Article

A Potential Biodegradable Mg-Y-Ag Implant with Strengthened Antimicrobial Properties in Orthopedic Applications

1
Department of Orthopedics, Xiangya Hospital, Central South University, Changsha 410008, China
2
Department of Material Science and Engineering, Yantai Nanshan University, Yantai 265713, China
3
School of Material Science and Engineering, Central South University, Changsha 410083, China
*
Author to whom correspondence should be addressed.
Submission received: 16 October 2018 / Revised: 5 November 2018 / Accepted: 12 November 2018 / Published: 14 November 2018

Abstract

:
In order to design a potential biodegradable implant, which combines with fine mechanical and antimicrobial properties, Mg-4Y-1Ag (mass fraction, %) alloys were produced by permanent mold casting and then hot extrusion. The microstructure, mechanical behavior, anti-corrosion behavior, and antimicrobial properties of the experimental alloys were comprehensively investigated. The results showed that α-Mg, Mg24Y5 (ε), and AgMg4 phases existed in the Mg-4Y-1Ag. The grain size of Mg-4Y-1Ag was greatly refined through hot-extrusion. The as-extruded Mg-4Y-1Ag alloy exhibit an ultimate tensile strength of 202.7 MPa with a good elongation of 33.6%. The compressive strength of as-extruded Mg-4Y-1Ag was 385 MPa, and the strength remained 183 MPa after immersing in PBS solution for four weeks. The as-extruded alloy had better corrosion resistance than as-cast alloy and as-extruded pure magnesium in PBS solution, for the reason of refined grain and the formation of Y2O3 film on the surface of Mg-4Y-1Ag alloy. Furthermore, the as-extruded Mg-4Y-1Ag alloys were superior to Ti6Al4V (TC4) and as-extruded pure magnesium in antimicrobial property for released Ag+ ion. Obvious inhibition halo was observed in the LB agar plate adding with as-extruded Mg-4Y-1Ag alloys. Also as-extruded Mg-4Y-1Ag alloys showed no cytotoxicity by co-culturing with L929 using the MTT method.

Graphical Abstract

1. Introduction

Magnesium and its alloys have been investigated as biodegradable metallic materials in bone implants over the past years due to their inherent biocompatibility, biodegradability, and their excellent mechanical properties close to the natural bone [1,2]. Mg and its alloys may be a good substitution for permanent materials such as stainless steels, Ti-based alloys, polymers, or bioceramics which do not require a second surgery [3].
However, the clinical application of magnesium alloys is limited by their rapid corrosion speed [4,5], which is almost an intrinsic response of magnesium to a chloride containing solution [6,7], like the human body fluid. Meanwhile, a lot of hydrogen gas will be released during the process of rapid corrosion. If the evolution is too rapid to be absorbed, a balloon effect will take place and an alkaline pH shift will happen in the vicinity of the corroded surface [8]. Moreover, the biodegradable implants made of magnesium alloys can’t keep mechanical integrity before the patients recovered due to the rapid degradation rate [9]. In addition to consider the corrosion of magnesium alloy without stress, magnesium alloy implants possess adequate resistance to cracking/fracture under stress corrosion cracking (SCC), before the implant can be put to actual use [10]. The AZ91D alloy is found to be susceptible to SCC in the physiological environment. A substantial decrease in the mechanical integrity of AZ91D is observed in investigations using the SSRT testing in m-SBF solution. Therefore, controlling the corrosion rate of magnesium in body fluid is an important issue in the development of magnesium implants and one of the most effective measures is alloying treatment [11].
Silver (Ag) is well known for its strong antimicrobial property for thousands of years. Ag ions released from the degradation of Mg-Ag alloys could kill bacteria during bone healing [12]. Additionally, the addition of Ag was reported to enhance the corrosion resistance of Mg alloys due to its noble nature and contribution to the formation of oxidation films [13]. Mg2Ag (wt %) showed good corrosion resistance and promising antibacterial activity among Mg, Mg2Ag, Mg4Ag, and Mg6Ag. It was also reported that RE element (Y) can promote the formation of protective surface films which then strengthen the anti-corrosion ability of magnesium alloys [14]. According to the study of He et al. [15], when the yttrium weight content was above 0.36% in Magnesium alloy, Y2O3 protective surface film would form on exposure to Hank’s solution. Moreover, the Y2O3 film promoted the anti-corrosion ability by significantly decreasing the cathodic current density. Therefore, we developed the Mg-4Y-1Ag alloy for promoting both antimicrobial and anti-corrosion properties in this research.
Except alloying treatment, thermomechanical processes are also an important method to improve the mechanical properties and corrosion resistance of magnesium alloys. Nayak et al. [16] found that Grain size got refined significantly with increasing amount of deformation. The Mg-3Zn (wt %) experiences a marked improvement in hardness, yield strength, ultimate tensile strength, strain and toughness with finer grain size through hot-rolled. Mg-Zn alloys and Mg-Zn-β-Ca3(PO4)2 composites shows fine comprehensive properties in as-extruded state [17]. As hot-extrusion could densify magnesium alloy better than hot-rolling for its severe deformation, hot-extrusion is selected as further method to process Mg-Y-Ag alloy.
On one hand, Mg-Re alloy shows good corrosion resistance and mechanical properties among magnesium alloys, on the other hand, Mg-Ag alloy proves to be good antimicrobial biodegradable implant. We hope to design Mg-Y-Ag alloy to occupy both corrosion resistance, mechanical properties, and antimicrobial properties for biodegradable implants. Moreover, Marián Viček [18] compared in vitro corrosion of Mg-4Y and Mg-4Y-1Ag, and made a conclusion that the addition of 1 wt % Ag to the Mg-4Y alloy has practically no effect on the in vitro corrosion rate in the solution-treated condition. In the present work, Mg-4%Y-1%Ag (wt %) alloys were prepared and hot-extruded to study the microstructure, mechanical, corrosion, and antimicrobial properties compared to pure magnesium and Ti6Al4V (TC4). Meanwhile, its cytotoxicity was evaluated by the MTT method.

2. Materials and Methods

2.1. Sample Preparation

The Mg-4%Y-1%Ag (wt %) alloy was melted with high purity Mg (>99.9%), Ag (>99.99%) and Mg-20%Y (wt %) master alloy. The actual chemical composition of Mg-4%Y-1%Ag alloy was determined by inductively coupled plasma atomic emission spectroscopy (ICP-AES), which was Mg-3.73%Y-0.85%Ag. The as-cast Mg-4Y-1Ag (C-Mg-4Y-1Ag) ingot with a size of φ60 mm × 200 mm was homogenized at 400 °C for 24 h and hot-extruded at 350 °C to a plate with extrusion ratio of 12:1. The experimental samples of as-extruded Mg-4Y-1Ag (Ex-Mg-4Y-1Ag) and as-extruded pure magnesium (Ex-Mg) were both obtained from the extruded plates, while samples of the as-cast alloys were cut from the casted ingot. Disk samples 10 mm × 10 mm × 4 mm in size were prepared for the immersion test and electrochemical measurements. The specimens were grounded with 1000 grid SiC sandpaper and diamond polishing, then etched with etchant solution. The etchant used for optical microstructure observation was composed of 5 mL nitric acid and 95 mL absolute ethyl alcohol.

2.2. Mechanical and Metallurgical Testing

Mechanical testing samples were cut from the ingot and the extruded plate. The tensile samples (40 mm in gauge length and 6 mm in diameter) and compressive samples (10 mm in gauge length and 6 mm in diameter) were machined from the extruded plates along the extrusion direction. The tensile tests and compressive tests were conducted at a crosshead speed of 2 mm/min at room temperature in air using a MTS type machine (MTS 810, MTS Systems Coporation, Minnesota, MI, USA). The elastic modulus, yield stress, and ultimate strength of tensile tests were calculated by the software attached with MTS machine. At least three samples were tested for each condition. The microstructures of the experimental Mg-4Y-1Ag specimens were characterized using optical microscope (OM, Leica DMi8, Solms, Germany) and scanning electron microscope (SEM, FEI Quanta 200, Hillsboro, OR, USA). Presence of each phases were identified with a BRUKER D8 X-ray diffraction (XRD) employing CuKα radiation (λ = 1.5406 Å). The scan range was performed continuously from 10 deg to 80 deg at a speed of 2 deg/min.

2.3. In Vitro Corrosion Testing

Immersion testing was performed in phosphate buffer saline (PBS) at 37 ± 0.2 °C for two weeks to evaluate the in vitro corrosion properties of experimental alloys. The pH value of PBS was recorded during the immersion. In immersion test, the PBS solution didn’t change to make convenient to measure the pH value of the solution. The H2 gas evolution testing was also carried out in PBS at 37 ± 0.2 °C for 2 weeks to evaluate the volume of evolved H2 gas and corrosion rate of C-Mg-4Y-1Ag, Ex-Mg-4Y-1Ag and Ex-Mg. The PBS solution in hydrogen evolution tests was renewed every 24 h in order to maintain a relatively stable fluid environment [19]. The working area of specimens used for electrochemical testing was 1 cm2, which was ground with 400, 600, 800, and 1000 grid sandpaper, respectively. The electrochemical testing was performed at 37 ± 0.2 °C by a three-electrode device (the specimens as working electrode, saturated calomel as reference electrode and platinum foil as the counter electrode) with a CHI660C potentiostat/galvanostat system (CHI Company, Austin, TX, USA). Tafel extrapolation approach was adopted to measure the corrosion current density (Icorr), corrosion potential (Ecorr) and polarization resistant (Rp) of samples. Electrochemical impedance spectroscopy (EIS) was examined with a perturbation amplitude of 10 mV. The scanning frequency of EIS ranged from 10,0000 to 0.01 Hz. ZsimDemo 3.30d software (EChem Software, Michigan, MI, USA) was used to fit and analyze the EIS results.

2.4. Antibacterial and Ion Concentration Testing

The samples, including Ex-Mg-4Y-1Ag, Ex-Mg and TC4 (Ti6AL4V) were denoted as S1, S2, Z, and S3 respectively. Staphylococcus aureus (ATCC 25923) was selected to evaluate the antibacterial properties of the specimens. Three specimens and a blank control group, with 10 mL of the solution which contained bacteria medium, the concentration of which was 106 CFU (colony-forming units)·mL−1, were incubated on a 6-well culture plate at room temperature for 24 h. The antibacterial ratio was calculated as the equation: Antibacterial rate (%) = (CFU of control group − CFU of testing groups)/CFU of control group × 100%. The antibacterial abilities of the Ex-Mg-4Y-1Ag was also assessed by the inhibition halo testing with S. aureus strain. Then, 105 CFU/mL bacterial suspension was made up and evenly distributed on a LB agar plate, all the specimens were put in touch with the agar in the middle and cultured at 37 °C for 24 h. Three groups of specimens and 10 mL of suspension (106 CFU·mL−1) were incubated on agar plate at 37 °C for 2 and 4 h respectively. The suspension with samples were cultured for 2 and 4 h, respectively, and then were in contact with BacLight Live/Dead which utilizes Syto9 and propidium iodide (PI) reagent mixture. Then, the specimens were washed third times by PBS solution. Finally, the fluorescence microscopy (NIKON, Tokyo, Japan) was used to evaluate the quantity of bacteria. The ion concentration variation of 100 mL medium was monitored by an inductively coupled plasma optical emission spectrometry (ICP-OES). 10 mL of 100 mL culture medium was taken out to test and 10 mL fresh culture medium would be added into the remaining medium every week.

2.5. Cell Toxicity Experiment

According to the ISO 10993-2009 standard, mouse fibroblast L929 cells (ATCC CCL-1) were cultured with extracting fluid (10%, 50%, and 100%), the Dulbecco’s modified Eagle’s medium (DMEM) as negative control and the DMEM containing 0.5% phenol as positive control in different time points respectively. The cell toxicity of material extract was measured by 3-(4,5-dimethylthiazol-2-yl)-2,5-diphenyltetrazolium bromide (MTT) method, and the relative growth rate (RGR) was calculated according to the OD values to evaluate cell toxicity based on ISO 10993-2009 standard. The morphology of L 929 cells were observed by optical microscope at 72 h of incubation.

2.6. Statistical Analysis

The antibacterial tests and cell toxicity tests were performed at least three times, and the results were expressed as mean ± SD, and statistical analysis between different groups was performed with one-way ANOVA using the SPSS 17.0 software (IBM, Armonk, NY, USA). Differences were considered significant when *p < 0.05.

3. Results

3.1. Microstructure of Mg-4Y-1Ag Alloys

The typical micrographs of the as-cast and as-extruded Mg-4Y-1Ag alloys taken by optical microscopy are shown in Figure 1a,b. The as-cast alloys had fine grain size of 100–200 μm. The secondary dendrites are observed in the grains. Some eutectic phases form during the solidification along the grain boundaries, while the grain size of as-extruded alloys is 10–20 μm. The grain size was well refined by hot extrusion which eliminate the second dendrites in grain at the same time. Representative secondary electron image of the as-extruded alloys morphology is illustrated in Figure 1c,d, and the white second phases can also be seen in the SEM image. Combined with XRD patterns (Figure 1e) and EDS, the white second phases along the extrusion direction are Mg24Y5 (ε) and AgMg4, the quantity and size of which decrease through hot-extrusion. The ε phases were the bright white spots in position A. However, the dark white spots in position B were the mixtures of ε and AgMg4 phases. Moreover, the hot-extrusion does not change the phases of Mg-4Y-1Ag alloys, only change the orientation of grains due to the variations of X-ray diffraction peak intensity in (100) and (002) lattice plane of Mg matrix.

3.2. Mechanical Property of Mg-4Y-1Ag Alloys

Table 1 summarizes the mechanical properties of the Mg-4Y-1Ag alloys compared with the equivalent properties of natural bone [3], Ex-Mg and TC4. The elastic modulus of Mg-4Y-1Ag and Ex-Mg is close to that of natural bone, while the elastic modulus of TC4 is much higher than that of natural bone. Therefore, it can avoid the stress shielding effect induced by a serious mismatch between the modulus of natural bone and other metal implants. The tensile testing results, as shown in Figure 2a, indicate that the improvement in yield stress, ultimate tensile stress, and elongation of Ex-Mg-4Y-1Ag compared with C-Mg-4Y-1Ag. Since the grain size of Mg-4Y-1Ag is refined by hot-extrusion, the strength increases with the decrease of the grain size according to the Hall-Petch equation. Moreover, Ex-Mg-4Y-1Ag alloys have better mechanical strength and elongation with the addition of Y and Ag element than Ex-Mg. The addition of Y [20] improves the strengths and the addition of Ag [12] improves the elongation in Magnesium binary alloys. The Ex-Mg-4Y-1Ag showed good ultimate tensile strength (UTS) and elongation of 211 MPa and 40.4%, which meet specific mechanical requirements that the strength should be higher than 200 MPa and the elongation greater than 10% for biomaterials [21]. Figure 2b shows the fracture morphology of Ex-Mg-4Y-1Ag. Many deep dimples distributed in the facture morphology which indicate that Ex-Mg-4Y-1Ag alloy has good plasticity. It has good elongation of 40.4%. Figure 2c,d show the stress-strain compressive curves of Ex-Mg and Ex-Mg-4Y-1Ag immersed in PBS at 37 ± 0.2 °C after 0, 1, 2, and 4 weeks. It can be seen that the compressive strengths of Ex-Mg-4Y-1Ag and Ex-Mg decrease with the increase of immersion time. Figure 2e shows the ultimate compressive strength-week graph of Ex-Mg and Ex-Mg-4Y-1Ag. The initial compressive strengths of Ex-Mg-4Y-1Ag and Ex-Mg are 385 MPa and 253 MPa before immersion. The Ex-Mg-4Y-1Ag alloy lost much compressive strength which reduced to 265 MPa in one week of immersion. After four weeks of immersion, the corrosion speed of Ex-Mg-4Y-1Ag was slowed down by the formation of corrosion product layer, the compressive strength of Ex-Mg-4Y-1Ag decreases to 183 MPa, which is still larger than that of Ex-Mg. Figure 2f shows a similar phenomenon that the elastic modulus of both Ex-Mg and Ex-Mg-4Y-1Ag decreased with the increase of immersion time.

3.3. In Vitro Corrosion Test

Figure 3 compares corrosion properties of C-Mg-4Y-1Ag, Ex-Mg-4Y-1Ag and Ex-Mg in PBS at a temperature of 37 ± 0.2 °C. The degradation rate of Ex-Mg-4Y-1Ag is significantly lower than that of the C-Mg-4Y-1Ag, while the pH value, the volume of evolved hydrogen e of Ex-Mg-4Y-1Ag is close to Ex-Mg (Figure 3a,b). Figure 3c shows the potentiodynamic polarization curves of C-Mg-4Y-1Ag, Ex-Mg-4Y-1Ag, and Ex-Mg. Electrochemical parameters were summarized from Figure 3c by Tafel extrapolation method in Table 2, which indicates that the Ecorr (−1.791 V) of Ex-Mg is much lower than the Ex-Mg-4Y-1Ag (−1.464 V) and C-Mg-4Y-1Ag (−1.537 V), which indicates the addition of Ag and Y promote the Ecor of magnesium. The Jcorr (5.38 × 10⁻⁶ A) of the Ex-Mg-4Y-1Ag is much lower than that (1.32 × 10⁻⁵ A) of as-cast alloys, while it has the same magnitude order as that (4.92 × 10⁻⁶ A) of Ex-Mg, which suggests that hot extrusion can slow down the corrosion rate of Mg-4Y-1Ag alloys.
Figure 4 illustrates the surface morphologies of the Ex-Mg and Ex-Mg-4Y-1Ag alloy exposed to PBS solution at 37 °C for different degradation times. Both Ex-Mg and Ex-Mg-4Y-1Ag alloy specimens experienced pitting corrosion and were covered with corrosion products at the beginning of immersion (24 h), as shown in Figure 4a,b. It can be found that the holes of pitting corrosion in Ex-Mg-4Y-1Ag alloy are larger in quantity than those in Ex-Mg, which means that degradation of Ex-Mg in PBS solution was slower than that of Ex-Mg-4Y-1Ag alloy for the reason of galvanic corrosion caused by the second phases in alloy. The EDS results reveal that the surface corrosion products on Ex-Mg and Ex-Mg-4Y-1Ag alloy samples after immersing in the PBS solution for 24 h were almost the same, which were rich in O, Mg, P and Ca, as shown in Figure 4. The P and Ca components both originate from the PBS solution [22], so the main corrosion product of Ex-Mg and Ex-Mg-4Y-1Ag alloy might be Mg(OH)2 at the beginning of immersion. After 120 h of immersion time, the surfaces of the entire Ex-Mg and Ex-Mg-4Y-1Ag alloy were found to be covered by the corrosion product layers. The surface morphology of Ex-Mg differed from that of Ex-Mg-4Y-1Ag after soaking in PBS for 120 h, some wide cracks appeared on the entire surfaces of Ex-Mg. The EDS results showed that the element component of zone C was similar with zone A and zone B, which means that the main corrosion product of Ex-Mg for 120 h of immersion was still Mg(OH)2, while a dense corrosion product layer was coated on the surface of Ex-Mg-4Y-1Ag alloy, which might be the mixture of Mg(OH)2 and Y2O3, because plenty of Y was detected in zone D (Figure 4D).
EIS plots and the equivalent circuits of Ex-Mg and Ex-Mg-4Y-1Ag in PBS solution are displayed in Figure 5 for further analyzing the corrosion mechanism of the studied alloys. The EIS plots for Ex-Mg and Ex-Mg-4Y-1Ag samples show similar shapes, so their electrochemical mechanism can be explained by the same equivalent circuit. ZSimDemo 3.30d software is adopted to obtain fitted values of impedance parameters. The fitted results are listed in Table 3. The equivalent circuit created from the EIS spectra is presented in Figure 5. The curves of Ex-Mg and Ex-Mg-4Y-1Ag consisted of one high frequency capacitance loop and one low frequency capacitance loop, which was in accord with the [18].

3.4. Antibacterial Test

Figure 6a indicates that in 6 h, group S1 has lesser CFUs than any other groups. The antibacterial rate (%) = (CFU of control group − CFU of testing groups)/CFU of control group × 100%. While co-cultured with the bacteria, the CFU in the Ti group was not less than the control group, so after subtracting CFU values in the control group, the antibacterial rate value may be small, or even a minus. Considering the average Ra value in Ti group is low, the error would be larger. Then the CFUs of all groups increased at 24 h; while group S1 had a very thin colony, the other plates were full of it. As shown in Figure 6b, the antibacterial rate (Ra) values of Ex-Mg-4Y-1Ag, Ex-Mg and TC4, increased from 65.29%, 42.55%, 28.74% at 6 h, to 78.98%, 55.11%, 2.5% at 12 h, then 92.93%, 65.37%, and 23.84% at 24 h, respectively, indicating that Ex-Mg-4Y-1Ag can inhibit bacteria proliferation, had the strongest antibacterial activity. Figure 6c shows that samples were able to create a clear and significant zone closing to the sample’s surface. This behavior is due to the diffusion of Ag+ ions. In the area close to the sample the Ag+ concentration was high and no bacterial growth was observed, while in the areas further from the sample the silver concentration gradually decreased and some bacterial colonies began to survive.
The fluorescence microscopy images are shown in Figure 7. As the culture duration was prolonged from 2 h to 4 h, the green fluorescent intensity which represented living bacterial colonies on Mg and TC4 alloy increased and the red were hardly observed on them, conversely, more red spots were distributed on Ex-Mg-4Y-1Ag, illustrating that the Ex-Mg-4Y-1Ag samples possess better antibacterial activity. According to the counting by Image-Pro, the mean amounts of bacteria are 931.4, 1766, 2413.8 at 2 h and 999, 2176.4, 2505 at 4 h, respectively, also indicating that the Ex-Mg-4Y-1Ag possess better antibacterial activity among three groups of specimens.
Figure 8 shows the ion concentration variation of culture medium with samples in four weeks. The concentrations of Ag+ in S1 reached their maximum values in approximately two weeks. It is found that the concentration of Mg2+ in S1 and S2 both remain a range from 18 mg/L to 30.84 mg/L. The concentration of Y3+ was much smaller than the concentration of Ag+ over the entire course of the experiment for the reason that the undissolved Y2O3 is the main product from the yttrium [15,23]. Moreover, there was no Y3+ ion could be detected in week 2, because all of Y element formed insoluble Y2O3 or Y(OH)3 corrosion product layer. Such a phenomenon indicates that the Ag+ ion that was biodegraded from Ex-Mg-4Y-1Ag can inhibit bacteria proliferation for Ex-Mg-4Y-1Ag and Ex-Mg showing the close pH and concentration of Mg2+.

3.5. Cytotoxicity Test

The cell toxicity experiment indicated that Optical value (OD) of the L-929 cells incubated in different concentration extracts of the Ex-Mg-4Y-1Ag alloy (Figure 9a), which can infer the cell relative growth rate (RGR) was between 83.0% and 99.4% in different dilution of extracting fluid and different time points. Thus, the RGR was calculated as following formula: RGR (%) = ODtest/ODnegative × 100%. Based on ISO 10993-2009 standard, the cell toxicity scores were ranked in grade 0–1, which means good biocompatibility in vitro. There were no significant difference between the 10%, 50% concentration extracting liquid groups and negative group (Figure 9b–d) (p > 0.05), while there was significant difference between 100% extracting liquid group (Figure 9e) and the positive group (Figure 9f) (p < 0.05). These results demonstrated that Ex-Mg-4Y-1Ag alloy showed no obvious cytotoxicity in vitro.

4. Discussion

The Ex-Mg-4Y-1Ag alloy exhibited good in mechanical, anticorrosion and antimicrobial properties because of their alloying and processing. The mechanical and in vitro corrosion tests demonstrated that the Mg-4Y-1Ag alloy which was processed by hot-extrusion showed better tensile strength, compressive strength and elongation than pure Mg, and maintained good anticorrosion property. And it was selected for the analysis of antimicrobial property compared with Mg and TC4. Finally, the cytotoxicity results of the Ex-Mg-4Y-1Ag alloy illustrated no toxicity to L929 cells.
Hot-extrusion has been reported to be an efficient grain refiner for Mg alloys. In this work, the SEM and optical images confirmed that hot-extrusion in the Mg-4Y-1Ag alloy led to the refinement of the grain size. The mechanical properties including UTS and elongation of Mg-4Y-1Ag alloy were promoted for refined grains through hot-extrusion. Thus, hot-extrusion could get more refined grain and eliminate the second dendrites in grain. After hot-extrusion, the white second phases in as-extruded alloys decreased and distributed in homogeneous dispersion state. Hot-extrusion changed from localised corrosion in cast alloy to homogeneous corrosion properties in extruded alloy, which slowed down the corrosion of Mg-4Y-1Ag [24]. Thus, Ex-Mg-4Y-1Ag showed much better anticorrosion property than C-Mg-4Y-1Ag.
In vitro corrosion experiments are effective way to estimate degradable behaviour of the Mg-based biomaterials in SBF solution. The pH value and hydrogen evolution variation in Figure 3 illustrated a phenomenon that degradation of Mg was slower than that of Ex-Mg-4Y-1Ag at beginning of 72 h, however, the corrosion of Ex-Mg-4Y-1Ag slowed down after immersion of 120 h in PBS. At the beginning of degradation in PBS solution, the corrosion products of Mg and Mg alloy were hydrogen gas(H2) and Mg(OH)2 according to Equation (1) [25].
Mg Mg 2 + + 2 e   ( anodic   reaction ) 2 H 2 O + 2 e H 2 + 2 OH   ( cathodic   reaction )   Mg + 2 H 2 O H 2 + Mg ( OH ) 2   ( overall   reaction )
The corrosion rate (CR) was calculated by the equation below [26]:
  Corrosion   Rate   =   95 Δ V S   ×   T   ×   ρ  
where Δ V   ( mL ) is the H2 evolution of magnesium alloys, S   ( cm 2 ) is the surface area exposed in Ringer’s, T   ( h ) is the immersion time and ρ   ( g / cm 3 ) is the density of magnesium alloys.
The average corrosion rate of Mg and Ex-Mg-4Y-1Ag after 72 h, 120 h, and 300 h of immersion was calculated in Table 4.
The surface of Mg alloy were covered by Mg(OH)2 layer, which could decrease the corrosion rate. However, the Mg(OH)2 layer was incompact and full of cracks as shown in Figure 4a. Then the PBS solution would touch the fresh surface through the cracks and continue the degradation process [27,28]. At the beginning of immersion, due to the potential of second phases in alloy (ε and AgMg4) is higher than the αMg, so the Equation (1) reacted first. As shown in Table 4, the corrosion rate of Ex-Mg-4Y-1Ag alloy in PBS solution was bigger than that of Mg for the reason of galvanic corrosion accelerating reaction caused by the second phases in alloy. The chloride ions present in PBS solution transformed the protective Mg(OH)2 layer into the more resoluble MgCl2, according to Equation (3) [29]:
Mg ( OH ) 2 + 2 Cl MgCl 2 + 2 OH  
At last, the dissolution and formation of an Mg(OH)2 layer produced a dynamic balance, so the dissoluted Mg2+ ion which was detected by ICP was part of degradable Mg element in Mg alloy. Therefore, the corrosion rate calculated by Mg2+ ion concentration in Figure 8 was smaller than that calculated by the H2 evolution.
After immersion of 120 h, Y2O3 and Y(OH)3 were found in the corrosion products of Ex-Mg-4Y-1Ag from EDS (Figure 4). Finally, the corrosion of Ex-Mg-4Y-1Ag was slower than that of Mg after immersion of 300 h. The following reactions Equation (4) [23] have occurred during the corrosion of Ex-Mg-4Y-1Ag alloy:
  4 Y + 3 O 2 2 Y 2 O 3   Y 2 O 3 + 3 H 2 O 2 Y ( OH ) 3  
Compared to the αMg = 0.81 (density of oxide film for Mg), the value for Y is much bigger (αY > 1), leading to a more compact mixture of Mg(OH)2 and Y2O3 or Y(OH)3 oxide film. The cracks on surface of Ex-Mg-4Y-1Ag were filled with Y2O3 or Y(OH)3, as shown in Figure 10. Therefore, the PBS solution could hardly touch the fresh surface, and the corrosion rate of Ex-Mg-4Y-1Ag decreased obviously. It has been reported that the beneficial effect of Y is attributed to the eventual stabilization of the corrosion surface layer [15]. Liu et al. [23] found that for Mg-Y binary alloy, Y can incorporate in the surface film in the form of Y2O3 as confirmed with XPS and XRD, and can improve the corrosion resistance of the surface film.
EIS plot and the equivalent circuit in Figure 5 illustrated the corrosion mechanism of Mg and Mg alloy in PBS solution. The diameter of high frequency capacitive loop is corresponding to the charge transfer resistance Rt and could also reflect the value of electrochemical double layer. The Rt of Mg (665 Ω·cm2) was a little bigger than that of Ex-Mg-4Y-1Ag (430.9 Ω·cm2), which means Mg have better anticorrosion at the beginning of corrosion. The Rf stood for the resistance of protective film, and it was mainly affected by compactness integrity of corrosion product layer [30]. It can be seen in Table 3 that Rf of Ex-Mg-4Y-1Ag (521.6 Ω·cm2) was much bigger than that of Mg (2.404 Ω·cm2), which indicates the corrosion product layer of Ex-Mg-4Y-1Ag is much more compact than that of Mg.
On one hand, the addition of Ag led to the improvement of the mechanical properties resulting from the grain refining effect of Ag [31]. On the other hand, the addition of Ag in Mg alloy showed good biocompatibility that Mg-Ag alloy exhibit no cytotoxicity of MG63 and RAW 264.7 cells, and antibacterial activity with the release of Ag+ ion during the degradation [13]. As mentioned above in the antibacterial test, the order of antibacterial activity was Ex-Mg-4Y-1Ag > Mg > TC4. The antibacterial activity of Mg derived from OH ion which was its corrosion product. With the degradation of Mg, both OH- ion and pH value of the local extract promote, and bacteria are hard to survive in alkaline environment. However, the pH value of PBS solution immersing with Mg and Ex-Mg-4Y-1Ag almost reach the same value (pH = 9.1), Ex-Mg-4Y-1Ag exhibit better antibacterial activity than Mg. Because the release of Ag+ ion play more important role in antibacterial property. As shown in Figure 8, during the degradation of 4 weeks, the release of Ag+ ion can be detected ranging from 0.085 mg/L–0.26 mg/L, which ensure Ex-Mg-4Y-1Ag alloy implant keeping antibacterial activity during the whole degradation.
The MTT assay was performed to continuously compare the proliferation of L929 cells cultured on different concentration of extracts of Mg-4Y-1Ag alloy according to ISO 10993-2009 standard. As shown in Figure 9a, an increasing trend of cell growth in a time dependent manner was observed in each extract group. And we found that high concentration (100%) extract of Mg-4Y-1Ag alloy could inhibit cells proliferation (p < 0.05). However, no statistically significant difference was found in the proliferation rate of L929 cell among 10% and 50% concentration extracting liquid. These preliminary results showed that Ex-Mg-4Y-1Ag alloy exhibited good compatibility in vitro and further experimental studies are needed to be carried out to testify whether this alloy meets the requirements of biomedical materials.

5. Conclusions

(1)
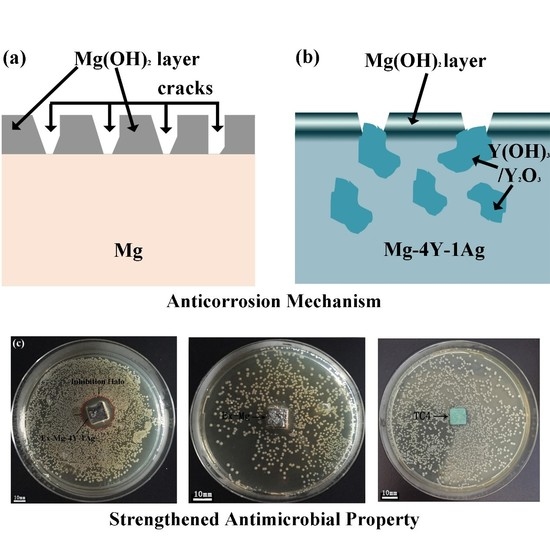
Hot-extrusion make Mg-4Y-1Ag alloys get smaller grain size and eliminate the second dendrites, which can greatly promote the corrosion resistance of Mg-4Y-1Ag. The degradation rate of Ex-Mg-4Y-1Ag is close to Ex-Mg. The incorporation of oxidized Y in the surface film is identified as enhancing the degradation resistance of Mg-4Y-1Ag alloys.
(2)
The Ex-Mg-4Y-1Ag alloys show acceptable strengths, elastic moduli and elongation. The densities and elastic moduli of the alloys match those of natural bone, and the strengths and elongation are larger than that of natural bone.
(3)
Compared to Ex-Mg and TC4, the Ex-Mg-4Y-1Ag alloy possesses significant antibacterial effect toward S. aureus for its released Ag+ ion and shows no cytotoxicity to L929 cells.

Author Contributions

For Y.D., X.X., Y.Y., and Y.Z. prepared the Mg-Y-Ag alloy samples and performed the microstructural characterization and the corrosion resistance under the supervision of K.Y., Y.T., H.L., and Z.L. performed antibacterial test and cell cytotoxicity under the supervision of Y.Z., Y.D. and H.L. revised manuscript. All authors discussed the results and approved the final manuscript.

Funding

This research was funded by the National Natural Science Foundation of China (No. 81874006), Fundamental Research Funds for the Central Universities of Central South University Project (2015zzts024), China, the Key Research and Development Program of Hunan Province project (2017GK2120), the Natural Science Foundation of Hunan Province of China (2018JJ2506), the Planned Science and Technology Project of Hunan Province, China, No. 2015SK20474, the 2015 ShanDong province project of outstanding subject talent group and the Natural Science Foundation of Shandong Province of China (ZR2017MEM005).

Conflicts of Interest

The authors declare no conflict of interest.

References

  1. Witte, F. Reprint of the history of biodegradable magnesium implants: A review. Acta Biomater. 2015, 23, S28–S40. [Google Scholar] [CrossRef] [PubMed]
  2. Zhang, Y.; Xu, J.; Ruan, Y.C.; Yu, M.K.; O’Laughlin, M.; Wise, H.; Chen, D.; Tian, L.; Shi, D.; Wang, J.; et al. Implant-derived magnesium induces local neuronal production of CGRP to improve bone-fracture healing in rats. Nat. Med. 2016, 22, 1160–1169. [Google Scholar] [CrossRef] [PubMed] [Green Version]
  3. Yu, K.; Chen, L.; Zhao, J.; Li, S.; Dai, Y.; Huang, Q.; Yu, Z. In vitro corrosion behavior and in vivo biodegradation of biomedical β-Ca3(PO4)2/Mg-Zn composites. Acta Biomater. 2012, 8, 2845–2855. [Google Scholar] [CrossRef] [PubMed]
  4. Song, G.L.; Song, S.Z. A possible biodegradable magnesium implant material. Adv. Eng. Mater. 2007, 9, 298–302. [Google Scholar] [CrossRef]
  5. Mueller, W.D.; Nascimento, M.L.; de Mele, M. Critical discussion of the results from different corrosion studies of Mg and Mg alloys for biomaterial applications. Acta Biomater. 2010, 6, 1749–1755. [Google Scholar] [CrossRef] [PubMed]
  6. Kirkland, N.T.; Birbilis, N.; Staiger, M.P. Assessing the corrosion of biodegradable magnesium implants: A critical review of current methodologies and their limitations. Acta Biomater. 2012, 8, 925–936. [Google Scholar] [CrossRef] [PubMed]
  7. Witte, F.; Hort, N.; Vogt, C.; Cohen, S.; Kainer, K.U.; Willumeit, R.; Feyerabend, F. Degradable biomaterials based on magnesium corrosion. Curr. Opin. Solid State Mater. Sci. 2008, 12, 63–72. [Google Scholar] [CrossRef]
  8. Shi, Z.; Song, G.; Atrens, A. Corrosion resistance of anodised single-phase Mg alloys. Surf. Coat. Technol. 2006, 201, 492–503. [Google Scholar] [CrossRef]
  9. Hedayati, R.; Ahmadi, S.M.; Lietaert, K.; Tã Mer, N.; Li, Y.; Amin, Y.S.; Zadpoor, A.A. Fatigue and quasi-static mechanical behavior of bio-degradable porous biomaterials based on magnesium alloys. J. Biomed. Mater. Res. A 2018, 106, 1798–1811. [Google Scholar] [CrossRef] [PubMed] [Green Version]
  10. Peron, M.; Torgersen, J.; Berto, F. Mg and its alloys for biomedical applications: Exploring corrosion and its interplay with mechanical failure. Metals 2017, 7, 252. [Google Scholar] [CrossRef]
  11. Du, H.; Wei, Z.; Liu, X.; Zhang, E. Effects of Zn on the microstructure, mechanical property and bio-corrosion property of Mg-3Ca alloys for biomedical application. Mater. Chem. Phys. 2011, 125, 568–575. [Google Scholar] [CrossRef]
  12. Tie, D.; Feyerabend, F.; Hort, N.; Hoeche, D.; Kainer, K.U.; Willumeit, R.; Mueller, W.D. In vitro mechanical and corrosion properties of biodegradable Mg-Ag alloys. Mater. Corros. 2014, 65, 569–576. [Google Scholar] [CrossRef]
  13. Tie, D.; Feyerabend, F.; Müller, W.; Schade, R.; Liefeith, K.; Kainer, K.U.; Willumeit, R. Antibacterial biodegradable Mg-Ag alloys. Eur. Cell. Mater. 2013, 25, 284–298. [Google Scholar] [CrossRef] [PubMed]
  14. Feyerabend, F.; Fischer, J.; Holtz, J.; Witte, F.; Willumeit, R.; Drucker, H.; Vogt, C.; Hort, N. Evaluation of short-term effects of rare earth and other elements used in magnesium alloys on primary cells and cell lines. Acta Biomater. 2010, 6, 1834–1842. [Google Scholar] [CrossRef] [PubMed]
  15. He, W.; Zhang, E.; Yang, K. Effect of Y on the bio-corrosion behavior of extruded Mg–Zn–Mn alloy in Hank’s solution. Mater. Sci. Eng. C 2010, 30, 167–174. [Google Scholar] [CrossRef]
  16. Nayak, S.; Bhushan, B.; Jayaganthan, R.; Gopinath, P.; Agarwal, R.D.; Lahiri, D. Strengthening of Mg based alloy through grain refinement for orthopaedic application. J. Mech. Behav. Biomed. 2016, 59, 57. [Google Scholar] [CrossRef] [PubMed]
  17. Yan, Y.; Kang, Y.; Li, D.; Yu, K.; Xiao, T.; Deng, Y.; Dai, H.; Dai, Y.; Xiong, H.; Fang, H. Improvement of the mechanical properties and corrosion resistance of biodegradable β-Ca3(PO4)2/Mg-Zn composites prepared by powder metallurgy: The adding β-Ca3(PO4)2, hot extrusion and aging treatment. Mater. Sci. Eng. C Mater. Biol. Appl. 2017, 74, 582. [Google Scholar] [CrossRef] [PubMed]
  18. Vlček, M.; Lukáč, F.; Kudrnová, H.; Smola, B.; Stulíková, I.; Luczak, M.; Szakács, G.; Hort, N.; Willumeit-Römer, R. Microhardness and In Vitro Corrosion of Heat-Treated Mg-Y-Ag Biodegradable Alloy. Materials 2017, 10, 55. [Google Scholar] [CrossRef] [PubMed]
  19. Song, G.; Atrens, A.; Stjohn, D. An Hydrogen Evolution Method for the Estimation of the Corrosion Rate of Magnesium Alloys; John Wiley & Sons, Inc.: Hoboken, NJ, USA, 2013; pp. 255–262. [Google Scholar]
  20. Peng, Q.; Huang, Y.; Zhou, L.; Hort, N.; Kainer, K.U. Preparation and properties of high purity Mg-Y biomaterials. Biomaterials 2010, 31, 398–403. [Google Scholar] [CrossRef] [PubMed]
  21. Chen, Y.; Xu, Z.; Smith, C.; Sankar, J. Recent advances on the development of magnesium alloys for biodegradable implants. Acta Biomater. 2014, 10, 4561–4573. [Google Scholar] [CrossRef] [PubMed]
  22. Pereda, M.D.; Alonso, C.; Burgos-Asperilla, L.; Del Valle, J.A.; Ruano, O.A.; Perez, P.; Ma, F.N.L.D. Corrosion inhibition of powder metallurgy Mg by fluoride treatments. Acta Biomater. 2010, 6, 1772–1782. [Google Scholar] [CrossRef] [PubMed]
  23. Liu, M.; Schmutz, P.; Uggowitzer, P.J.; Song, G.; Atrens, A. The influence of yttrium (Y) on the corrosion of Mg–Y binary alloys. Corros. Sci. 2010, 52, 3687–3701. [Google Scholar] [CrossRef]
  24. Zhou, W.; Shan, D.; Han, E.H.; Ke, W. Structure and formation mechanism of phosphate conversion coating on die-cast AZ91D magnesium alloy. Corros. Sci. 2008, 50, 329–337. [Google Scholar] [CrossRef]
  25. Lebouil, S.; Duboin, A.; Monti, F.; Tabeling, P.; Volovitch, P.; Ogle, K. A novel approach to on line measurement of gas evolution kinetics: Application to the negative difference effect of Mg in chloride solution. Electrochim. Acta 2014, 124, 176–182. [Google Scholar] [CrossRef]
  26. Witte, F.; Fischer, J.; Nellesen, J.; Crostack, H.A.; Kaese, V.; Pisch, A.; Beckmann, F.; Windhagen, H. In vitro and in vivo corrosion measurements of magnesium alloys. Biomaterials 2006, 27, 1013–1018. [Google Scholar] [CrossRef] [PubMed]
  27. Abidin, N.I.Z.; Martin, D.; Atrens, A. Corrosion of high purity Mg, AZ91, ZE41 and Mg2Zn0.2Mn in Hank’s solution at room temperature. Corros. Sci. 2011, 53, 862–872. [Google Scholar] [CrossRef]
  28. Peng, Q.; Fu, H.; Pang, J.; Zhang, J.; Xiao, W. Preparation, mechanical and degradation properties of Mg-Y-based microwire. J. Mech. Behav. Biomed. 2014, 29, 375–384. [Google Scholar] [CrossRef] [PubMed]
  29. Ye, X.; Chen, M.; Yang, M.; Wei, J.; Liu, D. In vitro corrosion resistance and cytocompatibility of nano-hydroxyapatite reinforced Mg-Zn-Zr composites. J. Mater. Sci. Mater. Med. 2010, 21, 1321. [Google Scholar] [CrossRef] [PubMed]
  30. Zhang, Y.; Yan, C.; Wang, F.; Li, W. Electrochemical behavior of anodized Mg alloy AZ91D in chloride containing aqueous solution. Corros. Sci. 2005, 47, 2816–2831. [Google Scholar] [CrossRef]
  31. Fu, H.M.; Qiu, D.; Zhang, M.X.; Wang, H.; Kelly, P.M.; Taylor, J.A. The development of a new grain refiner for magnesium alloys using the edge-to-edge model. J. Alloys Compd. 2008, 456, 390–394. [Google Scholar] [CrossRef]
Figure 1. The microstructure and XRD patterns of Mg-4Y-1Ag alloys: (a) optical image of as-cast alloys; (b) optical image of as-extruded alloys; (c) SEM image of as-cast alloy; (d) SEM image of as-extruded alloys; and (e) XRD patterns and EDX analysis of Mg-4Y-1Ag alloys.
Metals 08 00948 g001
Figure 2. (a) Stress-strain tensile curves of Ex-Mg and Ex-Mg-4Y-1Ag; (b) fracture morphology of Ex-Mg-4Y-1Ag; Stress-strain compressive curves of samples after different immersion time: (c) Ex-Mg-4Y-1Ag, (d) Ex-Mg, (e) ultimate compressive strength-week graph of Ex-Mg and Ex-Mg-4Y-1Ag; and (f) compressive elastic modulus-week graph of Ex-Mg and Ex-Mg-4Y-1Ag.
Metals 08 00948 g002
Figure 3. Graphs charting the dynamic degradation of the C-Mg-4Y-1Ag, Ex-Mg-4Y-1Ag and Ex-Mg samples in PBS as a function of time: (a) pH value of PBS; (b) volume of evolved hydrogen; and (c) potentiodynamic polarization curves.
Metals 08 00948 g003
Figure 4. Surface morphologies and EDS analysis of the Ex-Mg and Ex-Mg-4Y-1Ag alloy exposed to PBS solution at 37 °C for different degradation times: (a) Ex-Mg at 24 h; (b) Ex-Mg-4Y-1Ag at 24 h; (c) Ex-Mg at 120 h; and (d) Ex-Mg-4Y-1Ag at 120 h. EDS in Zone (A) for Figure 4a; Zone (B) for Figure 4b; Zone (C) for Figure 4c; and Zone (D) for Figure 4d.
Metals 08 00948 g004
Figure 5. The EIS plots and the equivalent circuit of Mg and Ex-Mg-4Y-1Ag.
Metals 08 00948 g005
Figure 6. Results of bacteria counting and inhibition halo testing: (a) optical images of bacteria of three groups at 6 h, 12 h and 24 h, respectively; (b) graph of the antibacterial rate of three groups at 6 h, 12 h and 24 h; and (c) optical images of inhibition halo test for Ex-Mg-4Y-1Ag, Ex-Mg, TC4.
Metals 08 00948 g006
Figure 7. Fluorescence microscopy of Ex-Mg-4Y-1Ag, Ex-Mg, and TC4: (ac) show S1, S2, S3 group cultured for 2 h; (df) show S1, S2, S3 group cultured for 4 h.
Metals 08 00948 g007
Figure 8. Mg2+, Ag+, Y3+ ion concentration variation of culture medium with Ex-Mg-4Y-1Ag and Ex-Mg: (a) Mg2+; (b) Ag+; (c) Y3+.
Metals 08 00948 g008
Figure 9. Cytotoxicity results of the Ex-Mg-4Y-1Ag alloy: (a) Optical value (OD) of L-929 cells cultured in different extracts. Optical images of L-929 cells that cultured in (b) negative control (complete medium); (c) 10% extracting liquid; (d) 50% extracting liquid; (e) 100% extracting liquid; and (f) positive control (0.5% phenol) at 72 h.
Metals 08 00948 g009
Figure 10. Surface corrosion layer formation on Mg and Mg-4Y-1Ag after exposure to SBF solution: (a) Mg; (b) Mg-4Y-1Ag.
Metals 08 00948 g010
Table 1. Mechanical properties of different metal samples.
SamplesElastic Modulus/GPaYield Stress/MPaUltimate Tensile Stress/MPaElongation/%
C-Mg-4Y-1Ag40671463.8
Ex-Mg-4Y-1Ag3710221140.4
Ex-Mg21831639.3
TC411289198613.0
Natural Bone3–20-130–1801.07–2.10
Table 2. Electrochemical parameters of C-Mg-4Y-1Ag, Ex-Mg-4Y-1Ag, and Ex-Mg.
SamplesEcorr/VIcorr/μARp/KΩ
C-Mg-4Y-1Ag−1.53713.20.732
Ex-Mg-4Y-1Ag−1.4645.381.521
Ex-Mg−1.7914.921.922
Table 3. Electrochemical parameters of Mg and Ex-Mg-4Y-1Ag alloy from the electrochemical impedance spectroscopy.
SamplesRsY1n1RtY2n2Rf
(Ω·cm2)(μΩ−1·cm−2·s−1)(Ω·cm2)(μΩ−1·cm−2·s−1)(Ω·cm2)
Ex-Mg1.83013.470.9499665.00.934212.404
Ex-Mg-4Y-1Ag1.80326.320.9524430.945.420.6483521.6
Table 4. The average corrosion rate of Mg and Ex-Mg-4Y-1Ag after 72 h, 120 h, and 300 h of immersion.
CR (mm/year) Materials72 h120 h300 h1 month
Mg1.221.160.950.42
Ex-Mg-4Y-1Ag2.361.520.860.35

