Burnishing of FSW Aluminum Al–Cu–Li Components
by
 , , , and
Adrián Rodríguez
1, 
Amaia Calleja
2,
Luis Norberto López de Lacalle
1,* ,
,
Octavio Pereira
1,
Haizea González
3,
Gorka Urbikain
4 and
and
Julien Laye
5 1
CFAA, University of the Basque Country (UPV/EHU), Parque Tecnológico de Zamudio 202, 48170 Bilbao, Spain
2
Department of Mechanical Engineering, University of the Basque Country (UPV/EHU), Nieves Cano 12, 01006 Vitoria, Spain
3
Department of Mechanical Engineering, University of the Basque Country (UPV/EHU), Alameda de Urquijo s/n, 48013 Bilbao, Spain
4
Department of Mechanical Engineering, University of the Basque Country (UPV/EHU), Plaza Europa 1, 20018 San Sebastián, Spain
5
Constellium, Tupolevlaan 41-61, 1119 NW Schiphol-Rijk, The Netherlands
*
Author to whom correspondence should be addressed.
Metals 2019, 9(2), 260; https://0-doi-org.brum.beds.ac.uk/10.3390/met9020260
Submission received: 26 January 2019
/
Revised: 15 February 2019
/
Accepted: 17 February 2019
/
Published: 21 February 2019
(This article belongs to the Special Issue New Processes and Machine Tools for Advanced Metal Alloys)
Abstract
:Ball-burnishing is presented herein as a mechanical surface treatment for improving mechanical properties after the friction stir welding process. Ball-burnishing provides good surface finish, high compressive residual stresses, and a hardness increase of the surface layer. These characteristics are key for the fatigue life improvement of the component, and for wear resistance due to the higher hardness. This work presents a complete analysis of surface and sub-surface hardness values focusing on the determination of each process parameter influence. Burnishing pressure, radial width, and burnishing direction influence were analyzed. The tested material was 2050 aluminum alloy with two different heat treatments (T3 and T8). The optimum parameters were established, and a complete analysis of the surface hardness was performed. Results show that burnishing is an economical and feasible mechanical treatment for the quality improvement of component surfaces.
1. Introduction
Friction stir welding (FSW) is a solid-state welding method which was developed by the Welding Institute in the early 1990s and patented in 1991 [1]. This novel welding system is an automated process that solves many of the problems associated with traditional joining techniques. Very-high-quality welds are obtained even in difficult-to-weld materials such as aluminum [2].
Currently, there is a demand for light and resistant products, short manufacturing times, and lower manufacturing costs. In this line, the FSW is an increasingly applied process due to it producing high-strength joints [3] in a wide range of materials and dimensions. FSW’s potential is justified for unions in nonferrous alloys with a low melting point, mainly aluminum alloys.
The process presents an absence of porosity and hot cracking. It is not necessary to prepare the welding joint, no consumables are used, and it is an automatic process. The main disadvantage of this process is related to surface integrity and joint mechanical properties [4]. During the process, emerging residual tensile stresses, albeit lower than in other conventional joining processes, could cause serious problems by reducing fatigue resistance in the final component [5]. Moreover, other mechanical properties, such as hardness and tensile strength, are also affected negatively in the welded area [6].
In order to improve the mechanical properties after the welding process, burnishing deformation techniques can be applied in the joint affected area [7]. Ball-burnishing is a rapid, simple, and cost-effective mechanical surface treatment. This treatment is widely used to improve the physical and mechanical properties of metallic components. The process is based on small plastic deformations on part surfaces, which cause material displacement from the “peaks or ridges” to the “valleys or depressions” of the surface micro-irregularities. Due to plastic deformations, compressive residual stress states, work hardening, microstructural alterations, and favorable roughness values are produced. Moreover, fatigue strength and wear resistance are improved.
Therefore, surface treatments prevent crack initiation, retard propagation of small cracks, improve corrosion resistance, and even improve wear behavior. Specifically, Reference [8] studied fatigue improvement of FSW welded aluminum joints using low-plasticity burnishing (LPB) as a final treatment. Another example of the deformation treatment application on welded aluminum components was presented in Reference [9]. In this work, generated residual stresses were analyzed, and it was demonstrated that the component fatigue behavior improved due to compression residual stresses generated by burnishing. Moreover, a burnishing tool specially designed for its application during the FSW process was presented. Authors designed the in situ rolling friction stir welding (IRFSW) process. Few works were found in the bibliography related to the application of burnishing techniques in FSW welded components [10,11]. For this reason, this work presents a series of tests carried out on a 2050 aluminum alloy in order to determine alternatives for stable hardness values in the area close to the welding.
On the other hand, welded components present microstructure variations after FSW, and there are two main problems derived from this microstructure variation. Firstly, as well as in other welding processes, the welded joint is the weakest point regarding fatigue, corrosion, and mechanical properties [12]. Furthermore, there is also a variation in the hardness distribution [13] especially in the thermo-mechanically affected zone (TMAZ) and heat-affected zone (HAZ). Although these limitations do not represent an insurmountable impediment for FSW components, there are some concrete applications, such as welded tubes or pressure vessels, where improved mechanical properties could increase component life.
Therefore, this work focuses on hardness distribution analysis, limiting welded affected areas and determining in order to test the influence on the welded sheet. Alternatives for stable hardness values in FSW aluminum components are studied considering burnishing deformation techniques and heat treatments. This paper describes the effect of ball-burnishing on the mechanical properties of 2050 aluminum alloy FSW welded components. In a first phase, different burnishing tests were made in two kinds of base material (T3 and T8 heat treatments) using a wide range of parameters in order to study the effect on surface hardness. In this way, the correct range of parameters could be established, and a high-quality design of experiments could be prepared on welded parts. Afterward, the process methodology was established, and surface and sub-surface hardness values were analyzed for different base materials and conditions in order to determine the best alternative for stable hardness values in FSW aluminum components.
2. Analysis of FSW 2050 Aluminum Alloys
Aluminum alloys (2050) are Al–Cu–Li alloys developed as an alternative to medium-thickness sheets of alloys such as 2025 in aeronautical applications, or thinner sheets such as 2024. These alloys present lower density and greater resistance values to corrosion. In fact, the 2050-T84 alloy was approved by Airbus for its A380-800 and A380-800F models for the structures of some wing components [14]. The chemical composition and standard properties of this alloy are shown in Table 1.
There are different thermal treatments applicable to aluminum alloys. In this case, the studied material was 2050 aluminum alloy, which was treated with a T3 heat treatment (cooled from an elevated-temperature shaping process, cold-worked, and naturally aged to a substantially stable condition) and T8 heat treatment (solution heat-treated at 550 °C for 1 h, cold-worked, then artificially aged at about 150 °C for 1 h). These values are indicative and vary depending on the final application and the manufacturer’s know-how.
During the FSW process, plastic deformation and high temperatures are involved in the material recrystallization and the size change and precipitate distribution. Based on the microstructural characterization of grains and precipitates, three zones can be distinguished in the joined area as follows:
- Nugget zone (NZ): Affected by plastic deformation. Area of practically equiaxial grains due to recrystallization caused by frictional heat.
- Thermo-mechanically affected zone (TMAZ): Region adjacent to the nugget, where the grains are plastically deformed; however, due to the lower temperature, there is no recrystallization.
- Heat-affected zone (HAZ): Region next to TMAZ; there is no plastic deformation but there are microstructure changes due to process heat.
- Base metal (BM): Rest of material not influenced by the welding process.
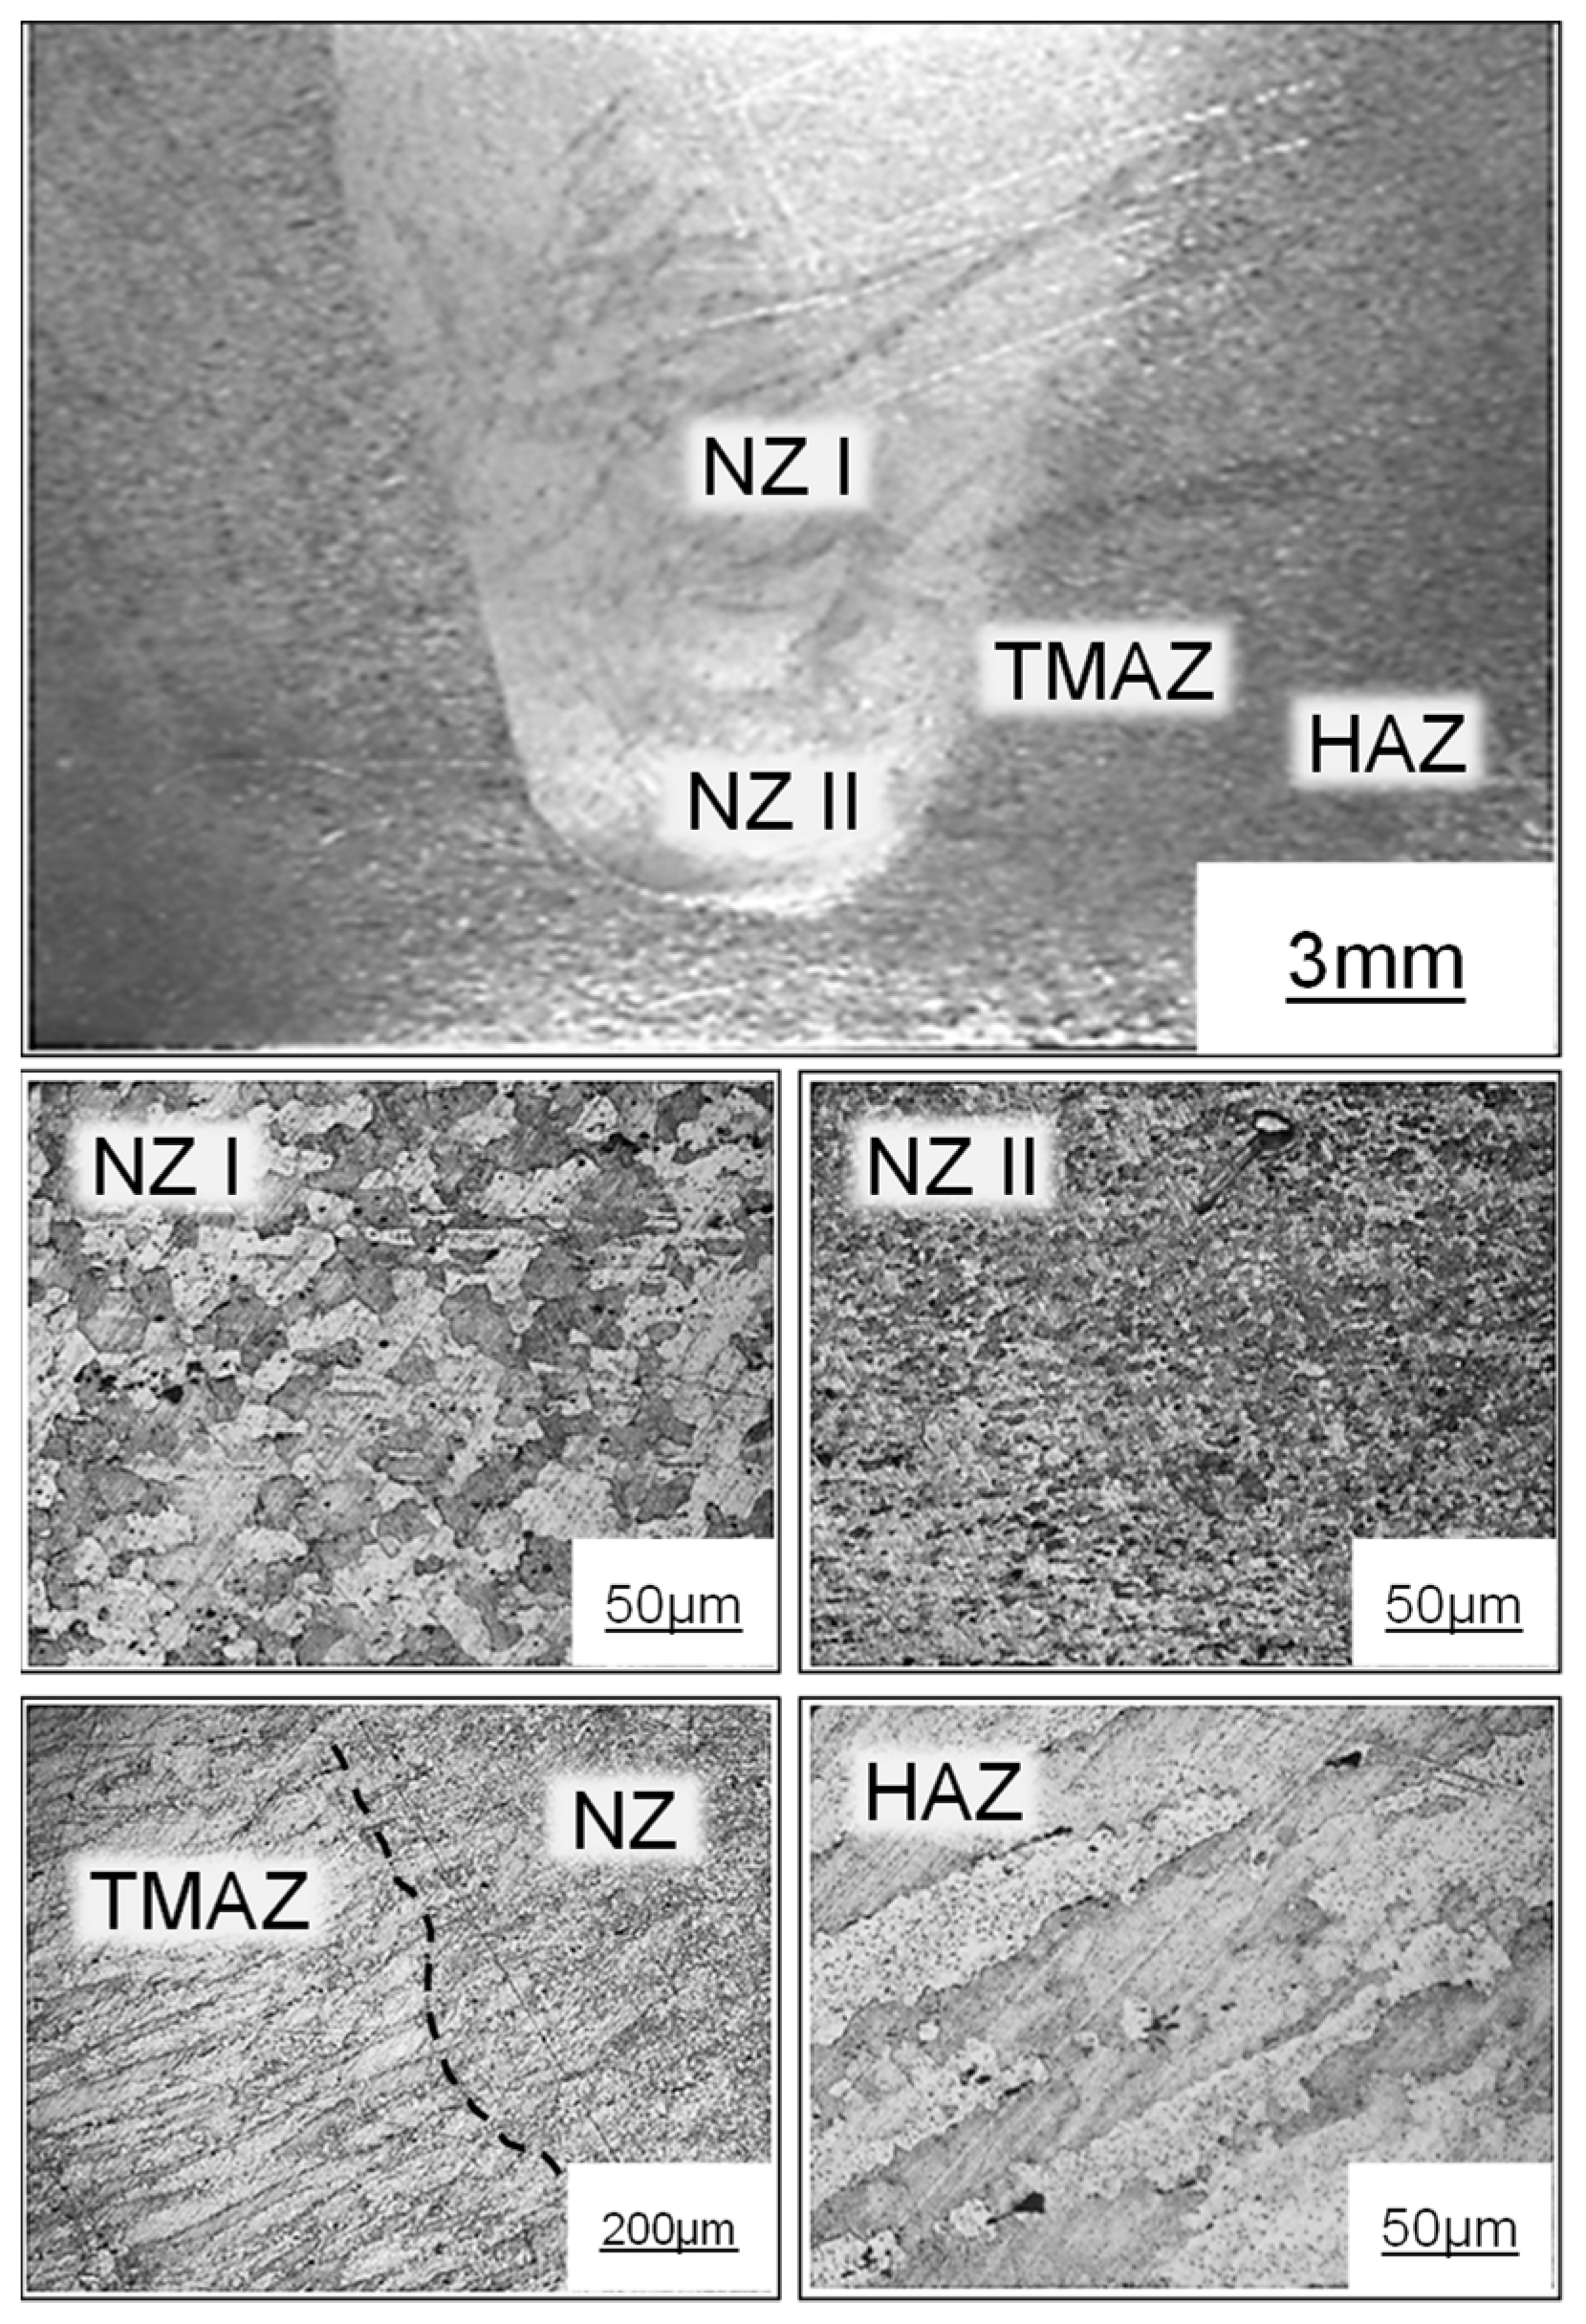
Each zone presents different qualitative or quantitative values of microstructure, hardness, and residual stress; thus, the mechanical properties will be different. Figure 1 shows microstructural changes in different zones of the welded material used for the tests. Regarding etching solution, a standard solution was used, i.e., hydrofluoric acid (0.5 mL) and H2O (99.5 mL). In the NZ, the intense plastic deformation and high temperatures generated created a fully recrystallized microstructure of fine and equiaxial grains in this region. The grain size tended to increase in the upper zone of the weld and decreased as it approached the lower zone. This fact, together with the dissolution of some precipitates, directly affected the properties of the material, particularly the hardness, which decreased noticeably in this area. The TMAZ is the region adjacent to the NZ and was characterized by having a highly deformed structure. The thermally affected zone, HAZ, maintained the same microstructure as the base material; the grains were elongated in the rolling direction. However, as in the TMAZ, there was a considerable difference in the size and distribution of the precipitates, which gave different mechanical properties.
This microstructure variation along a perpendicular line to the weld causes two main problems. On one hand, as well as in other welding processes, weld is the weakest point regarding fatigue, corrosion, and mechanical properties. On other hand, hardness value distribution is not constant, and lower hardness values are detected in TMAZ and HAZ.
Hardness value distribution follows a “W” geometry in a plane perpendicular to the weld. The minimum hardness value was obtained for the HAZ region next to TMAZ as can be seen in Figure 2 (left and right). In the nugget, depending on the material alloy and the heat treatment, the hardness values can vary from HAZ minimum values to base materials hardness values. In some cases, depending on FSW conditions (temperature, stress, deformation, velocity, etc.) and heat treatment characteristics (aging process), the hardness values in the nugget could even be superior to base material values (Figure 2, right).
Most of the aluminum alloys (2xxx, 6xxx, and 7xxx) present the hardness distribution [15] in Figure 2a. However, the one in Figure 2b is also frequent.
Hardness is not the only material property affected by FSW; other material properties (tensile strength, etc.) are also reduced [4]. Moreover, in an aging process, hardness values can be improved, but the value distribution keeps constant [16]. Changes by heat also appears in laser cladding [17] or in micromilling [18] by the rubbing effect of cutting edge when using flexible slender tools. Therefore, a process in order to obtain a complete recrystallization is required. In this line, the burnishing process acts on the surface; it affects penetration depth and improves mechanical properties. This characteristic is of special interest in this application. Due to the different properties in the surface of the component, particularly the hardness, the burnishing process will need to face harder and softer areas. For this reason, it is necessary to analyze the variation of parameters such as the burnishing pressure, in order to achieve an optimal surface after the application of burnishing.
3. Burnishing Tests: Parameter Influence on Surface Quality
Burnishing tests were carried out in a five-axis milling machine center Ibarmia® ZV25/U600 (IBARMIA INNOVATEK, S.L.U., Azkoitia, Spain). The burnishing equipment was adapted to the machine spindle.
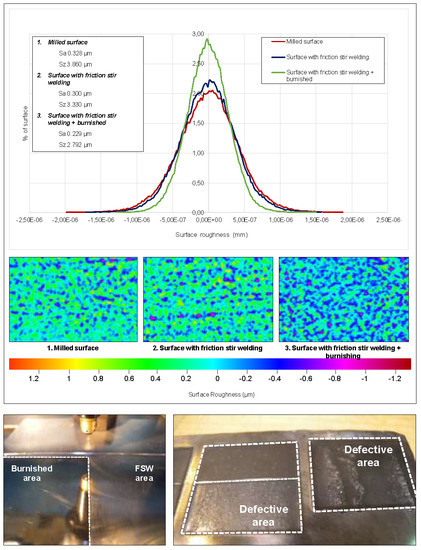
First adjustment tests were carried out by varying the burnishing conditions in a wide range. Rectangular patches were burnished on the surface of the 2050-T8 aluminum alloy base material in order to make a first evaluation of the obtained surface quality. Being a material of medium–low hardness values, the application of excessive surface pressure conditions determines the final result obtained. Table 2 shows tests parameters and obtained roughness values (Ra). The linear burnishing speed was 7500 mm/min, corresponding to the maximum possible value that guarantees that the nominal value is reached at the test distance. Ra < 1.00 μm was established in order to set an indicator to discriminate acceptable values of non-acceptable values of surface roughness for this application. However, another value as an indicator is possible in other applications. On the other hand, frames with a line refer to a defective or excessively deformed surface. These results show how, in this case, the best surface roughness values were obtained with pressures of 10 MPa and radial widths of depth of around 0.1 mm.
In this application, the priority was to obtain similar physical properties in the welded zone and in the base material. In particular, the priority feature was to improve surface and sub-surface hardness in the NZ; therefore, the burnishing pressure must be the maximum possible that allows the material and process without generating defects on the surface.
As can be seen in Figure 3, there are areas where the burnishing process was correct, and areas where the process generated a defective surface due to the high pressure on the surface. In particular, when the burnishing pressure was 40 MPa and the radial width of depth was lower than 0.2 mm, the surface was excessively deformed, generating an irregular and clearly defective final surface. For this reason, in this type of material of medium–low hardness and high ductility, the combination of high pressures and small width of depth is not recommended.
4. Preliminary Tests
The objective of the preliminary tests was to develop the set-up of the work. On one hand, some preliminary burnishing tests were performed in the base material considering a wide range of parameters in order to evaluate material behavior and to establish the correct range of parameters. On the other hand, burnishing tests were performed in a welded plate with the objective of establishing the test methodology used in the work.
4.1. Preliminary Test on Raw Material
The preliminary burnishing tests were performed in base material (T3 and T8 heat treatments) for different process parameters such as ball pressure (Pb = 10 MPa, Pb = 20 MPa, Pb = 30 MPa, Pb = 40 MPa), radial width of depth (ab = 0.05 mm, ab = 0.1 mm, ab = 0.2 mm, ab = 0.3 mm, ab = 0.4 mm, ab = 0.5 mm), and number of passes (N = 1, N = 2) (Figure 4). The burnishing direction was perpendicular to the rolling direction. The burnishing ball diameter was 6 mm.
The burnishing tool feed rate was 7500 mm/min, because, in such a short distance, the machine was not able to reach the maximum nominal speed of 15,000 mm/min. The tests in welded parts were made at the same feed rate because of the same reason. It was proven [7] that the mechanical properties reached with the feed rate of 7500 mm/min are similar to the ones reached with the feed rate of 15,000 mm/min; thus, in the industrial process, a feed rate of 15,000 mm/min is more appropriate because it is faster and, consequently, more efficient.
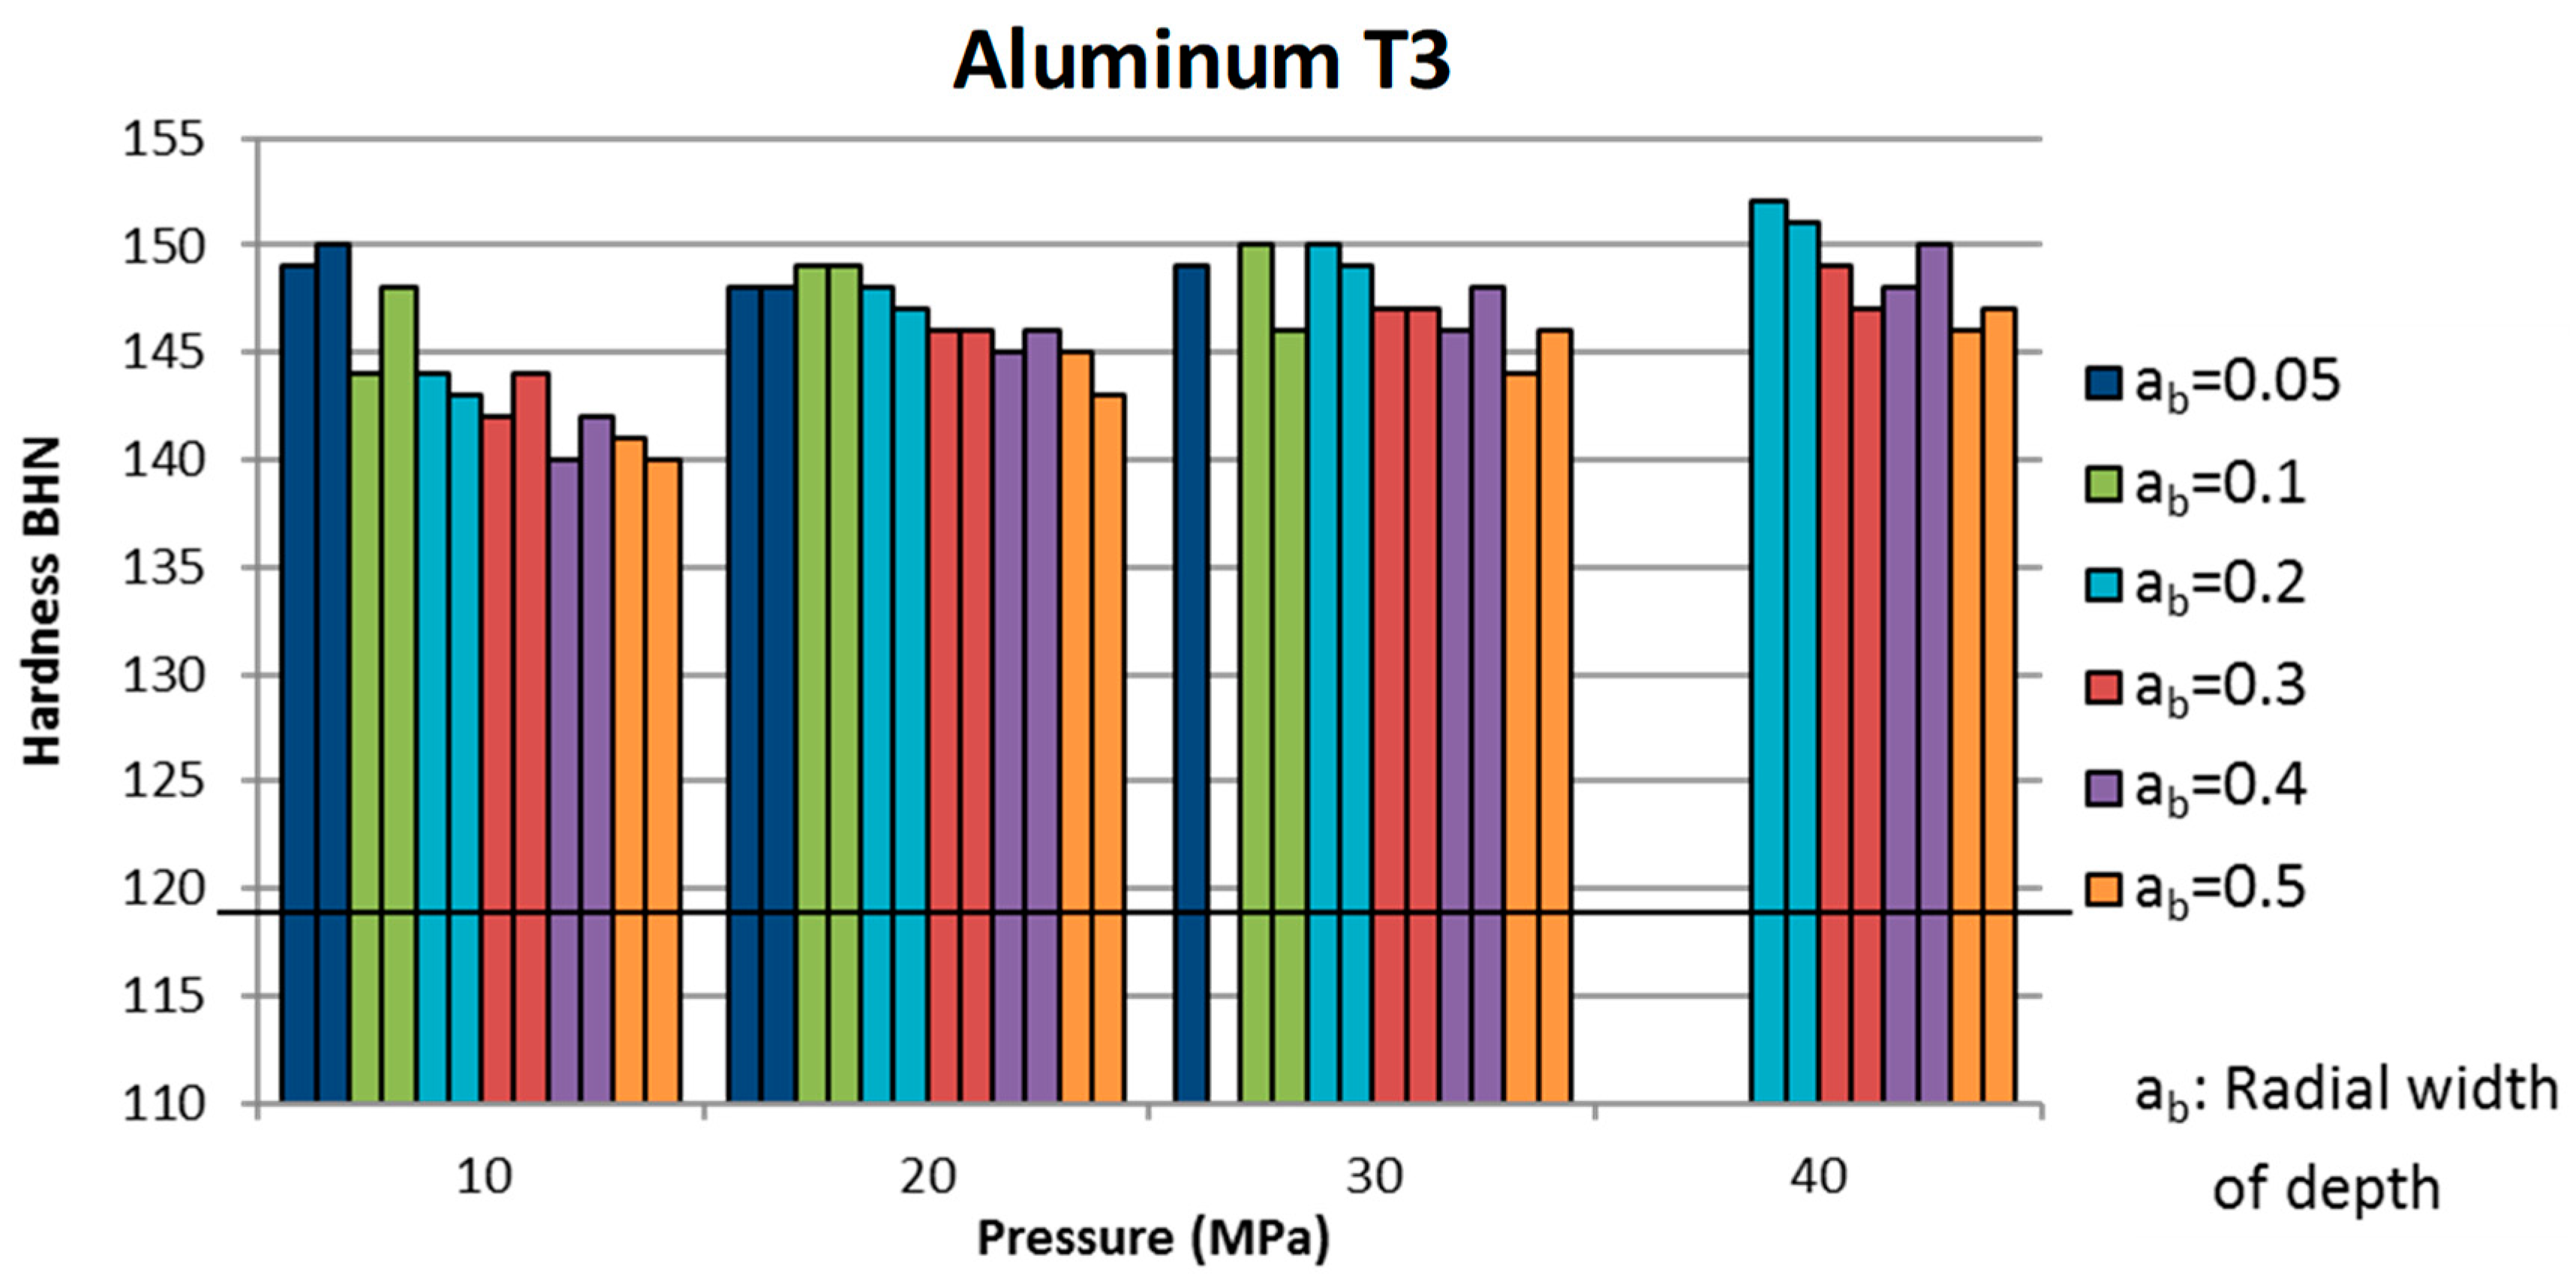
The surface hardness tests were made with a portable hardness tester ERNST Computest SC (CISAM-ERNST srl, Induno Olona, Italy). In Figure 5 and Figure 6, the values of surface hardness (Brinell Hardness Number-BHN) obtained after burnishing operations are shown according to pressure (P), radial width (ab), and the number of burnishing passes (N). The second column of the same color represents the hardness value for the second pass. The surface hardness of the base material is shown as a horizontal black line. Missing conditions are burnished “defective areas” that have unacceptable surface finish.
According to the results, it was confirmed that the surface hardness increased considerably after the burnishing operation. Pressure was the parameter that mainly affected the surface hardness. The radial depth presented minor effects in some cases, and the number of passes had no influence. As 2050 aluminum alloy T3 is softer, it is more deformable plastically and the increase of hardness is higher.
4.2. Preliminary Tests on Welded Part with T8 Heat Treatment
Burnishing tests were performed in welded components in order to establish the test methodology. Process parameters were as follows: P = 20 MPa, ab = 0.1 mm, N = 1, F = 7500 mm/min. The burnishing direction was parallel to welding direction. The burnishing test was performed in 2050 aluminum alloy with heat treatment (T8) after the welding process.
Figure 7 shows the effect of the burnishing operations on surface microhardness across the weld line (Keller’s reagent etched). The microhardness was measured using a microhardness tester Future-Tech FM-800.
According to the results, the surface microhardness across the weld line can be increased on the order of 50% with the burnishing parameters used in the test.
The preliminary results show that hardness values increased. The range of burnishing parameters to study was reduced and the test methodology to use on welded parts was established. With tested correct burnishing parameters, the roughness was maintained and even improved in comparison to initial values. The surface hardness can be increased more than 50%.
5. Tests on FSW Components
After preliminary tests, tests on FSW components were carried out in Constellium (S = 280 rpm, F = 180 mm/min and vertical downforce 58–62 kN) welded plates. In this phase, burnishing parameters were limited to the ones with better results in preliminary tests, and surface and sub-surface hardness values were measured with a microdurometer.
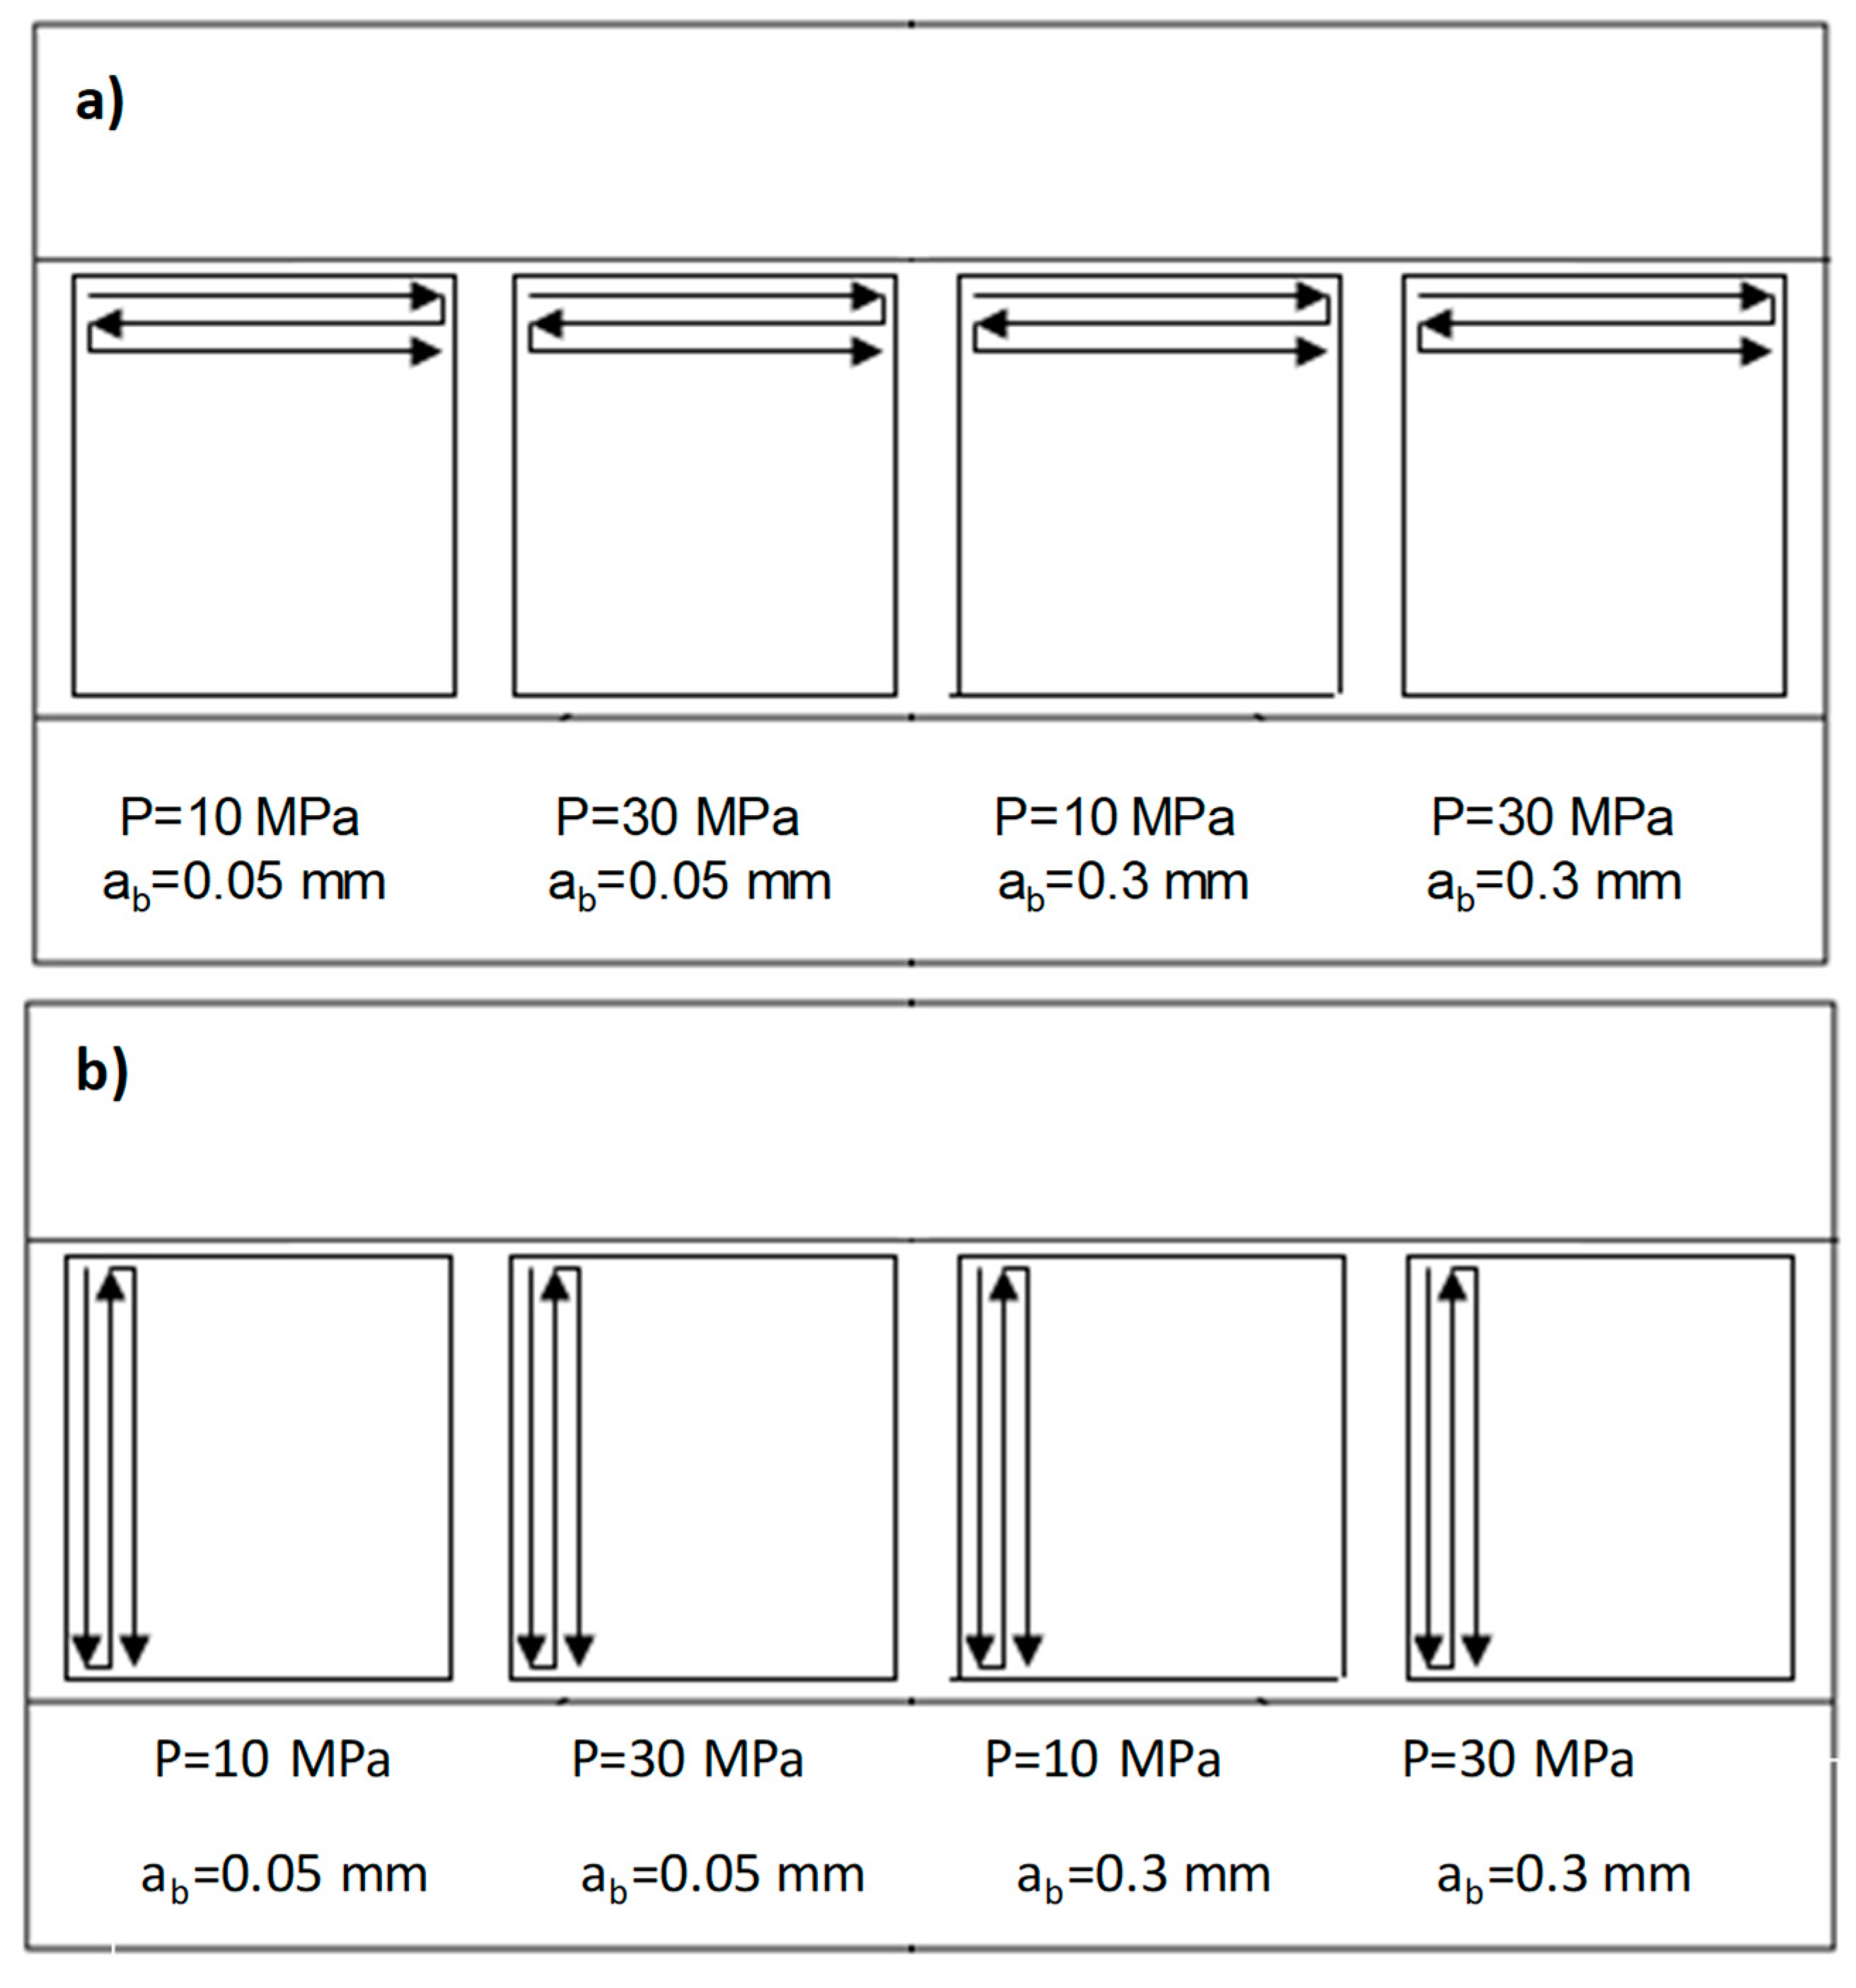
Process burnishing parameters were as follows: ball pressure (Pb = 10 MPa, Pb = 30 MPa) and radial feed (ab = 0.05 mm, ab = 0.3 mm). Tested burnishing directions were parallel and perpendicular to welding direction. The FSW joint line was horizontally located in the middle of burnished rectangles. Two different materials were tested. On one hand, 2050 aluminum alloy with T8 heat treatment and posterior FSW and final burnishing was tested, and, on the other hand, 2050 aluminum alloy with T3 heat treatment, posterior FSW, T8 heat treatment, and final burnishing was tested. As explained in Section 4.1, the feed rate was 7500 mm/min. On the other hand, the number of passes was limited to one (N = 1) for all cases, because it was proven in preliminary tests that the second pass does not have a significant influence on the mechanical properties. Moreover, in this way, the process time was shorter. Figure 8 shows the test design.
5.1. 2050 Aluminum Alloy with T8 Heat Treatment and FSW
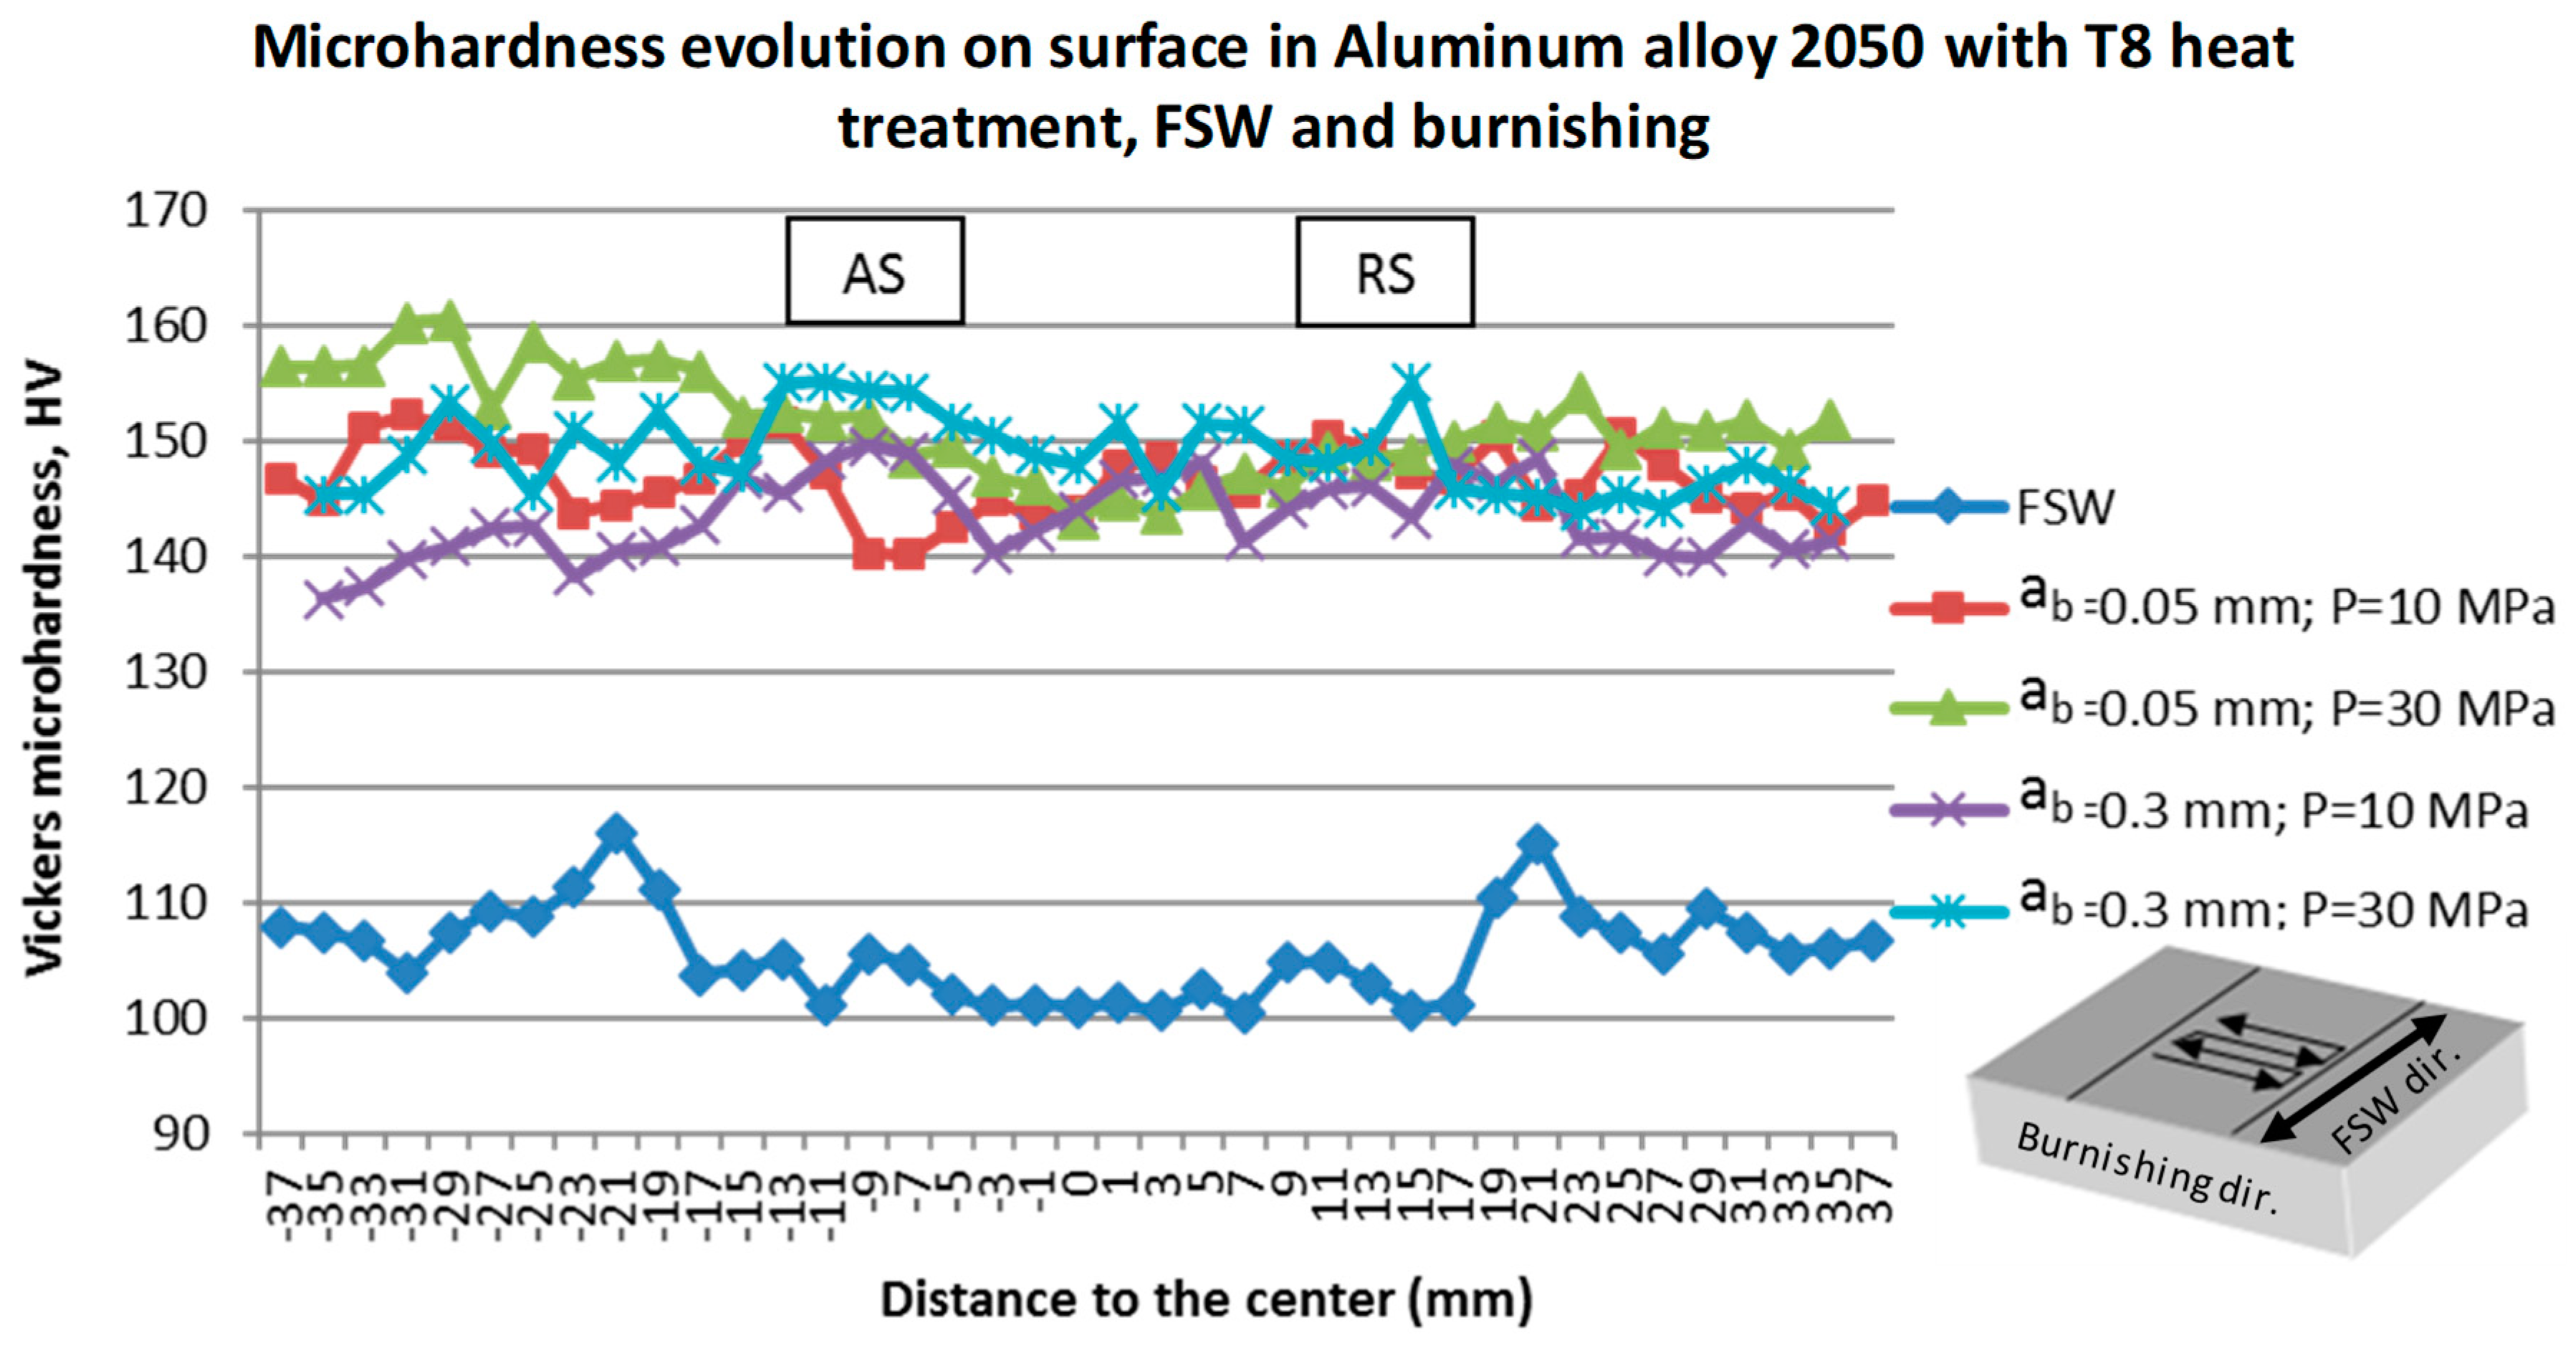
Figure 9 and Figure 10 show the microhardness values, after burnishing tests, through the welding, for the 2050 aluminum alloy with a T8 heat treatment after the FSW process, which did not receive a post-weld heat treatment: Al2050 (T8) + FSW. Figure 9 represents hardness values for burnishing applied in a perpendicular direction to the welding one. Figure 10 shows burnishing applied parallel to the welding direction. In both cases, advancing side (AS) and retreating side (RS) of the welding tool were defined. The AS is the side of the tool with the local direction of the tool surface in relation to tool rotation and the direction of traverse in the same direction. The RS is the side of the tool where the local direction of the tool surface in relation to tool rotation and the direction of traverse are in the opposite direction.
As can be seen in Figure 9 and Figure 10, there was a drop in the hardness values near the nugget area (at a distance of 17 mm from the nugget). Anyway, values were increased in all the tests in comparison to hardness values before burnishing and after FSW (~100 HV), and, in general, hardness value distribution was constant in the welded area. The burnishing process maintained hardness value distribution, increased hardness values, and maintained constant hardness values in the weld area.
After the burnishing process, the drop in the hardness values was much less aggressive in the weld zone. The hardness values increased around 40% and 65% with burnishing tested parameters. However, in all cases, two minimums were also observed at about 17 mm from the nugget (between 140 and 150 HV), although the minimum was clearer on the advancing side than on the retreating side. This fact could be appreciated in the surface of the burnished zone only when aggressive parameters were used (in this case, ab = 0.05 mm; P = 30 MPa). The surface was slightly damaged (Figure 11) at the distance of 17 mm from the center, and previous surface quality was obtained. The damage was clearer when the burnishing was applied perpendicular to welding direction.
According to obtained results, the most determinant factor in the increase of superficial hardness was the pressure. The burnishing direction seemed to have a slight influence, and radial width did not present a significant effect on the increase in hardness. The influence of the burnishing parameters was visible in the weld zone (17 mm from the center in both sides); outside this range, the influence was not so representative. This effect was caused due to the material’s softer condition in the welded area. As a consequence, it was more hardenable by plastic deformation.
Figure 12 shows the influence of the burnishing direction on hardness values. As can be observed, there was a slight increment of hardness values for burnishing in the parallel direction due to burnishing passes being made along the weld direction.
5.2. Aluminum Alloy 2050 with T3 Heat Treatment, FSW, and T8 Heat Treatment
Figure 13 and Figure 14 show the microhardness after burnishing tests, through the welding, for the 2050 aluminum alloy with a T3 heat treatment before the FSW welding and with a T8 post-weld heat treatment: Al2050(T3) + FSW + T8 heat treatment. Figure 13 shows microhardness values of burnishing applied perpendicular to the welding direction, and Figure 14 shows microhardness values of burnishing applied parallel to welding direction.
In this case, there was no drop in the hardness values. Hardness values in the welded area increased due to the heat treatment (T8) after the FSW welding process. The hardness values were maintained almost constant between 100 and 110 HV (with the exception of two maximum values, at about 21 mm from the center on both sides, ~115 HV) through the surface. After the burnishing process, the hardness increased between 40% and 60% with tested parameters. In this case, hardness did not reach the minimum value of the aluminum that did not receive the post-weld heat treatment; thus, the use of the most aggressive parameters (ab = 0.05 mm; P = 30 MPa) damaged the surface less, although the damage was general and not isolated (Figure 15).
It can be concluded that the most determinant factor for the increase in superficial hardness was the pressure, although this effect was clearer when burnishing was applied in the parallel direction of the welding. In this case, the variation in hardness values for each test was larger. Radial width did not present any effect on the increase in hardness, and the burnishing direction in this case was not representative.
6. Surface and Sub-Surface Analysis
This section studies surface roughness values and sub-surface hardness and microstructure results.
6.1. Surface Analysis
For surface analysis, Alicona CompactCobot (Alicona Imaging GmbH, Raaba/Graz, Austria) (collaborative six-axis robot with optical three-dimensional (3D) measurement sensor IF-SensorR25) measuring equipment was used. Surface roughness of milled was compared for a milled surface with friction stir welding and a milled surface with friction stir welding and final burnishing. As can be seen in Figure 16, obtained results regarding surface roughness value were better in surfaces with FSW and burnishing.
6.2. Sub-Surface Hardness and Microstructure
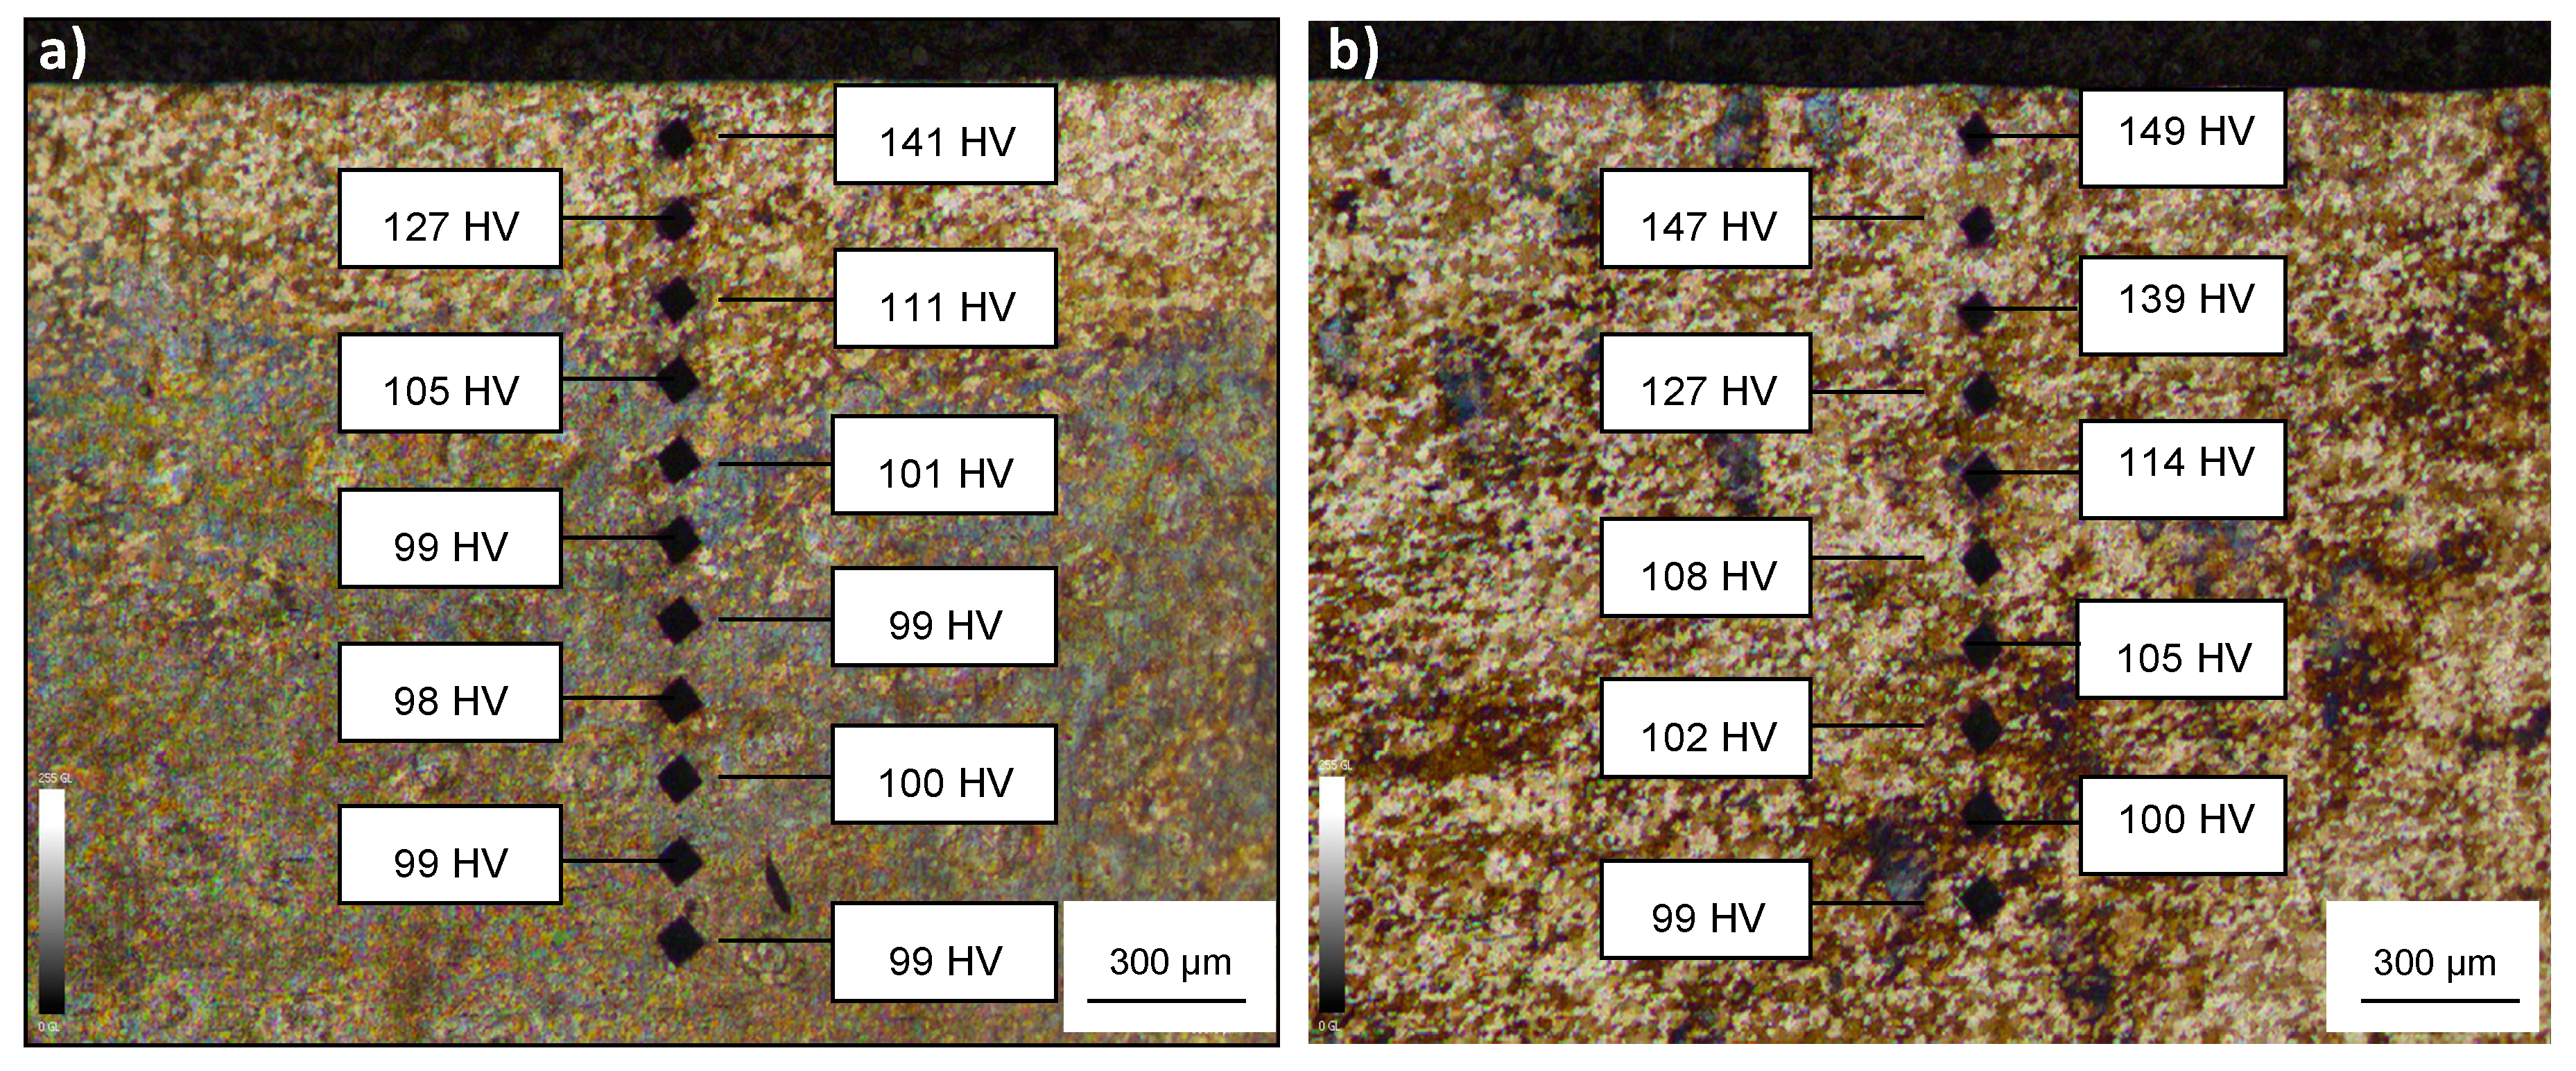
The affected layer of hardened material in the surface depended strongly on the burnishing pressure. It was proven that the effect of burnishing direction on the surface hardness was very small and that the effect of radial width was insignificant. Thus, the effect of the pressure on the sub-surface hardness was studied. Microhardness for two different cases is analyzed in this section (ab = 0.05 mm; P = 10 MPa and ab = 0.05 mm; P = 30 MPa). The measurements were performed in the center of the burnished weld nugget of the aluminum that did not receive a post-weld heat treatment (Al2050 (T3 heat treatment) + FSW). Both material states presented similar hardness values in the surface center; thus, obtained values awee comparable in both cases. Figure 17 shows the sub-surface microhardness values for both tests.
It was proven that the layer of hardened material strongly depended on the burnishing pressure. In the first case (P = 10 MPa), the burnishing process affected a surface layer of 0.5 mm thickness, while, in the second case, the affected surface layer was about 1 mm thickness.
Theoretically, the burnishing operation created a deformation on the surface grains due to the cold-work process. The deformation of the grains increased when the applied burnishing pressure increased. However, this effect was not appreciated in performed tests. Figure 18 shows the microstructure of the studied cases. The microstructure in both cases did not show the deformation of the surface grains.
7. Conclusions
The ball-burnishing process is a highly efficient, cost-effective, and flexible surface condition solution to provide joints with the maximum performance. The combination of the FSW process and ball-burnishing can be a very promising alternative.
After performed burnishing tests, the following can be stated:
- The most determinant factor in the increase of surface hardness is the pressure; this effect is emphasized when burnishing is applied parallel to weld direction.
- Radial width and burnishing direction do not have a clear influence.
- The surface hardness can be increased on the order of 60% for tested aluminum alloys. For the aluminum without post-weld heat treatment, the influence of ball-burnishing was higher in the weld zone where the material was softer and, consequently, more hardenable by plastic deformation.
- The layer of hardened material also depends strongly on the burnishing pressure. A pressure of 10 MPa affected a surface layer of 0.5 mm thickness, while a pressure of 30 MPa affected a layer of practically 1.00 mm thickness.
- The microstructure of the material is not damaged after the burnishing process.
Author Contributions
A.R. and J.L. designed and performed the experiments. H.G. and A.C. wrote the paper. O.P. and G.U. analyzed the data related to surface and sub-surface roughness and dimension accuracy. L.N.L.d.L. contributed with resources (machine, tools, material, etc.) and guided and supervised all the work carried out in this research.
Acknowledgments
This work was supported by the Constellium Technology Center of France and the Aeronautics Advanced Manufacturing Center (CFAA) of Bilbao. We thank also the UFI in the Mechanical Engineering department of the UPV/EHU for its support of this project.
Conflicts of Interest
The authors declare no conflict of interest. The founding sponsors had no role in the design of the study; in the collection, analyses, or interpretation of data; in the writing of the manuscript, and in the decision to publish the results.
References
- Thomas, W.M.; Nicholas, E.D.; Needham, J.C.; Murch, M.G.; Templesmith, P.; Dawes, C.J. Improvements Relating to Friction Welding. Patent EP 0615480 B1, 6 December 1991. [Google Scholar]
- Texier, D.; Atmani, F.; Bocher, P.; Nadeau, F.; Chen, J.; Zedan, Y.; Vanderesse, N.; Demers, V. Fatigue performances of FSW and GMAW aluminum alloys welded joints: Competition between microstructural and structural-contact-fretting crack initiation. Int. J. Fatigue 2018, 116, 220–233. [Google Scholar] [CrossRef]
- Wu, H.; Chen, Y.-C.; Strong, D.; Prangnell, P. Stationary shoulder FSW for joining high strength aluminum alloys. J. Mater. Process. Technol. 2015, 221. [Google Scholar] [CrossRef]
- Patel, A.R.; Kotadiya, D.J.; Kapopara, J.M.; Dalwadi, C.G.; Patel, N.P.; Rana, H.G. Investigation of mechanical properties for hybrid joint of aluminium to polymer using friction stir welding (FSW). Mater. Today Proc. 2018, 5, 4242–4249. [Google Scholar] [CrossRef]
- Moreira, P.M.G.P.; de Figueiredo, M.A.V.; de Castro, P.M.S.T. Fatigue behaviour of FSW and MIG weldments for two aluminium alloys. Theor. Appl. Fract. Mech. 2007, 48, 169–177. [Google Scholar] [CrossRef]
- Jenarthanan, M.P.; Varma, C.V.; Manohar, V.K. Impact of friction stir welding (FSW) process parameters on tensile strength during dissimilar welds of AA2014 and AA6061. Mater. Today Proc. 2018, 5, 14384–14391. [Google Scholar] [CrossRef]
- Rodríguez, A.; López de Lacalle, L.N.; Celaya, A.; Lamikiz, A.; Albizuri, J. Surface improvement of shafts by the deep ball-burnishing technique. Surf. Coat. Technol. 2012, 206, 2817–2824. [Google Scholar] [CrossRef]
- Jayaraman, N.; Prevéy, P.; Mahoney, M. Fatigue life improvement of an aluminium alloy FSW with low plasticity burnishing. In Proceedings of the 132th TMS Annual Meeting, San Diego, CA, USA, 2–6 March 2003. [Google Scholar]
- Huang, Y.; Wan, L.; LV, S.; Zhang, J.; Fu, G. In-situ rolling friction stir welding for joining AA2219. Mater. Des. 2013, 50, 810–816. [Google Scholar] [CrossRef]
- Başak, H.; Özkan, S.; Taşkesen, A. Application of burnishing process on friction stir welding and investigation of the effect of burnishing process on the surface roughness, hardness and strength. Exp. Tech. 2011, 35, 8–16. [Google Scholar] [CrossRef]
- Abdullah, R.; Beithou, N. Burnishing Effects on Friction Stir Welding of Al-Alloy 7075 T6. Glob. J. Res. Eng. Mech. Mech. Eng. 2014, 14, 12–19. [Google Scholar]
- Krasnowski, C.; Hamilton, S.; Dymek, S. Influence of the tool shape and weld configuration on microstructure and mechanical properties of the Al 6082 alloy FSW joints. Arch. Civ. Mech. Eng. 2015, 15, 133–141. [Google Scholar] [CrossRef]
- Sachinkumar, S.; Chakradhar, D. Effect of FSW on microstructure and hardness of AA6061/SiC/fly ash MMCs. Mater. Today Proc. 2018, 5, 17866–17872. [Google Scholar] [CrossRef]
- Lequeu, P.; Lassince, P.; Warner, T. Aluminum alloy development for the airbus A380. Adv. Mater. Process 2007, 165, 41–44. [Google Scholar]
- Buahombura, P.; Miyashita, Y.; Otsuka, Y.; Mutoh, Y.; Nobushiro, S. Fatigue crack growth behavior in weld nugget zone of FSWed similar and dissimilar aluminum alloys joint. In Proceedings of the 1st International Joint Symposium on Joining and Welding; Woodhead Publishing: Cambridge, UK, 2013; pp. 225–230. [Google Scholar] [CrossRef]
- Krishna, P.M.; Simhachalam, M.; Ramanaiah, N. Effect of ageing on mechanical properties of dissimilar friction stir welded aluminum alloy (AA2024 and AA6351) joints. J. Appl. Sci. 2012, 12, 1053–1057. [Google Scholar] [CrossRef]
- Calleja, A.; Tabernero, I.; Fernández, A.; Celaya, A.; Lamikiz, A.; López de Lacalle, L.N. Improvement of strategies and parameters for multi-axis laser cladding operations. Opt. Lasers Eng. 2014, 56, 113–120. [Google Scholar] [CrossRef]
- Uriarte, L.; Azcárate, S.; Herrero, A.; Lopez de Lacalle, L.N.; Lamikiz, A. Mechanistic modelling of the micro end milling operation. Proc. Inst. Mech. Eng. B J. Eng. Manuf. 2008, 222, 23–33. [Google Scholar] [CrossRef]
Figure 1.
Microstructural changes in the friction stir welding (FSW) weld union in 2050 aluminum alloy.
Figure 1.
Microstructural changes in the friction stir welding (FSW) weld union in 2050 aluminum alloy.

Figure 2.
Hardness value distribution along a line perpendicular to the welding clad. (a) Distribution with base material hardness values higher than nugget hardness values. (b) Distribution with nugget hardness values higher than base material hardness values.
Figure 2.
Hardness value distribution along a line perpendicular to the welding clad. (a) Distribution with base material hardness values higher than nugget hardness values. (b) Distribution with nugget hardness values higher than base material hardness values.

Figure 3.
Burnished area details. (a) Correct burnished area; (b) excessively deformed area: visible defect.
Figure 3.
Burnished area details. (a) Correct burnished area; (b) excessively deformed area: visible defect.

Figure 4.
Different burnishing tests in the base material. (a) Test design. (b) Real performed burnishing tests according to test design.
Figure 4.
Different burnishing tests in the base material. (a) Test design. (b) Real performed burnishing tests according to test design.

Figure 5.
Effect of pressure, radial width, and number of phases in the surface hardness for the 2050 aluminum alloy with T3 heat treatment.
Figure 5.
Effect of pressure, radial width, and number of phases in the surface hardness for the 2050 aluminum alloy with T3 heat treatment.

Figure 6.
Effect of pressure, radial width, and number of passes in the surface hardness for the 2050 aluminum alloy with T8 heat treatment.
Figure 6.
Effect of pressure, radial width, and number of passes in the surface hardness for the 2050 aluminum alloy with T8 heat treatment.

Figure 7.
Effect of burnishing in Brinell hardness of the surface across the weld line.

Figure 8.
Design of tests in weld plates. (a) Burnishing parallel to welding direction. (b) Burnishing perpendicular to welding direction.
Figure 8.
Design of tests in weld plates. (a) Burnishing parallel to welding direction. (b) Burnishing perpendicular to welding direction.

Figure 9.
Microhardness evolution with burnishing applied perpendicular to the welding direction.

Figure 10.
Microhardness evolution with burnishing applied parallel to the welding direction.

Figure 11.
Example of damaged surface due to the use of aggressive parameters.

Figure 12.
Effect of burnishing direction on microhardness values for ab = 0.05 mm.

Figure 13.
Microhardness evolution with burnishing applied perpendicular to the welding direction.

Figure 14.
Microhardness evolution with burnishing applied parallel to the welding direction.

Figure 15.
Example of damaged surface due to the use of aggressive parameters.

Figure 16.
Measured roughness results.

Figure 17.
Microhardness values. (a) After burnishing operation (P = 10 MPa); (b) after burnishing operation (P = 30 MPa).
Figure 17.
Microhardness values. (a) After burnishing operation (P = 10 MPa); (b) after burnishing operation (P = 30 MPa).

Figure 18.
Microstructure 20×. (a) After burnishing operation (P = 10 MPa); (b) after burnishing operation (P = 30 MPa).
Figure 18.
Microstructure 20×. (a) After burnishing operation (P = 10 MPa); (b) after burnishing operation (P = 30 MPa).


Table 1.
Aluminum alloy (2050) chemical composition and standard properties.
| 2050 ALUMINIUM ALLOY | |||||||||
|---|---|---|---|---|---|---|---|---|---|
| COMPOSITION | Si | Fe | Cu | Mn | Mg | Zn | Li | Ag | Zr |
| 0.08 | 0.10 | 3.2 3.9 | 0.2 0.5 | 0.2 0.6 | 0.25 | 0.7 1.7 | 0.2 0.7 | 0.06 0.14 | |
| PROPERTIES | KIC (MPa·m1/2) | Hardness T3 (Brinell Hardness Number-BHN) | Hardness T8 (Brinell Hardness Number-BHN) | ||||||
| ≈37 | 120 | 160 | |||||||
Table 2.
Burnishing conditions and roughness values (Ra).
| State | Radial Width of Depth (ab (mm)) | Pressure | |||
|---|---|---|---|---|---|
| 10 MPa | 20 MPa | 30 MPa | 40 MPa | ||
| Initial | 0 | 0.47 | 0.47 | 0.47 | 0.47 |
| Burnishing | 0.05 | 0.23 | 0.26 | 0.36 | - |
| 0.1 | 0.20 | 0.28 | 0.31 | - | |
| 0.2 | 0.32 | 0.53 | 0.71 | 1.02 | |
| 0.3 | 0.61 | 0.95 | 0.98 | 1.51 | |
| 0.4 | 0.93 | 1.43 | 1.87 | 2.14 | |
| 0.5 | 1.96 | 2.54 | 3.22 | 3.76 | |
© 2019 by the authors. Licensee MDPI, Basel, Switzerland. This article is an open access article distributed under the terms and conditions of the Creative Commons Attribution (CC BY) license (http://creativecommons.org/licenses/by/4.0/).
Share and Cite
MDPI and ACS Style
Rodríguez, A.; Calleja, A.; López de Lacalle, L.N.; Pereira, O.; González, H.; Urbikain, G.; Laye, J. Burnishing of FSW Aluminum Al–Cu–Li Components. Metals 2019, 9, 260. https://0-doi-org.brum.beds.ac.uk/10.3390/met9020260
AMA Style
Rodríguez A, Calleja A, López de Lacalle LN, Pereira O, González H, Urbikain G, Laye J. Burnishing of FSW Aluminum Al–Cu–Li Components. Metals. 2019; 9(2):260. https://0-doi-org.brum.beds.ac.uk/10.3390/met9020260
Chicago/Turabian StyleRodríguez, Adrián, Amaia Calleja, Luis Norberto López de Lacalle, Octavio Pereira, Haizea González, Gorka Urbikain, and Julien Laye. 2019. "Burnishing of FSW Aluminum Al–Cu–Li Components" Metals 9, no. 2: 260. https://0-doi-org.brum.beds.ac.uk/10.3390/met9020260
Note that from the first issue of 2016, this journal uses article numbers instead of page numbers. See further details here.