Article

Delaware’s Climate Action Plan: Omission of Source Attribution from Land Conversion Emissions

1
Department of Forestry and Environmental Conservation, Clemson University, Clemson, SC 29634, USA
2
Department of Biological Science and Biotechnology, Minnan Normal University, Zhangzhou 363000, China
3
University Key Lab for Geomatics Technology and Optimized Resources Utilization in Fujian Province, Fuzhou 350002, China
4
University of Arkansas Agricultural Experiment Station, Arkansas Forest Resources Center, University of Arkansas at Monticello, Monticello, AR 71655, USA
5
Department of Environmental Engineering and Earth Sciences, Clemson University, Anderson, SC 29625, USA
6
Geography Department, Portland State University, Portland, OR 97202, USA
7
Emory University School of Law, Atlanta, GA 30322, USA
*
Author to whom correspondence should be addressed.
Submission received: 15 March 2022 / Revised: 18 April 2022 / Accepted: 20 April 2022 / Published: 9 May 2022

Abstract

:
Delaware’s (DE) Climate Action Plan lays out a pathway to reduce greenhouse gas (GHG) emissions by at least 26% by 2025 but does not consider soil-based GHG emissions from land conversions. Consequently, DE’s climate action plan fails to account for the contribution of emissions from ongoing land development economic activity to climate change. Source attribution (SA) is a special field within the science of climate change attribution, which can generate “documentary evidence” (e.g., GHG emissions inventory, etc.). The combination of remote sensing and soil information data analysis can identify the source attribution of GHG emissions from land conversions for DE. Traditional attribution science starts with climate impacts, which are then linked to source attribution of GHG emissions. The most urgent need is not only to detect climate change impacts, but also to detect and attribute sources of climate change impacts. This study used a different approach that quantified past soil GHG emissions which are then available to support impact attribution. Study results provide accurate and quantitative spatio-temporal source attribution for likely GHG emissions, which can be included in the DE’s climate action plan. Including the impact of land conversion on GHG emissions is critical to mitigating climate impacts, because without a more complete source attribution it is not possible to meet overall emission reduction goals. Furthermore, the increased climate change impacts from land conversions are in a feedback loop where climate change can increase the rates of GHG emissions as part of these conversions. This study provides a spatially explicit methodology that could be applied to attribute past, future, or potential GHG emission impacts from land conversions that can be included in DE’s GHGs inventory and climate impact assessment.

1. Introduction

Attribution science is becoming increasingly important in climate litigation “as it informs discussions of responsibility for climate change” (Burger et al. 2020; Baldrich 2021). Climate change detection and attribution science try to identify the role of human actions on the climate and related Earth systems in a two-step process by detecting change and attributing possible causative factors for detected change (Burger et al. 2020). Attribution science is divided into three types: (1) source attribution, (2) climate attribution, and (3) impact attribution (Baldrich 2021) (Figure 1). Source attribution involves “identifying the relative contribution of various emission sources and land use changes” (Burger et al. 2020). Climate attribution “links climate change to anthropogenic drivers” (Burger et al. 2020). Impact attribution “links impact to climate change” (Burger et al. 2020). Traditionally, most climate attribution studies have been focused on attribution of long-term change, event attribution, and impact attribution (Zhao et al. 2018). Source attribution is particularly important for GHG inventories, which are essential in climate change policies and actions at various spatio-temporal scales. These GHG inventories serve as “documentary evidence”, which can be used to assign responsibility for emissions (Burger et al. 2020). Ideally, source attribution “cuts across different social and scientific disciplines” (Burger et al. 2020).

The Role of Soils in Delaware’s Climate Action Plan and Source Attribution

The state of DE seeks to achieve at least 26% reduction in GHG emissions by 2025 without considering soil-based emissions from land conversions (Delaware Department of Natural Resources and Environmental Control 2021). Delaware is “part of the U.S. Climate Alliance, a bipartisan coalition of 25 states that have committed to reducing GHG emissions, thereby supporting the goals of the Paris Agreement (United Nations 2015) and the United Nations Sustainable Development Goals (SDGs)” (Keestra et al. 2016). Delaware’s Climate Action Plan calls for accountability and transparency in statewide emissions reductions, which involve DE’s GHG inventory. Delaware’s “2017 GHG Emission Inventory” does not include GHG emissions from land conversions because this inventory “identified the land-use sector and forestry as a sink for GHG emissions in Delaware” without providing accounting and methodological details (Division of Air Quality 2020). This omission of source attribution is one of the gaps in DE’s climate action to maximize resilience to climate change impacts (Delaware Department of Natural Resources and Environmental Control 2021).
Pedodiversity of DE (soil type composition of the State) defines the soil regulating ecosystem services/disservices (ES/ED) potential with regards to its ability to store or release CO2 and the vulnerability of soil resources to climate change (Table 1, Figure 2) (Mikhailova et al. 2021a). There are five soil orders in the state of DE, belonging to slightly weathered (Entisols, Inceptisols, Histosols), moderately weathered (Alfisols), and strongly weathered (Ultisols) soils with different soil C storages and vulnerabilities to climate change. The state of DE has selected Greenwich as the State Soil (soil order: Ultisols) for its value in provisioning ES (e.g., agriculture, forestry, prime farmland) (Natural Resources Conservation Service n.d.).
Soils are an integral part of DE’s diverse ecosystems and provide numerous ES/ED to the State and its citizens, especially upon considering the high proportion of private land ownership in the state (92.6%, U.S. Bureau of the Census 1991). Delaware is experiencing an increase in development because of population growth, which threatens various ecosystems, including wetlands (Delaware Department of Natural Resources and Environmental Control 2011). According to an economic valuation of wetland ES in DE, a 1.2% decline (−3132 acres) in wetlands across the State over a 15-year period (2007 to 2022) will result in numerous damages, including loss of 194,417 metric tons of carbon storage with associated social costs of carbon in the amount of $19.9M (where M = million = 106) based on $118 per Mg of C (Toll 2009). This analysis did not differentiate carbon losses by soil type.
The present study hypothesizes that source attribution from land conversions emissions can be used by the State of DE to supplement its current GHG emissions inventory with soil-based GHG emissions from land conversions. Our study will use newly determined soil-based emission estimates from land conversion in DE obtained through integrated remote sensing and soil spatial data analysis. This type of analysis shows “hotspots” of GHG emissions, which result from the conversion of low disturbance (e.g., forests, pastures) to high disturbance (e.g., residential and commercial developments) land covers (Mikhailova et al. 2021b). Our study will demonstrate how spatially explicit scientific data on GHG emissions can be “translated” into “documentary evidence” that can be used by state and federal governments for source attribution.
The specific objective of this study was to assess the value of soil organic carbon (SOC), soil inorganic carbon (SIC), and total soil carbon (TSC) in the state of DE (USA) and its change in the past 15 years based on the social cost of C (SC–CO2) and avoided emissions provided by C sequestration, which the U.S. Environmental Protection Agency (EPA) has determined to be $46 per metric ton of CO2, applicable for the year 2025 based on 2007 U.S. dollars and an average discount rate of 3% (EPA 2016a). Our calculations provide estimates for the monetary values of SOC, SIC, and TSC across the state and by different spatial aggregation levels (i.e., county) using the State Soil Geographic (STATSGO) and Soil Survey Geographic Database (SSURGO) databases and information previously reported by Guo et al. (2006). Classified land cover data for 2001 and 2016 were downloaded from the Multi-Resolution Land Characteristics Consortium (MRLC) website (MRLC n.d.).

2. Accounting for Soil Regulating Ecosystem Services in the State of Delaware

This study used both biophysical (science-based, Figure 2) and administrative (boundary-based, Figure 2) accounts to calculate monetary values for SOC, SIC, and TSC (Table 2 and Table 3). Although this framework was used primarily to account for soil regulating ES, it can be adapted for identifying source attribution. Table 2 was enhanced by the addition of an explanation of different interpretations of source attributions (e.g., physical, social, etc.).
The present study estimates monetary values associated with stocks of SOC, SIC, and TSC in DE based on reported contents (in kg m−2) from Guo et al. (2006). Values were calculated using the avoided social cost of carbon (SC-CO2) of $46 per metric ton of CO2, applicable for 2025 based on 2007 U.S. dollars and an average discount rate of 3% (EPA 2016a). According to the EPA, the SC-CO2 is intended to be a comprehensive estimate of climate change damages. Still, it can underestimate the true damages and cost of CO2 emissions due to the exclusion of various important climate change impacts recognized in the literature (EPA 2016b). Area-normalized monetary values ($ m−2) were calculated using Equation (1), and total monetary values were summed over the appropriate area(s) (noting that a metric ton is equivalent to 1 megagram (Mg) or 1000 kilograms (kg), and SC = soil carbon, e.g., SOC, SIC, or TSC):
$ m 2   =   ( SOC / SIC / TSC   Content , kg m 2 )   ×   1   Mg 10 3   kg   ×   44   Mg   CO 2 12   Mg   SC × $ 46 Mg   CO 2
Table 4 presents area-normalized contents (kg m−2) and monetary values ($ m−2) of soil carbon, which were used to estimate stocks of SOC, SIC, and TSC and their corresponding values by multiplying the contents/values by the area of a particular soil order within a county (Table 3). For example, for the soil order Inceptisols, Guo et al. (2006) reported a midpoint SOC content of 8.9 kg m−2 for the upper 2-m soil depth (Table 4).
Using this SOC content in Equation (1) results in an area-normalized SOC value of $1.50 m−2. Multiplying the SOC content and its corresponding area-normalized value each by the total area of Inceptisols present in Delaware (558.5 km2, Table 3) results in an estimated SOC stock of 5.0 × 10⁹ kg (Table 5) with an estimated monetary value of $837.7M.
Land use/land cover change in DE between 2001 and 2016 was analyzed using classified land cover data from the MRLC (MRLC n.d.). Changes in land cover, with their associated soil types, were calculated in ArcGIS Pro 2.6 (ESRI n.d.) by comparing the 2001 and 2016 data, converting the land cover to vector format, and unioning the data with the soils layer in the Soil Survey Geographic (SSURGO) Database (Soil Survey Staff n.d.a).

3. Soil Carbon Regulating Ecosystem Services and Land Cover Change in the State of Delaware

Based on avoided SC–CO2, the total estimated monetary mid-point value for TSC in the state of Delaware was $6.8B (i.e., 6.8 billion U.S. dollars, where B = billion = 109), $5.7B for SOC (84% of the total value), and $1.1B for SIC (16% of the total value). Previously, we have reported that among the 48 conterminous states of the U.S., Delaware ranked 47th for TSC (Mikhailova et al. 2019b), 47th for SOC (Mikhailova et al. 2019a), and 47th for SIC (Groshans et al. 2019).

3.1. Storage and Value of SOC by Soil Order and County for Delaware

Soil orders with the highest midpoint value for SOC were Ultisols ($3.2B), Entisols ($928.7M), and Inceptisols ($837.7M) (i.e., 837.7 million U.S. dollars, where M = million = 106) (Table 5 and Table 6). The highest midpoint SOC value was in Sussex County ($3.3B), followed by Kent County ($1.7B), and then New Castle County ($759.2M) (Table 5 and Table 6).

3.2. Storage and Value of SIC by Soil Order and County for Delaware

Soil orders with the highest midpoint value for SIC were Entisols ($564.1M), Inceptisols ($480.3M), and Alfisols ($90.0M) (where M = million = 106) (Table 7 and Table 8). The ranking of counties for SIC value was the same as for SOC above: Sussex County ($757.3M), Kent County ($202.2M), and New Castle County ($186.5M) (Table 7 and Table 8).

3.3. Storage and Value of TSC (SOC + SIC) by Soil Order and County for Delaware

Soil orders with the highest midpoint value for TSC were Ultisols ($3.2B), Entisols ($1.5B), and Inceptisols ($1.3B) (Table 9 and Table 10). Sussex County had the highest TSC value ($4.0B), followed by Kent County ($1.9B), and New Castle County ($945.8M) (Table 9 and Table 10). Note that SOC was a larger contributor to TSC in the State than SIC.

3.4. Land Use/Land Cover Change by Soil Order in Delaware from 2001 to 2016

Delaware experienced changes in land use/land cover (LULC) over the 15-year period from 2001 to 2016 (Table 11 and Figure 3), which resulted in GHG emissions from soils. Changes varied by soil order and original LULC classification, with most soil orders experiencing area losses in “low disturbance” LULC classes (e.g., evergreen forest, hay/pasture) while gaining in the areas of “developed” LULC classes. Among the three counties, Sussex has exhibited the most development with $70.96M in realized social costs. Sussex is in the southern part of the state with many beaches, and it has experienced growth in real estate attracting various homebuyers (e.g., retirees, etc.).

4. Significance of Results

4.1. Significance of Results for Delaware’s GHG Emissions Inventory and Climate Action Plan

Although the state of DE is committed to reducing GHG emissions by at least 26% by 2025, there are gaps in achieving this goal in a quantifiable way (Delaware Department of Natural Resources and Environmental Control 2021). One of these gaps is information about soil carbon storage and soil-based GHG emissions from land conversions in both Delaware’s GHG Emissions Inventory (Division of Air Quality 2020) and Delaware’s Climate Action Plan (Delaware Department of Natural Resources and Environmental Control 2021). This study provides quantitative information about the distribution of soil regulating ecosystem services in DE (Table 12).
The 2017 GHG emissions inventory for DE (Division of Air Quality 2020) claims that land-use is a sink, but our results show opposite findings with GHG emissions as a result of land conversions between 2001 and 2016. This lack of information can prevent the state of DE in achieving its GHG emissions reduction goals since its accounting of GHG emissions is incomplete. This study provides quantitative information about soil-based GHG emissions (Table 11, Table 12, Table 13 and Table 14) as a result of land conversions.

4.2. Significance of Results in Broader Context

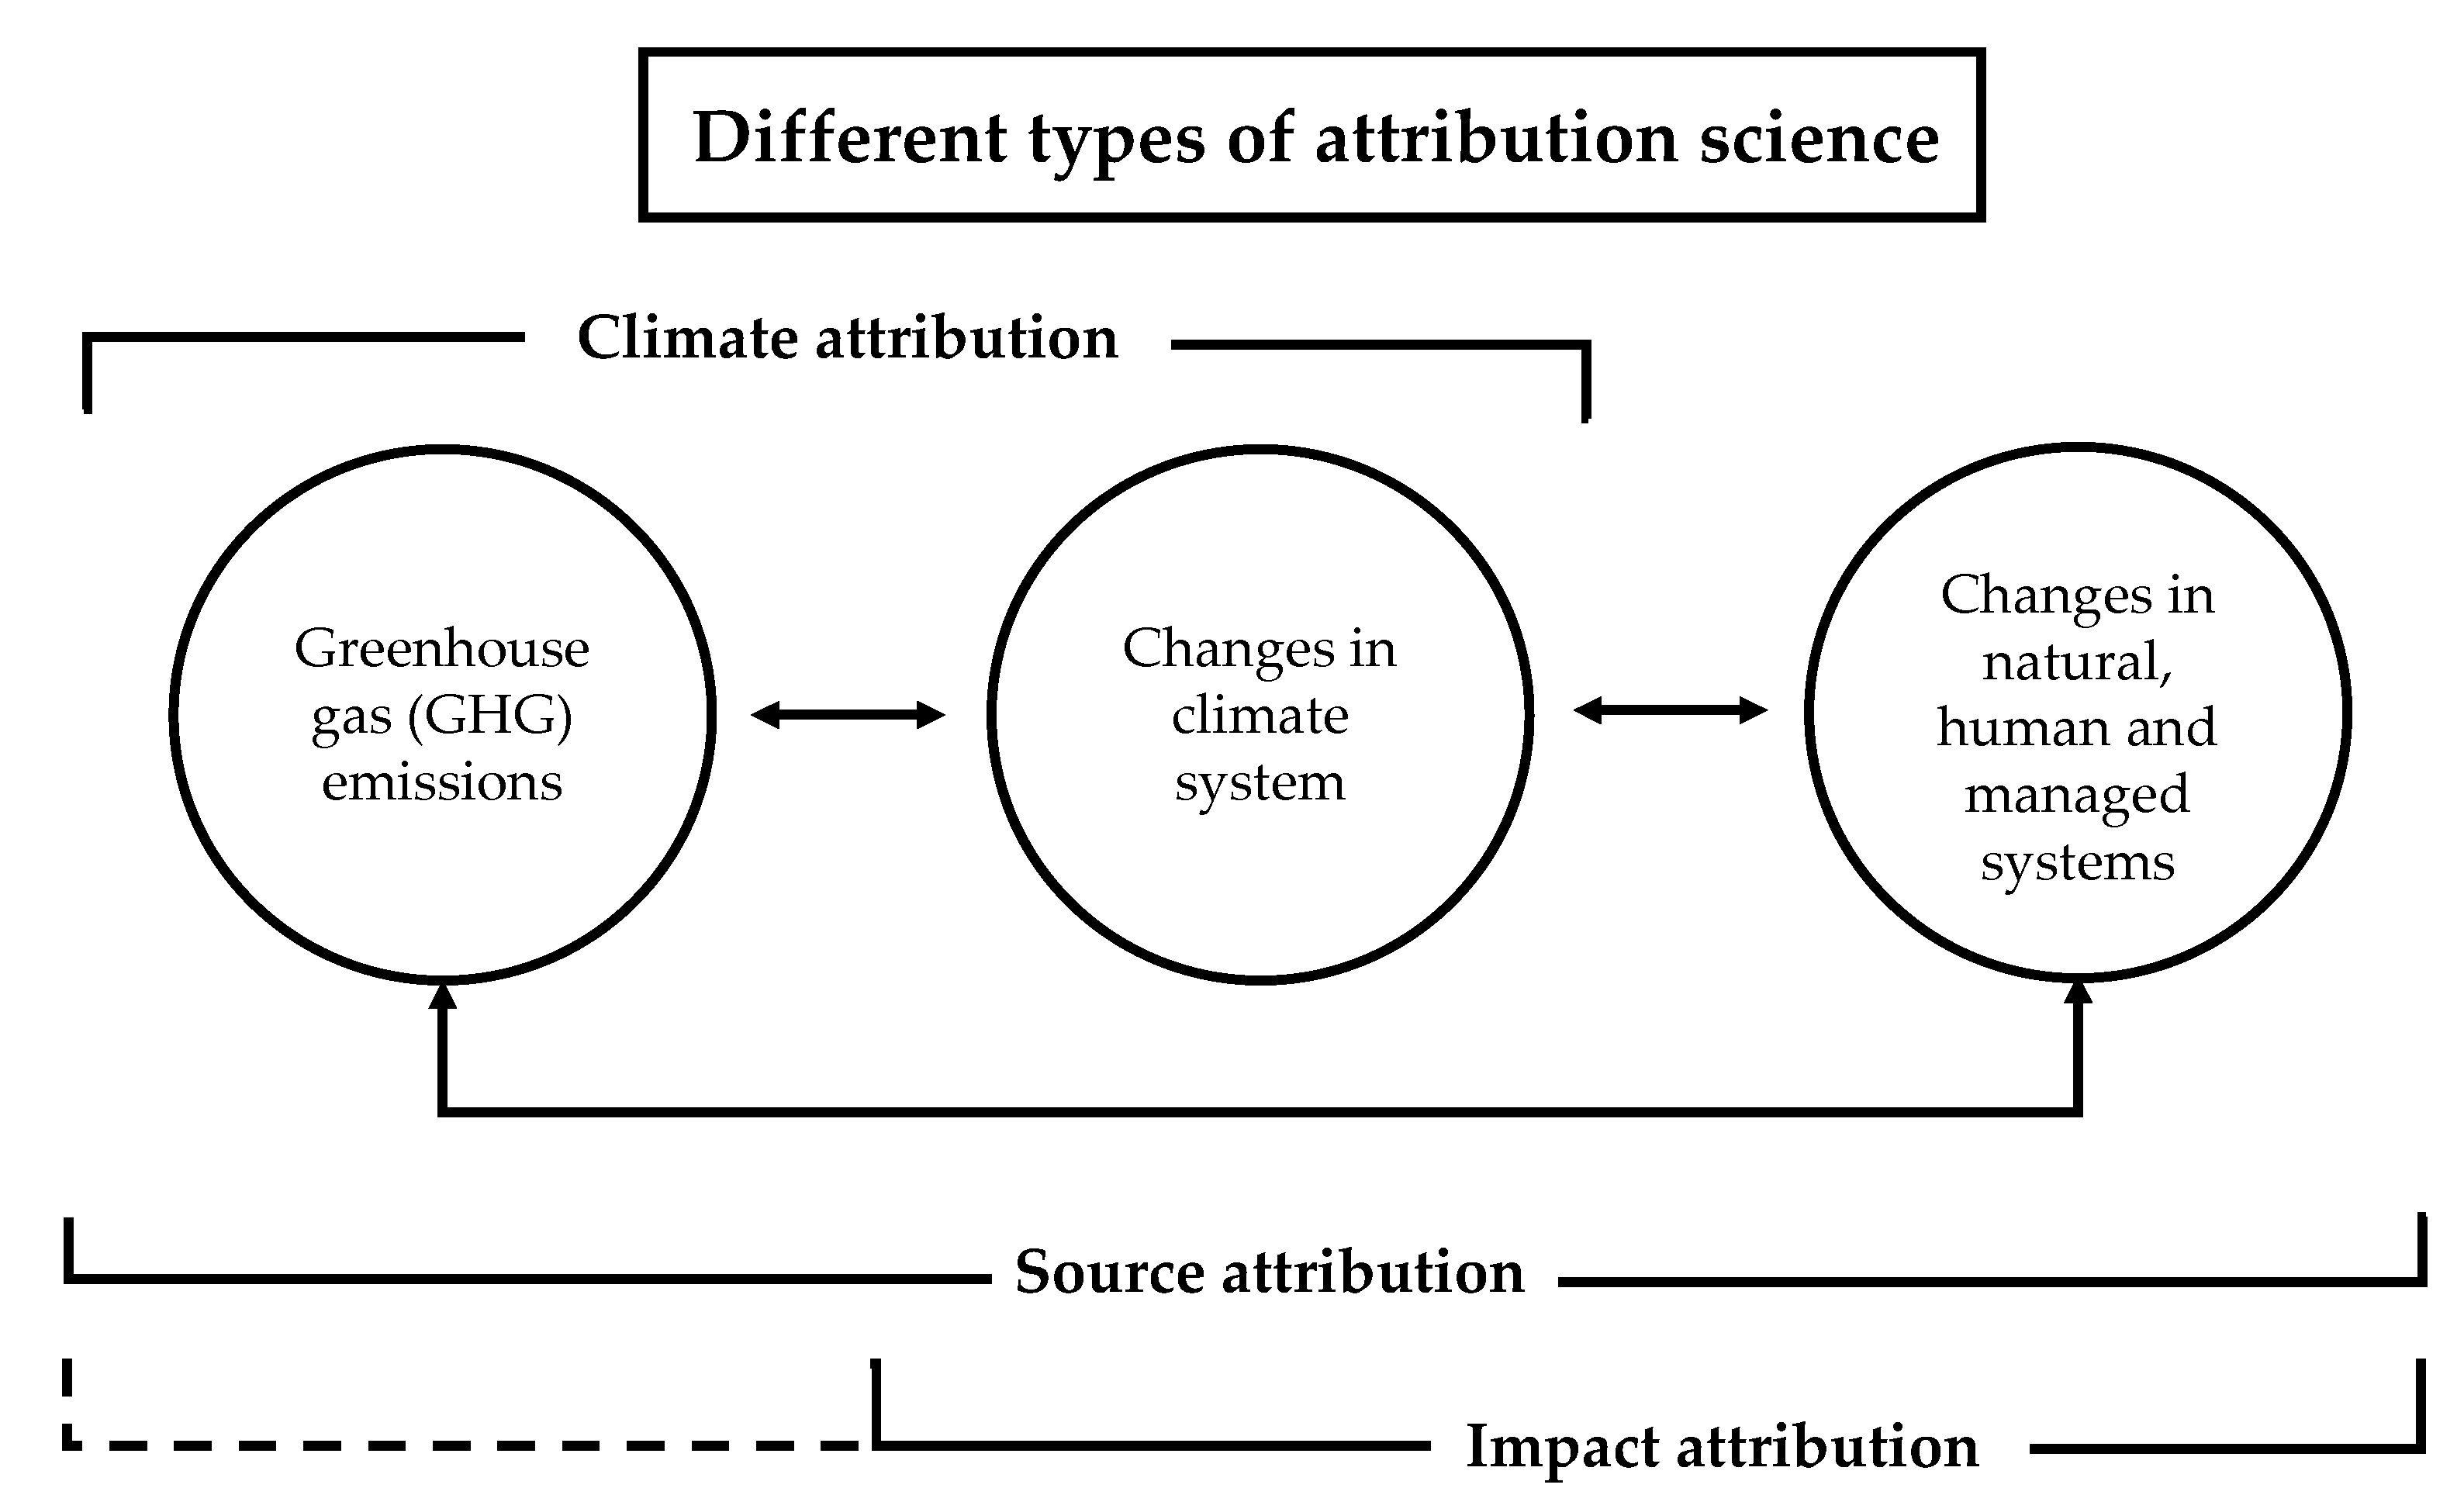
4.2.1. Significance of Results for Source Attribution Science

Traditional attribution science starts with climate impacts which are then linked to source attribution of GHG emissions (Burger et al. 2021). This approach raises the issue: Do you wait for climate impacts and then look for causal source attribution, or do you start identifying attributable sources to help mitigate future climate impacts? The most urgent need is to not only detect climate change impacts but to detect and attribute sources of climate change impacts. This study used a different approach that quantified past soil GHG emissions which are then available to support impact attribution.
The present study provides a methodology to determine source attribution of soil-based GHG emissions linked to land cover change, which can be used for current or future impact attribution. Given the large expected human impacts from future climate change events, it is critical to use these types of source attribution techniques to limit future GHG emissions, thereby helping to mitigate future projected climate change impacts.
This study demonstrates the application of attribution science which is a two-step process:
(1)
detection of change, which in this study is demonstrated by an increase in land development (LULC: developed open space, developed medium intensity, developed low intensity, and developed high intensity) and maximum potential for realized social costs of C due to complete loss of total soil carbon (TSC) of developed land by soil order and county in Delaware (USA) from 2001 to 2016 (Figure 4a).
(2)
attribution of change, which in this case is an attribution map of the development that can be linked to land ownership (Figure 4a).
The present study proposes an additional third step to this process that relates to the projection of change or damages related to human climate impact. This modification of attribution science methodology provides an opportunity for the evaluation of predicted future impacts (e.g., sea-level rise) before all of these impacts occur, thereby providing the opportunity to modify human behavior to limit future damages.
Many future impacts of climate change are being modeled and may cause catastrophic impacts, including sea-level rise (Figure 4b). Sea level rise will have a dramatic impact on many coastal communities in DE (Figure 4b), causing human and infrastructure damages with the forced relocation of both people and infrastructure. The cost of damages associated with sea-level rise will be dramatically higher than the estimated realized social costs of C (Figure 4a) because of the high density of human development in coastal areas (Figure 3).

4.2.2. Significance of Results in Policy and Legal Applications

Policymaking:
The results from this study can be used in addressing the causes of climate change by modeling soil-based GHG emissions to improve the effectiveness of adaptation and mitigation policies. In terms of policies related to mitigation, the results and methods of our study can be used for source attribution (Figure 4a) at the county level and could be expanded to the parcel level to identify the associated responsible parties and activities that could be targeted for reputation or regulation based policies.
This study will aid in the shaping, through law-and-economics analysis, of appropriate environmental statutes and regulations. Until now, the regulation of GHG has not focused on limiting land conversions. This is because of the inability to identify precisely which land disturbances are occurring and how much GHG the disturbances are releasing. One cannot craft appropriate legislation or regulations to control GHG emissions from land disturbances without first knowing the degree to which land disturbances are an important source of GHG. One cannot use economic cost-benefit analysis to determine whether regulation is worthwhile without knowing the extent of land disturbances, the amount of GHG that they release, and the social costs that they impose. This study fills this gap. It demonstrates precisely that land disturbances are indeed an important source of GHG that imposes large, measurable social costs, making regulation necessary and important. In addition, this study would make possible the enforcement of such statutes and regulations. A government cannot enforce statutory limits on GHG from land disturbance without a means to monitor in detail emissions from land disturbance. This study demonstrated an approach, which can be used for monitoring and litigation.
Litigation:
The results of this study can be used in the context of several legal issues. For example, source attribution maps and data (Figure 4, Table 13 and Table 14) can be used as documentary evidence to challenge the state of DE for failure to regulate soil-based GHG emissions from land conversions and in liability lawsuits for climate change damages (Klein 2015). In other cases, this documentary evidence can be made more detailed with specific information about the responsible emitters to obtain an injunction against future emissions from land conversions or monetary damages for adaptation costs in the state (Burger et al. 2021). These types of lawsuits are based on tort with its four elements:
(1)
Duty. The state of DE recognizes its duty in climate change mitigation and adaptation in Delaware’s (DE) Climate Action Plan (Delaware Department of Natural Resources and Environmental Control 2021). This study provides important information to fill some of the gaps identified in this action plan: soil-based GHG emissions from land conversion in DE.
(2)
Breach. Failure to account for soil-based GHG emissions from land conversions can lead to more soil-based GHG emissions from land conversions in DE. In addition, these land conversions lead to developments, which can be in the areas highly vulnerable to the sea rise, therefore putting human well-being and infrastructure at risk.
(3)
Causation. This study demonstrated a methodology to produce documentary evidence (spatial, temporal), which can be used in various types of causation (cause-in-fact, proximate). For cause-in-fact example, if land conversions to developments did not happen in the areas prone to sea rise, the damages would not have occurred.
(4)
Harm or Injury. This study demonstrated a methodology to produce documentary evidence, which can be used for harm and injury claims.
Utilization of source attribution science in the courtroom:
Standing and justiciability: This study demonstrates a methodology to produce documentary evidence (spatial, temporal, quantitative, analytical), which can be used to show the climate-change-related risk of harm as an injury for an individual or group of people (Figure 4) providing reasons for standing and justiciability. Figure 4a can be used to provide a so-called fractional standing, which is the probability and severity of harm to the number of people at risk (aggregate harm) (Burger et al. 2021).
Factual and proximate causation:
(a)
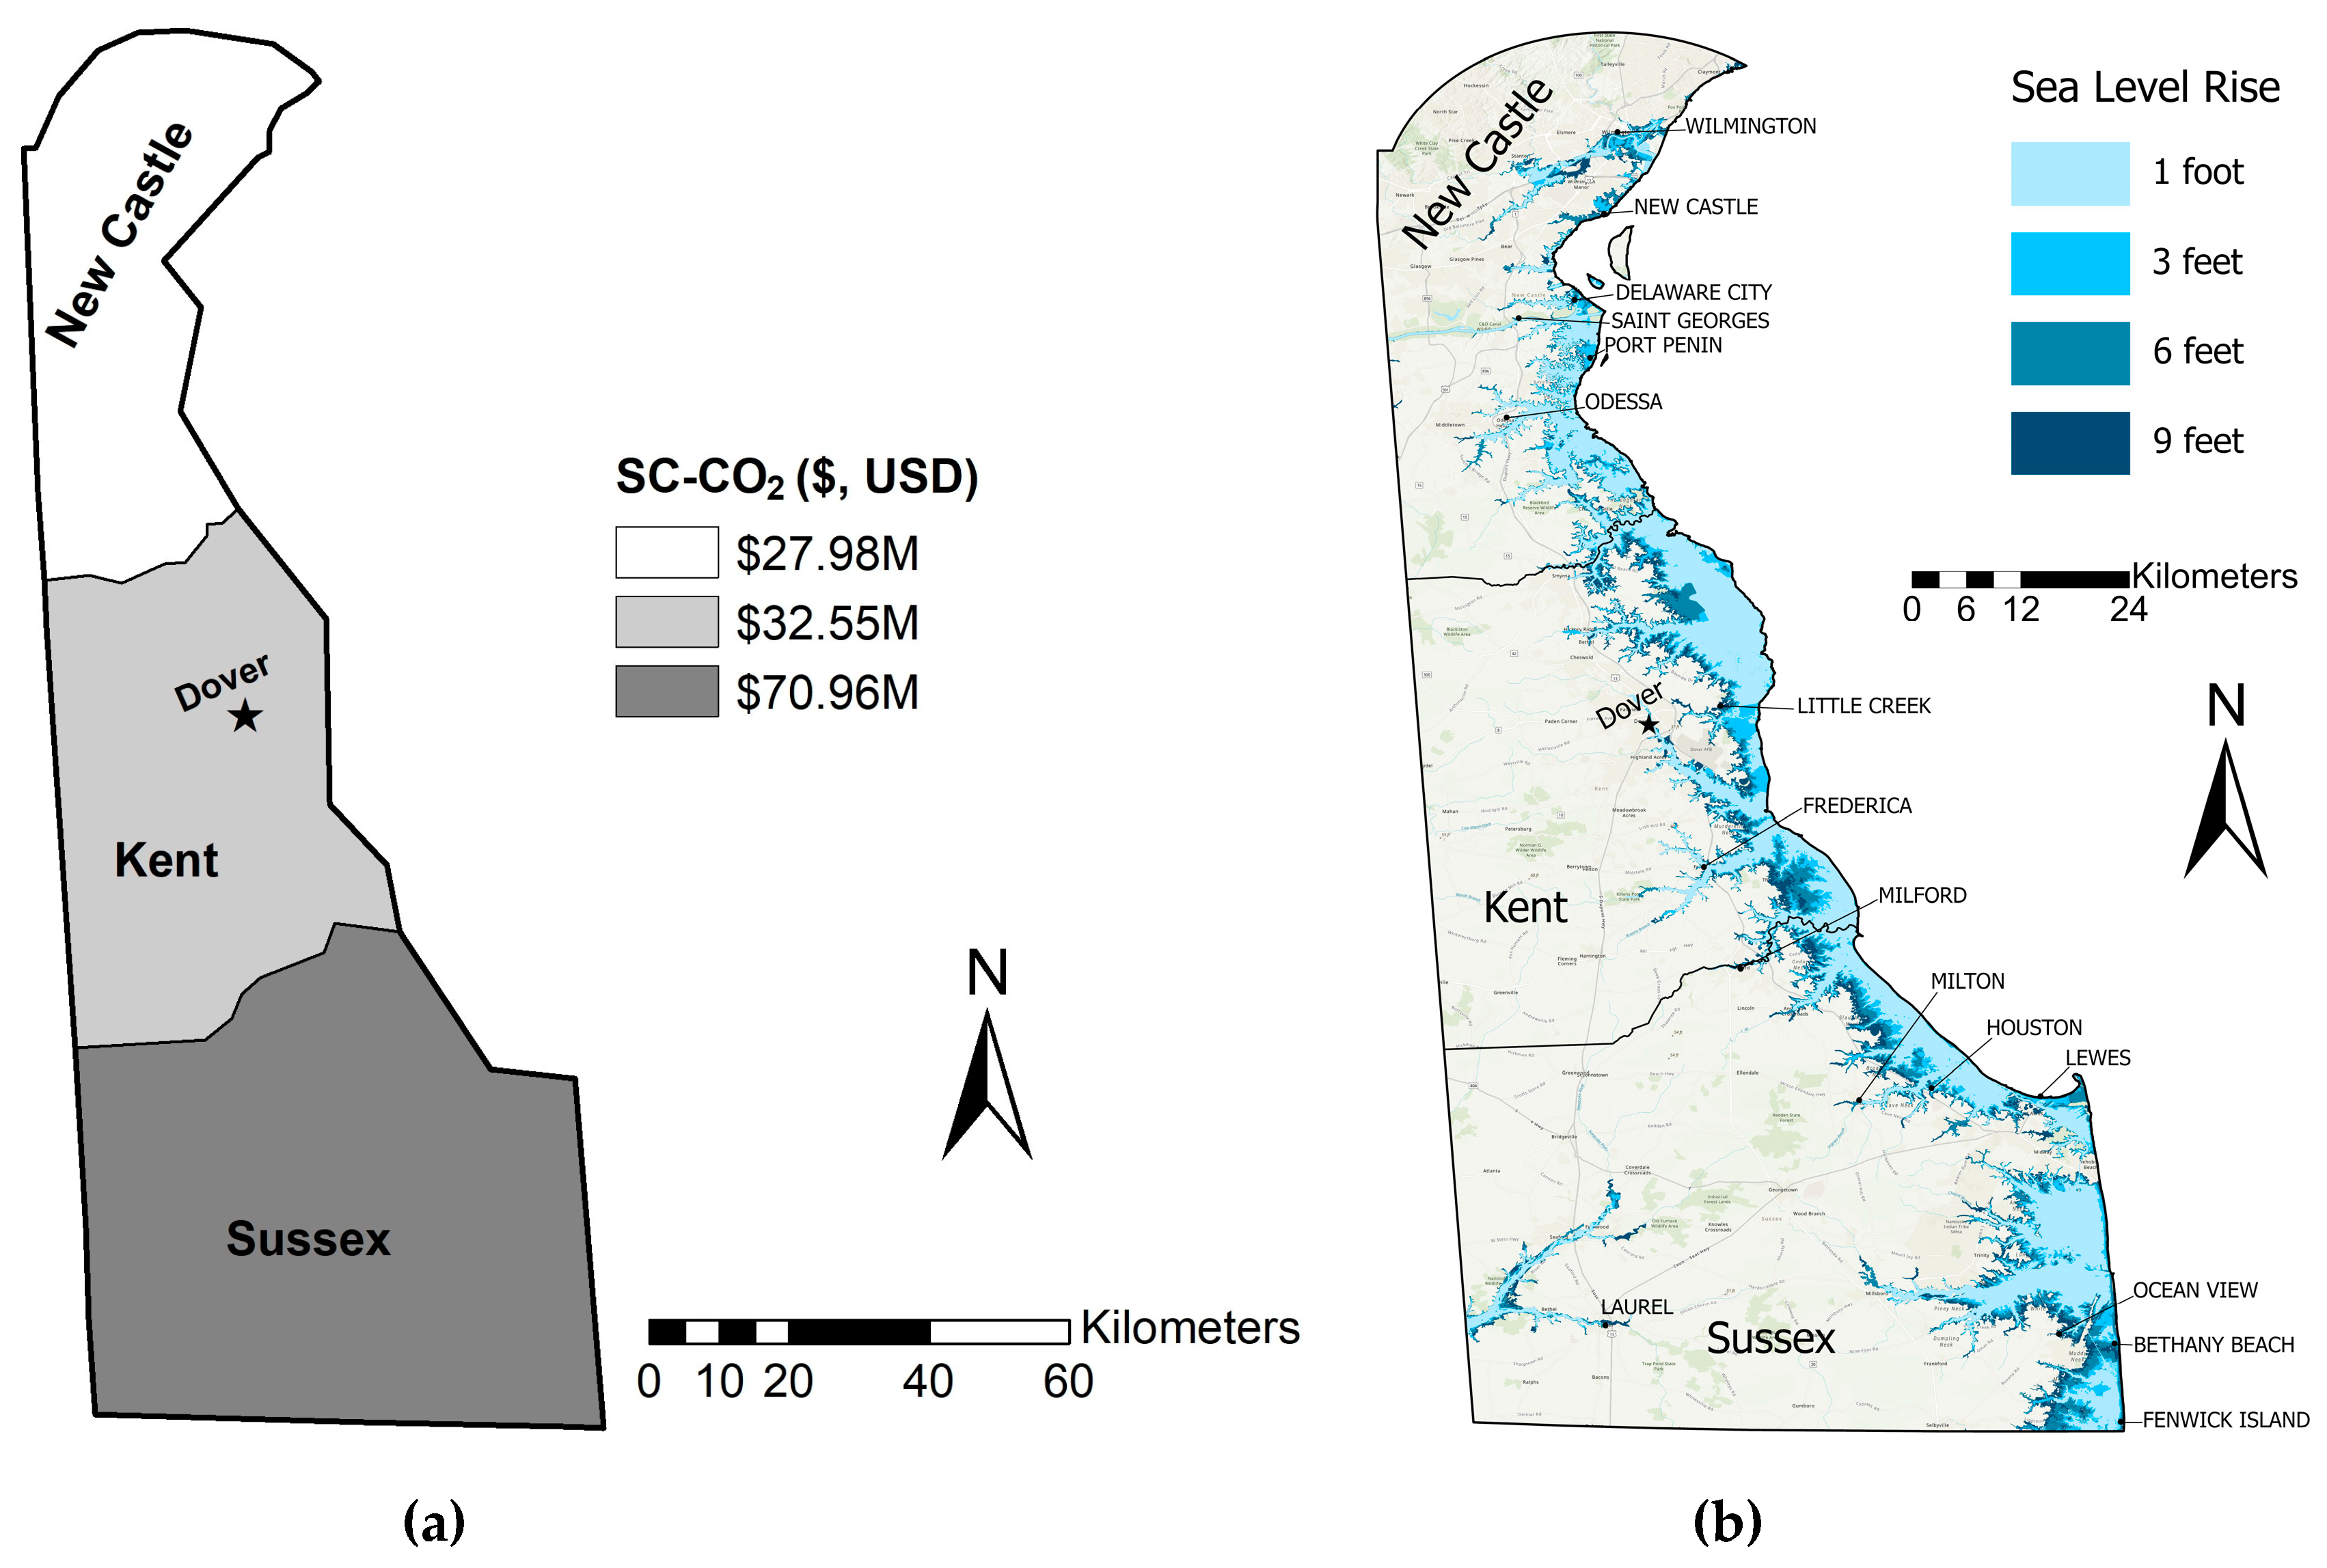
Defining parties’ contributions to GHGs emissions: This study demonstrates a science-based methodology to produce documentary evidence (spatial, temporal, quantitative, analytical), which can be used to show Delaware’s soil carbon storage, which can be a significant source of soil-based GHG emissions into the atmosphere as a result of land conversions. Figure 4a shows a detection and attribution map of the realized social cost of C because of land conversion in the state of DE by county in the period between 2001 and 2016. This detection and attribution map can be made even more detailed showing individual ownership of these realized social costs.
(b)
Establishing causal connections to impacts: This study demonstrates a science-based methodology to produce documentary evidence (spatial, temporal, quantitative, analytical), which can be used to connect Delaware’s soil-based GHG contributions from land conversions to climate change, which causes sea-rise on Delaware’s coast. Figure 4b shows the projected impact of future sea rise due to climate change in Delaware with numerous cities potentially being affected.
(c)
Proving and defending against obligations and redressability: This study demonstrates a science-based methodology to produce documentary evidence (spatial, temporal, quantitative, analytical), which can be used to show the need for establishing obligations for combatting climate change from various actors (e.g., individuals, companies, etc.). For example, Figure 4a shows the share of realized social costs of carbon from land conversions by county. It can be further refined to determine individual contributions within the county.
Numerous studies point out to limitations and “evolving” nature of legal framework with regard to climate change law and litigation (Burgers 2020). For example, Galperin and Kysar (2020) question the utility of tort (a private law system of justice) in environmental applications, because tort predates “the age of environmental statutes and the rise of law and economics”. Tort litigation has been unsuccessful in cases involving GHG and climate change not because tort law is innately inadequate in environmental applications. Instead, lawsuits involving GHG and climate change have been unable to succeed because the necessary evidence for proving a tort claim has been unavailable. For example, in order to win a tort case, a plaintiff must prove, among other things, causation and damages. In turn, these are made up of three parts, each of which is addressed by attribution science.
First, the plaintiff must show source attribution: that the defendant’s conduct released GHG. The second is event attribution: that the released GHG contributed to both climate change and a specific event—such as rising sea levels on Delaware’s coastline. Third, the plaintiff must show damages, also known as impact attribution: that the event imposed unavoidable harms on the plaintiff—such as that rising sea levels destroyed buildings or roads (Burger et al. 2020). The present study will provide plaintiffs the necessary evidence for proving the first of these, source attribution, in lawsuits involving harms from GHG released from land conversions: our approach now allows relatively precise identification of which actors have disturbed lands and the amount of GHG released. In addition, this study will provide some evidence on the second and third of three forms of attribution—event and damages/impact attribution. For example, if a government regulatory body were to sue to recover damages for an individual developer’s release of GHG through land disturbance at a specific project, the present study demonstrates how to obtain a measure of the social cost.

4.2.3. Significance of Results in International Context

Most climate change attribution research worldwide is focused on extreme weather event attribution science and litigation, therefore highlighting the lack of research on preventive measures tackling the “wicked” problem of climate change (Marjanac and Patton 2018). Present study is focused on source attribution, which provides information about the sources of GHG emissions. Soil-based emissions from land conversions are “international” in scope because of their GHG contributions to the world’s atmosphere and climate change (IPCC 2021). These emissions are not always accounted for in GHGs inventories worldwide because of their invisible nature. This study enhanced source attribution science with a new methodology to determine soil-based GHG emissions linked to land cover change, which could be used for past, current, or future impact attribution. This methodology was tested in the state of DE and its results were discussed in terms of the U.S. legal framework, which has limitations with regard to judging in the Anthropocene (Galperin and Kysar 2020).
The insights from this study can benefit international source attribution science, legislation, and policymaking. In terms of international source attribution science, the proposed methodology can be adapted to other countries based on soil and land cover change data availability. Although countries have different legal systems and policymaking, there are certain duties (“duties of care”) with regard to climate change, which are most likely common among them. The Office of the High Commissioner for Human Rights, the United Nations Environment Programme (UNEP), and the International Bar Association (IBA) recognize the effects of climate change on human rights and government responsibilities for climate change mitigation and resilience (OHCHR 2016). According to Marjanac and Patton (2018), a new focus of climate change litigation worldwide will likely involve failures by individuals and/or organizations responsible for GHG inventories and related climate change risks. Greenhouse gas emissions are increasingly being recognized as liabilities, which are challenging to address (USGCRP 2018). Many countries around the world are examining their legal frameworks for dealing with climate change litigation. For example, Kotzé (2021) described a “ground-breaking” climate change case in Germany as an inspiration for the proposal of a new paradigm “planetary climate litigation” to be adapted by courts. Burgers (2020) describes “constitutionalization” of the environment, where the constitution “constitutes” the state—to include the environment as a fundamental right. Our research will make it possible to measure progress under the pledges that countries have made for reductions of GHG emissions under the Paris Agreement (United Nations 2015) and other agreements.

5. Conclusions

Attribution science is increasingly being used in climate change litigation. Traditional attribution science starts with climate impacts which are then linked to source attribution of GHG emissions, but the most urgent need is to not only detect climate change impacts but to detect and attribute sources of climate change impacts. This study used a different approach that quantified past soil GHG emissions which are then available to support future impact attribution using the state of Delaware as a case study. The total estimated monetary mid-point value for TSC stocks in the state of Delaware was $6.8B (i.e., 6.8 billion U.S. dollars (USD), where B = billion = 109), $5.7B for SOC stocks, and $1.1B for SIC stocks. Soil orders with the highest midpoint value for SOC were Ultisols ($3.2B), Entisols ($928.7M), and Inceptisols ($837.7M). Soil orders with the highest midpoint value for SIC were Entisols ($564.1M), Inceptisols ($480.3M), and Alfisols ($90.0M) (where M = million = 106). Soil orders with the highest midpoint value for TSC were Ultisols ($3.2B), Entisols ($1.5B), and Inceptisols ($1.3B). The counties with the highest midpoint SOC values were Sussex ($3.3B), Kent ($1.7B), and New Castle ($759.2M). The counties with the highest midpoint SIC values were Sussex ($757.3M), Kent ($202.2M), and New Castle ($186.5M). The counties with the highest midpoint TSC values were Sussex ($4.0B), Kent ($1.9B), and New Castle ($945.8M). Delaware has experienced land use/land cover (LULC) changes between 2001 and 2016 with the most maximum “realized” SC-CO2 of $131.49M with soil order of Ultisols ($84.32M) contributing the most to the total value. Among three counties, Sussex has exhibited the most development with $70.96M in realized social costs.
This study provided a methodology to determine source attribution of soil-based GHG emissions linked to land cover change, which could be used for current or future impact attribution. This study demonstrated the traditional application of attribution science as a two-step process using the state of DE as a case study. The first step was detection of change, which in this study was demonstrated by an increase in land de-velopment (LULC: developed open space, developed medium intensity, developed low intensity, and developed high intensity) and maximum potential for realized social costs of C due to complete loss of total soil carbon (TSC) of developed land by soil order and county in Delaware (USA) from 2001 to 2016. The second step was an attribution of change, which was in this case an attribution map of the development that could be linked to land ownership in DE. This study proposed an additional third step to this process that related to the projection of change or damages related to human climate impact. This modification of attribution science methodology provides an opportunity for the evaluation of predicted future impacts (e.g., sea-level rise) before all of these impacts occur, thereby providing the opportunity to modify human behavior to limit future damages.

Author Contributions

Conceptualization, E.A.M.; methodology, E.A.M., M.A.S. and H.A.Z.; formal analysis, E.A.M.; writing—original draft preparation, E.A.M.; writing—review and editing, E.A.M., C.J.P., M.A.S., G.C.P. and G.B.S.; visualization, H.A.Z., L.L. and Z.H. All authors have read and agreed to the published version of the manuscript.

Funding

This research received no external funding.

Institutional Review Board Statement

Not applicable.

Informed Consent Statement

Not applicable.

Data Availability Statement

Not applicable.

Acknowledgments

We would like to thank the reviewers for their constructive comments and suggestions.

Conflicts of Interest

The authors declare no conflict of interest.

Glossary

EDEcosystem disservices
ESEcosystem services
EPAEnvironmental Protection Agency
SC-CO2Social cost of carbon emissions
SDGsSustainable Development Goals
SOCSoil organic carbon
SICSoil inorganic carbon
SSURGOSoil Survey Geographic Database
TSCTotal soil carbon
USDAUnited States Department of Agriculture
U.S.A.United States of America

References

  1. Baldrich, Roxanna. 2021. The Role of Climate Science in Litigation against Carbon Majors. ISIpedia. Available online: https://www.isipedia.org/story/the-role-of-climate-science-in-litigation-against-carbon-majors/ (accessed on 8 February 2022).
  2. Burger, Michael, Jessica Wentz, and Radley Horton. 2020. The law and science of climate change attribution. Columbia Journal of Environmental Law 45: 57–240. [Google Scholar]
  3. Burger, Michael, Jessica Wentz, and Radley Horton. 2021. The law and science of climate change attribution. Environmental Law Reporter 51: 10646. [Google Scholar]
  4. Burgers, Laura. 2020. Should judges make climate change law? Symposium article. Transnational Environmental Law 9: 55–75. [Google Scholar] [CrossRef] [Green Version]
  5. Delaware Department of Natural Resources and Environmental Control. 2011. Economic Valuation of Wetland Ecosystem Services in Delaware; Cambridge: Industrial Economics, Incorporated. Available online: http://www.dnrec.delaware.gov/Admin/DelawareWetlands/Documents/Economic%20Evaluation%20of%20Wetland%20Ecosystem%20Services%20in%20Delaware.pdf (accessed on 8 February 2022).
  6. Delaware Department of Natural Resources and Environmental Control. 2021. Delaware’s Climate Action Plan. Available online: https://documents.dnrec.delaware.gov/energy/Documents/Climate/Plan/Delaware-Climate-Action-Plan-2021.pdf (accessed on 7 February 2022).
  7. Division of Air Quality. 2020. Delaware’s 2017 Greenhouse Gas Emissions Inventory. Available online: https://documents.dnrec.delaware.gov/Air/Documents/2017-DE-GHG-Inventory.pdf (accessed on 7 February 2022).
  8. EPA (United States Environmental Protection Agency). 2016a. The Social Cost of Carbon. EPA Fact Sheet. Available online: https://19january2017snapshot.epa.gov/climatechange/social-cost-carbon_.html (accessed on 15 September 2021).
  9. EPA (United States Environmental Protection Agency). 2016b. What Climate Change Means for Delaware. Available online: https://19january2017snapshot.epa.gov/sites/production/files/2016-09/documents/climate-change-de.pdf (accessed on 26 January 2022).
  10. ESRI (Environmental Systems Research Institute). n.d. ArcGIS Pro 2.6. Available online: https://pro.arcgis.com/en/pro-app/2.6/get-started/whats-new-in-arcgis-pro.htm (accessed on 1 September 2021).
  11. Galperin, Joshua U., and Douglas A. Kysar. 2020. Uncommon Law: Judging in the Anthropocene. Climate Change Litigation in the Asia Pacific. University of Pittsburgh Legal Studies Research Paper (2020–33). Cambridge: Cambridge University Press. [Google Scholar]
  12. Groshans, Garth R., Elena A. Mikhailova, Christopher J. Post, Mark A. Schlautman, and Lisha Zhang. 2019. Determining the value of soil inorganic carbon stocks in the contiguous United States based on the avoided social cost of carbon emissions. Resources 8: 119. [Google Scholar] [CrossRef] [Green Version]
  13. Guo, Yinyan, Ronald Amundson, Peng Gong, and Qian Yu. 2006. Quantity and spatial variability of soil carbon in the conterminous United States. Soil Science Society of America Journal 70: 590–600. [Google Scholar] [CrossRef] [Green Version]
  14. IPCC. 2021. Summary for Policymakers. In Climate Change 2021: The Physical Science Basis. Contribution of Working Group I to the Sixth Assessment Report of the Intergovernmental Panel on Climate Change. Edited by V. Masson-Delmotte, P. Zhai, A. Pirani, S. L. Connors, C. Péan, S. Berger, N. Caud, Y. Chen, L. Goldfarb, M. I. Gomis and et al. Nairobi: UN Environment Programme. [Google Scholar]
  15. Keestra, Saskia D., Johan Bouma, Jakob Wallinga, Pablo Tittonell, Pete Smith, Artemi Cerdà, Luka Montanarella, John N. Quinton, Yakov Pachepsky, Wim H. van der Putten, and et al. 2016. The significance of soils and soil science towards realization of the United Nations Sustainable Development Goals. Soil 2: 111–28. [Google Scholar] [CrossRef] [Green Version]
  16. Klein, Jennifer. 2015. Potential Liability of Governments for Failure to Prepare for Climate Change. Paper from Sabin Center for Climate Change Law. New York: Columbia Law School. [Google Scholar]
  17. Kotzé, Louis J. 2021. Neubauer et al. versus Germany: Planetary climate litigation for the Anthropocene? German Law Journal 22: 1423–44. [Google Scholar] [CrossRef]
  18. Marjanac, Sophie, and Lindene Patton. 2018. Extreme weather event attribution science and climate change litigation: An essential step in the causal chain? Journal of Energy and Natural Resources Law 36: 265–98. [Google Scholar] [CrossRef]
  19. Mikhailova, Elena A., Garth R. Groshans, Christopher J. Post, Mark A. Schlautman, and Gregory C. Post. 2019a. Valuation of soil organic carbon stocks in the contiguous United States based on the avoided social cost of carbon emissions. Resources 8: 153. [Google Scholar] [CrossRef] [Green Version]
  20. Mikhailova, Elena A., Garth R. Groshans, Christopher J. Post, Mark A. Schlautman, and Gregory C. Post. 2019b. Valuation of total soil carbon stocks in the contiguous United States based on the avoided social cost of carbon emissions. Resources 8: 157. [Google Scholar] [CrossRef] [Green Version]
  21. Mikhailova, Elena A., Hamdi A. Zurqani, Christopher J. Post, Mark A. Schlautman, and Christopher J. Post. 2021a. Soil diversity (pedodiversity) and ecosystem services. Land 10: 288. [Google Scholar] [CrossRef]
  22. Mikhailova, Elena A., Lili Lin, Zhenbang Hao, Hamdi A. Zurqani, Christopher J. Post, Mark A. Schlautman, and Gregory C. Post. 2021b. Land cover change and soil carbon regulating ecosystem services in the state of South Carolina, USA. Earth 2: 674–95. [Google Scholar] [CrossRef]
  23. Multi-Resolution Land Characteristics Consortium (MRLC). n.d. Available online: https://www.mrlc.gov/ (accessed on 1 September 2021).
  24. Natural Resources Conservation Service. n.d. USDA. Greenwich—Delaware State Soil. Available online: https://www.nrcs.usda.gov/Internet/FSE_DOCUMENTS/stelprdb1236952.pdf (accessed on 26 January 2022).
  25. Office of the High Commission for Human Rights (OHCHR). 2016. Discussion Paper: Understanding Human Rights and Climate Change, Submission of the OHCHR to the 21st Conference of the Parties to the United Nations Framework Convention on Climate Change (2015); United Nations Environment Programme, ‘Climate Change and Human Rights’ (2015); International Bar Association Task Force n 55., John H. Knox, ‘Human Rights Principles and Climate Change’ in Cinnamon P. Carlarne, Kevin R. Gray and Richard G. Tarasofsky (eds). In The Oxford Handbook of International Climate Change Law. Oxford: Oxford University Press. [Google Scholar]
  26. Soil Survey Staff. n.d.a Natural Resources Conservation Service, United States Department of Agriculture. Soil Survey Geographic 548 (SSURGO) Database. Available online: https://nrcs.app.box.com/v/soils (accessed on 10 September 2021).
  27. Soil Survey Staff. n.d.b. Natural Resources Conservation Service, United States Department of Agriculture. Photos of Soil Orders. Available online: https://www.nrcs.usda.gov/wps/portal/nrcs/detail/soils/edu/?cid=nrcs142p2_053588 (accessed on 20 September 2021).
  28. The United States Census Bureau. 2018. TIGER/Line Boundary Shapefiles. Available online: https://www.census.gov/geographies/mapping-files/time-series/geo/tiger-line-file.2018.html (accessed on 10 September 2021).
  29. Toll, Richard S. J. 2009. The economic effects of climate change. Journal of Economic Perspectives 23: 29–51. [Google Scholar] [CrossRef] [Green Version]
  30. U.S. Bureau of the Census. 1991. Statistical Abstract of the United States: 1991. p. 201. Available online: https://www.census.gov/library/publications/1991/compendia/statab/111ed.html (accessed on 10 December 2021).
  31. United Nations. 2015. Paris Agreement. Available online: https://unfccc.int/sites/default/files/english_paris_agreement.pdf (accessed on 1 September 2021).
  32. USGCRP. 2018. Impacts, Risks, and Adaptation in the United States: Fourth National Climate Assessment, Volume II: Report-in-Brief; Washington: U.S. Global Change Research Program, 186p. [CrossRef]
  33. Zhao, Panmao, Baiquan Zhou, and Yang Chen. 2018. A review of climate change attribution studies. Journal of Meteorological Research 32: 671–92. [Google Scholar] [CrossRef]
Figure 1. Different types of attribution science (adapted from Baldrich 2021).
Laws 11 00041 g001
Figure 2. General soil map of Delaware (U.S.A.) (Latitude: 38°27′ N to 39°50′ N; Longitude: 75°3′ W to 75°47′ W) derived from the SSURGO database (Soil Survey Staff n.d.a) overlaid with county boundaries (The United States Census Bureau 2018).
Laws 11 00041 g002
Figure 3. Land cover map of Delaware (U.S.A.): 2016 (Latitude: 38°27′ N to 39°50′ N; Longitude: 75°3′ W to 75°47′ W) (based on data from MRLC n.d.).
Laws 11 00041 g003
Figure 4. Demonstration of the two-step process of climate change detection and attribution, as well as projected impacts: (a) Detection and attribution map of realized social cost of C because of land conversion. The total dollar value of mid-point total soil carbon (TSC) storage value for newly “developed” land covers (open space, low, medium, and high intensity) from 2001 to 2016 in Delaware (U.S.A.) based on a social cost of C (SC-CO2) of $46 per metric ton of CO2 applicable for the year 2025 based on 2007 U.S. dollars with an average discount rate of 3% (EPA 2016a), (b) Projected impact of future sea rise due to climate change in Delaware, USA.
Laws 11 00041 g004
Table 1. Soil diversity (pedodiversity) is expressed as taxonomic diversity at the level of soil order and ecosystem service types in Delaware (U.S.A.) (adapted from Mikhailova et al. 2021a).
StocksEcosystem Services
Soil OrderGeneral Characteristics and Constraints ProvisioningRegulation/MaintenanceCultural
Slightly Weathered
EntisolsEmbryonic soils with ochric epipedonxxx
InceptisolsYoung soils with ochric or umbric epipedonxxx
HistosolsOrganic soils with ≥20% of organic carbonxxx
Moderately Weathered
AlfisolsClay-enriched B horizon with B.S. ≥ 35%xxx
Strongly Weathered
UltisolsHighly leached soils with B.S. < 35%xxx
Note: B.S. = base saturation.
Table 2. A conceptual overview of the accounting framework used in this study (adapted from Groshans et al. (2019)) which can also be used for identifying source attribution in climate change science.
OWNERSHIP (e.g., government, private, foreign, shared, single, etc.)
Time (e.g., information disclosure, etc.) Stocks/Source AttributionFlowsValue
Biophysical Accounts
(Science-Based)
Administrative Accounts
(Boundary-Based)
Monetary Account(s)Benefit(s)Total Value
Soil extent:Administrative extent:Ecosystem good(s) and
service(s):
Sector:Types of value:
Composite (total) stock: Total soil carbon (TSC) = Soil organic carbon (SOC) + Soil inorganic carbon (SIC)
Past
(e.g., post-development disclosures)
 
Current (e.g., status)
 
Future
(e.g., pre-development disclosures)
Environment:The social cost of carbon (SC-CO2) emissions can be interpreted as “avoided“ through climate action or “realized“ through climate inaction
- Soil orders (Entisols, Inceptisols, Histosols, Alfisols, Ultisols)- State (Delaware)
- County
(3 counties)
- Regulating (e.g., carbon sequestration)- Carbon
sequestration
- $46 per metric ton of CO2 applicable for the year 2025 (2007 U.S. dollars with an average discount rate of 3% (EPA 2016a))
Table 3. Soil diversity (pedodiversity) by soil order (taxonomic pedodiversity) and county in Delaware (U.S.A.) based on Soil Survey Geographic (SSURGO) Database (Soil Survey Staff n.d.a).
Total
Area
(km2) (%)
Degree of Weathering and Soil Development
CountySlight ModerateStrong
EntisolsInceptisolsHistosolsAlfisolsUltisols
2016 Area (km2), (% of Total County Area)
Kent1330.5 (33)99.4 (7)80.9 (6)4.3 (0)68.6 (5)1077.3 (81)
New Castle601.8 (15)131.0 (22)44.8 (7)0 56.4 (9)369.6 (61)
Sussex2095.7 (52)457.6 (22)432.8 (21)24.0 (1)01181.4 (56)
Totals4028.1 (100)687.9 (17)558.5 (14)28.3 (1)125.0 (3)2628.3 (65)
Table 4. Area-normalized content (kg m−2) and monetary values ($ m−2) of soil organic carbon (SOC), soil inorganic carbon (SIC), and total soil carbon (TSC = SOC + SIC) by soil order based on data reported by Guo et al. (2006) for the upper 2 m of soil and an avoided social cost of carbon (SC-CO2) of $46 per metric ton of CO2, applicable for 2025 based on 2007 U.S. dollars with an average discount rate of 3% (EPA 2016a).
Soil OrderSOC ContentSIC ContentTSC ContentSOC ValueSIC ValueTSC Value
Minimum—Midpoint—Maximum ValuesMidpoint Values
(kg m−2)(kg m−2)(kg m−2)($ m−2)($ m−2)($ m−2)
Slightly Weathered
Entisols1.8–8.0–15.81.9–4.8–8.43.7–12.8–24.21.350.822.17
Inceptisols2.8–8.9–17.42.5–5.1–8.45.3–14.0–25.81.500.862.36
Histosols63.9–140.1–243.90.6–2.4–5.064.5–142.5–248.923.620.4124.03
Moderately Weathered
Alfisols2.3–7.5–14.11.3–4.3–8.13.6–11.8–22.21.270.721.99
Strongly Weathered
Ultisols1.9–7.1–13.90.0–0.0–0.01.9–7.1–13.91.200.001.20
Table 5. Midpoint soil organic carbon (SOC) storage by soil order and county for the state of Delaware (USA), based on the areas shown in Table 3 and the midpoint SOC contents are shown in Table 4.
Total SOC
Storage
(kg) (%)
Degree of Weathering and Soil Development
CountySlightModerateStrong
EntisolsInceptisolsHistosolsAlfisolsUltisols
Total SOC Storage (kg), (% of Total by County)
Kent1.0 × 1010 (30)8.0 × 10⁸ (8)7.2 × 10⁸ (7)6.1 × 10⁸ (6)5.1 × 10⁸ (5)7.6 × 10⁹ (74)
New Castle4.5 × 109 (13)1.0 × 10⁹ (23)4.0 × 10⁸ (9)04.2 × 10⁸ (9)2.6 × 10⁹ (58)
Sussex1.9 × 1010 (57)3.7 × 10⁹ (19)3.9 × 10⁹ (20)3.4 × 10⁹ (17)08.4 × 10⁹ (44)
Totals3.4 × 1010 (100)5.5 × 10⁹ (16)5.0 × 10⁹(15)4.0 × 10⁹ (12)9.4 × 10⁸ (3)1.9 × 10¹⁰ (55)
Table 6. Monetary value of soil organic carbon (SOC) by soil order and county for the state of Delaware (USA), based on the areas shown in Table 3 and the area-normalized midpoint monetary values shown in Table 4.
Total
SC-CO2
($)
Degree of Weathering and Soil Development
CountySlight ModerateStrong
EntisolsInceptisolsHistosolsAlfisolsUltisols
SC-CO2 ($ = USD)
Kent1.7 × 1091.3 × 1081.2 × 1081.0 × 1088.7 × 1071.3 × 109
New Castle7.6 × 1081.8 × 1086.7 × 10707.2 × 1074.4 × 108
Sussex3.3 × 1096.2 × 1086.5 × 1085.7 × 10801.4 × 109
Totals5.7 × 1099.3 × 1088.4 × 1086.7 × 1081.6 × 1083.2 × 109
Table 7. Midpoint soil inorganic carbon (SIC) storage by soil order and county for the state of Delaware (USA), based on the areas shown in Table 3 and the midpoint SIC contents shown in Table 4.
Total SIC
Storage
(kg) (%)
Degree of Weathering and Soil Development
CountySlight ModerateStrong
EntisolsInceptisolsHistosolsAlfisolsUltisols
Total SIC Storage (kg), (% of Total by County)
Kent1.2 × 109 (18)4.8 × 10⁸ (40)4.1 × 10⁸ (35)1.0 × 10⁷ (1)3.0 × 10⁸ (25)0
New Castle1.1 × 109 (16)6.3 × 10⁸ (57)2.3 × 10⁸ (21)02.4 × 10⁸ (22)0
Sussex4.5 × 109 (66)2.2 × 10⁹ (49)2.2 × 10⁹ (49)5.7 × 10⁷ (1)00
Totals6.8 × 109 (100)3.3 × 10⁹ (49)2.8 × 10⁹ (42)6.8 × 10⁷ (1)5.4 × 10⁸ (8)0
Table 8. Monetary value of soil inorganic carbon (SIC) by soil order and county for the state of Delaware (USA), based on the areas shown in Table 3 and the area-normalized midpoint monetary values shown in Table 4.
Total
SC-CO2
($)
Degree of Weathering and Soil Development
CountySlight ModerateStrong
EntisolsInceptisolsHistosolsAlfisolsUltisols
SC-CO2 ($ = USD)
Kent2.0 × 1088.1 × 1077.0 × 1071.8 × 1064.9 × 1070
New Castle1.9 × 1081.1 × 1083.9 × 10704.1 × 1070
Sussex7.6 × 1083.8 × 1083.7 × 1089.8 × 10600
Totals1.1 × 1095.6 × 1084.8 × 1081.2 × 1079.0 × 1070
Table 9. Midpoint total soil carbon (TSC) storage by soil order and county for the state of Delaware (USA), based on the areas shown in Table 3 and the midpoint SIC contents shown in Table 4.
Total TSC
Storage
(kg) (%)
Degree of Weathering and Soil Development
CountySlight ModerateStrong
EntisolsInceptisolsHistosolsAlfisolsUltisols
Total TSC Storage (kg), (% of Total by County)
Kent1.1 × 1010 (28)1.3 × 10⁹ (11)1.1 × 10⁹ (10)6.2 × 10⁸ (5)8.1 × 10⁸ (7)7.6 × 10⁹ (67)
New Castle5.6 × 109 (14)1.7 × 10⁹ (30)6.3 × 10⁸ (11)06.7 × 10⁸ (12)2.6 × 10⁹ (47)
Sussex2.4 × 1010 (58)5.9 × 10⁹ (25)6.1 × 10⁹ (26)3.4 × 10⁹ (14)08.4 × 10⁹ (35)
Totals4.1 × 1010 (100)8.8 × 10⁹ (22)7.8 × 10⁹ (19)4.0 × 10⁹ (10)1.5 × 10⁹ (4)1.9 × 10¹⁰ (46)
Table 10. Monetary value of total soil carbon (TSC) by soil order and county for the state of Delaware (USA), based on the areas shown in Table 3 and the area-normalized midpoint monetary values shown in Table 4.
Total
SC-CO2
($)
Degree of Weathering and Soil Development
CountySlight ModerateStrong
EntisolsInceptisolsHistosolsAlfisolsUltisols
SC-CO2 ($ = USD)
Kent1.9 × 1092.2 × 1081.9 × 1081.0 × 1081.4 × 1081.3 × 109
New Castle9.5 × 1082.8 × 1081.1 × 10801.1 × 1084.4 × 108
Sussex4.0 × 1099.9 × 1081.0 × 1095.8 × 10801.4 × 109
Totals6.8 × 1091.5 × 1091.3 × 1096.8 × 1082.5 × 1083.2 × 109
Table 11. Land use/land cover (LULC) change by soil order in Delaware (USA) from 2001 to 2016.
NLCD Land Cover Classes
(LULC)
2016 Total
Area by LULC
(km2)
Change in Area,
2001–2006, %)
Degree of Weathering and Soil Development
SlightModerateStrong
EntisolsInceptisolsHistosolsAlfisolsUltisols
2016 Area by Soil Order, km2 (Change in Area, 2001–2016, %)
Barren land12.48 (−13.49%)10.97 (−4.82%)0.43 (−70.88%)0.02 (0.00%)0.14 (−4.85%)0.92 (−26.41%)
Woody wetlands865.30 (1.42%)116.79 (3.22%)272.48 (0.25%)17.36 (3.91%)6.16 (94.10%)452.51 (0.93%)
Shrub/Scrub23.42 (−46.13%)6.51 (−43.87%)2.23 (−46.61%)0.01 (0.00%)0.12 (46.67%)14.55 (−47.30%)
Mixed forest205.14 (1.63%)49.48 (1.59%)18.93 (3.94%)0.20 (−1.74%)2.22 (−1.98%)134.30 (1.39%)
Deciduous forest210.91 (−0.49%)26.08 (0.74%)19.35 (2.84%)0.06 (6.67%)8.51 (−4.71%)156.91 (−0.85%)
Herbaceous6.05 (−65.04%)3.11 (−44.59%)0.26 (−89.51%)0.03 (12.00%)0.11 (−5.47%)2.55 (−71.89%)
Evergreen forest128.87 (19.87%)35.50 (15.12%)19.20 (15.55%)0.15 (−4.02%)0.16 (−1.67%)73.86 (23.64%)
Emergent herbaceous wetlands230.90 (−8.56%)97.97 (−6.53%)7.96 (−17.99%)8.59 (−8.54%)66.47 (−4.79%)49.91 (−15.08%)
Hay/Pasture38.60 (−7.57%)4.17 (−8.21%)1.52 (−7.89%)0.00 (0.00%)1.32 (−11.18%)31.59 (−7.31%)
Cultivated crops1663.09 (−4.29%)182.65 (−3.85%)172.84 (−3.19%)0.56 (−1.75%)0.27 (−5.57%)1306.77 (−4.49%)
Developed, open space334.77 (9.26%)64.64 (3.05%)24.48 (10.19%)0.69 (0.65%)18.67 (0.52%)226.29 (11.92%)
Developed, medium intensity84.12 (49.56%)27.32 (21.78%)5.71 (100.53%)0.14 (49.04%)3.54 (11.72%)47.40 (71.15%)
Developed, low intensity198.50 (15.30%)51.85 (5.65%)12.10 (25.12%)0.47 (2.37%)16.78 (1.27%)117.31 (21.69%)
Developed, high intensity25.93 (42.39%)10.91 (17.15%)1.02 (98.47%)0.02 (109.09%)0.56 (10.99%)13.42 (70.53%)
Table 12. Distribution of soil carbon regulating ecosystem services in the state of Delaware (USA) by soil order (photos courtesy of USDA/NRCS (Soil Survey Staff n.d.b). Values are taken/derived from Table 3, Table 6, Table 8, and Table 10.
Soil Regulating Ecosystem Services in the State of Delaware
Degree of Weathering and Soil Development
Slight
32%
Moderate
3%
Strong
65%
Entisols
17%
Inceptisols
14%
Histosols
1%
Alfisols
3%
Ultisols
65%
Laws 11 00041 i001 Laws 11 00041 i002 Laws 11 00041 i003 Laws 11 00041 i004 Laws 11 00041 i005
Social cost of soil organic carbon (SOC): $5.7B
$928.7M$837.7M$668.3M$158.8M$3.2B
16%15%12%3%55%
Social cost of soil inorganic carbon (SIC): $1.1B
$564.1M$480.3M$11.6M$90.0M$0.0
49%42%1%8%0%
Social cost of total soil carbon (TSC): $6.8B
$1.5B$1.3B$679.9M$248.8M$3.2B
22%19%10%4%46%
Sensitivity to climate change
LowLowHighHighLow
SOC and SIC sequestration (recarbonization) potential
LowLowLowLowLow
Note: Entisols, Inceptisols, Alfisols, and Ultisols are mineral soils. Histosols are mostly organic soils. M = million = 106; B = billion = 109.
Table 13. Increases in developed land and maximum potential for realized social costs of carbon due to complete loss of total soil carbon (TSC) of developed land by soil order in Delaware (USA) from 2001 to 2016. Values are derived from Table 4 and Table 11.
NLCD Land Cover Classes
(LULC)
Degree of Weathering and Soil Development
SlightModerateStrong
EntisolsInceptisolsHistosolsAlfisolsUltisols
Developed Area increase between 2001 and 2016, km2 (SC-CO2, $ = USD)
Developed, open space1.91 ($4.15M)2.26 ($5.34M)0.01 ($108,134.95)0.10 ($191,637.37)24.10 ($28.92M)
Developed, medium intensity4.89 ($10.60M)2.86 ($6.76M)0.05 ($1.10M)0.37 ($739,682.56)19.71 ($23.65M)
Developed, low intensity2.77 ($6.01M)2.43 ($5.73M)0.01 ($259,524.14)0.21 ($419,096.53)20.91 ($25.09M)
Developed, high intensity1.60 ($3.47M)0.50 ($1.19M)0.01 ($259,523.98)0.06 ($111,042.04)5.55 ($6.66M)
Totals (90.30 km2, $130.76M)11.17 ($24.23M)8.06 ($19.02M)0.07 ($1.73M)0.73 ($1.46M)70.27 ($84.32M)
Note: Entisols, Inceptisols, Alfisols, and Ultisols are mineral soils. Histosols are mostly organic soils. M = million = 106.
Table 14. Increases in land development (LULC: developed open space, developed medium intensity, developed low intensity, and developed high intensity) and maximum potential for realized social costs of C due to complete loss of total soil carbon (TSC) of developed land by soil order and county in Delaware (USA) from 2001 to 2016.
Total
Area Change
(km2)
(SC-CO2,
$ = USD)
Degree of Weathering and Soil Development
CountySlight ModerateStrong
EntisolsInceptisolsHistosolsAlfisolsUltisols
Developed Area Increase between 2001 and 2016, km2 (SC-CO2, $ = USD)
Kent25.98 ($32.55M)0.60 ($1.31M)0.57 ($1.34M)0.1 ($108,135.02)0.02 ($42,983.96)24.79 ($29.74M)
New Castle20.32 ($27.98M)2.21 ($4.79M)0.77 ($1.82M)00.71 ($1.42M)16.64 ($19.96M)
Sussex44.31 ($70.96M)8.67 ($18.82M)6.72 ($15.86M)0.07 ($1.67M)028.85 ($34.62M)
Totals90.61 ($131.49M)11.48 ($24.92M)8.06 ($19.02M)0.17 ($1.77M)0.73 ($1.46M)70.28 ($84.32M)
Note: Entisols, Inceptisols, Alfisols, and Ultisols are mineral soils. Histosols are mostly organic soils. M = million = 106.
Publisher’s Note: MDPI stays neutral with regard to jurisdictional claims in published maps and institutional affiliations.

