Urban Morphology and Outdoor Microclimate around the “Shophouse” Dwellings in Ho Chi Minh City, Vietnam


Centre for Urban Design, Architecture and Sustainability, University of Huddersfield, Queensgate, Huddersfield HD1 3DH, UK
*
Author to whom correspondence should be addressed.
Buildings 2020, 10(3), 40; https://0-doi-org.brum.beds.ac.uk/10.3390/buildings10030040
Submission received: 17 January 2020
/
Revised: 16 February 2020
/
Accepted: 24 February 2020
/
Published: 28 February 2020
(This article belongs to the Section Architectural Design, Urban Science, and Real Estate)
Abstract
:The underestimation of population growth has resulted in the disruptive and uncontrolled expansion of settlements in Ho Chi Minh City (HCMC). The outcome is a complicated mix of new spontaneous dwelling areas featuring a number of distinct urban morphologies. Previous studies have shown the impacts of urban morphologies on comfort levels in outdoor environments. The paper examines the correlation of microclimatic conditions and constituents that create the urban spatial form of residential neighbourhoods, particularly around ‘shophouse’ buildings. Understanding that relationship is significant for improving the future planning and design of residential zones and the creation of a pleasant external environment. Seven urban dwelling patterns were studied. Thermal variables were measured on-site over a summer season, while meteorological data were recorded. Additionally, numerical studies of the microclimate around two sample sites showed variations owing to different urban contexts. During summer, the outdoor conditions for the types surveyed ranged from 29.5 to 38.0 °C air temperature, 41% to 79% humidity, and 0.1 to 0.9 m/s airspeed at the occupied level. Environmental variations averaged 1.5 °C, 7% relative humidity, and 0.3 m/s between the urban geometries. Occupant thermal satisfaction was found around formally planned dwelling blocks, while compact neighbourhoods were characterised by cooler temperatures, but poor airflow and daylight. The outcomes are significant for optimising urban and building design.
1. Introduction
1.1. Background
Thermal comfort is a complex issue and studies of occupied environments have two main conceptual backgrounds: the predicted mean vote (PMV) approach, originally devised by Fanger [1], which was derived from laboratory experiments; and the adaptive approach, which was derived from the assessment of real building environments in which occupants could adapt themselves and their building space. The adaptive approach is also more closely associated with free-running buildings rather than closely-controlled (often air-conditioned) buildings.
In relation to the adaptive approach, and arising from a process of plotting data collected from world-wide field surveys, Humphreys found a close linear regression for the indoor neutral temperature (which is the temperature of the thermal environment in which people sense neither warm nor cool) against the outdoor temperature in naturally ventilated buildings, and a complex relationship in air-conditioned buildings [2]. In other words, changes in the outdoor meteorological conditions can cause a positive or negative connection to the indoor climate through the physical building, subsequently influencing the thermal satisfaction of occupants. Comfort, particularly in free-running buildings, is a result of a complex interplay of external climate patterns, building (design, building type, and cooling principle), and people (physiology, psychology, and behaviours) [3,4,5,6]. These considerations, coupled with global warming and the increasing urban heat island (UHI) impacts resulting from changeable land use and city configuration, have negative influences on comfort conditions, health, and energy use of buildings [7,8]. Uncomfortable warmth can be produced in local open spaces and is also associated with an increase in the use of energy in building mechanical cooling systems [9].
Over the last 40 years, a large number of studies on indoor thermal comfort have been conducted for various building types across widely varying climatic regions; however, only modest work on occupant thermal satisfaction in urban spaces has been carried out [10,11]. Several studies have determined that comfort in outdoor thermal environments is more complex to investigate because of the diversity of temporal and spatial factors within a neighbourhood or among neighbourhoods around a city [12,13,14].
Many studies on outdoor thermal sensations have been carried out through field questionnaire interviews and measurements across various urban spatial geometries and climatic zones. Nikolopoulou et al. undertook interviews with 1431 participants to understand the human parameters in outdoor spaces in Cambridge, United Kingdom. She found the pedestrians’ thermal neutrality to be 17.8 °C [15]. Between 2001 and 2002, the RUROS project (Rediscovering the Urban Realm and Open Spaces) investigated microclimate and comfort in urban spaces described by distinct spatial structure located in six cities in European countries [10]. The climatic characteristics and comfort temperatures were found to vary between those locations. The common limits of neutrality in summer ranged from 16.0 to 28.9 °C, and people were uncomfortable at 30.0 °C in the stale/static air condition.
In the tropics, other researchers conducted a number of surveys on the physical environment, along with recording subjective sensation in a wide variety of urban spatial conditions. Fieldwork with 1018 subjects in Australia by Spagnolo and de Dear determined a comfort temperature of 26.2 °C in outdoor and semi-outdoor locations [13]. The work of Bakar and Gadi predicted a comfort zone of 27.5–33.7 °C for public spaces in Kuala Lumpur, Malaysia [16]. Surveys of six different urban functional areas in Barranquilla, Colombia found pedestrians’ thermal neutrality to be 27.9 °C and a comfortable temperature range of 25.0–31.0 °C in the sunny season [17]. In a similar season, thermally acceptable conditions of urban spaces in Chiang Mai, Thailand were between 23.1 and 31.0 °C, with a neutral point of 27.1 °C [18]. Lin et al. investigated subjective thermal perceptions in a public square in Taichung, Taiwan. The outdoor desired temperature was 25.6 °C and the range of acceptable temperatures fell between 21.3 °C and 28.5 °C during a warm summer [19,20]. The research team continued conducting a widespread investigation into public spaces in central Taiwan. Their findings concluded the comfort temperature was 29.0 °C and the acceptable outdoor environmental band was 26.0–31.0 °C in the hot season [21]. Focusing on street environments influencing thermal comfort in Hong Kong in summer, Ng and Cheng analysed 1567 datasets collected under shaded conditions and found the desired outdoor temperature to be around 28.0 °C and acceptable wind velocities between 0.9 and 1.3 m/s [11].
Taken together, the outcomes of these previous studies on comfort in urban environments provide an understanding of the strong correlation between outdoor comfort conditions and local microclimate. It is clear that the variations of urban geometries contribute to the ability to control that relationship. This can be beneficial if correctly designed at different urban scales: building, urban block, and city scales [22,23]. Furthermore, while the range of environments that subjects find comfortable has been predicted, the contextual terms of climate, the spatial structure of external space, and social background are less certain and result in variations of occupant thermal sensations in different functional urban environments across different climatic regions. The role of wind speed and wind direction is of great significance here, and particularly where these factors interact strongly with internal air movement and consequently with internal thermal comfort.
For the context of the research reported here, the comfort predictions gathered in the humid tropics show that the conditions of subjective thermal neutrality in spaces around buildings fall into a typical range of 23.0–31.0 °C in warm summer periods. Additionally, sufficient provision of wind flow is suggested within the range of 0.9–1.3 m/s. Considering the factors overall, there is a need for further research and particularly to better understand some of the relationships between ambient conditions, building features, internal environments, and human comfort—this paper addresses such issues.
1.2. Aim and Objectives of the Paper
Most research literature has separately focused on thermal comfort indoors or outdoors; however, there is a lack of a connection between the two. Furthermore, although the existing fieldwork studies have investigated outdoor comfort conditions for urban environments, most of those surveys have been conducted for three dissimilar environment types: smaller-scale public spaces characterised by a particular usage; larger open areas, for example, parks, railway stations, public squares, bus interchanges, and so on [10,13,14,19]; or the larger city scale [7,11,24].
Returning to consider the previously identified correlation of outdoor climate and indoor comfort, some questions thus emerge, as follows: What are the real microclimatic patterns around buildings within a settlement? Whether or not most available findings discovered in open spaces actually reflect microclimate and occupant thermal perceptions in different urban geometries, particularly blocks of residential buildings in tropical cities? Although some research has considered the outdoor environments in a variety of open spaces, this has not reflected systematic issues such as those that would be linked to intrinsic principles of planning/zoning.
In order to address this research gap, this paper researches microclimates surrounding residential buildings in Vietnam through a case study of Ho Chi Minh City (HCMC). The current study is particularly related to the ‘shophouse’, which is a unique vernacular housing typology found extensively across SE Asia, including in Vietnam. This typology is linked to both the specific features of the building and its urban pattern. Using as a basis an existing database for the systematic classification of shophouse urban structure types in HCMC [25], this paper aims to analyse the physical variations of urban patterns through their urban constituents. The shophouse settlements are characterised by diverse conditions, such as subdivided building types, density, height, open area, vegetation, and building grouping patterns—all of which can be difficult to incorporate into a design process to achieve satisfactory ambient thermal environments. The paper then identifies varying environmental performances according to a system of urban types. Finally, the effects of urban morphology on outdoor microclimate are determined by applying a combination of four methods including mapping, field measurements, monitoring, and simulation. The study goes on to propose appropriate recommendations for the urban design of residences to improve the outdoor microclimate, which can lead to greater thermal satisfaction with both internal and surrounding climates and consequent reductions in energy demand. While the study is clearly located in one, albeit important, city, the outcomes have implications for the wider geographical region as well as similar housing types and urban configurations.
2. Materials and Methods
2.1. Location of the Study
HCMC is the second-largest city in Vietnam and is located in the south-central part of the country. The city experiences a climate of high air temperature, high humidity, and heavy rainfall throughout the year. The mean annual temperature is 28 °C; however, over summer, the extreme temperature can reach up to 40 °C. The average monthly relative humidity ranges from 70% to 85% [26]. Two prevailing winds flowing across the city are the west and southwest monsoon winds in the rainy season and the north and northeast monsoon winds in the sunny season. Furthermore, the trade wind from the south and southeast also operates from March to May [27].
Since the initiation of the ‘Doi Moi’ economic renovation in 1986, many reforms have occurred across Vietnam, in which HCMC has played the leading role [28]. The economic changes are linked to an explosion of population and urbanisation. The census of 2015 concluded that the total population of HCMC was almost 9 million people; this figure is almost 1.8 times higher than in 1999 and with over 90% of citizens living in urban areas [29,30]. The city projections to 2025 expect a rise in population to 13.9 million, of which 10 million would be considered municipal residents [31].
The population growth also means a massive urban expansion and rise in housing demand from both local people and migrants. The total city area of 2093 km2 consists of four sub-regions: core-centre, former inner, new inner, and suburban. The city area covered by hard construction surfaces increased by 20% between 1989 and 2006 and is associated with an increase in the average surface temperature of 4 °C in urban areas. Additionally, a difference of up to 10 °C was found in central city districts [32,33]. The predicted urban population in 2025 would be accompanied by an expansion to 750 km2 of the overall built-up area, increasing urbanisation in new inner and suburban districts, and a decline in population in the centre [34]. Since 2015, over 300 residential building projects have been developed across the city, mainly in new districts and peripheral areas. The exacerbating effects of both urbanization and population growth have resulted in chaotic urban development without clear management of long-term planning and management in HCMC. The impacts of expanding residential neighbourhoods, as well as global warming, have accelerated the problems of urban climate. The microclimate has changed and there is greater variability between neighbourhoods accompanied by increasing risks for comfort and air quality experienced by occupants in HCMC. The city’s mean temperature has risen by 0.9–1.2 °C since 1958 [35]. Climate changes and man-made modifications have resulted in unsatisfactory thermal environments in and around buildings, and in trends for increased energy use.
As will be discussed below, the architectural and planning characteristics of the shophouse typology, as well as its urban spatial structures, will be presented using a systematic categorisation. In addition, the climatic results of field measurements around shophouse dwellings during summer will be discussed and a computational analysis of the outdoor microclimate of two sample sites will be carried out; finally, some conclusions will be extracted.
2.2. Studies on Housing and Urban Structure Types
2.2.1. Classification of Dwelling Types
The ‘shophouse’ is an individual house that has a particular settlement pattern including a ‘shop’ for commercial/retail/work purposes, normally found on the ground floor, and the ‘house’, providing accommodation on the upper floors. Across Vietnam, the shophouse dwelling type is predominant, accounting for around 98.5% of the housing market in comparison with the occupancy of other types: flat (1.4%) and villa (0.1%) [29]. Considering HCMC, the total construction coverage of shophouse buildings was approximately 95% of the built-up land area for residential buildings, according to field observations between 2010 and 2014 [36].
The shophouse dwelling is basically a form of terraced house. Its principal characteristic is a convoluted building form, but often appearing to be like a long and thin tube, so they are also known as “tube houses”. Typically, building dimensions are 3–5 m in width and 20–25 m in depth, even reaching up to 100 m in some older traditional properties. The shophouse can comprise one storey or more up to a normal maximum of five, as shown in Figure 1 [37]. All dwellings are positioned along, and perpendicular to, streets and alleys. Thus, people can approach the main façade of buildings from road or alley before entering deeper within the building [38]. An overarching review of the morphologies of shophouses shows they are diverse in size, configuration, style, and structure.
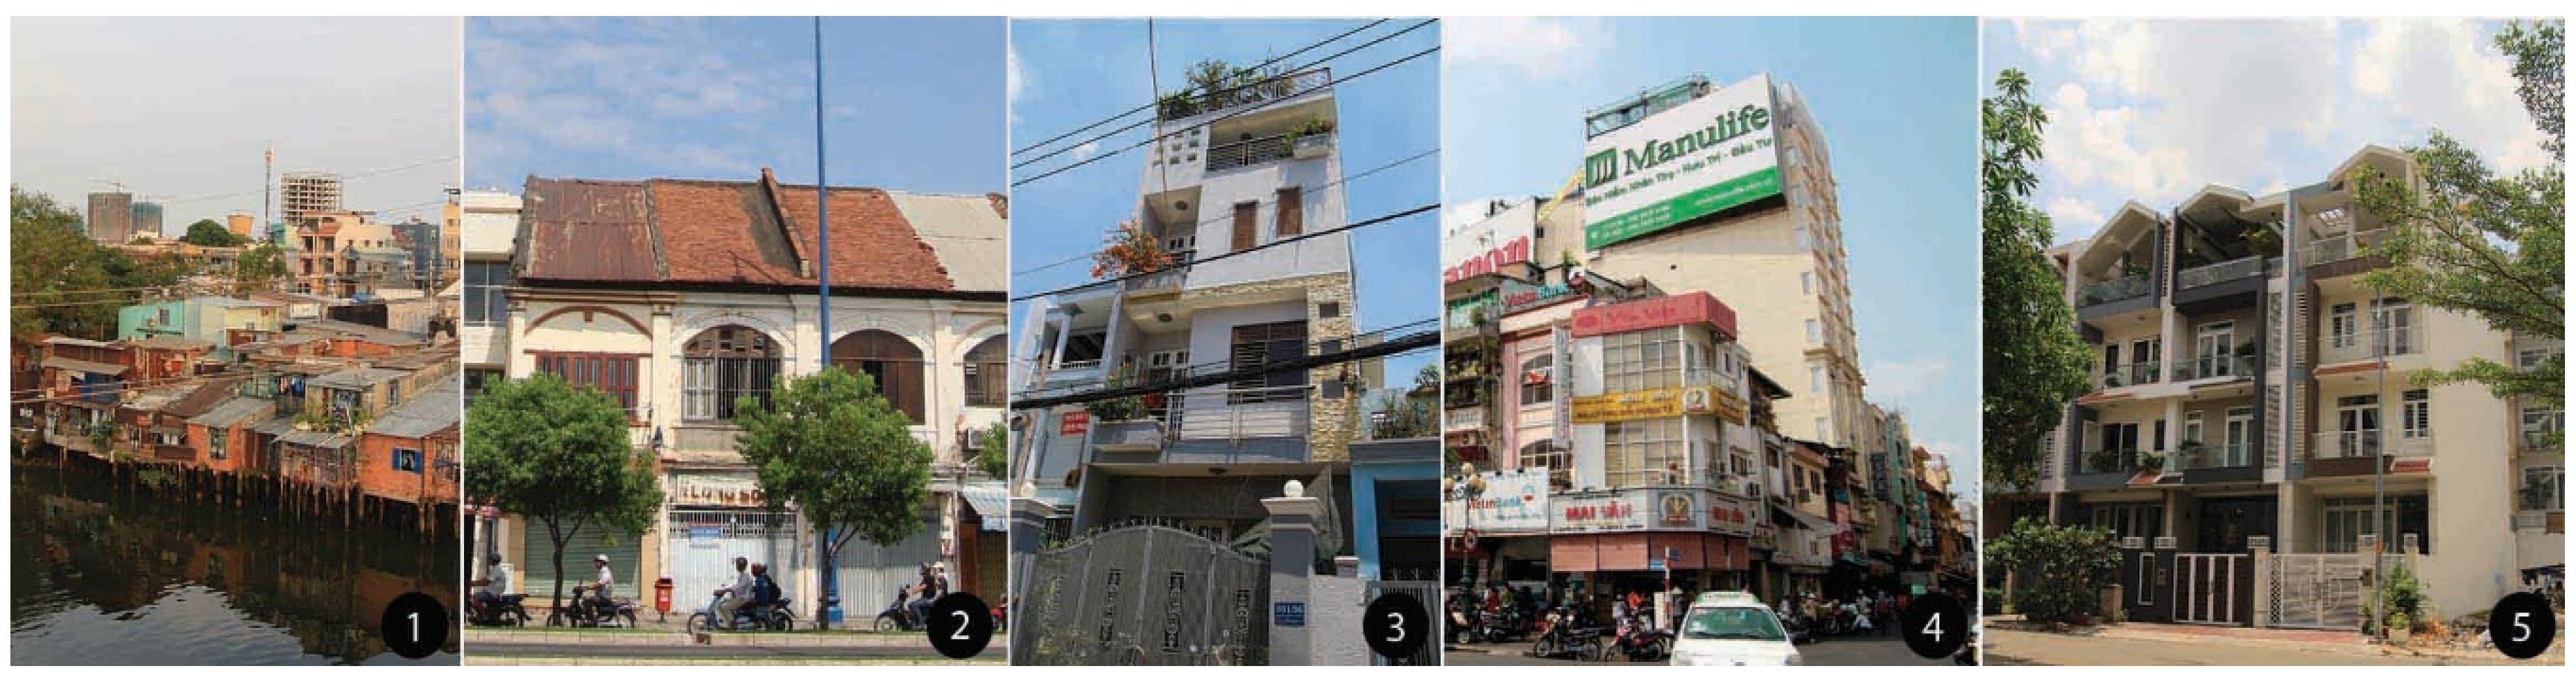
The five-year survey findings of land use in HCMC have identified a total of five shophouse types: rudimentary (Type 1), traditional (Type 2), new (Type 3), commercial (Type 4), and row house (Type 5) [39]. Examples of each type are shown in Figure 2. The subcategorised housing types are differentiated by architectural and planning distinctions in terms of location, usage, access, material, building volume, height, and design features. For instance, Type 3, which is predominant out of the five shophouse types, usually appears in compact municipal areas. They have a wide variety of building size, façade appearance, architectural style, and a number of floors. Meanwhile, Type 5 is primarily a three- to five-storey shophouse archetype, which is used for lower density residential neighbourhoods with or without public spaces/facilities.
2.2.2. Urban Structure Types
The University of Cottbus, Germany carried out extensive studies on the adaptation of HCMC to climate change between 2010 and 2014. One significant factor in their research was the classification of city spatial patterns, which was based on building types, urban constituents, and their construction, covering both fully formal and informally planned areas. Using the Land-use Map 2010 at a scale of 1:25,000 combined with fieldwork, a total of 82 city structures were defined with 16,292 blocks and a subset of five major classifications: residential, public and special use, industrial and commercial, green spaces, and traffic system and water networks [36].
Settlement structural definitions were assigned to 6717 blocks including 12 patterns, with 6436 blocks categorised as urban low-rise dwellings (Table 1) [25]. The morphologies of residential blocks are determined by many factors: land use, road pattern, population density, spatial pattern, building ratio, planned green space, housing archetype, and building height. For the scope of this paper, seven urban morphologies highlighted in Table 1 were studied considering physical characteristics, microclimate, and the impacts of urban components on such a climate.
2.3. Research Methods
2.3.1. Identification of Residential Urban Types for Survey and Analysis
Each of the seven selected patterns of urban morphology, which provide a good selection of commonly dwelling urban structures, were visited and outdoor environmental parameters were measured. There were 65 settlements of seven urban pattern types studied around the city. The extant proportions of the investigated urban types are shown in Figure 3, in which pattern types 3 and 4 are the most popular. Each pattern type is characterised by a distinctive spatial morphology; however, because of some similar constituents of some urban typologies, four groups of urban pattern types were devised: Group 1 (pattern types 1 and 2), Group 2 (pattern type 3), Group 3 (pattern types 4, 5, and 6), and finally Group 4 (pattern type 7) (Figure 4).
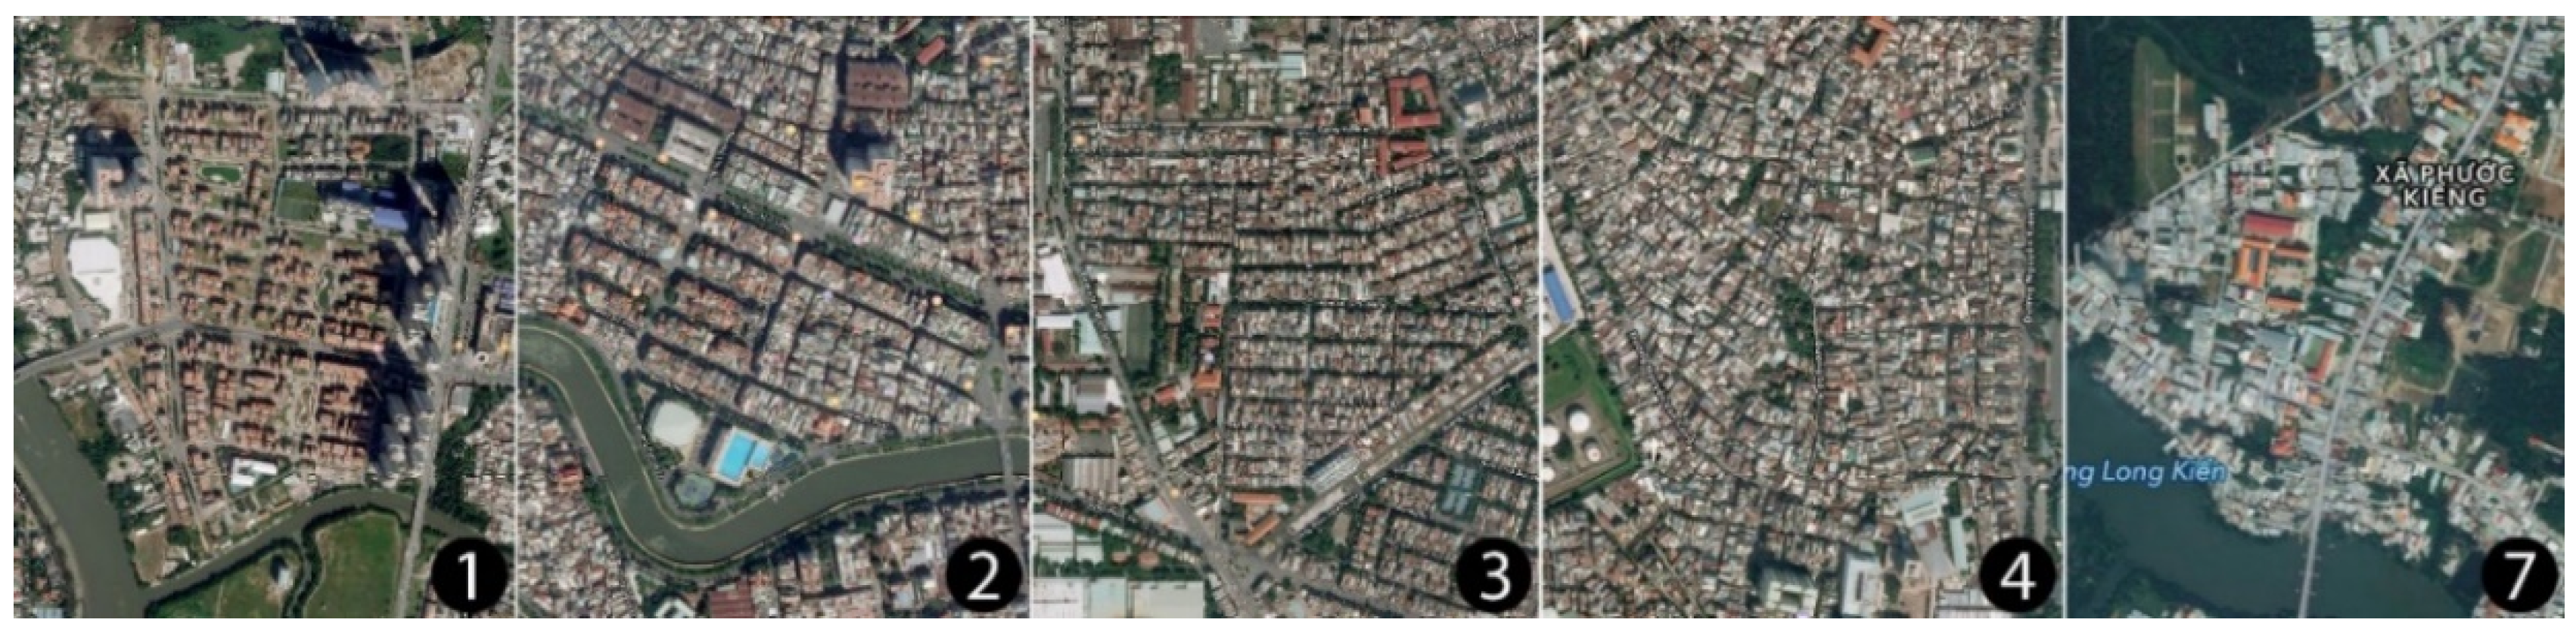
Group 1 was characterised by the terraced housing archetypes located perpendicular to main streets in a back-to-back pattern, and with communal spaces within each residential block. The distribution of Group 1 is common in new and peripheral districts of HCMC. Group 2 has a high density of occupancy found in the 2060 ha of the inner-core and new inner areas of the city. The spatial structure of Group 2 includes the regular development of low and high shophouses facing narrow streets/alleys. The spaces within buildings are usually narrow and open to the main streets. Group 3 includes three urban patterns: the major feature of this group is an irregular and non-homogeneous high-density pattern of dwellings with narrow streets or alleys. The buildings are located along alleyways spreading away from the main streets. The houses’ architecture varies, and there is no single archetype. Group 4 is generally found in the new inner and suburban neighbourhoods of HCMC. This group’s morphology is characterised by a less dense structure and regular arrangement of houses. The housing found in this group includes new and rudimentary houses of one to three stories along main streets. Within buildings, many unplanned green spaces can be found.
2.3.2. Research Techniques
Four research techniques were used, including mapping, field measurement, climate monitoring, and simulation. These were used in combination as follows.
Mapping was the tool used to understand the urban form and building footprints of the urban blocks through satellite photos and figure-ground maps.
Outdoor Field Measurement. To examine microclimate around shophouses, fieldwork at 59 locations covering seven urban typologies was conducted in HCMC in April and May 2017. The climate during these two months is the most rigorous because of heat and lower precipitation. Close to every dwelling urban block, some locations for measurement were selected, and then thermal variables—air temperature, relative humidity (RH), and airspeed—were measured using hand-held calibrated instruments (PCE-WB 20SD and Testo 425 hot-wire anemometer). The date and time of measurement, as well as sky conditions, were also recorded. The measurements were carried out from 09:00 until 17:00 during summer. The environmental parameters were collected at the level of pedestrians and were read after 3 min of calibration. The air velocity was averaged by a number of measurements over 3 min.
Climate Monitoring. Along with the field measurements, the meteorological data of the city’s weather station were also collected. The data amassed do not constitute full continuous sampling (which would be impossible without much greater resource); however, it does provide information across such developments about environmental conditions that have not previously been reported.
Moreover, to provide further systematic data for the further investigation of variable environmental conditions around residential neighbourhoods, Netatmo type weather stations shown in Figure 5 were placed within three different urban types: Type 1, Type 3, and Type 4. Such a weather station contains three units: an indoor module, which records the internal physical variables; an outdoor module to record air temperature and humidity simultaneously; and an anemometer to collect data on wind speed and direction. The weather stations were left to operate remotely over a period of two months, but with daily checks performed using online data.
Simulation. The microclimate of the urban blocks was also estimated over the year from numerical analyses using the software of ENVI-met (this is a well-known and widely used tool for understanding and simulating urban environments). Although ENVI-met is a tool that is useful to compare the variations of underlying thermal performance among different research cases, the software shows limitations in predicting absolute conditions on the specific values of thermal variables. The thermal conditions in terms of air temperature and air movement were predicted for the months of March, June, September, and December, and from 09:00 to 17:00. The simulation was processed for sample areas defined by zones of 100 m × 100 m.
3. Results
3.1. Overall Results for Microclimatic Data
Summarising data from the 59 environmental measuring points around the city at levels under 10 m show that the average temperature was 32.6 °C (SD 1.63), mean RH was 61% (SD 8.06), and air velocity was 0.32 m/s (SD 0.19) during the two months of April and May (Table 2). Over summer, the outdoor temperature and airspeed reached a peak at nearly 38 °C and 0.9 m/s, respectively.
Considering the outdoor microclimate of settlements, which are characterised by different urban constituents, the on-site measurements of the physical variables at 59 different locations across the city in summer 2017 indicate the variations of the urban environment between the residential blocks investigated. Those urban physical features help quantify comfort/discomfort of the individual urban morphologies, and thus can support the assessment of appropriate design recommendations or changes to respective spatial structures of settlements. The environment surrounding dwellings classified according to the four groups of urban structures was evaluated using boxplot analysis of air temperature, RH, and air movement, along with the longitudinal climatic pattern. The next subsections will show more details.
3.2. Air Temperature
Figure 6 indicates that the hottest thermal condition measured was in Type 3, which was characterised by the highest median (33.6 °C, SD 1.67) and maximum (38 °C) air temperature over summer. Meanwhile, the average ambient temperatures within other urban types were lower or equal to the overall average value shown in Table 2. The mean air temperature in pattern type 1 + 2 and pattern type 7 areas was similar and close to the average of 32.6 °C. However, the variability of the thermal conditions during the day was different between those urban types. One way to examine this is to look at the statistical variation in values about the mean. In pattern types 1 + 2, the fluctuation of air temperatures is narrower at 2.5 °C (31–33.5 °C) and with SD (1.49) and standard error (0.47) compared with the wider range of 5 °C (29.5–34.5 °C), higher SD (1.92), and higher standard error (0.78) in pattern type 7. In pattern types 4 + 5 + 6, the mean of air temperature outdoors was the lowest of all seven urban patterns, with 32.2 °C (SD 1.52).
Figure 7 depicts the distributions of air temperatures recorded by the Netatmo weather stations in two hot months (April and May) for three of the urban types studied. The results represent a difference of average temperature (2 °C) between those cases: pattern type 1–32 °C (SD 1.33), pattern type 3–33 °C (SD 1.58), and pattern type 4–31 °C (SD 1.23). They support evidence that warmer temperatures are experienced around the shophouse buildings in the urban structure of pattern type 3–especially during extreme heat periods of over 39 °C, which usually occurred around noon. In general, the pattern of exterior thermal condition surrounding pattern types 1 and 4 was similar and showed more pleasant conditions during the testing period. However, the temperature data recorded generally show potential for less thermal satisfaction in the daytime in all three pattern types (1, 3, and 4); occupants would be exposed to many hours of daytime hot temperatures during hot months.
3.3. Relative Humidity
Relative humidity varied between 48% and 80% across all urban types observed during summer. Some details are shown in Figure 8. The hot air temperature caused the drier environment over summer months in pattern type 3, while the air condition was more humid in all other patterns. However, referring to the acceptable relative humidities as defined by TCVN (Vietnam Building Standard) 7438:2004 shows that almost 100% (pattern type 3) and 75% (all other pattern types) of RH values recorded comply with the standard at a range of 30% to 70%. Data collated for the lowest density neighbourhoods (pattern types 1 + 2) and the highest density blocks (pattern types 4 + 5 + 6) show the humid condition of the air in those locations; the supplement of air breezes is thus significant in improving occupant thermal comfort by dissipating moisture in the hot condition. In summer, the relative humidity can be seen to peak at about 80%.
The above analyses simply compare the humidity levels between the real condition and recommendation implemented in the national standard; it should also be noted that the variable is coupled with air temperature and that it is more difficult to measure and explain the influence of humidity precisely and independently [40]. Humidity is, however, confirmed to be an important factor influencing human comfort and health in warm-humid climates [40,41]. Under those climatic conditions, the involvement of sufficient air velocity for ventilative cooling is a great advantage for the indoor and outdoor environment and air quality [1].
3.4. Natural Wind Environment
Unlike the meteorological data from the official weather stations, which are located in open areas and at a greater height, the observations of the wind environment at the lower level within the urban dwelling blocks environment showed the majority of air velocities were low, typically less than 0.3 m/s over the summer period. This difference found between climatic data and actual measurements is significant for both dwelling planning and design, but it is important to be able to understand the impact.
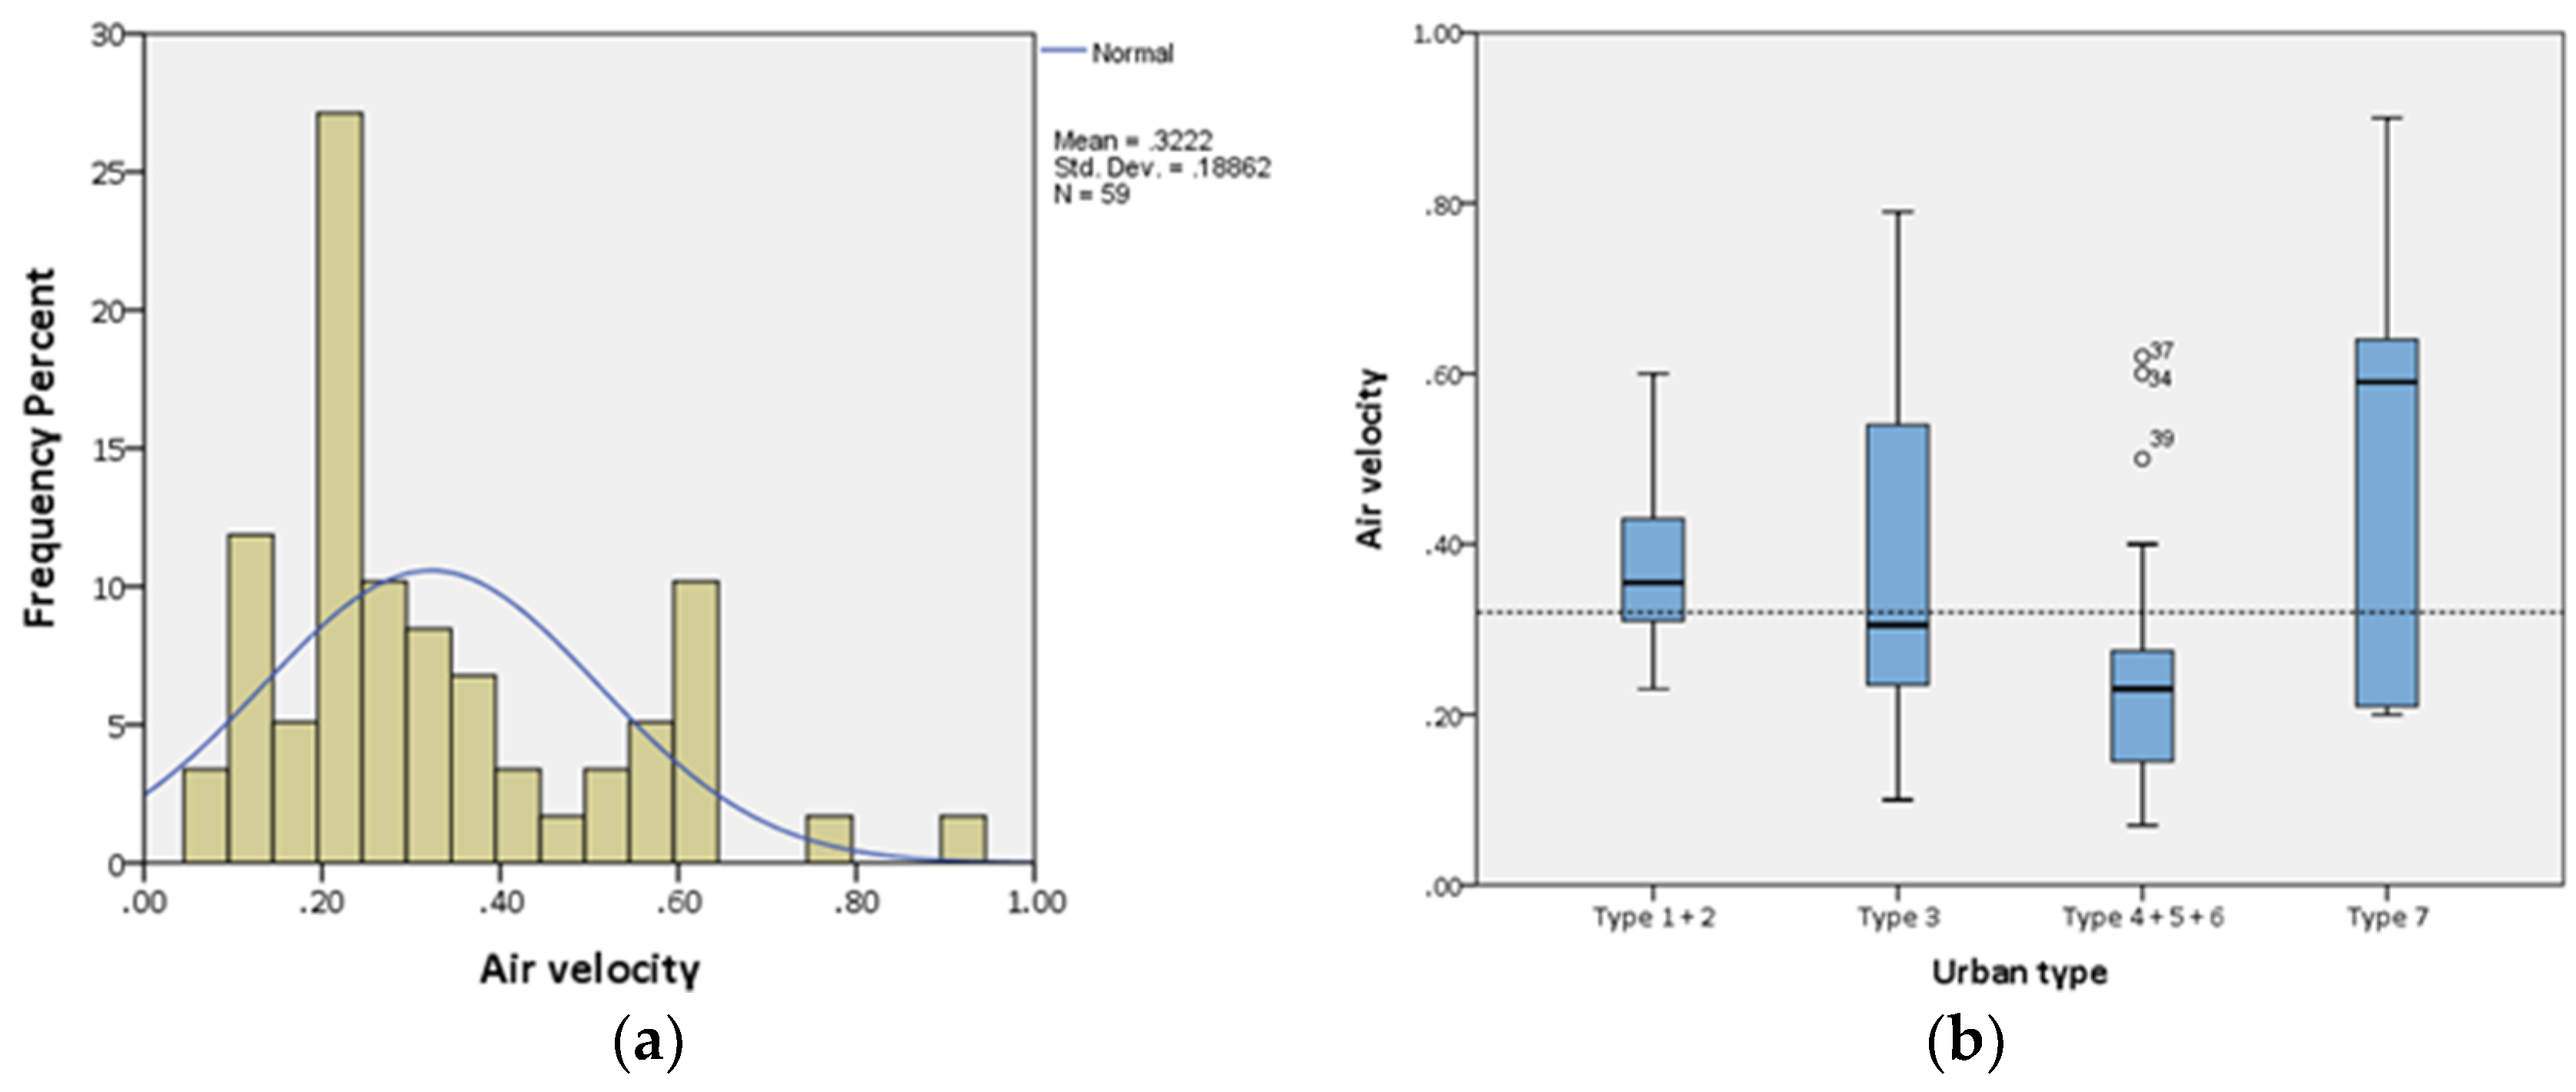
From previous studies, the acceptable natural wind range for occupants in the tropics was reported as either in the range 0.3–0.9 m/s (i) [42], 0.5–1 m/s (ii) [9,43], or 0.9–1.3 m/s (iii) [11]. From these three references, the limits set in (i) and (ii) are commonly applied for indoor spaces. Under warm thermal conditions in summer, people can be comfortable at a high air temperature under the intervention of increased air velocity [40]. Measured airflow in the city ranged from 0.1 to 0.9 m/s in the summer months (Figure 9a). The histogram analysis of recorded wind data shows that the air movement was insufficient over 53%, 75%, and 93% of residential neighbourhoods surveyed in total corresponding to findings (i), (ii), and (iii), respectively.
Referring to the acceptable zone of air velocities (0.3–1 m/s) recommended by Gong et al. [44] and Szokolay [9], approximately 70% of airspeed values were observed to fall within the limits in the urban patterns of types 1, 2, and 7. The maximum air velocity in pattern types 1 + 2 and type 7 was recorded at 0.6 m/s and 0.9 m/s, respectively (Figure 9b). High-density construction and the irregular urban morphology may well explain the poor performance of wind flows in pattern types 4 + 5 + 6: 75% of airspeeds were lower than 0.3 m/s, causing summer thermal discomfort in these types. In pattern type 3, the variability of wind speed was from 0.1 to 0.8 m/s, with half the values above 0.3 m/s in the hot months.
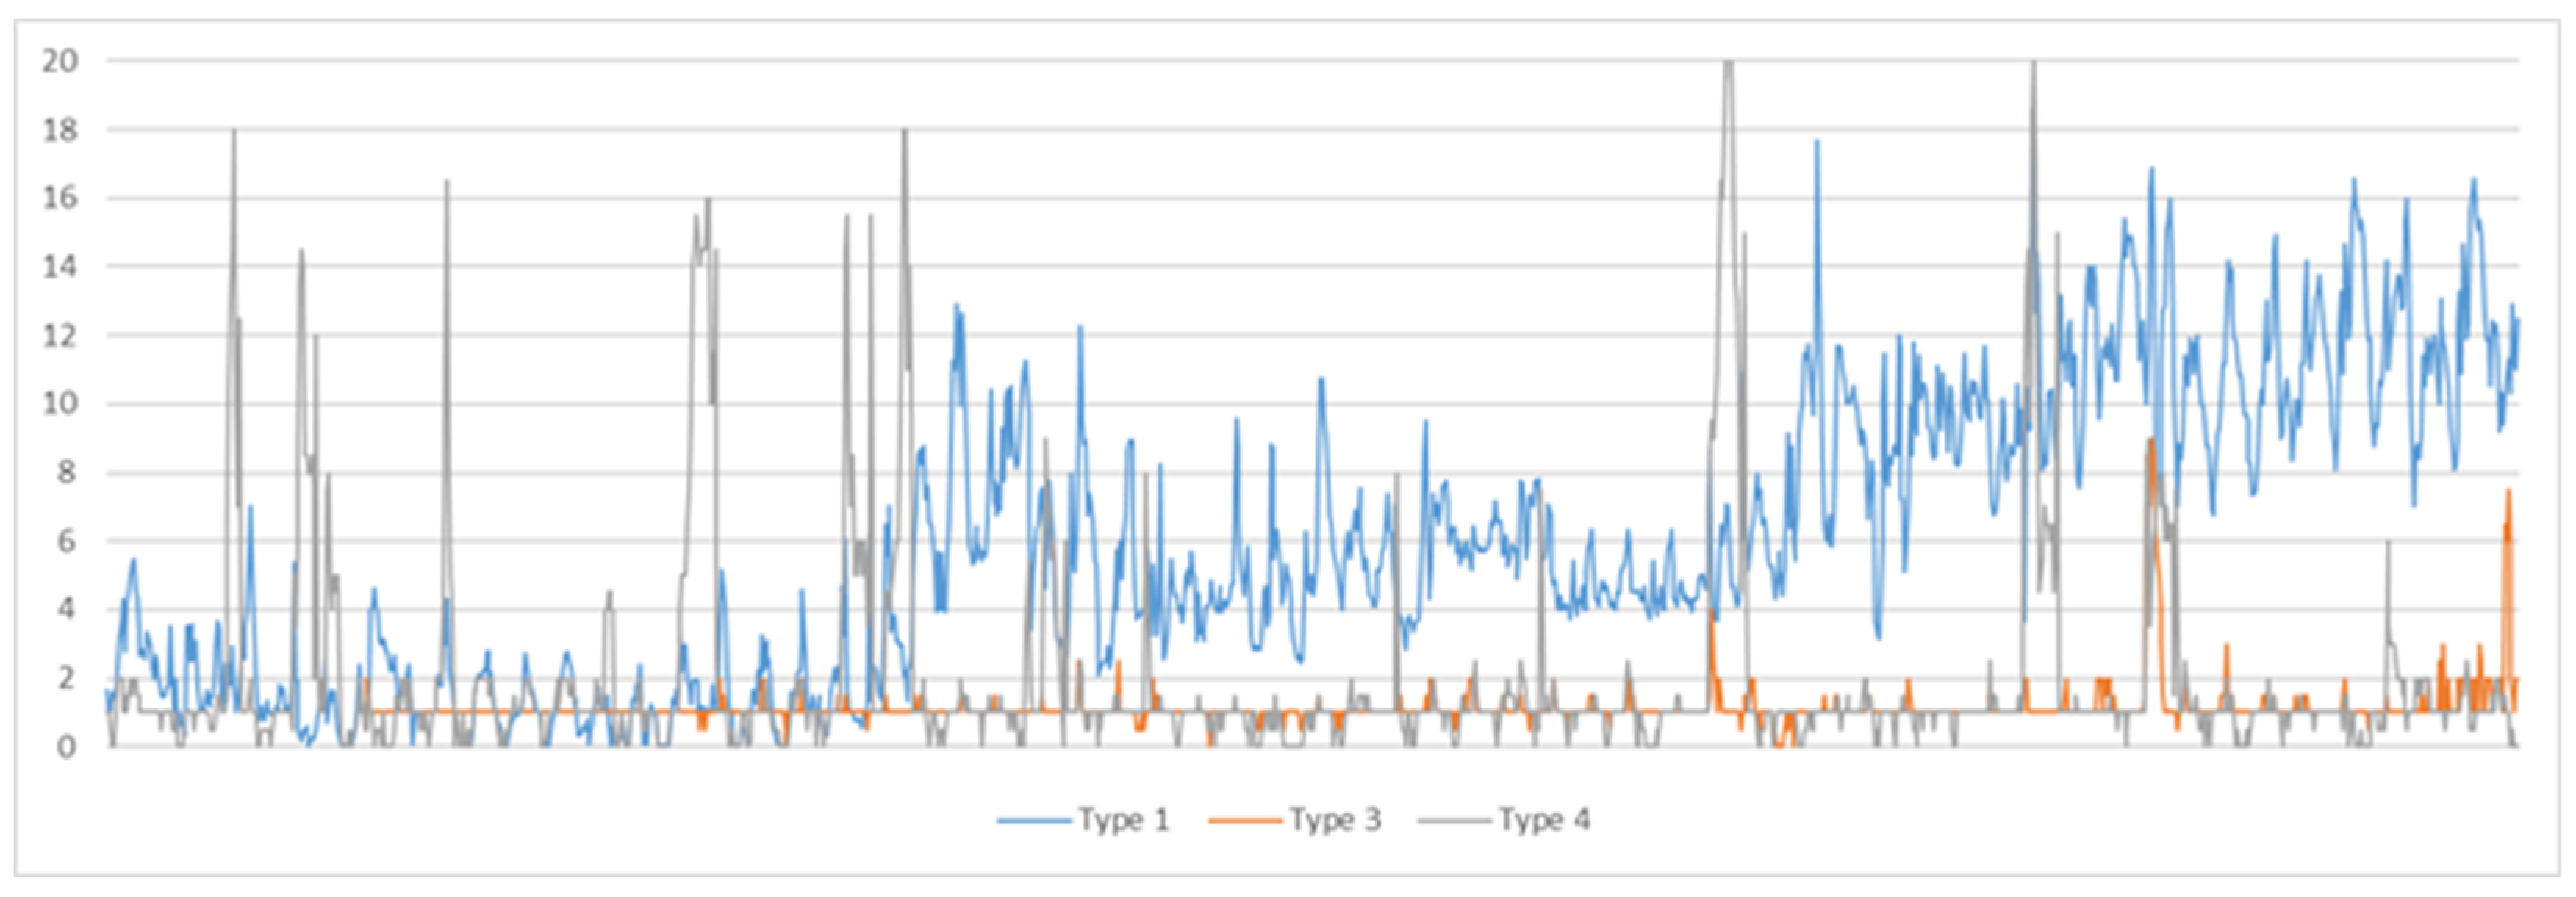
The data gathered from the long-term installation of the loggers indicated the presence of higher values of wind speed when measured over the period as compared with the short-term ‘snap-shot’ measurements. This is plausible because of some differences in measuring methods and the slightly higher measurement location of these meters. The short-term recording of airspeeds around specific areas within Type 1, 3, and 4 shows some discrepancies that might be attributed to the influences of urban and building patterns (Figure 10). The variation of mean airspeed was 2 m/s across three urban morphologies. The wind flow in and around the residential blocks designed with a lower density and a more regular spatial pattern was better and more uniform, which is an advantage in providing a pleasant thermal environment for both climates in and around houses. The complex urban morphology of Type 4, along with variable housing volume and height, is a significant reason for the fluctuation of the wind environment. Although air velocities were intense at certain times, airflow distribution within the shophouses in Type 4 was relatively poor. Consequently, both indoor and outdoor human thermal comfort in and around the dwelling blocks of Type 4 benefit little from the effects of natural wind.
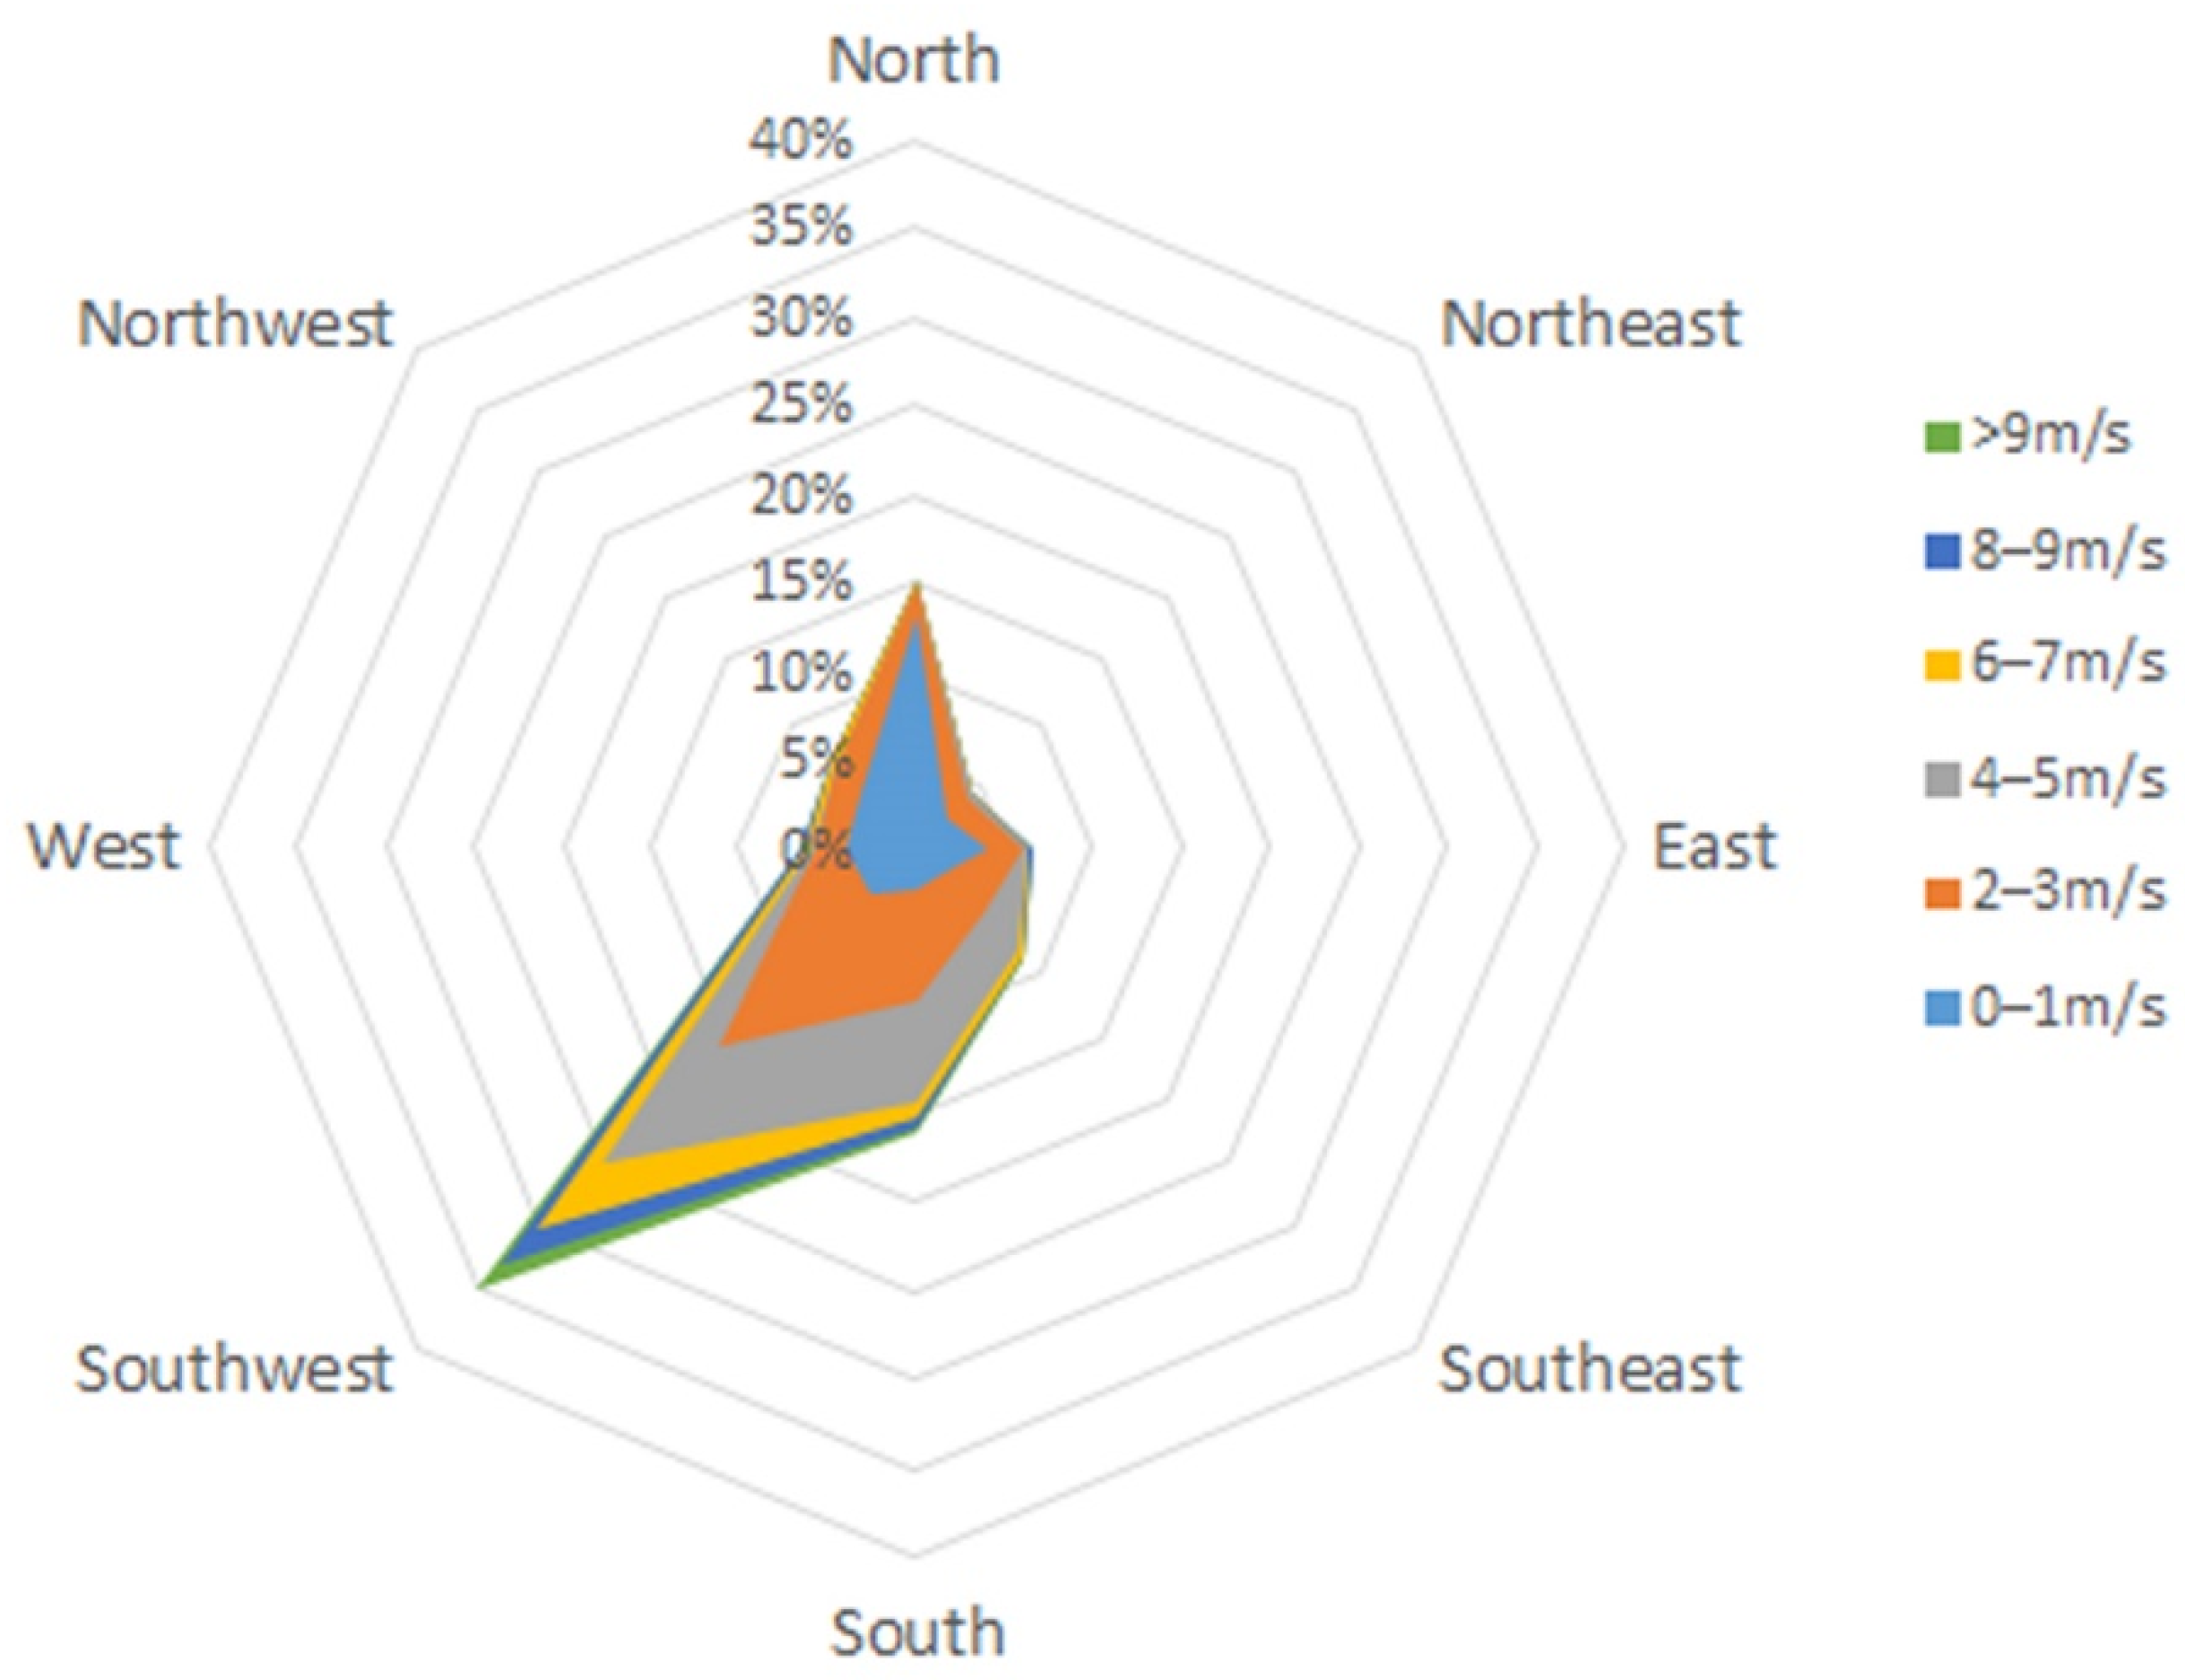
Both wind speed and wind direction are important in determining flows within buildings, and thus eventual comfort levels. Data were recorded to attempt to capture these aspects of the local environments. The long-term recording of wind data was carried out at one position within each settlement; the difference in the pattern of wind flows in terms of air velocity and direction can help explain the impact of urban spatial structure and the relationship between outdoor winds and the orientation of a neighbourhood. The data are shown in Figure 11, Figure 12 and Figure 13 in graphical format for three locations. Further studies are needed, probably involving CFD (computational fluid dynamics) studies to enable any predictive outcomes; this is beyond the scope of the current work.
In pattern type 1, the dominant wind incident was from the southwest, with a wide variability of airspeeds from 2 m/s up to more than 9 m/s. In addition, wind flows from south and north were available with high velocities during the surveying period; however, their frequency was less dominant. In pattern type 3, the wind direction within the settlement mainly came from between the northeast and west. The maximum velocity range of wind flows was between 2 and 4 m/s. Among the three main wind directions, the airstreams from the north were the most dominant. In pattern type 4, the wind environment outside the building fluctuated significantly with the range of wind velocities from 0 to more than 9 m/s. There were four important directions: east, southeast, south, and north. However, the most significant wind was from the southeast.
3.5. Investigating the Thermal Environment of Two Samples of Residential Neighbourhoods
Besides assessing urban environments based on both ‘snap-shot’ and longer term monitoring measurements at different points around shophouse buildings over the city during summer, this section studies the microclimate of two dwelling blocks: pattern type 2 (sample 1) and pattern type 3 (sample 2), through computational analyses using the ENVI-met program. The urban blocks were considered as squares of dimension 100 m × 100 m. After modelling and declaring the inputs (the respective urban constituents of each case and meteorological data within the testing period), the outputs are spectral images of numerical data. These data represent more comprehensive performance analyses of the microclimate outside buildings, focusing on two dominant thermal parameters in the tropics: air temperature and airspeed.
The urban morphology of the two samples is illustrated in Figure 14, and variations of urban parameters between samples can be observed. Firstly, for building form and coverage, in sample 1, the housing design matches with some archetypes; the building height is four stories, and the building density is medium. In sample 2, the design of four-story houses is non-homogeneous and the construction coverage is much denser. Secondly, despite similar underlying regular road layouts in both samples; the pattern is more compact in sample 2. In sample 1, more open spaces and green sidewalks/driveways are observed, while the narrow/medium streets without trees/pavements provide the only empty spaces within the block.
The simulations were carried out on a typical day (21st) of three typical months (March, June, and December), which spanned the range of weather conditions in the city. For the simulation process, the major characteristics related to climate, planning, and building around the examined residential areas were input. In particular, the monthly mean temperature, humidity, solar radiation, and air velocity of three particular months investigated were used; additionally, the direction of the monthly prevailing wind was also declared. Moreover, information associated with building height and landscape (tree density, tree height) was assumed for the simulations according to real conditions on-site. The outputs of the thermal environment around ‘shophouse’ blocks are indicated by a spectrum as displayed in the figures.
Figure 15 shows the outdoor thermal conditions within the two sample areas at 15:00, on 21 March, 21 June, and 21 December. Despite the greater prevalence of green areas in sample 1, the wide asphalt roads contribute to an increase in temperature in the air around the dwellings. The thermal condition outdoors in this urban type is hotter than in sample 2, which gets the benefits of overshadowing between buildings. In December, the cooler climate of the city has caused the temperature to drop by 2–4 °C in both samples compared with the hot ambient temperatures in summer. The hot conditions in sample 1 can provide discomfort not only for the people located outdoors, but also for the occupants in naturally ventilated houses owing to thermal exchange between internal and external climates. In sample 2, the compact building pattern is effective in providing protection from solar heat and retaining coolness, but there is also a problem of weak air flows and poor daylighting.
The features of urban spatial morphology clearly affect wind distribution surrounding houses in terms of intensity and direction. Building density and narrow common spaces in sample 2 give rise to the poor quality of wind flow through associated urban canyons within building groups. This was studied over three months; Figure 16 shows the simulated results of air flow patterns are comfortable for the occupants in March and June in sample 1 of pattern type 2, which is significant when compared with human thermal comfort under a warmer environment in sample 1. The free open spaces combining vegetation can accommodate the air flows around the block with a wide air movement range of 0.6–2.7 m/s. However, in December, the wind condition is relatively still with an air velocity of under 0.3 m/s in both samples, which may impact occupants’ thermal satisfaction.
Another evaluation is concerned with the broader wind patterns associated with the climate. Variable wind distribution around the two urban blocks over the year can be explained by the changeable direction of seasonal prevailing winds and their modification when they flow around the buildings, especially in sample 2. During March, south to southeast winds are modified and typically flow horizontally in front of the building; however, vertical wind patterns along the building side are observed in June. This is interesting as it suggests the development of more sophisticated planning strategies should be considered that can raise thermal comfort in and around houses by allowing prevailing winds to flow, or by directing them to the upwind surfaces of buildings.
4. Discussion
In the built environment of HCMC, the existing meteorological data implemented were recorded from the Tan Son Hoa weather station and published by the Ministry of Construction (MoC) in 2009 [26]; unfortunately, there is no other suitable set of data for this analysis. Regarding that report, the maximum, minimum, and average temperatures were 34.6 °C, 26 °C, and 29.2 °C, respectively, over both April and May. Furthermore, RH values ranged from 72% to 79%, and average airspeed varied from 2.5 to 3.3 m/s during summer; however, it was also noted that the city macroclimate was changing, so the more recent years were examined for this study. There is a significant divergence of environmental parameters observed in the field and the recorded meteorological data owing to the changing urban environment and the complex impact of urban compositions at the pedestrian level. The warmer temperatures taken showed the higher thermal vulnerability of the real outdoor environment. Meanwhile, the values of air velocity recorded by the weather station at a height of 10 m are not the case for lower levels within urban areas. This is often an issue in taking meteorological station records and using them in the analysis.
Generally, when compared with official Ministry data for microclimates, the environmental values of actual measurements were higher than the threshold of the acceptable thermal zone in hot months (29.5 °C) [43]. Cross-referencing the data to the outdoor thermal acceptable range (23–31 °C) found above in the tropics, 85% of measurements were outside the acceptable limits, meaning people would experience uncomfortable warmth. Although the remaining data fell into the comfort zone, the actual wind environment was likely insufficient to retain thermal satisfaction if referring to the necessary range of air velocities between 0.9 and 1.3 m/s found by Ng and Cheng (2012). In short, the microclimatic conditions surrounding the dwellings of HCMC in summer appear to confirm urban discomfort for residents because of warm air temperatures and low wind speeds.
The spatial structure of the different urban types causes variations in the exterior environment. Table 3 summarises general outdoor climates within the shophouse settlements categorised into four groups of urban spatial patterns studied. All the temperatures averaged from the cross-sectional surveys are much warmer than the upper limits (30 °C and 31 °C) found from field studies in summer months in Europe [10] and in the tropics [11,17,18,21], respectively.
The lowest mean air temperature and mean air velocity around the residential blocks of Group 3 (pattern types 4 + 5 + 6) appear to be linked to the irregular planning and high density of dwellings. Under the urban morphology of those pattern types, overshadowing between buildings appears to reduce the impact of solar heat, producing a cooler thermal condition in these types. However, the compact urban pattern may provide an obstruction for airflow and comfort convective cooling.
Meanwhile, the settlements of Group 1 (pattern types 1 + 2) and 4 (pattern type 7) are characterised by formal planning, lower construction coverage, regular road pattern, simple road system, wider spacing, green sidewalks, and presence of green spaces. Those urban constituents can contribute to regulating the warm air if supported by other measures such as shading, evaporative cooling, humidity balance, and enhancing convection and penetration of airflow around buildings [24,45]. These were linked to a warmer environment (typically by 0.5 °C) and higher wind flows, especially within pattern type 7 compared with pattern types 4 + 5 + 6 (Group 3). The unplanned large green areas in Group 4 probably play a significant role in moderating the microclimatic conditions around residential neighbourhoods. Thus, the thermal environments here are more pleasant for the occupants.
The most unpleasant climates were found in pattern type 3 (Group 2). The hot environment around buildings in pattern type 3 may be a result of solar radiation owing to reflection from surrounding buildings, as well as the heat absorption of asphalt roads. Meanwhile, the on-site investigations around settlements of pattern type 3 found two typical conditions of vegetation: a paucity of trees to shade street surfaces and use of unsuitable types of plants for urban conditions (spacing, building height, and density). Those shortcomings of vegetation could be linked to the uncomfortable temperatures at the level of pedestrians because of the additional radiant and convective heat from high surface temperatures of unshaded roads. Reflected glare from the street surface is also a problem for visual comfort. Considering those issues, appropriate solutions using vegetation and planting can be beneficial by minimising impacts through providing shadows and lowering of air temperature; additionally, trees can absorb pollutants and decrease noise in urban environments [24,46].
Additionally, in comparison of the typically acceptable zone of outdoor temperatures (23–31 °C) and air velocities (0.9–1.3 m/s) defined above in the tropics in summer, longitudinal data monitored in pattern types 1, 3, and 4 in HCMC during warm summer were grouped into variations of temperature and wind flow (Table 4). In the three urban structural groups studied, the percentage of ambient temperatures within such thermal range was the lowest in pattern type 3, while the proportion was the highest in pattern types 4 + 5 + 6. Despite the larger percentage of temperatures recorded within the limits of 23–31 °C, a great number of warmer temperatures also shows the potential of urban discomfort for occupants in the daytime in all the three groups of urban forms. The interventions of encouraging/enabling better air movement, coupled with evaporative cooling techniques and shading provided by trees, can bring mitigation of such urban discomfort [24].
Considering four airspeed variations (<0.9 m/s—unacceptable, 0.9–1.3 m/s—minimum values to remain comfort, 1.3–2.5 m/s—still acceptable, and >2.5 m/s—potential draught) found by Ng and Cheng (2012) in Hong Kong, although wind velocities over the pedestrian level in Group 2 were calmer compared with the settlements of other urban types, the majority of airflow values fell into the acceptable range from 0.9 to 2.5 m/s. Pedestrians experienced stronger wind environments in certain pattern types, particularly in the neighbourhoods of pattern types 1 and 2, with 48% of airspeeds greater than 2.5 m/s. Much high external wind speeds can result in occupant dissatisfaction. However, to find the optimum acceptable airspeed in urban environments around residences in HCMC, and more generally in Vietnam, requires further more detailed field studies on human sensations.
Using the two sample sites, the numerical analyses by ENVI-met were used to interpret the thermal performance around the shophouse buildings in HCMC throughout the year. The urban constituents and spatial structures have significant influences on the outdoor climate. Within the residential blocks of pattern type 2, which are characterised by low construction density, homogeneous architecture, regular road pattern, road width above 10 m, and medium planting density, the thermal conditions outdoors show the advantages of airflows, whereas the external air temperatures can be constantly high over almost the whole year. One of the possible solutions can be planting: an increase of shade trees with appropriate height and canopy not only prevents solar absorption on the wide road surface by increased shading, but also controls wind flows through buildings [24]. Therefore, landscape strategies may be supportive to improve outdoor comfort within the urban areas having similar identities to sample 1. On the other hand, the thermally comfortable environment around ‘shophouse’ neighbourhoods as in sample 2 may be difficult to achieve in practice and requires more consideration.
The insights of environmental characteristics within settlements gathered from the research presented in this study show that the current design and planning of those urban patterns so far categorised do not properly provide outdoor environmental satisfaction for occupants. Even new residential areas, formally planned with lower densities, appropriate building archetypes, and integrated public facilities compared with the highly compact settlements existing in central districts, still fail to provide comfort.
According to the measurements of wind velocities at the pedestrian level of the settlements studied, although the exterior wind environment of pattern type 1, 2, and 7 neighbourhoods, which are formally planned, was more comfortable than that in the regions of other urban patterns (pattern types 3, 4, 5, and 6), it might be that some imperfections in the planning of such settlements result in unacceptable airspeeds for pedestrians.
In order to address these deficiencies, the principles of urban design, for example, road pattern, spacing, building height and density, vegetation, and ratio and location of open spaces, should be considered carefully in the relationship with the ambient environment to create an outdoor climate satisfactory for pedestrians. This is also necessary to create outdoor environments that can benefit from the associated indoor climate in housing planning in HCMC and Vietnam more generally.
5. Conclusions
The study confirms thermal discomfort in exterior climates in cities of the tropics such as HCMC. This is associated with urban development and human activities and is likely to subsequently affect indoor comfort and lead to higher levels of energy use. The field measurements show the existence of heat islands in macro-neighbourhoods across the city. The unplanned and planned development of compact urban areas may result in warmer conditions and reduced natural wind flows. The outdoor environments were thermally uncomfortable owing to observations of high air temperatures and low air velocities across the majority of the city.
At the micro-scale of housing urban blocks, categorised into a morphological system, the spatial planning factors have significant impacts on the environmental conditions around buildings in terms of temperature, humidity, and wind distribution. Variations in microclimate were found from results of field studies and from computer simulation; these seemed to be linked to different urban morphologies present in the city. Through on-site observations at the pedestrian level, the deviation of physical parameters between the urban types includes 1.5 °C of air temperature, 7% of humidity, and 0.3 m/s of wind speed in summer. Meanwhile, monitoring the outdoor climate in pattern type 1, 3, and 4 during hot months also revealed differences in air temperature (2 °C) and air velocity (2 m/s) between those types. The more satisfactory environment was found in area pattern types 1, 2, and 7.
The changing urban environment accelerates discomfort for people in both indoor and outdoor environments. Pleasant environments and comfort outdoors can be improved through reducing impacts of heat and improving wind flow. The provision of canopies, shading by vegetation, and encouragement of green areas is beneficial, as these decrease impacts of solar radiation and ameliorate heat by evapotranspiration of plants, and additionally encourage convective ventilation. However, the characteristics of plants and the ratio and location of green areas within settlements should be considered carefully. Additionally, the appropriate building pattern (road geometry and spacing) and density within dwelling blocks can contribute to cooling effects by allowing/encouraging air movement or by changing/manipulating the direction of prevailing winds passing through the urban layouts.
It should also be possible to improve and optimize outcomes, taking more account of both wind speed and directions together. The complexity involved in making numerous measurements at the same time was beyond the resources of the authors, though they suggest that CFD models might be created in the future to aid and support this analysis.
The results of the study encourage practitioners (planners, urban designers, and architects) to consider the urban microclimate and to find the correlation between changes in the outdoor climate and interior environment at the beginning of the design process. Knowledge of urban conditions and environmental characteristics of the common residential neighbourhoods can be systematised according to urban morphologies. Further investigations carried out simultaneously and other shophouse urban forms would facilitate an even better analysis. The study can also be expanded in neighbourhoods of different municipal functions. In addition, systematic comfort surveys for pedestrians would offer the potential to find correlations between climate and human thermal sensations.
The paper has developed and expanded research on physical conditions and urban climate around the exterior of areas of shophouse buildings—a design that is a vernacular housing type in Vietnam and SE Asia—as well as within their urban morphologies. The authors suggest that the current study’s findings in HCMC can be used as a reference to review and apply in other tropical cities in Vietnam and SE Asia, where there are many similarities of the dominance of shophouse buildings, planning, and climate.
Author Contributions
Conceptualization, H.T.D. and A.P.; Methodology, H.T.D; Software, H.T.D; Validation, H.T.D. and Adrian Pitts; Formal Analysis, H.T.D.; Investigation, H.T.D.; Resources, H.T.D. and A.P.; Data Curation, H.T.D.; Writing–Original Draft Preparation, H.T.D.; Writing–Review & Editing, Adrian Pitts; Visualization, H.T.D.; Supervision, Adrian Pitts; Project Administration, A.P.; Funding Acquisition, H.T.D. All authors have read and agreed to the published version of the manuscript.
Funding
This research was funded by the Vietnamese Government and by the British Council through a Newton Fund Scholarship ref VN17 911.
Acknowledgments
The authors would like to acknowledge the financial support of the Vietnamese Government, and the Newton Fund and the British Council. We also thank a colleague, Vi Ho, who has been a Ph.D. researcher at the University of Nottingham, UK for her help in the simulations using ENVI-Met.
Conflicts of Interest
The authors declare no conflict of interest.
References
- Fanger, P.O. Thermal Comfort: Analysis and Applications in Environmental Engineering; Danish Technical Press: Copenhagen, Denmark, 1970. [Google Scholar]
- Humphreys, M. Outdoor temperatures and comfort indoors. Batim. Int. Build. Res. Pr. 1978, 6, 92–105. [Google Scholar] [CrossRef]
- Brager, G.S.; de Dear, R.J. Thermal adaption in the built environment—A literature review. Energy Build. 1998, 27, 83–96. [Google Scholar] [CrossRef] [Green Version]
- De Dear, R.; Brager, G.S. Thermal comfort in naturally ventilated buildings: Revisions to ASHRAE Standard 55. Energy Build. 2002, 34, 549–561. [Google Scholar] [CrossRef] [Green Version]
- Nicol, F.; Humphreys, M. Adaptive thermal comfort and sustainable thermal standards for buildings. Energy Build. 2002, 34, 563–572. [Google Scholar] [CrossRef]
- Nicol, F. Adaptive comfort. Build. Res. Inf. 2011, 39, 105–107. [Google Scholar] [CrossRef]
- Wong, N.H.; Yu, C. Study of green areas and urban heat island in a tropical city. Habitat Int. 2005, 29, 547–558. [Google Scholar] [CrossRef]
- Allegrini, J.; Dorer, V.; Carmeliet, J. Influence of morphologies on the microclimate in urban neighbourhoods. J. Wind Eng. 2015, 144, 108–117. [Google Scholar] [CrossRef]
- Szokolay, S.V. Thermal comfort in the warm-humid tropics. In ANZAScA’97—Principles and Practice; Brisbane, Australia, 1997; Available online: http://anzasca.net/paper/thermal-comfort-in-the-warm-humid-tropics/ (accessed on 20 May 2016).
- Nikolopoulou, M.; Lykudis, S. Thermal comfort in outdoor urban spaces: Analysis across different European countries. Build. Environ. 2006, 41, 1455–1470. [Google Scholar] [CrossRef] [Green Version]
- Ng, E.; Cheng, V. Urban human thermal comfort in hot and humid Hong Kong. Energy Build. 2012, 55, 51–65. [Google Scholar] [CrossRef]
- Mayer, H.; Hoppe, P. Thermal comfort of man in different urban environments. Theor. Appl. Climatol. 1987, 38, 43–49. [Google Scholar] [CrossRef]
- Spagnolo, J.; de Dear, R. A field study of thermal comfort in outdoor and semi-outdoor environments in subtropical Sydney Australia. Build. Environ. 2003, 38, 721–738. [Google Scholar] [CrossRef] [Green Version]
- Johansson, E.; Yahia, M.W.; Arroyo, I.; Bengs, C. Outdoor thermal comfort in public space in warm-humid Guayaquil, Ecuador. Int. J. Biometeorol. 2017, 62, 387–399. [Google Scholar] [CrossRef] [PubMed] [Green Version]
- Nikolopoulou, M.; Baker, N.; Steemers, K. Thermal comfort in outdoor urban spaces: Understanding the human parameter. Sol. Energy 2001, 70, 227–235. [Google Scholar] [CrossRef]
- Bakar, A.; Gadi, M.B. Urban Outdoor Thermal Comfort of the Hot-Humid Region. In Proceedings of the MATEC Web of Conferences, Kuala Lumpur, Malaysia, 7–8 March 2016. [Google Scholar]
- Villadiego, K.; Velay-Dabat, M.A. Outdoor thermal comfort in a hot and humid climate of Colombia: A field study in Barranquilla. Build. Environ. 2014, 75, 142–152. [Google Scholar] [CrossRef]
- Srivanit, M.; Auttarat, S. Thermal Comfort Conditions of Urban Spaces in A Hot-Humid Climate in Chiang Mai City, Thailand. In Proceedings of the 9th International Conference on Urban Climate, Toulouse, France, 20–24 July 2015. [Google Scholar]
- Lin, T.P. Thermal perception, adaptation and attendance in a public square in hot and humid regions. Build. Environ. 2009, 44, 2017–2026. [Google Scholar] [CrossRef]
- Lin, T.P.; de Dear, R.; Hwang, R.L.; Matzarak, A. Prediction of Thermal Acceptability in Hot-Humid Outdoor Environments in Taiwan. In Proceedings of the Seventh International Conference on Urban Climate, Yokohama, Japan, 29 June–3 July 2009. [Google Scholar]
- Lin, T.P.; de Dear, R.; Hwang, R.L. Effect of thermal adaptation on seasonal outdoor thermal comfort. Int. J. Climatol. 2011, 31, 302–312. [Google Scholar] [CrossRef]
- Asfour, O.S. Prediction of wind environment in grouping patterns of housing blocks. Energy Build. 2010, 42, 2061–2069. [Google Scholar] [CrossRef]
- Rajagopalan, P.; Lim, K.C.; Jamei, E. Urban heat island and wind flow characteristics of a tropical city. Sol. Energy 2014, 107, 159–170. [Google Scholar] [CrossRef]
- Tran, G.V.; Tran, D.B. Cultural monography of Ho Chi Minh City. In History, Ho Chi Minh City; The Ho Chi Minh City Publishing House: Ho Chi Minh City, Vietnam, 1998. [Google Scholar]
- CPHSC. The 2009 Vietnamese Population and Housing Census: Major Findings; Central Population and Housing Census Steering Committee: Hanoi, Vietnam, 2010. [Google Scholar]
- Statistics Office. Population and Labour; Statistics Office of Ho Chi Minh City: Ho Chi Minh City, Vietnam, 2015. [Google Scholar]
- Asian Development Bank. Ho Chi Minh City Adaptation to Climate Change; Asian Development Bank: Mandaluyong, Philippines, 2010. [Google Scholar]
- Tran, V.T.; Ha, B.D.X. Study of the impact of urban development on surface temperature using remote sensing in Ho Chi Minh City, Southern Vietnam. Geogr. Res. 2010, 48, 86–96. [Google Scholar]
- Tong, S.; Wong, N.H.; Tan, C.L.; Jusuf, S.K.; Tan, E.; Ignatius, M. Impact of urban morphology on microclimate and thermal comfort in China. Sol. Energy 2017, 155, 212–223. [Google Scholar] [CrossRef]
- Downes, N.K.; Storch, H. The Urban Structure Types of Ho Chi Minh City, Vietnam; Brandenburgishe Technische Universität, IKMZ: Cottbus, Germany, 2014. [Google Scholar]
- IBST. Vietnam Building Code: Natural Physical & Climatic Data for Construction; Ministry of Construction: Hanoi, Vietnam, 2009.
- Pham, N.D. Bioclimatic Architecture: Bioclimatic Design in Built Environment of Vietnam; House of Construction: Hanoi, Vietnam, 2002. [Google Scholar]
- Storch, H.; Downes, N.; Katzschner, L.; Nguyen, X.T. Building resilience to climate change through adaptive land-use planning in Ho Chi Minh City, Vietnam. Resilient Cities 2011, 349–363. [Google Scholar] [CrossRef]
- Cox, W. The Evolving Urban Form: Ho Chi Minh City (Saigon). Available online: http://www.newgeography.com/content/002738-the-evolving-urban-form-ho-chi-minh-city-saigon (accessed on 22 March 2012).
- Thuc, T.; Nguyen, T.V.; Huynh, H.T.L.; Mai, K.V.; Nguyen, H.X.; Doan, P.H. Climate Change and Sea Level Rise Scenarios for Vietnam; MoNRE: Hanoi, Vietnam, 2016.
- Downes, N.; Rujner, H.; Storch, H.; Schmidt, M. Spatial Indicators for Assessing Climate Risks and Opportunities within the Environment of Ho Chi Minh City, Vietnam. In Proceedings of the 47th ISOCARP Congress: Liveable Cities: Urbanising World. Meeting the Challenges, Wuhan, China, 24–28 October 2011. [Google Scholar]
- Le, M.T.T. The Form and Development of the Urban Street Houses at the Moment; Ho Chi Minh City University of Architecture: Ho Chi Minh City, Vietnam, 1999. [Google Scholar]
- Dam, K.H. The Urban Street House—History and Development Tren in Vietnam Urban Context; Ho Chi Minh City University of Architecture: Ho Chi Minh City, Vietnam, 2011. [Google Scholar]
- Moon, K.; Downes, N.; Rujner, H.; Storch, H. Adaption of the Urban Structure Type Approach for Vulnerability Assessment of Climate Change Risks in Ho Chi Minh City, Vietnam; Porto, Portugal, 2009; Available online: https://www.semanticscholar.org/paper/Adaptation-of-the-Urban-Structure-Type-Approach-for-Moon-Downes/ (accessed on 14 December 2015).
- MOC. TCXDVN 306:2004—Dwelling and Public Buildings—Parameters for Microclimates in the Room; Ministry of Construction: Hanoi, Vietnam, 2004.
- Golany, G.S. Urban design morphology and thermal performance. Atmos. Environ. 1996, 30, 455–465. [Google Scholar] [CrossRef]
- Vietnam Standards and Quality Institute (VSQI). TCVN 7438:2004 Ergonomics—Moderate Thermal Environments—Determination of the PMV and PPD Indices and Specification of the Conditions for Thermal Comfort; Ministry of Science and Technology: Hanoi, Vietnam, 2005.
- Nicol, F. Adaptive thermal comfort standards in the hot-humid tropics. Energy Build. 2004, 36, 628–637. [Google Scholar] [CrossRef]
- Tanabe, S.-I.; Kimura, K.-I. Effects of air temperature, humidity, and air movement on thermal comfort under hot and humid conditions. Ashrae Trans. 1994, 100, 953–969. [Google Scholar]
- Gong, N.; Tham, K.; Melikov, A.K.; Wyon, D.P.; Sekhar, S.C.; Cheong, K.W. The acceptable air velocity range for local air movement in the tropics. HVAC&R Res. 2006, 12, 1065–1074. [Google Scholar]
- Johansson, E.; Emmanuel, R. The influence of urban design on outdoor thermal comfort in the hot, humid city of Colombo, Sri Lanka. Int. J. Biometeorol. 2006, 51, 119–133. [Google Scholar] [CrossRef]
Figure 1.
A sample of modern shophouse dwellings in Ho Chi Minh City (HCMC) (No 6, No 41 str, Dist 4, HCMC).
Figure 1.
A sample of modern shophouse dwellings in Ho Chi Minh City (HCMC) (No 6, No 41 str, Dist 4, HCMC).

Figure 2.
Five shophouse types found in HCMC: (1) rudimental shophouse; (2) traditional shophouse; (3) new shophouse; (4) commercial shophouse; and (5) row house.
Figure 2.
Five shophouse types found in HCMC: (1) rudimental shophouse; (2) traditional shophouse; (3) new shophouse; (4) commercial shophouse; and (5) row house.

Figure 3.
Proportions of urban housing pattern types in the research.

Figure 4.
Examples of urban structure pattern types in the study ((1) pattern type 1; (2) pattern type 2; (3) pattern type 3; (4) pattern types 4, 5, and 6; and (7) pattern type 7) (source: Map data ©2018 Google).
Figure 4.
Examples of urban structure pattern types in the study ((1) pattern type 1; (2) pattern type 2; (3) pattern type 3; (4) pattern types 4, 5, and 6; and (7) pattern type 7) (source: Map data ©2018 Google).

Figure 5.
Netatmo weather station (outdoor and indoor units, wind gauge).

Figure 6.
Distribution of air temperature by urban pattern types.

Figure 7.
Hourly distribution of outdoor temperature in three shophouse urban types 1, 3, and 4.

Figure 8.
Distribution of relative humidity in different pattern type groups.

Figure 9.
Air velocity shown as frequency distribution (a) and by variation in urban pattern type (b).
Figure 9.
Air velocity shown as frequency distribution (a) and by variation in urban pattern type (b).

Figure 10.
Hourly distribution of air velocity at three urban types (1, 3, and 4) in summer 2017.

Figure 11.
Wind environment for pattern type 1.

Figure 12.
Wind environment for pattern type 3.

Figure 13.
Wind environment for pattern type 4.

Figure 14.
Urban pattern of two samples: Type 2 (1), Type 3 (2).

Figure 15.
Distribution of air temperature of the two studied urban pattern types.

Figure 16.
Air pattern of the two studied urban pattern types.


Table 1.
Summary of urban structure pattern types of ‘shophouses’ (source: Downes & Storch, [30]).
Table 1.
Summary of urban structure pattern types of ‘shophouses’ (source: Downes & Storch, [30]).
| Type | ‘Shophouse’ Category | No. of Blocks | Building Ratio | Surface Area (ha) |
|---|---|---|---|---|
| 1 | Regular new community | 62 | 60 | 392 |
| 2 | Regular new | 100 | 70 | 450 |
| 3 | Regular + narrow streets | 592 | 75 | 2063 |
| 4 | Irregular high density | 425 | 78 | 1602 |
| 5 | Irregular + yards | 794 | 57 | 4444 |
| 6 | Irregular + regular | 23 | 69 | 350 |
| 7 | Regular + yards | 153 | 44 | 2020 |
| 8 | Irregular clustered | 741 | 30 | 5490 |
| 9 | Irregular scattered | 815 | 28 | 6990 |
| 10 | Irregular + large gardens | 2342 | 5 | 17,133 |
| 11 | Irregular temporary | 85 | ||
| 12 | Shophouse + industry | 222 | 74 | 1292 |
Table 2.
The outdoor environment in summer over 59 cases.
| Variable | N | Min. | Max. | Mean | Std. Dev. |
|---|---|---|---|---|---|
| Air temperature (°C) | 59 | 29.5 | 37.8 | 32.6 | 1.63 |
| Relative humidity (%) | 59 | 41 | 79 | 61 | 8.06 |
| Air velocity (m/s) | 59 | 0.07 | 0.9 | 0.32 | 0.19 |
Table 3.
The mean outdoor environment found by urban pattern types.
| Urban Type | Mean Air Temperature (°C) | Mean Relative Humidity (%) | Mean Air Velocity (m/s) |
|---|---|---|---|
| Group 1 (Type 1+2) | 32.7 (SD 1.5) | 64 (SD 9.2) | 0.4 (SD 0.13) |
| Group 2 (Type 3) | 33.7 (SD 1.67) | 57 (SD 5.94) | 0.35 (SD 0.21) |
| Group 3 (Type 4+5+6) | 32.2 (SD 1.52) | 61 (SD 7.78) | 0.25 (SD 0.14) |
| Group 4 (Type 7) | 32.6 (SD 1.92) | 60 (SD 10.0) | 0.55 (SD 0.27) |
Table 4.
The mean outdoor environment found by urban types.
| Urban Type | Air Temperature (°C) | Air Velocity (m/s) | |||||
|---|---|---|---|---|---|---|---|
| T < 23 °C | 23 °C < T < 31 °C | T > 31 °C | < 0.9 | 0.9–1.3 | 1.3–2.5 | >2.5 | |
| Group 1 (Type 1+2) | 0 | 61% | 39% | 9% | 24% | 19% | 48% |
| Group 2 (Type 3) | 0 | 57% | 43% | 3% | 93% | 4% | 0% |
| Group 3 (Type 4+5+6) | 0 | 64% | 36% | 24% | 46% | 17% | 13% |
© 2020 by the authors. Licensee MDPI, Basel, Switzerland. This article is an open access article distributed under the terms and conditions of the Creative Commons Attribution (CC BY) license (http://creativecommons.org/licenses/by/4.0/).
Share and Cite
MDPI and ACS Style
Dang, H.T.; Pitts, A. Urban Morphology and Outdoor Microclimate around the “Shophouse” Dwellings in Ho Chi Minh City, Vietnam. Buildings 2020, 10, 40. https://0-doi-org.brum.beds.ac.uk/10.3390/buildings10030040
AMA Style
Dang HT, Pitts A. Urban Morphology and Outdoor Microclimate around the “Shophouse” Dwellings in Ho Chi Minh City, Vietnam. Buildings. 2020; 10(3):40. https://0-doi-org.brum.beds.ac.uk/10.3390/buildings10030040
Chicago/Turabian StyleDang, Hung Thanh, and Adrian Pitts. 2020. "Urban Morphology and Outdoor Microclimate around the “Shophouse” Dwellings in Ho Chi Minh City, Vietnam" Buildings 10, no. 3: 40. https://0-doi-org.brum.beds.ac.uk/10.3390/buildings10030040
Note that from the first issue of 2016, this journal uses article numbers instead of page numbers. See further details here.