1. Introduction
In a perspective of sustainable development, the Europe 2020 strategy aims for a control of environmental impacts as an instrument of European economic growth. On such an issue, the construction sector is subjected to a particular attention: with reference to recent information of International Energy Agency (IEA), the existing building stock is responsible for 50% of material depletion and 40% of energy consumption, generates 36% of greenhouse gases (GHG) emissions and a third of the total waste [
1]. Moreover, people spend 90% of their time in buildings that should guarantee the highest level of safety, comfort and wellness [
2].
As a consequence of the recent economic crisis of the construction sector in all European countries, the number of new buildings is significantly decreased, even if by 2050 2.6 billion people will require new housing, work places and infrastructure due to rapid urbanization and population growth [
2]. With respect to this, the renovation of existing buildings through retrofit is an effective strategy: the overall building performance is improved and additions of new volumes and surfaces are allowed, without encountering any demolition and rebuilding, which has proved to have higher environmental impacts [
3,
4]. This challenge calls research for improvements to established design procedures and construction approaches, which could be more effective and support the achievement of a net carbon neutral society.
In the last few decades, methodologies have been developed to assess environmental and economic impacts, such as life-cycle approaches, used in the building sector especially in the context of building certification labelling systems. They support the decision-making process and represent an instrument for developing and applying new and more sustainable materials, technologies and measures. Recently, the results’ transparency and the trustworthiness of such analyses have been discussed. One of the debated topics is the influence of uncertainties and the importance to include them in the analysis to improve the robustness of life-cycle assessment (LCA) and to allow a better interpretation and communication of the results [
5]. Another important aspect is the inclusion of unexpected events such as earthquakes: in a context of buildings mostly outdated (almost 40% [
2]) and with seismic vulnerabilities, such events could lead in the worst case scenario to irreversible consequences such as high reconstruction costs, environmental damage and lost human lives. On the other hand, users could implement preventive renovation measures that could minimize the environmental impacts and final costs, if such measures have been conceived following a life-cycle thinking perspective. Thanks to these, the building can extend or even restart its own service life [
6].
With regard to the methodological point of view, standard life-cycle (or so called “static”) approaches do neither consider dynamic effects, such as impact profile variation in time, service life variation, technological improvements and subject willingness, nor sources of uncertainty, such as unexpected events, that might lead to service-life reduction. Thus, stakeholders might be wrongly supported leading to miscalculation or missing information on the building life-cycle. Given the above, the focus of the paper is to address a methodology for the inclusion of seismic hazard and building structural quality enhancement: in life-cycle analyses carried out under consideration of probabilistic approaches in order to provide a tool for decision making on renovation measures.
2. Life-Cycle Assessment (LCA) State of the Art
LCA, defined as “an evaluation of the inputs and outputs of a product system”, is a widely applied methodology whose framework is provided in standards ISO 14040 and ISO 14044. The environmental assessment of products is conducted thought 4 steps, namely goal and scope, life-cycle inventory (LCI), life-cycle impact assessment (LCIA) and a final results interpretation [
7,
8]. By contrast with industrial processes, buildings cannot be standardized as easily and several issues cause a particular complexity of the assessment. Among them, we mention:
the long lifespan of entire building (50–100 years);
the shorter, but varying lifespan of building parts and components;
the complex interaction and interconnection of numerous materials and processes;
the unique character of each building;
the building evolution over time due to maintenance, refurbishment or renovation measures.
Most of them cannot be exactly predicted during the planning and design phase: the long lifespan and user behavior and choices can especially require more assumptions and, if neglected, may question the environmental performance and the results’ credibility [
5]. For such reasons, research on LCA has focused on uncertainties and their effects. The aforementioned standards address uncertainties analysis within the interpretation phase without any specifications or any systematic procedures and therefore many studies provide different approaches [
9,
10].
In literature there are several uncertainties classifications which consider common sources (i.e., data comprehensiveness, subjective factors, temporal or local conditions) which may all affect the results of LCA studies [
11,
12,
13]. For the investigated case, uncertainty due to methodology and external factors, which are the focus of this work, have been prioritized depending on their influence on results coming from environmental assessment. Further sources are assumed negligible.
2.1. Uncertainties Due to Methodology
As for many mathematical models, LCA does not refrain from approximation: the basis of such approximation is related to a linearized calculation of the vector
r of environmental impacts according to (1):
where
Q is the matrix of characterization factors,
H is the environmental intervention matrix of emissions per unit process of product systems,
G is the technology matrix representing the inter-process flows needed for functioning of the product system, and
u is the external supply vector, related to the functional unit [
11,
14].
Such a vector cannot always express the variability given, i.e., spatial and temporal factors, and consequently this can mislead final decisions [
15]. In order to solve this issue and improve the reliability in LCA, the ISO norms recommend technical standards which lead to the implementation of input variability in form of simple probability distribution. In addition to this, a global sensitivity analysis is generally accepted for a comprehensive uncertainty analysis [
14].
Beside such procedures, probabilistic and sampling-based methods have been developed and applied: while sensitivity analysis tries to characterize output uncertainty by apportioning it to its input constituents, probabilistic methods such as Bayesian inference, Gaussian process (GP), and polynomial chaos expansion methods characterize and propagate uncertainties throughout the system to outputs and quantify them [
16].
Among them, the Monte Carlo sampling is mostly applied, where parameters are provided dependently from probability functions and the output vector is calculated. Simulations are repeated thousands of times and the results are provided in the form of probability distribution rather than a unique value. Especially in a LCA framework, with an adequate uncertainties quantification, efforts can be focused on collecting more (accurate) information on LCA phases that contribute the most to the LCA output. It has been shown that the trade-off between parameter uncertainty and model-form uncertainty can help in determining an optimal model to reduce the overall uncertainty [
17].
2.2. Design Changes Due to External Factors
The complexity of a building design is due to a variety of factors which influence the final decision during the whole planning process. Some of them may induce design changes even during the operating phase of a building [
18]: several studies tried to identify all of them and agree on a distinction between internal and external factors [
18,
19,
20,
21]. By contrast with internal factors, which could be included during the project management, external factors are parties not directly involved. In addition to this, none of all external factors can be foreseen and consequently a prediction may be possible only through statistical methodologies [
22]. As reported by Yana et al., they can be distinguished in [
18]:
Political and economic matters can dictate policies and regulations; economic fluctuations (price increase, inflations etc.) can furthermore influence the decision making. Requests coming from third parties (i.e., neighborhood) concern mostly end users and regulatory bodies. A technological advancement can be helpful by promoting more performing and optimized products. Lastly, the natural environment involves a multitude of matters: weather and geological conditions or natural disasters that are hardly predictable. The latter, even without a high frequency, represent a still open issue for the engineering design criteria. A common example is earthquakes, which are included in the overall building design for seismic-prone regions [
23].
By a LCA-methodological point of view, such issues have been handled so far in different ways.
The problem is usually solved a priori, by considering a seismic resistant building and consequently neglecting further vulnerabilities. The impact related to seismic hazards is limited to renovation measures, which are carried out in pre-specified periods of the building operating phase [
24]. Even if capable of bringing an idea about the impact of the single intervention, such examples do not envisage unforeseen future losses and the random nature of seismic events.
In FEMA’s Advanced Engineering Building Module (AEBM) [
25] and in PEER-PBEE studies [
26], probabilistic methodologies are investigated rather than the abovementioned deterministic one. On the basis of a probabilistic seismic hazard assessment (see
Section 3.1), seismic losses are evaluated and the environmental impacts expressed by a repair or retrofit measure belonging to a predetermined set [
25,
26]. As already noticed by Calvi et al., such approaches do not take into account a possible building performance upgrade over time of the buildings lifecycle [
27].
In general, all the mentioned applications do not include user subjectivity, which, depending on its own economic availability and aesthetical preference, represents an active actor within the choice of renovation measures.
2.3. Uncertainties in Service Life
In the field of life-cycle assessment, there is wide consensus on the consideration of a service lifespan coming from structural and seismic design requirements: building components are designed for a service life between 30–70 years and then refurbished or substituted, while the building is planned with a 50 years’ service life (Design working life category 4: Building structures and other common structures [
28]). The structure shall be designed such that deterioration over the considered building lifespan does not impair the structural performance, considering regular maintenance. After the working life, the structure needs to be checked for possible deterioration and retrofitted or dismantled. Such assumption differs however from information coming from building stock data. According to the latest report of Building Performance Institute Europe (BPIE), a substantial share of the existing building stock in Europe is older than 50 years and has not always been subjected to renovation measures to enhance the overall performance or many of the buildings still in use are hundreds of years old [
29].
With regard to building renovation works, the cost of the intervention is a relevant factor which could compromise the definition of the plan for necessary measures. Therefore, social and technical benefits have to find a compromise with the national economic situation and the fund availability. A model for works planning can be based on predicting the time when building critical elements may reach degradation levels that exceed acceptable values [
30]. Nevertheless, even a degradation level cannot be scientifically defined or a service life cannot be assessed by deterministic approaches. Therefore, in the literature, probabilistic or engineering methods which combine both deterministic and probabilistic ones, such as the factor method (ISO:15686-1) [
31], have been developed but not frequently applied by architects and planners.
Eurocodes [
28] state that to achieve an adequately durable structure, the designer should take into account various aspects such as the intended or foreseeable use of the building, the expected environmental conditions, the structural detailing, and the intended maintenance during the designed working life, among others. However, in some conditions, the knowledge of such factors has changed during the building life: for instance, different and not predictable use of the building may have been arisen since the initial design, the knowledge of the environmental factors, such as seismic hazard, has changed during time due to the increased availability of earthquake data, and an increased knowledge of the structural and material performance has been available due to the advancement of scientific research.
All these issues contribute to increasing uncertainties in the working life and, consequently, in the impacts assessment.
3. Method: Probabilistic life-cycle analyses with Inclusion of Seismic Hazard Model
The presented methodology consists in a probabilistic model enriched by factors related to technological, economic and environmental changes, ensuring its flexibility over an extended building lifespan. The service life is dictated by using stage and user aware choices, and, especially for construction with significant structural vulnerabilities, by earthquakes.
The main steps are:
“As is” situation analysis. Investigations about the reference building (when t = 0, today’s situation), in order to verify its compliance with current building code, minimal requirements of design limit states and vulnerabilities.
Events choice. With particular respect to the geographical location, earthquakes with different magnitude and frequency are taken into account. The frequency is evaluated by Geophysics and Volcanology institutions on the basis of the classical probabilistic seismic hazard analysis (PSHA) model.
Decision tree set up. In the occurrence of earthquakes, different scenarios are considered. In the worst case, where the building will present a damage level greater than 40% of the building value, a demolition and a re-build will generally occur. Over time the reference building may be subjected to further improvements by user decision and under particular technological, environmental and economic conditions which influence intervention willingness.
Future scenarios analysis. Because of an eventual adjustment, the response to seismic loads (here called Building Quality—BQ) could be improved.
Probabilistic Model setting. A Monte Carlo sampling method is set up and all aforementioned considerations are included.
The inclusion of Probabilistic Seismic Hazard Analysis (PSHA) in life-cycle assessment (LCA) and life-cycle cost (LCC), while introducing more uncertainties in the analyses (e.g., aleatory and epistemic uncertainties related to the structural performance), provides a rational way to deal with them. In particular, accounting for unforeseen events such as earthquakes allows a more comprehensive LCA and LCC and to analyze the effects of events that could alter classic results.
3.1. Life-Cycle Impact Assessment (LCIA) and Cost (LCC) Method of Measurement
The total environmental impact and cost are calculated as the sum of impacts (2) and costs (3) recorded every year of the observation time of n years.
where
3.1.1. Construction Phase and Building Renovation Measures
Regarding the embodied carbon derived by the building production, replacement or refurbishment, a dynamic measurement has been considered, by adjusting the value at t = 1 year (i.e., at present) by using price increase rate and discount rate for cost analyses (5) and a
decarbonisation rate for the environmental assessment (4), which expresses technological advancements suitable to reduce environmental impacts due to manufacturing. The discount rate has been neglected in environmental analyses [
10].
where
/price increase rate (LCC)
3.1.2. End-of-Life
In this approach, the end-of-life (EoL) costs and environmental impacts are dictated by a final dismantling after 100 years’ analysis. As well as for the production, the value is corrected by taking into account average decarbonisation, price increase and discount rates [
10].
where
3.2. Seismic Hazard
3.2.1. Probabilistic Seismic Hazard Analysis (PSHA)
By contrast with other cases such as weather conditions, seismic events cannot be
forecast, but the current state of knowledge allows predictions: the available models are capable to address the likelihood of a seismic event [
32].
In order to maintain conservative assumptions, the Poisson Model is generally used for seismic hazard assessment to represent the occurrence rate of an earthquake through time-independent models. The probability density function is expressed as following:
where:
On the basis of this, Cornell developed the probabilistic seismic hazard analysis (PSHA), which is still nowadays used for deriving hazard curves and embedded into seismic design regulations [
33]. In PSHA the annual probability of exceedance of a ground motion
Y ≥ y is:
where:
is the activity rate of the ith-source of earthquakes
is the probability density function of earthquake magnitude
is the probability density function of source-to-site distance
is the ground motion shape uncertainty density function
[Y>y|m,r,ε] is the conditional probability that Y exceeds y, given m, r, ε
For simplicity, hazard curve and annual frequencies can be provided by seismologists (such as the Institute for Geophysics and Volcanology, INGV, in Italy) [
34]. For each geographical location different earthquake intensity, expressed for instance in terms of peak ground acceleration (PGA), are associated with their mean annual frequency of occurrence and, according to building design regulation, to a design limit state [
32,
35].
3.2.2. Inclusion of PSHA Method in Probabilistic LCA
In the present paper, the occurrence of a seismic event is taken into account by a Monte Carlo simulation. The building lifespan is subdivided into years and for each year the occurrence of an earthquake with a given intensity is considered by comparing a random value n
r with the earthquake occurrence probability P (λ) under the following conditions:
where:
The occurrence probability P(
λ) is the Probability Mass Function (PMF) for Poisson’s distribution (see Equations (10)–(12)). In this application only one seismic event (n = 1) is allowed in the considered time step, t = 1 year. Consequently, different earthquakes cannot occur simultaneously, and, if that is the case, only the highest intensity earthquake is considered. The generalized equation can be assumed here as following:
This assumption allows the evaluation of a yearly increases of environmental impacts and costs overall the building lifespan. Due to the discrete and limited number of the earthquake intensity levels, it is expected to observe scattered results in the cumulative distribution functions.
3.3. Life Duration of Building and Building Parts
For this analysis, a wider time duration of 100 years has been considered, in order to assume an extended service life of the whole building, where the structure is not highly damaged. While structural service life is dictated more dynamically by earthquake occurrence, non-structural building parts present in this application a pre-defined lifespan: every 30 years’ service life, their replacement takes place. The chosen building lifespan leads to the generation of 10,000 random value runs, i.e., 100 times the building lifespan.
4. Case Study
A case study has been selected as a proof of concept for the proposed methodology: an integrated structural and architectural renovation intervention, which can potentially improve the energy performance through further measures. An 8-storey apartment building is considered located in L’Aquila, a region of high seismicity in Italy, and designed for gravity loading, without accounting for seismic actions. Two different structural retrofit measures have been considered and analyzed. In this section, the results of a static and the proposed probabilistic LCA are reported and compared.
Table 1 shows the specification of the LCA analysis.
4.1. Static LCA
The LCA analysis has been carried out for the reference building and for the selected retrofit measures, specifically a diagrid system and shear walls. For both examples the modelling and the final impact evaluation have been realized with help of GaBi ts pc-tool [
37] and Generis software [
38], on the basis of environmental databases updated on 2019.
4.1.1. Rebuilding
Data collection has been made for the whole considered building and for each part of it. The stratigraphic information has been collected and included in the final model in GaBi ts software. For the End-of-Life of the building, a whole demotion has been envisaged with a rebuilding process. The new building will be considered equivalent to the old one in terms of geometry but with structural elements fully complying with current seismic regulations.
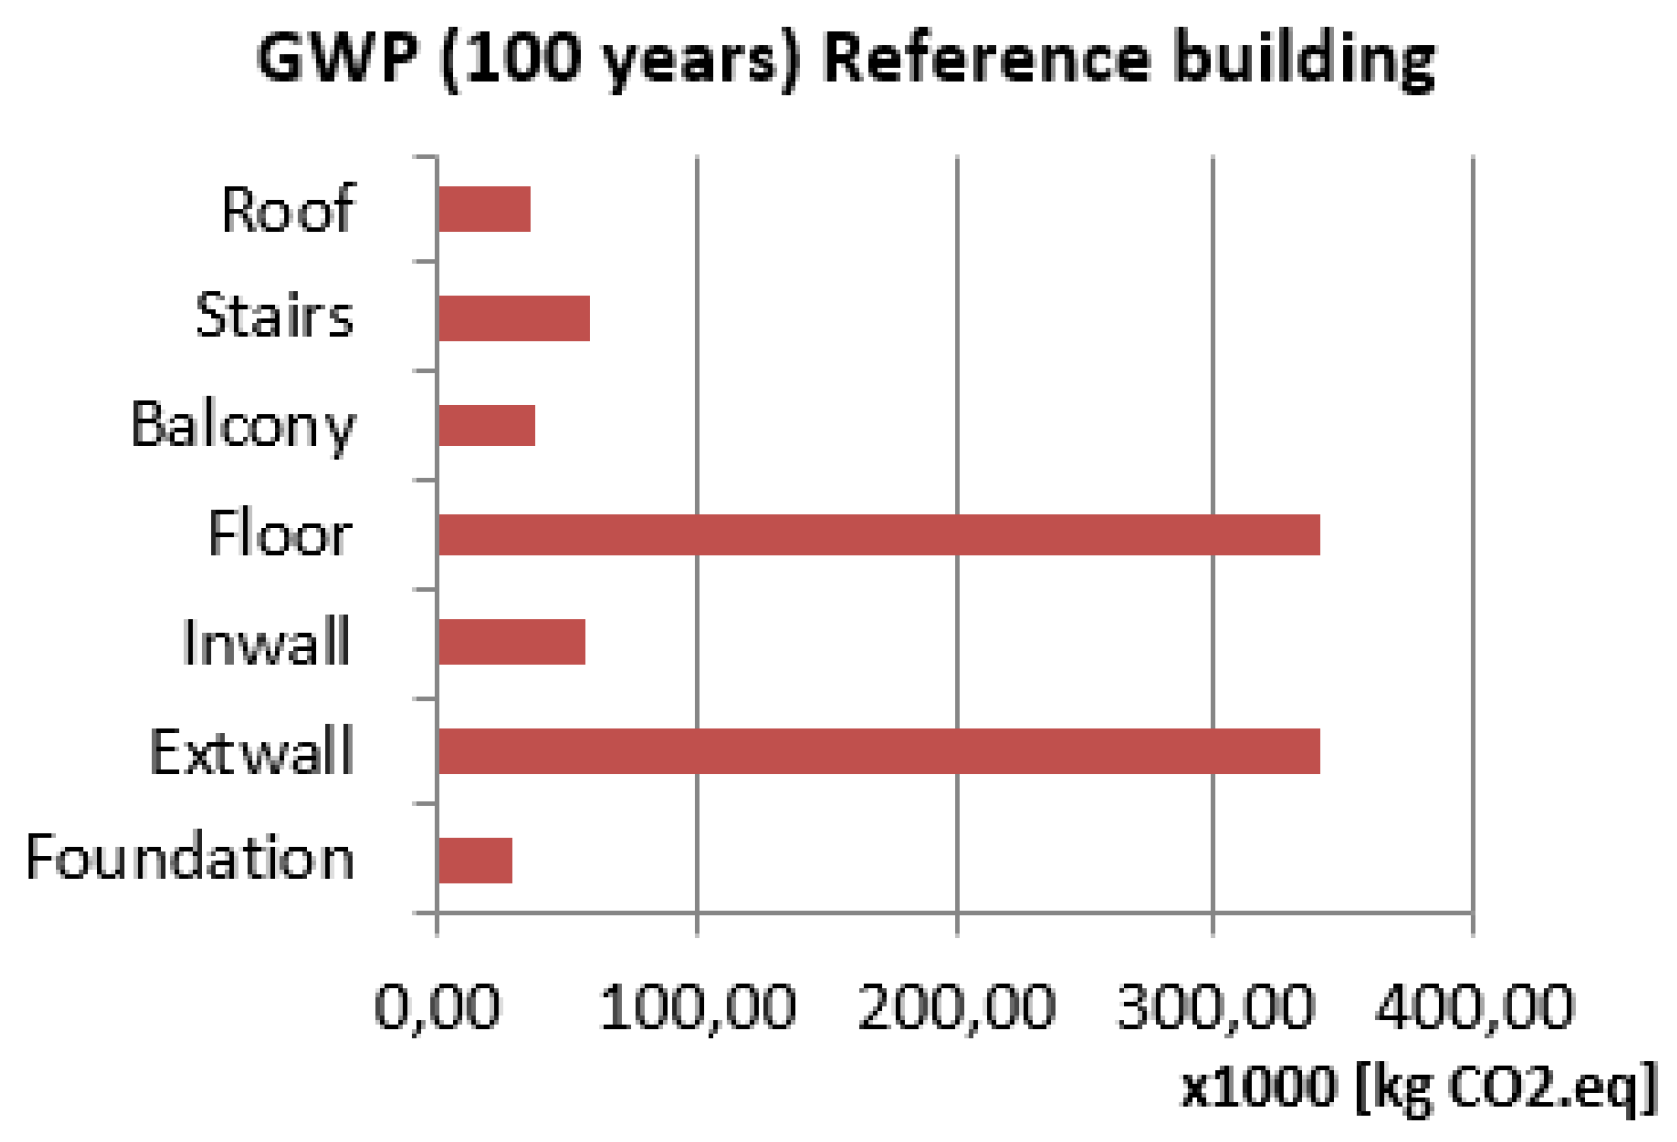
Life-Cycle Impact Assessment: according to the results of the impact assessment for global warming potential, 490 kg CO
2 eq./m
2 are calculated. Most of the environmental impacts are due to the construction process during which structural reinforced concrete (RC) elements are the most relevant (see
Figure 1). The calculated value does not differ too much from results of analyses carried out for new buildings in the Italian territory, which estimate 488.5 kg CO
2 eq./m
2 [
39]. Hence, for the rebuilding process the same LCIA result can be claimed valid.
Reconstruction Costs Assessment: the lack of precise information about manufacturing processes and further costs related to reconstruction of damaged buildings does not allow a direct calculation of the costs. An indirect evaluation is possible consulting likely reconstruction costs per net surface of RC buildings after strong earthquakes which include, e.g., professional fees, geotechnical tests, dismantling, strengthening and repair costs.
For most of the highly damaged RC buildings (usability rating class E according to Italian practice) following the recent earthquakes in L’Aquila on 2009, a mean unit cost for re-construction of 1300 €/m
2 net surface has been evaluated [
40,
41]. Demolition activities are, meanwhile, evaluated for RC buildings with 152 €/m
2 net surface [
42]. The discount due to the scrap steel of reinforcement bars has been considered negligible.
4.1.2. Replacement
The first renovation alternative consists in a substitution of the non-structural elements belonging to the external envelope and to the internal partition walls. The total emission derives by considering the production of the new elements and the dismantling of the old ones (see
Table 2). With regard to costs, lump-sum costs are derived by information from local authorities [
42] and evaluated as 245 €/m
2 net surface.
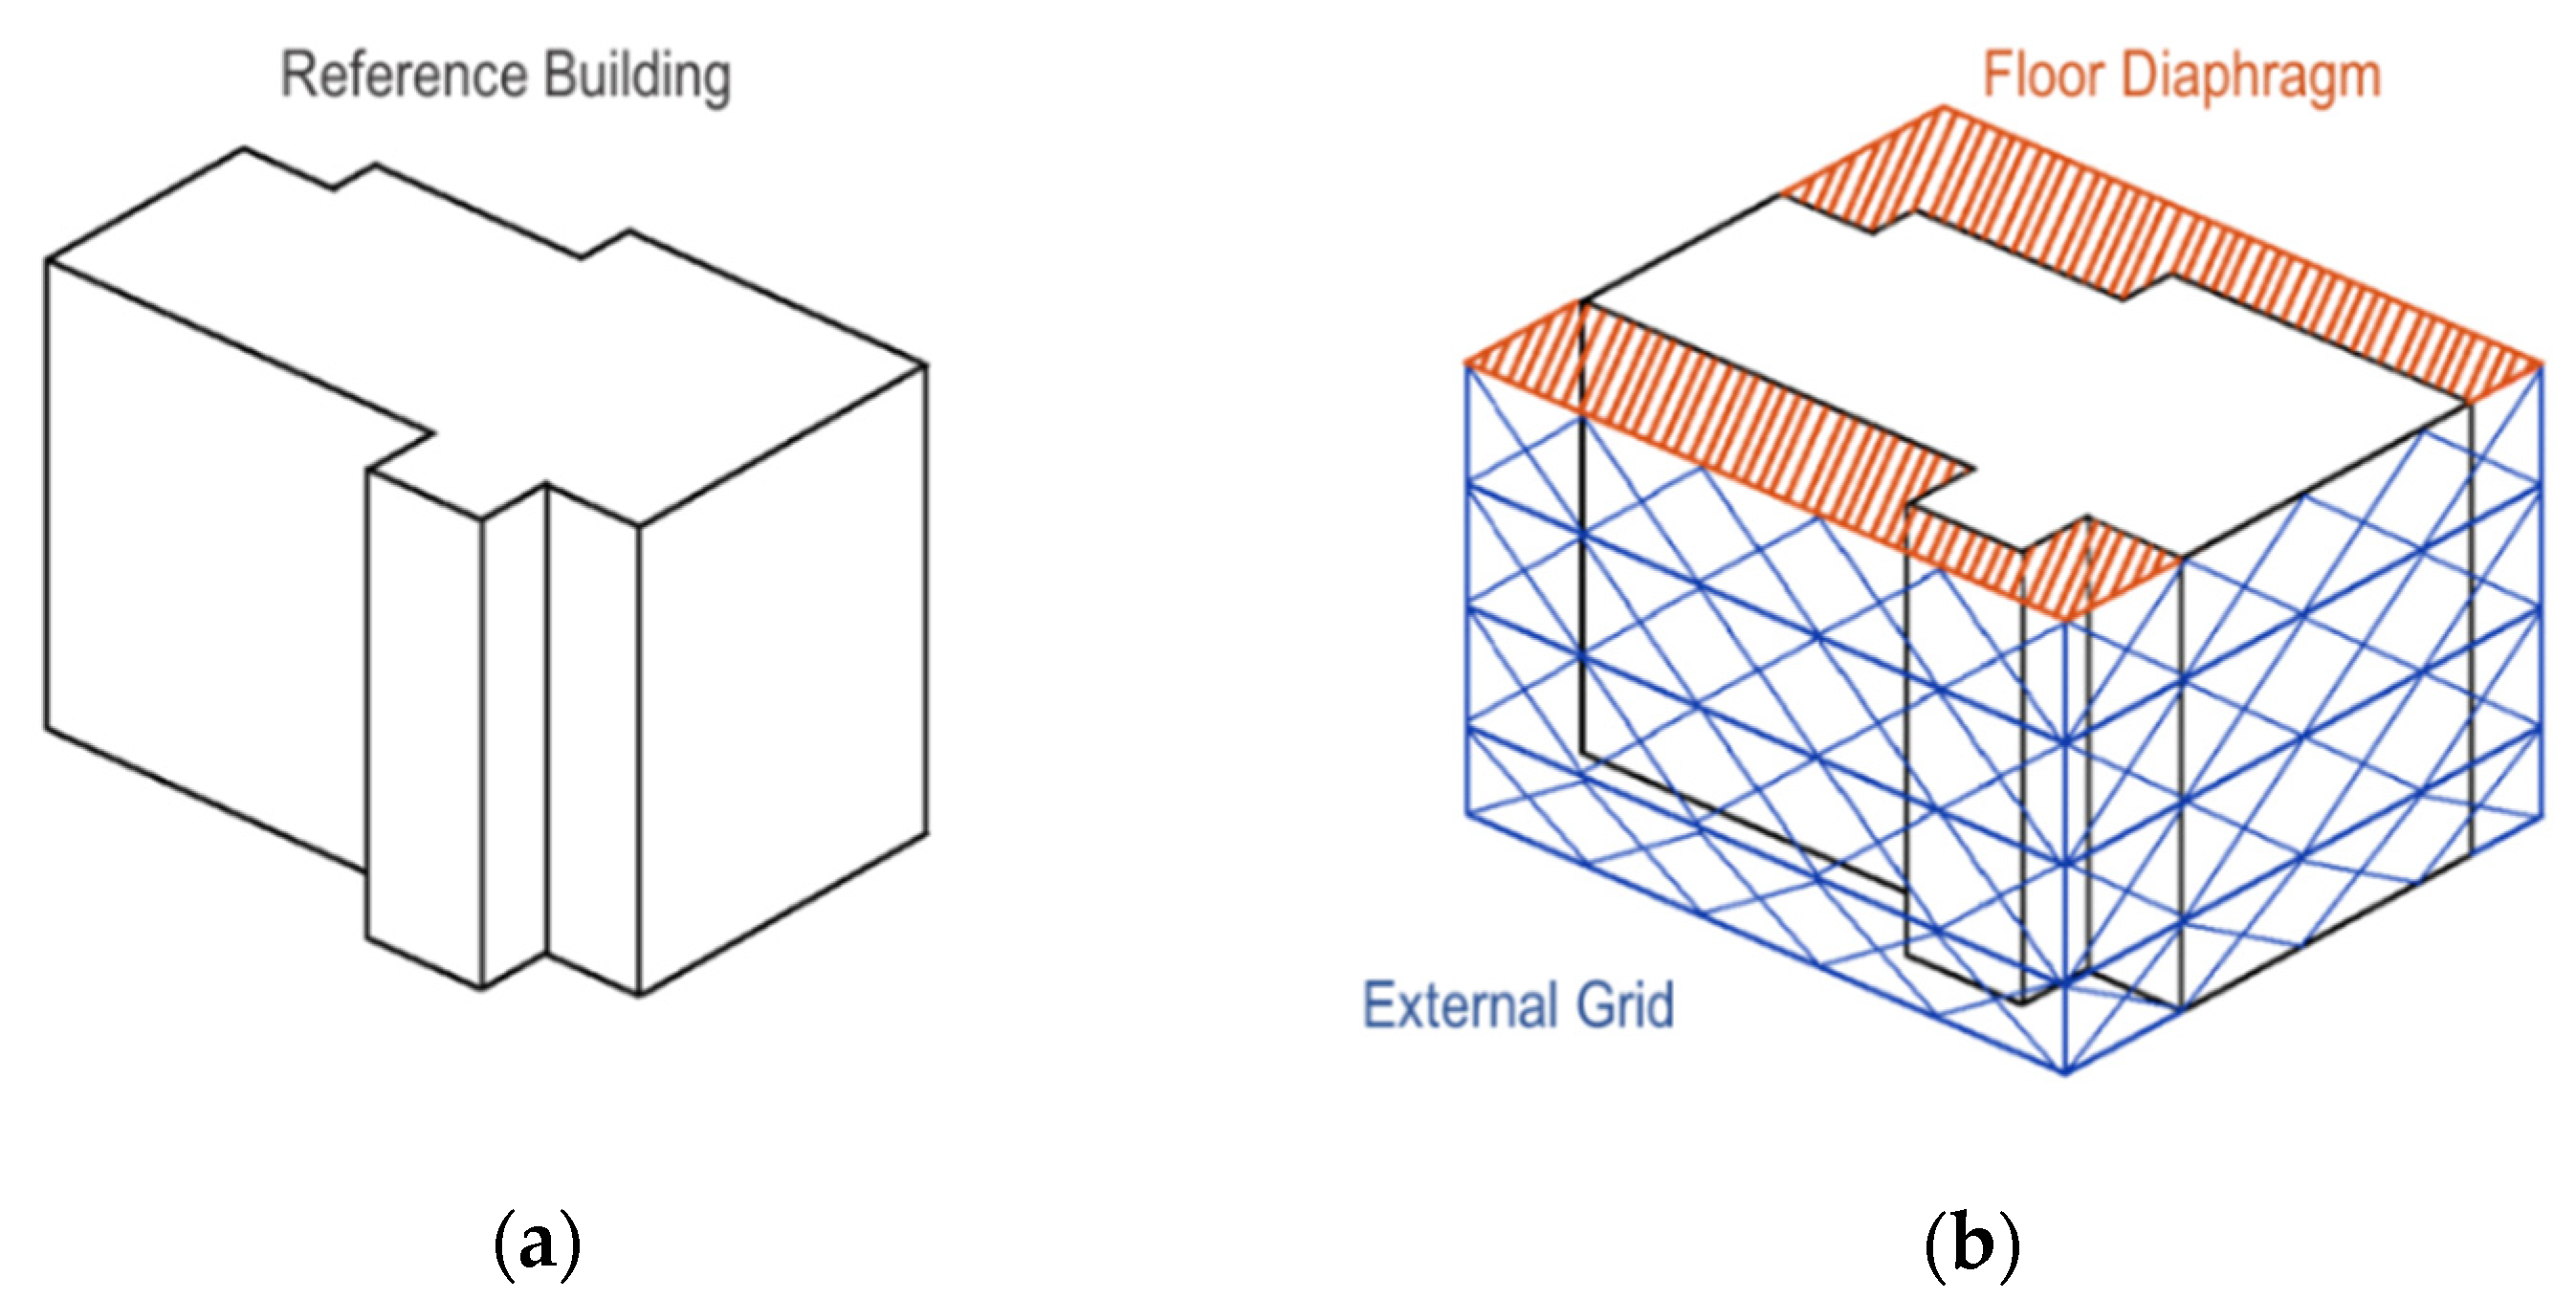
4.1.3. Diagrid Retrofit System
A diagrid is a global intervention which provides an external reinforcement directly attached to the building. An additional exoskeleton reshapes the building façade, improves the structural performance by sustaining static and seismic loads that exceed the capacity of the existing structure. The global system is activated by transferring the seismic inertia loads through floor diaphragms. As a result, a box-structural behavior of the retrofitted building is obtained (see
Figure 2) [
43,
44].
The envisaged system is made by cross bracing steel elements with variable circular hollow cross sections. At each floor, a floor diaphragm made by steel profiles, metal sheets and protected by lightweight concrete connects the grid to the existing floors. A concrete foundation system transfers loads from the structure to the soil.
Life-Cycle Impact Assessment: the evaluation of the potential environmental impacts is reported in
Table 3. After the data collection, impacts are calculated for raw material supply and manufacturing (A1–A3), disposal (C3–C4) and credits due to recycling (D) modules, according to EN 15804 [
36]. By contrast with other renovation measures, the main advantage of the diagrid is due to its dried technique: this allows an easier dismantling and more chances to the scrap steel elements to be recycled or, in the best case integrally reused.
Costs Assessment: for a screening cost assessment of the diagrid, three groups of activities have been considered (see
Table 4): (I) pouring of lightweight concrete per floor diaphragm, (II) steel components erection, (III) new foundations together with total required materials. Information is derived by local authorities and include raw materials, manufacturing and machine costs [
42] and it provides a conservative estimation. Since they do not include value added tax (VAT) and by considering the lack of information, they are increased by 22%. Lastly, the recovery steel elements have been considered with reference to the current scrap European prices updated on the end of year 2019. Furthermore, the final unit price per square meter in
Table 4 is calculated with reference to the net surface in the as-is layout, and reduces quite remarkably if one considers the extension of the net surface in the post-retrofit condition, thus including the red shaded area in
Figure 2.
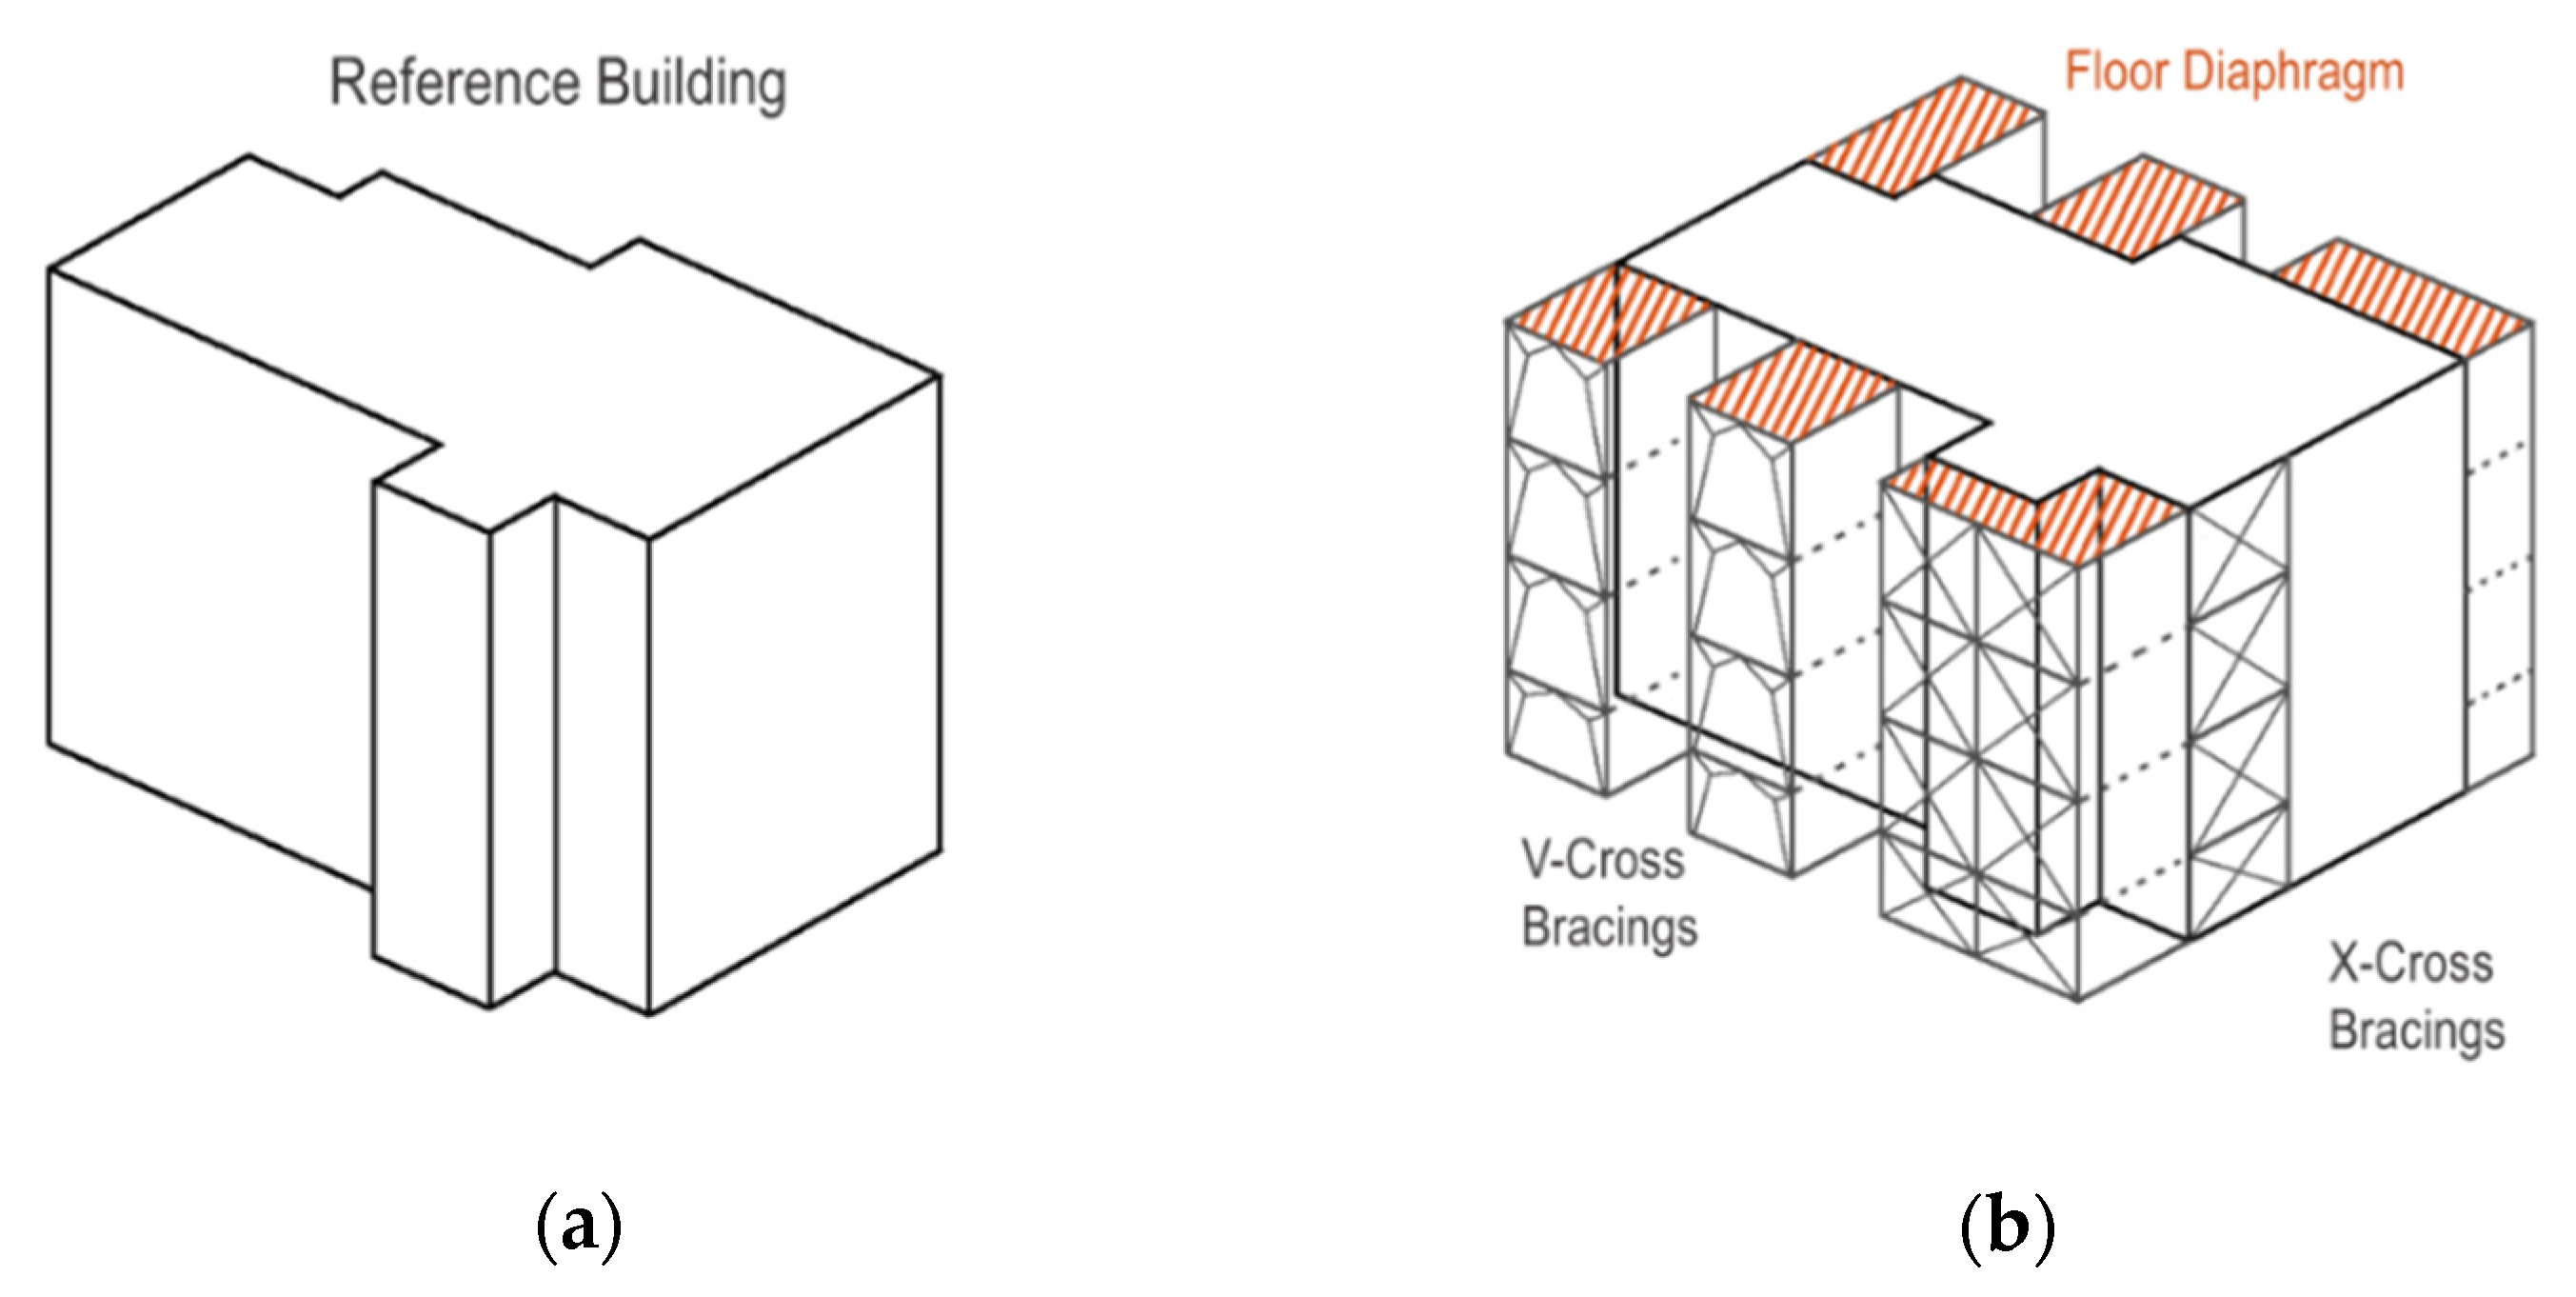
4.1.4. Shear Wall Retrofit System
The second retrofit system considered is composed by steel cross bracings located in specific parts of the building. The additional system is made by steel circular hollow profiles and it is assembled by employing X- or V-cross bracing. The V-Cross bracing elements are used in the neighborhood of openings for sake of usability (see
Figure 3).
The location of such elements has been selected to re-establish the floor symmetry and regularity. An additional floor is realized where new surfaces are added. The connection between the new system and the building has been made in correspondence to the floor RC edge beams by steel elements and connectors. A concrete foundation system transfers loads from the structure to the soil. The unit price per square meter in
Table 5 is calculated by spreading the total cost over the net surface in the as-is condition, and does not reflect the beneficial effect of the expansion of the net surface (red shaded area in
Figure 3).
Life Cycle Impact Assessment: by collecting all materials, the total impact of the shear walls system has been evaluated through environmental databases according to EN 15804 (see
Table 5) [
36]. Due to the high quantity of steel and the large cross section of the chosen profiles, the total GWP is higher in the shear wall systems compared to the diagrid system.
Costs Assessment: the screening cost assessment considers steel components erection, additional floor and foundation system construction together with total required materials (see
Table 6). Information is derived by local authorities and includes raw materials, manufacturing and machine costs [
42]. Costs are increased by 22% VAT as well as for the diagrid system and the recovery steel elements refers to the current scrap European prices updated on the end of year 2019.
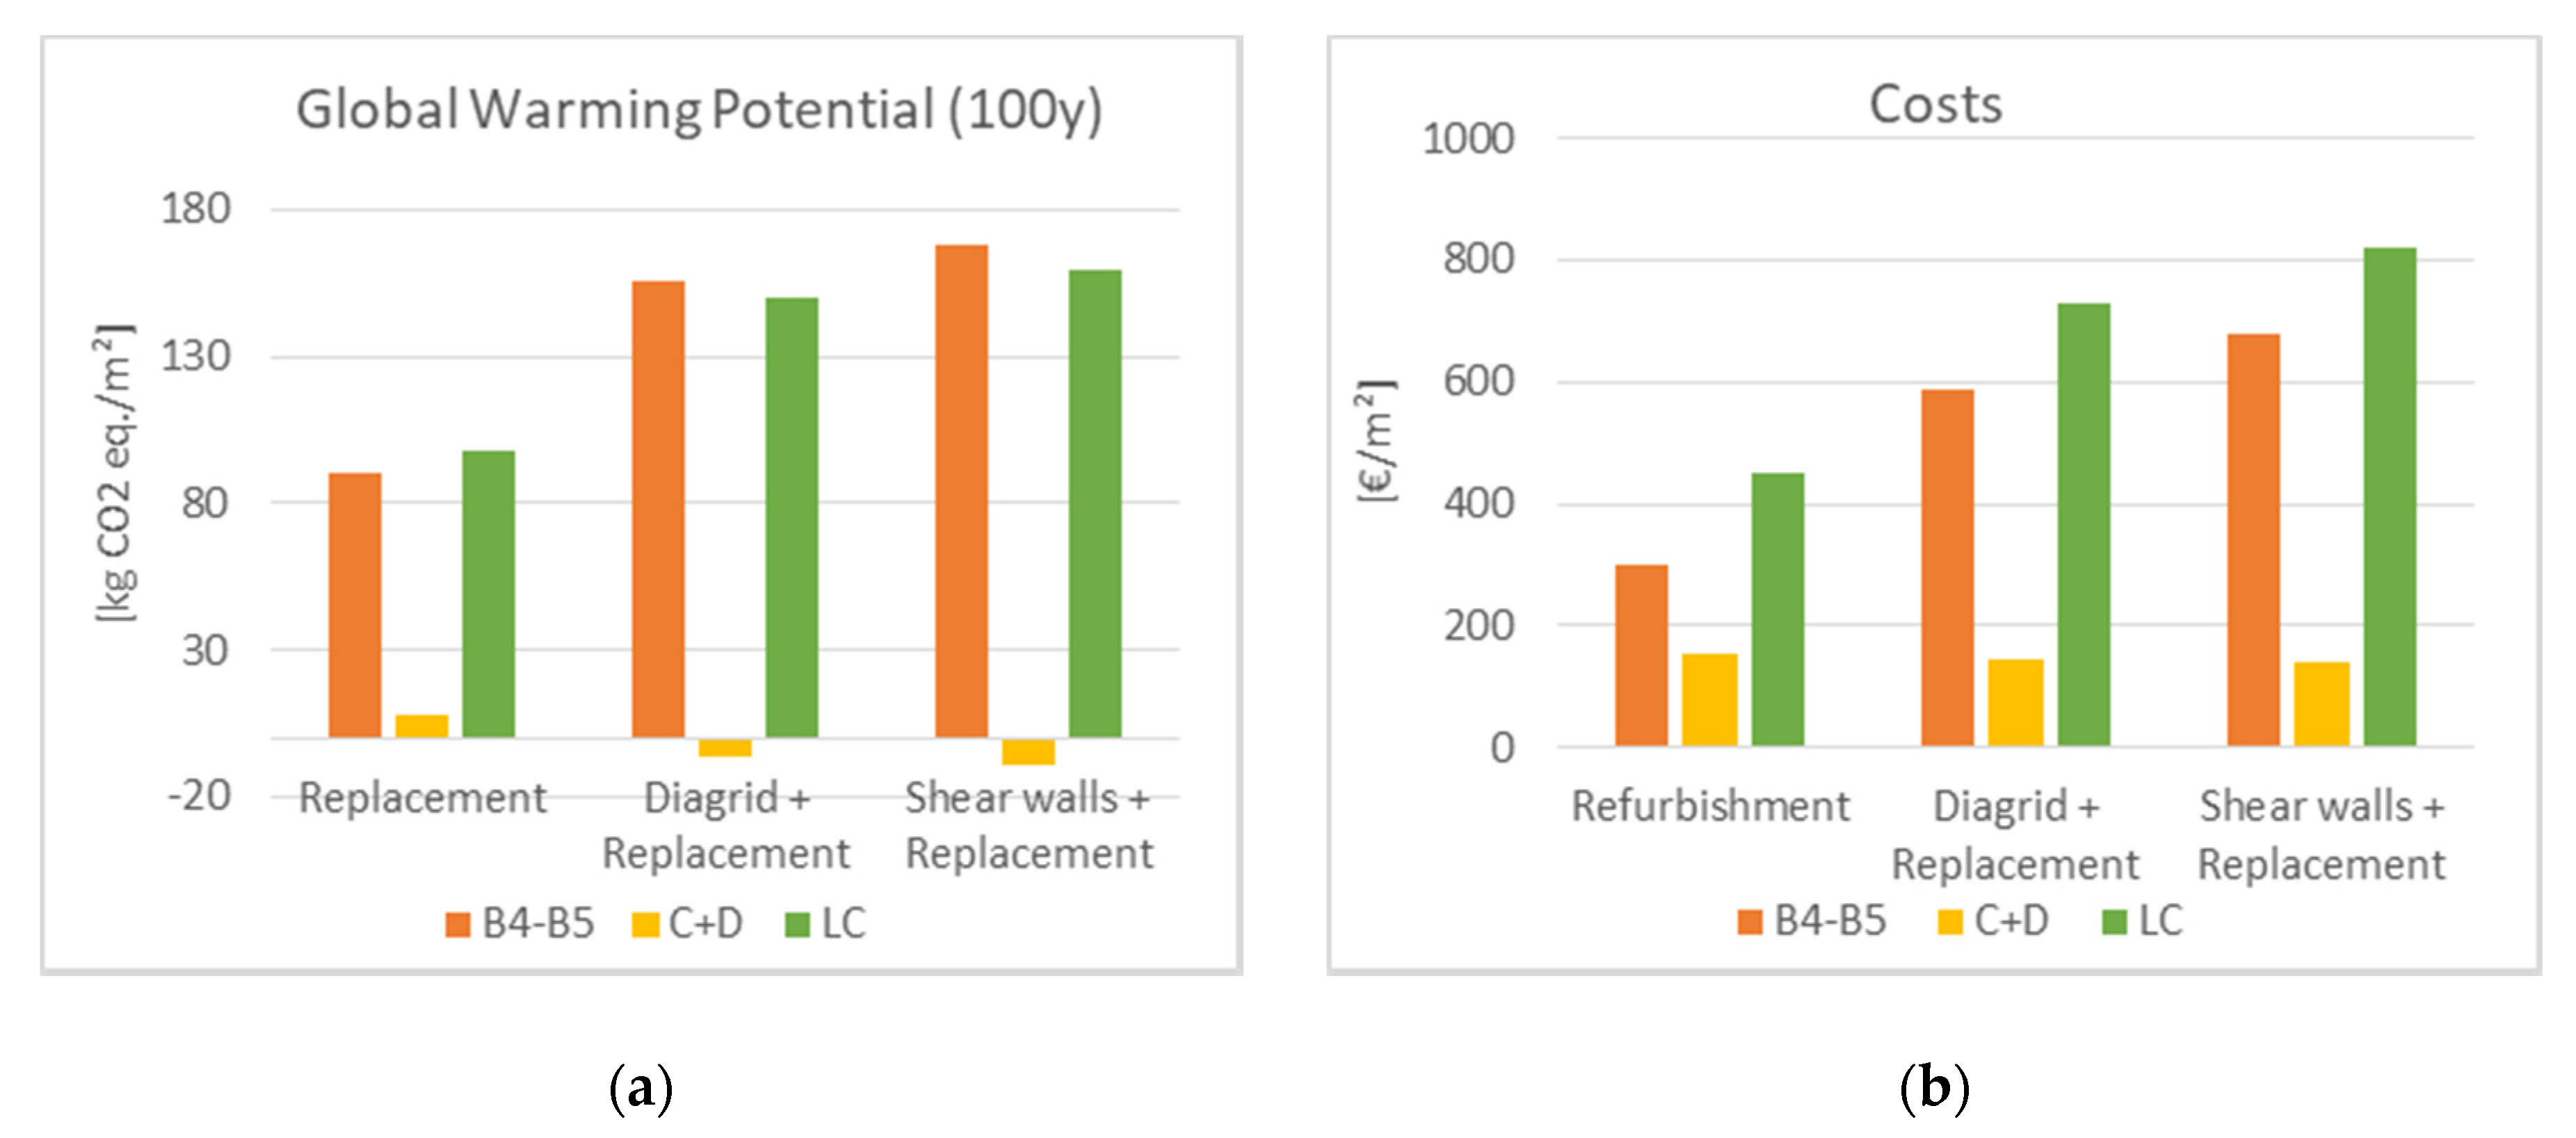
4.1.5. Comparing Results
As shown in
Figure 4, the impact and cost assessment carried out by static approaches does not encourage renovation measures associated with a structural enhancement, especially because of the evaluated total costs.
This may be due to the selected functional unit, which, by referring on net surface of dwellings, can reflect the equal performances of renovation measures only in “standard” conditions, namely under static permanent or variable loads and wherever seismic events do not occur. In a context of seismic hazard, a building provided with diagrid system can be comparable to a new building in terms of the remaining structural service life, resistance and displacements due to seismic loads, performances which cannot be improved through replacement of non-structural elements.
Rather than reviewing and establishing a new functional unit, in the next section such a shortcoming is handled by revising the methodology and applying probabilistic approaches. As an advantage, the seismic hazard can be included as well as further sources of uncertainties.
4.2. Probabilistic LCA
This section shows the results of the probabilistic LCA under seismic hazard with Monte Carlo simulations. The environmental impact and costs at year-1 are given by the results of static LCA–LCC and processed according to the
Section 3.
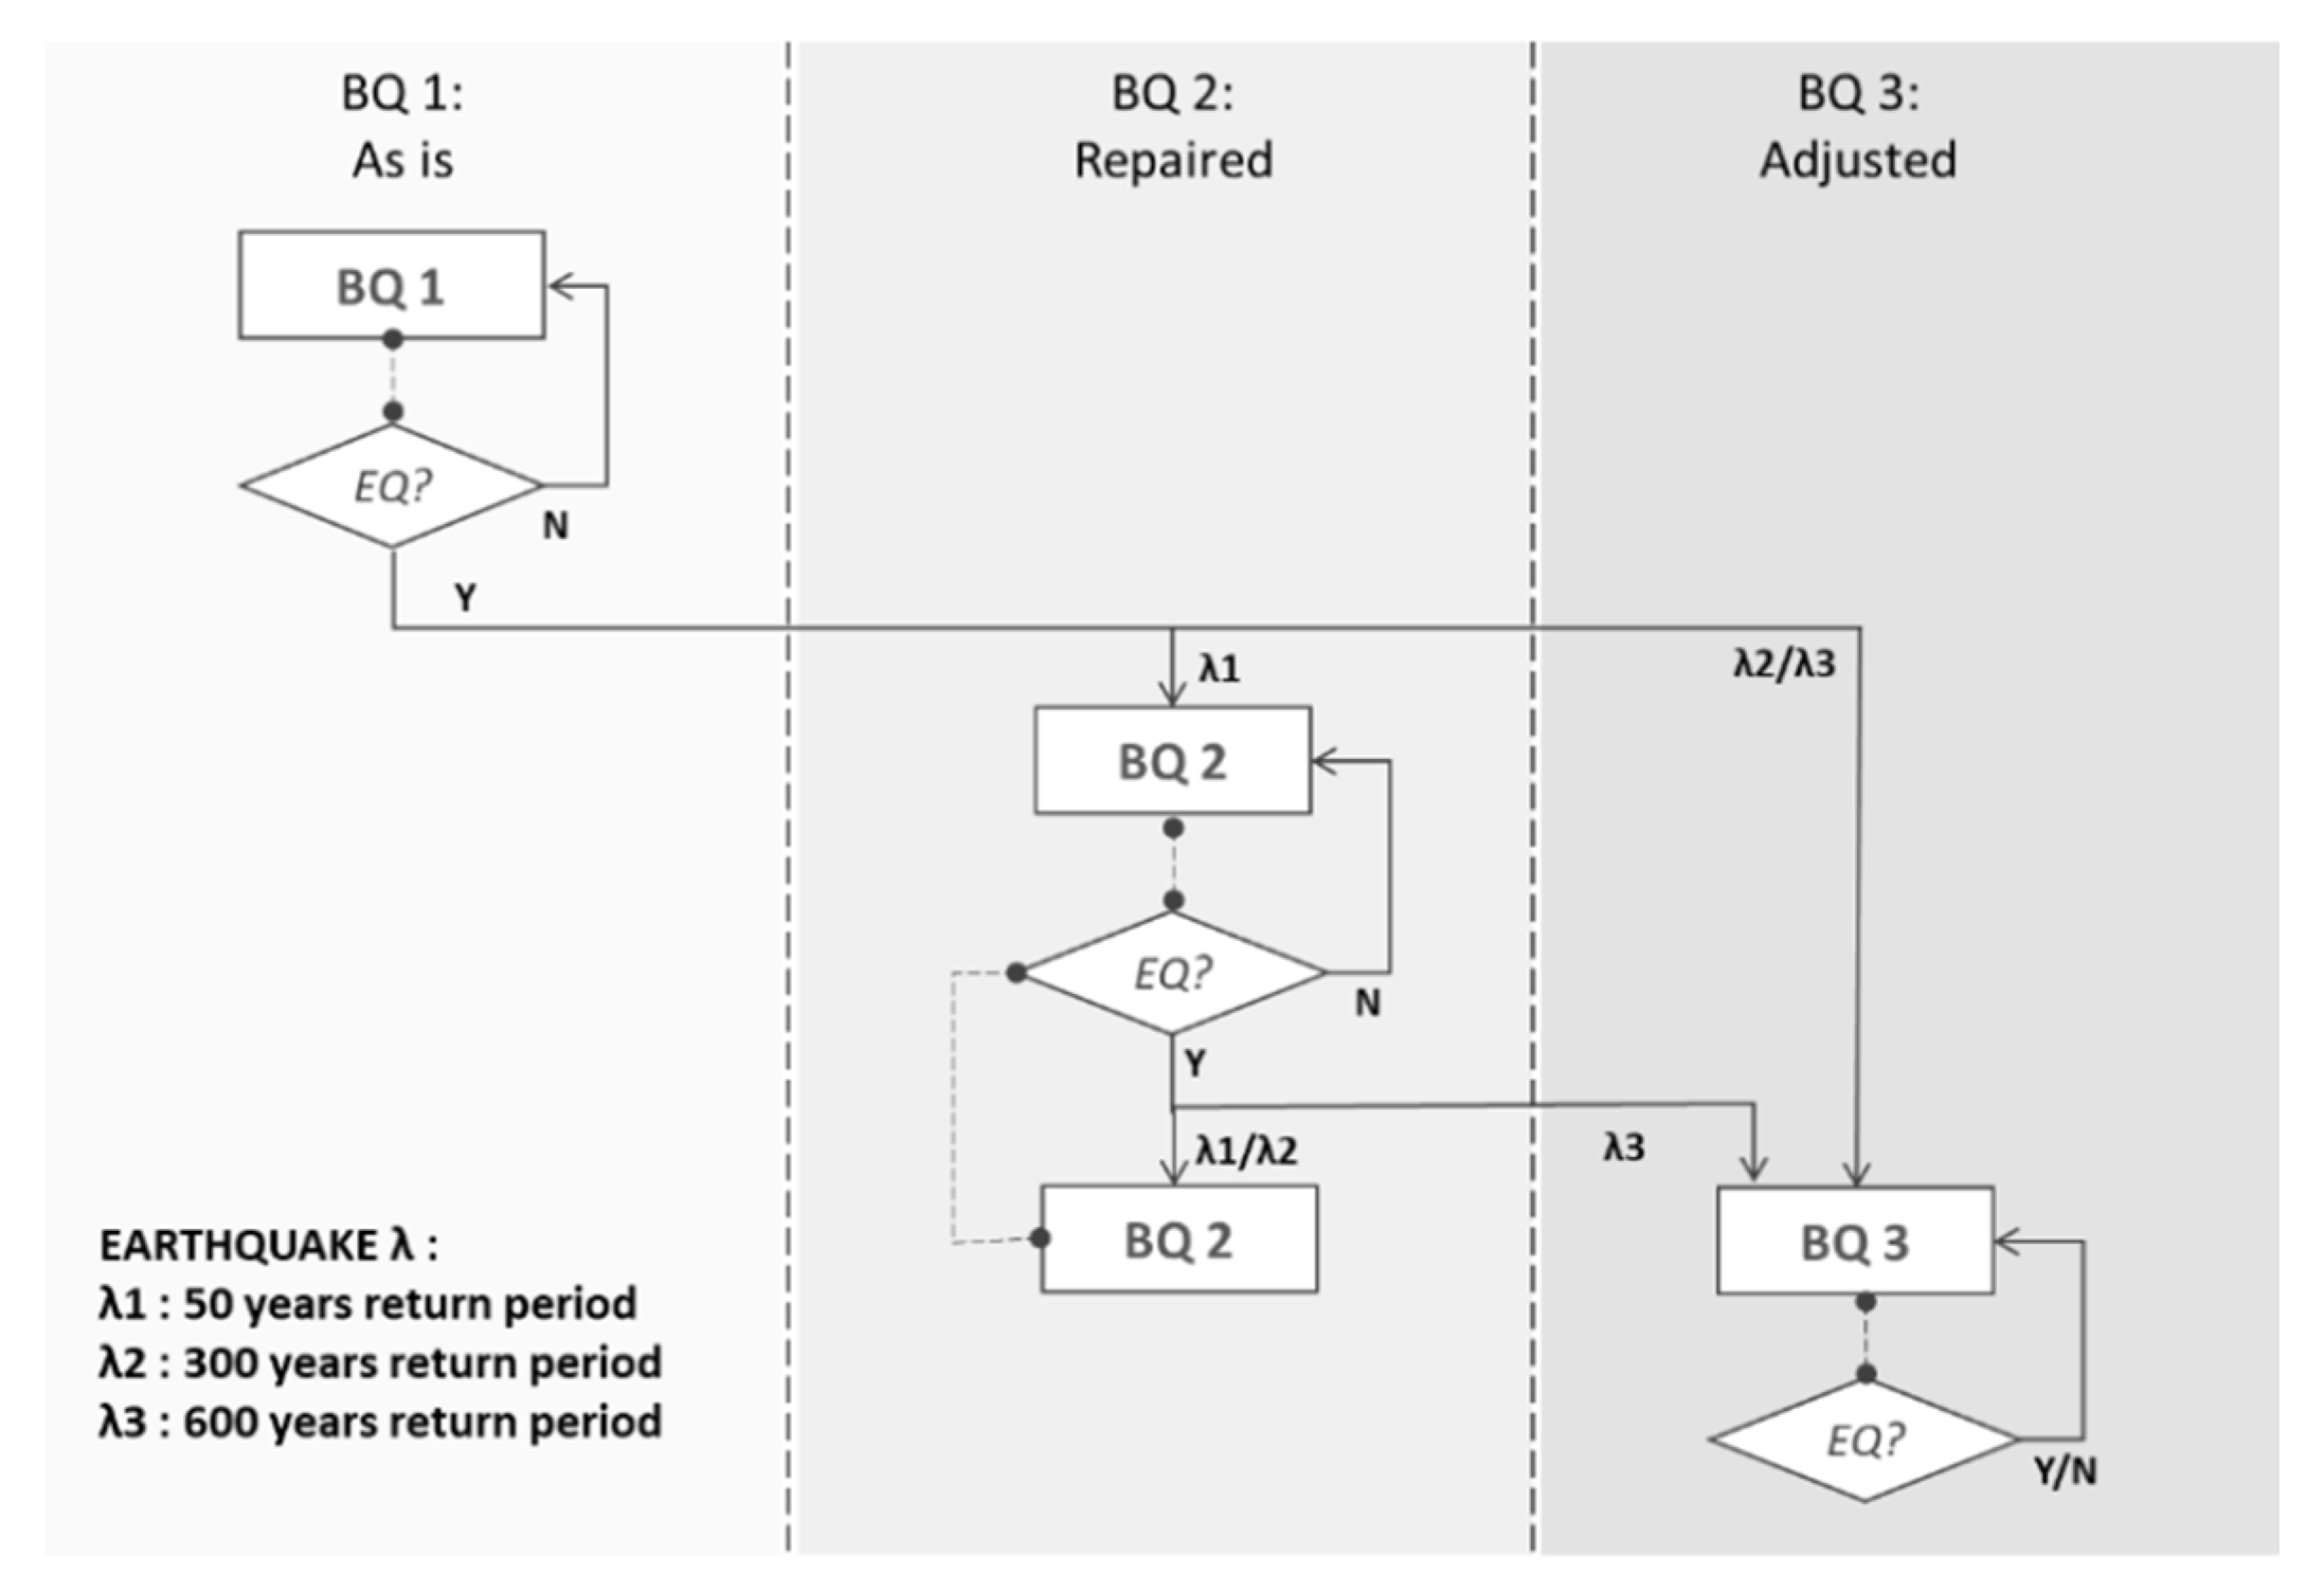
4.2.1. Seismic Event Choice
Earthquake magnitudes are derived for the geographical location of L’Aquila. The chosen events refer to the designed nominal service life of dwellings (50 years) and with higher return periods (300 and 600 years). For the considered case study, earthquakes between 50–300 years return period may lead to a mean damage level not higher than 25% of the building. Higher return periods, due to higher damages, lead to demolition and reconstruction.
Table 7 reports the characteristics of the considered earthquakes [
34].
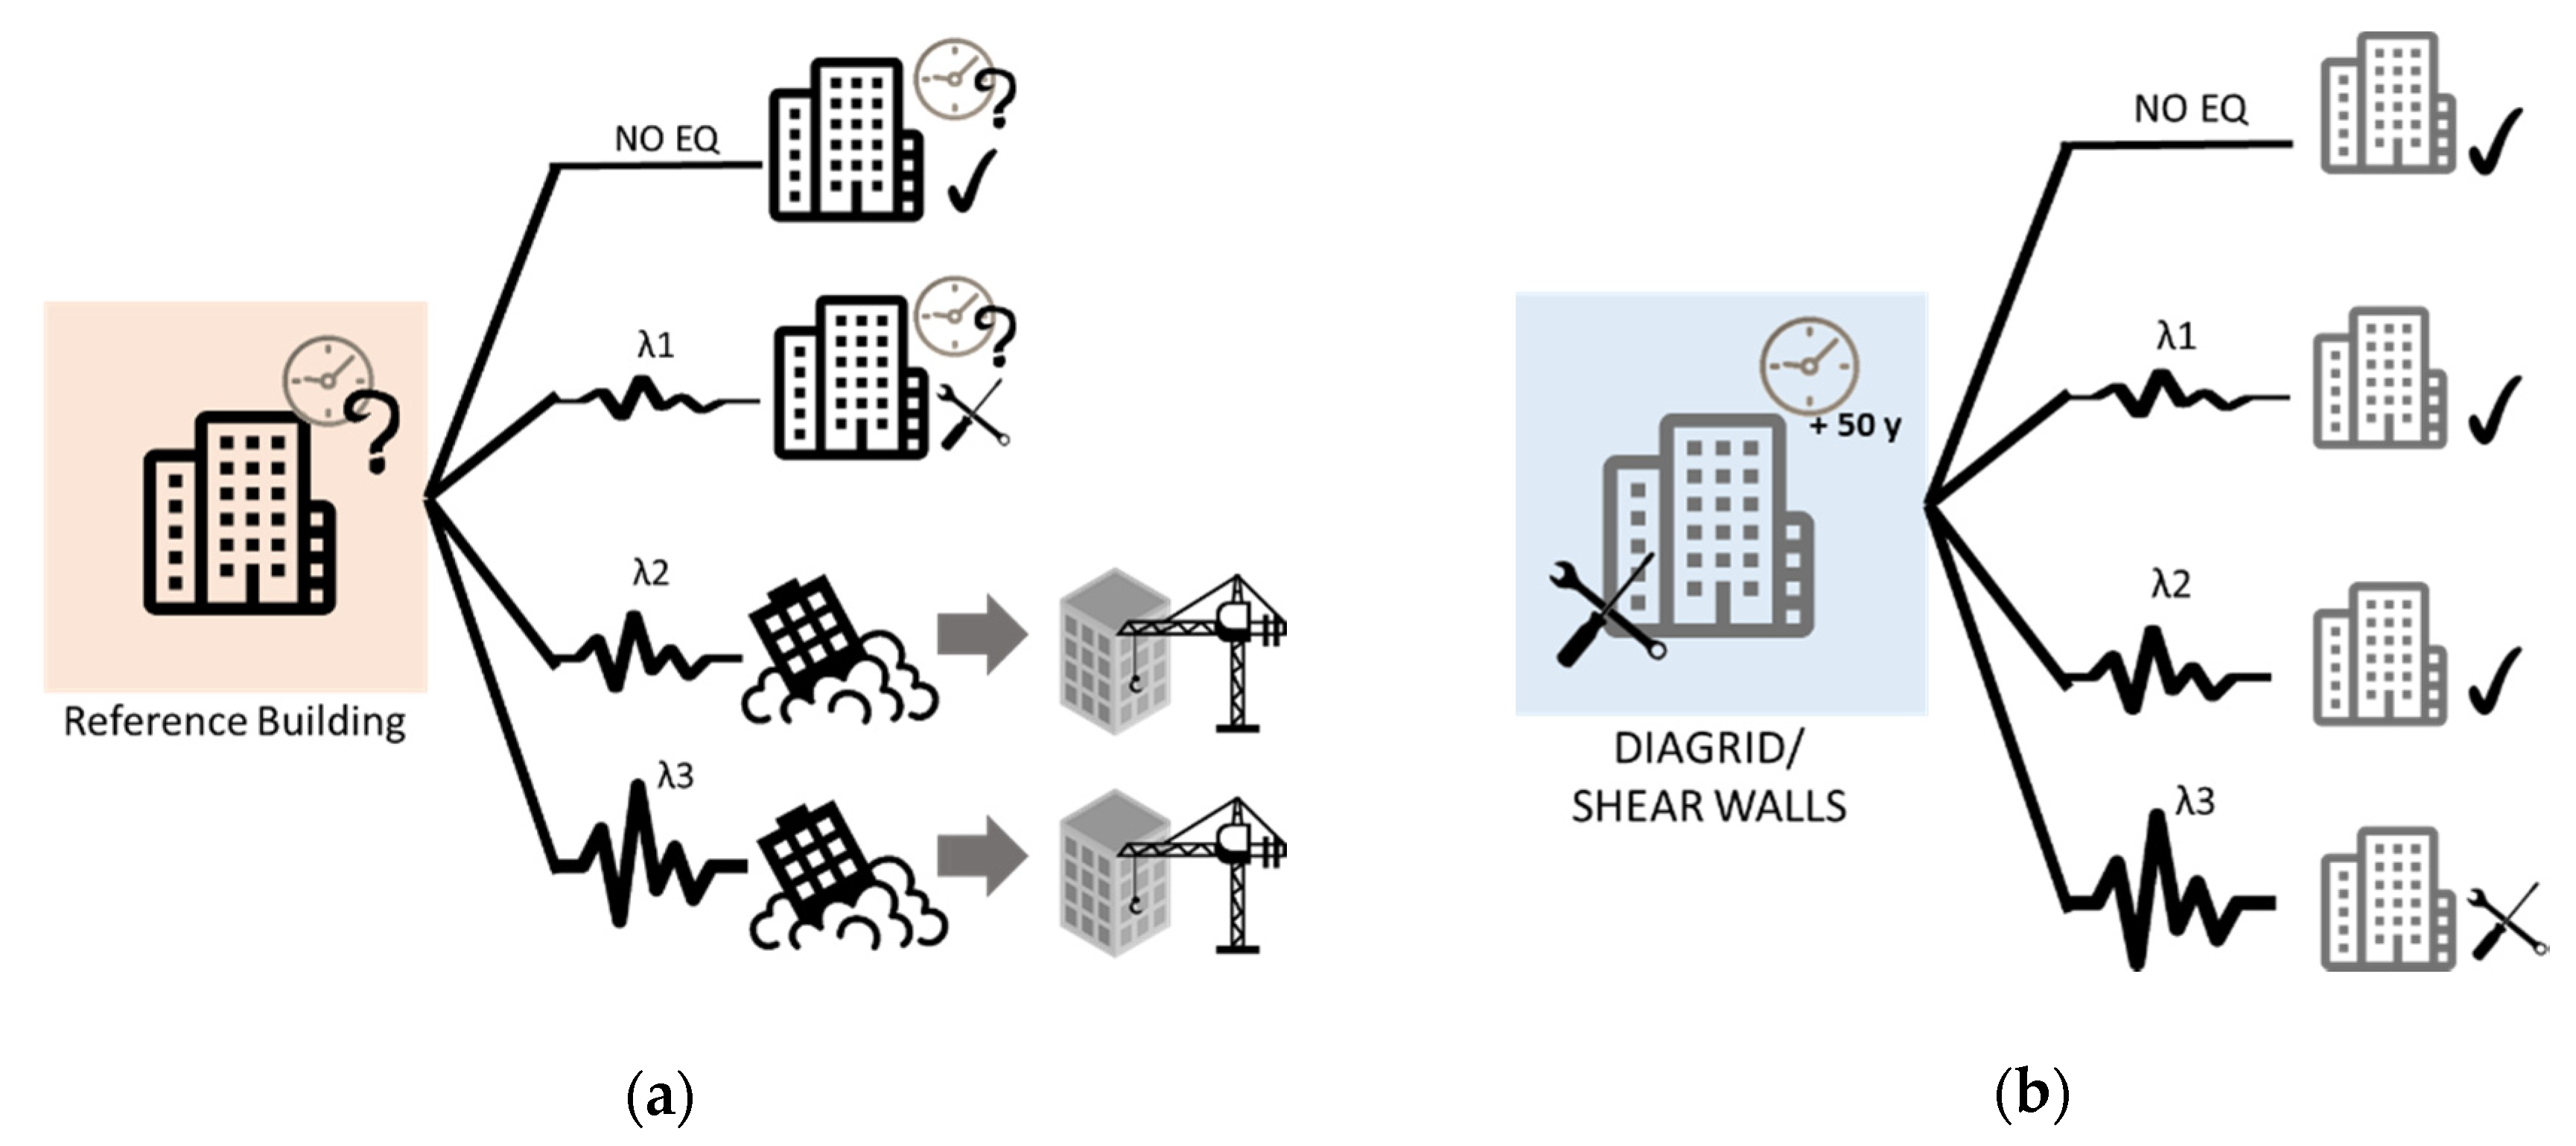
4.2.2. Fan Diagram—Today’s Scenarios
Depending on human decisions, there are three main groups of possibilities:
No retrofit. Service life of non-structural elements is extended. Nevertheless, the overall structural performance does not comply with current regulations (Building quality—BQ 1)
Diagrid/shear wall intervention. The service life of the building can be extended: the intervention adjusts the building structural response under seismic loading according to current regulation (BQ 3).
Demolition and re-building. This entails complications, such as the relocation of inhabitants, waste production and long-term works. For such reasons, demolition and rebuilding is not considered as an option to start the analysis with.
4.2.3. Fan Diagram—Future Scenarios
By considering the quality of the building at year-0, future scenarios are analyzed (
Figure 5).
Reference building without adequate adjustments may resist low-intensity earthquakes (λ1). After repairs, some vulnerabilities can be solved (BQ 2) but the occurrence of medium- and high-intensity earthquakes (λ2–λ3) cause severe damage and eventually its collapse. This leads to a new construction: the new building is considered equivalent in shape and complying with seismic design requirements (BQ 3).
The building with a new retrofit intervention enhances immediately its behavior (BQ 3). In the case of strong earthquake occurrence (λ3) the building may be subjected to moderate damage evaluated for 25% of the building value in terms of costs and environmental impacts.
Scenarios are converted into a matrix (see
Table 8) in which interventions related to earthquake events and building quality (BQ) are converted in GWP and costs (
Table 9 and
Table 10). Both matrices are processed in a Monte Carlo Simulation by means of the software MATLAB [
45]. In
Figure 6 a flow chart shows the building quality function variation due to earthquakes’ occurrence.
For impacts and costs discounting rates, the Italian price increase rate is derived from direct measurements or as the average value of the inflation rate (evaluated in 2019 as 0.82% [
46]). The discount rate is derived from government bonds (expiring date at least of 10 years—2.8% [
47]). LCA analyses consider a “business as usual” modelled decarbonisation rate of 1.6% [
48].
4.2.4. Monte Carlo (MC) Simulation Results
After obtaining a series of possible CO
2 emissions and costs values, results are processed. Relevant statistical values are derived, e.g., minimum, maximum, mean and median values (see
Table 11).
It is worth to notice that, due to the recorded values distribution, the median and arithmetic mean are different, especially for RB case, this may be related to different reasons, such as a non-Gaussian distribution, and, more likely, to the discrete number of the considered earthquake intensity levels and to the given deterministic repair costs and environmental impacts for each earthquake scenario. In addition, RB cases are characterized by higher dispersion. Besides these limitations, the results obtained still allow general considerations on the effects of including the earthquake occurrence in LCA and LCC analyses.
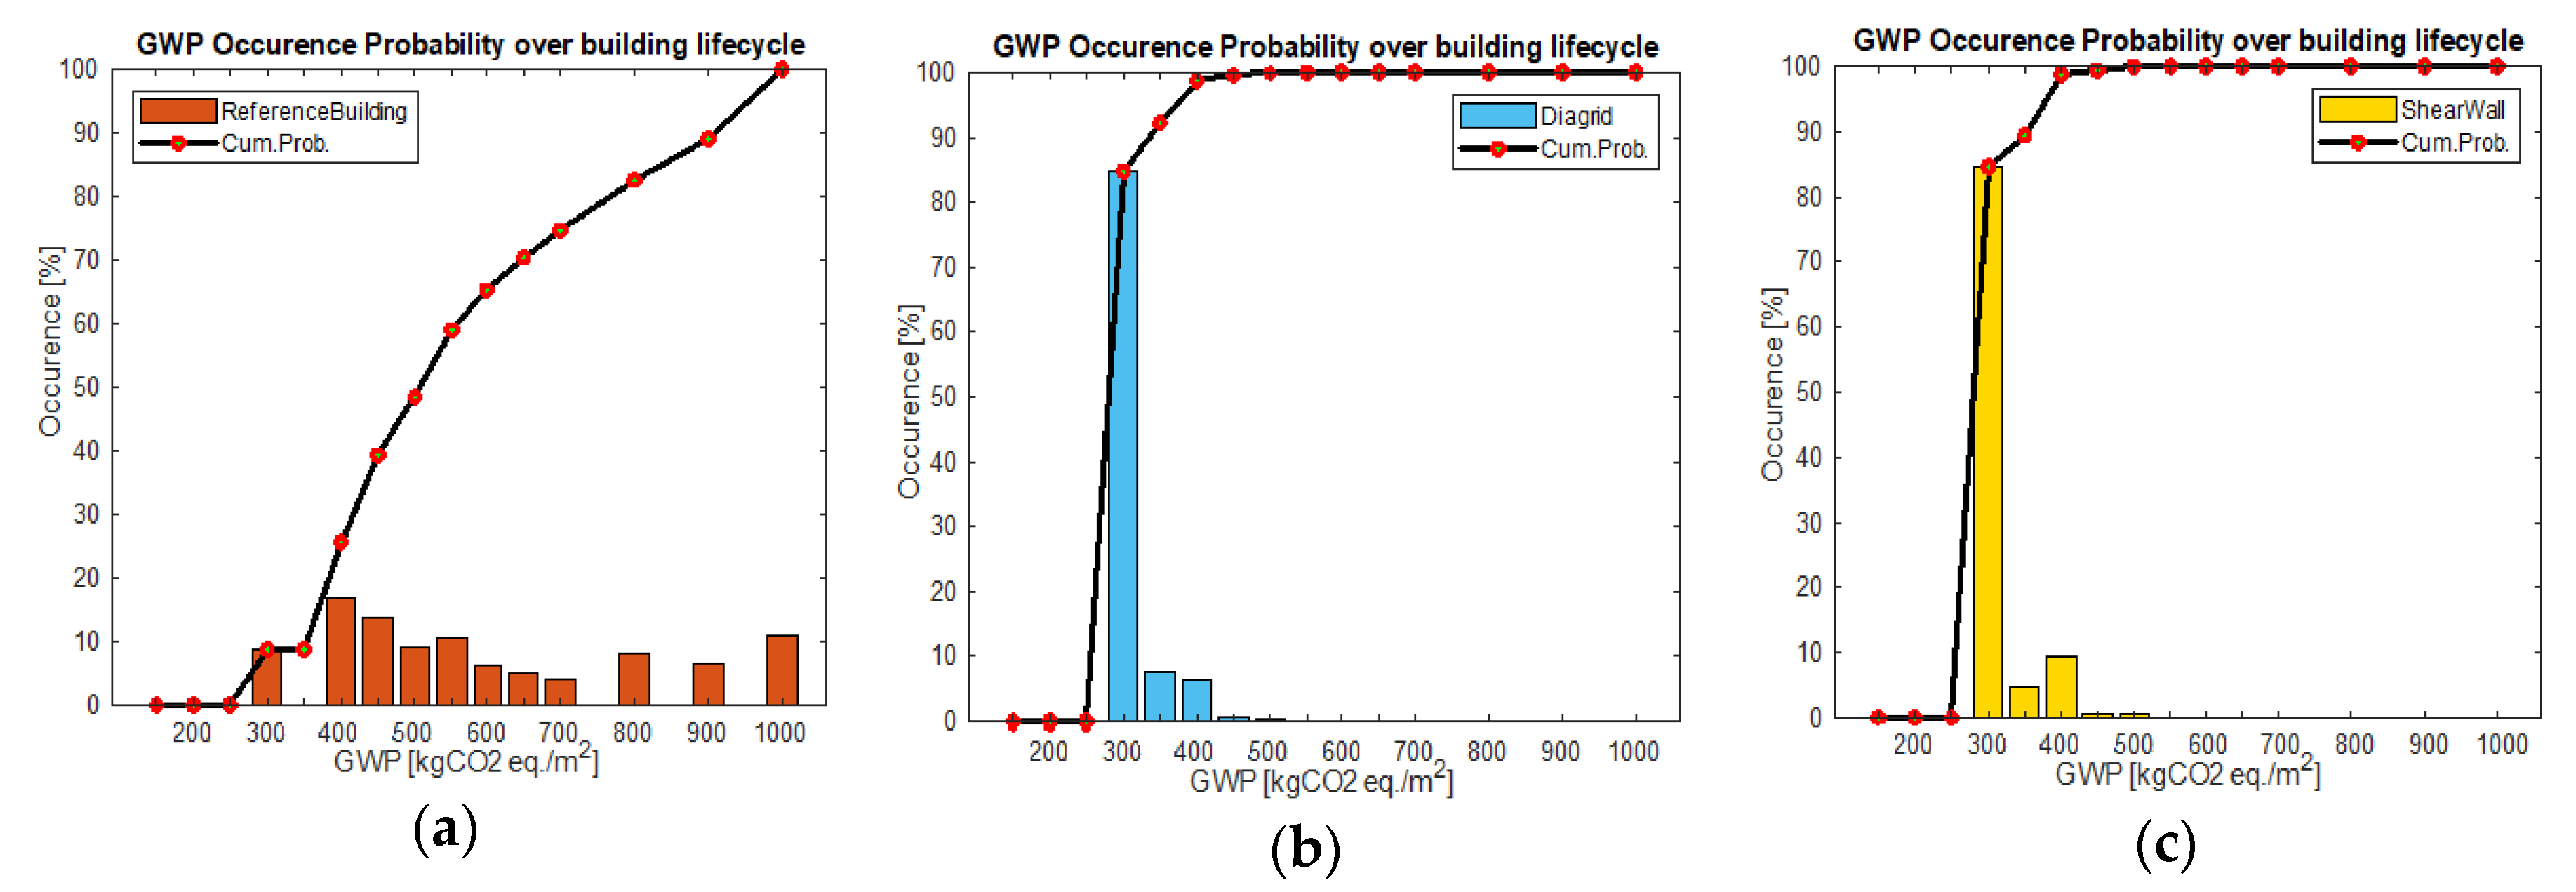
The results are grouped in ranges of values and their occurrence within such ranges is counted. The following graphs represent the probability trends. Two groups of values are distinguished (see
Figure 7): one in correspondence to low-medium values (200–500 kg CO
2 eq.) and another to high environmental impacts (500 to 1000 kg CO
2 eq.). The second group reveals the effects of the occurrence of medium and strong intensity earthquakes. For a not-retrofitted building, critical consequences are expected and consequently high economic and environmental impacts due to the demolition and re-building process are observed (
Figure 7a). A building provided with structural retrofit systems (
Figure 7b,c) does not reveal high impact occurrence because preventive initiatives have been undertaken. Few cases are recorded in the shear wall case (
Figure 7c), due to higher environmental impacts of reinforcement production.
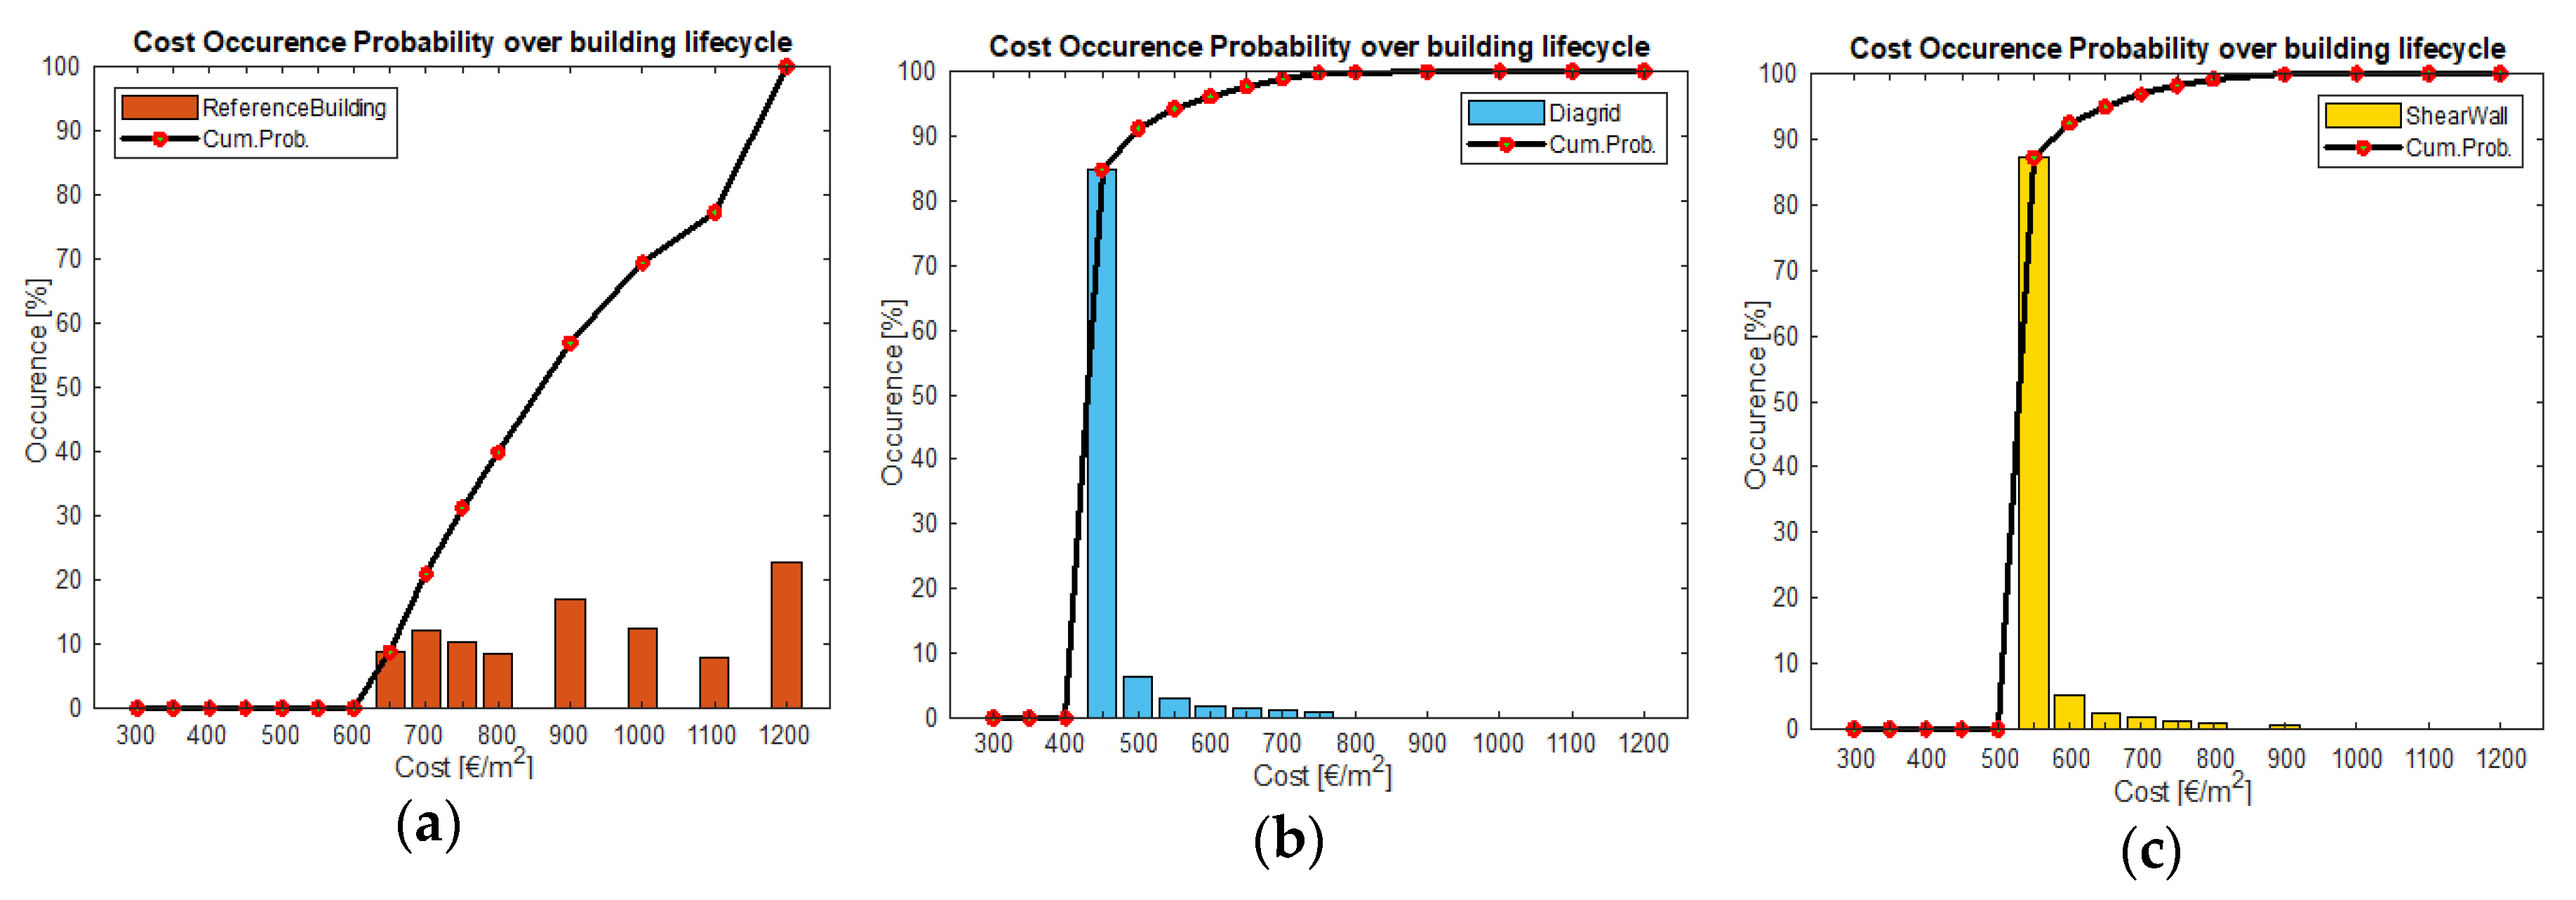
With regard to LCC results, a non-retrofitted building presents costs occurrence that is rather homogenous between 700–1100 €/m
2 while values higher than 1200 €/m
2 have more than 20% probability of occurrence. Retrofitted buildings (
Figure 8b,c) do not record high costs.
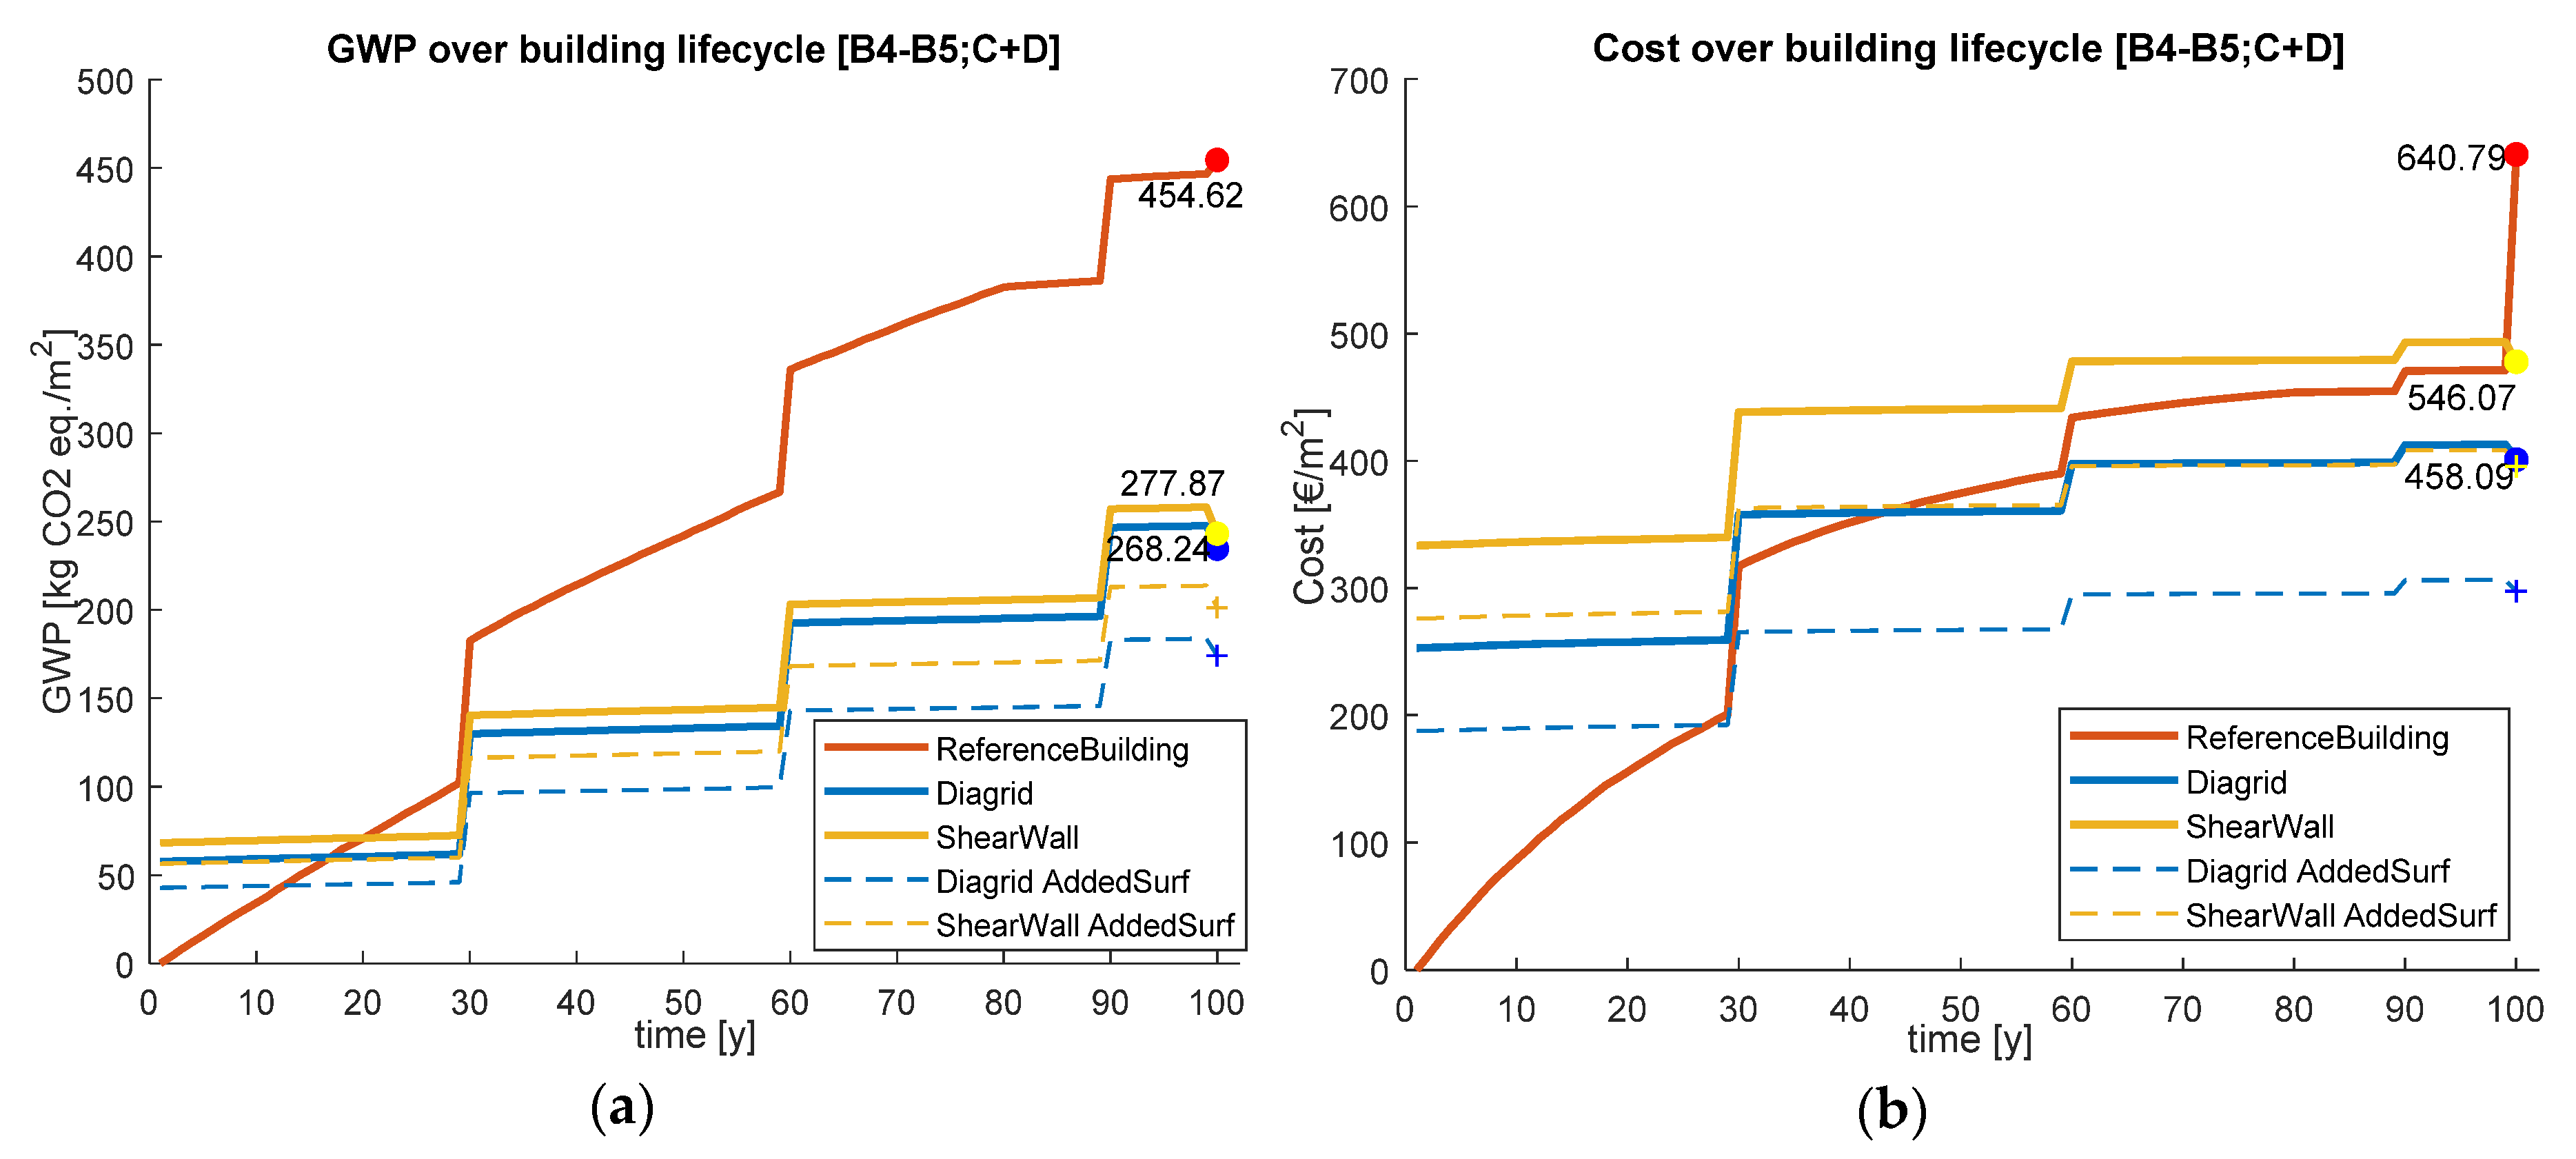
Lastly, probabilistic LCA and LCC results are shown over the 100 years’ observation time of the building (
Figure 9). For each year average GWP and costs are calculated and summed with previous values in order to analyze the yearly increase. This visualization of the results enables to evaluate the measure impact over time. As shown by the graphs, every 30 years a building refurbishment increases costs and impacts. GWP curves present a linear trend, while costs, because of discounting, are non-linear. This is especially noticeable for the reference building, where sensitivity to change is higher. In this regard, the building quality variation is visible through the curve gradient. When the building achieves the highest building quality, both GWP and costs curve trends become as flat as for buildings provided with structural retrofit. Nevertheless, this occurs for the reference building only beyond 75 years’ analysis. The reference building seems to be advantageous in terms of GWP only in a short or medium period (20 years ca. for both diagrid and shear walls). In comparison with lifecycle costs of the reference building, the diagrid proved to be the most advantageous renovation with a payback time of 44 years. It is worth noting that if we would have considered standard profiles instead of circular ones for the diagrid, we would have had a payback time of 33 years. In any case, if we account for the extra floor surface provided by the new retrofit system (92m
2 per floor for the diagrid and 55 m
2 per floor for the shear walls system), the cost over the building lifecycle reduces (dashed lines in
Figure 9) with a payback time of 27 years (22 years with standard profiles) for the diagrid and 47 years for the shear walls system.
5. Discussion
The comparison between the two methodologies highlights that probabilistic LCA and LCC can solve miscalculation due to uncertainties and thus prevent from misleading LCA-based decisions. The probabilistic approach enriches the analyses by adding additional functions and parameters related to environmental, economic contingencies and external factors, leading to a more complex model which can allow stakeholders to make more aware choices.
According to the results obtained, static analyses are not able to consider the advantage of a seismic retrofit, since it may be not capable through a single trustworthy value to reveal the performance of the construction under seismic actions and the risk of long-term losses due to the lack of a suitable anti-seismic structural system. On the contrary, the presented method performs both probabilistic LCA–LCC and includes a statistical assessment in order to provide impact occurrence probability for different ranges of values. Among the analyzed solutions, the retrofit system with a diagrid achieves more economic and environmental savings in shorter terms, while the analyzed shear wall system can be considered not efficient for the considered case study.
In comparison with the PEER-PBEE probabilistic model, the proposed approach introduces a function related to the building quality. Thank to this, the structural enhancement due to repairs of seismic adjustments has been included and consequently a reduced likelihood of damage in the case of subsequent earthquakes. As a disadvantage, the missing variation of the building quality function may lead to the considered case study overestimating results that would not always encourage anti-seismic reinforcements within the decision making process over the building life cycle (
Appendix A).
To validate this study, in particular referring to the occurrence rate of the simulated earthquakes, a comparison between the results of the model and the target annual frequency of exceedance has been made: for 10,000 runs over 100 years’ observation time, the recorded frequency can slightly diverge (see
Table 12) but an accuracy of 10
−2 ÷ 10
−3 is achieved. More MC runs would improve the convergence between values model and empirical values, but, on the other hand, generate problems due to the used calculation software limits and the high quantity of values to be processed.
It is necessary to underline the “Proof-of-Concept” character of the presented methodology, which still contains inaccuracies and approximations. A first approximation can be related to the probabilistic seismic hazard assessment (PSHA) model, which is currently used and it results advantageous because it describes earthquake occurrence and effects by requiring a limited number of parameters. Due to the complexity of introducing Monte Carlo simulations in the LCA evaluation, future research will focus on the development and investigation of simplified procedures to include earthquake effects in LCA, analogously to what has developed in earthquake engineering, such as software (as PACT—Performance Assessment Calculation Tool, FEMA P-58 [
48]) or direct loss assessment procedures (such as the displacement-based loss assessment [
49]).
More significant inaccuracies are related to the correct assessment of the building damage and to the cost of retrofit. In this work, three seismic events with increasing intensity have been considered, which lead to a certain building damage level. Actually, there is a variety of events with different consequences, depending on the vulnerability of the existing building: in this regard, the inclusion of a wider set of earthquakes would improve the technical aspect of the analyses, by adding more scenarios. Specific local damages and interventions may be included in order to derive more accurate predictions under seismic hazard on building components level.
The framework could be enriched through the inclusion of more sources of LCA uncertainties. On one hand, this enables more transparent results but on the other hand increases the complexity of the model. Hence, it is important to identify uncertainties that, individually or together with other factors, influence results’ robustness. Lastly, a more detailed data collection or the extension of LCA-LCC system boundaries, through i.e., the inclusion of building energy demand information, would improve the analysis with more comprehensive results.
Author Contributions
Conceptualization and methodology, R.D.B., J.G.; Analysis R.D.B., A.B., A.M.; investigation, R.D.B.; data curation, R.D.B., A.B., A.M.; writing—original draft, R.D.B.; visualization R.D.B.; writing—review and editing, R.D.B., A.B., A.M. and R.H.; Supervision, A.B., A.M., R.H. and J.G. All authors have read and agreed to the published version of the manuscript.
Funding
This research and the APC was funded by the Deutsche Forschungsgemeinschaft (DFG, German Research Foundation) under Germany´s Excellence Strategy—EXC 2120/1. Grant number 390831618.
Acknowledgments
Supported by the Deutsche Forschungsgemeinschaft (DFG, German Research Foundation) under Germany´s Excellence Strategy—EXC 2120/1-390831618.
Conflicts of Interest
The authors declare no conflict of interest.
Appendix A
In
Table A1 are the results of 10,000 runs of Monte Carlo simulation of LCA–LCC analyses by varying the starting building quality of the reference building on year y = 1. BQ variation due to earthquake occurrence is not considered.
Table A1.
Probabilistic LCA–LCC results without BQ variation due to earthquake occurrence.
In
Table A2 are the results of 10,000 runs Monte Carlo simulation of LCA–LCC analyses by varying the starting building quality of the reference building on year y = 1. BQ variation due to earthquake occurrence is considered.
Table A2.
Probabilistic LCA–LCC results with BQ variation due to earthquake occurrence.
References
- Global Alliance for Buildings and Construction. Global Status Report 2018. Available online: https://www.unenvironment.org/resources/report/global-status-report-2018 (accessed on 30 November 2019).
- Eurostat. People in the EU—statistics on housing conditions. Available online: https://ec.europa.eu/eurostat/statistics-explained/index.php/People_in_the_EU_-_statistics_on_housing_conditions (accessed on 30 November 2019).
- Frey, P.; Dunn, L.; Cochran, R.; Spataro, K.; McLennan, J.F.; Di Nola, R.; Heider, B. The Greenest Building: Quantifying the Environmental Value of Building Reuse. Available online: http://www3.cec.org/islandora-gb/en/islandora/object/islandora%3A1018 (accessed on 30 November 2019).
- Hasik, V.; Escott, E.; Bates, R.; Carlisle, S.; Faircloth, B.; Bilec, M.M. Comparative whole-building life cycle assessment of renovation and new construction. Build. Environ. 2019, 161, 106218. [Google Scholar] [CrossRef]
- Buyle, M.; Braet, J.; Audenaert, A. Life cycle assessment in the construction sector: A review. Renew. Sustain. Energy Rev. 2013, 26, 379–388. [Google Scholar] [CrossRef]
- Belleri, A.; Marini, A. Does seismic risk affect the environmental impact of existing buildings? Energy Build. 2016, 110, 149–158. [Google Scholar] [CrossRef]
- Internaational Organization for Standardization. Life Cycle Assessment—Principles and Framework, DIN EN ISO 14040:2006; Internaational Organization for Standardization: Geneva, Switzerland, 2006. [Google Scholar]
- Internaational Organization for Standardization. Life cycle Assessment—Requirements and Guidelines, DIN EN ISO 14044; International Organization for Standardization: Geneva, Switzerland, 2006. [Google Scholar]
- Igos, E.; Benetto, E.; Meyer, R.; Baustert, P.; Othoniel, B. How to treat uncertainties in life cycle assessment studies? Int. J. Life Cycle Assess. 2019, 24, 794–807. [Google Scholar] [CrossRef]
- Gantner, J.; Fawcett, W.; Ellingham, I. Probabilistic Approaches to the Measurement of Embodied Carbon in Buildings. In Embodied Carbon in Buildings: Measurement, Management, and Mitigation; Pomponi, F., de Wolf, C., Eds.; Springer: Cham, Switzerland, 2018; pp. 23–50. ISBN 978-3-319-72796-7. [Google Scholar]
- Huijbregts, M.A.J. Application of uncertainty and variability in LCA. Int. J. Life Cycle Assess. 1998, 3, 273. [Google Scholar] [CrossRef]
- Williams, E.D.; Weber, C.L.; Hawkins, T.R. Hybrid Framework for Managing Uncertainty in Life Cycle Inventories. J. Ind. Ecol. 2009, 13, 928–944. [Google Scholar] [CrossRef]
- Björklund, A.E. Survey of approaches to improve reliability in lca. Int. J. Life Cycle Assess. 2002, 7, 64. [Google Scholar] [CrossRef]
- Huijbregts, M.A.J. Part II: Dealing with parameter uncertainty and uncertainty due to choices in life cycle assessment. Int. J. Life Cycle Assess. 1998, 3, 343–351. [Google Scholar] [CrossRef]
- Roy, P.-O.; Deschênes, L.; Margni, M. Uncertainty and spatial variability in characterization factors for aquatic acidification at the global scale. Int. J. Life Cycle Assess. 2014, 19, 882–890. [Google Scholar] [CrossRef]
- Ziyadi, M.; Al-Qadi, I.L. Model uncertainty analysis using data analytics for life-cycle assessment (LCA) applications. Int. J. Life Cycle Assess. 2019, 24, 945–959. [Google Scholar] [CrossRef]
- Van Zelm, R.; Huijbregts, M.A.J. Quantifying the trade-off between parameter and model structure uncertainty in life cycle impact assessment. Environ. Sci. Technol. 2013, 47, 9274–9280. [Google Scholar] [CrossRef] [PubMed]
- Yana, A.G.A.; Rusdhi, H.A.; Wibowo, M.A. Analysis of Factors Affecting Design Changes in Construction Project with Partial Least Square (PLS). Procedia Eng. 2015, 125, 40–45. [Google Scholar] [CrossRef] [Green Version]
- Alnuaimi, A.S.; Taha, R.A.; Al Mohsin, M.; Al-Harthi, A.S. Causes, Effects, Benefits, and Remedies of Change Orders on Public Construction Projects in Oman. J. Constr. Eng. Manag. 2010, 136, 615–622. [Google Scholar] [CrossRef]
- Hsieh, T.-Y.; Lu, S.-T.; Wu, C.-H. Statistical analysis of causes for change orders in metropolitan public works. Int. J. Proj. Manag. 2004, 22, 679–686. [Google Scholar] [CrossRef]
- Moayeri, V. Design Change Management in Construction Projects Using Building Information Modeling (BIM). Ph.D. Thesis, Concordia University, Montreal, QC, Canada, 2017. [Google Scholar]
- Duffey, R. Predicting Rare Events Risk Exposure Uncertainty and Unknown Unknowns. In Proceedings of the 19th Advances in Risk and Reliability Technology Symposium, Stratford-upon-Avon, UK, 12–14 April 2011. [Google Scholar]
- European Committee for Standardization. Eurocode 8: Design of Structures for Earthquake Resistance. Part 1: General Rules, Seismic Actions and Rules for Buildings, EN 1998-1:200; European Committee for Standardization: Brussels, Belgium, 2004. [Google Scholar]
- Vitiello, U.; Salzano, A.; Asprone, D.; Di Ludovico, M.; Prota, A. Life-Cycle Assessment of Seismic Retrofit Strategies Applied to Existing Building Structures. Sustainability 2016, 8, 1275. [Google Scholar] [CrossRef] [Green Version]
- Kircher, C.A. HAZUS®-MH: Advanced Engineering Building Module (AEBM)—Technical and User’s Manual. Available online: https://www.fema.gov/media-library/assets/documents/16638 (accessed on 30 November 2019).
- Günay, M.S.; Mosalam, K.M. PEER Performance Based Earthquake Engineering Methodology, Revisited. J. Earthq. Eng. 2013, 17, 829–858. [Google Scholar] [CrossRef]
- Calvi, G.M.; Sousa, L.; Ruggeri, C. Energy Efficiency and Seismic Resilience: A Common Approach. In Multi-Hazard Approaches to Civil Infrastructure Engineering; Gardoni, P., LaFave, J.M., Eds.; Springer: Cham, Switzerland, 2016; pp. 165–208. ISBN 978-3-319-29713-2. [Google Scholar]
- European Commitee for Standardization. Eurocode 0—Basis of Structural Design, EN 1990:2002; European Commitee for Standardization: Brussels, Belgium, 2005. [Google Scholar]
- Buildings Performance Institute Europe (BPIE). Europe’s buildings under the microscope: A country-by-country review of the energy performance of buildings. Available online: http://bpie.eu/publication/europes-buildings-under-the-microscope/ (accessed on 30 November 2019).
- Garrido, M.A.; Paulo, P.V.; Branco, F.A. Service life prediction of façade paint coatings in old buildings. Constr. Build. Mater. 2012, 29, 394–402. [Google Scholar] [CrossRef]
- Ortega, L.; Serano, B.; Fran, J. Proposed method of estimating the service life of building envelopes. J. Constr. 2015, 14, 60–68. [Google Scholar]
- Shi, B.; Wang, Z.; Woolery, E.W. Understanding Seismic Hazard and Risk Assessments: An Example in the New Madrid Seismic Zone of the Central United States. In Proceedings of the 8th U.S. National Conference on Earthquake Engineering, San Francisco, CA, USA, 18–22 April 2006. [Google Scholar]
- Cornel, C.A. Engineering Seismic Risk Analysis. Bull. Seismol. Soc. Am. 1968, 58, 1583–1606. [Google Scholar]
- Istituto Nazionale di Geofisica e Vulcanologia (INGV). Interactive Seismic Hazard Maps. Available online: http://esse1-gis.mi.ingv.it/s1_en.php (accessed on 30 November 2019).
- Ministero delle Infrastrutture e dei Trasporti. Norme Tecniche per le Costruzioni, D.M. 17 Gennaio 2018.; Gazzetta Ufficiale n. 42; Ministero delle Infrastrutture e dei Trasporti: Rome, Italy, 2018. [Google Scholar]
- European Committee for Standardization. Sustainability of Construction Works—Environmental Product Declarations- Core Rules for the Product Category of Construction Products, EN 15804:2012 +A2:2019; European Committee for Standardization: Brussels, Belgium, 2019. [Google Scholar]
- Thinkstep. GaBi Software Version 9.2; Thinkstep—A Sphera Company: Leinfelden-Echterdingen, Germany, 2019. [Google Scholar]
- Fraunhofer IBP. Generis Online Software. Available online: www.generis.live (accessed on 10 February 2020).
- Gervasio, H.; Dimova, S. Model for Life Cycle Assessment (LCA) of buildings: EFIResources: Resource Efficient Construction towards Sustainable Design. Available online: https://ec.europa.eu/jrc/en/publication/model-life-cycle-assessment-lca-buildings (accessed on 30 November 2019).
- Di Ludovico, M.; Prota, A.; Moroni, C.; Manfredi, G.; Dolce, M. Reconstruction process of damaged residential buildings outside historical centres after the L’Aquila earthquake: Part II—“heavy damage” reconstruction. Bull. Earthq. Eng. 2017, 15, 693–729. [Google Scholar] [CrossRef]
- Risi, M.T.D.; Del Gaudio, C.; Verderame, G.M. Evaluation of Repair Costs for Masonry Infills in RC Buildings from Observed Damage Data: The Case-Study of the 2009 L’Aquila Earthquake. Buildings 2019, 9, 122. [Google Scholar] [CrossRef] [Green Version]
- Regione Abruzzo—Dipartimento infrastrutture, trasporti, mobilità, reti e logistica. Prezzi Informativi Opere Edili nella Regione Abruzzo. 2019. Available online: https://www.regione.abruzzo.it/content/nuovo-prezzario-regionale (accessed on 10 February 2020).
- Labò, S.; Passoni, C.; Marini, A.; Belleri, A.; Camata, G.; Riva, P.; Spacone, E. Diagrid solutions for a sustainable seismic, energy, and architectural upgrade of European RC buildings. In Proceedings of the XII International Conference on Structural Repair and Rehabilitation, Porto, Portugal, 26–29 October 2016. [Google Scholar]
- Labò, S.; Passoni, C.; Marini, A.; Belleri, A.; Riva, P. Diagrid structures as innovative retrofit solutions for existing reinforced concrete buildings. In Proceedings of the 12th Fib International PhD Symposium in Civil Engineering, Prague, Czechia, 29–31 August 2018. [Google Scholar]
- MathWorks. MATLAB® Software,R2019b (Version 9.7); Mathworks: Natick, MA, USA, 2019. [Google Scholar]
- Inflation.eu. Inflation—Current and Historic Inflation by Country. Available online: https://www.inflation.eu/inflation-rates/italy/historic-inflation/hicp-inflation-italy-2019.aspx (accessed on 30 November 2019).
- PWC. Low Carbon Economy Index 2018. Available online: https://www.pwc.co.uk/ghost/low-carbon-economy-index-2018.html (accessed on 30 November 2019).
- Applied Technology Council for the Federal Emergency Management Agency (FEMA). Performance Assessment Calculation Tool (PACT); Applied Technology Council for the Federal Emergency Management Agency (FEMA): Washington, WA, USA, 2012. [Google Scholar]
- Welch, D.P.; Sullivan, T.J.; Calvi, G.M. Developing Direct Displacement-Based Procedures for Simplified Loss Assessment in Performance-Based Earthquake Engineering. J. Earthq. Eng. 2014, 18, 290–322. [Google Scholar] [CrossRef]
© 2020 by the authors. Licensee MDPI, Basel, Switzerland. This article is an open access article distributed under the terms and conditions of the Creative Commons Attribution (CC BY) license (http://creativecommons.org/licenses/by/4.0/).

 ,
, 


