Living Environment Quality Determinants, Including PM2.5 and PM10 Dust Pollution in the Context of Spatial Issues—The Case of Radzionków


Faculty of Architecture, Cracow University of Technology, 31-155 Cracow, Poland
Buildings 2020, 10(3), 58; https://0-doi-org.brum.beds.ac.uk/10.3390/buildings10030058
Submission received: 3 February 2020
/
Revised: 10 March 2020
/
Accepted: 11 March 2020
/
Published: 14 March 2020
(This article belongs to the Special Issue Architecture and Engineering: the Challenges - Trends - Achievements)
Abstract
:This article discusses living environment determinants in Central and Eastern Europe. It is based on a case study of the city of Radzionków, which has 16 thousand inhabitants and is located in the Silesian agglomeration in southern Poland. Hard coal has been mined in this area for almost two hundred years, and it is the main fuel used for central heating. A total of 360 buildings, divided into groups of 60 buildings each, were investigated in the selected city. Three distinct areas were distinguished in terms of living environment quality, depending on building technical condition, heating method and location. These qualities were found to be largely determined by site-specific spatial and geophysical conditions. A significant portion of the literature was found to ignore the spatial factors mentioned in this paper, instead focusing primarily on statistical data concerning pollution. This study examines site-specific variables and presents differences in air pollution levels as examined in relation to the morphological structure of development, the degree of building modernisation and heating system types.
1. Introduction
At present, the problem of air pollution caused by inefficient heat sources has become one of the most important urban problems of Central and Eastern Europe. On the macro scale, air pollution resulting from the use of fossil fuels for heating is extremely harmful to the Earth’s climate due to greenhouse gas emissions, while on the local and the regional scale, it has a direct, negative impact on human health (e.g., PM2.5 and PM10 pollution) [1,2,3]. Particulates, due to their dimensions, can be transported over considerable distances even by weak winds. It was found that solid particles (0.1–1 µm) can be transported over a distance of up to several thousand kilometres [4]. The latest research [5] shows that a significant amount of PM10 emitted in Silesia can be transported several hundred kilometres to eastern or northern Poland, and even to Scandinavia. Air pollution emitted in this area of Poland can be considered an external source of air pollution, affecting, among others, the eastern regions of the Czech Republic [6]. Poland, along with Bulgaria, is one of the countries with the highest levels of PM10 air pollution (above 50 µg/m3) in Europe [7,8,9]. Both high-altitude and low-altitude emissions have a significant impact on measurable and perceptible air quality in living areas [10,11,12,13,14,15]. Emissions at an altitude of 40 m above ground level are considered to be high altitude emissions. Low altitude emissions include all sources of particle pollution up to a height of 40 m. In Poland, the primary sources of low altitude emissions are domestic furnaces and boilers, with road transport also being a significant but smaller contributor.
Particle pollution caused by fine and coarse particulates (PM2.5 and PM10, respectively) is presently one of the most important scientific problems [16]. PM2.5 is particulate matter that consists of particles smaller than 2.5 µm in diameter, while PM10 is composed of particles that range between 2.5 µm and 10 µm in diameter. Both types are extremely dangerous. Inhaling harmful substances can lead to various respiratory and cardiovascular disorders [17]. Epidemiological studies confirm that permanent exposure to PM2.5 significantly contributes to a higher incidence of cardiopulmonary disease and complications that can lead to increased mortality rates [18,19]. Therefore, a better and more comprehensive understanding of all conditions related to PM2.5 and PM10 pollution is necessary. This can significantly contribute to preventing air pollution and protecting human health. A substantial amount of research has been conducted on PM2.5 and PM10 pollution around the world. The main areas of focus include spatial issues and the time of occurrence of pollution [5,6,7,8,9,10], particle pollution sources [20,21,22,23], effects on human health [24,25,26,27] and estimation studies [28,29,30,31].
Studies have shown that on the macro scale, meteorological conditions affect PM2.5 and PM10 levels [32,33,34,35]; on the micro scale, PM2.5 pollution is strongly associated with land use [36,37,38,39]. Some researchers suggest that land use can be optimised to reduce PM2.5 and PM10 levels on an urban level [40,41,42]. However, there is a noticeable lack of research into the link between spatial development, urban composition and topography in the context of PM2.5 and PM10 emissions [37,43]. Therefore, the author made an attempt to determine the impact of land use on PM2.5 and PM10 pollution levels and to present pollutant distribution across different functional and spatial zones. This can be considered necessary and significant even in the case of Radzionków, a city located in southern Poland, which has very distinct climatic, topographic and spatial conditions.
There is insufficient available data to carry out research of land use impact on the degree of PM2.5 and PM10 pollution, which is a major challenge. Several attempts to study this subject have been made during the current decade. Pollutant concentrations should be interpolated using dense monitoring grids, while in reality, monitoring sites are usually rare and sparsely placed, with less than ten locations in large cities, while in small towns there is often only one. Dispersion models that simulate pollutant behaviour may be useful in some cases, but their dependence on many spatial variables requires very accurate input data [44,45].
In Poland, energy and climate policy, particularly concerning air pollution prevention, has been steadily increasing in prominence in public debates, political decisions and academic research. However, it is more commonly associated with problems of the mining and energy sector rather than the problems of the direct pollution of urban areas. Popular opinion among Polish citizens holds that the air in small-town and rural areas is cleaner and healthier than in large cities and metropolises. However, scientific publications in this field prove that the situation is quite the opposite—air quality in small towns and rural areas is often observed to be much poorer [46,47,48,49]. The problem of air pollution in small urbanised areas in Poland is largely connected with the use of conventional, old and inefficient energy carriers and central heating systems [50]. The effects of using low-calorie coal include the emission of harmful compounds into the atmosphere. These compounds include sulphur dioxide (SO2), nitrogen oxides (NOx), carbon oxides (COx) and harmful particulates. Particulates with a diameter below 10 µm, including PM2.5 and PM10, are considered to be the most harmful [51]. Direct inhalation of particulates (PM2.5) is associated with an increased incidence of cardiovascular disease [52]. These particulates often include other impurities such as arsenic, cadmium, nickel and polycyclic aromatic hydrocarbons, which are considered mutagenic, such as benzo(a)pyrene, as well as substances that contribute to carcinogenicity. They are also one of the most dangerous air pollutants [53,54]. The burning of conventional energy carriers such as hard coal contributes to the degradation of the natural environment via the greenhouse effect and water and soil pollution. In Polish small towns and rural areas, the problem is additionally compounded by obsolete power grids.
Gas distribution grids are also poorly developed and are absent in many areas. The quality of the living environment depends on many factors [55]. It is largely determined by a location’s existing spatial conditions. The topography and development spatial structure of an area can be considered significant when analysing air quality and pollution. Many reports on the living environment do not take spatial factors into account, as they focus solely on pollution statistics [56,57,58]. In this study, the author, taking into account site-specific variables, shows differences in air pollution measurements for designated locations relative to the morphological structure of their development. The study aimed at answering two fundamental questions.
- What are the key factors that contribute to PM2.5 and PM10 pollution under the conditions of a small Polish town whose development has historically been based on coal mining?
- Which structures generate the most pollution in this situation?
2. Object and Method of Research
Radzionków is a city and municipality in south-western Poland, in Tarnowskie Góry County in the Silesian Voivodeship. It is located in the northern part of the Upper Silesian Industrial District (GOP), which is one of the most important cultural, academic and economic centres in Poland. The oldest mentions of Radzionków are dated to between 1326 and 1357. The subject of the study was the northern and central part of the municipality of Radzionków. In terms of morphology, the central part of its structure is a surviving oval system with a historical trail. Most of the buildings in the area are located along streets that are delineated along plot boundaries. The buildings located in the city’s core form frontages and have a regional, classicist character, with stone featured in their facades. Their architecture is typical of the end of the nineteenth and the start of the twentieth centuries. Historical architecture is complemented by Modern and Functionalist buildings. Most residential buildings were built after the Second World War, either in a Modern or Postmodern style. In the eastern part of the town, there is a railway line that divides its area into separate zones, with circulation between them provided only by historical tunnels or viaducts above the railway tracks. The eastern part of the city also includes the Silesian Insurgents Park and the Silesian Botanical Garden.
Three types of city heating zones were determined after first outlining six characteristic zones. These areas were selected based on their location, similarities within their development structure in terms of age and architectural form, as well as similar topography. Building insulation and central heating systems were inspected on site. Within the six areas, 60 buildings were randomly selected, and their heating systems and insulation were analysed. In total, the analysis covered 360 buildings divided into 6 groups composed of 60 buildings each. Based on the findings of the analysis, the author delineated 3 major urban zones that displayed distinct heating and insulation systems (Figure 1).
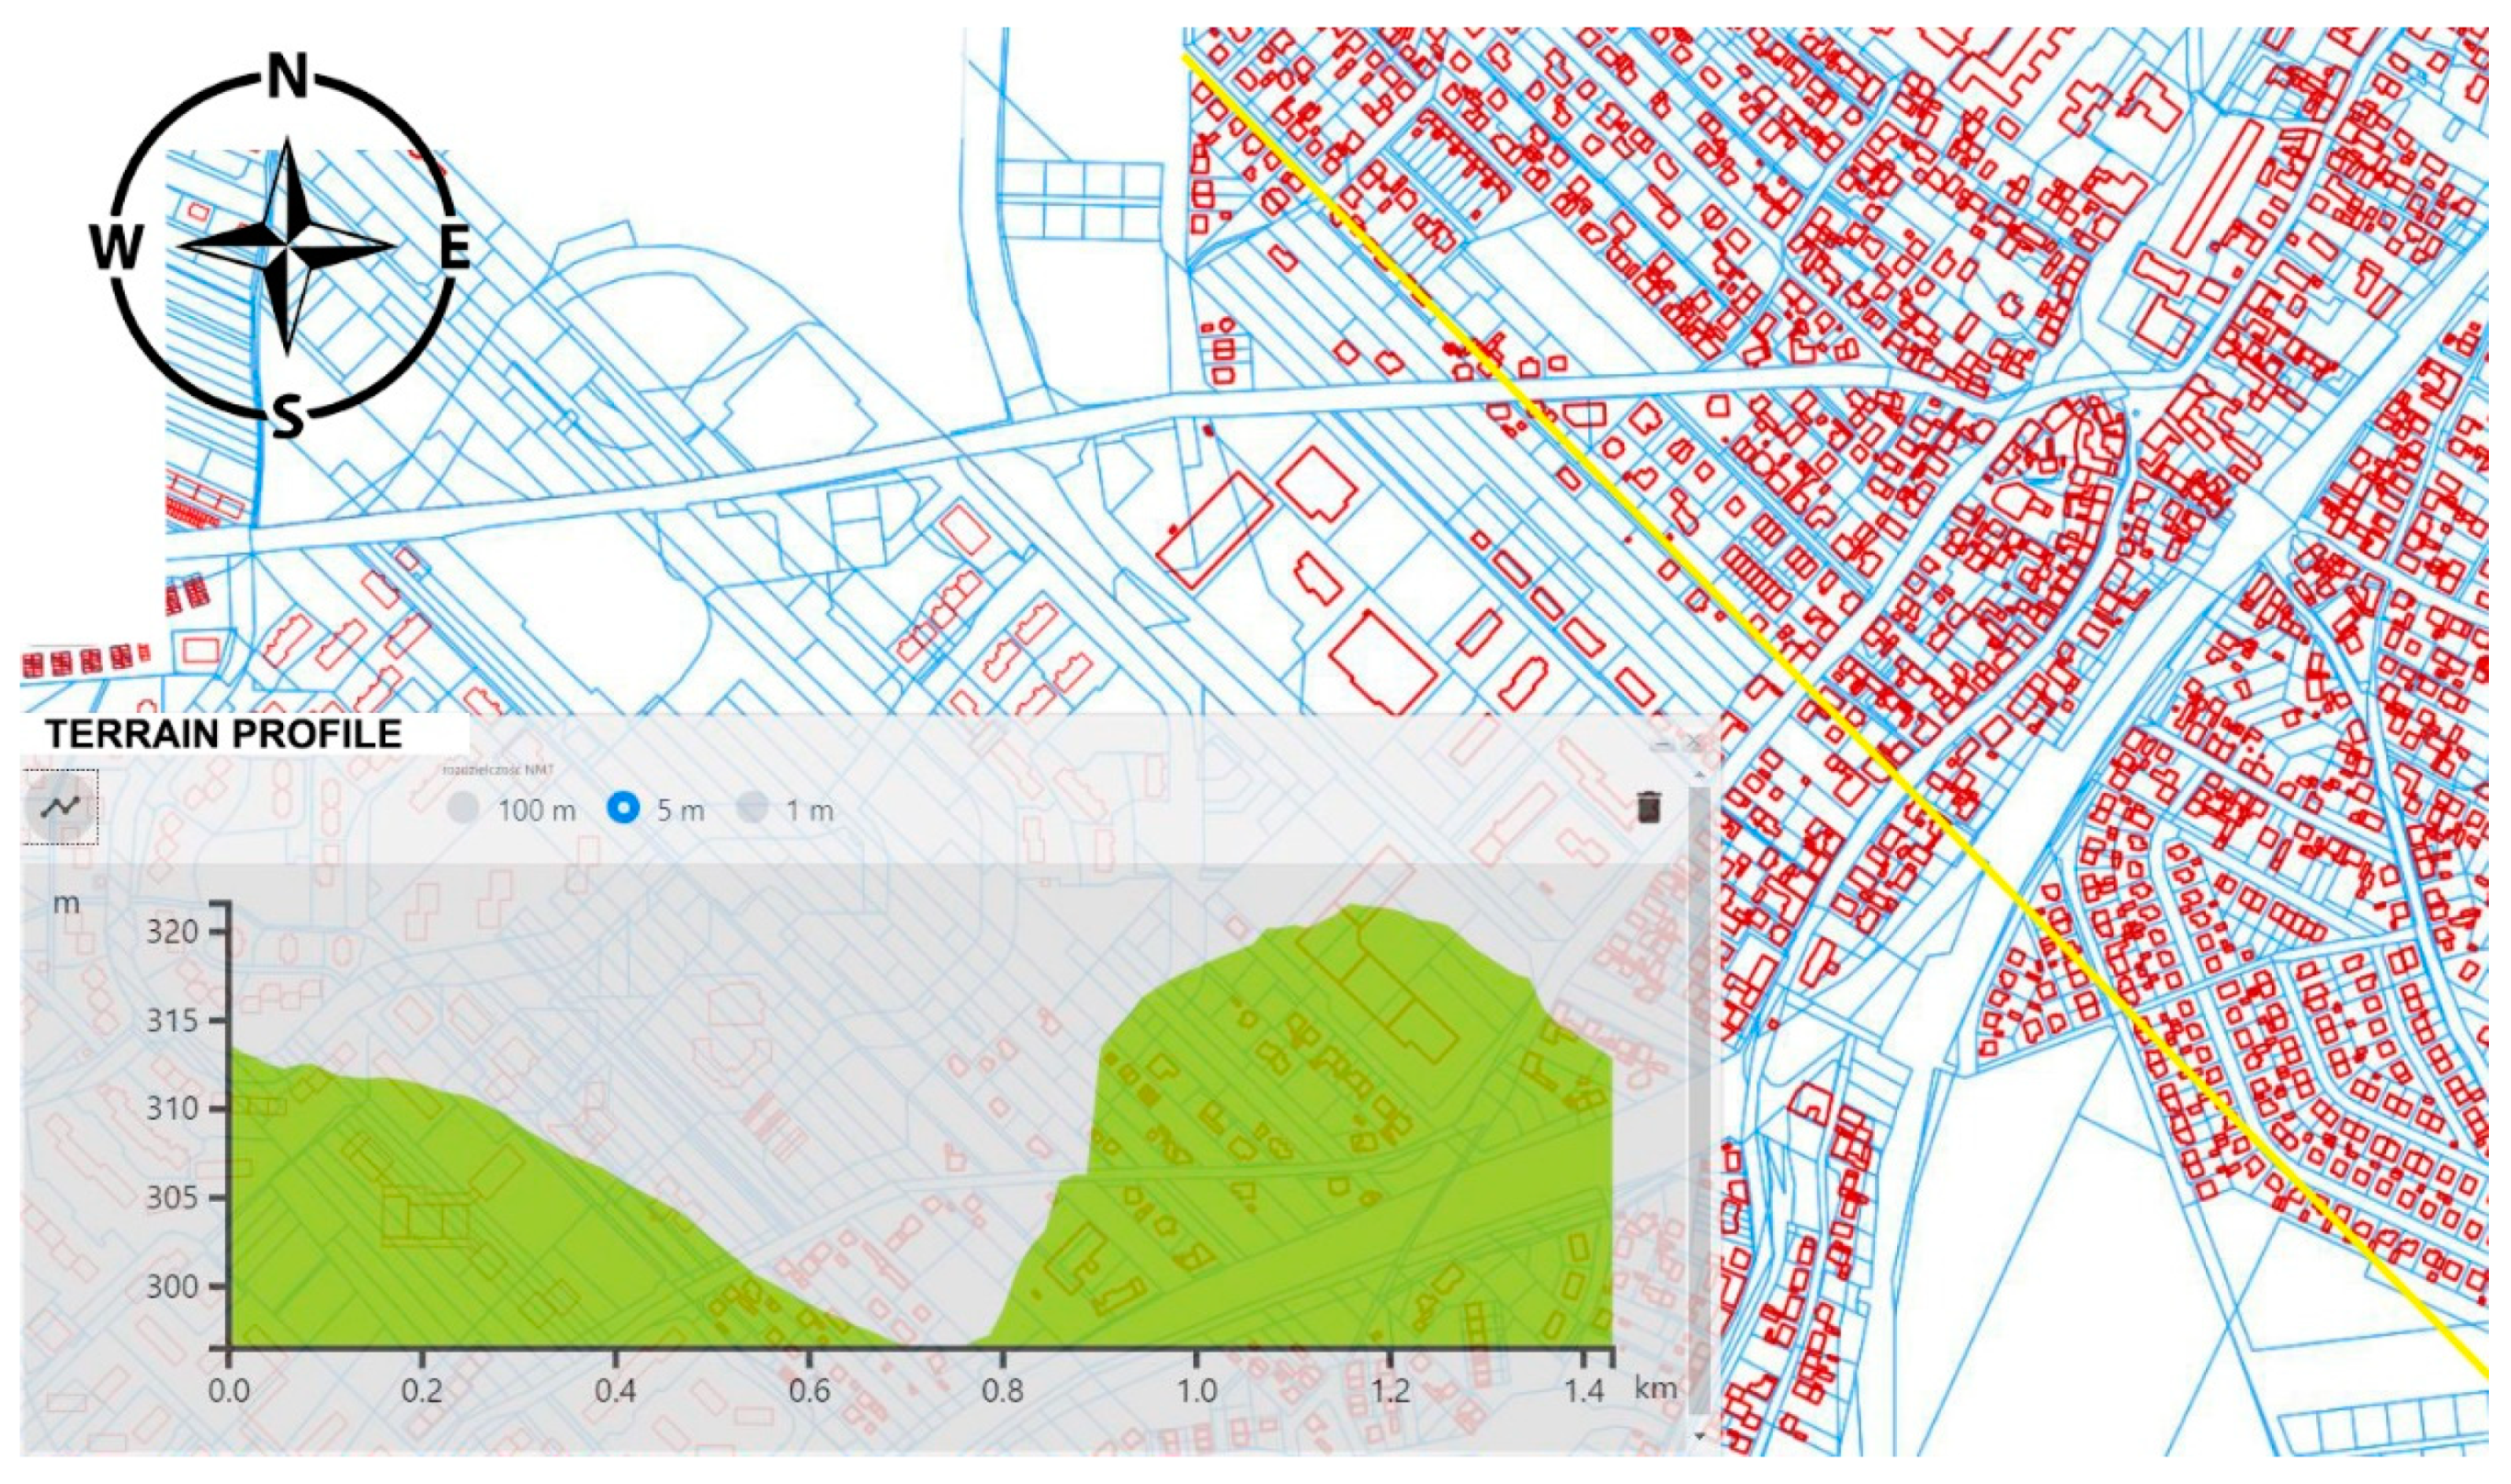
To better explain and illustrate the problem, 4 terrain profiles were presented, showing the valley-like character of the development structure (Figure 2, Figure 3, Figure 4 and Figure 5). Slightly smaller height differences between the valley floor and its edges are present in the northern tip of the valley (Figure 2 and Figure 3). However, the most urbanised part shows the greatest terrain height differences, as here the valley floor is surrounded on both sides by hills with a height of 30 metres (Figure 4 and Figure 5). This adversely affects the natural ventilation of the central zone. One of the presented terrain profiles shows the rise of the terrain opposite to the direction from which fresh air is supplied, along with the prevalent wind directions, i.e., from the south-west (Figure 6, Figure 7 and Figure 8). The area primarily sees south-westerly winds, and this dominant wind direction was presented against the background of the existing urban fabric. The figure also presents streets that are aligned with the city’s direction of ventilation and the streets that form barriers and obstacles to ventilation (Figure 7 and Figure 8). Figure 1 presents the main zones that were delineated after the analysis, designated A, B and C, respectively. Detailed tests and observations of PM2.5 and PM10 levels were performed for zone A (Figure 9). The city has one official air pollution monitoring station. Measurements in each zone were conducted using a certified portable manual measuring device—Steinberg 10030389 SBS-PM2.5/EX10030389. Tests for individual zones were conducted during the winter period in 2018 and 2019. The inspection of the individual zones was performed by moving the particulate matter measuring device to each location and then comparing its readings with results from the official air quality measurement station. The measurements were carried out at 3 locations in each of the following zones: A1, A2, A3, B1, B2, C1, C2 and C3. A total of 25 measuring points were designated in the city. The measurements were performed on days when air pollution readings were high, medium and very low. The test was repeated to verify the results. Sample measurement results will be presented in Figure 10 and Figure 11 The tests were verified and compared with official documents [56,57].
According to official documents, during the formulation of the environmental quality policy, surveys were conducted for 991 buildings/dwellings (780 detached buildings, 116 semi-detached buildings, 76 terraced houses and 19 apartments in housing blocks or tenement houses), 24 businesses and 14 public buildings. In housing, the average house/flat floor area was 129.7 m2 [56,57]. The oldest residential building was dated to 1860, the newest was dated to 2014, while the average building completion date was 1961. Some citizens reported having modern boilers (the latest was from 2015), but a large group of respondents used outdated central heating systems (the oldest being from 1960). The average boiler production year was 2003, and the average power was 20.3 kW. On average, there were 4 people per household. In businesses (firms), the average heated area was reported as 247.9 m2, and the average year of building completion was 1951 (the oldest being from 1800 and the newest from 2011). On the other hand, for used boilers, the average power was 27.5 kW, and the average production year was 2005. For public buildings covered by the survey, the average heated area was 579.0 m2, and the year of building completion was 1960 (the oldest being from 1885 and the newest from 1986). The average boiler power was reported to be only 5 kW, as most public buildings were reported to be connected to the heating grid, and boilers were used only as an additional source of domestic hot water. The average production year reported for these boilers was 2003. The municipal authorities have a plan to replace existing heating installations and co-finance boiler replacement with RES heating media. However, as these changes are being introduced very slowly, they were not observed to have a significant impact on the environment of Radzionków. An additional survey regarding interest in replacing the heat sources conducted on a group of 701 people showed that 81.31% were interested in replacing their heat sources or in purchasing renewable energy sources or a more eco-friendly energy source [56,57]. Another survey showed that only 9.13% of the respondents planned to postpone the replacement of their heating systems to an unspecified point in the future.
3. Results and Discussion
Radzionków’s urban area cannot be treated as a morphologically homogeneous structure. As evidenced by the attached terrain profiles (Figure 2, Figure 3, Figure 4, Figure 5 and Figure 6), Radzionków’s entire urban area is located in a small river valley located in the Szarlejka river catchment, with an incline of 1% from the north-east to south-west is 1%. The attached 4 transverse terrain profiles (Figure 2, Figure 3, Figure 4 and Figure 5) and one longitudinal terrain profile (Figure 6) show the valley-like character of the town’s layout. In addition, the historical layers of the town’s urban tissue development indicate its expansion from the valley floor to areas located at a higher elevation. In order to examine specific environmental zones, 6 areas were initially delineated, selected on the basis of their location, similar development structure, the age and type of local buildings and similar topography. In these areas, 60 buildings were randomly selected and analysed in terms of their heating and insulation systems. A total of 360 buildings were analysed, divided into 6 zones with 60 buildings each. The findings of the analysis enabled the delineated of 3 major urban zones that were distinct in terms of dwelling heating and insulation solutions (Figure 1). Considering the most important environmental conditions from the point of view of urban tissue ventilation, westerly and south-westerly winds were observed to encounter a natural barrier in the form of a 35-metre tall hill on the eastern side of the city (Figure 2, Figure 3, Figure 4 and Figure 5 and Figure 7). Additional obstacles include groups of buildings placed parallel to the roads running along the northwest–southeast direction (Figure 8). In the entire spatial arrangement of the city, only 19% of roads were observed to be oriented along the southwest–northeast direction, the remaining 81% being roads that are mostly perpendicular and thus not intended to ventilate the city (Figure 8). The road layout outside the city centre was mostly created via delineating them along the original outline of fields—perpendicularly to the slopes of hills. Considering the topography of the city and the dominant south-westerly winds, the city’s location can be considered highly unfavourable in terms of its ventilation across the entirety of its territory.
Against the background of existing development tissue, when the age of the buildings is considered, three zones, named A, B and C, respectively, can be clearly distinguished on the basis of their distinct environmental conditions (Figure 1). They provide a basis for formulating conclusions concerning necessary actions related to the high PM2.5 and PM10 levels observed in the city (Figure 9).
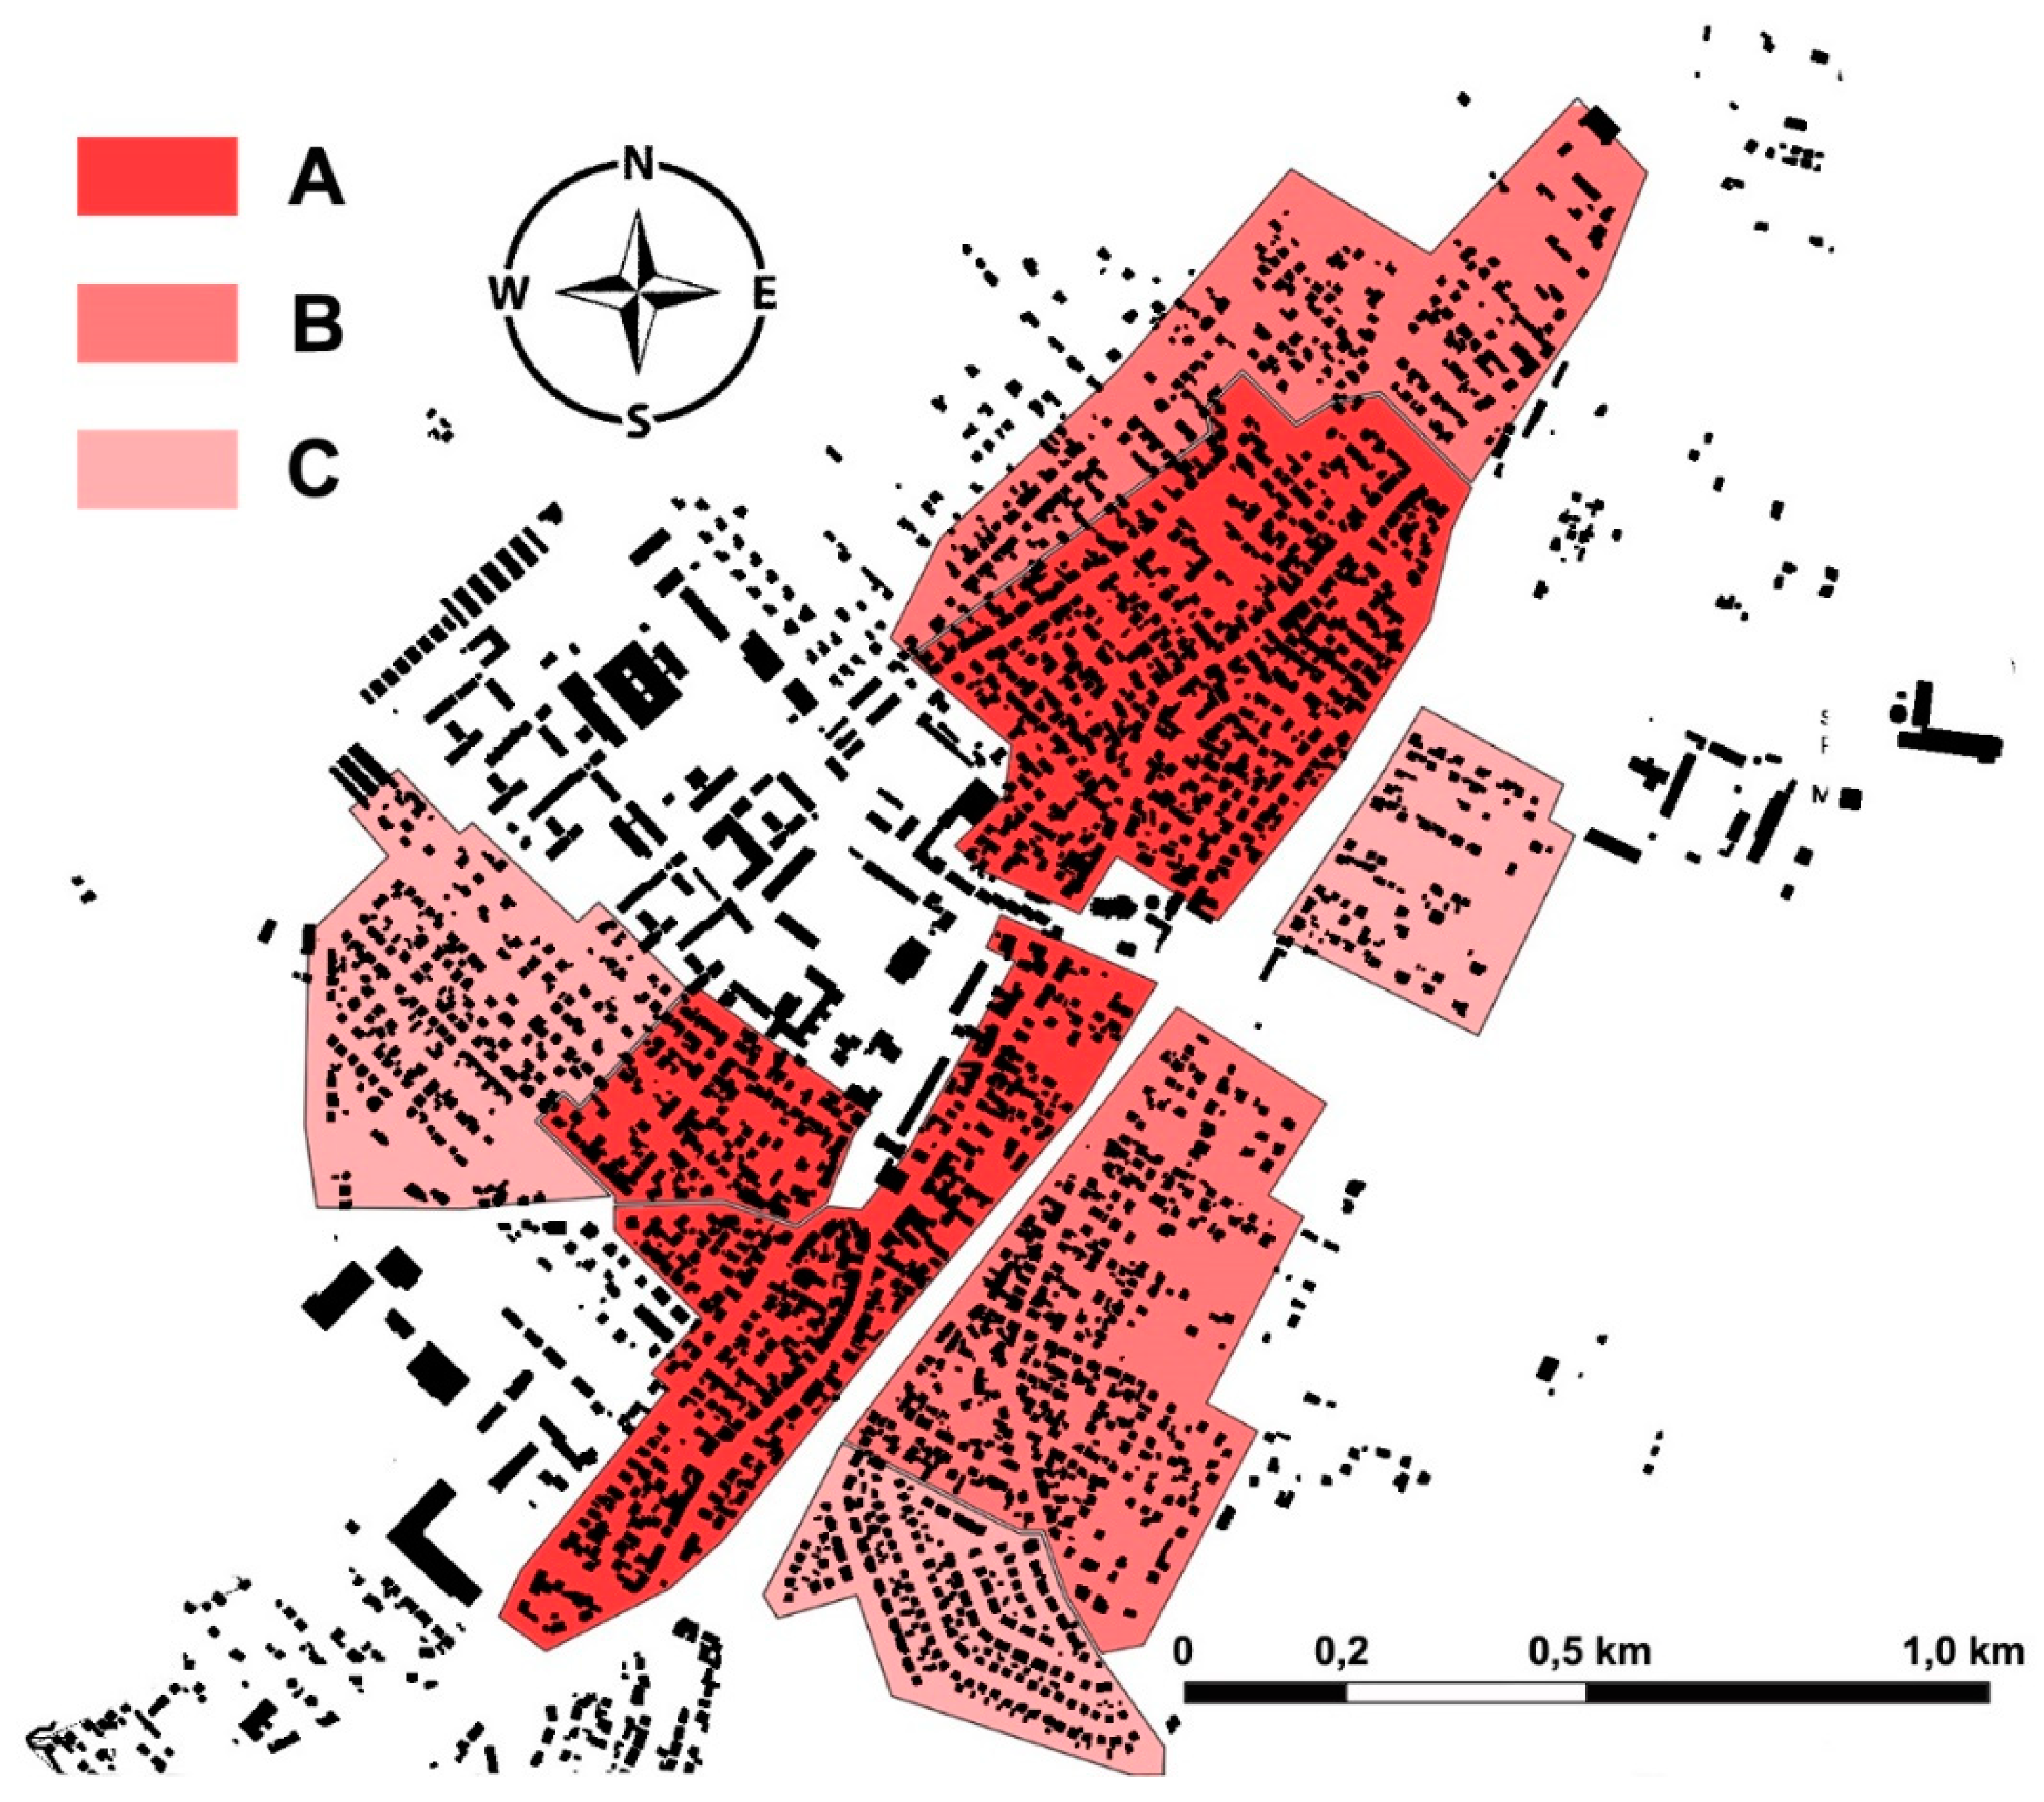
In zone A, 53% of buildings were heated with coal; in zone B, 39% of buildings were heated with coal; in zone C, 35% of buildings were heated with coal. Outside these zones, new housing estates were heated with gas and renewable energy sources, public buildings were heated using the heating grid. In zone A, there were 44% insulated buildings; in zone B, 48% of buildings were insulated; in zone C, 68% of buildings were insulated. Outside of these zones, contemporarily built buildings constructed today were either all insulated or met thermal insulation standards (Figure 1) [58].
3.1. Characteristics of Zone A
Zone A (Figure 1) was observed to have the worst environmental conditions since 53% of buildings were heated with coal. It is also the zone located at the lowest elevation on the valley floor, ranging between 296 m above sea level to 306 m above sea level, with an average 1% incline in the opposite direction to that of the area’s natural ventilation. This zone is hemmed in from the southeast and the northwest by 35-metre hills. In this zone, only 6 streets were observed to run parallel to the direction of the area’s dominant winds. The remaining roads, i.e., approx. 39, were oriented perpendicular to the dominant wind direction. The ventilation of this zone was observed to be the worst because it had the most physical barriers—most of the buildings were oriented parallel to the roads. In zone A, 44% of the buildings were thermally insulated, although the average was skewed upwards by the smallest, sometimes new residential buildings. The largest percentage of the buildings were not thermally insulated. In general, small buildings emit much less pollution than large multi-family buildings, which were reported to be heated by either several individual installations or central former coal installations.
It is also the oldest and the most intensively built-up zone. The development density (the floor area to plot area ration) of this zone ranges between 0.3 and 2.0. In order to improve the quality of the environment, it is necessary to increase expenditure on new building heating systems This can be done by introducing subsidies for gas heating or by taking advantage of existing potential in the form of connection to the heating grid that is linked to the Jerzy Ziętek housing estate. The largest stone buildings, often under heritage protection, require special expenditures.
3.2. Characteristics of Zone B
In zone B (Figure 1), 48% of buildings were insulated, with the average inflated by infill buildings after 1980. The closer to the historical layout of the town centre, the more buildings without insulation and that used coal for heating were observed. On the other hand, insulated buildings were observed to be in breach of the building code (Ordinance concerning the technical conditions to be met by buildings and their placement of 2014), specifying the maximum energy intensity parameter at 120 kWh/(m2annum). To meet these parameters, common traditional brick wall technology requires a layer of mineral wool or polystyrene sheets with a thickness of 15 cm and a lambda factor of 0.031 W/(mK) (Figure 12) [58]. Typically, the insulation thickness ranged between 5 and 10 cm. In zone B, 39% of the buildings were heated with coal, which significantly contributed the deterioration of the quality of the environment in this area but at the same time affected the deterioration of the environment in zone A, which is located on the valley floor. In area B, on the slopes of hills, streets perpendicular to the direction of ventilation become natural pollution funnels that direct it towards the valley floor. According to Office of the City of Radzionków, the average age of coal boilers in Radzionków area were boilers installed 17 years ago—it can be assumed that the average boiler age in this area is compliant with official data. Most of the buildings in this zone are dated to the post-war period and were built mostly between 1945 and 1990.
3.3. Characteristics of Zone C
In zone C (Figure 1), 68% of the buildings were insulated, as they were mostly relatively new buildings built on the outskirts of the city. The closer to the centre, the more the number of insulated buildings decreased and their age increased. Most of the insulated buildings were observed to be in breach of the building code (Ordinance concerning the technical conditions to be met by buildings and their placement of 2014), specifying the maximum energy intensity parameter at 120 kWh/(m2annum). This situation was similar to the one observed in zone B [58]. The thickness of buildings insulation layers varied between 5 and 10 cm (Figure 12). In zone C, 35% of buildings were heated with coal, which significantly contributed to the deterioration of the quality of the environment in this area, similarly affecting zone A, located at the valley floor. According to the Municipal Office, the average age of coal-powered boilers in Radzionków was 17 years—it can be assumed that the average age of boilers in this area was slightly lower than listed in statistical data. Most of the buildings in this zone are dated to the post-war period and were erected between 1960 and 2010.
3.4. Measurements of Air Pollution in the Urban Area of Radzionkow
Currently, there is only one air quality measurement station (Figure 9) in Radzionków. It is located on Szymały Street outside of the designated zones. Its readings seem to be unreliable, due to the open and flat space that surrounds it, which facilitates the area’s ventilation. Furthermore, there are no buildings that use coal for heating up to a distance of 1 km to its west. The measurement station is actually located on the edge of Radzionków’s urban area, where environmental conditions are highly favourable. The measuring equipment is located at a height of approx. 6.5 m. It should, therefore, be assumed that its indications show the most favourable situation in the city, at a site located outside the designated reliable location (A, B, C). On a sunny, windy day, e.g., 30 December 2019, the sensor’s indicators showed a PM10 level of 52 µg/m3. The acceptable total is 50 µg/m3 per day. The readings did not fall below 50 µg/m3 during the entire day, at times reaching 110 µg/m3, with the average hourly reading being approx. 65 µg/m3. Calculated for all hours of the day, this resulted in a combined PM10 amount of 1440 µg/m3 [55,59]. This demonstrates that the readings exceeded standards by as much as 2280% for the entire day, with the daily average exceeding standards by 130%, while overall it exceeded 360 µg/m3 per day—under very favourable weather conditions and measured at a convenient location. According to WHO recommendations, the permissible daily concentration should not be exceeded for more than 35 days in a year, with levels of 300 µg/m3 (daily average) being cause for alarm [55,59].
In terms of permissible PM2.5 standards, European Union Member States have set their maximum levels at 25 µg/m3 [55]. Measurements taken for the purposes of this study showed a value of 30 µg/m3, while in zone A, measured with a hand-held pollution measurement device, they reached 120 µg/m3. Inside a gas-heated building, the readings were as high as 91 µg/m3. In zone A, the test results were four times worse than the readings of the official measurement station. At the same time, this demonstrates that the standard was exceeded by 480%. Daily tests performed during the period with the highest concentrations of PM2.5 at the measurement station, which reported a level of 75 µg/m3, produced readings at a level of 300 µg/m3 on the hand-held device in zone A, exceeding the standard by 1200%. On less windy days, in zone A, readings taken with the hand-held device exceeded standards by 2000%.
4. Conclusions
In recent years, mathematical LUR (Land Use Regression) models have become an alternative to conventional research approaches [60]. They are used to predict the concentration of atmospheric pollution at a given location by establishing statistical relationships between pollution measurements and potential predictive variables, e.g., land use, traffic and physical features of land use [60,61]. High PM2.5 and PM10 levels observed in a mostly residential and service-oriented zone did not confirm frequently reported findings in which industrial zones have higher air pollution levels than residential zones. This is mainly related to PM2.5 and PM10 emission sources, which are more closely associated with restrictive regulations and inspections of zones used by industrial entities under Polish conditions. On the other hand, in the zones under study, differences in pollution around new multi-family housing and service areas were clearly noticeable. The study did not confirm the findings presented in the simulation model described in [62] and focused on the topographic and functional specificity of areas in Central Europe, rooted in their historical, economic and spatial conditions. As a result of political and economic changes that took place in the twentieth century, Poland has engaged in measures aimed at promoting and supporting renewable energy only relatively recently. The first significant reduction of air pollutant emissions took place in Poland in the 1990s. This was due to the abandonment of old industrial technologies that caused significant environmental pollution. At that time, biomass and coal combustion technology in existing domestic boilers was developed quite successfully [63]. Unfortunately, changes in domestic heating technologies affected less urbanised areas to a smaller extent. In the municipal and multi-family housing sector in Poland, they are regulated and modernised in many places. In the private sector, low-efficiency furnaces with no dedusting systems are used the most often. The purpose of this paper is to highlight the problem of reducing emissions at low altitudes with a particular emphasis on topography. The paper discusses development challenges that are often faced by selected municipal authorities in the area under study.
The research showed that:
- The location of air pollution measurement stations is crucial as it can affect their readings, and well-ventilated sites at higher altitudes can underreport pollution values;
- The topographic altitude of urban development has a very strong impact on PM2.5 and PM10 air pollution readings;
- Development layouts that inhibit ventilation of the spatial structure adversely affect air quality, even in cases of quite favourable altitude (part of zone C in the southern part of Radzionków);
- Built-up basins and valleys arranged perpendicularly (corridor) to the dominant wind direction, wherein most streets are oriented perpendicular to the most common wind directions, generate very unfavourable initial conditions in terms of air pollution (the shape and form of the Radzionków basin in relation to the wind rose);
- There is evidence in support of the argument that the period during which the Silesian agglomeration and its land ownership structure developed determined their impact on the environment;
- Residential buildings built before 1980 (zone A and B) were observed to generate the greatest air pollution,
- The smallest air pollution was generated by buildings owned by municipalities and education authorities, which rely on the municipal heating grid.
Several postulates can be formulated for the case under study:
- Using coal for domestic heating should be prohibited in zones A and B of the Radzionków basin on account of their extremely unfavourable topographic conditions, with a requirement to achieve building energy consumption levels as stipulated in applicable Polish construction regulations for 2017, i.e., 95 kWh/(m2annum);
- In zone A, designating ventilation corridors should be a priority, while in zone C, all buildings should be fitted out with insulation;
- The co-financing planned for the insulation of buildings and supporting the replacement of coal-fuelled boilers with gas-powered ones or other heating devices using renewable energy planned in the municipality should apply to zones A and B to a greater extent. Municipal funds should be allocated appropriately for each zone; efficient results can be achieved as a measure of environmental policy in some quantitative value, for example: 55% of funds for zone A, 35% of funds for zone B, 15% of funds for zone C; in addition, the allocated funds should include a clause on the necessity of spending them within a year of receipt;
- The planned measures intended to reduce PM2.5 and PM10 levels should first focus on the centre and then shift outwards from there.
Funding
This research received no external funding.
Conflicts of Interest
The author declares no conflict of interest.
References
- Bilgen, S.; Sarıkaya, I. Energy for environment, ecology and sustainable development. Renew. Sustain. Energy Rev. 2015, 51, 1115–1131. [Google Scholar] [CrossRef]
- Kampa, M.; Castanas, E. Human health efects of air pollution. Environ. Pollut. 2008, 151, 362–367. [Google Scholar] [CrossRef] [PubMed]
- Hendryx, M.; Fedorko, E. The relationship between toxics release inventory discharges and mortality rates in rural and urban areas of the United States. J. Rural Health 2011, 27, 358–366. [Google Scholar] [CrossRef] [PubMed]
- QUARG. Airborne Particulate Matter in the UK; Third Report of the Quality of Urban Air Review, Group; Harrison, R.M., Ed.; Institute of Public and Environmental Health, University of Birmingham: Birmingham, UK, 1996. [Google Scholar]
- Grewling, Ł.; Bogawski, P.; Kryza, M.; Magyar, D.; Šikoparija, B.; Skjøth, C.A.; Udvardy, O.; Wermer, M.; Smith, M. Concomitant occurrence of anthropogenic air pollutants, mineral dust and fungal spores during long-distance transport of ragweed pollen. Environ. Pollut. 2019, 254, 112948. [Google Scholar] [CrossRef] [PubMed]
- Kozáková, J.; Pokorná, P.; Vodicka, P.; Ondrácková, L.; Ondrácek, J.; Krumal, K.; Mikuška, P.; Hovorka, J.; Moravec, P.; Schwarz, J. The influence of local emissions and regional air pollution transport on a European air pollution hot spot. Environ. Sci. Pollut. Res. Int. 2019, 26, 1675–1692. [Google Scholar] [CrossRef] [PubMed]
- Adamczyk, J.; Piwowar, A.; Dzikuc, M. Air protection programmes in Poland in the context of the low emission. Environ. Sci. Pollut. Res. 2017, 24, 16316–16327. [Google Scholar] [CrossRef]
- Naydenova, I.; Petrova, T.; Velichkova, R.; Simova, I. PM10 exceedance in Bulgaria. In Proceedings of the CBU International Conference Proceedings, Prague, Czech Republic, 21–23 March 2018; Volume 6, pp. 1129–1138. [Google Scholar]
- Beloconi, A.; Chrysoulakis, N.; Lyapustin, A.; Utzinger, J.; Vounatsou, P. Bayesian geostatistical modelling of PM10 and PM2.5 surface level concentrations in Europe using high-resolution satellite-derived products. Environ. Int. 2018, 121, 57–70. [Google Scholar] [CrossRef]
- Gehrsitz, M. The efect of low emission zones on air pollution and infant health. J. Environ. Econ. Manag. 2017, 83, 121–144. [Google Scholar] [CrossRef] [Green Version]
- Ellison, R.B.; Greaves, S.P.; Hensher, D.A. Five years of London’s low emission zone: Effects on vehicle fleet composition and air quality. Transp. Res. D Transp. Environ. 2013, 23, 25–33. [Google Scholar] [CrossRef]
- Holman, C.; Harrison, R.; Querol, X. Review of the efficacy of low emission zones to improve urban air quality in European cities. Atmos. Environ. 2015, 111, 161–169. [Google Scholar] [CrossRef]
- De Marco, A.; Proietti, C.; Anav, A.; Ciancarella, L.; D’Elia, I.; Fares, S.; Fornasier, M.F.; Fusaro, L.; Gualtieri, M.; Manes, F.; et al. Impacts of air pollution on human and ecosystem health, and implications for the National Emission Ceilings Directive: Insights from Italy. Environ. Int. 2019, 125, 320–333. [Google Scholar] [CrossRef] [PubMed]
- Cai, B.; Liang, S.; Zhou, J.; Wang, J.; Cao, L.; Qu, S.; Xu, M.; Yang, Z. China high resolution emission database (CHRED) with point emission sources, gridded emission data, and supplementary socioeconomic data. Resour. Conserv. Recycl. 2018, 129, 232–239. [Google Scholar] [CrossRef]
- Alyuz, U.; Alp, K. Emission inventory of primary air pollutants in 2010 from industrial processes in Turkey. Sci. Total Environ. 2014, 488, 369–381. [Google Scholar] [CrossRef] [PubMed]
- Han, L.; Zhou, W.; Li, W.; Li, L. Impact of urbanization level on urban air quality: A case of fine particles (PM2.5) in Chinese cities. Environ. Pollut. 2014, 194, 163–170. [Google Scholar] [CrossRef]
- Makkonen, U.; Hellén, H.; Anttila, P.; Ferm, M. Size distribution and chemical composition of airborne particles in south-eastern Finland during different seasons and wildfire episodes in 2006. Sci. Total Environ. 2010, 408, 644–651. [Google Scholar] [CrossRef]
- Pope, C.A., III; Dockery, D.W. Health effects of fine particulate air pollution: Lines that connect. J. Air Waste Manag. 2006, 56, 709–742. [Google Scholar] [CrossRef]
- Pope, C.A.; Turner, M.C.; Burnett, R.; Jerrett, M.; Gapstur, S.M.; Diver, W.R.; Krewski, D.; Brook, R.D. Relationships between fine particulate air pollution, cardiometabolic disorders, and cardiovascular mortality. Circ. Res. 2015, 116, 108–115. [Google Scholar] [CrossRef]
- Behera, S.N.; Sharma, M. Reconstructing primary and secondary components of PM2.5 composition for an urban atmosphere. Aerosol Sci. Technol. 2010, 44, 983–992. [Google Scholar] [CrossRef] [Green Version]
- Wang, Z.; Hu, M.; Wu, Z.; Yue, D.; He, L.; Huang, X.; Liu, X.; Wiedensohler, A. Long-term measurements of particle number size distributions and the relationships with air mass history and source apportionment in the summer of Beijing. Atmos. Chem. Phys. 2013, 13, 10159–10170. [Google Scholar] [CrossRef] [Green Version]
- Wu, D.W.; Fung, J.C.; Yao, T.; Lau, A.K. A study of control policy in the Pearl River Delta region by using the particulate matter source apportionment method. Atmos. Environ. 2013, 76, 147–161. [Google Scholar] [CrossRef]
- Wang, Y.; Li, L.; Chen, C.; Huang, C.; Huang, H.; Feng, J.; Wang, S.; Wang, H.; Zhang, G.; Zhou, M.; et al. Source apportionment of fine particulate matter during autumn haze episodes in Shanghai, China. J. Geophys. Res. 2014, 119, 1903–1914. [Google Scholar] [CrossRef]
- Brook, R.D.; Rajagopalan, S.; Pope, C.A.; Brook, J.R.; Bhatnagar, A.; Diez-Roux, A.V.; Holguin, F.; Hong, Y.; Luepker, R.V.; Mittleman, M.A. Particulate matter air pollution and cardiovascular disease an update to the scientific statement from the American Heart Association. Circulation 2010, 121, 2331–2378. [Google Scholar] [CrossRef] [Green Version]
- Bell, M.L. Assessment of the Health Impacts of Particulate Matter Characteristics; Research Report, No 161; Health Effects Institute: Boston, MA, USA, 2012; pp. 5–38. [Google Scholar]
- Fann, N.; Lamson, A.D.; Anenberg, S.C.; Wesson, K.; Risley, D.; Hubbell, B.J. Estimating the national public health burden associated with exposure to ambient PM2.5 and ozone. Risk Anal. 2012, 32, 81–95. [Google Scholar] [CrossRef]
- Kim, S.Y.; Peel, J.L.; Hannigan, M.P.; Dutton, S.J.; Sheppard, L.; Clark, M.L.; Vedal, S. The temporal lag structure of short-term associations of fine particulate matter chemical constituents and cardiovascular and respiratory hospitalizations. Environ. Health Perspect. 2012, 120, 1094. [Google Scholar] [CrossRef] [Green Version]
- Beckerman, B.S.; Jerrett, M.; Serre, M.; Martin, R.V.; Lee, S.-J.; van Donkelaar, A.; Ross, Z.; Su, J.; Burnett, R.T. A hybrid approach to estimating national scale spatiotemporal variability of PM2.5 in the contiguous. United States. Environ. Sci. Technol. 2013, 47, 7233–7241. [Google Scholar] [CrossRef] [PubMed] [Green Version]
- Geng, G.; Zhang, Q.; Martin, R.V.; van Donkelaar, A.; Huo, H.; Che, H.; Lin, J.; He, K. Estimating long-term PM2.5 concentrations in China using satellite-based aerosol optical depth and a chemical transport model. Remote Sens. Environ. 2015, 166, 262–270. [Google Scholar] [CrossRef]
- Just, A.C.; Wright, R.O.; Schwartz, J.; Coull, B.A.; Baccarelli, A.A.; Tellez-Rojo, M.M.; Moody, E.; Wang, Y.; Lyapustin, A.; Kloog, I. Using high-resolution satellite aerosol optical depth to estimate daily PM2.5 geographical distribution in Mexico City. Environ. Sci. Technol. 2015, 49, 8576–8584. [Google Scholar] [CrossRef] [PubMed] [Green Version]
- Zhang, T.; Gong, W.; Wang, W.; Ji, Y.; Zhu, Z.; Huang, Y. Ground level PM2.5 estimates over China using satellite-based geographically weighted regression (GWR) models are improved by including NO2 and enhanced vegetation index (EVI). Int. J. Environ. Res. Public Health 2016, 13, 1215. [Google Scholar] [CrossRef]
- Arain, M.A.; Blair, R.; Finkelstein, N.; Brook, J.R.; Sahsuvaroglu, T.; Beckerman, B.; Zhang, L.; Jerrett, M. The use of wind fields in a land use regression model to predict air pollution concentrations for health exposure studies. Atmos. Environ. 2007, 41, 3453–3464. [Google Scholar] [CrossRef]
- Madsen, C.; Carlsen, K.C.L.; Hoek, G.; Oftedal, B.; Nafstad, P.; Meliefste, K.; Jacobsen, R.; Nystad, W.; Carlsen, K.-H.; Brunekreef, B. Modeling the intra-urban variability of outdoor traffic pollution in Oslo,Norway—A GA 2 LEN project. Atmos. Environ. 2007, 41, 7500–7511. [Google Scholar] [CrossRef]
- Wilton, D.; Szpiro, A.; Gould, T.; Larson, T. Improving spatial concentration estimates for nitrogen oxidesusing a hybrid me teorological dispersion/land use regression model in Los Angeles, CA and Seattle, WA.Sci. Total Environ. 2010, 408, 1120–1130. [Google Scholar] [CrossRef] [PubMed]
- Li, X.; Liu, W.; Chen, Z.; Zeng, G.; Hu, C.; León, T.; Liang, J.; Huang, G.; Gao, Z.; Li, Z.; et al. The application of semicircular-buffer-based land use regression models incorporating wind direction in predicting quarterly NO2 and PM10 concentrations. Atmos. Environ. 2015, 103, 18–24. [Google Scholar] [CrossRef]
- Lam, T.; Niemeier, D. An exploratory study of the impact of common land-use policies on air quality. Transp. Res. D Transp. Environ. 2005, 10, 365–383. [Google Scholar] [CrossRef]
- Bandeira, J.M.; Coelho, M.C.; Sá, M.E.; Tavares, R.; Borrego, C. Impact of land use on urban mobility patterns, emissions and air quality in a Portuguese medium-sized city. Sci. Total Environ. 2011, 409, 1154–1163. [Google Scholar] [CrossRef] [PubMed] [Green Version]
- Zhang, R.S.; Pu, L.J.; Liu, Z. Advances in research on atmospheric environment effects of land use and land cover change. Area Res. Dev. 2013, 32, 123–128. [Google Scholar]
- Chen, L.D.; Sun, R.H.; Liu, H.L. Eco-environmental effects of urban landscape pattern changes: Progresses, problems and perspectives. Acta Ecol. Sin. 2013, 33, 1042–1050. [Google Scholar] [CrossRef] [Green Version]
- Briggs, D.J.; de Hoogh, C.; Gulliver, J.; Wills, J.; Elliott, P.; Kingham, S.; Smallbone, K. A regression-based method for mapping traffic-related air pollution: Application and testing in four contrasting urban environments. Sci. Total Environ. 2000, 253, 151–167. [Google Scholar] [CrossRef]
- Jerrett, M.; Arain, A.; Kanaroglou, P.; Beckerman, B.; Potoglou, D.; Sahsuvaroglu, T.; Morrison, J.; Giovis, C. A review and evaluation of intra-urban air pollution exposure models. J. Expo. Sci. Environ. Epidemiol. 2005, 15, 185–204. [Google Scholar] [CrossRef]
- Liu, C.; Henderson, B.H.; Wang, D.; Yang, X.; Peng, Z.-R. A land use regression application into assessing spatial variation of intra-urban fine particulate matter (PM2.5) and nitrogen dioxide (NO2) concentrations in City of Shanghai, China. Sci. Total Environ. 2016, 565, 607–615. [Google Scholar] [CrossRef]
- Sun, L.; Wei, J.; Duan, D.H.; Guo, Y.M.; Yang, D.X.; Jia, C.; Mi, X.T. Impact of Land-Use and Land-Cover Change on urban air quality in representative cities of China. J. Atmos. Sol.-Terr. Phys. 2016, 142, 43–54. [Google Scholar] [CrossRef]
- Henderson, S.B.; Beckerman, B.; Jerrett, M.; Brauer, M. Application of land use regression to estimate long-term concentrations of traffic-related nitrogen oxides and fine particulate matter. Environ. Sci. Technol. 2007, 41, 2422–2428. [Google Scholar] [CrossRef] [PubMed]
- Liu, W.; Li, X.; Chen, Z.; Zeng, G.; León, T.; Liang, J.; Huang, G.; Gao, Z.; Jiao, S.; He, X.; et al. Land use regression models coupled with meteorology to model spatial and temporal variability of NO2, and PM10, in Changsha, China. Atmos. Environ. 2015, 116, 272–280. [Google Scholar] [CrossRef]
- Olszowski, T.; Tomaszewska, B.; Góralna-Włodarczyk, K. Air quality in non-industrialised area in the typical Polish countryside based on measurements of selected pollutants in immission and deposition phase. Atmos. Environ. 2012, 50, 139–147. [Google Scholar] [CrossRef]
- Błaszczyk, E.; Rogula-Kozłowska, W.; Klejnowski, K.; Kubiesa, P.; Fulara, I.; Mielżyńska-Švach, D. Indoor air quality in urban and rural kindergartens: Short-term studies in Silesia, Poland. Air Qual. Atmos. Health 2017, 10, 1207–1220. [Google Scholar] [CrossRef] [Green Version]
- Kobza, J.; Geremek, M.; Dul, L. Characteristics of air quality and sources affecting high levels of PM 10 and PM 2.5 in Poland, Upper Silesia urban area. Environ. Monit. Assess. 2018, 190, 515. [Google Scholar] [CrossRef] [Green Version]
- Zajusz-Zubek, E.; Mainka, A.; Korban, Z.; Pastuszka, J.S. Evaluation of highly mobile fraction of trace elements in PM10 collected in Upper Silesia (Poland): Preliminary results. Atmos. Pollut. Res. 2015, 6, 961–968. [Google Scholar] [CrossRef]
- Dzikuc, M.; Kułyk, P.; Urban, S.; Dzikuc, M.; Piwowar, A. Outline of ecological and economic problems associated with the low emission reductions in the Lubuskie Voivodeship. Pol. J. Environ. Stud. 2019, 28, 65–72. [Google Scholar] [CrossRef]
- Nguyen, T.; Park, D.; Lee, Y.; Lee, Y.C. Particulate matter (PM10 and PM2.5) in subway systems: Health-based economic assessment. Sustainability 2017, 9, 2135. [Google Scholar] [CrossRef] [Green Version]
- Dabass, A.; Talbott, E.O.; Venkat, A.; Rager, J.; Marsh, G.M.; Sharma, R.K.; Holguin, F. Association of exposure to particulate matter (PM2.5) air pollution and biomarkers of cardiovascular disease risk in adult NHANES participants (2001–2008). Int. J. Hyg. Environ. Health 2016, 219, 301–310. [Google Scholar] [CrossRef]
- Błaszczyk, E.; Rogula-Kozłowska, W.; Klejnowski, K.; Fulara, I.; Mielżyńska-Švach, D. Polycyclic aromatic hydrocarbons bound to outdoor and indoor airborne particles (PM2.5) and their mutagenicity and carcinogenicity in Silesian kindergartens, Poland. Air Qual. Atmos. Health 2017, 10, 389–400. [Google Scholar] [CrossRef] [Green Version]
- Kujda, Ł.; Kozacki, D.; Pociech, D.; Hryniewicz, M. Effect of the renewable energy resources on the reduction of pollution emissions from the rural areas. Probl. Agric. Eng. 2016, 93, 59–67. [Google Scholar]
- Directive 2008/50/EC of the European Parliament and of the Council of 21 May 2008 on Ambient Air Quality 192 and Cleaner Air for Europe. Available online: https://eur-lex.europa.eu/legal-content/en/ALL/?uri=Celex (accessed on 15 December 2020).
- Low-Emission Economy Plan for the Radzionków Municipality for the Years 2015–2020. Update of the Draft Assumptions to the Plan for the Supply of Heat, Electricity and Gas Fuels for the Radzionków Commune. July 2018. Available online: http://www.bip.radzionkow.pl/?p=documentaction=showid=27696bar_id=17663 (accessed on 15 December 2020).
- Municipal Subsidies for Boiler Replacement in Radzionkow. Available online: http://www.radzionkow.pl/ochrona-zasobow-srodowiska/powietrze/440-dotacje-do-modernizacji-systemu-ogrzewania-z-budzetu-gminy (accessed on 15 December 2020).
- Ordinance of the Minister of Infrastructure of 12th April 2002 Concerning the Technical Conditions to be Met by Buildings and Their Placement. Available online: http://prawo.sejm.gov.pl/isap.nsf/DocDetails.xsp?id=WDU20020750690 (accessed on 15 December 2020).
- Health Effects of Particulate Matter. Policy Implications for Countries in Eastern Europe, Caucasus and Central Asia. Available online: http://www.euro.who.int/data/assets/pdf_file/0006/189051/Health-effects-of-particulate-matter-final-Eng.pdf (accessed on 15 December 2020).
- Olvera, H.A.; Garcia, M.; Li, W.-W.; Yang, H.; Amaya, M.A.; Myers, O.; Burchiel, S.W.; Berwick, M.; Pingitore, N.E., Jr. Principal component analysis optimization of a PM2.5 land use regression model with small monitoring network. Sci. Total Environ. 2012, 425, 27–34. [Google Scholar] [CrossRef] [Green Version]
- Briggs, D.J.; Collins, S.; Elliott, P.; Fischer, P.; Kingham, S.; Lebret, E.; Pryl, K.; Reeuwijk, H.V.; Smallbone, K.; Van Der Veen, A. Mapping urban air pollution using GIS: A regression-based approach. Int. J. Geogr. Inf. Sci. 1997, 11, 699–718. [Google Scholar] [CrossRef] [Green Version]
- He, Z.J.; Yuan, S.L.; Xiao, M. Pollution levels of airborne particulate matter PM10 and PM2.5 in summer inNanchang City. J. Anhui Agric. Sci. 2009, 38, 1336–1338. [Google Scholar]
- Dzikuc, M.; Piwowar, A. Ecological and economic aspects of electric energy production using the biomass co-firing method. The case of Poland. Renew. Sustain. Energy Rev. 2016, 55, 856–862. [Google Scholar] [CrossRef]
Figure 1.
Three zones (A, B and C) with different morphological and environmental conditions in the city of Radzionków, for which different spatial policies should be pursued in terms of protecting the quality of the living environment. Zone A: 53% of buildings were heated with coal; zone B: 39% of buildings were heated with coal; zone C: 35% of buildings were heated with coal.

Figure 2.
Cross-section through the northern section of Radzionków’s urban zone—the difference in elevation between the central and valley part is around 32 m; the terrain has a northwest-facing slope with an incline of around 7%. (Original work based on data from https://mapy.geoportal.gov.pl).
Figure 2.
Cross-section through the northern section of Radzionków’s urban zone—the difference in elevation between the central and valley part is around 32 m; the terrain has a northwest-facing slope with an incline of around 7%. (Original work based on data from https://mapy.geoportal.gov.pl).

Figure 3.
Cross-section through the central part of Radzionków’s urban area—the difference in elevation between the valley part and the south-eastern side is 45 m, with a 7% incline. (Original work based on data from https://mapy.geoportal.gov.pl).
Figure 3.
Cross-section through the central part of Radzionków’s urban area—the difference in elevation between the valley part and the south-eastern side is 45 m, with a 7% incline. (Original work based on data from https://mapy.geoportal.gov.pl).

Figure 4.
Cross-section through the valley. There are differences in elevation of 30 m on the north-west side and of 35 on the south-west side. The valley has a width of 1400 m in this area. There is an incline of 3.3% in the north and 5% in the south. (Original work based on data from https://mapy.geoportal.gov.pl).

Figure 5.
Cross-section of the urbanised area of Radzionków, the difference in elevation between the valley floor and the surrounding hills is up to 35 m; the lowest and highest points are less than 500 m apart, and the terrain has an incline of 7%. (Original work based on data from https://mapy.geoportal.gov.pl).

Figure 6.
Longitudinal cross-section of Radzionków’s urban zone—a difference in elevation of 14 m over a length of 1400 m has been observed. (Original work based on data from https://mapy.geoportal.gov.pl).
Figure 6.
Longitudinal cross-section of Radzionków’s urban zone—a difference in elevation of 14 m over a length of 1400 m has been observed. (Original work based on data from https://mapy.geoportal.gov.pl).

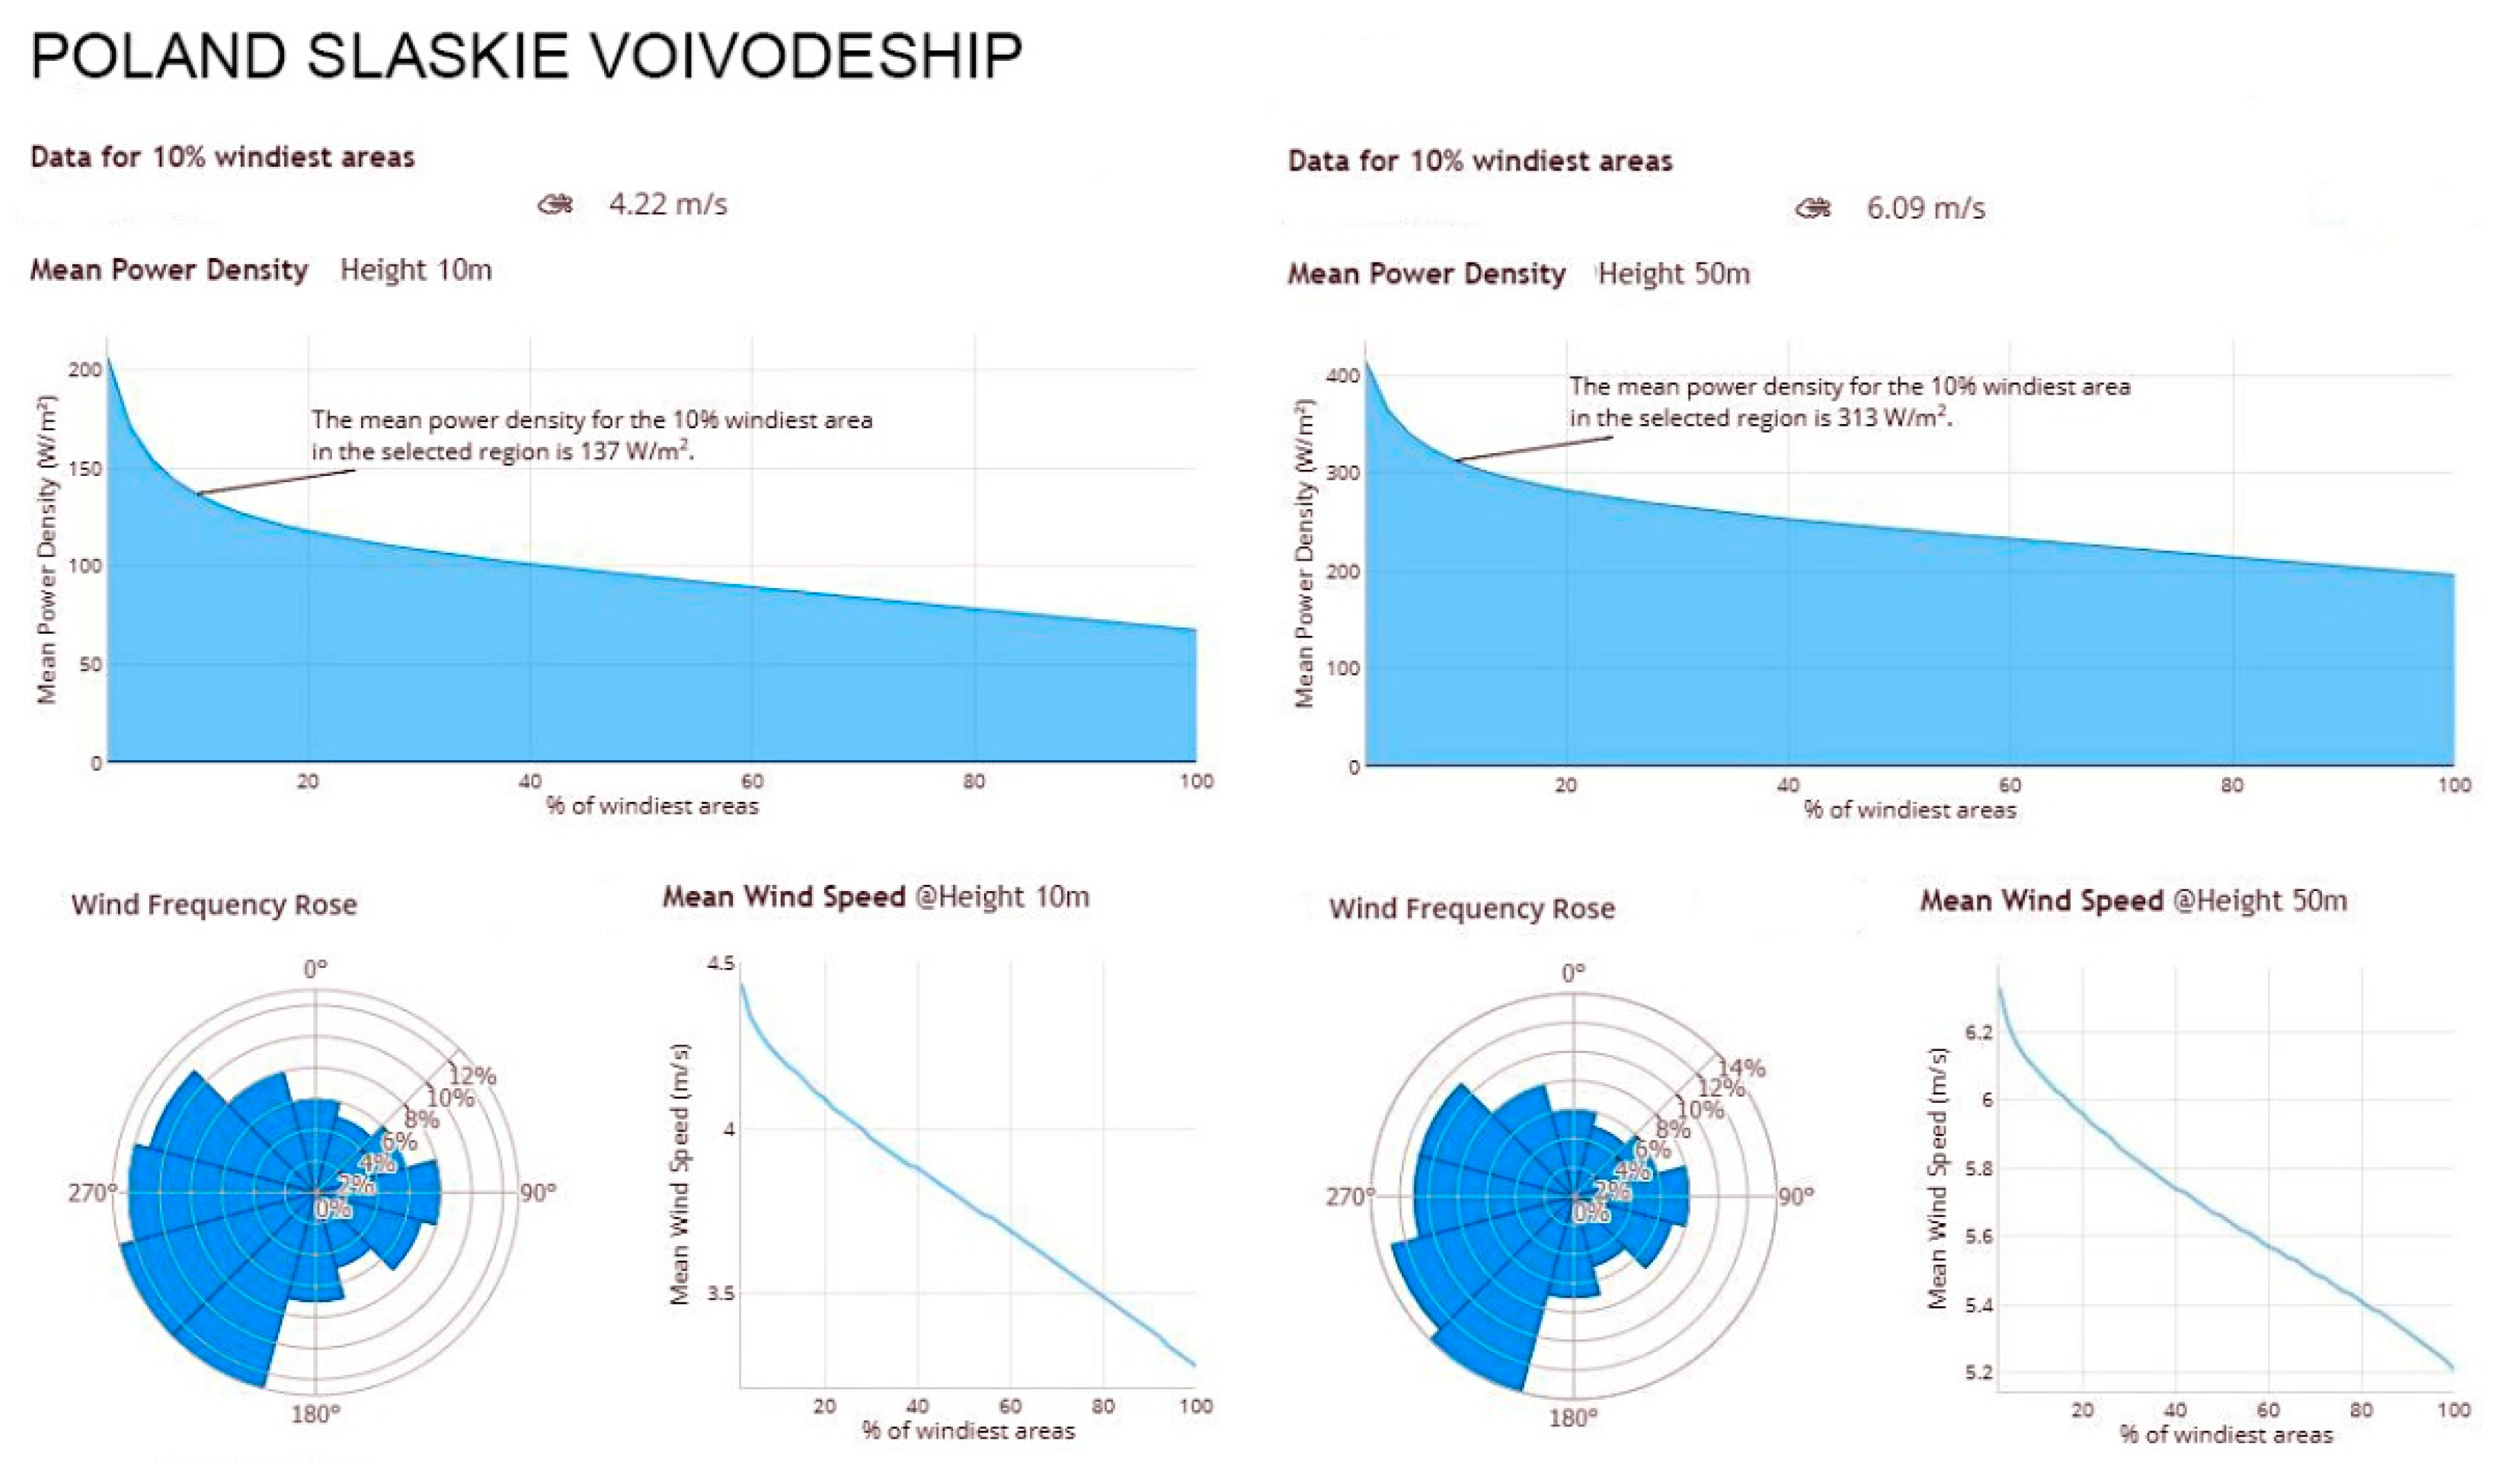
Figure 7.
Dominant wind directions for the Silesian Voivodeship. The illustration shows the strength and direction of the wind at two altitudes: at 10 m and at 50 m. Differences in wind force are clearly noticeable, with significantly weaker wind forces at low altitudes. This leads to there being very little air movement inside the valley, as most of it moves at higher altitudes along with south-westerly winds. (source: https://globalwindatlas.info/area/Poland/%C5%9Al%C4%85skie).

Figure 8.
Radzionków’s urban development structure compared with the dominant wind direction. The figure presents the roads that are perpendicular to the direction of wind flow (coloured magenta) and form barriers that inhibit the city’s ventilation, as well as the low number of roads aligned with the directions of the dominant number of winds (marked yellow).

Figure 9.
Air pollution at the measurement station at Szymały Street. (https://airly.eu/map).
Figure 9.
Air pollution at the measurement station at Szymały Street. (https://airly.eu/map).

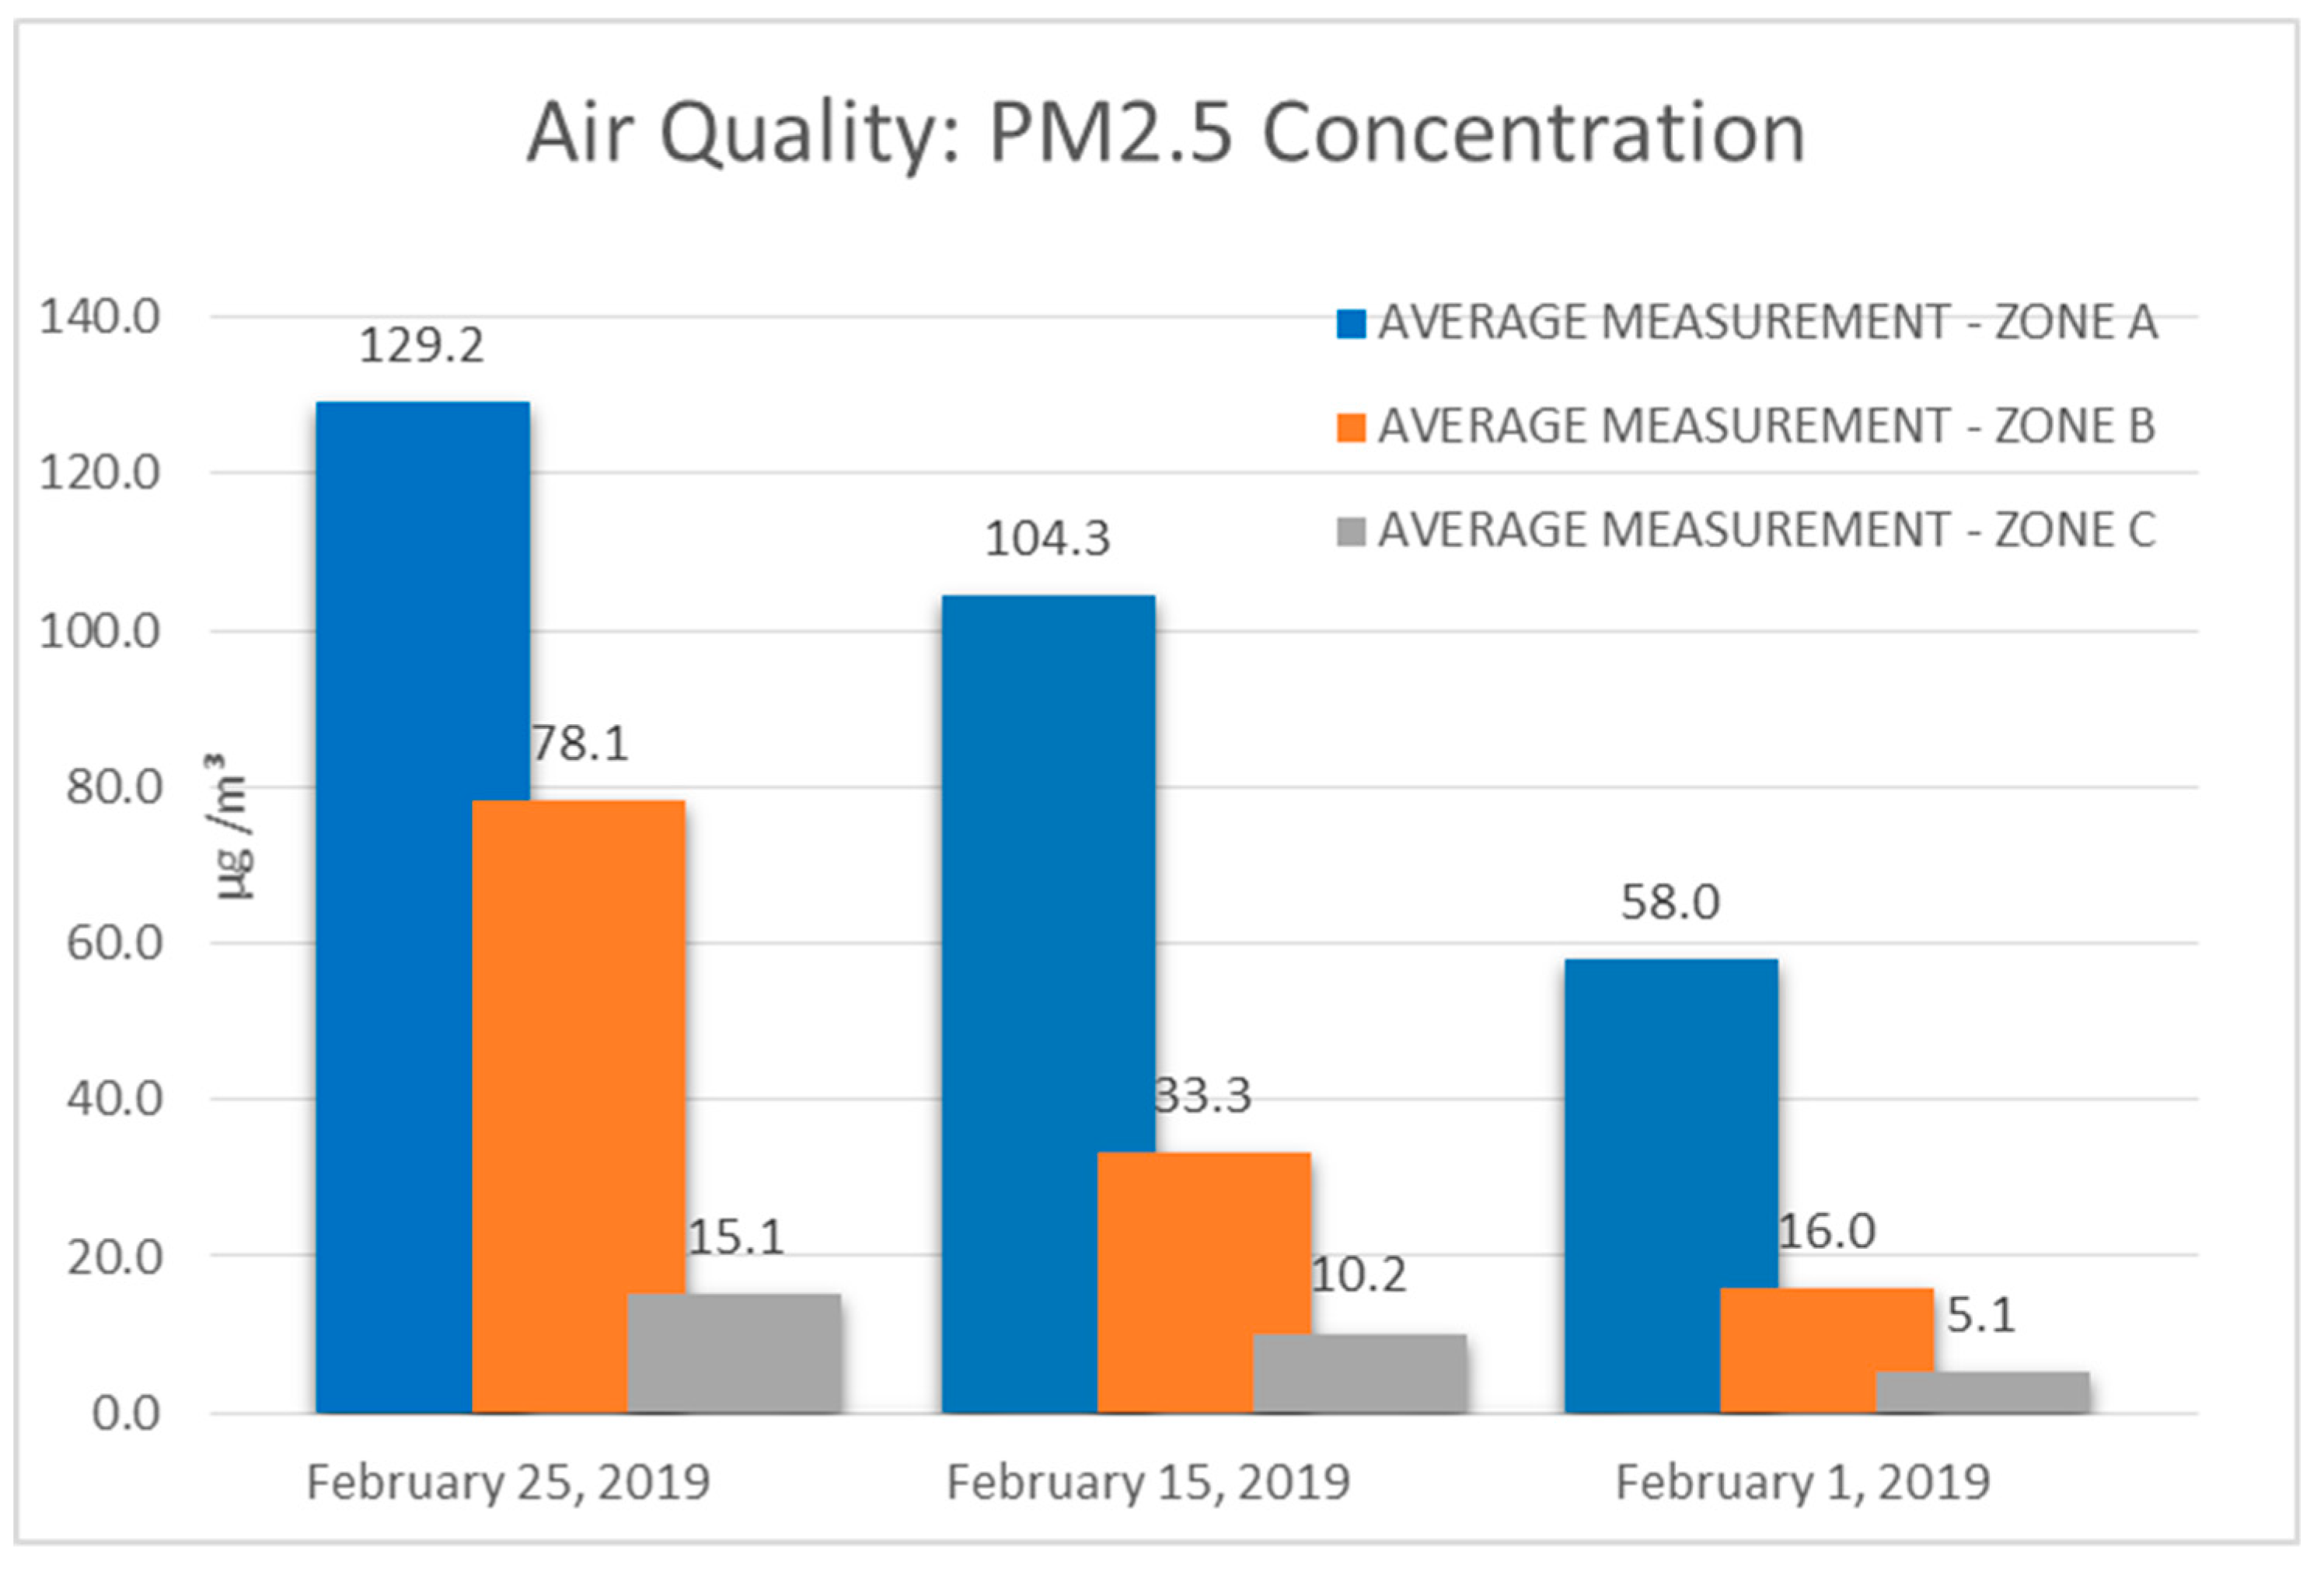
Figure 10.
Results of average PM2.5 level measurements performed in zones A, B, C for 3 different days, one with very high (25 February 2019), high (15 February 2019) and low pollution, respectively (1 February 2019).
Figure 10.
Results of average PM2.5 level measurements performed in zones A, B, C for 3 different days, one with very high (25 February 2019), high (15 February 2019) and low pollution, respectively (1 February 2019).

Figure 11.
Results of average PM10 level measurements in zones A, B, C for 3 different days, one with very high (25 February 2019), high (15 February 2019) and low pollution, respectively (1 February 2019).
Figure 11.
Results of average PM10 level measurements in zones A, B, C for 3 different days, one with very high (25 February 2019), high (15 February 2019) and low pollution, respectively (1 February 2019).

Figure 12.
Change of standards related to thermo-modernisation in Polish legislation in accordance with the Ordinance concerning the technical conditions to be met by buildings and their placement of 2014—120 (kWh/m2 annum); after 2017, the maximum value decreased to 95 (kWh/m2 annum), while after 2021, it is to decrease further down to 70 (kWh/m2 annum) [58].

© 2020 by the author. Licensee MDPI, Basel, Switzerland. This article is an open access article distributed under the terms and conditions of the Creative Commons Attribution (CC BY) license (http://creativecommons.org/licenses/by/4.0/).
Share and Cite
MDPI and ACS Style
Blazy, R. Living Environment Quality Determinants, Including PM2.5 and PM10 Dust Pollution in the Context of Spatial Issues—The Case of Radzionków. Buildings 2020, 10, 58. https://0-doi-org.brum.beds.ac.uk/10.3390/buildings10030058
AMA Style
Blazy R. Living Environment Quality Determinants, Including PM2.5 and PM10 Dust Pollution in the Context of Spatial Issues—The Case of Radzionków. Buildings. 2020; 10(3):58. https://0-doi-org.brum.beds.ac.uk/10.3390/buildings10030058
Chicago/Turabian StyleBlazy, Rafał. 2020. "Living Environment Quality Determinants, Including PM2.5 and PM10 Dust Pollution in the Context of Spatial Issues—The Case of Radzionków" Buildings 10, no. 3: 58. https://0-doi-org.brum.beds.ac.uk/10.3390/buildings10030058
Note that from the first issue of 2016, this journal uses article numbers instead of page numbers. See further details here.