Article

Profitability of Various Energy Supply Systems in Light of Their Different Energy Prices and Climate Conditions

by
Elaheh Jalilzadehazhari
1,*,
Georgios Pardalis
2 and
Amir Vadiee
3
1
Forestry and Wood Technology Department, Linnaeus University, 351 95 Växjö, Sweden
2
Department of Built Environment and Energy Technology, Linnaeus University, 351 95 Växjö, Sweden
3
School of Business Society and Engineering, Division of Civil Engineering and Energy Systems, Mälardalen University, 721 23 Västerås, Sweden
*
Author to whom correspondence should be addressed.
Submission received: 27 April 2020 / Revised: 10 May 2020 / Accepted: 23 May 2020 / Published: 28 May 2020
(This article belongs to the Special Issue Life Cycle Prediction and Maintenance of Buildings)

Abstract

:
The majority of the single-family houses in Sweden are affected by deteriorations in building envelopes as well as heating, ventilation and air conditioning systems. These dwellings are, therefore, in need of extensive renovation, which provides an excellent opportunity to install renewable energy supply systems to reduce the total energy consumption. The high investment costs of the renewable energy supply systems were previously distinguished as the main barrier in the installation of these systems in Sweden. House-owners should, therefore, compare the profitability of the energy supply systems and select the one, which will allow them to reduce their operational costs. This study analyses the profitability of a ground source heat pump, photovoltaic solar panels and an integrated ground source heat pump with a photovoltaic system, as three energy supply systems for a single-family house in Sweden. The profitability of the supply systems was analysed by calculating the payback period (PBP) and internal rate of return (IRR) for these systems. Three different energy prices, three different interest rates, and two different lifespans were considered when calculating the IRR and PBP. In addition, the profitability of the supply systems was analysed for four Swedish climate zones. The analyses of results show that the ground source heat pump system was the most profitable energy supply system since it provided a short PBP and high IRR in all climate zones when compared with the other energy supply systems. Additionally, results show that increasing the energy price improved the profitability of the supply systems in all climate zones.

1. Introduction

The energy renovation of single-family houses remains a challenging task throughout Europe due to threats posed by climate change on different regions’ environments and economies. The current range of energy renovations among member of the European union is between 0.5% and 2.5% per year, with an average of 1% per year [1]. To achieve the European parliament’s target for 40% energy efficiency by 2030, the renovation rate should increase to about 2.5% to 3% of the housing stock per year [1]. Although Sweden set a more ambitious target of 50% more efficient energy use by 2030, compared to the levels from the reference year 1995 [2], the renovation rate in this country was about 0.8% per year in 2016 [1]. At this point, the Swedish residential sector could be a major contributor to achieving the national target for reduction in energy use, since it is responsible for 22% of the country’s total energy consumption, from which 12% comes from single-family houses [3]. Single-family houses account for almost 50% of the total building stock in Sweden [4]. The total heated area (applying the Swedish Atemp definition) of the single-family houses in Sweden was about 293 million square meter in 2016, about 54% larger than the total area of multi-family houses [5]. According to the Swedish Statistics Central Bureau (SCB), 86% of single-family houses are about 30 years old, while 50% of them use electricity to support their heating demands [6]. Moreover, technical installations of single-family houses and insulation layers within building envelopes are likely to be near the end of their expected lifetime [7]. In addition, the existing single-family houses in Sweden primarily exhibit poor energy performance due to technical deterioration in heating, ventilation and air conditioning systems [7].
The energy renovation of single-family houses should be based on two main considerations. First, the energy use of single-family houses after renovation should meet the national energy target. Installing renewable energy supply systems was mainly considered as a solution to reduce the total energy use of single-family houses in Sweden. From 2010 until 2015, the market share of installed heat pumps and photovoltaic solar panels in Sweden increased to about 30% [4] and 19% [8], respectively. The second consideration concentrates on the cost of such an energy supply system for the homeowner. This is because installing renewable energy supply systems requires mainly high-cost investments, setting a great challenge for homeowners [9]. Financing such a supply system often involves taking out a loan, which will only be granted if the renovation increases the value of the property or reduces operational costs to offset the interest costs of the loan. The value of property in Sweden is highly dependent on its location. Accordingly, there is a risk as to the value of the property after installing energy supply systems will not cover the loan. Homeowners need to prioritize the adoption of energy supply systems that will allow them to save a high amount of energy and minimize their operational costs. However, the profitability of renewable energy supply systems is mainly determined by several different factors: Their technical characteristics [10], energy prices [11], interest rates [12], buildings’ energy use patterns [10], climate conditions [13], lifespan [14] and performance gap between actual and predicted energy savings [15], which is considered when analysing the profitability of the supply systems. There are several reasons for the inconstancies between actual and predicted energy savings; but “rebound effect” was frequently discussed by former studies [16,17]. The rebound effect refers to occupants’ tendency to consume more energy due to economic gains provided by energy-efficient renovations.
Although previous studies have analysed the implications of the abovementioned factors on the profitability of renewable energy supply systems in Sweden [12,18,19,20], they provided no information on how simultaneous changes in energy prices, interest rates, climate conditions and lifespan affect their profitability. Towards this direction, this study takes a novel approach and provides with an analysis of the profitability of a ground source heat pump (GSHP), photovoltaic solar panels (PVs) and an integrated ground source heat pump with a PV system (GSHP-PV) for a single-family house in Sweden. The profitability of the energy supply systems was analysed by calculating the payback period (PBP) and internal rate of return (IRR) for these systems. The IRR represents the interest rate, which, for a given time, can be obtained from the investment [21]. A high IRR signifies the profitability of an investment. On the other hand, PBP corresponds to the time in which, for a given discount rate, the investment cost will be repaid [22]. As homeowners prefer investments with low-risk exposure [23], a short PBP is more preferable. The profitability of the GSHP, PV and GSHP-PV systems was analysed for four Swedish climate zones, all with different climate conditions. In addition, three different energy prices, three different interest rates and two different lifespans were considered when calculating the IRR and PBP. Any such approach allows one to analyse how simultaneous changes in energy prices, interest rates, climate conditions and lifespan affect the cost-effectiveness of energy supply systems. The evaluation of the PBP and IRR assists in projecting energy efficiency policies while informing house owners of the outcomes of the investments they decide to make.

2. Methodology

The single-family house had a total heated area of 140 m2, with a ventilated volume of about 350 m3. The heated area was divided over 2 floors above the ground (Figure 1). In addition, the single-family house included an unheated attic with a wooden pitched roof on the 3rd floor. The attic area was equipped with a mechanical ventilation system.
The EnergyPlus simulation tool (8.5.0) was used to evaluate the energy performance of the house. The thermal specifications of the single-family house were in accordance with the national codes at the time of construction in 1979 (Table 1). The heat transfer between the ground and external floor slab followed ISO 13370 [24].
The heating system was an electrical boiler, which was connected to water-based underfloor and radiator distribution systems. The supply and return temperatures of the underfloor and radiator systems were set to 60/45 °C. The domestic hot water consumption was assumed to be 14 m3/person per year, which corresponded to 800 kWh/person per year [25]. The airtightness was assumed to be 1.6 L/s m2 at the pressure of ±50 (Pa), which complied with national codes at the time of construction. In addition, the single-family house was equipped with a mechanical ventilation system, which was comprised of a supply fan and a heat exchanger with an efficiency of 80% and 85%, respectively. The ventilation system was operated 24 h a day. The airflow rate was set to ±0.35 L/m2 to comply with national codes [26]. To ensure comfortable thermal conditions, the upper and lower temperature limits were set to 22 °C and 18 °C, respectively [27]. The occupancy density was about 0.02 persons per 1 m2, while the occupancy internal heat gain was assumed to be 80 W/person, following the recommendations provided by Levin [25] for Swedish housing. The occupancy schedule follows Figure 2 below.
The clothing thermal insulation followed ISO7730-Standard [28], as it was set to be 1 (clo) in winter and 0.5 (clo) in summer. The heat gain from artificial lighting and electric appliances was assumed to be 3.6 W/m2 [12]. The visible reflection of the interior walls, ceilings, and floors was set to be 60%, 80% and 20%, respectively, which complied with the Swedish standard [29].

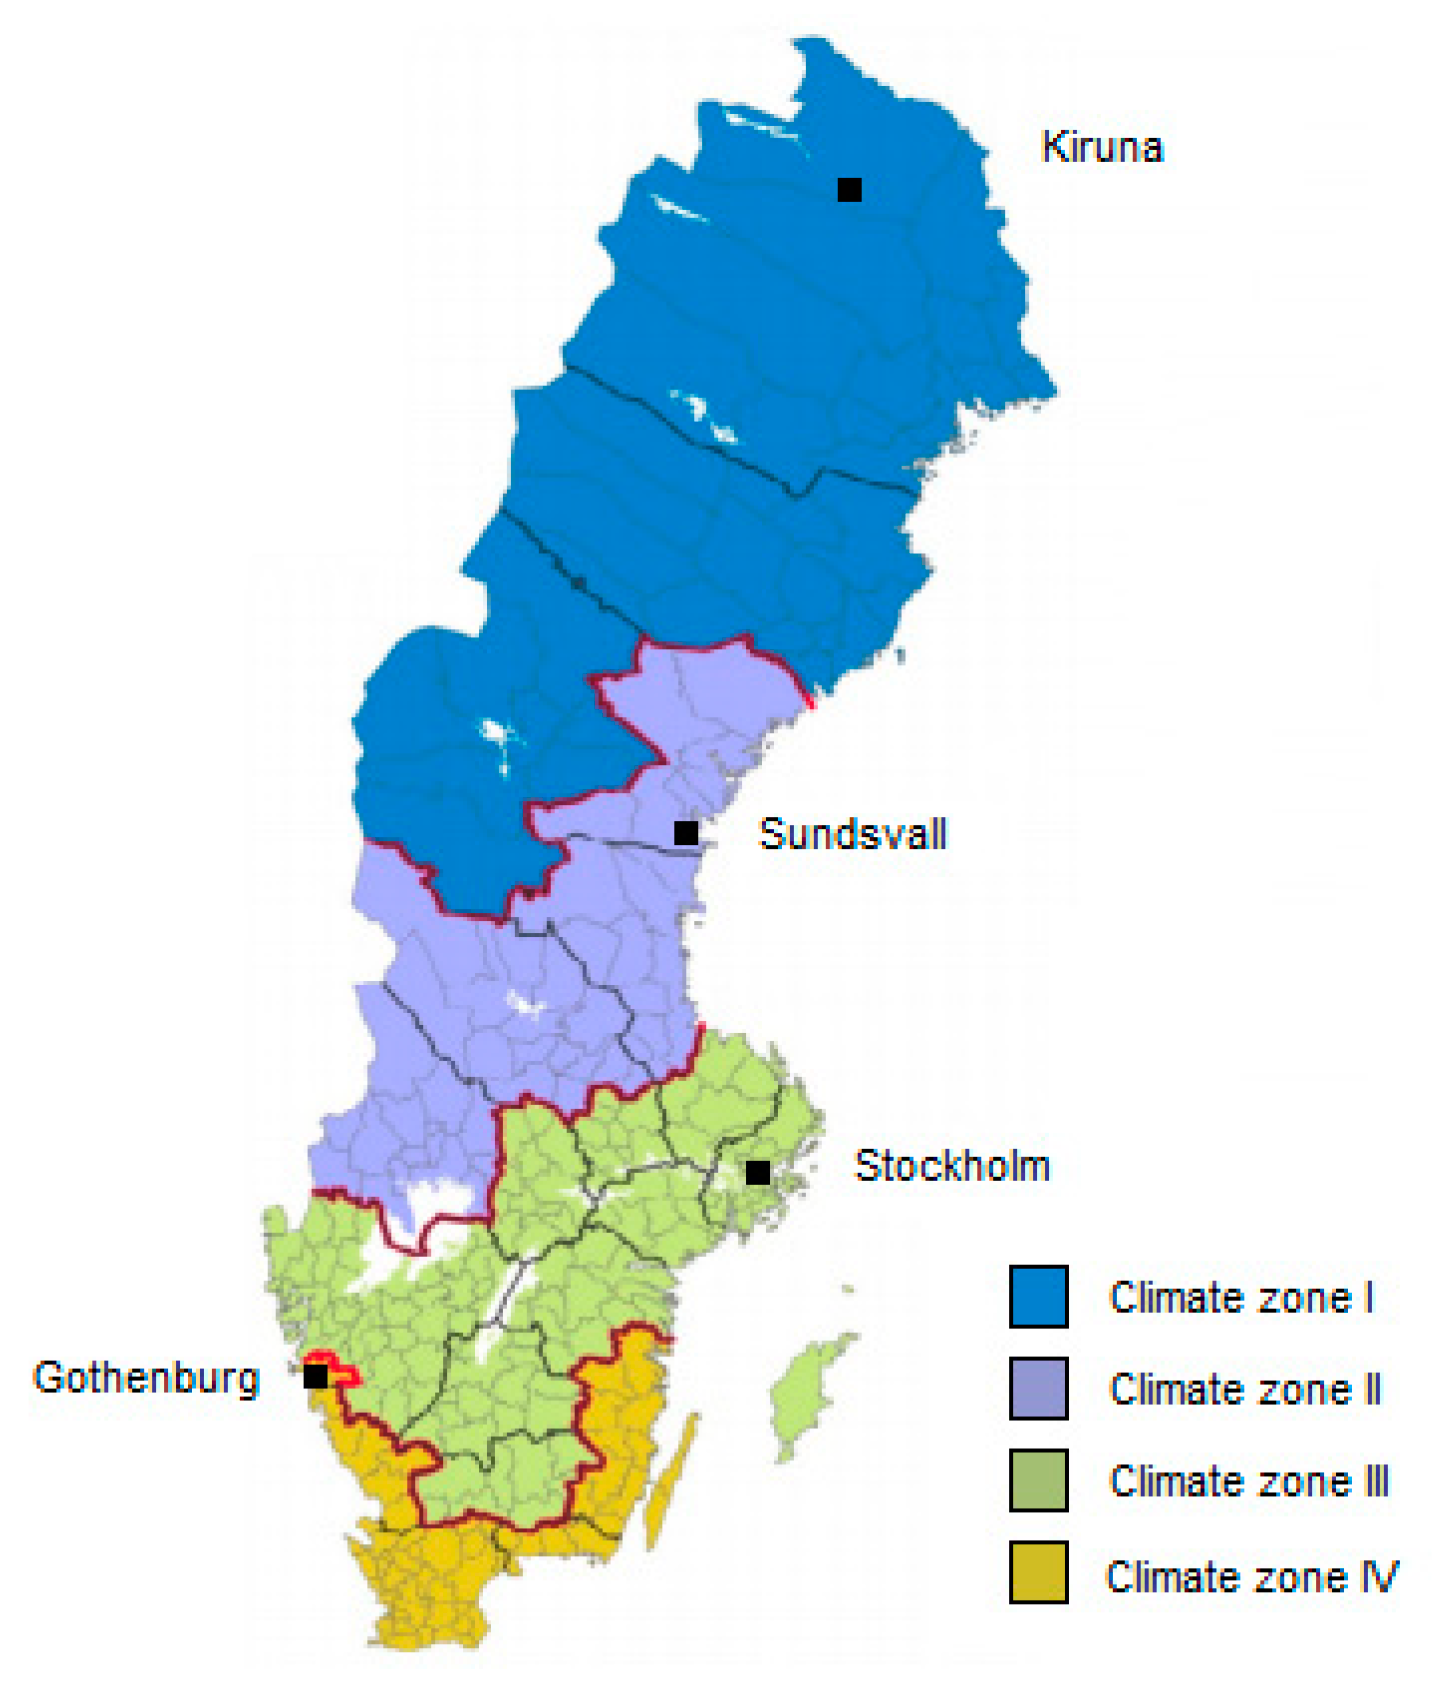
2.1. Weather and Climate Zones in Sweden

Following the Köppen-Geiger climate map, Sweden is located in the cold climate zone (D) [30]. In addition to the abovementioned categorization, the National board of housing building and planning [31] further classified Sweden into 4 climate zones, which allowed for the performing of detailed energy demand calculations based on the different climate conditions. The climate zones vary mainly in their outside design temperatures, annual average temperatures, wind velocity, relative humidity and solar radiation. The Swedish climate zone I represent the coldest and northmost zone, while climate zone IV represents the warmest and furthest south zone [31].
The single-family house was modelled in 4 different cities: Kiruna in climate zone I, Sundsvall in climate zone II, Stockholm in climate zone III, and Gotheborg in climate zone IV (Figure 3). This decision was made to analyse the contribution of the climate zones in terms of the cost-effectiveness of the 3 different energy supply systems in Sweden. Weather data files, required for performing simulations in the respective cities, were collected from Climate OneBuilding [32].

2.2. Energy Supply Systems

Three distinct energy supply systems were considered to improve the energy efficiency of the single-family house. The first considered supply system was a ground source heat pump (GSHP) with a coefficient of performance (COP) of 3 and a total power of 50 kW. The lifespan of the GSHP was 15 years. The 2nd supply system was a solar photovoltaic (PV) system with a lifespan of 20 years. Each PV panel had a power output of 285 W [33]. In total, 31 PV panels with a total area of 43.7 m2 were installed on a south-sloping roof with a 45° tilt toward the south. The third supply system was comprised of an integrated GSHP and PV system (GSHP-PV). The COP, total power and lifespan of the GSHP used in the integrated supply system was similar to those of the first energy supply system. However, the total number of PV panels to be installed in each climate zone varied in order to avoid overproduction issues. Although the overproduced electricity of the system can be sold back to the grid [34], PV panels had significantly higher embodied CO2 when compared with other supply systems [35]. Louwen, Van Sark [36] discussed about great downward trends of the environmental impact of PV production. Although previous studies included the evaluation of embodied CO2 impact of PV systems in their analyses, they used different data sources, technologies, system boundaries, locations and lifespans. The inconsistency in results, presented by previous studies, limits one to derive a robust conclusion about PV systems’ performance in reducing carbon footprints. Table 2 presents the specifications of the PV systems installed in each region.
The schedule for operating the abovementioned supply systems was set to 24/7 since they were designed to support both heating and domestic hot water demands.

2.3. Cost-Effectiveness Evaluations

The IRR and PBP were quantified using Equations (1) and (2). The IRR is the interest rate of “i”, which, for a given lifespan of “t”, the net present value (NPV) is zero. Meanwhile, PBP is the lifespan of “t”, which, for a given interest rate of “i”, makes NPV zero.
NPV = t = 0 n ( D t ) * 1 ( 1 + r ) t ( I + U )
D t = ( E 0 E t ) * α ( 1 + β ) t
where:
  • NPV is the net present value during the lifespan of n year;
  • D’t is the annual energy saving cost;
  • E0 is the initial total energy use before installing the supply systems;
  • Et is the total energy use after installing the supply systems;
  • r is the interest rate;
  • t is the lifespan of n years;
  • α is the energy price per kwh/m²;
  • β is the inflation in energy price (%);
  • I0 is the investment cost;
  • U is the maintenance and installation costs.
The IRR was calculated for the lifespans of 30 and 50 years. In quantifying PBP, the interest rates of 1%, 3% and 5% were considered. This decision was made to analyse the implication of lifespan and interest rate on the IRR and PBP, respectively. In addition, 3 different energy prices were considered when calculating the IRR and PBP (Table 3). Furthermore, the sensitivity of the IRR and PBP to rises in energy prices and changes in lifespan was analysed.
Table 4 presents the investment, maintenance, installation and labour cost of the three renovation packages. In calculating the IRR and PBP, the energy supply systems were replaced when they reached the end of their lifespan.

3. Results and Discussions

Table 5 shows the variation in the total energy consumption of the single-family house before and after installing the energy supply systems in the four regions. The GSHP and GSHP-PV systems reduced the total energy consumption to below 69 (kWh/m2), thereby satisfying the national energy target in reducing total energy use by 50% when compared with 1995. However, the PV system fulfilled the national energy code only in climate zone IV. In addition, the analyses of the results showed that the GSHP-PV system had the best performance in the four regions, as it reduced the total energy use by about 91% in climate zone I, 93% in climate zone II, and 98% in climate zone III and climate zone IV.

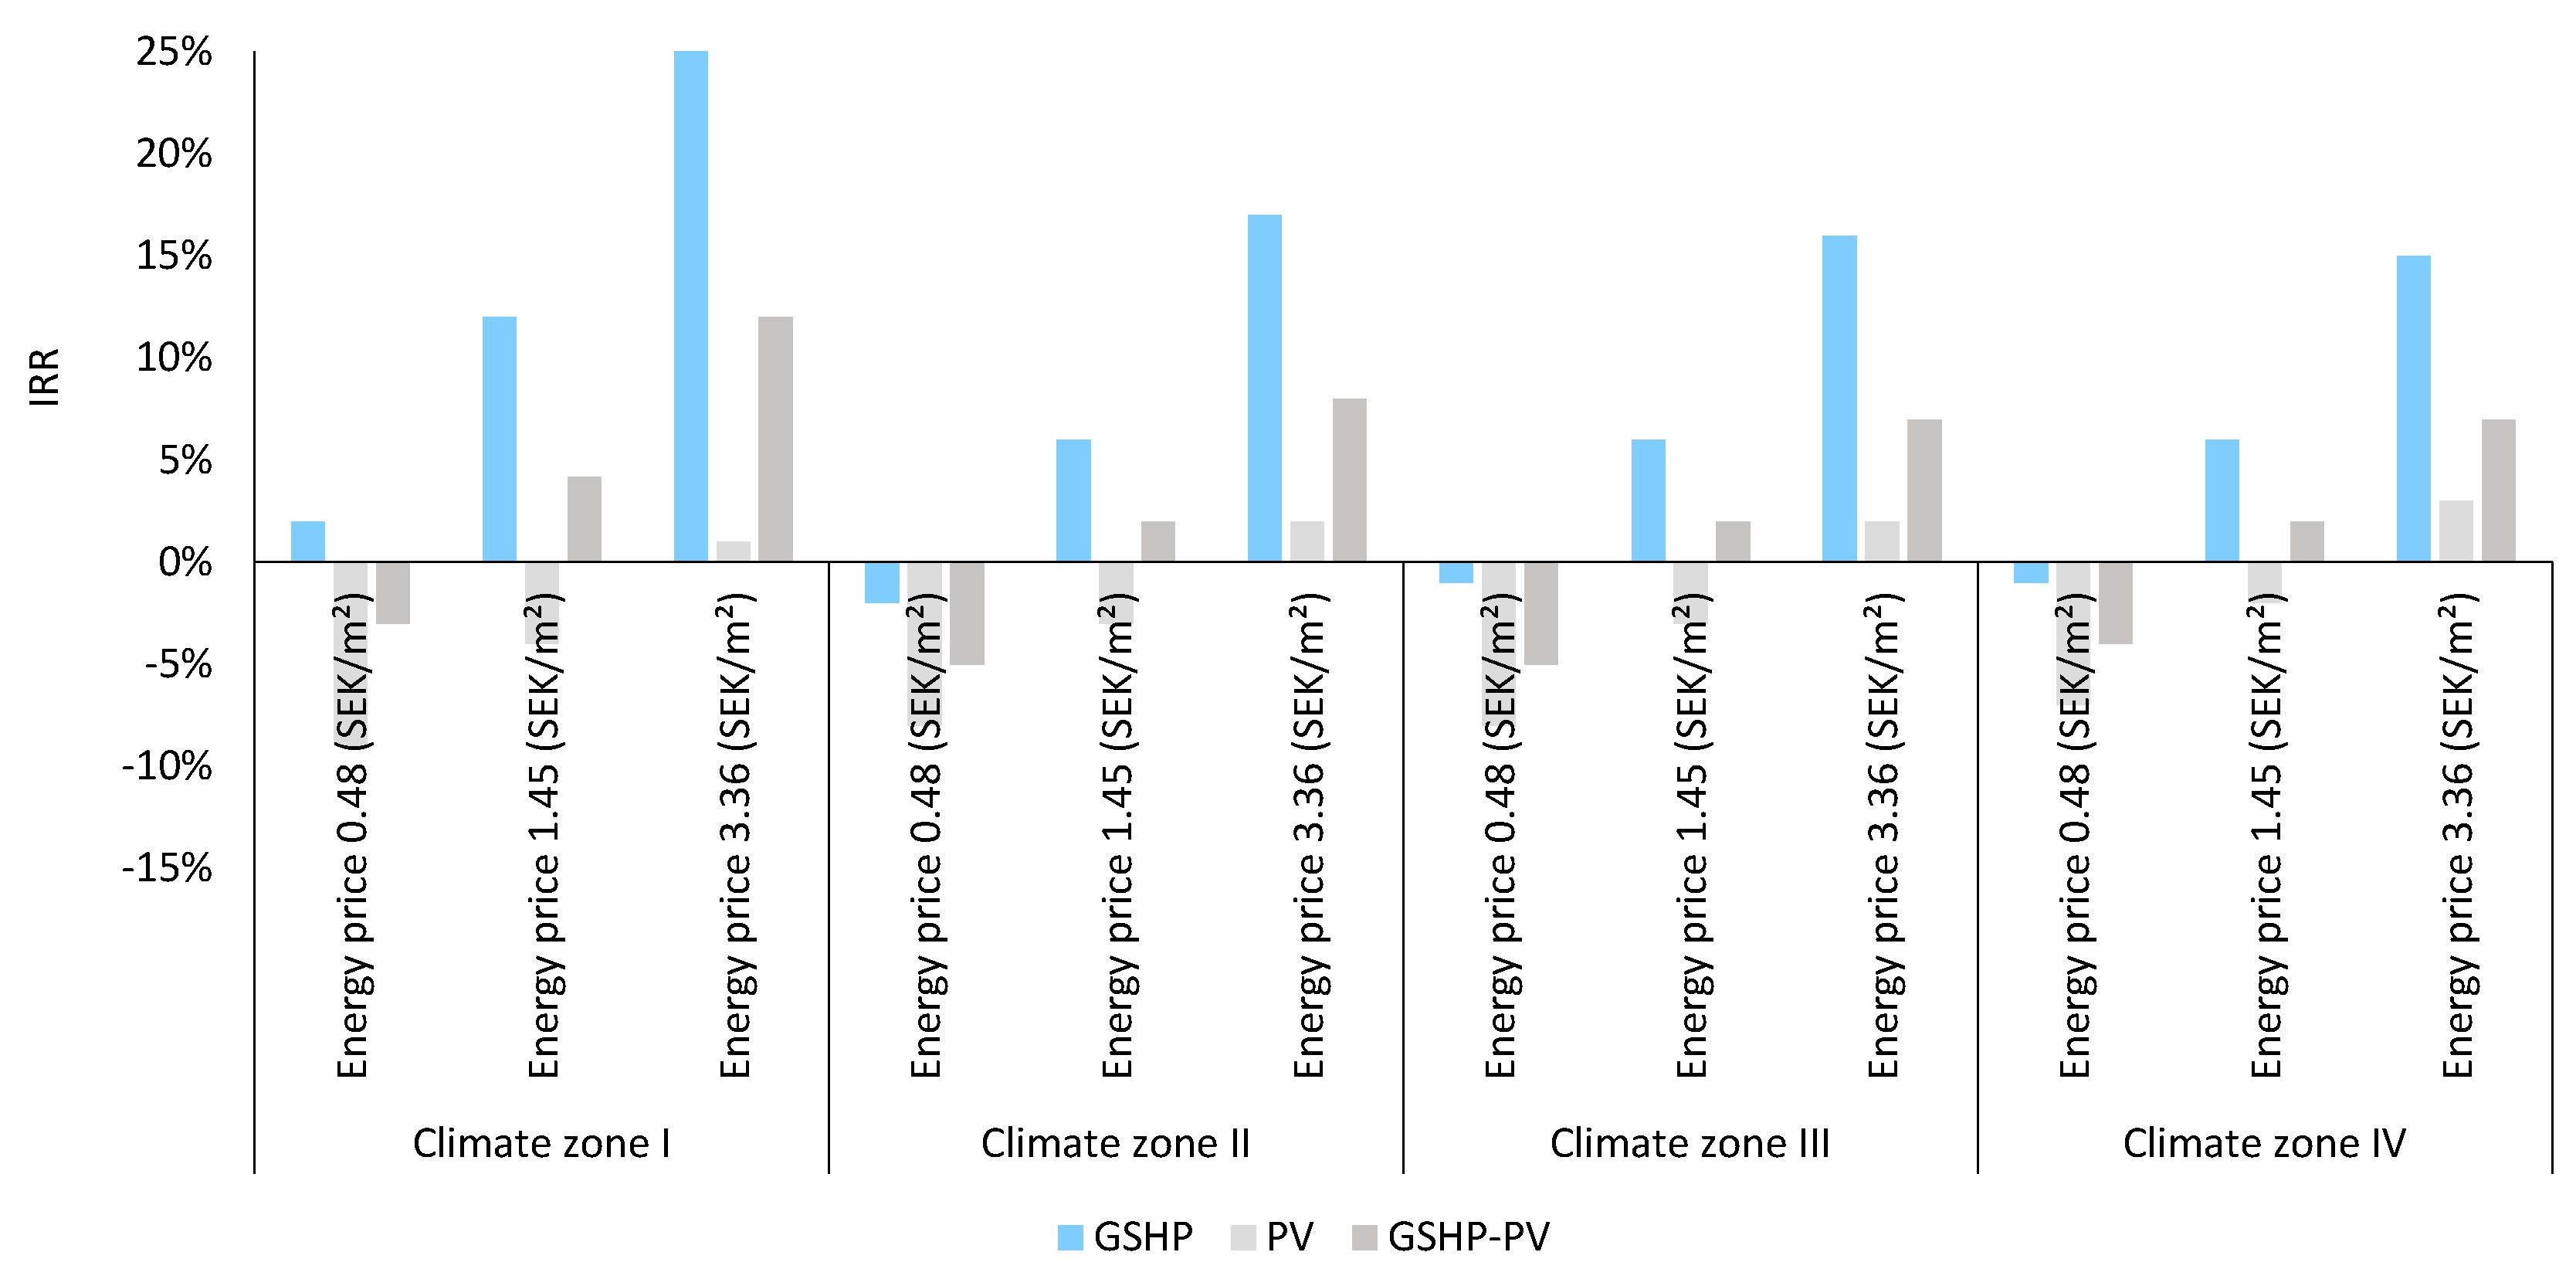
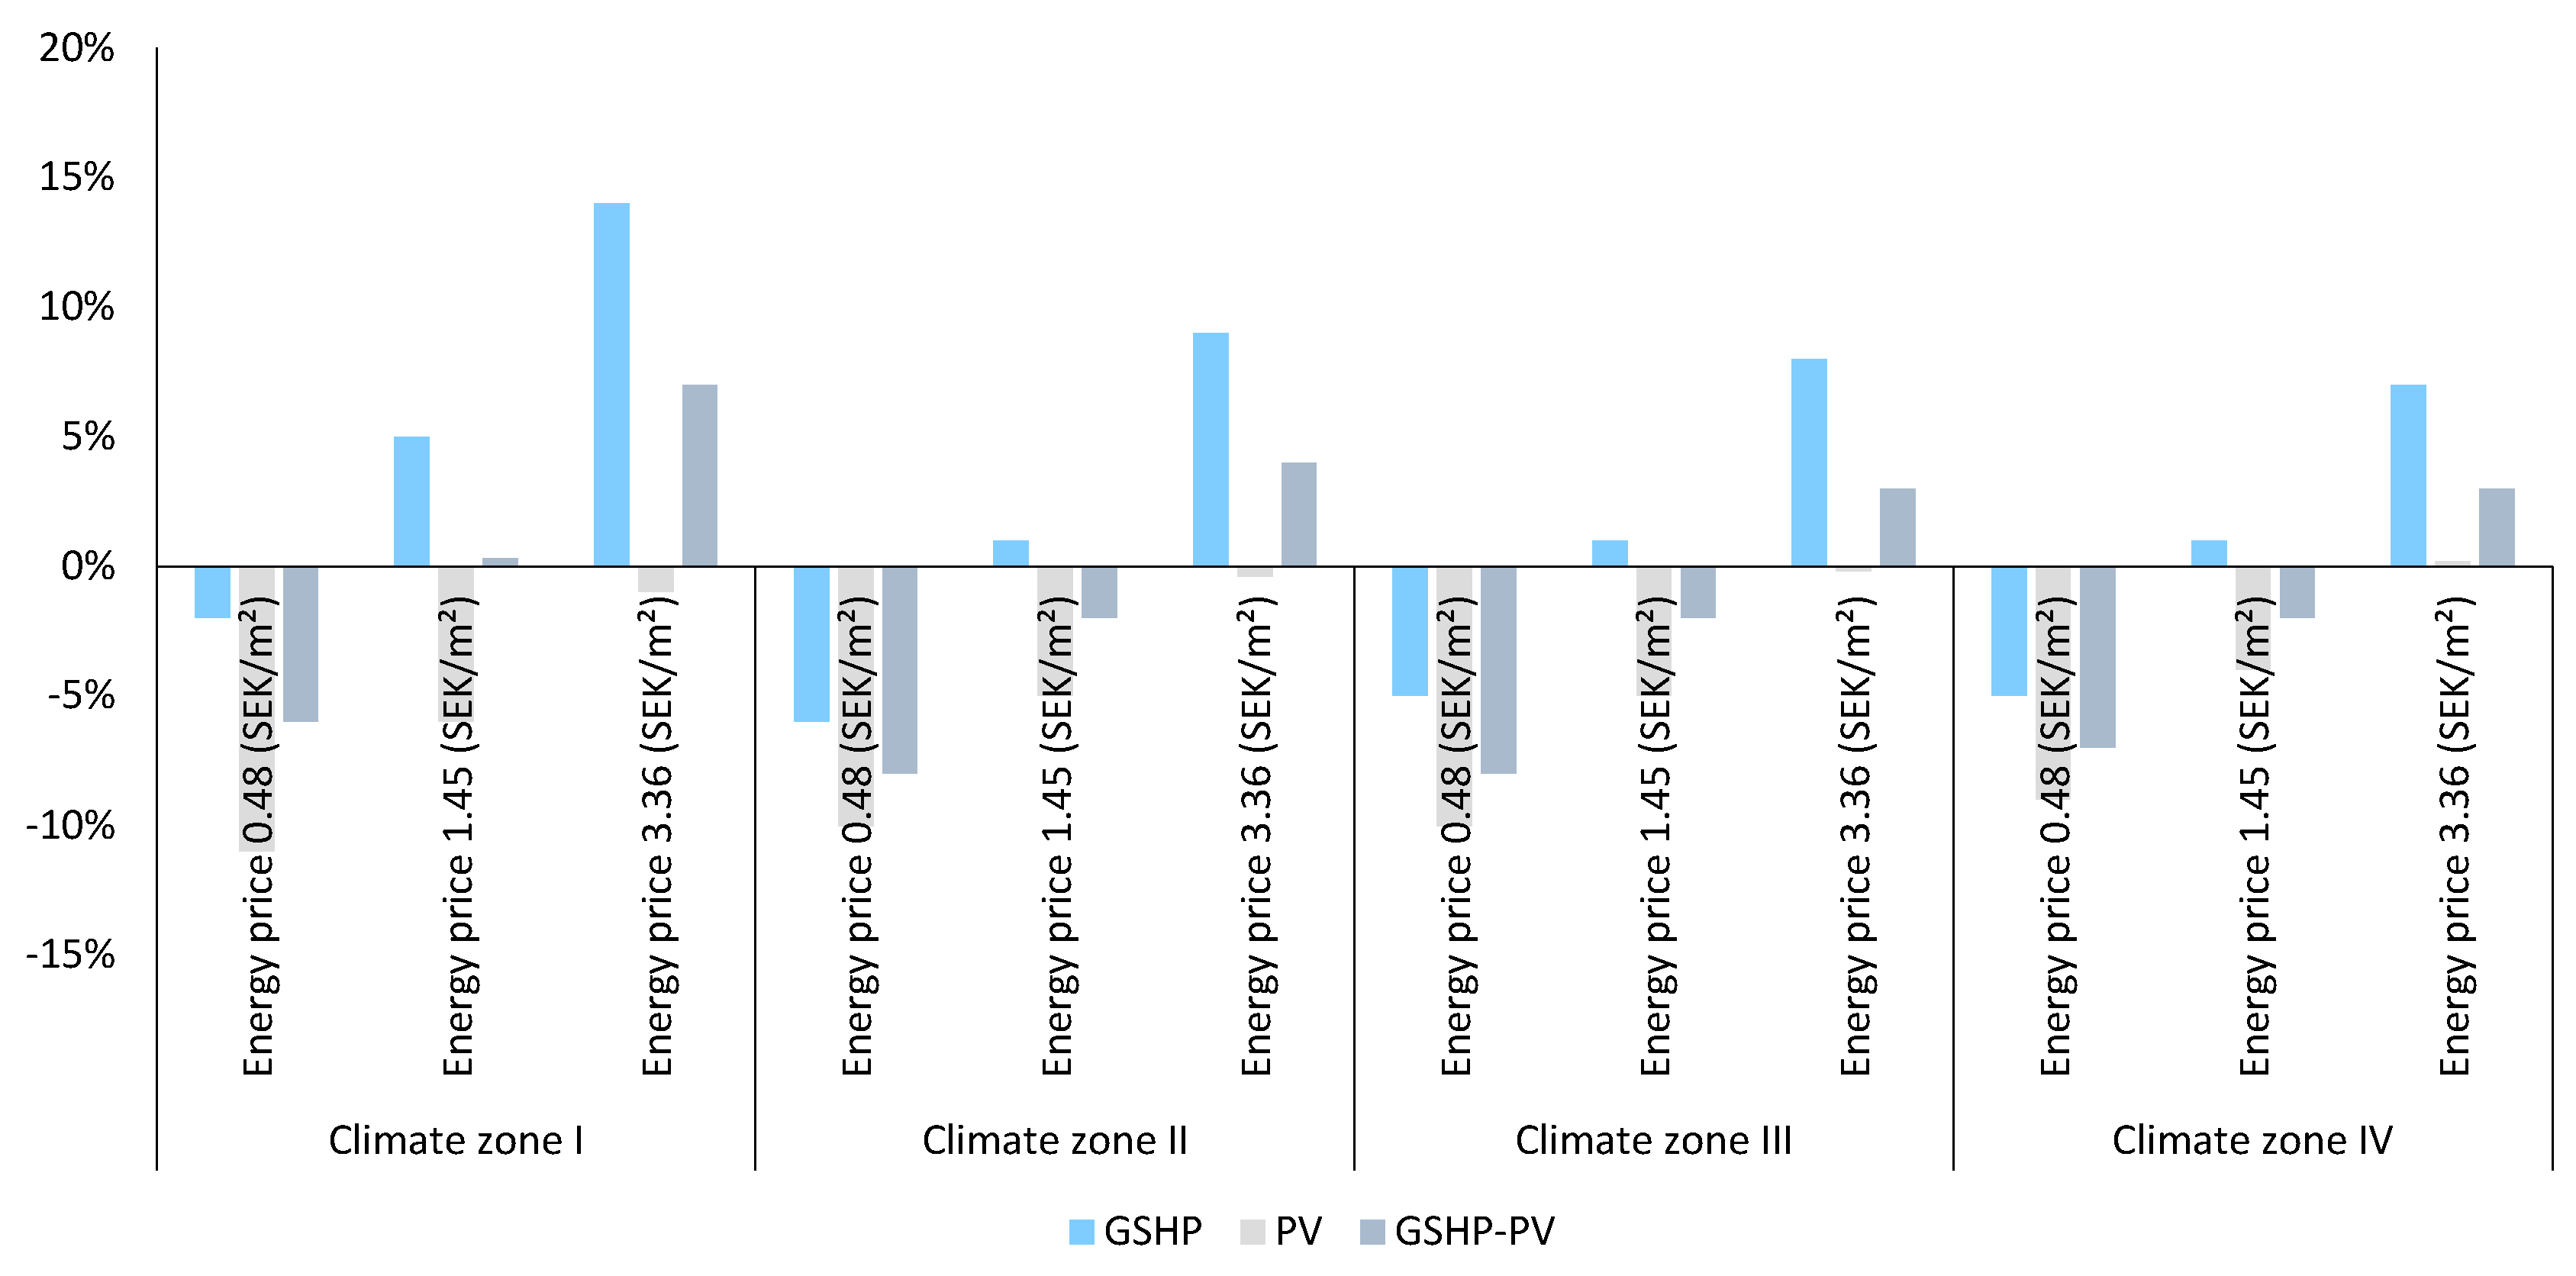
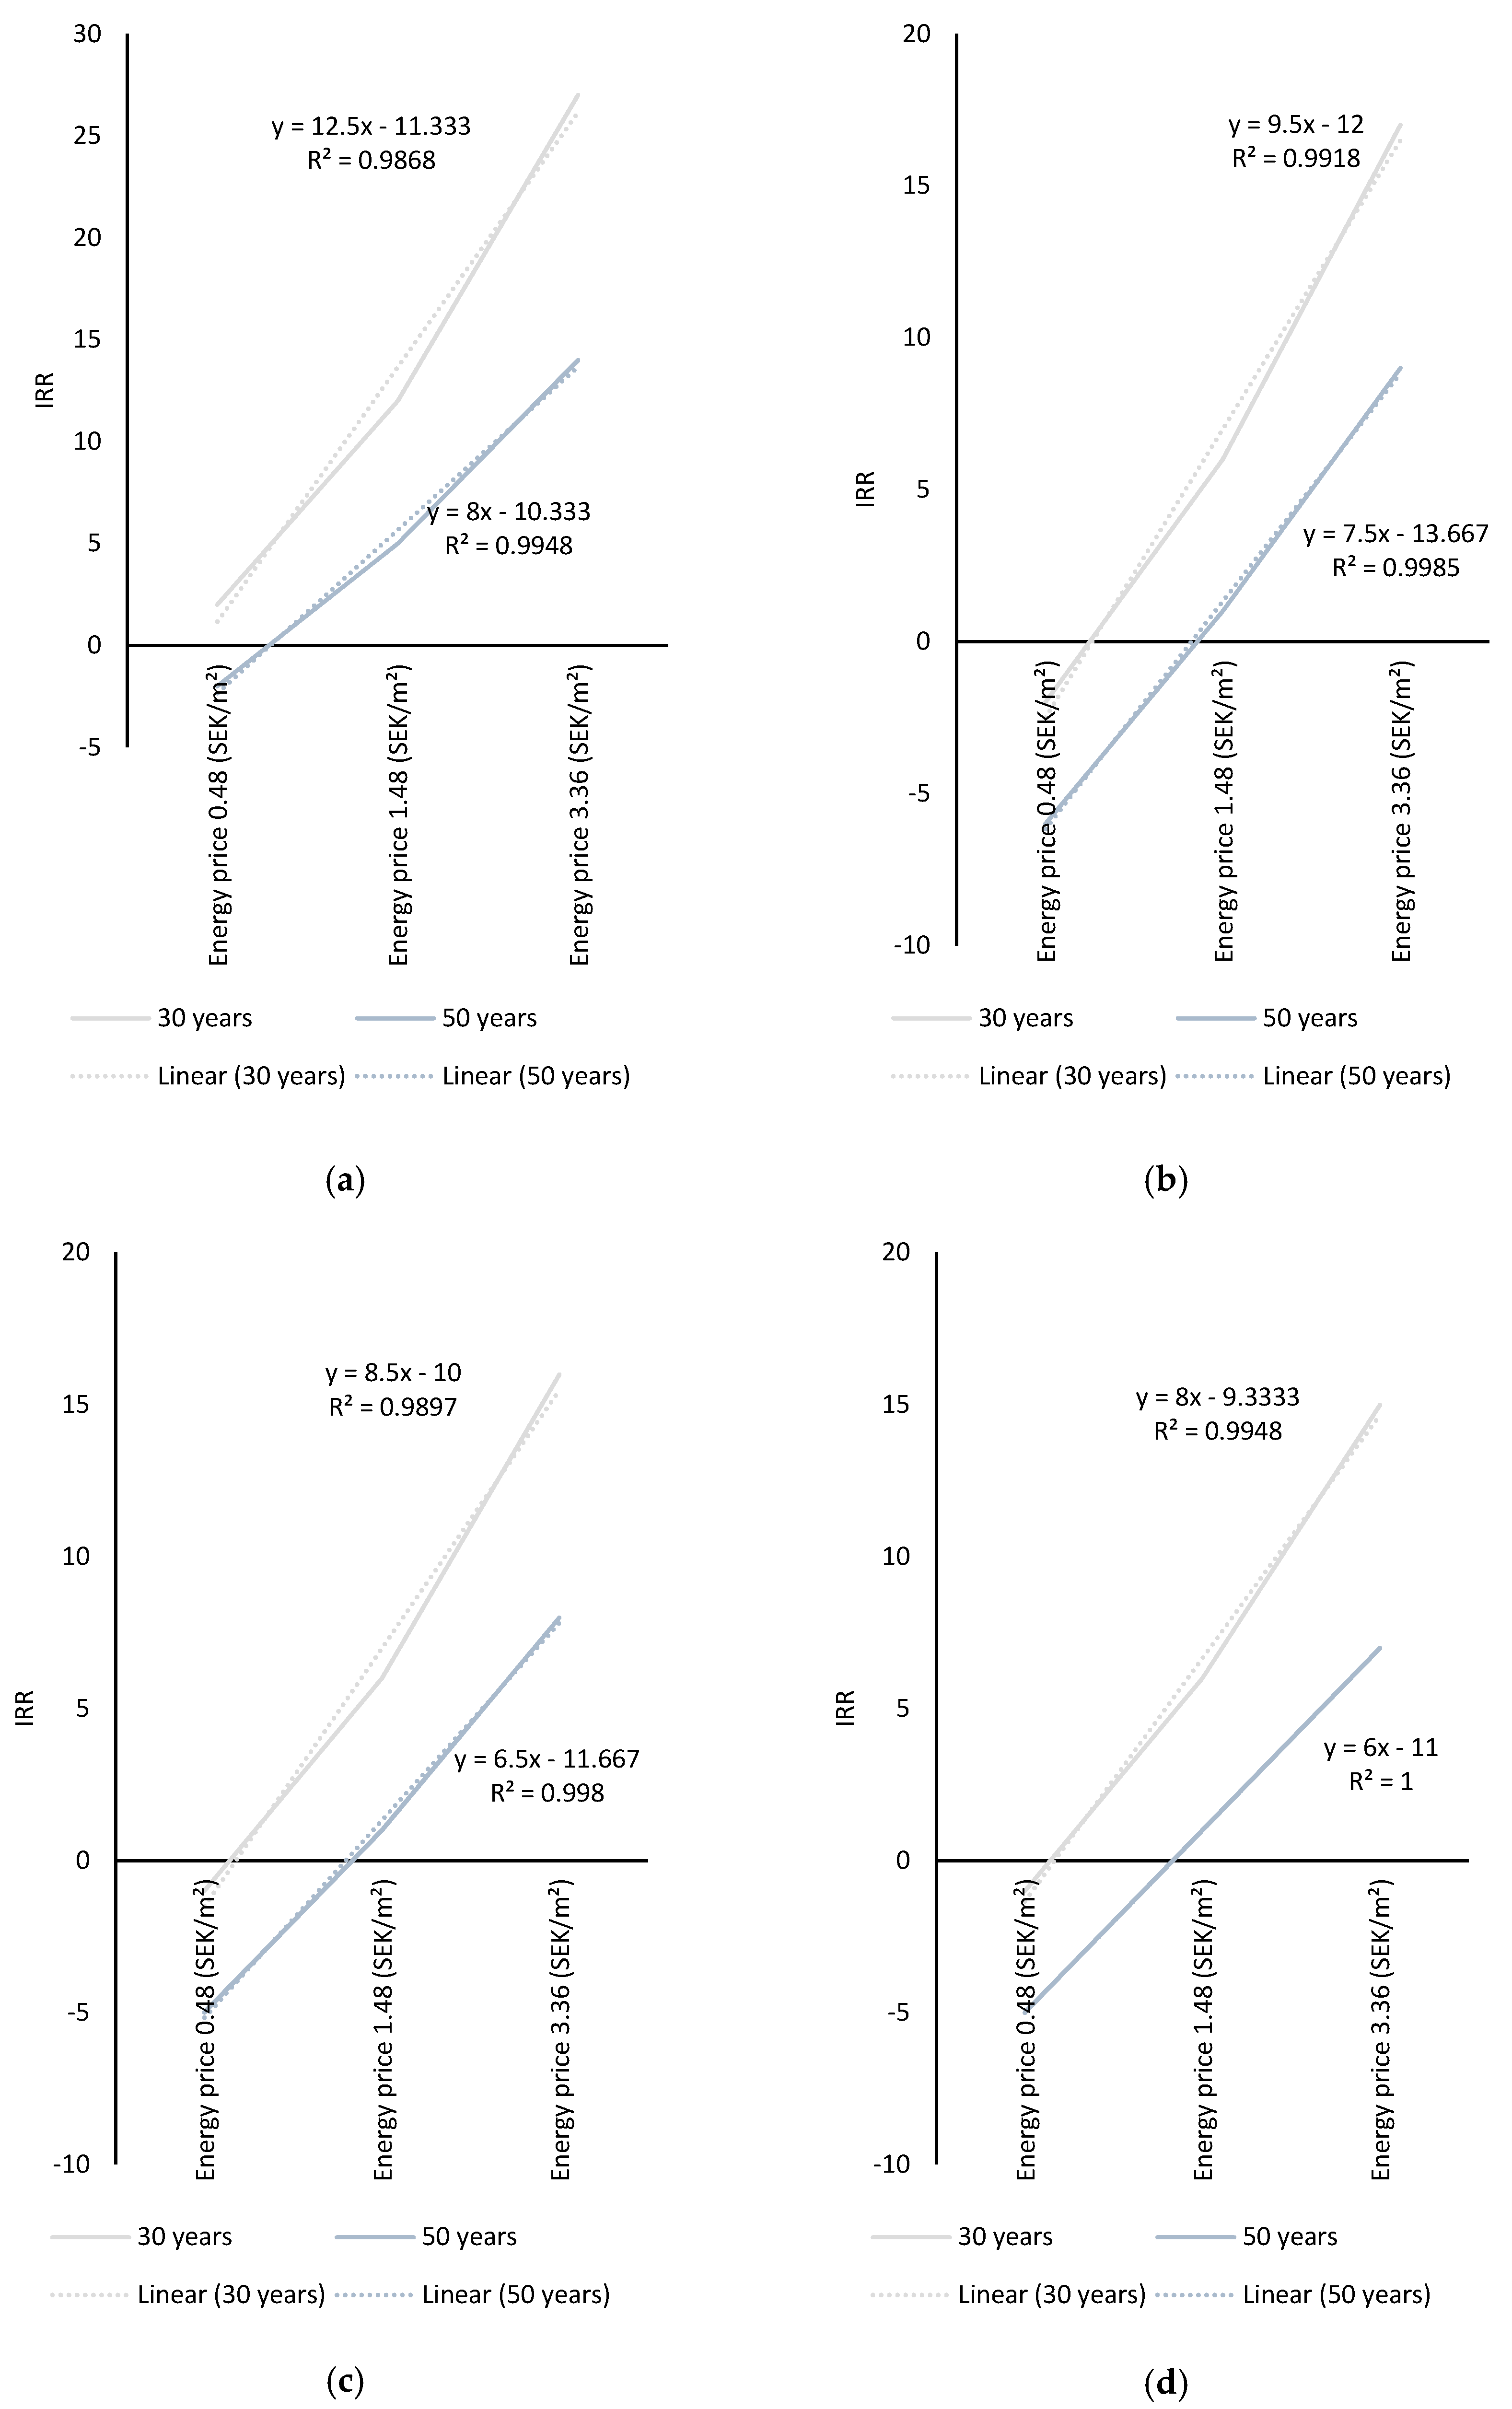
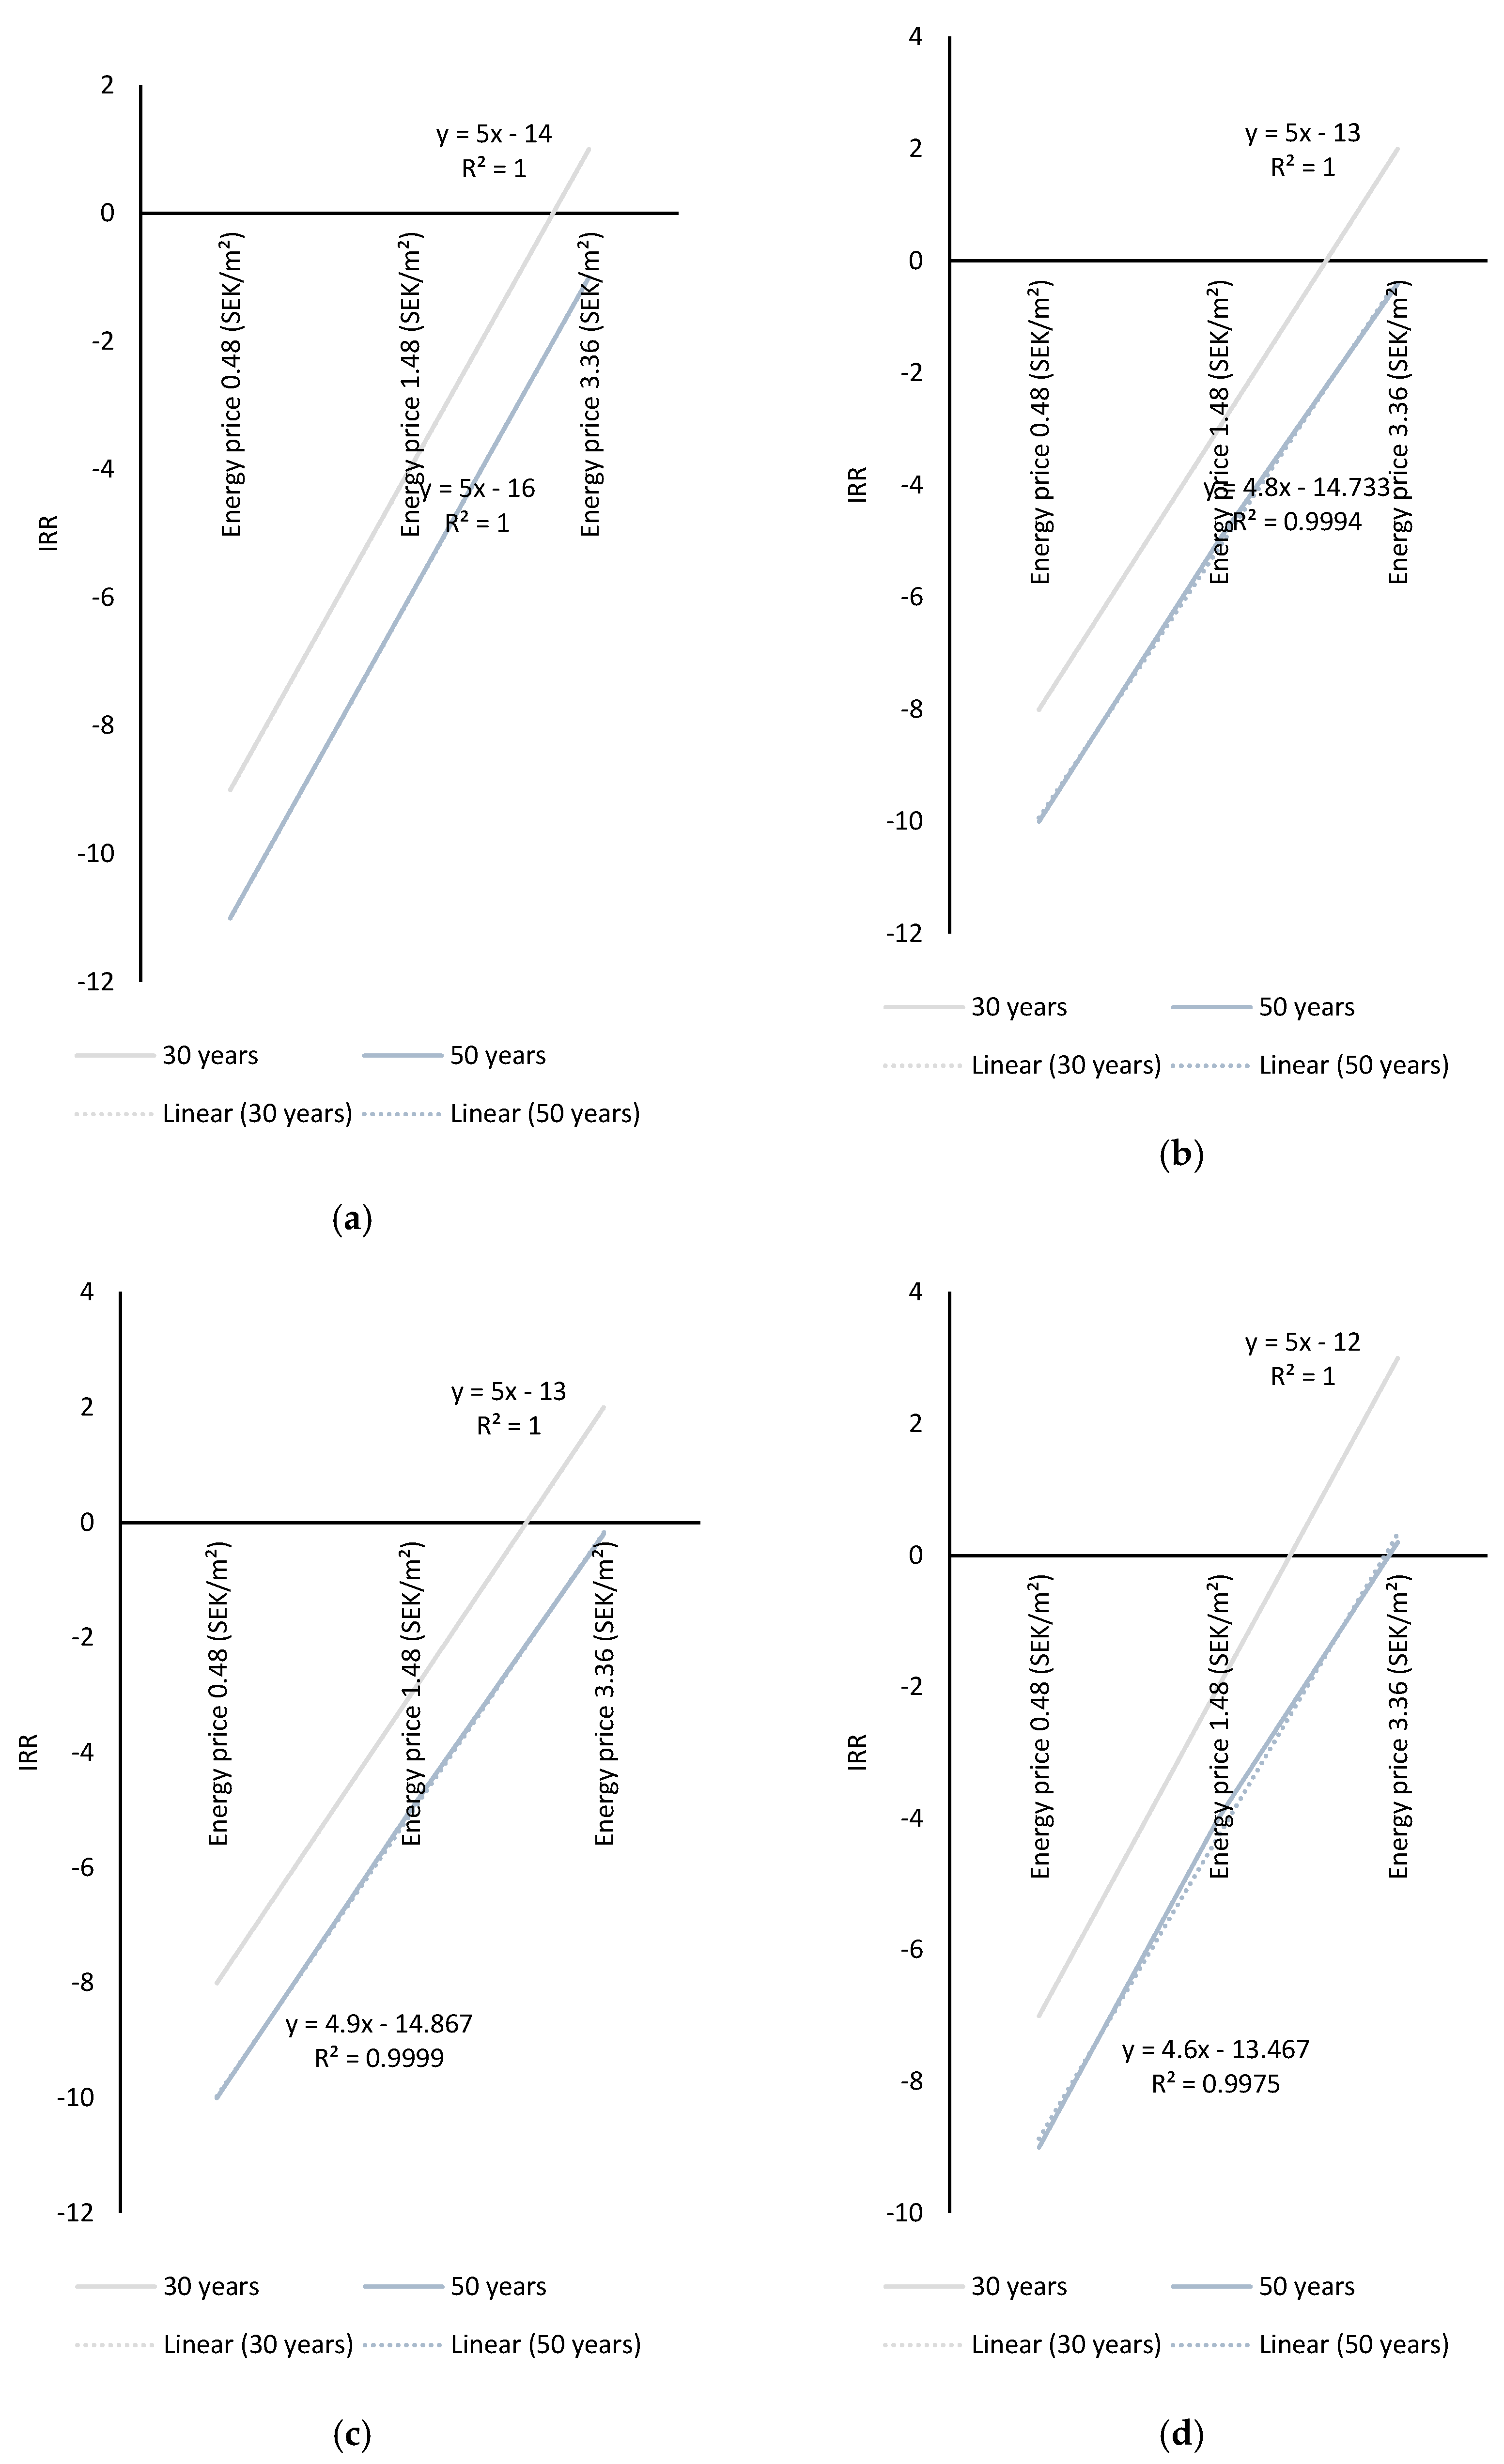
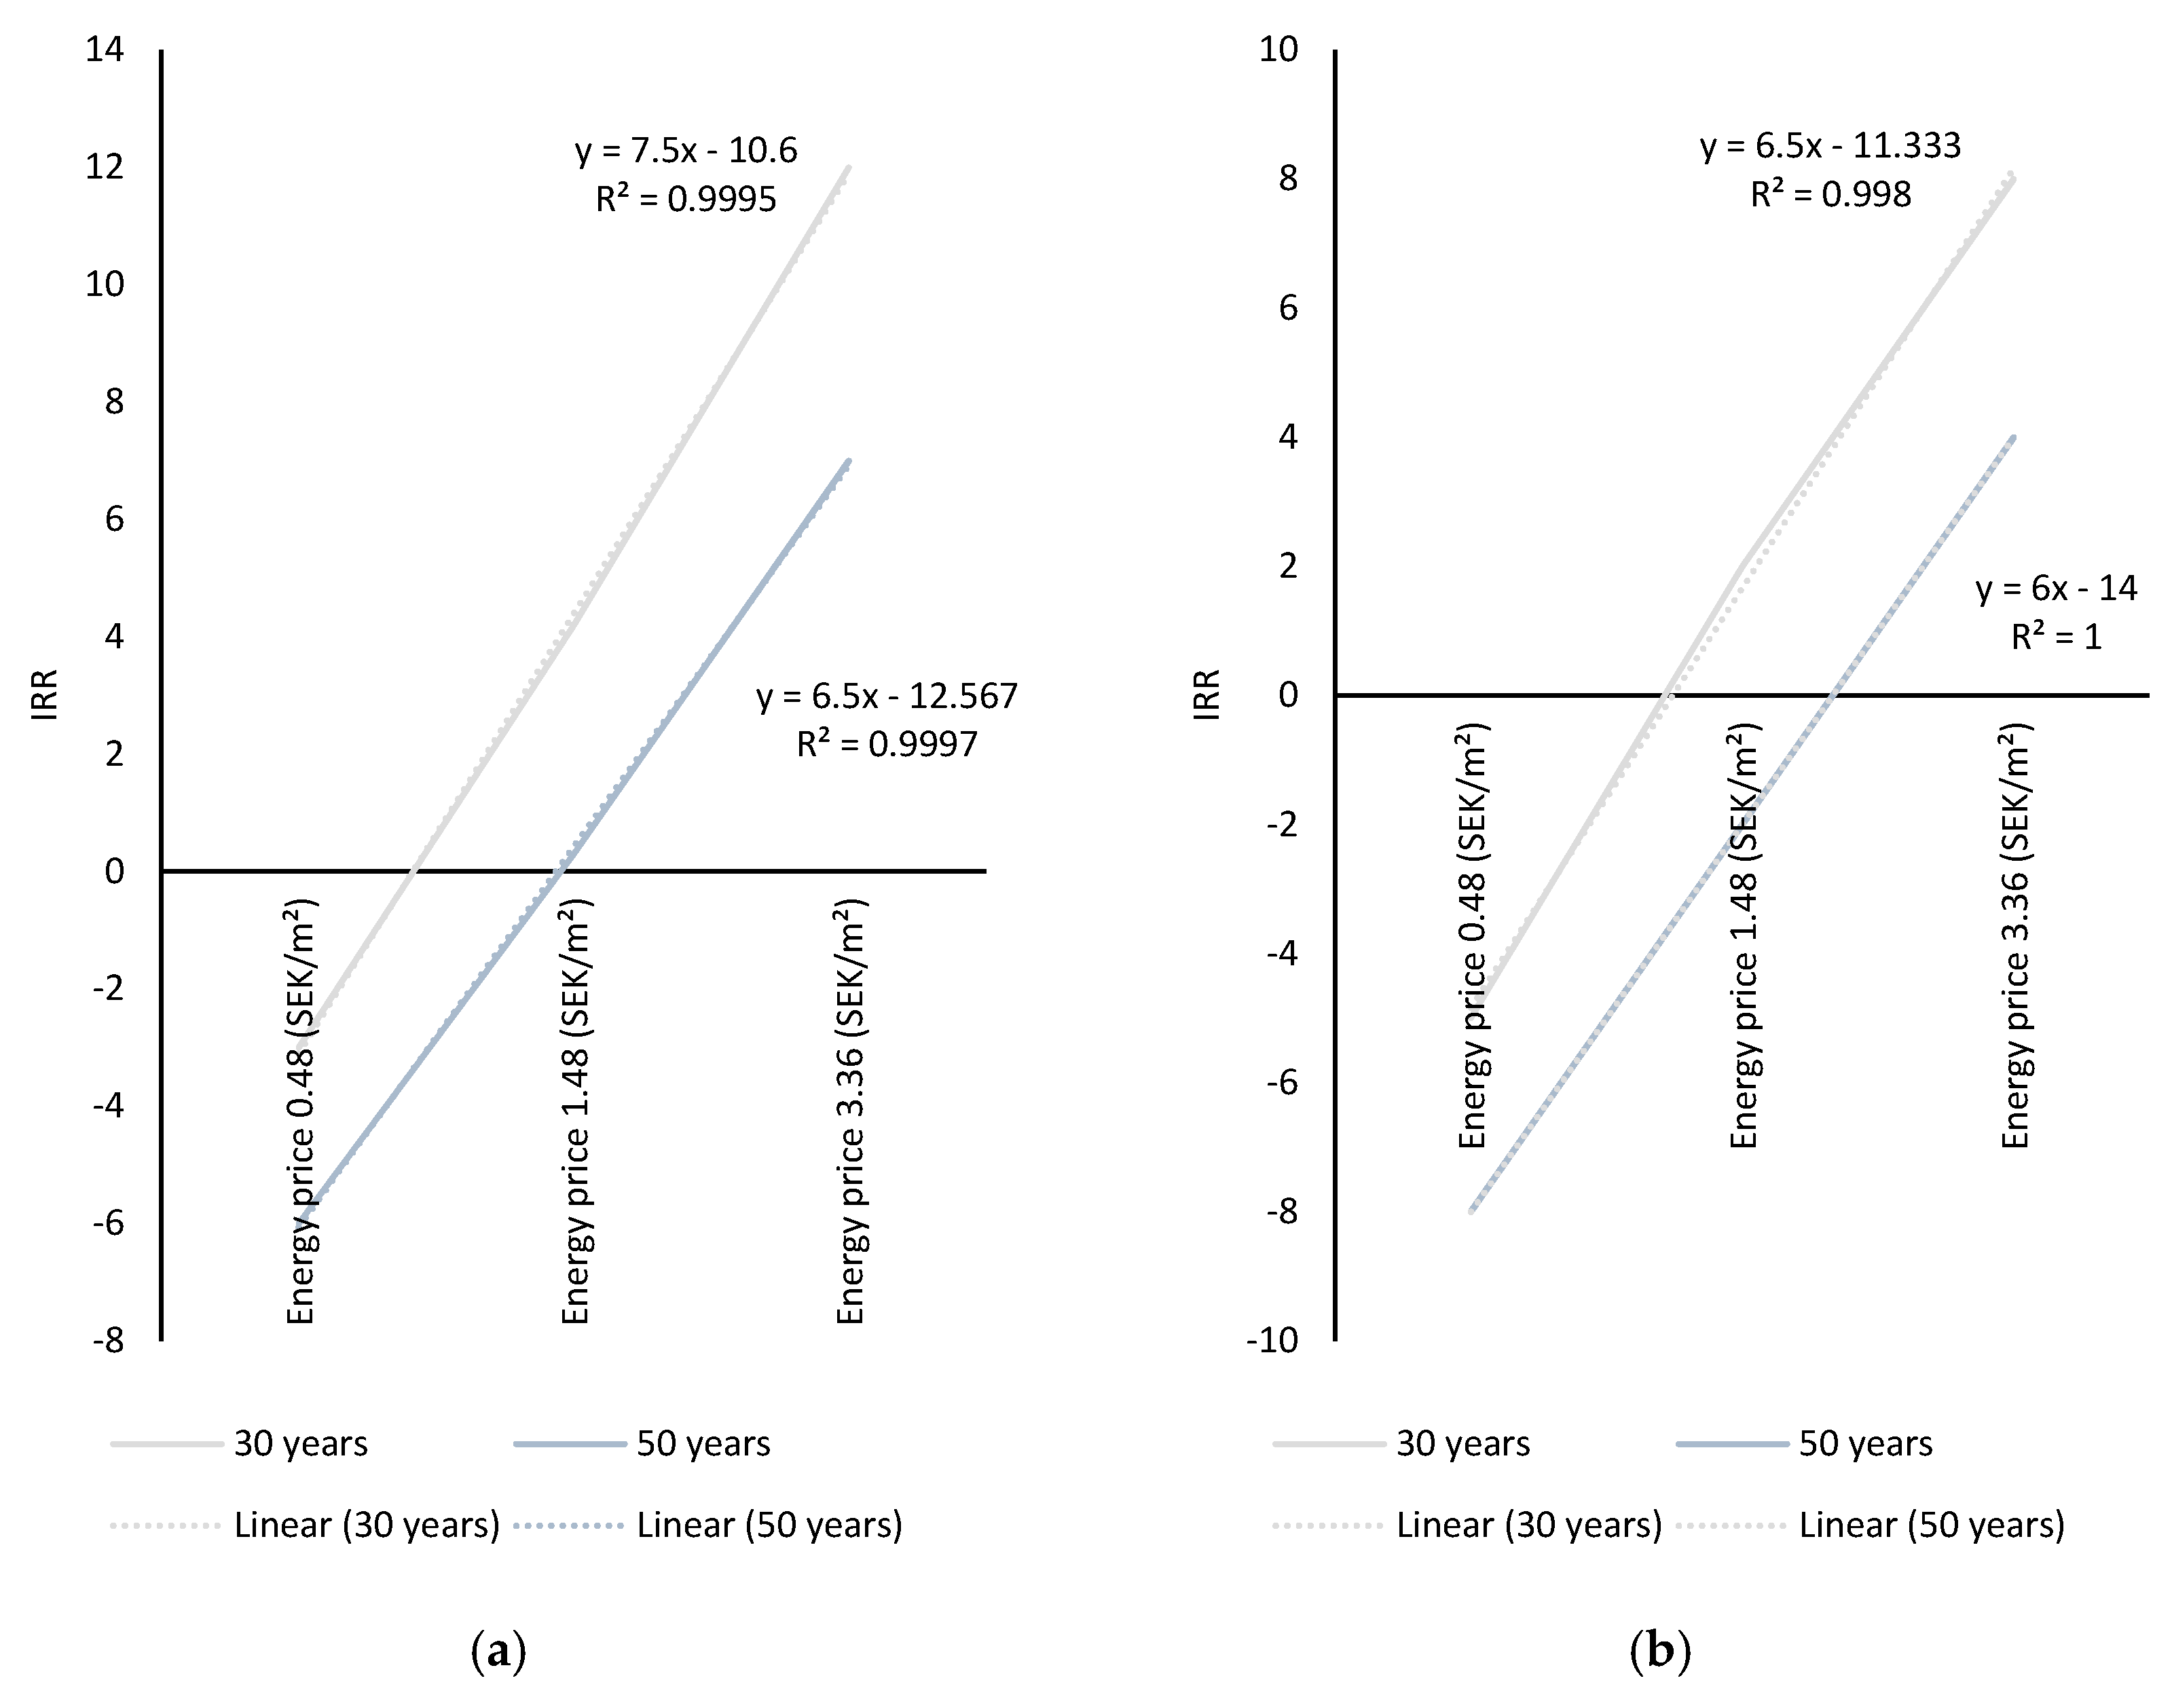
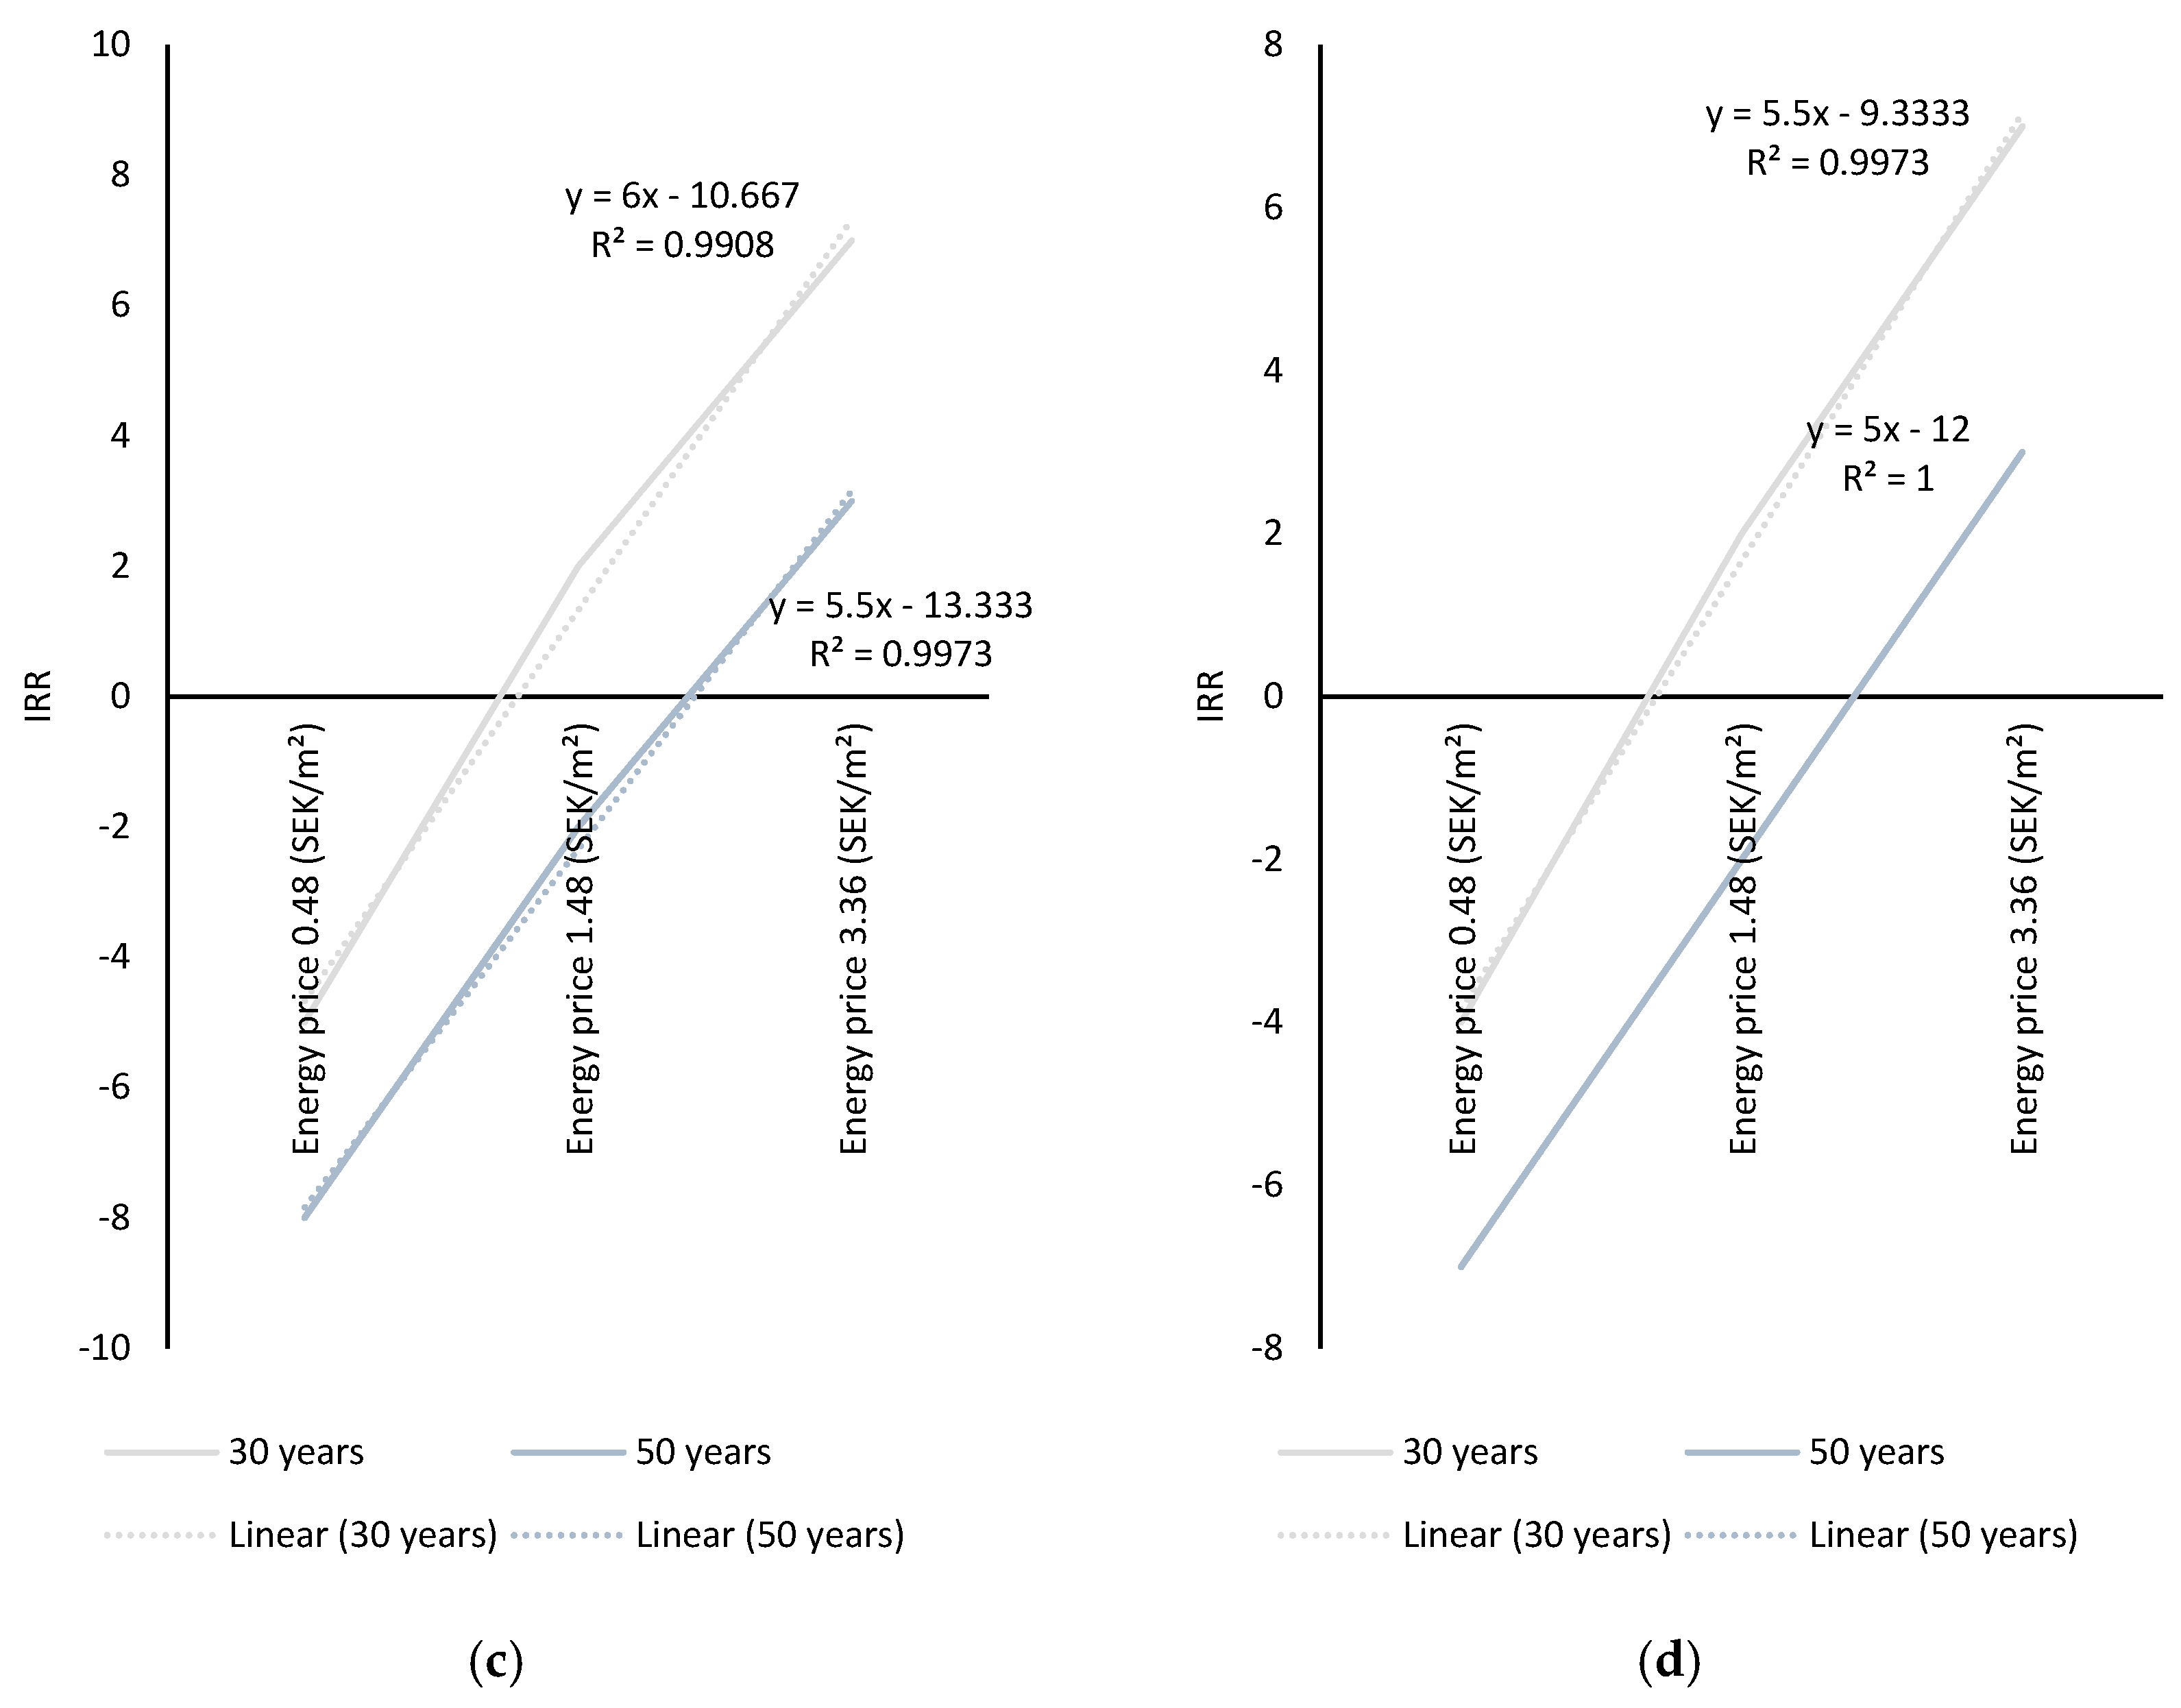
3.1. Analysing Variations in the IRR

Figure 4 shows the variations in IRR when installing energy supply systems with three different energy prices and lifespans of 30 years. Considering the GSHP system, when the energy price was 0.48 (SEK/kWh), the IRR was positive only in climate zone I. This was because the aggregate levels of monetary savings due to the installation of GSHP were greater in climate zone I than in the other climate zones. Accordingly, with a low energy price of 0.48 (SEK/kWh), the GSHP was profitable only in climate zone I, while it lost its value at its respective IRR in all climate zones. A higher energy price had a significant effect on the convenience of GSHP installation in all four climate zones, as it augmented the IRR across them all. However, IRR was augmented at a different degree of increase. When changing the energy price from 0.48 (SEK/kWh) to 1.45 (SEK/kWh), the IRR in climate zone I rose by a 10-fold increase; however, it was augmented by an 8-fold increase in climate zone II and by a 7-fold increase in climate zones III and IV. Similarly, when the energy price was changed from 0.48 (SEK/kWh) to 3.36 (SEK/kWh), the IRR rose 25-fold, 19-fold, 17-fold, and 16-fold in climates I, II, III and IV, respectively.
Considering the PV system, when the energy price was 0.48 (SEK/kWh) or 1.45 (SEK/kWh), all IRR values were negative. A negative IRR implied that the PV system was not profitable as it lost value at its respective IRR in all climate zones. This was because, when the energy prices were low, the investment cost of the PV system outweighed the cost of the saved energy. With an energy price of 3.36 (SEK/kWh), the lowest IRR was obtained in climate zone I. This was because, at higher latitudes, like Kiruna in climate zone I, the amount of electricity produced by the PV system was less than the electricity production in other climate zones, which increased the use of electricity from the grid. Accordingly, the aggregate levels of monetary savings due to the installation of the PV system were smaller in climate zone I. The highest IRR of 3% was obtained in climate zones III and IV, signifying that the PV system was most profitable in these climate zones because the PV system received high solar irradiation at lower latitudes, such as Gothenburg and Stockholm; accordingly, it exhibited better performance in producing electricity.
In terms of the GSHP-PV system, when the energy price was 0.48 (SEK/kWh), all IRR values were negative. Although the GSHP-PV system had the best performance in reducing the total energy use of the single-family house, its high investment costs exceeded the cost of the saved energy. With an energy price of 1.45 (SEK/kWh) or 3.36 (SEK/kWh), all IRR values were positive, but the highest IRR was obtained in climate zone I, while the lowest IRR was observed in climate zone IV. This occurred since the amount of saved energy due to the installation of the GSHP-PV system was higher in climate zone I, which added to the aggregate levels of monetary savings. Accordingly, the GSHP-PV system was most profitable in climate zone I when compared with the other climate zones. When changing the energy price from 1.45 (SEK/kWh) to 3.36 (SEK/kWh), the IRR in climate zone I was augmented by an 8-fold increase, while it rose 6-fold in climate zone II and 5-fold in climate zones III and IV.
Figure 5 presents the variations in IRR when installing energy supply systems with 3 different energy prices and lifespans of 50 years. The GSHP system was profitable in all climate zones only when the energy price was 1.45 (SEK/kWh) and 3.36 (SEK/kWh). When changing the energy price from 1.48 (SEK/kWh) to 3.36 (SEK/kWh), the IRR in climate zone I rose 9-fold, while it was augmented 8-fold, 7-fold, and 6-fold in climate zones II, III and IV, respectively.
With an energy price of 0.48 (SEK/kWh) or 1.45 (SEK/kWh), the PV system lost value at its respective IRR in all climate zones. Increasing the energy price to 3.36 (SEK/kWh) led to positive growth in the IRR in all climate zones; however, the IRR turned positive only in climate zone IV. Accordingly, the PV system was profitable in climate zone IV only when the energy price was high.
With a low energy price of 0.48 (SEK/kWh), the investment costs for the GSHP-PV system devalued at its respective IRR in all climate zones. The devaluation rate was lower in climate zone I, while it further deteriorated in other climate zones. This was because of the amount of costs of the saved energy due to the installation of the GSHP-PV system being greater in climate zone I than in the other climate zones. Increasing the energy price to 1.45 (SEK/kWh) had a positive effect on the IRR in all climate zones; however, the IRR became positive only in climate zone I. With a high energy price of 3.36 (SEK/kWh), all IRR values were positive. The highest IRR was obtained in climate zone I, while the lowest was observed in climate zones III and IV. Increasing the energy price from 1.48 (SEK/kWh) to 3.36 (SEK/kWh) augmented the IRR by a 6.7-fold increase in climate zone I, while it rose by 6-fold in climate zone II and 5-fold in climate zones III and IV.

Sensitivity Analyses

Figure 6a–d show the variations in the IRR in the four climate zones when installing the GSHP in terms of changes in energy price and lifespan. Regardless of whether energy price was low or high, changing the lifespan from 30 years to 50 years had a negative impact on the IRR in all climate zones. Accordingly, funding investments in the GSHP system during a lifespan of 30 years was more convenient way to invest in all climate zones. The analysis of the results showed that the IRR was more sensitive to increases in energy prices when the lifespan was 30 years. This was because, for a lifespan of 30 years, the difference between the costs of saved energy and investment costs was larger than for a lifespan of 50 years. In addition, the IRR was more sensitive to changes in energy prices in climate zone I, followed by climate zones II, III and IV. This was because the GSHP system had the best performance in climate zone I, and, accordingly, an increase in energy price augmented the IRR more significantly in this climate zone.
Figure 7a–d show the variation in the IRR in the four climate zones with respect to energy price and lifespan when installing the PV system. The analysis of results showed that, when the lifespan was 30 years, the IRR was equally sensitive to changes in energy prices in all climate zones. In addition, with a lifespan of 30 years, the IRR was more sensitive to changes in energy price, than for a lifespan of 50 years.
Figure 8a–d show the variation in the IRR in four climate zones when installing the GSHP-PV system in terms of changes in energy price and lifespan. Similarly, the IRR was more sensitive to changes in energy prices when the lifespan was 30 years in all climate zones. In addition, the IRR was more vulnerable to changes in energy prices in climate zone I, followed by climate zones II, III and IV. This was because the amount of monetary savings due to the installation of the GSHP-PV system in climate zone I was greater than those of the other climate zones; hence, an increase in energy price raised the IRR to a greater degree in this climate zone.

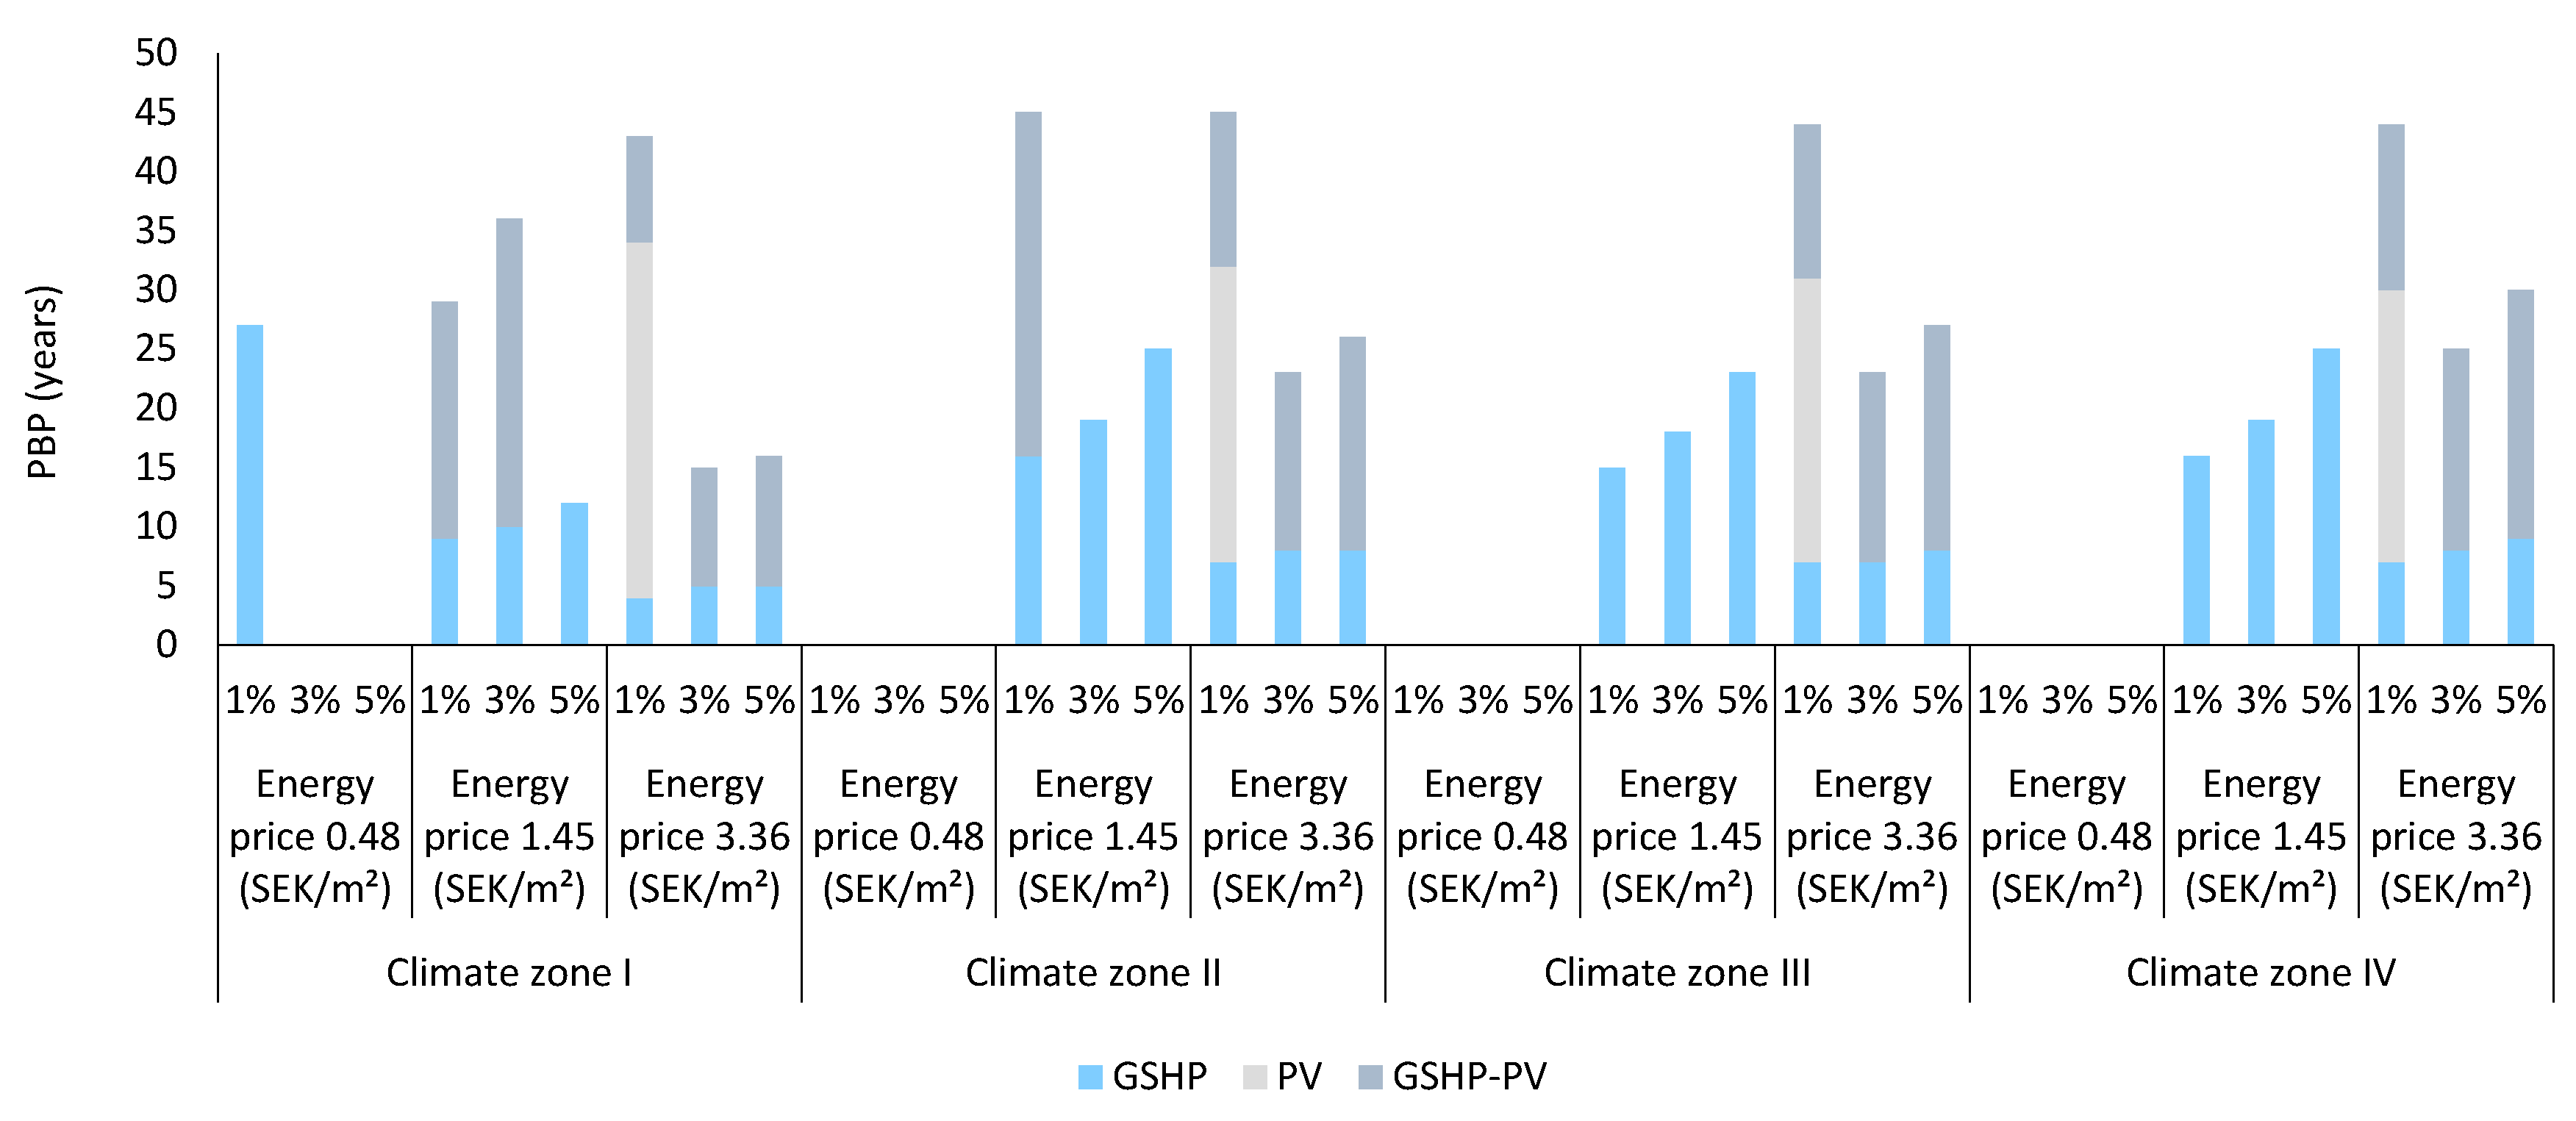
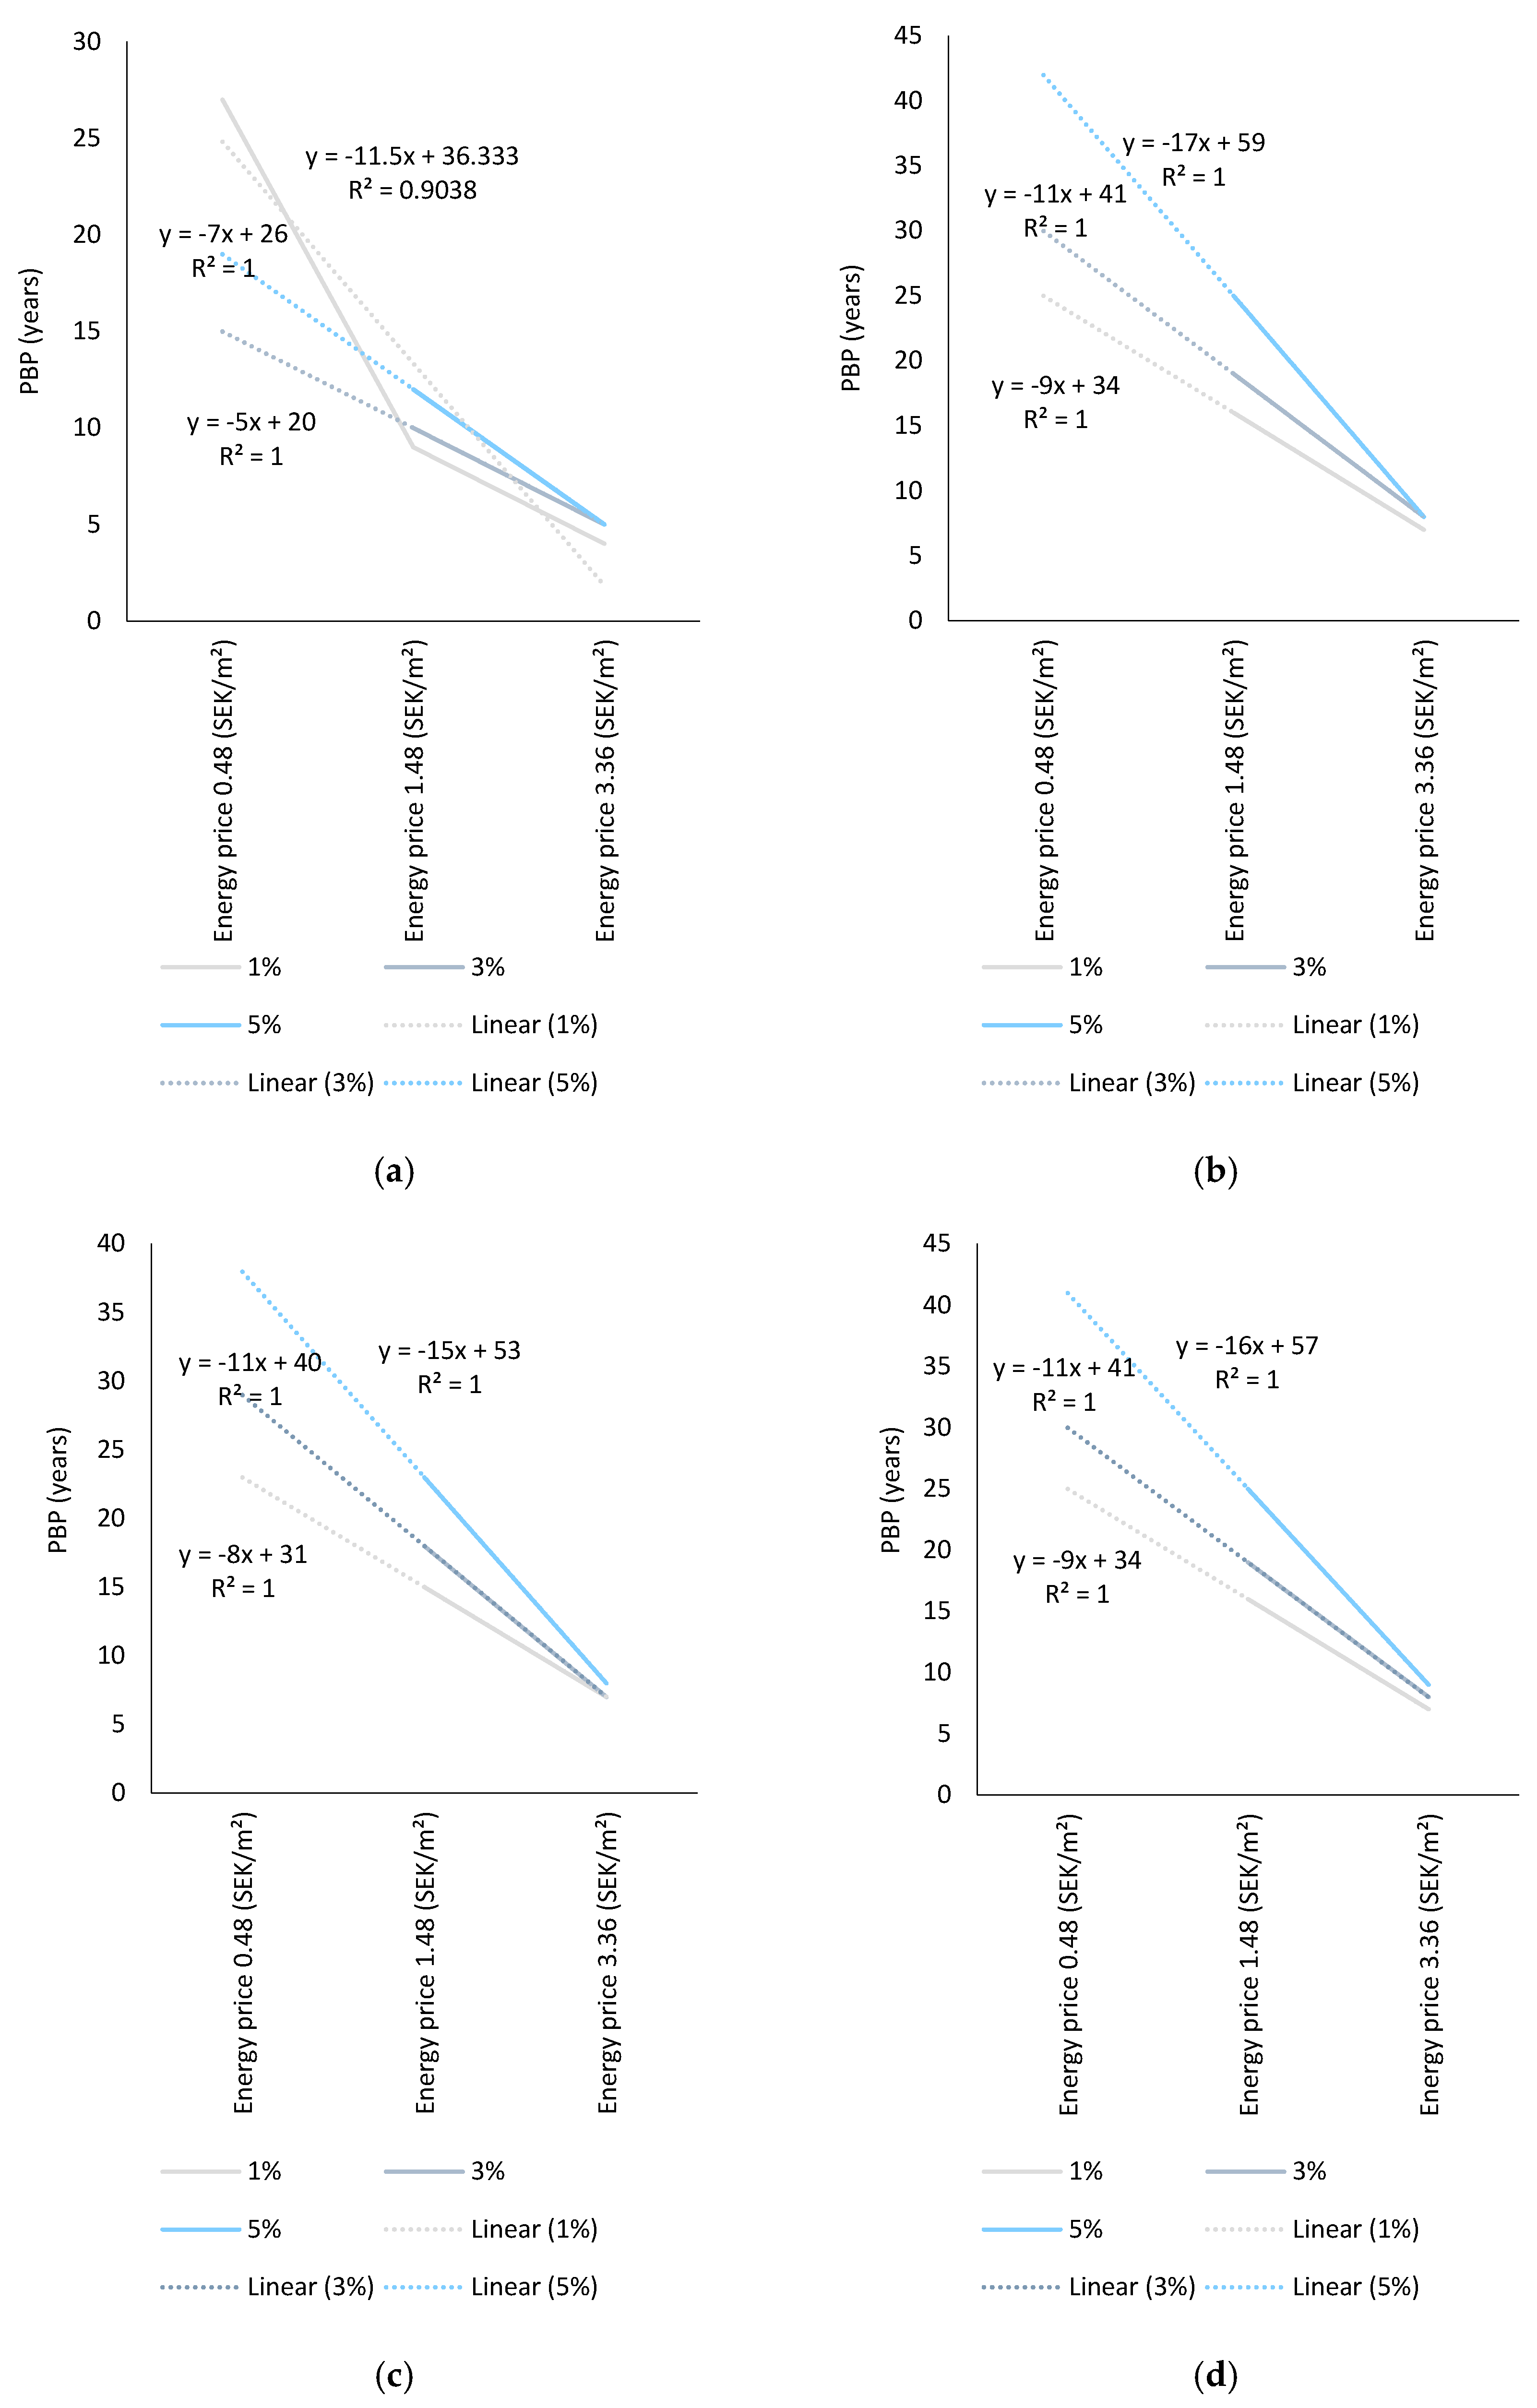
3.2. Analysing Variations in PBP

Figure 9 shows the variations in the PBP when installing energy supply systems with three different energy prices and three different interest rates. With interest rates of 1% and an energy price of 0.48 (SEK/kWh), the GSHP was the only profitable system in climate zone I, because it provided the highest energy saving rate of 73% in climate zone I, which accumulated in the monetary savings toward investment and maintenance costs. When the interest rate was increased to 3% and 5%, the investment costs for installing the GSHP system were never returned. However, the GSHP system was profitable in all climate zones when the energy prices increased to 1.45 (SEK/kWh) and 3.36 (SEK/kWh). Although increasing the interest rate usually augmented the PBP values, the increase in energy price mitigated the negative effect of a high interest rate on the PBP in all climate zones. Regardless of fluctuations in interest rate, when energy prices were 1.45 (SEK/kWh) or 3.36 (SEK/kWh), the lowest PBP was observed in climate zone I, while the highest was obtained in climate IV.
The profitability of the PV system was strongly dependent on a low interest rate of 1%, along with a high energy price of 3.36 (SEK/kWh). This was because a low interest rate, together with a high energy price, elevated the aggregate levels of monetary savings in all climate zones.
The profitability of the GSHP-PV system was determined by both the interest rate and energy price. Regardless of fluctuations in interest rate, when the energy price was 0.48 (SEK/kWh), funding investments in the GSHP-PV system was inconvenient, since the investment costs for installing this supply system was never repaid. Increasing the energy price mitigated the negative effect of the interest rates on PBP. With an interest rate of 1% and an energy price of 1.45 (SEK/kWh), the GSHP-PV was profitable only in climate zones I and II. Meanwhile, increasing the interest rate to 3% decreased the monetary savings, as the investment costs of the GSHP-PV system were only repaid in climate zone I. With an interest rate of 5%, the GSHP-PV system yielded no financial gain in any climate zones. However, with energy prices rising to 3.36 (SEK/kWh), the difference between the costs of the saved energy due to the installation of the GSHP-PV system and the investment costs turned positive in all climate zones, which made the GSHP-PV system a profitable solution for reducing total energy use. Regardless of fluctuations in interest rate, when the energy price was 3.36 (SEK/kWh), the lowest and highest PBPs were obtained in climate zone I and IV, respectively.

Sensitivity Analyses

Figure 10a–d show the variations in PBP when installing the GSHP in terms of changes in energy price and interest rate. The analysis of results showed that PBP was more sensitive to changes in energy prices when the interest rate was high. In other words, rising energy prices reduced the PBP in all climate zones but more significantly when the interest rate was high, which signified the effectiveness of a higher energy price in terms of the profitability of energy supply systems when interest rates were high. In addition, the sensitivity of PBP to changes in energy prices varied among the four climate zones. Regardless of the fluctuations in interest rate, the PBP was less vulnerable to changes in energy price in climate zone I, while it was highly sensitive to changes in energy price in climate zone IV.
No analyses were performed to study the sensitivity of PBP when installing the PV system since this system was only profitable with a high energy price of 3.36 (SEK/kWh) and a low interest rate of 1%.
Figure 10a–d show the variations in PBP when installing the GSHP-PV in terms of changes in energy price and interest rate. With an interest rate of 1%, PBP was less sensitive to changes in energy prices in climate zone I than in other climate zones. This was because the amount of monetary savings due to the installation of the GSHP-PV system was greater in climate zone I; accordingly, increases in energy price had a smaller effect on PBP in this climate zone. In addition, PBP was more sensitive to change in energy prices in climate zone I when the interest rate was increased to 3%. With an interest rate of 5%, the GSHP-PV system was profitable only when the energy price was 3.36 (SEK/kWh); accordingly, no analyses were performed to study whether or not the PBP was sensitive to change in energy price.

4. Final Remarks

The following remarks were concluded from the analyses performed.
The GSHP-PV system exhibited the best performance in reducing the total energy use of the single-family house.
In general, the GSHP system was the most profitable energy supply system, since it provided a short PBP and high IRR in all climate zones when compared with the other energy supply systems.
Increasing the energy price improved the profitability of the supply systems in all climate zones.
With an energy price of 1.45 (SEK/kWh) or 3.36 (SEK/kWh), funding investments in the GSHP and GSHP-PV systems during a lifespan of 30 years was more convenient in all climate zones.
The IRR was more sensitive to changes in energy price when the lifespan was 30 years in all climate zones.

5. Conclusions

The European parliament’s target for the energy efficiency of buildings mandates an increase in the rate of house renovations. The single-family houses in Sweden can be seen as highly relevant in fulfilling this target, as they account for almost half the residential building stock in this country. In addition, the single-family houses in Sweden are responsible for a large amount of total energy consumption within the residential sector. Installing renewable energy supply systems has thus been seen as a solution to meet the European parliament’s target. However, the rate of energy renovations performed on single-family houses in Sweden has been low, reaching only 0.8% in 2016. One of the reasons explaining this low renovation rate is the high investment costs required for installing renewable energy supply systems that pose a great challenge to house owners. Therefore, there is a need for evaluating the cost-effectiveness of different supply systems that could be applied to single-family houses. This study took a novel approach to analyse how simultaneous changes in energy prices, interest rates, climate conditions and lifespan affect the cost-effectiveness of energy supply systems. For this purpose, the internal rate of return (IRR) and the payback period (PBP) of three potential energy supply systems that could be possibly applied in the case of a single-family house in Sweden. The first energy supply system included the installation of a ground source heat pump (GSHP), while the second and third packages comprised the installation of photovoltaic panels (PV system) and the mounting of an integrated GSHP and PV system (GSHP-PV), respectively. The IRR was calculated for lifespans of 30 and 50 years, while the PBP was obtained for interest rates of 1%, 3% and 5%. Furthermore, the implications of the three different energy prices and four climate zones on IRR and PBP were analysed.
The analyses of the results showed that the GSHP provides a higher IRR; accordingly, it yields the highest profit during the lifespan of a house when compared to other energy supply systems. This was because of the high performance of the GSHP in reducing total energy use and its relatively low investment cost. Furthermore, the results showed that raising the energy cost can increase the IRR of the supply systems because it adds to costs related to saved energy and thus offset the investment costs. Comparatively, the GSHP provides the lowest PBP when compared with the PV and GSHP-PV systems. In addition, the results showed that increasing the interest rate adds to PBP of the supply systems since it depreciates the cost of saved energy. In contrast, increasing the energy price can ease the investment cost of the renovation package more effectively, thereby reducing the PBP. With a lifespan of 30 years, the IRR was more sensitive to changes in energy price, than for a lifespan of 50 years.
Although the renewable energy supply systems hold promise for providing energy savings, this promise can be misleading mainly due to the rebound effect. The rebound effect comprises two main categories: Temporal rebound and spatial rebound [15]. The temporal rebound is associated with phenomena such as temperature take-back, in which occupants keep a higher indoor temperature, practically over longer periods, thereby counteracting the energy efficiency provided by renewable energy supply systems. The spatial rebound refers to occupants’ tendency to expand the heated space.
Results, considering the effectiveness of the energy supply systems in reducing the total energy consumption, can be generalised to countries with similar climate conditions. However, the cost-effectiveness of the renewable energy resources depends on how investment costs, energy prices and energy policies evolve. Effective energy policy formulations can facilitate renewable energy transitions. Any such policy may include financial incentives or taxation regimes applying to non-renewable energy resources [39]. However, the scope of the energy policies may vary in different countries, since they are strongly influenced by social, political and economic factors [40].
The results can be expanded to provide an aid when developing energy efficiency policies with a goal of increasing the rate of implementation of energy renovations. In addition, the analyses performed could be expanded for the further quantification of the IRR and PBP in a more comprehensive manner, including the replacement of windows and insulation layers in building envelopes.

Author Contributions

Conceptualization, E.J. and G.P.; methodology, E.J.; software, E.J.; validation, E.J.; formal analysis, E.J.; investigation, E.J. and A.V.; resources, E.J.; data curation, E.J.; writing—original draft preparation, E.J. and G.P.; visualization, E.J.; supervision, A.V.; project administration, E.J.; funding acquisition, E.J. All authors have read and agreed to the published version of the manuscript.

Funding

This research was funded by Interreg Europe, grant number PGI05809.

Acknowledgments

This study was accomplished as part of LC-Districts project, financed by Interreg Europe. Authors appreciate greatly for their contributions.

Conflicts of Interest

The authors declare no conflict of interest.

References

  1. Artola, I.; Rademaekers, K.; Williams, R.; Yearwood, J. Boosting building renovation: What potential and value for Europe. In Study for the iTRE Committee, Commissioned by DG for Internal Policies Policy Department A; European Parliament: Brussels, Belgium, 2016; p. 72. [Google Scholar]
  2. Goverment Officies of Sweden. Available online: https://www.government.se/ (accessed on 1 March 2019).
  3. Swedish Energy Agancy. Energy Situation [Title in Swedish: Energiläget]; Swedish Energy Agancy: Bromma, Sweden, 2017; pp. 1–86.
  4. Swedish Energy Agancy. Summary of Energy Statistics for Dwellings and Nonresidential Premises [Title in Swedish: Energistatistik för Småhus, Flerbostadshus och Lokaler 2016]; Swedish Energy Agancy: Bromma, Sweden, 2016; pp. 1–30.
  5. Swedish Energy Agency. Energy in Sweden—2018; Swedish Energy Agancy: Bromma, Sweden, 2019. Available online: http://www.energimyndigheten.se/en/news/2018/energy-in-sweden---facts-and-figures-2018-available-now/ (accessed on 1 March 2019).
  6. Sköldberg, H.; Ryden, B. The heating market in Sweden-an overall view. In Sverige Värmemarknad; 2014; Available online: http://www.varmemarknad.se/pdf/The_heating_market_in_Sweden_141030.pdf (accessed on 1 March 2019).
  7. National Board of Housing Building and Planning. The Technical Status of the Existing Building Stock; National Board of Housing Building and Planning: Karlskrona, Sweden, 2010. [Google Scholar]
  8. Lindahl, J. National Survey Report of PV Power Applications in Sweden; Uppsala University and International Energy Agency: Uppsala, Sweden, 2014. [Google Scholar]
  9. Bjørneboe, M.G.; Svendsen, S.; Heller, A. Initiatives for the energy renovation of single-family houses in Denmark evaluated on the basis of barriers and motivators. Energy Build. 2018, 167, 347–358. [Google Scholar] [CrossRef]
  10. Shen, P.; Lukes, J.R. Impact of global warming on performance of ground source heat pumps in US climate zones. Energy Convers. Manag. 2015, 101, 632–643. [Google Scholar] [CrossRef]
  11. Shah, I.H.; Hiles, C.; Morley, B. How do oil prices, macroeconomic factors and policies affect the market for renewable energy? Appl. Energy 2018, 215, 87–97. [Google Scholar] [CrossRef] [Green Version]
  12. Gustafsson, M.; Gustafsson, M.S.; Myhren, J.A.; Bales, C.; Holmberg, S. Techno-economic analysis of energy renovation measures for a district heated multi-family house. Appl. Energy 2016, 177, 108–116. [Google Scholar] [CrossRef] [Green Version]
  13. Bonakdar, F.; Sasic Kalagasidis, A.; Mahapatra, K. The Implications of Climate Zones on the Cost-Optimal Level and Cost-Effectiveness of Building Envelope Energy Renovation and Space Heat Demand Reduction. Buildings 2017, 7, 39. [Google Scholar] [CrossRef]
  14. Jalilzadehazhari, E.; Mahapatra, K. The Most Cost-Effective Energy Solution in Renovating a Multi-family House. In Proceedings of the Cold Climate HVAC Conference, Kiruna, Sweden, 12–15 March 2018; Springer: Berlin/Heidelberg, Germany, 2018; pp. 203–216. [Google Scholar]
  15. Tweed, C.; Humes, N.; Zapata-Lancaster, G. The changing landscape of thermal experience and warmth in older people’s dwellings. Energy Policy 2015, 84, 223–232. [Google Scholar] [CrossRef] [Green Version]
  16. Sorrell, S.; Dimitropoulos, J.; Sommerville, M. Empirical estimates of the direct rebound effect: A review. Energy Policy 2009, 37, 1356–1371. [Google Scholar] [CrossRef]
  17. Winther, T.; Wilhite, H. An analysis of the household energy rebound effect from a practice perspective: Spatial and temporal dimensions. Energ. Effic. 2015, 8, 595–607. [Google Scholar] [CrossRef] [Green Version]
  18. Bonakdar, F.; Dodoo, A.; Gustavsson, L. Cost-optimum analysis of building fabric renovation in a Swedish multi-story residential building. Energy Build. 2014, 84, 662–673. [Google Scholar] [CrossRef]
  19. Ekström, T.; Bernardo, R.; Blomsterberg, Å. Cost-effective passive house renovation packages for Swedish single-family houses from the 1960s and 1970s. Energy Build. 2018, 161, 89–102. [Google Scholar] [CrossRef]
  20. Ekström, T.; Blomsterberg, Å. Renovation of Swedish Single-family Houses to Passive House Standard–Analyses of Energy Savings Potential. Energy Procedia 2016, 96, 134–145. [Google Scholar] [CrossRef] [Green Version]
  21. Fowlie, M.; Greenstone, M.; Wolfram, C. Do energy efficiency investments deliver? Evidence from the weatherization assistance program. Q. J. Econ. 2018, 133, 1597–1644. [Google Scholar] [CrossRef] [Green Version]
  22. Amstalden, R.W.; Kost, M.; Nathani, C.; Imboden, D.M. Economic potential of energy-efficient retrofitting in the Swiss residential building sector: The effects of policy instruments and energy price expectations. Energy Policy 2007, 35, 1819–1829. [Google Scholar] [CrossRef]
  23. Friedman, C.; Becker, N.; Erell, E. Retrofitting residential building envelopes for energy efficiency: Motivations of individual homeowners in Israel. J. Environ. Plan. Manag. 2018, 61, 1805–1827. [Google Scholar] [CrossRef]
  24. ISO 13370, E. Thermal Performance of Buildings-Heat Transfer via the Ground-Calculation Methods; ISO 13370: 2007; CEN: Brussels, Belgium, 2007. [Google Scholar]
  25. Levin, P. User Data for Housing Version 1.0 [In Swedish: Brukarindata Bostäder Version 1.0]; Sveby: Stockholm, Sweden, 2012. [Google Scholar]
  26. National Board of Housing Building and Planning. Building Regulation, Regulations and General Advices [In Swedish: Boverkets Byggregler, Föreskrifter och Allmänna råd, BBR. BFS 2011:6 med Ändringar till och med BFS 2018:4 BBR 26]; National Board of Housing, Building and Planning: Stockholm, Sweden, 2018. [Google Scholar]
  27. ASHRAE Standard 55-2010. Standard 55-2010: “Thermal Environmental Conditions for Human Occupancy”; ASHRAE: Atlanta, GA, USA, 2010. [Google Scholar]
  28. ISO7730-Standard. 7730. Ergonomics of the Thermal Environment—Analytical Determination and Interpretation of Thermal Comfort Using Calculation of the PMV and PPD Indices and Local Thermal Comfort Criteria; International Organization for Standardization: Geneva, Switzerland, 2005. [Google Scholar]
  29. Månsson, L. Light & Room, Guide for Planning of Indoor Lighting; Ljuskultur: Stockholm, Sweden, 2003. [Google Scholar]
  30. Peel, M.C.; Finlayson, B.L.; McMahon, T.A. Updated world map of the Köppen-Geiger climate classification. Hydrol. Earth Syst. Sci. Discuss. 2007, 4, 439–473. [Google Scholar] [CrossRef] [Green Version]
  31. National Board of Housing Building and Planning. Building Regulation, [In Swedish: Boverkets Byggregler, BFS 2011: 6 med ändringar till och med 2015: 3]; National Board of Housing, Building and Planning: Stockholm, Sweden, 2015; (In Swedish: Boverket). [Google Scholar]
  32. Climate OneBuilding. 2020. Available online: http://climate.onebuilding.org/WMO_Region_6_Europe/SWE_Sweden/index.html (accessed on 1 March 2020).
  33. Solhybrid. 2018. Available online: http://www.solhybrid.se/ (accessed on 1 August 2018).
  34. Galimshina, A.; Engström, J. Development of a Solar Strategy for Helsingborgshem; EEBD: Lund, Sweden, 2017. [Google Scholar]
  35. Finnegan, S.; Jones, C.; Sharples, S. The embodied CO2e of sustainable energy technologies used in buildings: A review article. Energy Build. 2018, 181, 50–61. [Google Scholar] [CrossRef]
  36. Louwen, A.; Van Sark, W.G.; Faaij, A.P.; Schropp, R.E. Re-assessment of net energy production and greenhouse gas emissions avoidance after 40 years of photovoltaics development. Nat. Commun. 2016, 7, 1–9. [Google Scholar] [CrossRef] [PubMed]
  37. Eurostat. 2020. Available online: http://appsso.eurostat.ec.europa.eu/nui/submitViewTableAction.do, (accessed on 1 January 2020).
  38. Fedrizzi, R.; Dipasquale, C.; Bellini, A. D6.5—Position Paper on Systemic Energy Renovation. Available online: http://inspirefp7.eu/wp-content/uploads/2017/01/WP6_D6.5_20161201_P1_Position-Paper-on-Systemic-Energy-Renovation.pdf (accessed on 1 August 2018).
  39. National Research Council. Electricity from Renewable Resources: Status, Prospects, and Impediments. Chapter 4: Economics of Renewable Electricity; National Academies Press: Washington, DC, USA, 2010. [Google Scholar]
  40. Burke, M.J.; Stephens, J.C. Political power and renewable energy futures: A critical review. Energy Res. Social Sci. 2018, 35, 78–93. [Google Scholar] [CrossRef]
Figure 1. The first and second floors of the single-family house.
Buildings 10 00100 g001
Figure 2. The occupancy schedule applied when running simulations.
Buildings 10 00100 g002
Figure 3. Four Swedish climate zones and the position of four regions analysed.
Buildings 10 00100 g003
Figure 4. Internal rate of return (IRR) values in four climate zones when installing energy supply systems with three different energy prices and a lifespan of 30 years.
Buildings 10 00100 g004
Figure 5. IRR values in four climate zones when installing energy supply systems with three different energy prices and a lifespan of 50 years.
Buildings 10 00100 g005
Figure 6. (a) Variation in IRR with respect to changes in lifespan and energy price in climate zone I. (b) Variation in IRR with respect to changes in lifespan and energy price in climate zone II. (c) Variation in IRR with respect to changes in lifespan and energy price in climate zone III. (d) Variation in IRR with respect to changes in lifespan and energy price in climate zone IV.
Buildings 10 00100 g006
Figure 7. (a) Variation in IRR with respect to changes in lifespan and energy price in climate zone I. (b) Variation in IRR with respect to changes in lifespan and energy price in climate zone II. (c) Variation in IRR with respect to changes in lifespan and energy price in climate zone III. (d) Variation in IRR with respect to changes in lifespan and energy price in climate zone IV.
Buildings 10 00100 g007
Figure 8. (a) Variation in IRR with respect to changes in lifespan and energy price in climate zone I. (b) Variation in IRR with respect to changes in lifespan and energy price in climate zone II. (c) Variation in IRR with respect to changes in lifespan and energy price in climate zone III. (d) Variation in IRR with respect to changes in lifespan and energy price in climate zone IV.
Buildings 10 00100 g008aBuildings 10 00100 g008b
Figure 9. Payback period (PBP) values in four climate zones when installing energy supply systems with three different energy prices and three interest rates.
Buildings 10 00100 g009
Figure 10. (a) Variation in PBP with respect to changes in the interest rate and energy price in climate zone I. (b) Variation in PBP with respect to changes in the interest rate and energy price in climate zone II. (c) Variation in PBP with respect to changes in the interest rate and energy price in climate zone III. (d) Variation in PBP with respect to changes in the interest rate and energy price in climate zone IV.
Buildings 10 00100 g010
Table 1. The thermal specifications of the single-family house.
Building EnvelopesU-Value
U-value of external walls0.25 (W/m² K)
U-value of attic roof0.08 (W/m² K)
U-value of external floor0.27 (W/m² K)
U-value of external windows1 (W/m² K)
Table 2. Photovoltaic solar panels (PV) systems, used when installing ground source heat pump-PV (GSHP-PV) system in four climate zones.
Total Number of PanelsTotal Area (m2)Max. Power (kW)Tilt Toward South
Climate zone I3151.28.845°
Climate zone II2541.37.145°
Climate zone III23386.645°
Climate zone IV21335.745°
Table 3. Three different energy prices considered.
Energy PriceEnergy Price for Electricity
Lowest energy price among European countries in 2019 * [37]0.48 (SEK/kWh)
Highest energy price among European countries in 2019 * [37]3.36 (SEK/kWh)
Energy price in Sweden in 2019 * [37]1.45 (SEK/kWh)
* Including tax and levies.
Table 4. Investment, maintenance and installation costs of energy supply systems.
Supply SystemsInvestment CostMaintenance Cost (SEK/kW.Y)Installation Cost
GSHP [38]6000 (SEK/kW)15024,000 (SEK/kW)
PV system [33]19,000 (SEK/kW)3423800 (SEK/kW)
GSHP-PV system [33,38]25,000 (SEK/kW)49227,800 (SEK/kW)
Table 5. The total energy consumption of the single-family house.
Initial
(kWh/m2)
After Installing
GSHP (kWh/m2)
After Installing
PV (kWh/m2)
After Installing
GSHP + PV (kWh/m2)
Climate zone I1975316421
Climate zone II12441869
Climate zone III11932793
Climate zone IV11329672

