Comparison of Different Intervention Options for Massive Seismic Upgrading of Essential Facilities


1
Italian National Research Council—IGAG, 00010 Montelibretti, Rome, Italy
2
School of Engineering, University of Basilicata, 85 100 Potenza, Italy
3
Department of Engineering, Pontificia Universidad Catolica del Peru, Lima 07001, Peru
*
Author to whom correspondence should be addressed.
Buildings 2020, 10(7), 125; https://0-doi-org.brum.beds.ac.uk/10.3390/buildings10070125
Submission received: 3 June 2020
/
Revised: 6 July 2020
/
Accepted: 7 July 2020
/
Published: 9 July 2020
(This article belongs to the Collection Non-linear Modelling and Analysis of Buildings)
Abstract
:The seismic retrofitting of essential facilities is a typical problem of public administrations. Due to the large amount of existing and/or historic buildings with a high seismic vulnerability and the limited economic resources, it is necessary to provide efficient solutions for the structural reinforcement of these structures on a national, regional, and urban level. This paper proposes an innovative and multidisciplinary framework to choose massive interventions on a large territorial scale according to the potential benefits of the intervention in terms of reduction in expected economic losses associated with retrofitting intervention and other important aspects usually neglected in intervention strategies. The proposed framework is based on Multi-Criteria Decision-Making (MCDM) analysis. It is applied to a very complex urban area: the case study is the school buildings stock (4458 buildings) in the Lima Metropolitan area, Peru. The goal of the study is arisk analysis aimed at selecting the optimal retrofitting strategy in a huge urban area. The results of this work can be considered the base for decision-makers. They could use them as a decision support tool in the seismic risk mitigation on a large territorial scale.
1. Introduction
Essential facilities (schools, hospitals, etc.) have a strategic role in ordinary conditions, and their role is even more important and critical during a disaster. The continued use of essential facilities is crucial for the functionality of urban systems. However, recent studies have highlighted the high seismic risk of these constructions and network particularly in megacities [1,2,3,4]. The need to enhance their seismic capacity with suitable retrofitting interventions has been highlighted. These interventions should ensure the continual operation of buildings and cannot be based only on engineering parameters such as building seismic capacity, seismic intensity demand, and/or their ratio. Optimal retrofitting interventions should be performed taking into account engineering, social, and economic aspects that are often neglected, such as probabilistic risk analysis, public safety, environmental impact, socio-economic loss assessment, and sustainability, as well as the social and natural environment [5].
In many countries, there are large amounts of existing buildings in strategic networks with high seismic vulnerability. Considering the restricted economic availability of public administrations, massive structural reinforcements are required in prioritized buildings to mitigate the high seismic risk of these structures and optimize the available economic resources through intervention solutions that reduce installation times and costs. These issues are a big problem on the agenda for public administrations. A multidisciplinary and transparent approach enhancing the analytic rigor should be used in order to avoid that the intervention solutions are prejudiced by irrational, non-technical, not measurable strategies or limited decision maker’s skills, and failure to meet the needs of users and owners, generating corruption problems [6]. In this manner, the different needs of all stakeholders can be effectively considered. The above issues are particularly relevant in urban agglomerations (megacities) with several million people [7].
Several existing approaches brings methods to select prioritized buildings that would be retrofitted in a very early fist stage but the practical applications for the selection of the optimal retrofitting solution are still poor, particularly in megacities.
This goal is even more relevant for megalopolises (or megaregions) and their sub systems. In megacities, seismic risk analyses must be approached in a highly multidisciplinary way and their unique characteristics are taken into consideration. In some cases, existing studies, models, and methods could be not applicable due to available information and especially to strong and complex interaction between different characteristics. This complexity can only be addressed by providing decision makers with simple and applicable tools. On the other hand, new tools, instruments, and new and more powerful technologies have made possible significant improvements in risk management.
Transparent and optimal retrofitting strategies could be defined through Multi-Criteria Decision-Making (MCDM) analysis. MCDM methods are commonly employed in most scientific, economic, and industrial fields to solve decision and planning problems involving multiple conflicting criteria. They solve complex problems in a technically valid and practically convenient way improving the transparency, the analytic rigor, auditability, and conflict resolution of decision makers [8]. Some interesting applications have been carried out to provide prioritization strategies for the seismic risk mitigation of essential facilities [1,4], and to select the optimal rehabilitation system in a single building [9,10].
This study follows previous studies based on MCDM methods. It proposes an innovative approach for the practical and optimal selection of retrofitting intervention strategies on a large territorial scale. To apply MCDM analysis, the economic, social, and technical convenience of the several selected interventions is considered. Consequently, the optimal solution is selected by comparing the expected reduction of seismic losses with the cost and other topics (social needs of the buildings’ users, safety during the works, quickness and reproducibility of the retrofit techniques, construction times and costs reduction, continuity of use of buildings). Operatively, the study leads to selecting optimal retrofitting strategies for existing buildings based on the design and careful evaluation of different intervention options on a wide territorial area. The proposal is applied in the Lima Metropolitan area and their typical school buildings. In a previous study [1,11], the list of priorities has been defined. In this study, the results complete the provided framework with optimal retrofitting strategies to support decision makers.
2. Methodology
Seismic risk mitigation strategies aimed at reducing buildings vulnerability on a large territorial scale require huge financial resources; therefore, it is essential to correctly understand the real dimensions of the problem in order to evaluate the need to intervene with appropriate measures. For these reasons, the proposed procedure requires, first, the evaluation of the current seismic risk of the exposed facilities.
When the political decision maker decides to intervene (generally based on a predetermined investment amount), different intervention solutions should be carefully designed and compared through a multidisciplinary and transparent decision-making process, which allows to take into account all the possible needs of the stakeholders. Each intervention option allows a reduction of vulnerability for single buildings. Nevertheless, on a large territorial area, the seismic risk mitigation may be not proportional to the installation cost and the best technical solution may not be the best solution. For this reason, it is essential to design different intervention solutions and then choose the global optimal solution.
Retrofit costs and consequent vulnerability functions are defined for all intervention options and these last are convoluted with seismic hazard and exposure models to evaluate the relevant reduction in expected losses. In addition to the expected losses and installation cost, other important aspects related to the social needs of the building’s users, safety in construction site operations and intervention reproducibility are analyzed in order to improve the technical, social, and economic benefits of the selected strategies.
In this study, attention is paid to the analysis of construction sites and the working process. In fact, the failure to assess the safety in construction site operations in a preliminary phase can lead to delays and cost increases, as well as additional risks on the safety of operators and users. Thus, construction site operations and associated equipment should be investigated. For this criterion, in a preliminary phase, retrofitting interventions are compared in terms of risk level associated to them.
To compare the different intervention options and select the optimal solution, MCDM methods are used. The main advantage of these methods is the comparison of quantitative and qualitative criteria. In this section, a brief description is reported. Any MCDM method is based on two basic parameters:
- the decision matrix D = [xij] (rectangular n×m, where n is the number of options and m is the number of judgment criteria, in which the generic column represents the performance of the i-th option with respect to the j-th criterion).
- the criteria weight vector W, which represents the importance that the decision maker gives to each judgment criterion.
After the definition of the decision matrix and criteria weight vector, the most appropriate MCDM method can be applied. Obviously, to define the decision matrix, for the same intervention option all the performances concerning each criterion must be evaluated. The performance of each intervention option with respect to the quantitative criteria can be directly inserted in the appropriate column of the decision matrix, while in order to evaluate the terms concerning the qualitative criteria, it is necessary to transform qualitative judgments into quantitative values.
There are several methods and models for various MCDM problems founded on different perspectives and theories. The Analytic Hierarchy Process (AHP) method [12,13] can be applied to assess quantitative the qualitative judgement criteria and determine criteria weights, while the TOPSIS method [14] can be used to compare and choose the optimal retrofit interventions. These methods (which allow reaching the goals of the study) are considered following the previous study on Lima Metropolitan areas [1].
The AHP method is based on matrices of pairwise comparisons and eigenvalue theory. It allows to divide a decision problem with different options and a plurality of criteria into a hierarchy of more easily comprehensible sub-problems that can be examined independently.
The TOPSIS method can directly select the preferred solution thanks to its capability to manage judgment criteria and variables, the reduced difficulty of analyzing parameters and choices, and the clarity of results. It can be developed in a series of steps:
Step 1: Construction of the normalized decision matrix R = [rij].
Todeal with incongruous criteria dimensions, all the xij values in the decision matrix D have to be normalized to form the matrix R = [rij]. The normalized value rij is calculated as follows:
where n is the number of intervention options and m is the number of judgment criteria:
Step 2: Construction of the weighted normalized decision matrix V = [vij].
By multiplying the normalized matrix by the weight wj of the j-th judgement criterion. The weighted normalized value vij is calculated as follows:
Step 3: Identification ideal solution A* and negative-ideal solution A−.
The ideal solution A* is determined by considering for each criterion the best performance value among the intervention options. On the other side, the negative-ideal solution A− is obtained by considering for each criterion the worst performance measure among the options.
where B is associated with benefit criteria, and C is associated with cost criteria:
Step 4: Calculation of the distance of each intervention option Ai from the two “virtual” options A* and A−.
The separation of each intervention option from the ideal solution is defined as follows:
Similarly, the separation from the negative-ideal solution is evaluated as follows:
Step 5: Determination of the relative closeness Ci* to the ideal solution A*.
The relative closeness of the retrofit option Ai with respect to A* is defined as follows:
According to the Ci* values, a ranking of the retrofit interventions can be defined. In particular, the optimal intervention is the one with the highest Ci* value, that is, the intervention option having the shortest distance from the ideal solution and the farthest distance from the negative-ideal solution. Finally, a sensitivity analysis of the results can be carried out to check if the selected solution is also sufficiently stable.
Four intervention options (n=4) are examined and compared based on eleven judgement criteria (m=11) shown in Table 1. The considered criteria analyze all the previously mentioned aspects and other themes usually neglected in the retrofitting strategies, such as aspects related to the visual inspection of the intervention in order to avoid irregularities in the execution of the work and in the quantity and quality of the materials used.
Based on the seismic risk assessments (Section 3.4), the expected economic losses with and without the specific retrofitting techniques are compared within C1, C2, and C3 criteria, which represent the seismic risk mitigation.
The criterion C4 gives a preliminary estimate (US dollar) of the total cost of the considered retrofitting techniques. Furthermore, the demolitions and subsequent renovations costs (partitions, infill panels, doors, etc.) are also considered.
The C5 criterion considers the different aspects related to planning and safety in the construction site operations. For each intervention option, these aspects are assessed according to a Risk Level (RL) defined using Equations (8) and (9).
For the risk assessment on construction site, the list of risks provided by UNI 10942 [15] is considered. Using this list, the “s” risks present in each activity of the considered retrofit technique can be identified. The amount of risk (Ri) associated with each required activity can be evaluated as follows:
where M is the severity of injury of the person or the magnitude, and P is the probability that the risk will result in an accident (M and P variable in the 1–4 range). The RLassociated with each retrofit technique is defined as follows:
The C6 criterion assesses whether the retrofit intervention involves the removal of students in adjacent classrooms and/or the complete shift of teaching activities in other structures. This criterion aims to avoid costs that are not strictly related to the intervention, such as the costs associated with the movement of occupants in other structures, therefore, a retrofit technique generating less perturbative effects should be preferred. Consequently, the intervention options in which the adjustment works are concentrated in areas that interfere as little as possible with the teaching activities have been preferred.
The C7 criterion estimates the maintenance operations to be performed during the normal life of the structure in the post-intervention phase to preserve the buildings. It describes the exposure to physical and chemical degradation phenomena for each retrofitting technique.
The C8 criterion analyzes the possibility of oversaw the various activities and work processes for each retrofitting technique. Its purpose is to prevent thecorruption and poor execution and management of the work carried out affecting the construction industry. These aspects involve serious irregularities in the execution of the work and in the quantity and quality of the materials used.
The C9 criterion compares the intervention options in terms of aesthetic and functional compatibility (i.e., with the normal activities of the building users). In other words, it evaluates the architectural impact resulting in the installation of the generic retrofit solution. This criterion is very important to ensure the normal activities of the building occupants during the execution of the works.
The C10 criterion considers the different impediments associated with the realization of each intervention option (availability of skilled labor, materials, and technologies) to realize and guarantee a very good final work. In other words, this criterion considers the amount of qualified workforce and skilled technology necessary for the realization of the considered retrofitting techniques. Some techniques require more skilled labor, materials, and technologies than traditional interventions. Generally, these features could be more difficult to find.
The C11 criterion analyzes the production process for each retrofitting technique to maximize the reduction of seismic risk in the areas studied. Retrofit interventions on a considerable number of buildings involve significant industrial needs for real and effective implementation of the mitigation strategies. It is therefore more appropriate to select retrofitting techniques that lend themselves better to their industrial reproducibility to reduce installation times and costs, as well as to guarantee the maximum safety and reliability of the intervention carried out.
The first five criteria are quantitative, while the remaining criteria are partially qualitative. In addition, the first seven criteria were processed as cost criteria (their minimization was searched), while the other criteria have been processed as benefit criteria (their maximization was searched). Obviously, other criteria could be used based on the specific needs of decision makers. However, the analyzed criteria seem to be the best solution for a first classification of the interventions.
3. Retrofitting Strategies for School Buildings in Lima
Lima (the capital of the Republic of Peru) is one of the oldest cities in South America. The Lima Metropolitan area comprises the 43 districts of Lima and the sixdistricts of the close province of Callao. It has an area of about 2800 km2 of extension and a population of about 10 million. Monumental and cultural heritages are widespread and scattered acrossthe city, and the originality of its historic center has earned the award of World Heritage Site by UNESCO in 1988.
Nevertheless, strong differences can be found in different districts in terms of average income per citizen, available services, networks, and security problems. These differences play a key role in governance and consequently in the definition and application of effective mitigation strategies. In particular, the school system plays a crucial social role, and for this reason, it is also fundamental from the point of view of natural risk management. Consequently, the school network is considered in this study and the optimal retrofitting intervention strategy is defined based on the proposed framework.
From a seismic hazard point of view, five seismic zones are considered in Lima Metropolitan area [16]:
- Zone I (S1) corresponds to hard ground or rock. This area has nolocal amplification.
- Zone II (S2) consists of fine granular soils and colluvial and alluvial clay soils on gravel. This area has moderate amplification effects.
- Zone III (S3) corresponds to sandy soil without the presence of water. The soils in this area are very durable but have important effects of amplification.
- Zone IV (S4) is formed by sandy soil with water.
- Zone V (S5) comprises filler soil.
In S4 and S5, there are very important amplifications that can even lead to structural instability of buildings due to the liquefaction phenomenon. Fortunately, in S5 there are no schools.
The schools in Lima are often built with poor construction practices due to the lack of regulated procedures and quality supervision [17]. According to several studies [1,16], six representative building types define the public school buildings analyzed in Lima: modular 780-PRE (PRE, 4401 buildings), great school unit (GUE, 57 buildings), modular 780-POST (POST, 997 buildings), unconfined masonry (MS-PRE-B, 1388 buildings), adobe walls (A-PRE-B, 147 buildings), and prefabricated lightweight material (PREF, 438 buildings). Within each building type, the buildings have a modular structural scheme with approximately the same dimensions, materials, and structural and foundation details. They meet the same building regulations and/or construction practices.
Among the six building types, only the POST type (currently used in Peru for the school buildings) has adequate seismic design criteria and showedappropriate levels of earthquake resistance during recent seismic events in southern Peru. It is a modular system of reinforced concrete frames and confined masonry, such as the PRE and GUE building types. For the other five building types, a massive seismic upgrading is required due to the lack of adequate seismic design criteria. More details on these building types can be found in [16].
The modular 780-PRE is the predominant building type in terms of number of buildings, built area, and number of students. Therefore, this building type is analyzedherein, and the choice of its optimal retrofitting strategy is also applied to the GUE buildings, given their similarity. Consequently, a total of 4458 school buildings are considered in this case study. Figure 1 shows their location within the seismic zones of the city. The influence of site amplification could significantly affect the damage distribution (for example [18]). Nevertheless, at this territorial scale and for this study step, it is neglected.
3.1. Buildings Descriptions
PRE buildings consist in reinforced concrete frames with confined masonry (thickness of 0.25 m) in the longitudinal direction and infill masonry panels (thickness of 0.13 m) in the longitudinal direction. They have from one to three floors and from two to five classrooms per floor with longitudinal corridor along the building’s facade. In general, the first floor is used as classrooms, libraries, stores, or administrative offices, while the upper levels are used as classrooms. The staircase is located next to the buildings. Figure 2 shows a typical PREbuilding with two floors and three classrooms in each of them.
The analyzed buildings can be considered as having approximately regular shape in plan and elevation (Figure 3). The classrooms are approximately square (about 7.80 m per side) and the interstory height is equal to 3.25 m. In the longitudinal direction, the structural system consists of two frames, while in the transversal direction the structural system is a combination of reinforced concrete frames and confined masonry walls.
The frames are rigid only in the transversal direction. In this direction, beams support the gravity loads (due to the one-way slabs) and have a rectangular cross section of dimension 30 × 70 cm or 25 × 45 cm (in the frames with confined masonry panels). In the longitudinal direction, columns are connected by rectangular beams with dimensions of 25 × 45 cm. Columns sizes are 25 × 45 cm (external columns) and 25 × 25 cm (internal columns) in the transversal frames with confined masonry walls, and 30 × 45 cm where these masonry walls are not present. Infill panels consist of brick walls with a total thickness of about 13 cm and a height of about 2.00 m. The windows have a height of 0.75 m. Finally, the floors (including the roof) are RC slabs with thickness of 20 cm (15 + 5), thus, they can be considered rigid in their own plane.
Based on the results of laboratory tests performed on the examined buildings, the mean value of concrete cylinder compressive strength fcm has been set to 17.50MPa and the mean value of steel yield strength fym has been set to 420MPa, while for masonry walls and infill panels, the relevant compressive strength fm has been assumed equal to 4MPa. Information on amount and detailing of reinforcement in the structural members can be found in Figure 3c.
PRE buildings suffered significant damage in the earthquakes of the past, mainly due to the low lateral stiffness of the frames in the longitudinal direction that triggered the problem of shear failure due to short column effect, severe cracking of the infill panels, problems of connection, etc.
3.2. Retrofitting Methods
The Ministry of Education of Peru requested the World Bank’s technical assistance to develop a seismic risk mitigation strategy forPeruvian school buildings. To reduce the vulnerability of typical PRE and GUE buildings, the World Bankargued thatthe implementation of incremental retrofitting techniqueswas more convenientthan the demolition and reconstruction of buildings [19]. Based on these aspects, four different intervention options are considered and compared herein in order to obtain a total seismic upgrading of PRE and GUE building types:
- A1—Compound walls.
- A2—Steel bracing.
- A3—RC walls.
- A4—Cable bracing system.
Each of them shows different advantages and drawbacks. In particular, the first three options (compound walls, steel bracing, and RC walls) were proposed by the World Bank [19]. In this study, the fourth option (a specific designed retrofitting technique based on cable bracing system) is proposed. In the following section, the first three intervention options are briefly described, and more details are reported on the fourth intervention. For the design of all the retrofit interventions, the Peruvian spectrum [20] for an intermediate soil S2 (C= 2.5, Z= 0.45, U= 1.50, S= 1.05 and Tp= 0.60) was used as seismic demand.
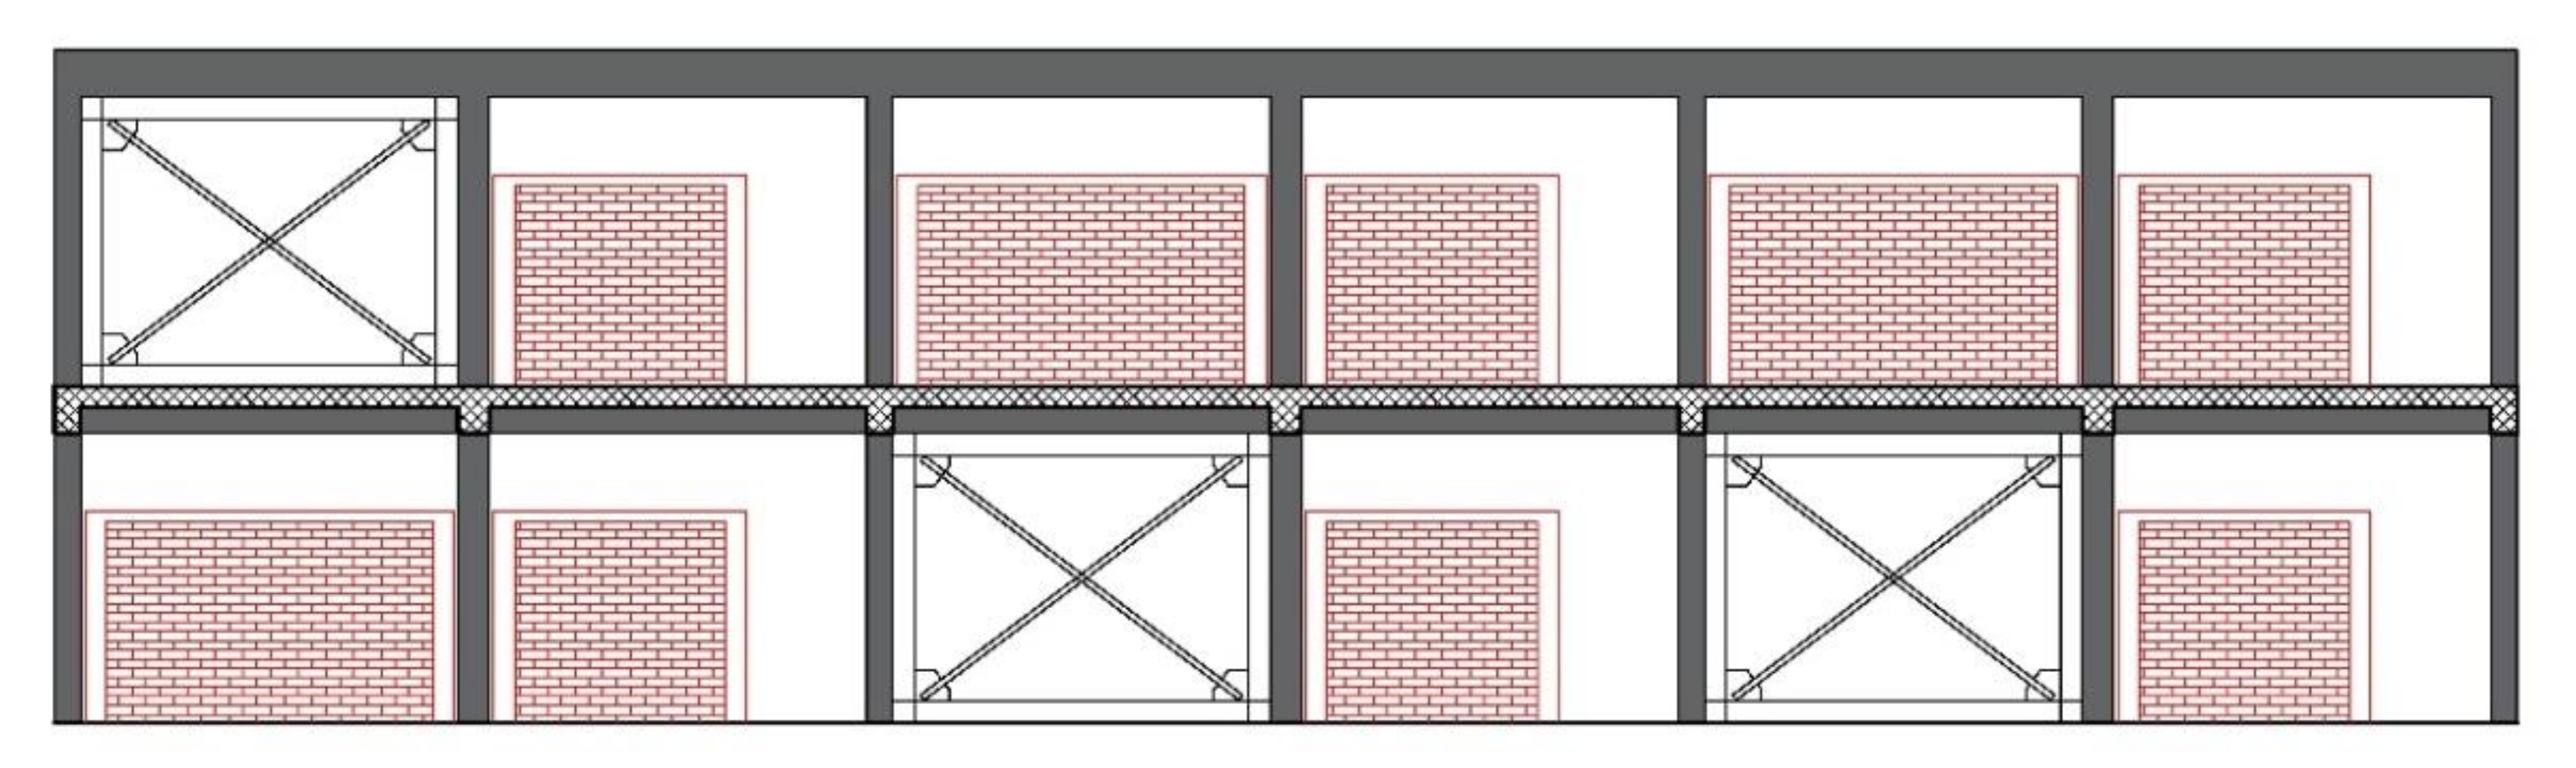
3.2.1. Intervention A1—Compound Walls
In the longitudinal direction, the retrofit intervention A1 consists ofcreating opportune confined masonry walls covered on both sides with plaster reinforced with welded wire mesh that jacket each side of the original columns 30 × 45 cm. The jacketing of all these elements creates three compound walls in each of the two longitudinal frames (one for each column 30 × 45 cm). In the upgrading design, the compressive strength of concrete and masonry was assumed equal to 21MPa and 4MPa, respectively, while the yield steel strength was set to 420MPa. This technique allows enhancing the resistance and ductility of the initial structure; obviously with this rehabilitation system, the overall failure of the structure is related to the maximum displacement of the compound walls. Its main advantage is the low cost and ease of construction. Figure 4 shows the schematic view for this intervention.
3.2.2. Intervention A2—Steel Bracing
The retrofit intervention A2consists of placing three steel frames with concentric bracing in each of the two longitudinal frames. The steel frames have cross-section W200 × 135 × 26.6 while the bracings have square hollow section 60 × 60 × 5. The latter are welded to the steel frames, which are connected to the RC frame using shear connectors. All the elements are made of S355 steel. This technique enhances the overall performance of the structure in terms of resistance and ductility, and its failure is related to the flexure failure of RC columns. The main benefit of this reinforcement is the fast installation time, while its disadvantage is the high cost. Figure 5 shows the schematic view for the retrofitting intervention.
3.2.3. Intervention A3—RC Walls
The retrofitting intervention A3consists of reinforcing three continues columns in each of the two longitudinal frames, increasing the central column size, and converting the adjacent ones into concrete walls. In designing the reinforced concrete jacketing, the compressive strength of the concrete and the yield strength of reinforcing bars were assumed equal to 21MPa and 420MPa, respectively. This technique requires the reinforcement of the footings for the new walls due to the increase in axial forces during seismic actions [21]. Its main advantage is the great increase in the performance of the structure in terms of stiffness, resistance, and ductility. In addition, it allows to improve the beam-column joints. However, some problems are the need of competent manpower to carry out the reinforcement works, and the time required to perform the intervention. Figure 6 shows the schematic view for the retrofitting intervention.
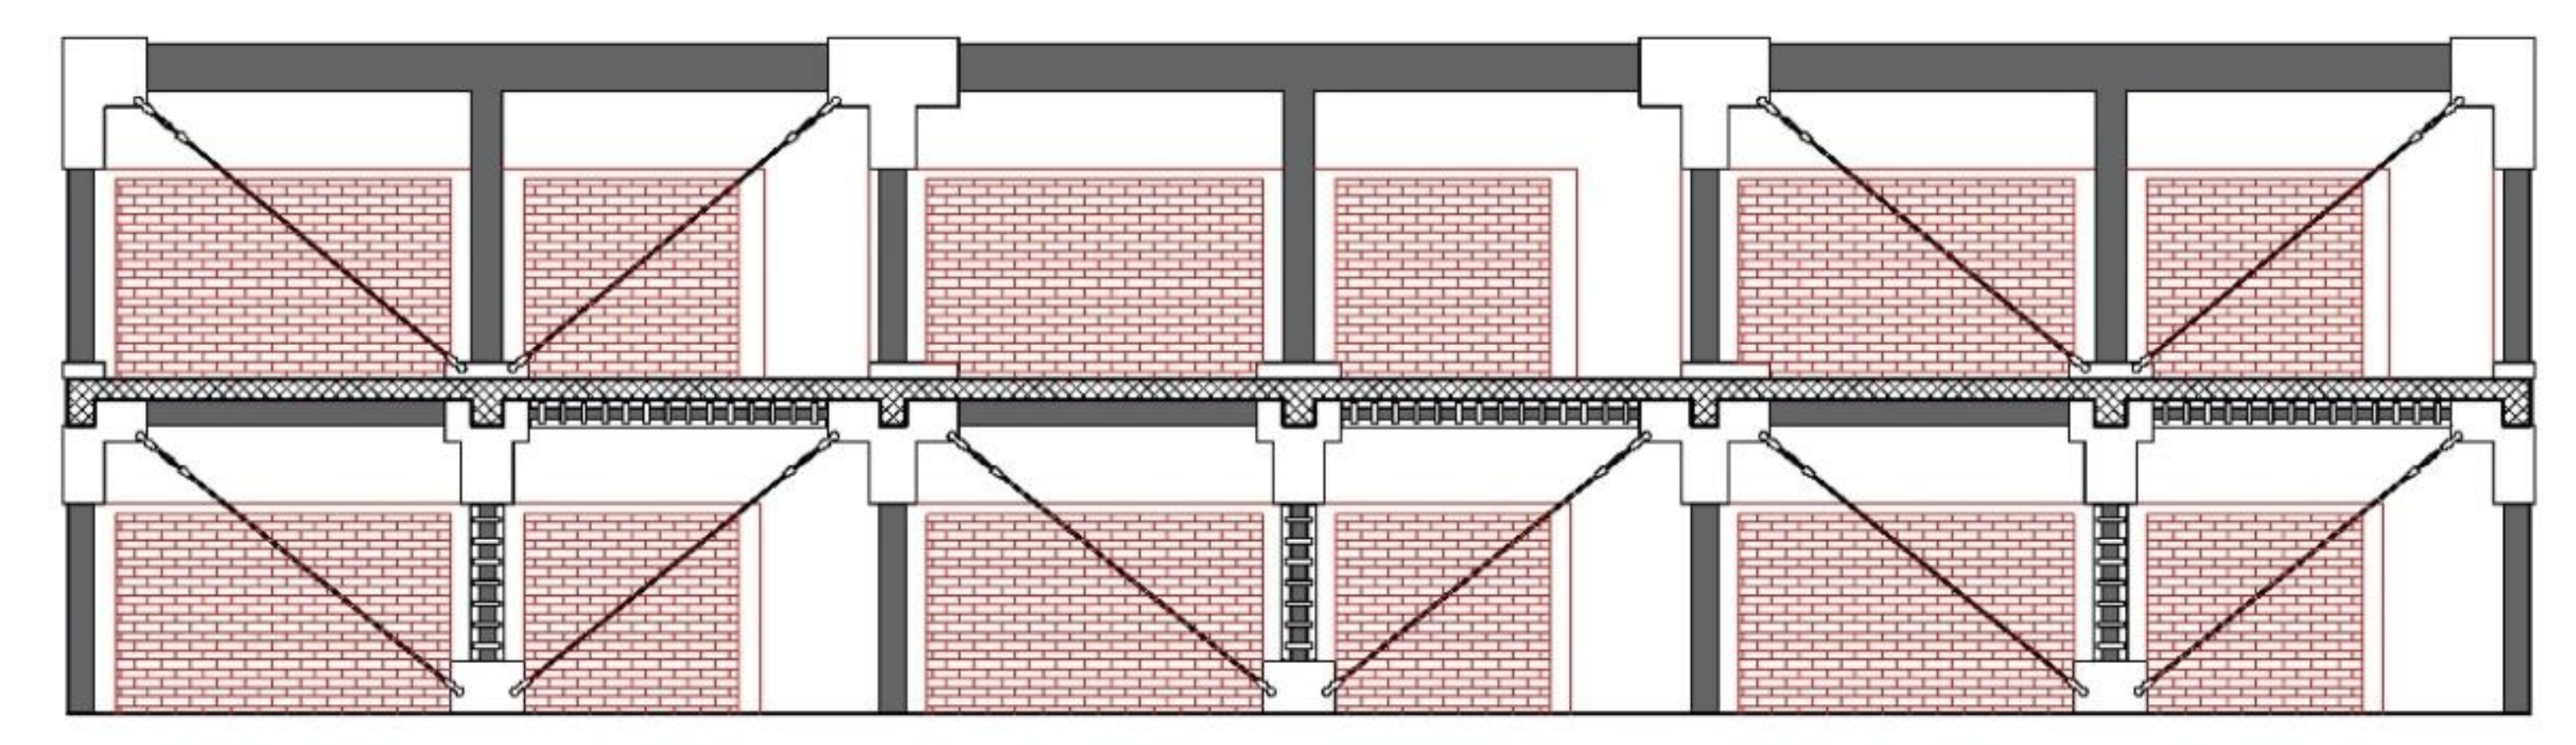
3.2.4. Intervention A4—Cable Bracing System
The retrofitting intervention A4 involves the installation of an innovative cable bracing system in each of the two longitudinal frames. In the structural meshes shown in Figure 7, two parallel cables are arranged in diagonal to maintain the openings in the braced fields. They are connected to the RC frame using steel plates in the beam-column joints and steel jackets in the adjacent structural elements.
According to European and Peruvian seismic codes [20,22,23], the proposed rehabilitation system was designed using non-linear finite element analysis. The system was designed in such a way that the collapse of infill panels at the first story precedes the collapse of existing beams and columns, avoiding the problem of shear failure due to short column effect. 1 × 19 stainless steel cables with a diameter of 26 mm and 20 mm thick steel plates are required. The former has a breaking strength of 1570 MPa and an elastic modulus of 130 GPa, while the latter and the steel jackets are made of S355 steel.
The proposed reinforcement system has an essential load bearing function during seismic actions. It aims at increasing the resistance and ductility of the structure remaining almost unchanged its stiffness. Unlike previous intervention options, this retrofit intervention avoids the creation of seismic joints (dictated in the previous interventions), which involve significant demolition and reconstruction of non-structural elements. In this way, it has the great advantage of minimizing the duration of the work and the consequent disturbance to the normal teaching activities of the occupants, ensuring a better functional and architectural compatibility of the intervention with respect to the original structure. Its disadvantage is the need of a good level of workers’ specialization to carry out the intervention.
3.3. Structural Performance Evaluation, Fragility and Vulnerability Curves
Currently, large sets of buildings require that many buildings be analyzed. Several analytical evaluation methods are defined based on simplified methodologies and compared with more sophisticated nonlinear dynamic analyses [24]. In this study, the main goal has been achieved with a reasonable computational effort.
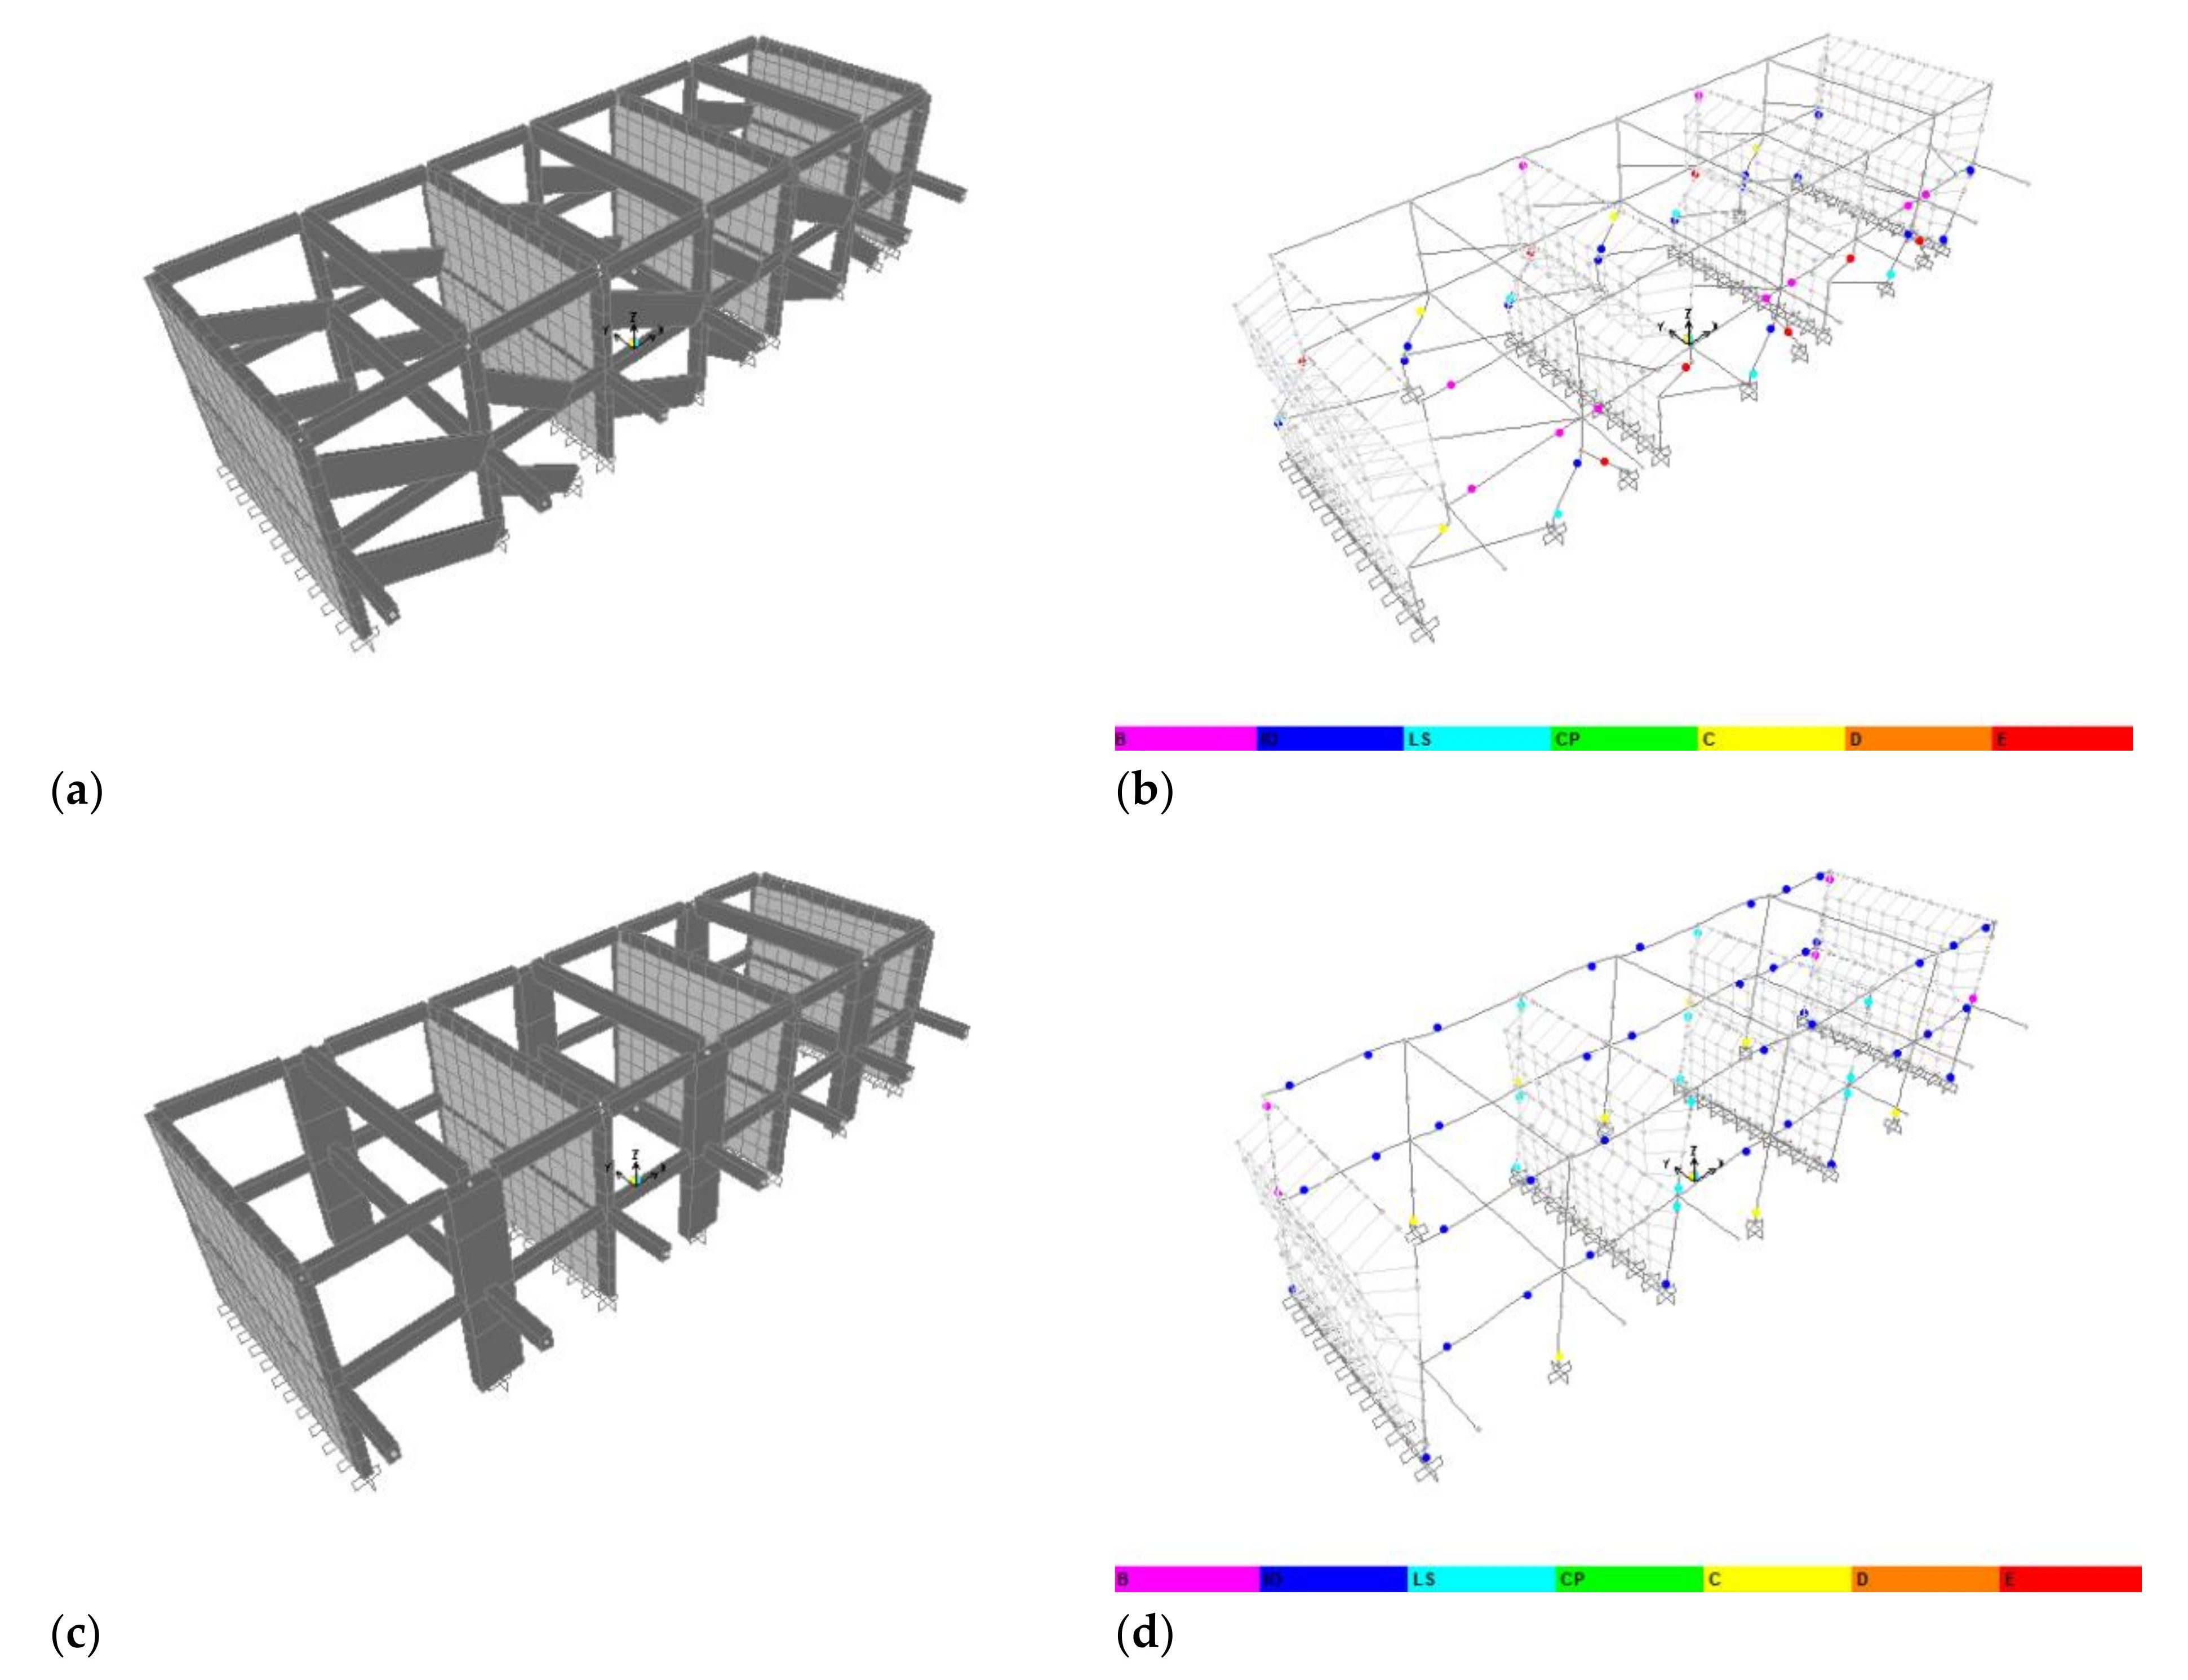
The seismic performances of the investigated buildings have been evaluated in current state and for each considered retrofitting technique using nonlinear static analysis method. The buildings have been modelled in 3D using a finite element software [25]. More specifically, with respect to the modelling of confined masonry walls, two-dimension elements (membrane type) have been used, while in the modelling of beams and columns, one-dimensional elements with concentrated plastic hinges have been assigned. Infill panels, concentric bracings, and cables were modelled as trusses. Truss elements used to model infill panels can be subjected only to axial compressive forces, while truss elements used to model concentric bracings and cables can only bear axial tensile forces. Axial force – axial displacement hinges have been used to characterize their nonlinear behavior. Properties of plastic hinges have been defined based on the dimensions, details, and mechanical properties of each structural and non-structural element. It is noted that the maximum resistance of infill panels and their equivalent truss model have been estimated according to Peruvian code [22]. This maximum resistancehas been assumed to be constant during the plastic axial displacement capacity (up). The latter has been definedby means of the yielding(uy) and ultimate axial displacement capacity (uu) of the equivalent truss element (up = uu – uy), considering a drift yield and ultimate of 1.25‰ and 5‰, respectively. Internal diaphragm constraints have been assigned to all nodes of the same floor to consider the effective stiffness of the floors. In this study, the seismic performances of the foundations are neglected based on the large territorial scale and the available information. Moreover, moment-resisting frames are less sensitive to foundation movement and are often not significantly affected by soil-structure interaction (see for example [26]). Obviously, for planning the interventions, the retrofit cost of the foundation system has been preliminary estimated.
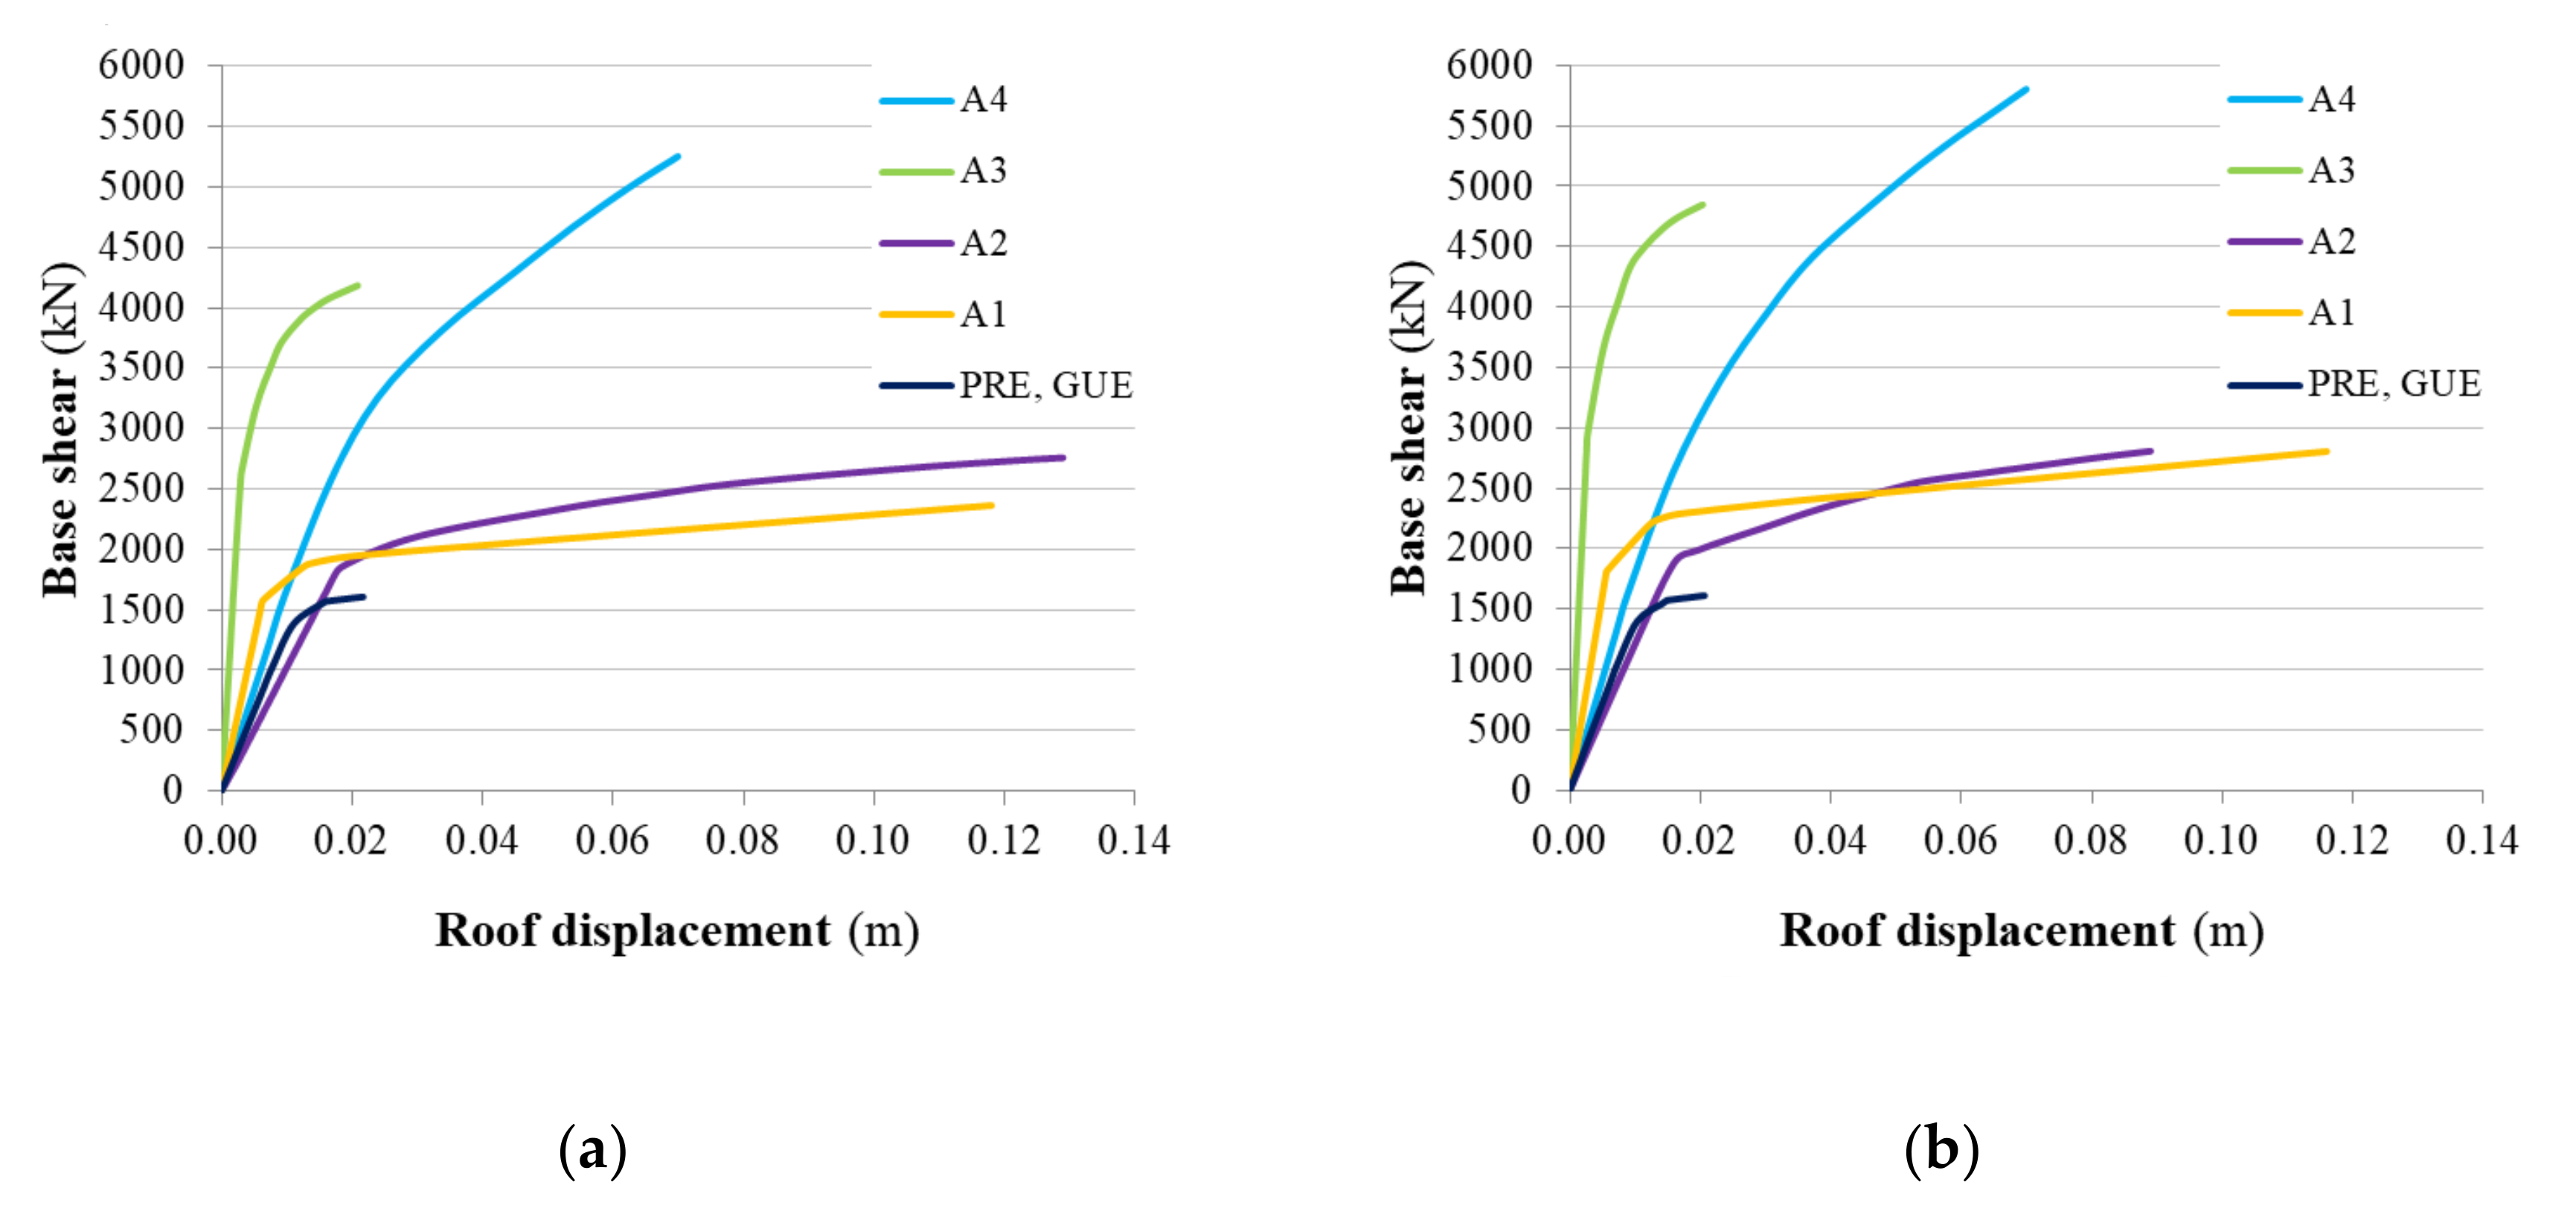
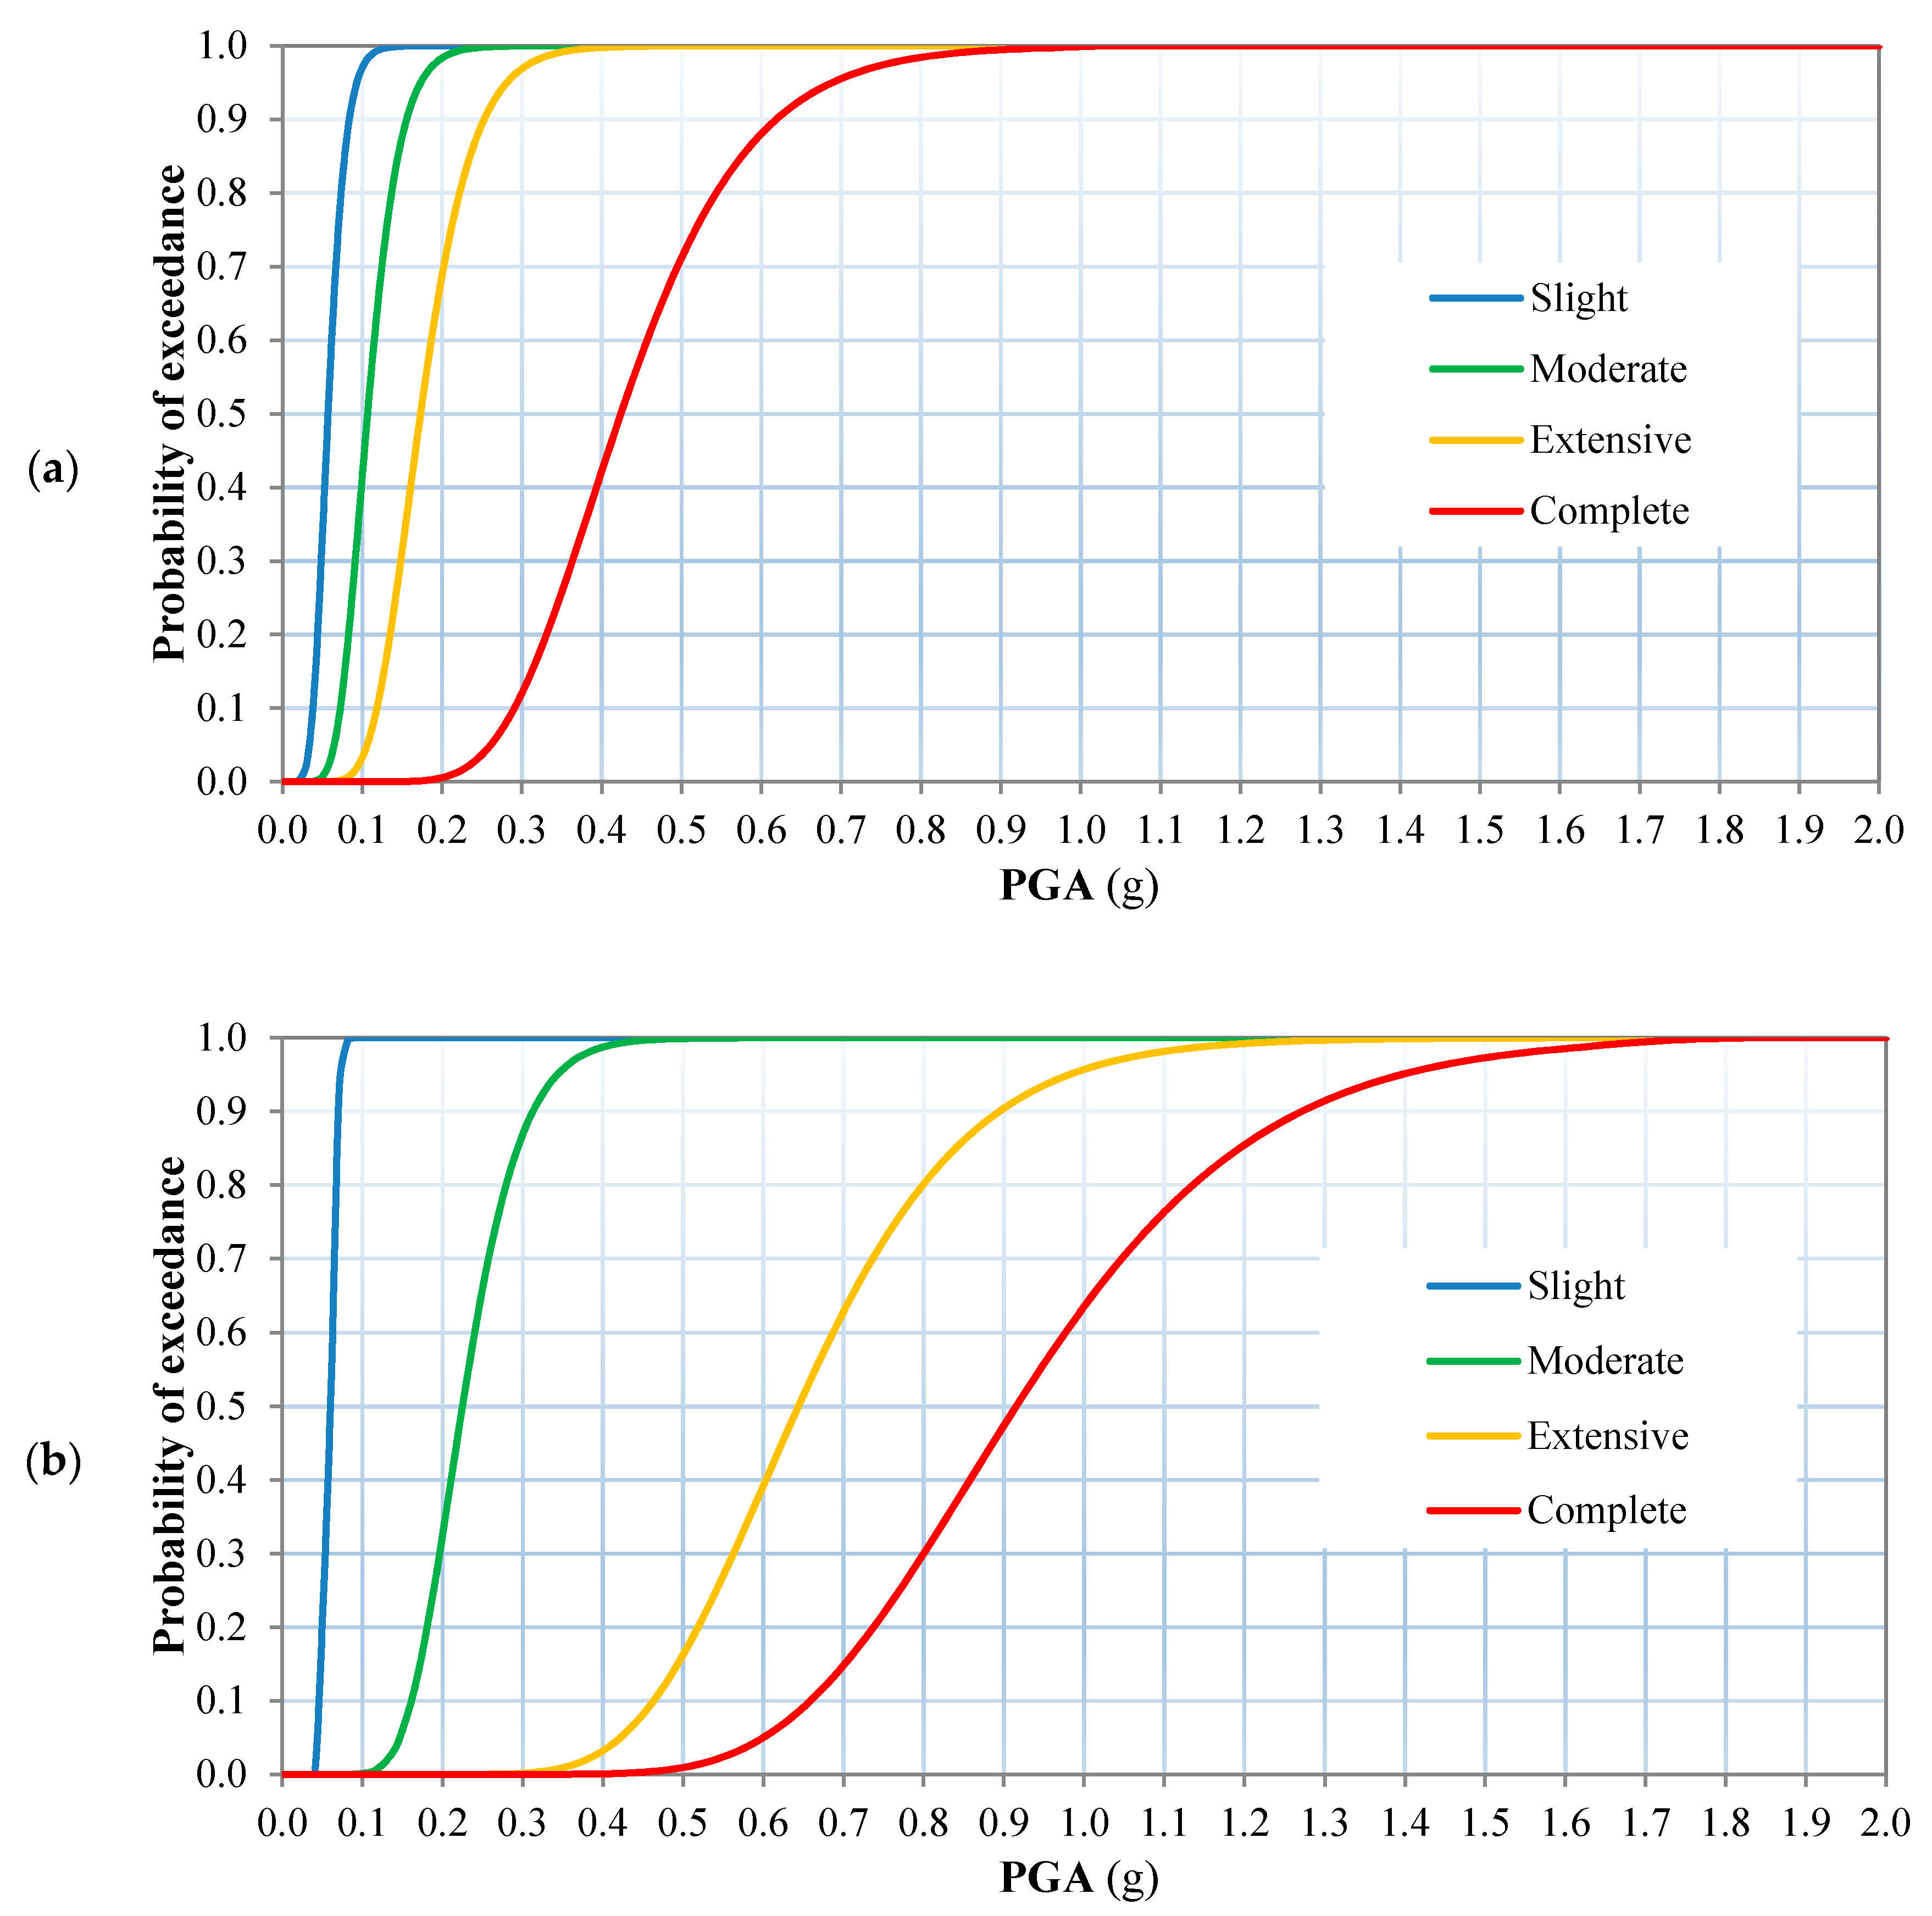
Four damage states dsi (slight, moderate, extensive, and complete) have been considered [27], which are coherent with first yielding, immediate occupancy, life safety, and collapse prevention described by existing codes [23,28]. The maximum interstory drift ratio (IDR) has been adopted as engineering demand parameter (EDP). Consequently, each damage state has been evaluated according to the displacement capacity of structural and non-structural elements (Table 2), interpreting the damage states description provided by existing regulations. In Figure 8, 3D models and collapse mechanisms in the longitudinal direction are reported. The obtained capacity curves are reported in Figure 9.
Fragility curves of the investigated buildings in current state and with the four considered retrofitting techniques are defined using Peak Ground Acceleration (PGA) as the ground motion intensity measure (IM). Although other IMs have shown to produce more meaningful results (e.g.,Housner Intensity, Arias Intensity, Acceleration Spectrum Intensity, and Average spectral acceleration), PGA has been considered to comply with existing hazard data and vulnerability models developed over the years by different research groups for Lima Metropolitan area (e.g., [1,2,3,5,21]).Fragility curves of the investigated buildings in current state and with the four considered retrofitting techniques are generatedfollowing the procedure proposed by several authors [29]. Using the results of static nonlinear analyses, the capacity curves are transformed into capacity curves of a single degree of freedom (SDoF) system in ADRS space, based on the relative floor displacements and floor masses. Such curves are idealized as bilinear elastic perfectly plastic curves, intersecting the initial stiffness line with the maximum spectral acceleration. The idealized curves are used to represent the inelastic SDoF. To represent the effects of record-to-record variability, for selected ground motions, the elastic and inelastic response are considered to define the performance point (PP) and resulting EDP associated with each damage state. Finally, fragility curves are generatedaccording to the IMs and EDPs obtained for each damage state using an appropriate statistical curve fitting approach.
The seismic demand has been defined by 10Peruvian and Chilean seismic records (Table 3) scaled in 20 steps (minimum factor = 0.1, maximum factor = 2, and step increments = 0.1). Consequently, a total of 200 ground motion records have been analyzed to generate each set of fragility curves. The derived fragility curves are shown in Figure 10.
Based on the large territorial scale and the available information, the uncertainties have been considered based on the analysis and characterization of the population of school buildings (PRE and GUE building types). The investigated types have been studied in previous project and can be considered representative (modular structural scheme with approximately the same dimensions, materials, structural, no structural, and details).
The uncertainty due to the possible geometric variations can be considered negligible while for the material variations properties the mean values are considered (derived from the experimental campaign). However, it is to be noted that based on the large territorial scale and the main goal of the study (a first comparison of different intervention options), the choice about the investigated retrofitted strategies can be considered little conditioned by the original material property. In the next step of the project, at different territorial scales (until a single building) the uncertainties associated with the structures will be investigated.
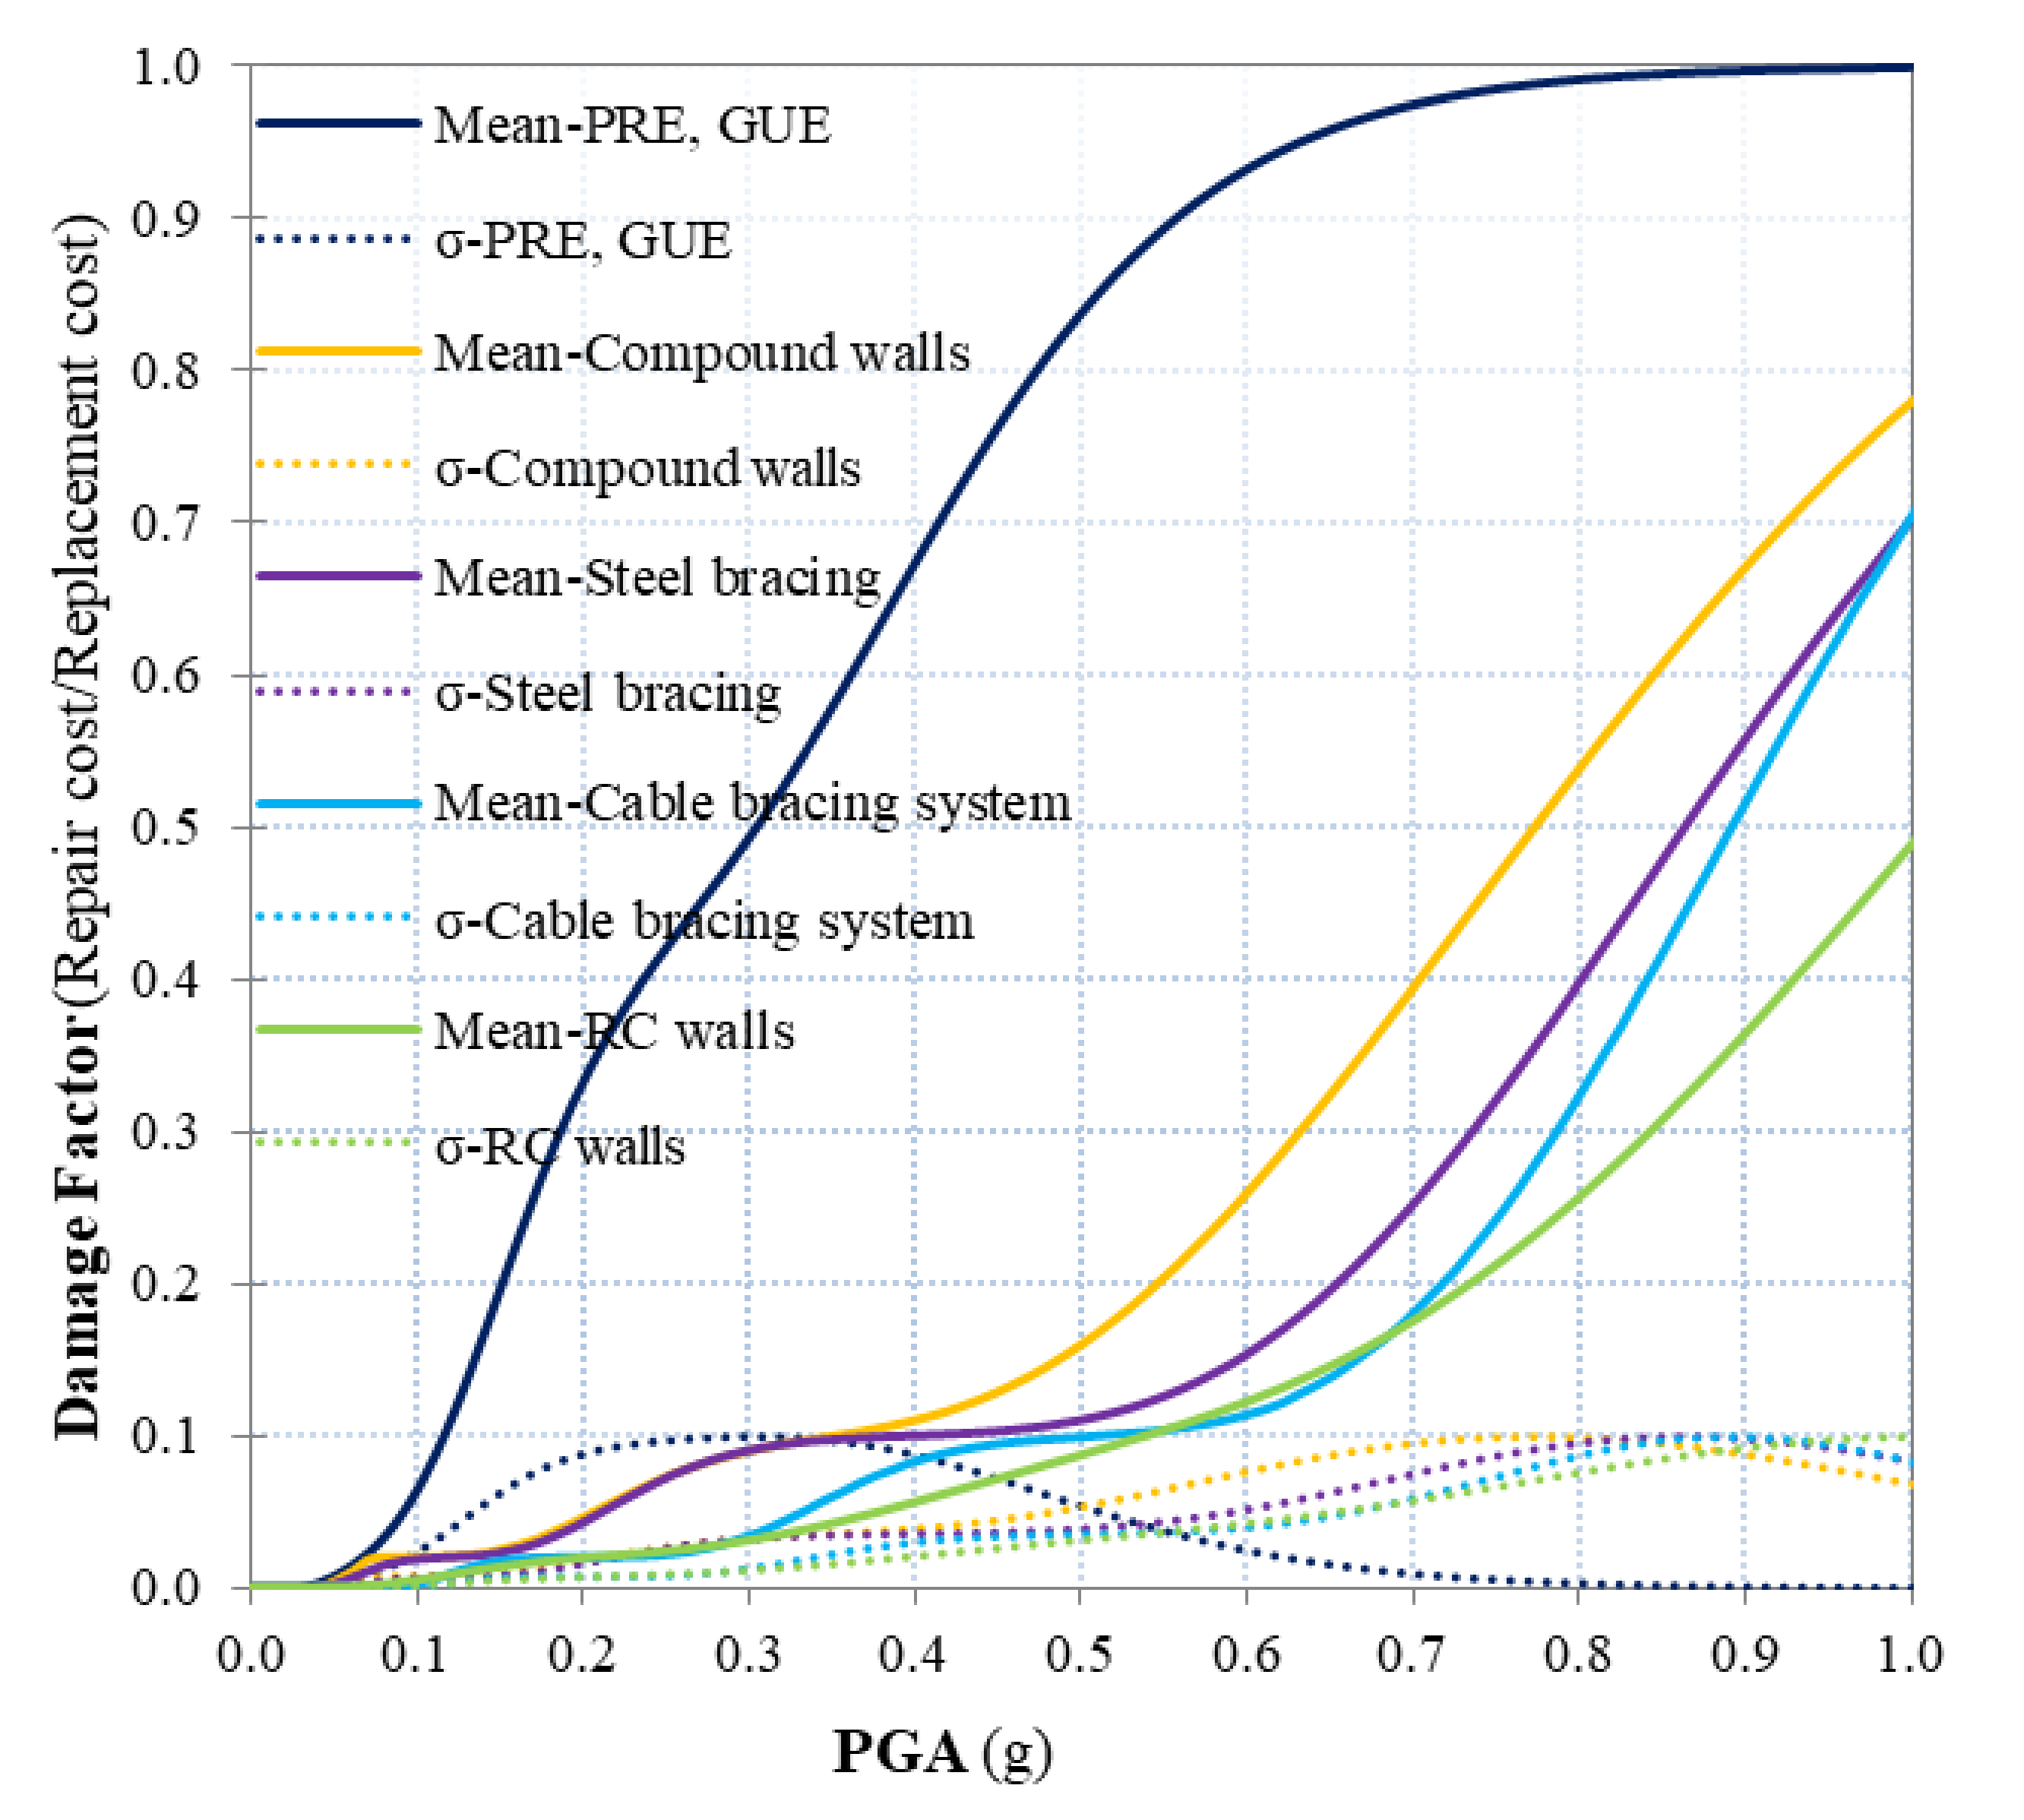
To obtain vulnerability curves the probabilities corresponding to all damage states are combined using the following equation [30]:
where n is the number of damage states considered; is the probability of a building to sustain the damage state dsi for a specific level of IM (in this case PGA); is the mean damage factor value consequent to the attainment of a given damage state dsi (Table 4). Conceptually, these damage factor values should be developed based on data collected from studies on specific buildings in Lima. Other values could be applied with great care to avoid gross errors due to the different buildings design practices in other parts of the world, which could be significantly different from those of Lima. Nevertheless, for a first application of the proposed methodology the above assumption was made.
Figure 11 shows the vulnerability functions of the retrofitted and un-retrofitted school buildings. It is to be noted that for the considered IM values, the examined retrofitting methods lead to different levels of vulnerability and consequent different seismic losses. The considered retrofitting methods have very different costs; consequently, the proposed approach can identify the optimal strategies based on costs, total investment amount, and the performance levels that are acceptable for the policy makers.
3.4. Seismic Risk Assessments
The Probabilistic Seismic Hazard Assessment (PSHA) has been carried out using the CRISIS2007 software [31] considering the effects of all the 33 seismic sources developed by the Geophysical Institute of Peru (IGP) and its associated ground motion prediction equations [32], and following the four steps of PSHA summarizedby Kramer [33]. More than 35,000 earthquakes with magnitudes (Mw) between 5.0 and 8.5 have been generated through the defined PSHA. In addition, a local site amplifications grid that consider the soil characteristics information of Lima city has been defined. To include this information inside each soil zone, SiteEffects software has been used [34].
Seismic risk assessment of the retrofitted and un-retrofitted school buildings is performed using CAPRA-GIS software [35,36]. CAPRA-GIS is a geographic information system that allows the integration of the seismic hazard, exposure, and vulnerability components to calculate the risk in terms of probable economic losses. Exposure model has been employed to contain information about the 4458 investigated school buildings. Based on CAPRA-GIS, the Scenario Expected Loss (SEL), the Expected Annual Loss (EAL), and the Probable Maximum Loss (PML) have been calculated.
Among the more than 35,000 earthquake scenarios that have been generated, the seismic source that leads to the maximum economic loss expected for the entire portfolio has been identified and analyzed. For this seismic source, the SEL for an occasional (Mw=8.2) and frequent (Mw=6.5) earthquake has been estimated. Such seismic events generate an acceleration of 0.25g and 0.10g on the coast of Peru with a return period (TR) of 75 and 10 years, respectively. Consequently, deterministic and probabilistic earthquake scenarios have been analyzed and the relevant seismic loss has been assessed for the 4458 school buildings. Table 5 shows the expected economic losses (in US dollar) of all retrofitted and un-retrofitted school buildings.
4. Selection of the Optimal Rehabilitation System
To apply the proposed methodology, for each qualitative criterion a preference matrix (4 × 4) has been built through simple binary comparisons (Table 6). According to the relevance with the examined qualitative criterion, for each comparison, a corresponding judgment of relative importance between two intervention options has been assigned using the Saaty’s scale [12,13]. The numerical values inserted in the appropriate column of the decision matrix (the last six columns of Table 7) are the principal eigenvectors of the preference matrixes so that their sum is equal to 1, while using principal eigenvalues, for each preference matrix, a consistency check has been performed in order to exclude unacceptable conflicts due to the expressed judgments. The decision matrix D = [xij] is shown in Table 7.
Similar to the qualitative criteria, the criteria weights were also defined through the AHP method previously described. In this case, the criteria preference matrix (Table 8) has been built through simple pair wise comparisons between all the criteria using Saaty’s scale and by simulating a likely behavior of the decision maker (DM). Obviously, an ordinary consistency measurement of the criteria preference matrix has been performed to exclude unacceptable conflicts. Criteria weights play a fundamental role in decision-making processes, because based on their value, some estimates of options can have greater importance than others, generating important changes in the options ranking.
In the considered case study, the reduction in expected economic losses (criterion C1, C2, C3), the installation cost (C4), and the functional and architectural compatibility (C9) have been considered predominant in order to prefer retrofitting intervention having better performance in terms of seismic risk mitigation, costs, and compatibility. As shown in Table 8, the most relevant criteria for the decision about seismic retrofitting are the criteria C1, C2, C3, and C4 (a1k = a2k = a3k = a4k ≥ 1, k = 1,..., 11). They have been judged to be slightly more important than criterion C9 (a19 = a29 = a39 = a49 = 2), and moderately more important than criterion C8 (a18 = a28 = a38 = a48 = 3).Criterion C5, regarding the safety in construction site operations, has been assumed less important than the others (a5k ≤ 1, k = 1,..., 11) for the reasons above, even if the retrofitting intervention involves a higher level of risk in construction site. This criterion has been considered slightly less important than criterion C7 (a57 = 1/2), and moderately less important than criterion C11 (a28 = 1/3).The criteria concerning the visual inspection (C8), disruption of use (C6), and technology level and feasibility (C10) have been also considered important in the decision-making process, because their lack of consideration would involve additional time, cost, and disruption to be sustained. They have been judged to be between significantly important and significantlymore important (a85 = 6), significantlymore important (a65 = 5), and between significantlyand moderately more important than criterion C2 (a105 = 4), respectively. In Table 9, the criteria weight vector W is presented.
After the definition of the decision matrix D = [xij] and the criteria weight vector W, the TOPSIS method has been applied and a ranking of the compared retrofitting interventions has been defined. More specifically, using Equation (1) the normalized decision matrix R = [rij] is built (Table 10) and then using Equation (2), the weighted normalized decision matrix V = [vij] is defined (Table 11). According this matrix, using Equations (3) and (4) the ideal solution A* and the negative-ideal solution A− are obtained (Table 12).
Finally, using Equations (5)–(7), , , and values are evaluated (Table 13) and a ranking of the compared intervention options is defined. As shown in Table 13, based on the maximization of Ci* values, the following classification is obtained: A4> A1> A2> A3; therefore, the fourth retrofitting technique (Ci*=0.723) is the optimal solution. A sensitivity analysis has been carried out to evaluate the stability of the optimal solution. This analysis consists of varying the weight of each criterion for evaluating whether there is a change in the top of the options ranking. It allows to assess how sensitive is the options ranking to small changes in criteria weights. According to the sensitivity analysis of the results, the optimal solution is also sufficiently stable.
5. Conclusions
In this study, the effects of different retrofitting strategies of essential facilities are studied and compared, and a new framework is suggested to select optimal intervention options on a large territorial scale (national, regional, and urban). It is based on the use of seismic risk analysis and the application of MCDM methods. The selection of the optimal intervention is defined through a multidisciplinary and transparent decision-making process aimed at providing efficient solutions among the compared interventions.
In the proposed framework, 4458 school buildings in the Lima Metropolitan area are considered and four different retrofitting techniques are compared according to 11criteria to select the optimal solution based on its technical, economic, and social benefit. In the proposed approach, decisions are made by comparing the expected reduction of seismic losses due to each intervention with the relevant cost and other important aspects related to its implementation at large geographical areas. These aspects consider the social needs of the buildings’ users and the public safety during the works, as well as the intervention reproducibility to reduce construction times and costs. In addition, aspects related to the visual inspection of the intervention are also considered to limit irregularities in the execution of the work and in the quantity and quality of the materials used.
In the decision-making process, the seismic risk mitigation, cost, and compatibility of the intervention have played a key role in selecting the optimal rehabilitation system. More specifically, the economic convenience of different retrofitting techniques has been compared based on fragility and vulnerability curves defined according to the displacement capacity of structural and non-structural elements and their repair cost due to a seismic event. Detailed studies at this territorial scale and with this detail are rather unusual. The results of this work could be used as a decision support tool in the seismic risk mitigation on a large territorial scale as Lima Metropolitan area.
Author Contributions
Conceptualization, A.A. and M.V.; methodology, A.A. and M.V.; validation, A.A. and M.V.;data curation, A.A., and M.V.; writing—original draft preparation, A.A. and M.V.; writing—review and editing, A.A., M.V., and S.-C.S.H.; visualization, A.A. and M.V.; supervision, M.V. and S.-C.S.H. All authors have read and agreed to the published version of the manuscript.
Funding
This research received no external funding.
Acknowledgments
This research was partially funded by European Commission grant number 552129-EM-1-2014-1-IT-ERA MUNDUS-EMA21 funded with support of the European Commission. This document reflects the view of only the authors, and the Commission cannot be held responsible for any use of the information contained therein.
Conflicts of Interest
The authors declare no conflict of interest.
References
- Anelli, A.; Santa-Cruz, S.; Vona, M.; Tarque, N.; Laterza, M. A proactive and resilient seismic risk mitigation strategy for existing school buildings. Struct. Infrastruct. Eng. 2018, 15, 137–151. [Google Scholar] [CrossRef]
- Liguori, N.; Tarque, N.; Bambarén, C.; Spacone, E.; Viveen, W.; De Filippo, G. Hospital treatment capacity in case of seismic scenario in the Lima Metropolitan area, Peru. Int. J. Disaster Risk Reduct. 2019, 38, 101196. [Google Scholar] [CrossRef]
- Santa-Cruz, S.; Palomino, J.; Liguori, N.; Vona, M.; Tamayo, R. Seismic Risk Assessment of Hospitals in Lima City Using GIS Tools. In Computational Science and Its Applications—ICCSA 2017; Lecture Notes in Computer Science; Gervasi, O., Murgante, B., Misra, S., Stankova, E., Torre, C.M., Rocha, A.M.A.C., Taniar, D., Apduhan, B.O., Tarantino, E., Ryu, Y., et al., Eds.; Springer: Cham, Switzerland, 2017; Volume 10406, pp. 354–367. [Google Scholar]
- Vona, M.; Anelli, A.; Mastroberti, M.; Murgante, B.; Santa-Cruz, S. Prioritization strategies to reduce the seismic risk of the public and strategic buildings. Disaster Adv. 2017, 10, 1–15. [Google Scholar]
- Santa-Cruz, S.; Fernandez De Córdova, G.; Rivera Holguin, M.; Vilela, M.; Arana, V.; Palomino, J. Social sustainability dimensions in the seismic risk reduction of public schools: A case study of Lima, Peru. Sustain. Sci. Pr. Policy 2016, 12, 34–46. [Google Scholar] [CrossRef]
- Ambraseys, N.; Bilham, R. Corruption kills. Nature 2011, 469, 153–155. [Google Scholar] [CrossRef] [PubMed]
- Bilham, R. The seismic future of cities. Bull. Earthq. Eng. 2009, 7, 839–887. [Google Scholar] [CrossRef] [Green Version]
- Kabir, G.; Sadiq, R.; Tesfamariam, S. A review of multi-criteria decision-making methods for infrastructure management. Struct. Infrastruct. Eng. 2014, 10, 1176–1210. [Google Scholar] [CrossRef]
- Formisano, A.; Castaldo, C.; Chiumiento, G. Optimal seismic upgrading of a reinforced concrete school building with metal-based devices using an efficient multi-criteria decision-making method. Struct. Infrastruct. Eng. 2017, 13, 1373–1389. [Google Scholar] [CrossRef]
- Caterino, N.; Cosenza, E. A multi-criteria approach for selecting the seismic retrofit intervention for an existing structure accounting for expected losses and tax incentives in Italy. Eng. Struct. 2018, 174, 840–850. [Google Scholar] [CrossRef]
- Santa-Cruz, S.; Brioso, X.; Córdova-Arias, C. Selection of seismic reinforcement techniques through a multi-criteria methodology and BIM tools to improve transparency. In Proceedings of the 11th National Conference on Earthquake Engineering 2018 (11NCEE): Integrating Science, Engineering, & Policy, Los Angeles, CA, USA, 25–29 June 2018. [Google Scholar]
- Saaty, T.L. The Analytic Hierarchy Process; McGraw-Hill: New York, NY, USA, 1980. [Google Scholar]
- Saaty, T.L. Decision Making for Leaders: The Analytic Hierarchy Process for Decision in a Complex World; RWS Publications: Pittsburgh, PA, USA, 1999. [Google Scholar]
- Hwang, C.L.; Yoon, K. Multiple Attribute Decision Making. Lecture Notes in Economics and Mathematical Systems; Springer: Berlin, Germany, 1981. [Google Scholar]
- UNI 10942. Building Site–Safety Plans–Guideline for Safety and Coordination Plans; Ente Nazionale Italiano di Unificazione: Milan, Italy, 2001. [Google Scholar]
- Anelli, A.; Santa-Cruz, S.; Vona, M.; Laterza, M. Spatial analysis and ranking for retrofitting of the school network in Lima, Peru. In Computational Science and Its Applications—ICCSA 201; Lecture Notes in Computer Science; Gervasi, O., Murgante, B., Misra, S., Stankova, E., Torre, C.M., Rocha, A.M.A.C., Taniar, D., Apduhan, B.O., Tarantino, E., Ryu, Y., et al., Eds.; Springer International Publishing: Cham, Switzerland, 2017; Volume 10405, pp. 310–325. [Google Scholar]
- Blondet, M.; Dueñas, M.; Loaiza, C.; Flores, R. Seismic Vulnerability of Informal Construction Dwellings in Lima, Peru: Preliminary Diagnosis. In Proceedings of the 13th World Conference on Earthquake Engineering, Vancouver, BC, Canada, 1–6 August 2004. [Google Scholar]
- Puglia, R.; Vona, M.; Klin, P.; Ladina, C.; Masi, A.; Priolo, E.; Silvestri, F. Analysis of site response and building damage distribution due to the 31 October 2002 earthquake at San Giuliano di Puglia (Italy). Earthq. Spectra. 2013, 29, 497–526. [Google Scholar] [CrossRef]
- World Bank. Proposed Update of the National Building Regulations to Incorporate the Incremental Reinforcement in Type 780 School Buildings Built Before 1997; World Bank: Lima, Peru, 2016. [Google Scholar]
- Standard E030. Norma Técnica Peruana E.030 Diseño Sismorresistente; Ministerio de Vivienda, Construcción y Saneamiento: Lima, Peru, 2016. (In Spanish) [Google Scholar]
- Loa, G.; Muñoz, A.; Santa-Cruz, S. Seismic evaluation of incremental seismic retrofitting techniques for typical Peruvian schools. In Proceedings of the ASCE Structures Congress 2017, Denver, CO, USA, 6–8 April 2017. [Google Scholar]
- Standard E070. Norma Técnica Peruana E.070 Albañilería; Ministerio de Vivienda, Construcción y Saneamiento: Lima, Peru, 2006. (In Spanish) [Google Scholar]
- CEN. Eurocode 8: Design of Structures for Earthquake Resistance—Part 3: Assessment and Retrofitting of Buildings; European Standard EN 1998-3-2005; European Committee for Standardization: Brussels, Belgium, 2005. [Google Scholar]
- Borzi, B.; Vona, M.; Masi, A.; Pinho, R.; Pola, D. Seismic demand estimation of RC frame buildings based on simplified and nonlinear dynamic analyses. Earthq. Struct. 2013, 4, 157–179. [Google Scholar] [CrossRef]
- CSI. Computer program SAP2000 (Version 17); CSI Inc.: Walnut Creek, CA, USA, 2014. [Google Scholar]
- FEMA P-58-1. Seismic Performance Assessment of Buildings: Volume 1–Methodology; Applied Technology Council: Redwood City, CA, USA, 2012. [Google Scholar]
- Vona, M.; Manganelli, B.; Tataranna, S.; Anelli, A. An Optimized Procedure to Estimate the Economic Seismic Losses of Existing Reinforced Concrete Buildings due to Seismic Damage. Buildings 2018, 8, 144. [Google Scholar] [CrossRef] [Green Version]
- ASCE/SEI 41-06. Seismic Rehabilitation of Existing Buildings; American Society of Civil Engineers: Reston, VA, USA, 2007. [Google Scholar]
- Rossetto, T.; Gehl, P.; Minas, S.; Galasso, C.; Duffour, P.; Douglas, J.; Cook, O. FRACAS: A capacity spectrum approach for seismic fragility assessment including record-to-record variability. Eng. Struct. 2016, 125, 337–348. [Google Scholar] [CrossRef]
- Anelli, A.; Mori, F.; Vona, M. Fragility curves of the urban road network based on the debris distributions of interfering buildings. Appl. Sci. 2020, 10, 1289. [Google Scholar] [CrossRef] [Green Version]
- Ordaz, M.; Aguilar, A.; Arboleda, J. CRISIS2007 Ver 7.4. Mexico. 2007. Available online: https://ecapra.org/es/topics/crisis-2007. (accessed on 8 July 2020).
- IGP. Peru and the Mapping of Seismic Hazard; Geophysical Institute of Peru: Lima, Peru, 2012. [Google Scholar]
- Kramer, S.L. Geotechnical earthquake engineering; Prentice Hall International Series in Civil Engineering and Engineering Mechanics: Upper Saddle River, NJ, USA, 1996. [Google Scholar]
- ERN-AL. Site Effects 1.0.0. Evaluación de Riesgos Naturales—America Latina. Ciudad de México, Mexico. 2010. Available online: www.ecapra.org (accessed on 8 July 2020).
- ERN-AL. Comprehensive Approach for Probabilistic Risk Assessment (CAPRA). In Proceedings of the 14th European Conference on Earthquake Engineering, Ohrid, North Macedonia, 30 August–3 September 2010. [Google Scholar]
- Cardona, O.D.; Ordaz, M.; Reinoso, E.; Yamín, L.; Barbat, A. CAPRA—Comprehensive Approach to Probabilistic Risk Assessment: International Initiative for Risk Management Effectiveness. In Proceedings of the 15th World Conference on Earthquake Engineering 2012 (15WCEE), Lisbon, Portugal, 24–28 September 2012. [Google Scholar]
Figure 1.
Public schools in Lima Metropolitan Area overlap to soil type.

Figure 2.
Characterization of existing buildings: PREbuilding type.

Figure 3.
PREbuilding type: (a) Architectural layout; (b) Elevation view; (c) Structural scheme.


Figure 4.
PREbuilding type: schematic view for the retrofitting intervention A1.

Figure 5.
PREbuilding type: schematic view for the retrofitting intervention A2.

Figure 6.
PREbuilding type: schematic view for the retrofitting intervention A3.

Figure 7.
PREbuilding type: schematic view for the retrofitting intervention A4.

Figure 8.
3D Finite Element model and collapse mechanisms in the longitudinal direction (weak direction) for the original building type (a,b) and for the retrofitting intervention A1 (c,d), A2 (e,f), A3 (g,h), and A4 (i,j).
Figure 8.
3D Finite Element model and collapse mechanisms in the longitudinal direction (weak direction) for the original building type (a,b) and for the retrofitting intervention A1 (c,d), A2 (e,f), A3 (g,h), and A4 (i,j).


Figure 9.
Capacity curves of the examined structures in the longitudinal direction (weak direction) considering the forces distributions proportional to the first vibration mode (a) and related to the structural masses (b).
Figure 9.
Capacity curves of the examined structures in the longitudinal direction (weak direction) considering the forces distributions proportional to the first vibration mode (a) and related to the structural masses (b).

Figure 10.
Fragility curves of the examined structures as built (a), and reinforced by retrofitting intervention A1 (b), A2 (c), A3 (d), and A4 (e).
Figure 10.
Fragility curves of the examined structures as built (a), and reinforced by retrofitting intervention A1 (b), A2 (c), A3 (d), and A4 (e).


Figure 11.
Vulnerability functions of the retrofitted and un-retrofitted school buildings.


Table 1.
Judgement Criteria to Select the Optimal Retrofitting Intervention.
| Judgement Criteria | Type | Associated With | |
|---|---|---|---|
| C1 | Reduction in expected loss for an occasional earthquake | Quantitative | Cost criterion |
| C2 | Reduction in expected loss for a frequent earthquake | Quantitative | Cost criterion |
| C3 | Reduction in expected annual loss | Quantitative | Cost criterion |
| C4 | Installation cost | Quantitative | Cost criterion |
| C5 | Safety in construction site operations | Quantitative | Cost criterion |
| C6 | Disruption of use | Qualitative | Cost criterion |
| C7 | Maintenance | Qualitative | Cost criterion |
| C8 | Visual inspection | Qualitative | Benefit criterion |
| C9 | Functional and architectural compatibility | Qualitative | Benefit criterion |
| C10 | Technology level and feasibility | Qualitative | Benefit criterion |
| C11 | Massive reproducibility | Qualitative | Benefit criterion |
Table 2.
Damage States Definition for RC Frames According to the Displacement Capacity of Structural and Non-Structural Elements.
Table 2.
Damage States Definition for RC Frames According to the Displacement Capacity of Structural and Non-Structural Elements.
| No Damage | Slight Damage | Moderate Damage | Extensive Damage | Complete Damage |
|---|---|---|---|---|
| SD = None | SD = None | SD = Low | SD = Significant | SD = Near Collapse |
| NSD = None | NSD = Weak | NSD = Significant | NSD = Near Collapse | NSD = Collapse |
| θ<θy | θ ≤ θy | θy<θ ≤ θy+0.25θp | θy+0.25θp <θ ≤ θy+0.75θp | θy+0.75θp<θ ≤ θy+θp |
| v <vy | v <vy | v <vy | v ≤ vy | v ≥ vy |
| and | and | and | and | and |
| u<uy | u≤ uy | uy< u≤ uy+up | u>uy+up | u>uy+up |
SD = structural damage; NSD = non-structural damage; θ = chord rotation; θy = yielding chord rotation capacity; θp = plastic chord rotation capacity; v = shear displacement; vy = yielding shear displacement capacity; u = axial displacement; uy = yielding axial displacement capacity; up = plastic axial displacement capacity.
Table 3.
Characteristics of the Considered Seismic Records.
| Seismic Record | Local Date | Magnitude | Depth | Epicenter | PGA | Duration |
|---|---|---|---|---|---|---|
| (Mw) | (Km) | (g) | (Sec) | |||
| Angol | 27 February 2010 | 8.8 | 30 | 36.29°S 73.24°W | 0.89 | 180 |
| Arequipa | 23 June2001 | 8.4 | 32 | 16.36°S 73.48°W | 0.68 | 75 |
| Concepcion | 27 February 2010 | 8.8 | 30 | 36.29°S 73.24°W | 0.51 | 180 |
| Huaraz | 31 May 1970 | 7.9 | 45 | 9.40°S 78.90°W | 0.11 | 45 |
| Lima | 17 October1966 | 8.1 | 38 | 10.70°S 78.70°W | 0.74 | 45 |
| Lima | 3 October 1974 | 8.1 | 36 | 12.25°S 77.52°W | 0.80 | 90 |
| Maule | 27February2010 | 8.8 | 30 | 36.29°S 73.24°W | 0.80 | 120 |
| Pisco | 15 August2007 | 8.0 | 39 | 13.35°S 76.51°W | 0.57 | 120 |
| Tarapaca | 13 June2005 | 7.8 | 116 | 19.99°S 69.20°W | 0.73 | 252 |
| Tocopilla | 14 November2007 | 7.7 | 40 | 22.32°S 69.97°W | 0.74 | 60 |
Table 4.
Damage Factor Values for Schools and Libraries (HAZUS-MH MR3).
| DAMAGE SCALE | ||||
|---|---|---|---|---|
| Slight | Moderate | Extensive | Complete | |
| DAMAGE FACTOR (DF)* | 2% | 10% | 43.5% | 100% |
| Structural DF | 0.4% | 1.9% | 9.5% | 18.9% |
| Acceleration Sensitive Non-Structural DF | 0.7% | 3.2% | 9.7% | 32.4% |
| Drift Sensitive Non-Structural DF | 0.9% | 4.9% | 24.3% | 48.7% |
| Total | 2% | 10% | 43.5% | 100% |
* Damage Factor (DF) Definition: Repair cost/Replacement Cost.
Table 5.
Expected Economic Losses.
| Expected Loss for an Occasional Earthquake | Expected Loss for a Frequent Earthquake | Expected Annual Loss | |
|---|---|---|---|
| ($) | ($) | ($) | |
| As Built | 142,871,808 | 41,033,804 | 12,849,902 |
| Retrofit A1—Compound Walls | 39,057,741 | 12,760,065 | 3,095,984 |
| Retrofit A2—Steel bracing | 34,237,128 | 9,956,375 | 2,552,567 |
| Retrofit A3—RC walls | 18,807,643 | 4,755,858 | 1,066,880 |
| Retrofit A4—Cable Bracing System | 23,309,648 | 4,249,501 | 1,056,047 |
Table 6.
Binary Comparisons to Build the Preference Matrix (4 × 4) for Each Qualitative Criterion.
| Criterion | Retrofit Technique | A1 | A2 | A3 | A4 |
|---|---|---|---|---|---|
| Disruption of Use | A1 | 1 | 1/2 | 1/3 | 3 |
| A2 | 2 | 1 | 1/2 | 4 | |
| A3 | 3 | 2 | 1 | 5 | |
| A4 | 1/3 | 1/4 | 1/5 | 1 | |
| Maintenance | A1 | 1 | 1/5 | 1 | 1/4 |
| A2 | 5 | 1 | 5 | 2 | |
| A3 | 1 | 1/5 | 1 | 1/4 | |
| A4 | 4 | 1/2 | 4 | 1 | |
| Visual Inspection | A1 | 1 | 1/7 | 3 | 1/7 |
| A2 | 7 | 1 | 9 | 1 | |
| A3 | 1/3 | 1/9 | 1 | 1/9 | |
| A4 | 7 | 1 | 9 | 1 | |
| Functional and Architectural Compatibility | A1 | 1 | 2 | 4 | 1/5 |
| A2 | 1/2 | 1 | 3 | 1/6 | |
| A3 | 1/4 | 1/3 | 1 | 1/7 | |
| A4 | 5 | 6 | 7 | 1 | |
| Technology Level and Feasibility | A1 | 1 | 5 | 3 | 7 |
| A2 | 1/5 | 1 | 1/4 | 3 | |
| A3 | 1/3 | 4 | 1 | 5 | |
| A4 | 1/7 | 1/3 | 1/5 | 1 | |
| Massive Reproducibility | A1 | 1 | 1/5 | 1 | 1/7 |
| A2 | 5 | 1 | 5 | 1/3 | |
| A3 | 1 | 1/5 | 1 | 1/7 | |
| A4 | 7 | 3 | 7 | 1 |
Table 7.
Decision Matrix.
| C1 | C2 | C3 | C4 | C5 | C6 | C7 | C8 | C9 | C10 | C11 | |
|---|---|---|---|---|---|---|---|---|---|---|---|
| A1 | 103,814,067 | 28,273,739 | 9,753,918 | 48,807 | 226 | 0.170 | 0.089 | 0.080 | 0.186 | 0.557 | 0.067 |
| A2 | 108,634,680 | 31,077,429 | 10,297,335 | 66,322 | 325 | 0.284 | 0.504 | 0.440 | 0.117 | 0.109 | 0.283 |
| A3 | 124,064,165 | 36,277,946 | 11,783,022 | 67,580 | 159 | 0.473 | 0.089 | 0.040 | 0.056 | 0.281 | 0.067 |
| A4 | 119,562,160 | 36,784,303 | 11,793,855 | 58,407 | 223 | 0.073 | 0.318 | 0.440 | 0.641 | 0.054 | 0.582 |
Table 8.
Criteria Preference Matrix.
| C1 | C2 | C3 | C4 | C5 | C6 | C7 | C8 | C9 | C10 | C11 | |
|---|---|---|---|---|---|---|---|---|---|---|---|
| C1 | 1 | 1 | 1 | 1 | 8 | 4 | 7 | 3 | 2 | 5 | 6 |
| C2 | 1 | 1 | 1 | 1 | 8 | 4 | 7 | 3 | 2 | 5 | 6 |
| C3 | 1 | 1 | 1 | 1 | 8 | 4 | 7 | 3 | 2 | 5 | 6 |
| C4 | 1 | 1 | 1 | 1 | 8 | 4 | 7 | 3 | 2 | 5 | 6 |
| C5 | 1/8 | 1/8 | 1/8 | 1/8 | 1 | 1/5 | 1/2 | 1/6 | 1/7 | 1/4 | 1/3 |
| C6 | 1/4 | 1/4 | 1/4 | 1/4 | 5 | 1 | 4 | 1/2 | 1/3 | 2 | 3 |
| C7 | 1/7 | 1/7 | 1/7 | 1/7 | 2 | 1/4 | 1 | 1/5 | 1/6 | 1/3 | 1/2 |
| C8 | 1/3 | 1/3 | 1/3 | 1/3 | 6 | 2 | 5 | 1 | 1/2 | 3 | 4 |
| C9 | 1/2 | 1/2 | 1/2 | 1/2 | 7 | 3 | 6 | 2 | 1 | 4 | 5 |
| C10 | 1/5 | 1/5 | 1/5 | 1/5 | 4 | 1/2 | 3 | 1/3 | 1/4 | 1 | 2 |
| C11 | 1/6 | 1/6 | 1/6 | 1/6 | 3 | 1/3 | 2 | 1/4 | 1/5 | 1/2 | 1 |
Table 9.
Criteria Weight Vector.
| Criterion Weight | ||
|---|---|---|
| Reduction in Expected Loss for an Occasional Earthquake | wC1 | 0.167 |
| Reduction in Expected Loss for a Frequent Earthquake | wC2 | 0.167 |
| Reduction in Expected Annual Loss | wC3 | 0.167 |
| Installation Cost | wC4 | 0.167 |
| Safety in Construction Site Operations | wC5 | 0.014 |
| Disruption of Use | wC6 | 0.052 |
| Maintenance | wC7 | 0.019 |
| Visual Inspection | wC8 | 0.075 |
| Functional and Architectural Compatibility | wC9 | 0.109 |
| Technology Level and Feasibility | wC10 | 0.036 |
| Massive Reproducibility | wC11 | 0.026 |
Table 10.
Normalized Decision Matrix.
| C1 | C2 | C3 | C4 | C5 | C6 | C7 | C8 | C9 | C10 | C11 | |
|---|---|---|---|---|---|---|---|---|---|---|---|
| A1 | 0.454 | 0.425 | 0.446 | 0.402 | 0.469 | 0.292 | 0.146 | 0.127 | 0.273 | 0.876 | 0.103 |
| A2 | 0.475 | 0.467 | 0.470 | 0.546 | 0.675 | 0.489 | 0.827 | 0.700 | 0.172 | 0.171 | 0.432 |
| A3 | 0.543 | 0.545 | 0.538 | 0.556 | 0.330 | 0.813 | 0.146 | 0.064 | 0.083 | 0.442 | 0.103 |
| A4 | 0.523 | 0.552 | 0.539 | 0.481 | 0.463 | 0.125 | 0.522 | 0.700 | 0.943 | 0.085 | 0.890 |
Table 11.
Weighted Normalized Decision Matrix.
| C1 | C2 | C3 | C4 | C5 | C6 | C7 | C8 | C9 | C10 | C11 | |
|---|---|---|---|---|---|---|---|---|---|---|---|
| A1 | 0.076 | 0.071 | 0.075 | 0.067 | 0.007 | 0.015 | 0.003 | 0.009 | 0.030 | 0.032 | 0.003 |
| A2 | 0.079 | 0.078 | 0.079 | 0.091 | 0.010 | 0.025 | 0.016 | 0.052 | 0.019 | 0.006 | 0.011 |
| A3 | 0.091 | 0.091 | 0.090 | 0.093 | 0.005 | 0.042 | 0.003 | 0.005 | 0.009 | 0.016 | 0.003 |
| A4 | 0.087 | 0.092 | 0.090 | 0.080 | 0.007 | 0.006 | 0.010 | 0.052 | 0.103 | 0.003 | 0.023 |
Table 12.
Ideal Solution A* and Negative-Ideal Solution A−.
| C1 | C2 | C3 | C4 | C5 | C6 | C7 | C8 | C9 | C10 | C11 | |
|---|---|---|---|---|---|---|---|---|---|---|---|
| A* | 0.076 | 0.071 | 0.075 | 0.067 | 0.005 | 0.006 | 0.003 | 0.052 | 0.103 | 0.032 | 0.023 |
| A− | 0.091 | 0.092 | 0.090 | 0.093 | 0.010 | 0.042 | 0.016 | 0.005 | 0.009 | 0.003 | 0.003 |
Table 13.
Ranking of the Compared Intervention Options Based on MCDM Analysis.
| Retrofitting Technique | Si* | Si- | Ci* |
|---|---|---|---|
| A4 | 0.043 | 0.114 | 0.723 |
| A1 | 0.087 | 0.061 | 0.413 |
| A2 | 0.095 | 0.056 | 0.372 |
| A3 | 0.120 | 0.019 | 0.136 |
© 2020 by the authors. Licensee MDPI, Basel, Switzerland. This article is an open access article distributed under the terms and conditions of the Creative Commons Attribution (CC BY) license (http://creativecommons.org/licenses/by/4.0/).
Share and Cite
MDPI and ACS Style
Anelli, A.; Vona, M.; Santa-Cruz Hidalgo, S. Comparison of Different Intervention Options for Massive Seismic Upgrading of Essential Facilities. Buildings 2020, 10, 125. https://0-doi-org.brum.beds.ac.uk/10.3390/buildings10070125
AMA Style
Anelli A, Vona M, Santa-Cruz Hidalgo S. Comparison of Different Intervention Options for Massive Seismic Upgrading of Essential Facilities. Buildings. 2020; 10(7):125. https://0-doi-org.brum.beds.ac.uk/10.3390/buildings10070125
Chicago/Turabian StyleAnelli, Angelo, Marco Vona, and Sandra Santa-Cruz Hidalgo. 2020. "Comparison of Different Intervention Options for Massive Seismic Upgrading of Essential Facilities" Buildings 10, no. 7: 125. https://0-doi-org.brum.beds.ac.uk/10.3390/buildings10070125
Note that from the first issue of 2016, this journal uses article numbers instead of page numbers. See further details here.