Article

Thermo-Mechanical Properties of a Wood Fiber Insulation Board Using a Bio-Based Adhesive as a Binder

by
Franz Segovia
1,*,
Pierre Blanchet
1,
Nicolas Auclair
1 and
Gatien Geraud Essoua Essoua
2
1
Department of Wood and Forest Sciences, Laval University, Québec, QC G1V0A6, Canada
2
FPInnovations, Québec, QC G1V 4C7, Canada
*
Author to whom correspondence should be addressed.
Submission received: 14 July 2020 / Revised: 25 August 2020 / Accepted: 27 August 2020 / Published: 1 September 2020
(This article belongs to the Section Building Materials, and Repair & Renovation)

Abstract

:
The goal of the present study was to develop a low-density thermal insulation board using wood fibers and a bio-based adhesive as a binder, which was prepared from a crude glycerol and citric acid mixture. The physical and mechanical properties of insulation boards manufactured using two ratios of crude glycerol and citric acid (1:0.66 and 1:1 mol/mol) and two adhesive contents (14% and 20%) were evaluated. The results show that the insulation boards with a range of density between 332 to 338 kg m−3 present thermal conductivity values between 0.064 W/m-K and 0.066 W/m-K. The effect of adhesive content was very significant for certain mechanical properties (tensile strength perpendicular to surface and compressive strength). The tensile strength (internal bond) increased between 20% and 36% with the increased adhesive content. In contrast, the compressive strength decreased between 7% and 15%. The thermo-mechanical properties obtained of insulation boards such as thermal conductivity, traverse strength, tensile strength parallel and perpendicular to surface, and compressive strength are in accordance with the requirements of the American Society for Testing and Materials C208-12 standard for different uses. The results confirm the potential of crude glycerol and citric acid mixture to be used as an adhesive in the wood fiber insulation boards’ manufacturing for sustainability purposes.

1. Introduction

The building industry faces great challenges, such as the reduction of energy consumption from construction to the demolition of buildings [1]. Globally, buildings account for about 40% of the total primary energy requirement and contribute to more than 30% of the CO2 emissions [2]. Thus, construction companies are continually searching for ways to improve the insulation performance of the building envelope [3]. Insulation materials are defined as construction products and are meant to fulfil the building-physical features of thermal or sound insulation. Building insulation materials are commonly manufactured using materials obtained from petrochemicals or from a natural source processed with high-energy consumption [1]. Materials such as fiberglass, mineral wool, or polyurethane foams have good thermo-mechanical properties (e.g., low thermal conductivity, good moisture protection, and fire resistance), but can be hazardous to human health and to the environment [4]. These materials emit high levels of carbon during production and cannot be reused or recycled [3]. Different types of insulation materials are available, the ones made with polymeric foams and the ones made with fibers. Those made with fibers can be classified into two subgroups: Inorganic (e.g., glass fiber, amorphous fiber (rock wool), ceramic fiber) and organic (e.g., hemp fiber, cotton fiber, wood fiber) fibers [5]. Recently, the use of natural, sustainable, renewable, and environmentally friendly materials has gained interest because of increasing environmental awareness. The research in the field of insulation materials in the building industry has been focusing increasingly more on the use of natural, local materials that are nontoxic, are recyclable, and can assure good thermal insulation [1,6,7]. Insulation products incorporating natural fibers are available on the market. These products have promising properties in building applications [8]. Asdrubali et al. [1] report some building insulation products made of natural unconventional material, which show good thermo-acoustic properties such as reeds, bagasse, cattail, corn cob, cotton, durian, rice, etc.
The raw material for wood fiber insulation boards’ manufacturing is typically the chips and shavings recovered as waste from other wood manufacturing processes. The two processes currently used in the insulation boards manufacturing are a wet process and dry process. On the one hand, the wet process, which is widely used, involves the use of water for mixing the wood fiber pulp, paraffin, with latex as a binder. The mix forms a fiber mat, while the water is removed through pressing and vacuum pumping. The insulation boards are dried in a dryer and sawed. On the other hand, in dry process, the dry fiber is sprayed with paraffin and polyurethane resin as a binder. The fiber mats are placed in a press where the resin is cured through exposure to a mixture of air and water vapor. Finally, the insulation boards are sawed and milled.
In the last few years, researchers analyzed different insulation boards with bio-based adhesive as a binder or binderless [4,9,10,11,12]. These researchers investigated the physical and mechanical properties of some insulation boards with low thermal conduction. Crude glycerol is a major by-product of the biodiesel refining process derived from vegetable oils [13,14]. World production of biofuels and, hence, of crude glycerol has been rapidly increasing in recent decades, making imperative the development of sustainable processes for the use of this by-product [15,16]. Heating a blend of glycerol and citric acid can form a three-dimensional polymeric structure, where only water is produced and could be easily removed by evaporation during the reaction [17,18]. Previous studies have shown that esterification of the citric acid and glycerol mixture yield polymer networks of varying complexity, depending upon the reactant ratio and esterification parameters used [17,19]. The temperature and polymerization time are the most important parameters in the curing process [14]. In previous works, different temperatures and curing times, such as 100 °C, 140 °C, 160 °C, and 180 °C during 60 or 120 min, were used to polymerize crude glycerol with citric acid. The results showed the presence of ester bonds and cross-linking levels, according to the catalyst and citric acid content used and related to the curing time and temperature [14,18,20].
The aim of the present study was to develop a wood fiber insulation board from a dry process using a crude glycerol and citric acid mixture as bio-based adhesive. The study evaluated the effect of reactant ratio and adhesive content on thermo-mechanical properties of insulation board such as thermal conductivity, traverse strength, tensile strength parallel and perpendicular to surface, and compressive strength. Finally, the study carried out a characterization of the bio-based adhesive and wood fiber insulation boards.

2. Materials and Methods

2.1. Materials

2.1.1. Wood Fibers

The low-density thermal insulation boards were manufactured with 40% softwood fibers and 60% hardwood fibers obtained from Uniboard, Mont-Laurier, QC, Canada. The wood fibers were dried to a 2–3% moisture content.

2.1.2. Bio-Based Adhesive

Crude glycerol (CG) was obtained from Rothsay Biodiesel, Guelph, ON, Canada, and was filtered with filter papers (Whatman, grade 4, China) before use to remove ashes and solid residues. Anhydrous citric acid (CA) was purchased from Univar, Canada, p-toluenesulfonic acid (p-TSA) was purchased from Sigma-Aldrich, St. Louis, MO, USA, condensed tannins were supplied by Silvateam, Ontario, CA, USA, and pure glycerol was obtained from Fisher Scientific, Canada. All those four chemical compounds were used as received without any further modification. The cellulose filaments were generously provided by Kruger, Montreal, QC, Canada.
In order to determine the optimal ratio of crude glycerol and citric acid. Two ratios of reactants were used in the formulations (1:0.66 and 1:1 mol/mol). The ratios were based on the results obtained in [14,18]. Crude glycerol has become an environmental problem because of the large amount generated by the production of biodiesel. Finding a way to reuse crude glycerol would decrease the impact on the environment [15].
Initially, the crude glycerol, the condensed tannin, and cellulose filaments were mixed at room temperature (Table 1). Then, the mixture was heated at 120 °C before adding citric acid, and it was vigorously stirred during approximately 120 min until complete solubility of the citric acid. Finally, the mixture was cooled down to 100 °C and the catalyst (p-TSA) was added. Before using, the mixture was preheated at 60 °C and it was mixed with water.

2.1.3. Insulation Boards’ Manufacturing

Wood fiber insulation boards with a nominal density of 350 kg m−3, 8% moisture content, and thickness of 13 mm were produced. The wood fibers were placed in a rotating-drum tank with pneumatic atomizers for the uniform diffusion of the adhesive. The bio-based adhesive mixed with water was applied to wood fibers (Table 2). The wood fibers englued were passed through a screen refiner (Model PSKM6-350, Pallman, Zweibrücken, Germany) to avoid fiber packets or balls. The fiber mat was hand formed using a mold of 460 mm × 560 mm. The fiber mats were pre-pressed at room temperature in an in-house-built cold-plate press using a pressure of 80–90 MPa. Subsequently, the fiber mats were hot-pressed at 200 °C for 13 min, using a hot press (Dieffenbacher, Alpharetta, GA, USA). The wood fiber insulation boards were cut in panels of 400 mm × 500 mm. Finally, the insulation boards were conditioned at temperature of 20 °C and at relative humidity of 65% until their equilibrium moisture content was obtained. Table 2 shows the bio-based adhesive content and water content used for each insulation board type.

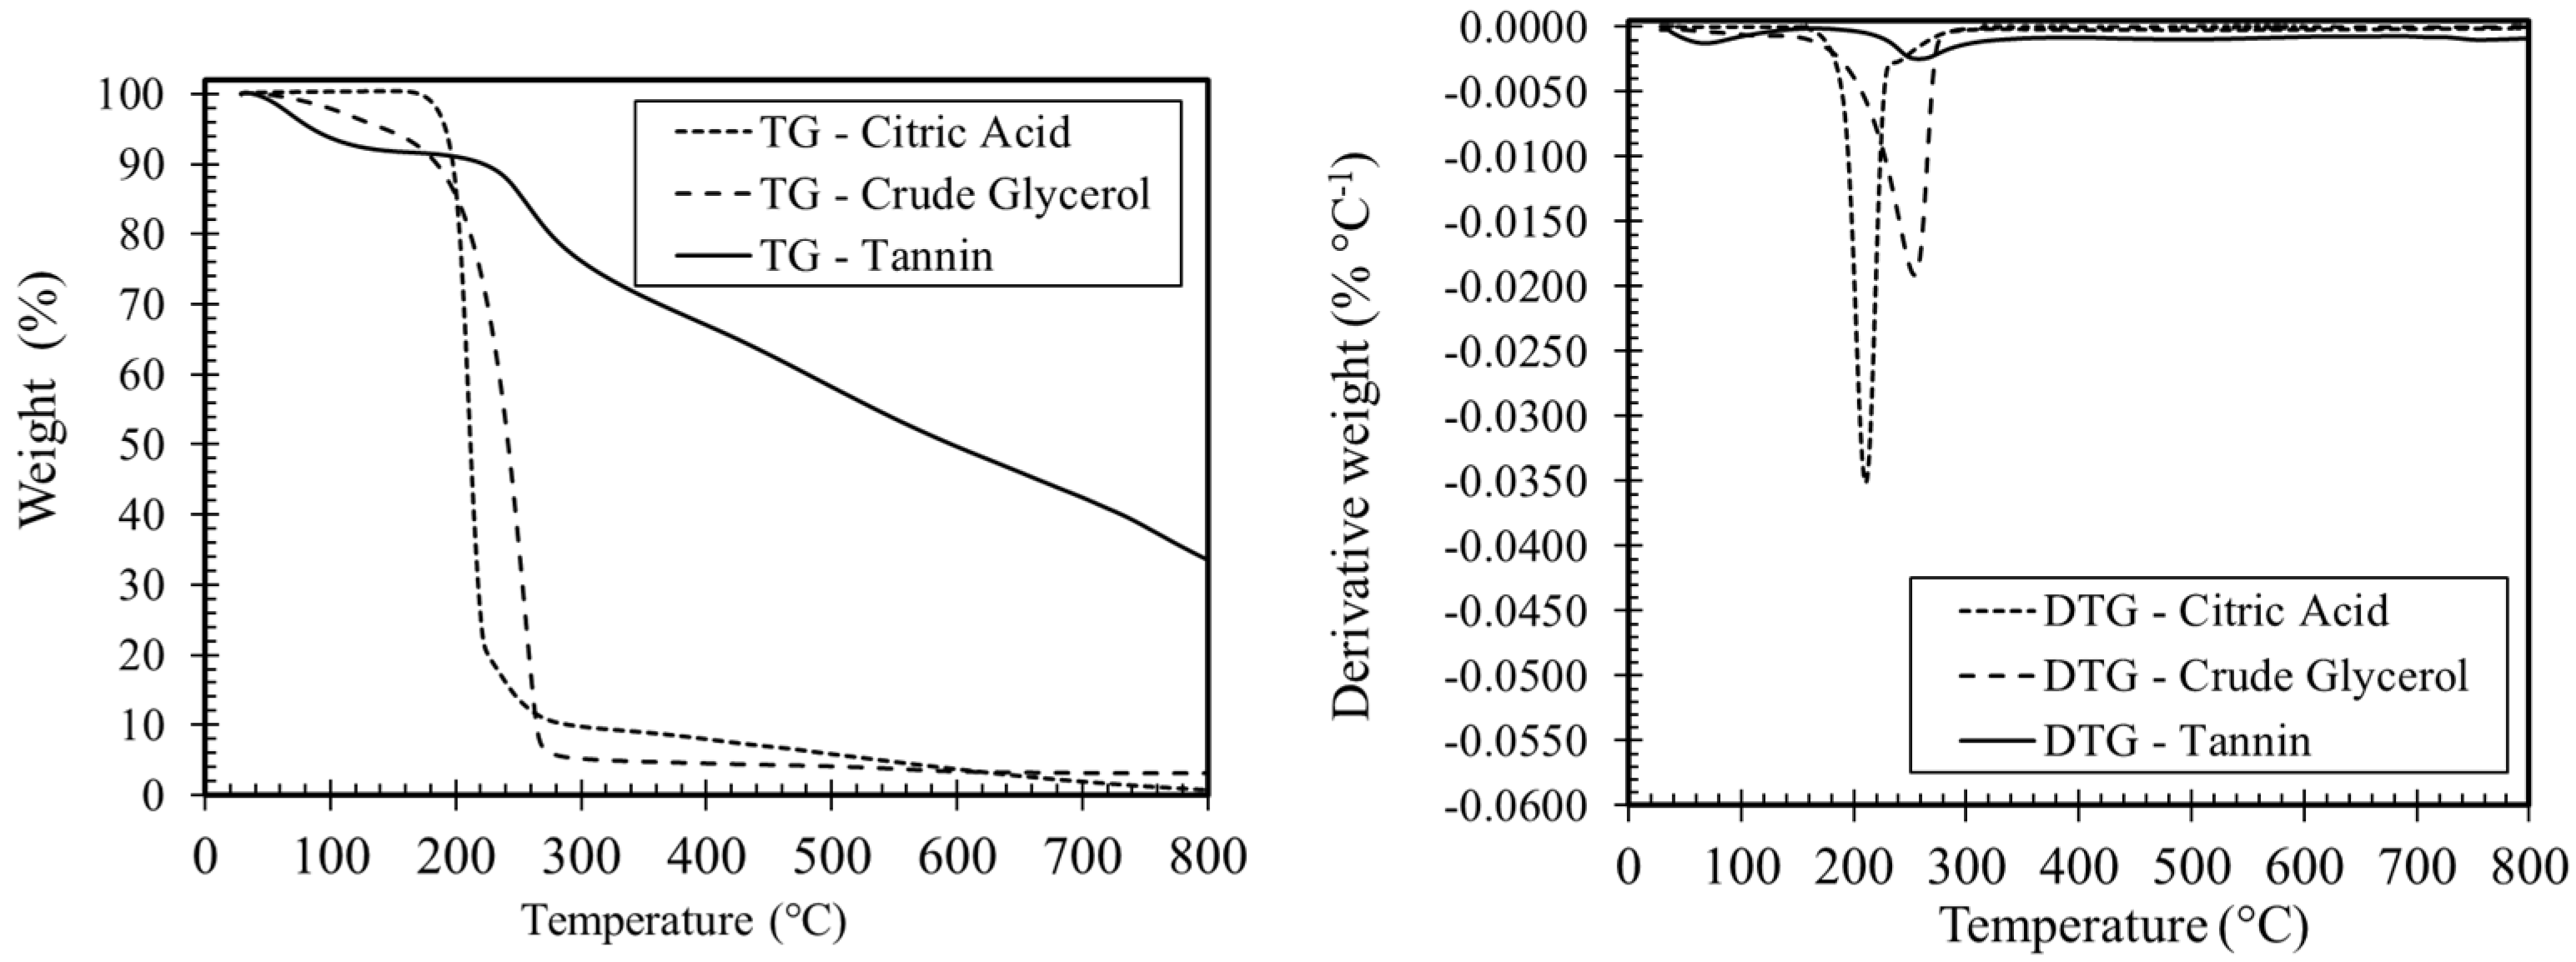
2.1.4. Characterization of Glycerol

To support the using of crude glycerol instead of pure glycerol, both compounds were characterized and compared. First, to determine the glycerol content in crude glycerol, quantitative analysis was performed with the Glycerol GK assay kit from Megazyme, Wicklow, Ireland. The pH was measured with an Accumet Basic AB15 pH meter from Fisher Scientific, Waltham, MA, USA. Then, to obtain the density, a 1-mL aliquot of each glycerol sample was pipetted and weighed. Finally, the viscosity was determined at 25 °C isotherm with a ViscoLab 4100 viscometer system from Cambridge Applied Systems (Cambridge, MA, USA) using the range piston of 50–1000 cP. The mean values were calculated from the characterization of 10 samples from different batches for the crude glycerol and three samples from the same batch for the pure glycerol. The mean value of each analysis is showed in Table 3.
From these results, crude glycerol contains around 88 % of pure glycerol with a mixture of water, ash, and other organic compounds, such as methanol, ethanol, fatty acid, etc. The lower pH value of crude glycerol could be attributed to the fatty acid presence. The lower density and viscosity of crude glycerol could be related to the water content.

2.2. Methods

2.2.1. Bio-Based Adhesives’ Characterization

Thermogravimetric analyses were performed using a TGA/DTA 851e Mettler Toledo instrument (Columbus, OH, USA). Approximately 10 mg of sample was placed in an uncovered 70-µL alumina crucible to determine mass loss during heating. Thermograms were recorded using a heating rate of 10 °C/min in a temperature range from 25 °C to 800 °C. Nitrogen was used as specimen purge at a flow rate of 50 mL/min.
The FT-IR spectroscopy was used for characterization of the functional group of the bio-based adhesive. FT-IR measurements were performed by using a Spectrum-400 spectrometer from Perkin-Elmer (Waltham, MA, USA), which was equipped with an attenuated total reflectance (ATR) crystal. A resolution of 4 cm−1 was chosen for each analysis, with 64 scans being recorded to reduce noise. All the spectra were recorded over the range of 4000 to 650 cm−1 in absorption mode.
Glass transition temperature (Tg) was determined by dynamic mechanical analysis based on the maximum of the tan δ peak, which represents the ratio of storage modulus to loss modulus [17]. The tests were conducted by using a Q800 dynamic mechanical analyzer (DMA) from TA instruments, New Castle, DE, USA. The tests were carried out in single-cantilever mode. First, the adhesive formulations were cured on a Teflon board at 200 °C for 13 min and were pressed in a cold plate press to obtain a polymerized adhesive sheet. Then, the specimens were cut from these sheets using a laser machine at a dimension of 35 mm (length) by 13 mm (wide) with a thickness of 1.7 mm. Ten repetition were carried out for each formulation. The analyses were conducted at a frequency of 1 Hz and an amplitude of 30 μm. All specimens were initially conditioned at 25 °C in the DMA chamber, and then dynamic heating scans were performed from 25 to 120 °C at 3 °C/min.

2.2.2. Determination of Properties of Insulation Board

Four low-density thermal insulation board for each reactant ratio (1:0.66 and 1:1 mol/mol) and for each bio-based adhesive content (14% and 20%) were manufactured. The insulation boards were placed in a conditioning room at 20 °C and 65% RH (Relative humidity) until a constant mass was obtained.
  • Density profiles’ tests
The insulation board density profiles along the thickness were carried out using an X-ray densitometer system QDP-01X (Quintek Measurement Systems Inc., Knoxville, TN, USA). Twenty specimens of 50 mm × 50 mm for each insulation board type were prepared. The specimens were placed in a conditioning room (T= 20 °C and RH = 65%).
  • Thermal conductivity tests
Thermal conductivity measurements of each insulation board used in this study were carried out using a FOX 314 heat flow meter from TA Instruments-LaserComp, USA, equipped with a ThermoCube cooling apparatus from Solid State Cooling Systems, USA. The thermal conductivity tests were performed according to the American Society for Testing and Materials C518-17 standard [21]. Twelve specimens of 200 × 200 mm2 for each insulation board type were tested. The measurements were taken at an average temperature of 22.5 °C. The temperature of the upper plate was set at 10 °C and the temperature of the lower plate was set at 35 °C. The WinTherm32 software calculated the thermal conductivity and the data was recovered when the system had reached equilibrium. Prior to conducting the tests, the specimens were conditioned to a moisture content average of 12 ± 3%.
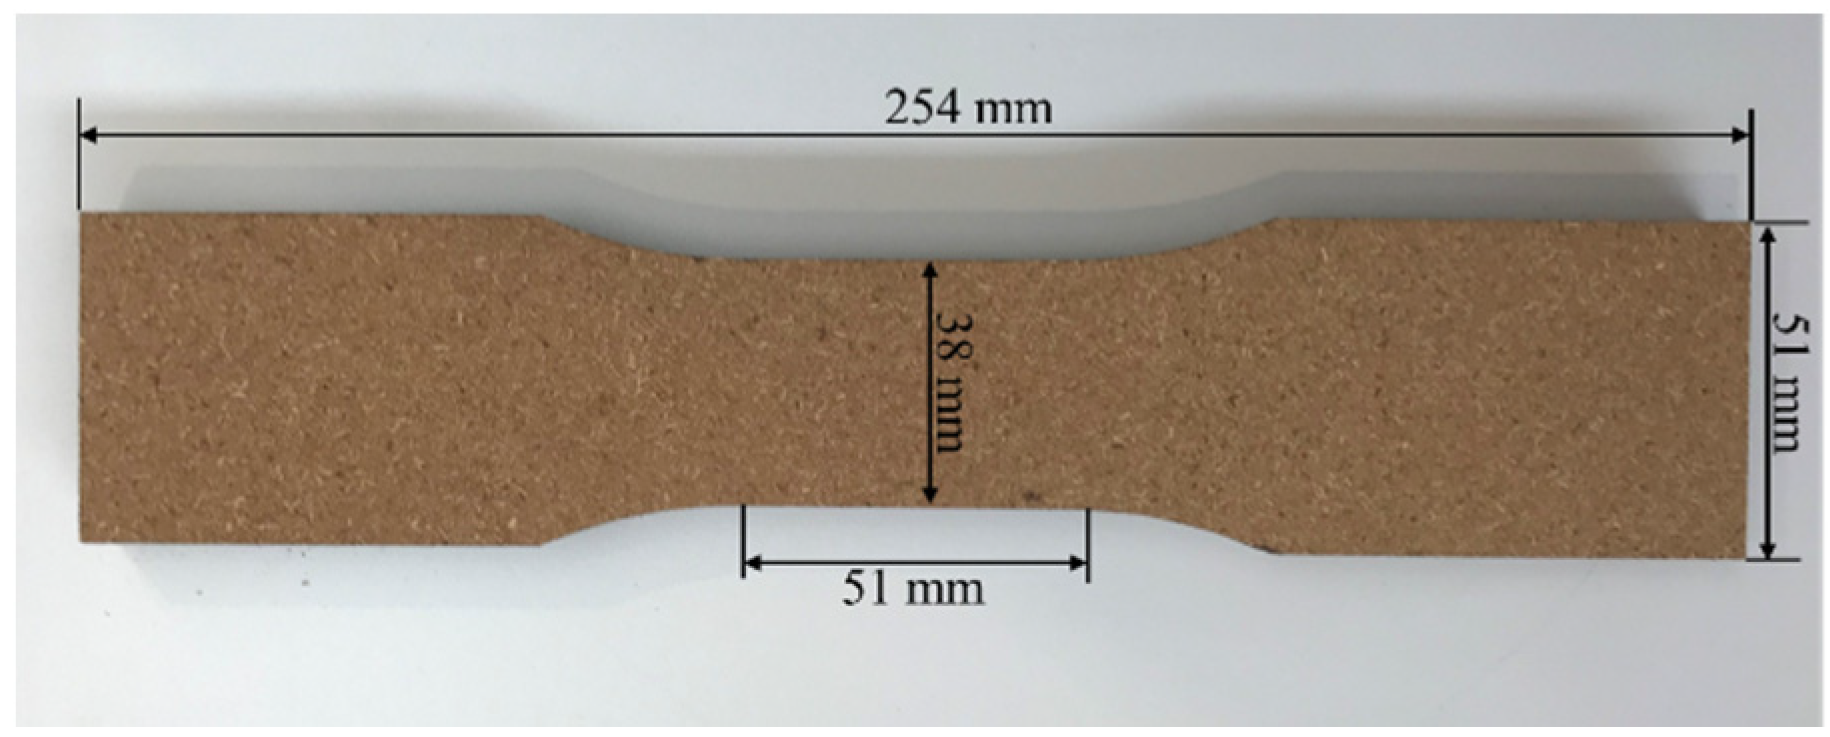
  • Mechanical properties’ tests
Mechanical properties were determined according to ASTM C209-15 standard [22] using a MTS Q Test/5 Universal testing machine (MTS System Corporation, Eden Prairie, MN, USA) equipped with a load cell of 5 kN. Traverse strength (modulus of rupture) was determined by applying a load in flexion to the specimen of 76 × 381 mm2 at a crosshead speed of 152 mm/min until failure occurs. The modulus of rupture was calculated using the Equation (1).
MOR = 6P/t^2
where MOR is the modulus of rupture (MPa), P is the traverse load (N), and t is the thickness (mm). The tensile strength parallel to surface was measured by applying a rate of separation of the jaws of 51 mm/min. The specimens were prepared in accordance with Figure 1. Twelve specimens of each insulation board were tested.
The tensile strength perpendicular to surface was measured by pulling the specimens (51 × 51 mm2) apart in the cross-section direction, at a crosshead speed of 51 mm/min. Both side surfaces of the specimen panel were mounted onto the testing accessory with speed bond resin.
The compressive strength was determined by following the Procedure A of ASTM C165-07 standard [23] using a MTS Alliance RT/50 (MTS System Corporation, USA) Universal testing machine equipped with a load cell of 50 kN. The compressive resistance of test specimen of 150 × 150 mm2 was calculated using the Equation (2).
S = W/A
where S is the compressive resistance (Pa), W is load at specified deformation (N), and A is average original area (m2). Prior to conducting the tests, the specimens were stored in a conditioning chamber at 23 °C and 50% RH until a constant mass was achieved.

2.2.3. Morphology Characterization of Insulation Boards

Microstructural analyses were performed using a Micro Computed Tomography (Micro-CT, model 1272, SkyScan, Kontich, Belgium). The analyses were conducted to evaluate the microstructure, porosity, and pore size distribution of the insulation boards. X-Ray micro-tomography is based on the attenuation of an X-ray beam by matter. The sample is scanned at different rotation angles by X-ray beams. The attenuation of the X-ray beam intensity is measured by a 2-D detector, which acquires a collection of projections. Then an algorithm reconstructs the 3-D specimen from the 2-D radio-density images. For this purpose, Skyscan 1272 software version 1.1.17 and NRecon software version 1.7.4.2 were used for image acquisition and reconstruction. There were 321 images of 1344 × 2016 pixels generated of each sample of 10 mm of diameter obtained of low-density thermal insulation boards studied. For porosity analysis, a volume of interest of 5 mm × 5 mm × 5 mm was selected from each sample. The images were separated into two-phase (segmentation): (1) Wood fiber and bio-based adhesive (white pixels) and (2) voids (black pixels), in order to calculate the pores’ percentage. The images, using a CTAN software, were analyzed.

2.2.4. Experimental Design and Data Analysis

A factorial design was used in this experiment. Factors were the ratio of crude glycerol and citric acid (1:0.66 and 1:1) in the formulations, and the adhesive content in the wood fiber insulation board manufacturing (14%, 20%). The Statistical Analysis System (SAS) 9.4 was used to analyze the thermo-mechanical properties. The influence of each factor and their interaction were analyzed. An analysis of variance (ANOVA) (ρ < 0.05) was performed.

3. Results and Discussion

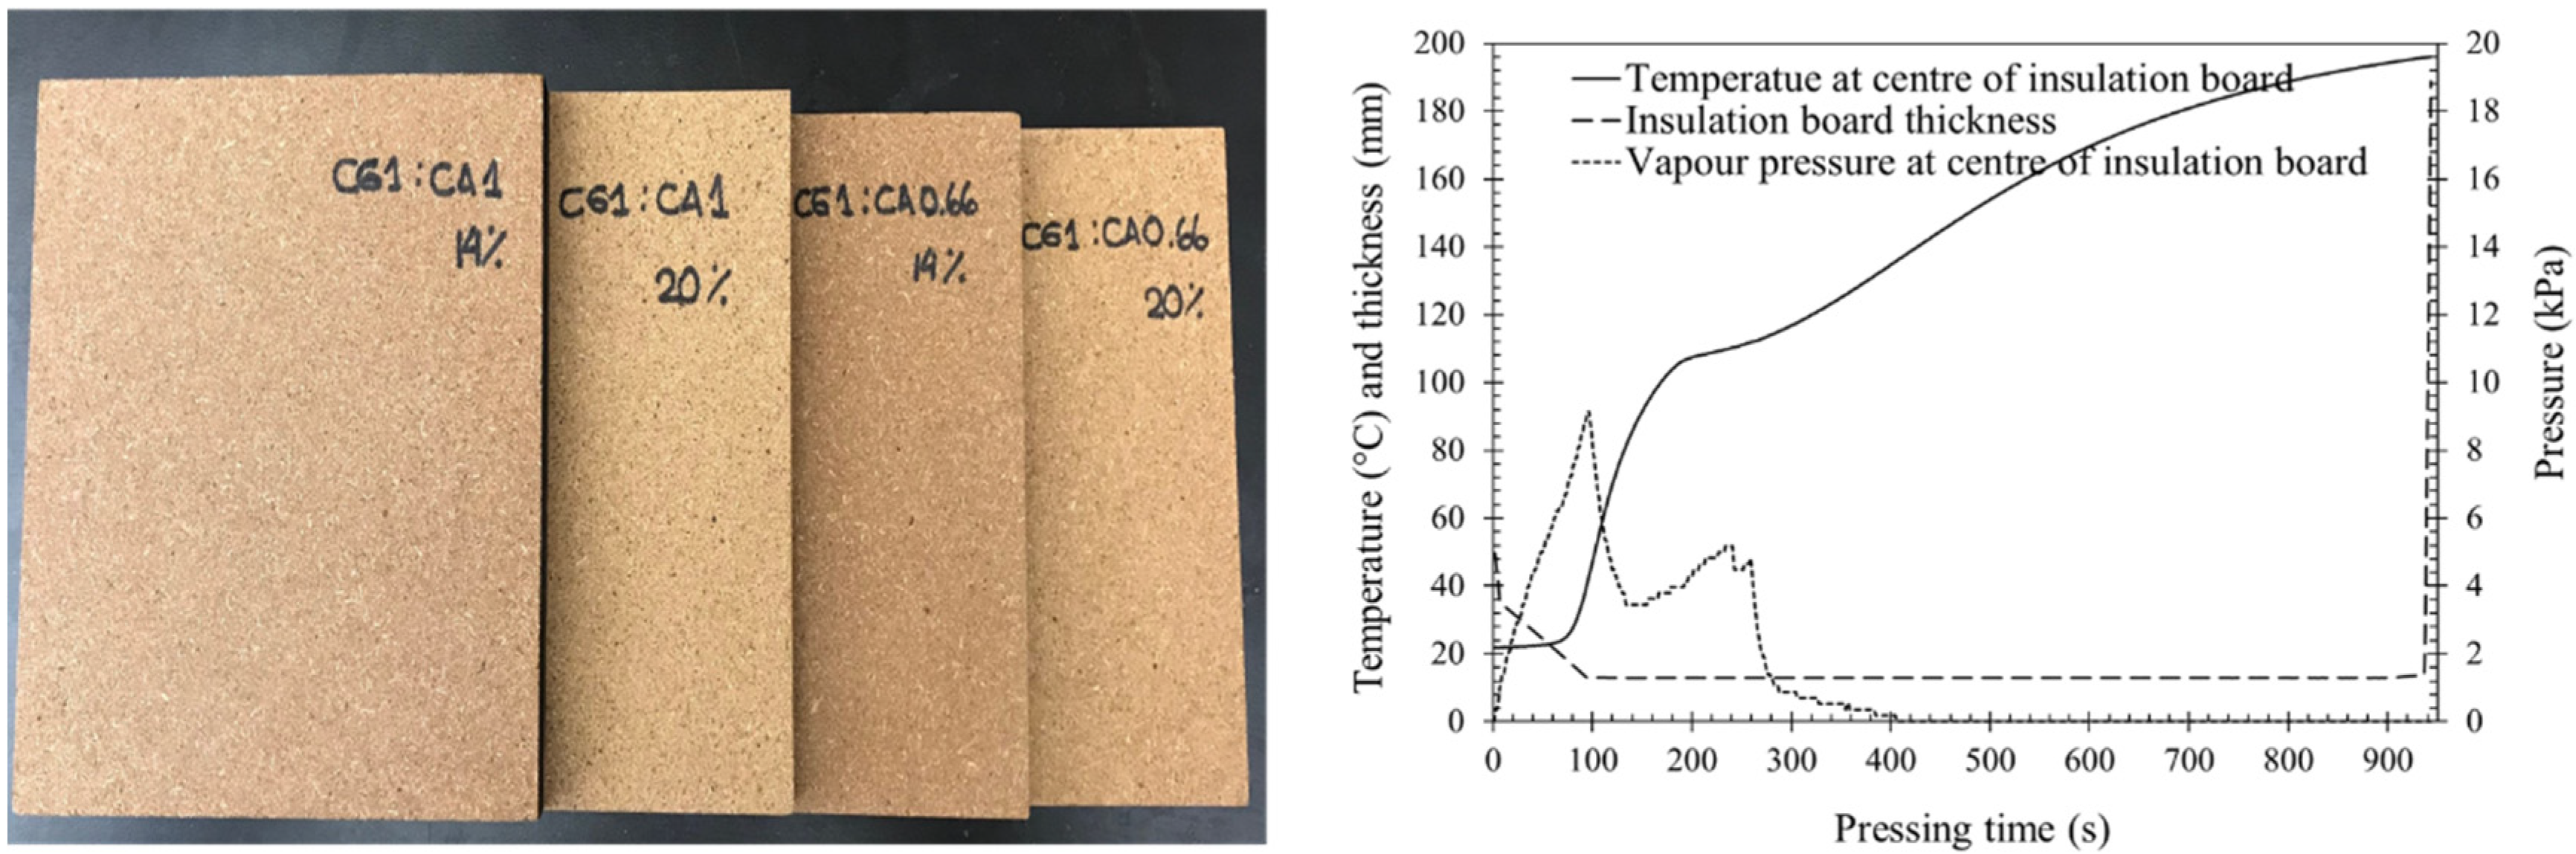
3.1. Insulation Board Manufacturing

The wood fiber insulation boards were manufactured in the laboratory (Figure 2). The water vapor pressure and temperature parameters were measured using a probe (Press MAN) placed at the center of the insulation boards. The curves of both parameters during pressing time are shown in the Figure 2. The temperature at the center of all insulation boards showed the same trend. The temperature was greater than 160 °C, reaching 195 °C at the end of pressing time. Prior studies have shown that crude glycerol and citric acid were cross-linked at temperatures from 140 to 180 °C [14,18,20]. The temperature at the center of the insulation board was greater than 160 °C during 7 min. Previous studies mentioned longer polymerization times of 60 or 120 min [14,18,20]. The determination of the mechanical properties of the insulation boards will confirm the effectiveness of the pressing time used. This polymerization is an esterification reaction that produced water as a by-product [17,18], which could cause an increase of vapor pressure during pressing time. Figure 2 shows a vapor pressure of 5 kPa to 10 kPa. This pressure did not cause any problems, such as delamination of the insulation board.

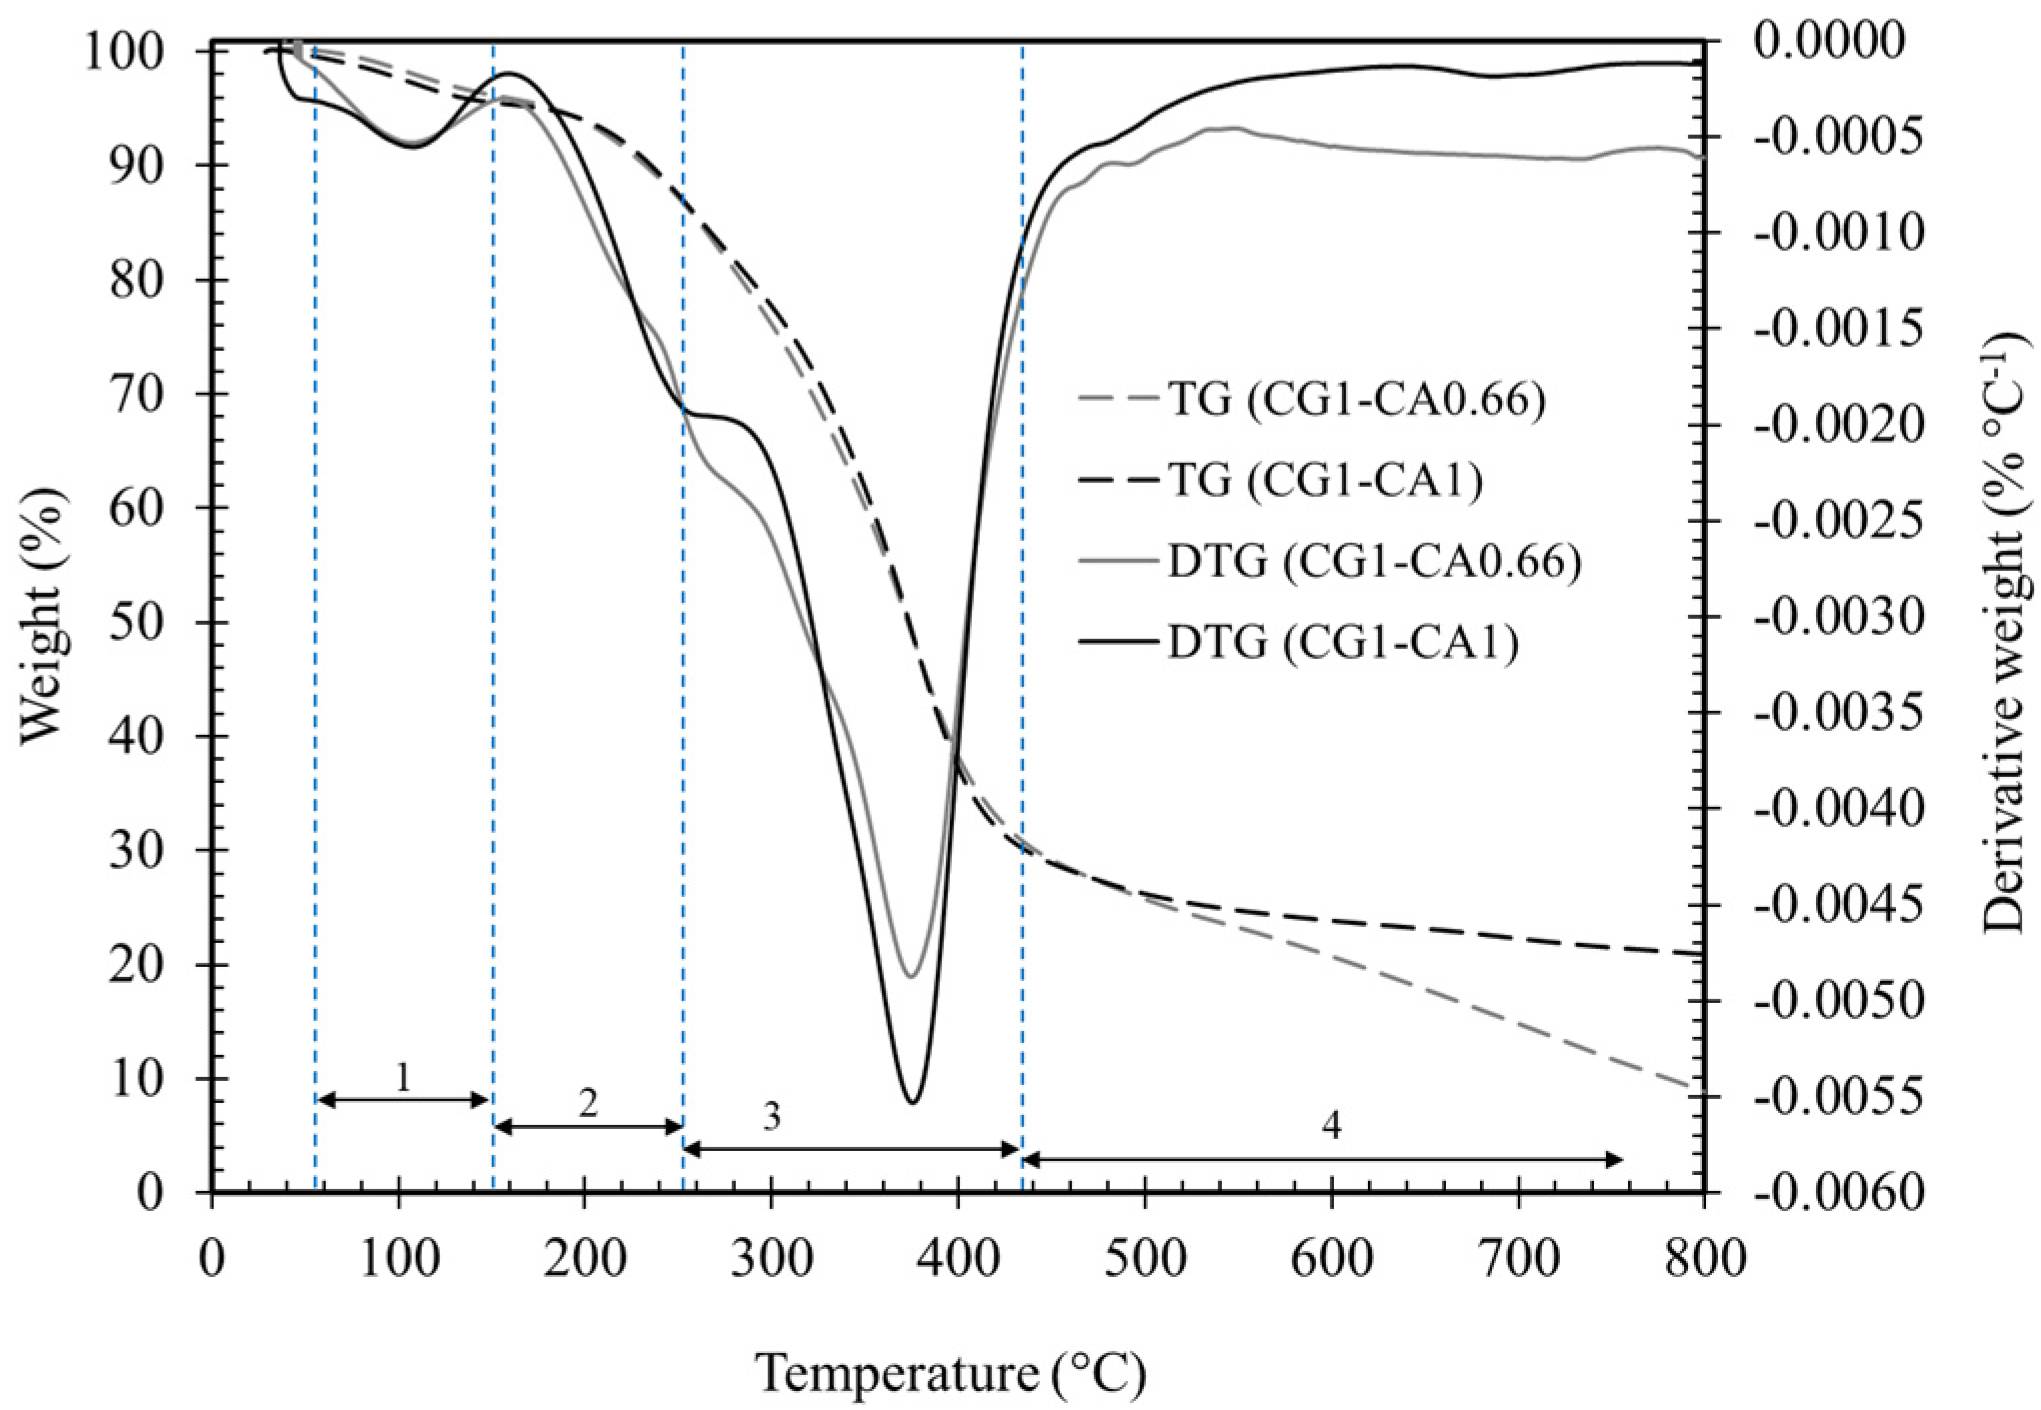
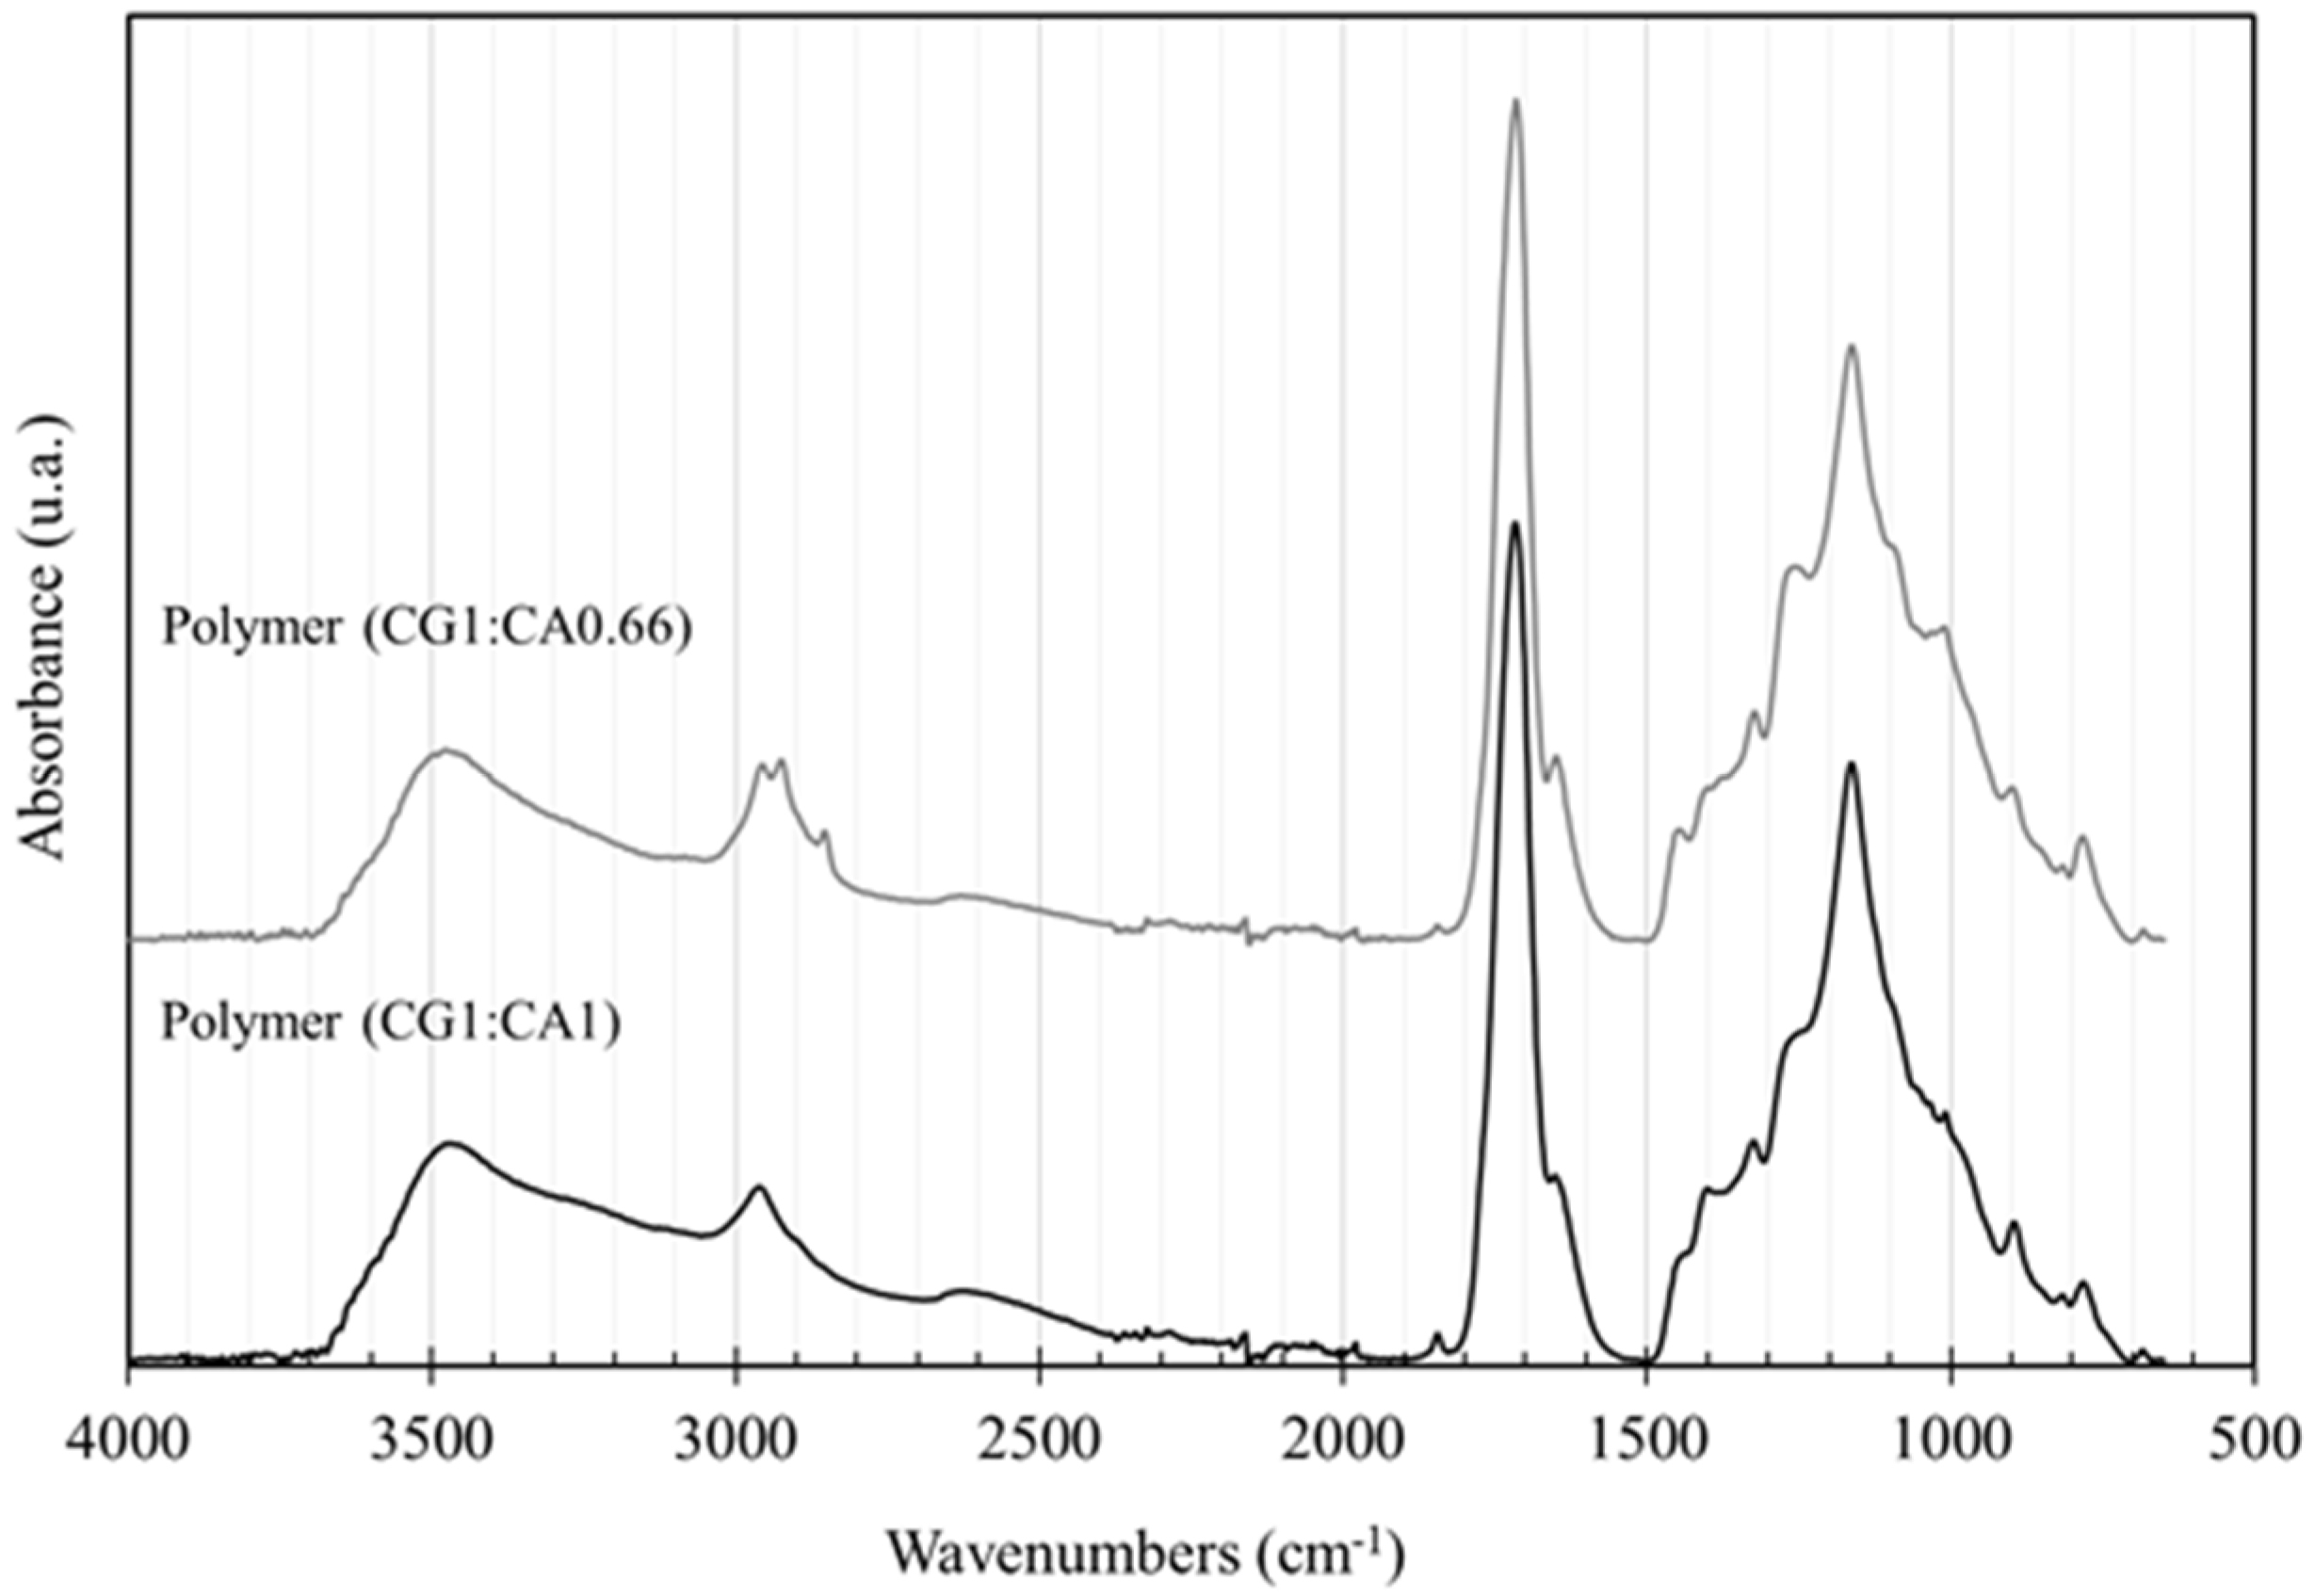
3.2. Characterization of Bio-Based Adhesive

The thermal degradation curves of both formulations cured at 200 °C for 13 min are shown in Figure 3. In general, both cured adhesives showed the same trends, although there were some differences. The specimens decomposed at 150–460 °C, which presented a significant mass loss between 70% and 71%. The cured adhesives presented mainly four degradation steps [18]. The first step occurred in the temperature range of 60–140 °C; the mass loss was mainly due to water evaporation and volatile compounds. The second step occurred in the temperature range of 150–270 °C. According to Figure 3 and Figure 4, the mass loss in this second step was due to the degradation of acid citric at 150 to 230 °C [24], the degradation of crude glycerol part (180–270 °C), the degradation of tannin (220–280 °C), and the polymer chains. The third step occurred in the temperature range of 280–460 °C. The mass loss in this step occurred due to thermal degradation of the remaining polymer chains, fatty acid methyl esters impurities, and carbonization [18]. According to thermo-gravimetric (TG) and Derivative thermo-gravimetric (DTG) curves at 375 °C, the CG1–CA1 formulation showed lower thermal stability in comparisons with CG1–CA0.66 formulation, although the difference in mass loss between both formulations was only 0.35%.
The fourth step occurred between 500–800 °C. The mass loss occurred due to ashes and coke, attributed to the thermal cracking process [18]. The ashes are considered as the char created during the heating at high temperature and as some residues in the crude glycerol formed during the biofuel process.
FT-IR spectra of CG1:CA0.66 and CG1:CA1 formulations cured at 200 °C for 13 min are shown in Figure 5. The FT-IR spectra of CG1:CA0.66 formulation was moved in the absorption axis for a better view. In general, the FT-IR profile of both cured adhesives was similar. The main peak shown in Figure 5 of both cured adhesives and their corresponding functional groups are indicated below. In the region between 4000 and 2500 cm−1, both cured adhesives showed absorption band at 3550–3200 cm−1, attributed to the free O–H groups’ stretching vibrations. The absorption band at 3000–2850 cm−1 corresponded to symmetric and asymmetric stretching vibration of C–H groups [25]. It could be observed that the FT-IR spectra of polymer CG1:CA0.66 presented a higher absorbance at 2950 cm−1 and 2856 cm−1. This may have been due to higher CH2 stretching vibrations. This could be explained by a different polymer reticulation caused by the lower quantity of citric acid used in the formulation. In the region between 2000 to 1550 cm−1, the main absorption bands were due to the carbonyl group. The high-intensity stretching vibration peak of ester groups (C=O) was observed around 1717 cm−1 for CG1:CA0.66 formulation and 1718 cm−1 for CG1:CA1 formulation. These peaks indicated the presence of ester bonds in both cured formulations. In the region between 1500 and 600 cm−1, the peaks around 1600 cm−1 and 1400 cm−1 characterized the aromatic compounds of condensed tannin [26]. In the absorption band at 1300–600 cm−1, different peaks corresponded to the substituted benzene rings [26,27]. The reaction between OH groups of glycerol and OH groups of condensed tannin formed ether (C–O–C) bonds that corresponded to the 1170–1070 cm−1 range.
DMA was used to analyze the glass transition temperatures (Tg) based on the maximum of the tan δ peak. The Tg for CG1:CA0.66 formulation was 77 °C, while for CG1:CA1 formulation was 73 °C. The increase of glass transition temperature was directly related to an increase in cross-linking density. The results confirmed the presence of cross-linked network between crude glycerol and citric acid. However, there were statistically not significant differences between the results of Tg for CG1:CA0.66 and CG1:CA1 formulations.

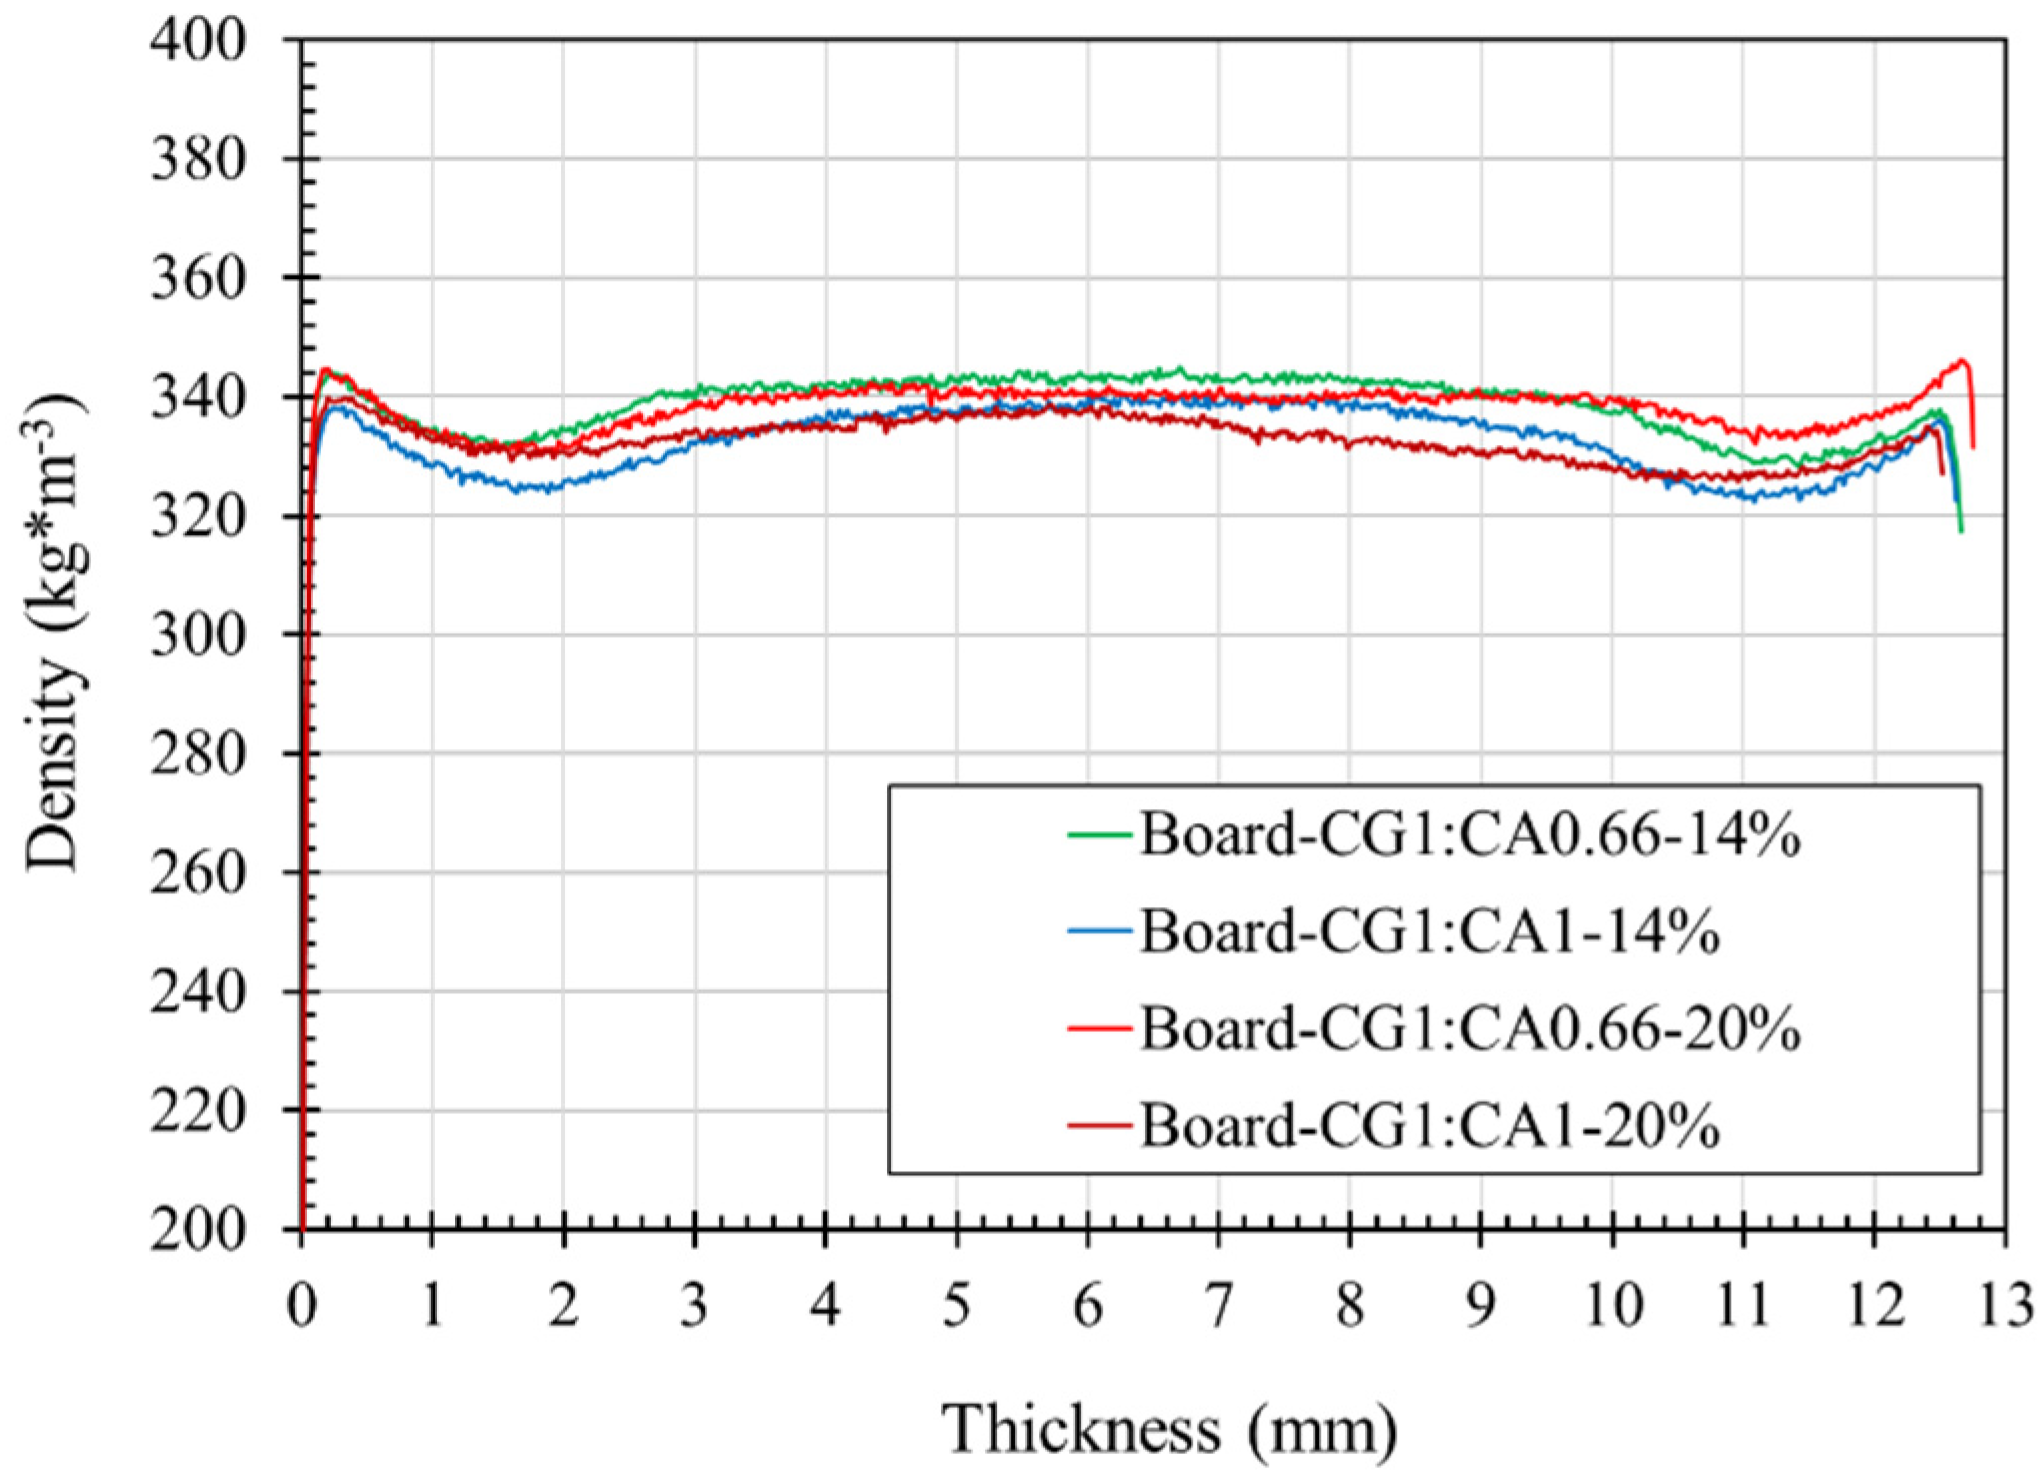
3.3. Density Profile of Insulation Boards

Figure 6 shows density profiles along the thickness of the insulation boards. The insulation boards showed a density profile flat, although the density values were higher in the center and the surface, as shown in Figure 6. This profile type would improve certain mechanical properties such as tensile strength perpendicular to surface of the insulation boards. The decrease of density values near the surface could improve through optimization of close time of plates of the press. The effect of reactant ratio and the bio-based adhesive content according to the ANOVA analysis was not significant for the density values.
The average density values of wood fiber insulation boards were between 332 and 338 kg m−3 with a coefficient of variation (COV) between 4% and 7%. The density values of a cellulosic fiber insulating board with a thickness of 11 to 76 mm were between 160 and 497 kg m−3, according to the ASTM C208-12 standard [28].

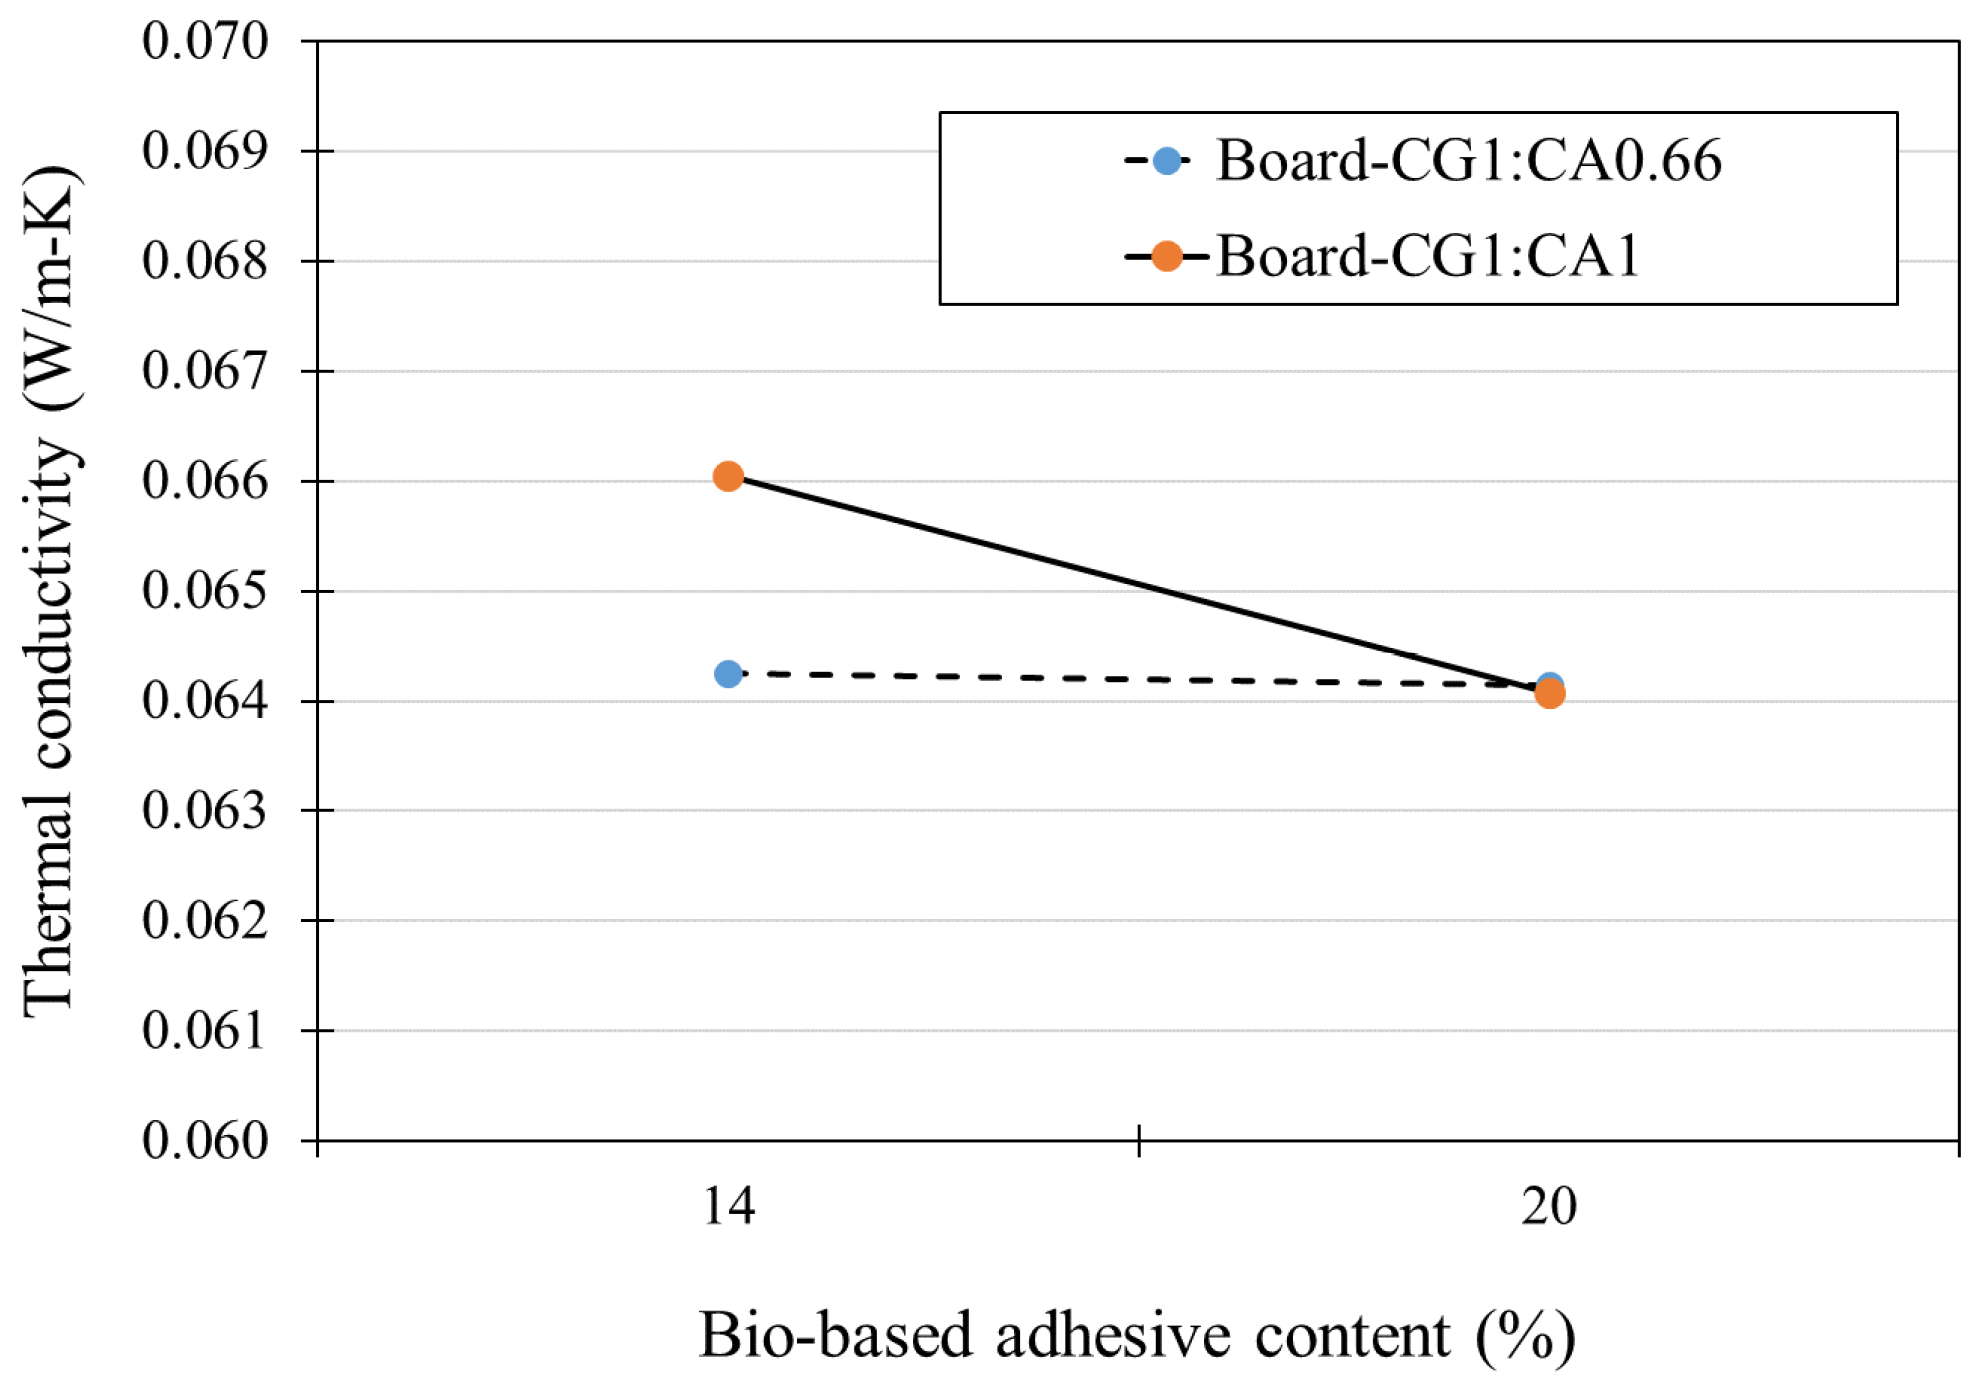
3.4. Thermal Conductivity

According to ANOVA results, the interaction between reactants ratio and adhesive content was statistically significant (Table 4).
Thermal conductivity values (λ) of insulation boards manufactured from wood fiber and bio-based adhesive are shown in Table 5.
At 14% of adhesive content, the thermal conductivity values of the insulation boards manufactured with CG1:CA0.66 formulation were slightly lower than those manufactured with CG1:CA1 formulation. The decrease of λ values could be explained by higher glass transition temperature of CG1:CA0.66 formulation, which led to an increase of cross-linked network. In contrast, at 20% of adhesive content, the λ values were similar for insulation boards manufactured with both formulations. For the insulation boards manufactured with CG1:CA1 formulation, the thermal conductivity values decreased with the increase of 14% to 20% of adhesive content. However, for insulation boards made with CG1:CA0.66 formulation, the values seemed to be identical even with an increase of the adhesive content, as shown in Figure 7.
Thermal conductivity values of the insulation boards were between 0.064 to 0.066 W/m-K. Usually, a material can be considered as a thermal insulator if its conductivity is lower than 0.07 W/m-K [1]. According to the ASTM C208-12 standard [25], the thermal conductivity maximum is in the range 0.055–0.072 W/m-K, depending on the use of the insulation board (e.g., roof insulation board, wall sheathing, ceiling tiles, and panels). Therefore, manufactured insulation boards meet requirements for a roof (grade 2) or wall sheathing insulation board (structural).
Table 5 compares thermal conductivity values of the insulation boards manufactured with CG1:CA0.66 and CG1:CA1 formulations with other thermal insulation materials. The λ values for insulation boards are close to that of the coconut husk insulation boards, bagasse insulation boards, larch bark insulation boards, kenaf-fiber insulation boards, and corncob particleboards, which have a similar density range [4,8,10,11,29]. In comparison to synthetic materials (e.g., mineral wool, polyethylene foam, and extruded polystyrene foam), the values were higher, although the density values of synthetic materials were lower in comparison to wood fiber insulation boards.

3.5. Physical and Mechanical Properties

The ANOVA showed that the effect of both parameters was not significant on MOR values (Table 6).
The effect of the reactant ratio and bio-based adhesive content in physical and mechanical properties of wood fiber insulation boards is presented in Table 7.
The maximum MOR value was 1.13 MPa, while the minimum value was 0.85 MPa for insulation board density of 332–338 kg m−3. According to the results, the MOR values of the insulation boards of 13 mm of thickness meet requirements of ASTM C208-12 standard [28] for roof insulation board of grade 1 (0.97 MPa), although MOR values were lower for the categories of wall sheathing regular and structural (1.90 and 2.76 MPa) and roof insulation board of grade 2 (1.90 MPa). The MOR values of the insulation boards were also close to other insulation boards [4,7,10], which presented similar or higher density values.
The effect of parameters on the tensile strength parallel to surface was also evaluated. The ANOVA showed that the interaction between the reactants’ ratio and the bio-based adhesive content was statistically significant (Table 6). For 14% of bio-based adhesive content, the values of the tensile strength parallel to surface were not significantly different, while for 20%, the values were significantly different. Table 6 shows also the effect of parameters on the tensile strength perpendicular to surface (internal bond). According to the ANOVA results, the effect of bio-based adhesive content was very significant on the internal bond values. The increase of bio-based adhesive content increased the tensile strength perpendicular to surface values. The tensile strength values of insulation boards meet requirements of ASTM C208-12 standard [28] for the mechanical properties for cellulosic fiber insulating board. The internal bond values meet requirements for roof insulation board (grade 1 and grade 2), wall sheathing regular and structural, and ceiling panels.
The effect of both parameters on the compressive strength was also evaluated. The effect of bio-based adhesive content was very significant in the compressive strength values (Table 7). An increase of 14% to 20% of adhesive content produced a decrease of the compressive strength values.

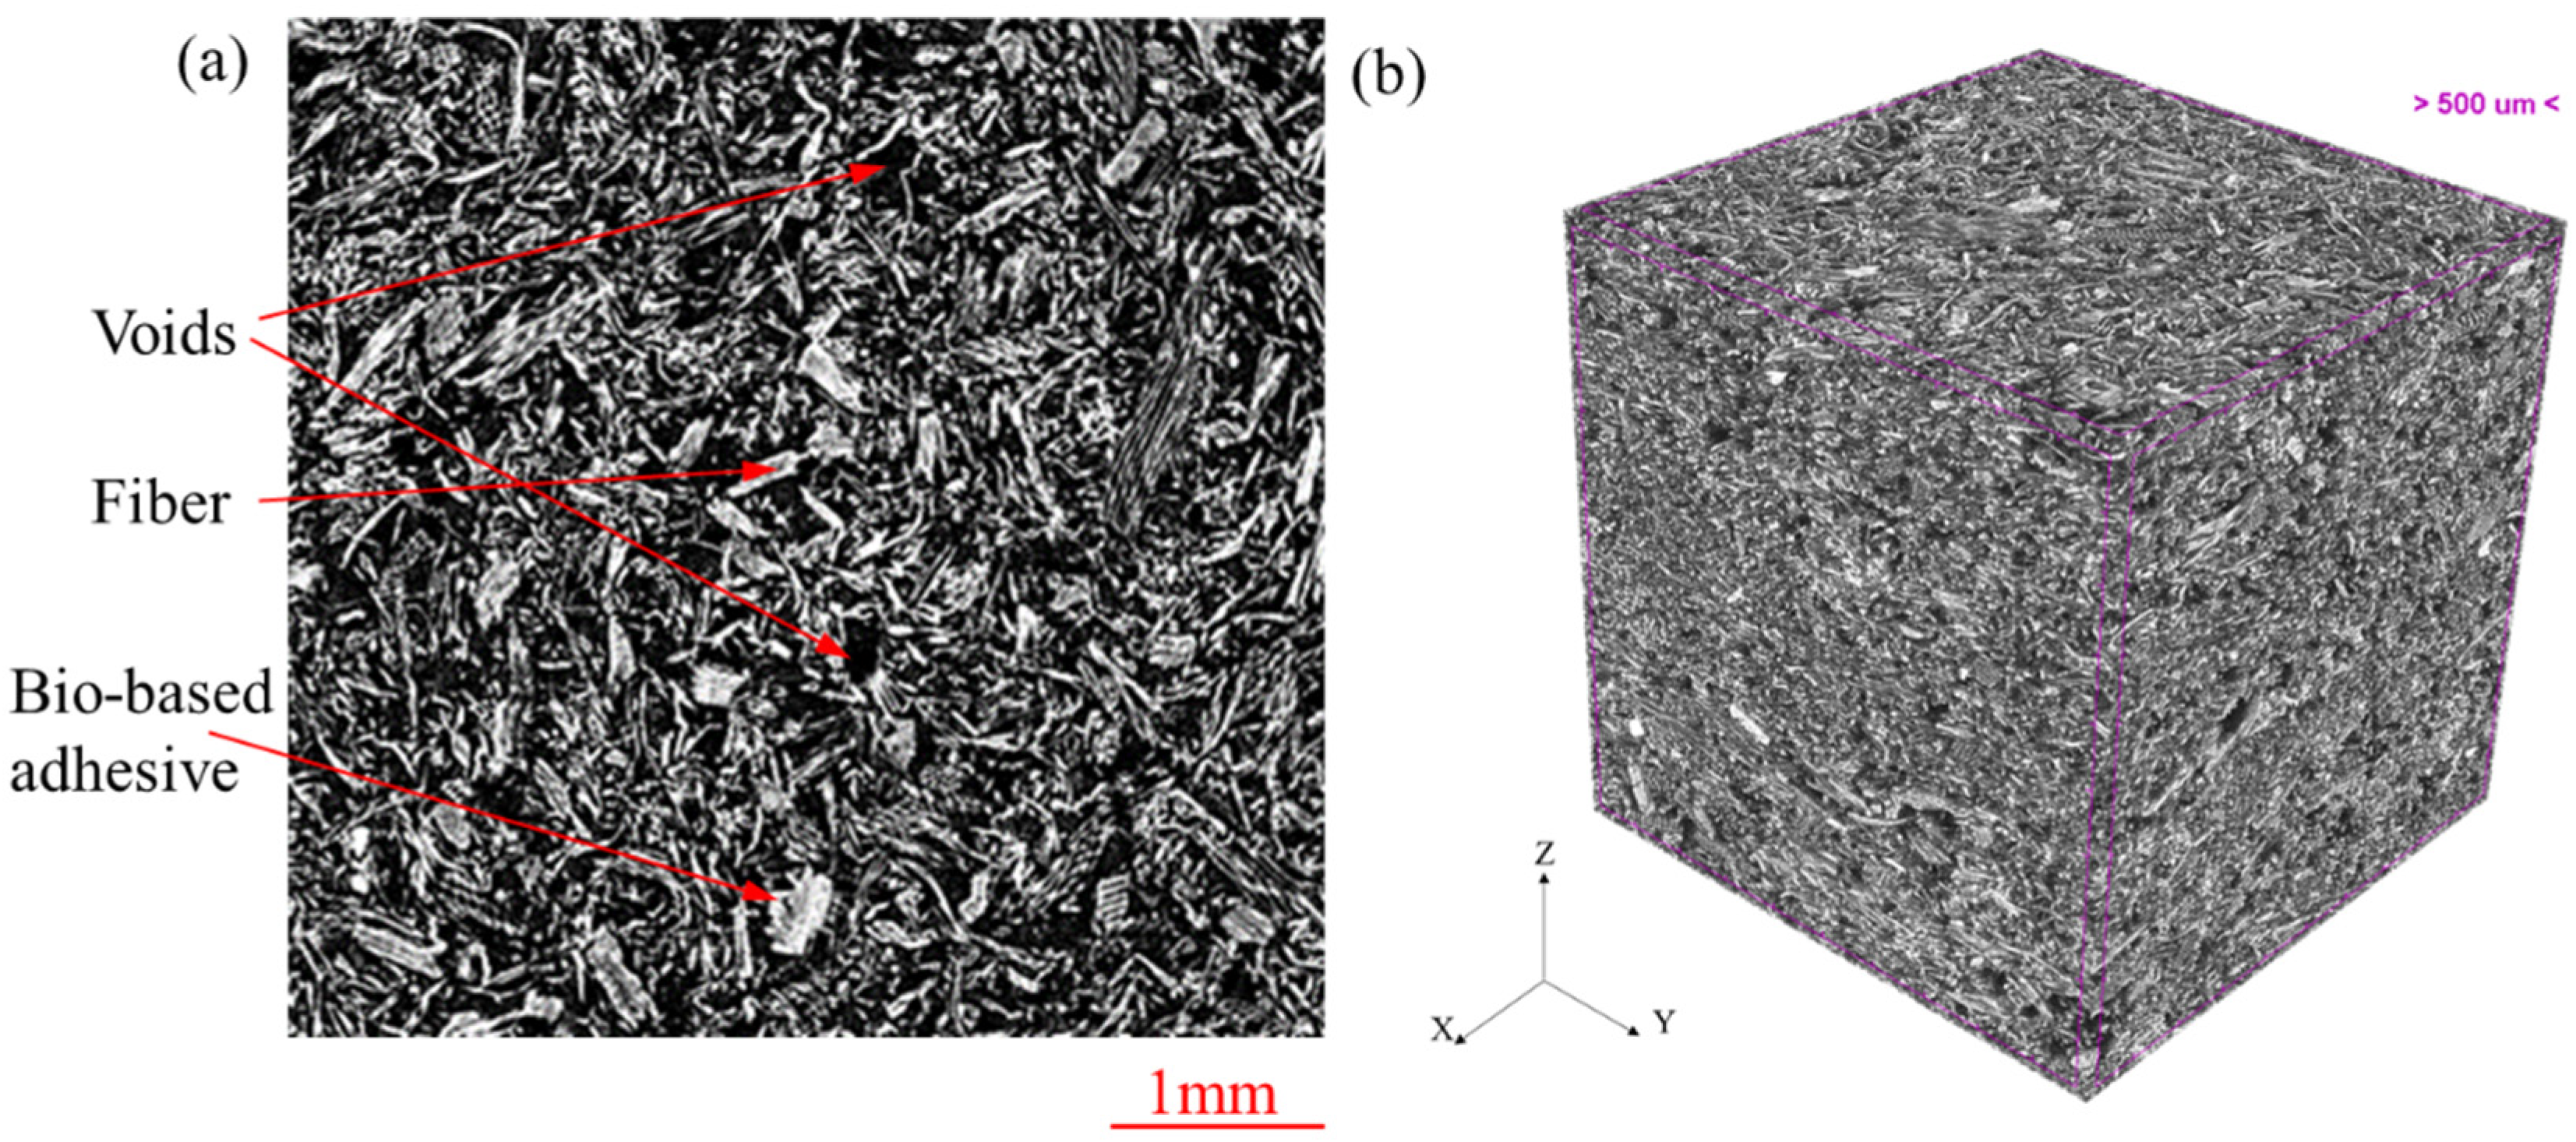
3.6. Microstructural Analyses of Insulation Boards

Figure 8 shows the results of the study of spatial microstructure in the wood fiber insulation boards. The image (Figure 8a) shows the reconstruction in 2D of insulation boards. The fibers and the bio-based adhesive can be seen as grey shades, while the voids are represented with a black tonality. From the reconstruction of the 2D images, using the CTAN software, a 3D model of the volume of interest of 5 mm × 5 mm × 5 mm (Figure 8b) was achieved. The total porosity and pore size distribution were obtained from the 3D model.
Table 8 shows the average values of total porosities for the wood fiber insulation boards. The total porosity showed a decrease as the bio-based adhesive content used in the insulation board manufacturing increased, although the decrease was not statistically significant. In [31], the authors also reported a decrease in porosity percentage of particleboard, although the increase in adhesive content was higher. The porosity percentage was lower in comparison to that reported by [32]. Nevertheless, the technique used for porosity determination was different. The effect of the reactants’ ratio was significant in the total porosity of insulation boards. The porosity was greater using CG1:CA0.66 formulation. The total porosity influenced the thermal conductivity (λ) values of insulation boards, which decreased as the porosity increased [32]. The thermal conductivity (λ) decreased as CG1:CA0.66 formulation was used in insulation boards’ manufacturing (Figure 7).
The pore size distribution using the CTAN software in each sample of wood fiber insulation boards was also calculated. Figure 9 shows the distribution of pore size in millimeter ranges. The highest percentage of pore size in insulation boards was determined between 0.072 to 0.024 mm.

4. Conclusions

The aim of the present paper was to develop a wood fiber insulation board from a dry process using a crude glycerol and citric acid mixture as a binder in order to prevent fossil-based additives. The effects of reactant ratio and the bio-based adhesive content in thermo-mechanical properties of the insulation board were evaluated. Furthermore, a characterization of bio-based adhesive and morphology study of insulation board were performed. Wood fiber insulation boards using two formulations as a binder were manufactured. Insulation boards at 200 °C for 13 min were pressed. The thermal conductivity values of insulation boards were between 0.064 W/m-K and 0.066 W/m-K. The values were similar to certain sustainable thermal insulation materials, but higher than synthetic materials. The microstructural analysis showed a direct relationship between total porosity and thermal conductivity.
The mechanical properties of insulation boards were evaluated. The effect of bio-based adhesive content was very significant for properties of tensile strength perpendicular to the surface and compressive strength. The tensile strength values (internal bond) increased between 20% and 36% with an increase of 14% to 20% of adhesive content, while the compressive strength decreased between 7% and 15%. The effect of both parameters in the module of rupture of the insulation boards was not significant, while the effect of the parameter interaction in the tensile strength parallel to surface was significant. The mechanical properties of wood fiber insulation boards confirmed the potential of crude glycerol and citric acid mixture as a binder to be used in the insulation boards’ manufacturing for environmental sustainability purposes.

Author Contributions

Methodology, F.S. and G.G.E.E.; formal analysis, F.S.; writing—original draft preparation, F.S.; writing—review and editing, P.B. and N.A.; supervision, P.B.; project administration, P.B.; funding acquisition, P.B. All authors have read and agree to the published version of the manuscript.

Funding

The authors are grateful to Natural Sciences and Engineering Research Council of Canada for the financial support through its discovery grant, IRC and CRD programs (RGPIN-2015-05683, IRCPJ 461745-18 and RDCPJ 524504-18) as well as the industrial partners of the NSERC industrial chair on eco-responsible wood construction (CIRCERB).

Conflicts of Interest

The authors declare no conflict of interest.

References

  1. Asdrubali, F.; D’Alessandro, F.; Schiavoni, S. A review of unconventional sustainable building insulation materials. Sustain. Mater. Technol. 2015, 4, 1–17. [Google Scholar] [CrossRef]
  2. Costa, A.; Keane, M.; Torrens, J.I.; Corry, E. Building operation and energy performance: Monitoring, analysis and optimisation toolkit. Appl. Energy 2013, 101, 310–316. [Google Scholar] [CrossRef]
  3. Yıldırım, N. Performance Comparison of Bio-based Thermal Insulation Foam Board with Petroleum-based Foam Boards on the Market. Bioresources 2018, 13, 3395–3403. [Google Scholar] [CrossRef]
  4. Panyakaew, S.; Fotios, S. New thermal insulation boards made from coconut husk and bagasse. Energy Build. 2011, 43, 1732–1739. [Google Scholar] [CrossRef] [Green Version]
  5. Kirsch, A.; Ostendorf, K.; Euring, M. Improvements in the production of wood fiber insulation boards using hot-air/hot-steam process. Eur. J. Wood Wood Prod. 2018, 76, 1233–1240. [Google Scholar] [CrossRef]
  6. Barreca, F.; Fichera, C.R. Thermal insulation performance assessment of agglomerated cork boards. Wood Fiber Sci. 2016, 48, 96–103. [Google Scholar]
  7. Kallakas, H.; Närep, M.; Närep, A.; Poltimäe, T.; Kers, J. Mechanical and physical properties of industrial hemp-based insulation materials. Proc. Est. Acad. Sci. 2018, 67, 183–192. [Google Scholar] [CrossRef]
  8. Ibraheem, S.A.; Ali, A.; Khalina, A. Development of Green Insulation Boards from Kenaf Fibres and Polyurethane. Polym. Technol. Eng. 2011, 50, 613–621. [Google Scholar] [CrossRef]
  9. Niro, J.F.D.V.M.; Kyriazopoulos, M.; Bianchi, S.; Mayer, I.; Eusebio, D.A.; Arboleda, J.R.; Lanuzo, M.M.; Pichelin, F. Development of medium- and low-density fibreboards made of coconut husk and bound with tannin-based adhesives. Int. Wood Prod. J. 2016, 7, 208–214. [Google Scholar] [CrossRef]
  10. Kain, G.; Güttler, V.; Barbu, M.-C.; Petutschnigg, A.; Richter, K.; Tondi, G. Density related properties of back insulation boards bonded with tannin hexamine resin. Eur. J. Wood Prod. 2014, 72, 417–424. [Google Scholar] [CrossRef]
  11. Zhou, X.-Y.; Zheng, F.; Li, H.-G.; Lu, C.-L. An environment-friendly thermal insulation material from cotton stalk fibers. Energy Build. 2010, 42, 1070–1074. [Google Scholar] [CrossRef]
  12. Gutiérrez, J.; Cadena, C.; Bula, A. Thermal insulation produced from rice husk agglomerated using starch produced by saccharomyces cerevisiae. DYNA 2013, 81, 138–143. [Google Scholar]
  13. Hu, S.; Luo, X.; Wan, C.; Li, Y. Characterization of Crude Glycerol from Biodiesel Plants. J. Agric. Food Chem. 2012, 60, 5915–5921. [Google Scholar] [CrossRef]
  14. Essoua, G.; Blanchet, P.; Landry, V.; Beauregard, R. Pinewood treated with a citric acid and glycerol mixture: Biomaterial performance improved by a Bio-byproduct. BioResources 2016, 11, 3049–3072. [Google Scholar]
  15. Quispe, C.A.; Coronado, C.J.; De Carvalho, J.A. Glycerol: Production, consumption, prices, characterization and new trends in combustion. Renew. Sustain. Energy Rev. 2013, 27, 475–493. [Google Scholar] [CrossRef]
  16. Moita, R.; Freches, A.; Lemos, P. Crude glycerol as feedstock for polyhydroxyalkanoates production by mixed microbial cultures. Water Res. 2014, 58, 9–20. [Google Scholar] [CrossRef]
  17. Halpern, J.M.; Urbanski, R.; Weinstock, A.K.; Iwig, D.F.; Mathers, R.T.; Von Recum, H.A. A biodegradable thermoset polymer made by esterification of citric acid and glycerol. J. Biomed. Mater. Res. Part A 2013, 102, 1467–1477. [Google Scholar] [CrossRef] [Green Version]
  18. Berube, M.-A.; Schorr, D.; Ball, R.J.; Landry, V.; Blanchet, P. Determination of In Situ Esterification Parameters of Citric Acid-Glycerol Based Polymers for Wood Impregnation. J. Polym. Environ. 2017, 26, 970–979. [Google Scholar] [CrossRef]
  19. Pramanick, D.; Ray, T. Synthesis and biodegradation of copolyesters from citric acid and glycerol. Polym. Bull. 1988, 19, 365–370. [Google Scholar] [CrossRef]
  20. Schorr, D.; Blanchet, P.; Essoua, G.G.E. Glycerol and Citric Acid Treatment of Lodgepole Pine. J. Wood Chem. Technol. 2018, 38, 123–136. [Google Scholar] [CrossRef]
  21. American Society for Testing and Materials. Standard Test Method for Steady-State Thermal Transmission Properties by Means of the Heat Flow Meter Apparatus, Standard C518-17; ASTM International: West Conshohocken, PA, USA, 2017. [Google Scholar]
  22. American Society for Testing and Materials. Standard Test Methods for Cellulosic Fiber Insulating Board, Standard C209-15; ASTM International: West Conshohocken, PA, USA, 2015. [Google Scholar]
  23. American Society for Testing and Materials. Standard Test Methods for Measuring Compressive Properties of Thermal Insulations, Standard C165-07; ASTM International: West Conshohocken, PA, USA, 2017. [Google Scholar]
  24. Barbooti, M.M.; Al-Sammerrai, D.A. Thermal decomposition of citric acid. Thermochim. Acta 1986, 98, 119–126. [Google Scholar] [CrossRef]
  25. Gama, N.; Soares, B.; Freire, C.; Silva, R.; Neto, C.P.; Barros-Timmons, A.; Ferreira, A. Bio-based polyurethane foams toward applications beyond thermal insulation. Mater. Des. 2015, 76, 77–85. [Google Scholar] [CrossRef]
  26. Bharudin, M.A.; Sakaria, S.; Chia, C.H. Condensed tannins from acacia mangium bark: Characterization by spot tests and FTIR. AIP Conf. Proc. 2013, 1571, 153. [Google Scholar] [CrossRef] [Green Version]
  27. Silveira Peres, R.; Cassel, E.; Schermann Azambuja, D. Black wattle tannin as steel corrosion inhibitor. ISRN Corrosion 2012, 5, 937920. [Google Scholar] [CrossRef] [Green Version]
  28. American Society for Testing and Materials. Standard Specification for Cellulosic Fiber Insulating Board, Standard C208-12; ASTM International: West Conshohocken, PA, USA, 2017. [Google Scholar]
  29. Paiva, A.; Pereira, S.; Sá, A.B.; Cruz, D.; Varum, H.; Pinto, J. A contribution to the thermal insulation performance characterization of corn cob particleboards. Energy Build. 2012, 45, 274–279. [Google Scholar] [CrossRef] [Green Version]
  30. Zou, N.Y. Thermal Insulation Materials for Wall and Roof; Chemical Industry Publish House: Beijing, China, 2008. [Google Scholar]
  31. Nakanishi, E.Y.; Cabral, M.R.; Gonçalves, P.D.S.; Santos, V.; Júnior, H.S.; Savastano, H. Formaldehyde-free particleboards using natural latex as the polymeric binder. J. Clean. Prod. 2018, 195, 1259–1269. [Google Scholar] [CrossRef]
  32. Rebolledo, P.; Cloutier, A.; Yemele, M.-C. Effect of Density and Fiber Size on Porosity and Thermal Conductivity of Fiberboard Mats. Fibers 2018, 6, 81. [Google Scholar] [CrossRef] [Green Version]
Figure 1. Specimen for determination of tensile strength parallel to surface.
Buildings 10 00152 g001
Figure 2. Wood fiber insulation boards and evolution of the temperature and vapor pressure at center of insulation board during pressing time.
Buildings 10 00152 g002
Figure 3. Thermo-gravimetric (TG) and Derivative thermo-gravimetric (DTG) curves of formulations cured at 200 °C for 13 min.
Buildings 10 00152 g003
Figure 4. TG and DTG curves of citric acid, crude glycerol, and condensed tannin.
Buildings 10 00152 g004
Figure 5. FT-IR spectra of CG1:CA0.66 and CG1:CA1 formulation cured at 200 °C for 13 min.
Buildings 10 00152 g005
Figure 6. Density profiles of the wood fiber insulation boards according to the reactant ratio (CG1:CA0.66 and CG1:CA1) and the bio-based adhesive content (14% and 20%).
Buildings 10 00152 g006
Figure 7. Interaction between the reactants’ ratio and the bio-based adhesive content in the thermal conductivity values of insulation board.
Buildings 10 00152 g007
Figure 8. Micro-CT micrographs of wood fiber insulation board. (a) Identification of wood fibers, bio-based adhesive, and voids from insulation board. (b) A 3D model of volume of 5 mm × 5 mm × 5 mm of insulation boards.
Buildings 10 00152 g008
Figure 9. Pore size distribution of the wood fiber insulation boards.
Buildings 10 00152 g009
Table 1. Composition of the bio-based adhesive formulations.
FormulationReactants Content (g)Condensed Tannins Content (wt.%) 1Cellulose Filaments Content (wt.%)p-TSA 2 Content (wt.%)
Crude Glycerol (CG)Citric Acid (CA)
CG1:CA0.6692.09126.8120.011.33
CG1:CA192.09192.1320.011.33
1 Percentage by weight; 2 p-toluenesulfonic acid.
Table 2. Wood fiber insulation board manufacturing parameters.
FormulationBio-Based Adhesive Content (%)Fiber Content (g)Water Content (g)
CG1:CA0.661497667
CG1:CA0.662092352
CG1:CA11497667
CG1:CA12092352
Table 3. Characterization of glycerol.
Pure GlycerolCrude Glycerol
Concentration (%)99 ± 188 ± 3
pH5.0 ± 0.33.1 ± 0.1
Density (g/cm3)1.262 ± 0.0021.254 ± 0.003
Viscosity (cP)800 ± 20180 ± 10
Table 4. Effect of parameters in the thermal conductivity (λ) of insulation boards.
SourceDegree of FreedomF ValuePr > F
Design
Reactants ratio13.810.0594 NS
Bio-based adhesive content15.490.0253 *
Reactants ratio x bio-based adhesive content14.370.0444 *
NS: Not significant; *: Significant.
Table 5. Thermal conductivity values of insulation boards manufactured with bio-based adhesive in comparison to other insulation materials.
Insulation Boards/MaterialsDensity (kg m−3)Thermal Conductivity (W/mK)Source
Board-CG1:CA0.66–14%338 ± 190.064
Board-CG1:CA0.66–20%338 ± 130.064
Board-CG1:CA1–14%332 ± 230.066
Board-CG1:CA1–20%332 ± 240.064
Coconut husk insulation board250–3500.046–0.068[4]
Bagasse insulation board250–3500.049–0.055[4]
Larch back insulation board250–5000.069–0.093[10]
Kenaf-fibers insulation board 0.069–0.087[8]
Corn cob particleboard171–3340.101[28]
Cotton stalk fibers150–4500.059–0.082[11]
Mineral wool (fiberglass and rockwool)24–2000.025–0.047[30]
Polystyrene (closed cell foam)16–35 0.034–0.035 [30]
Extruded polystyrene foam (XPS)24–42 0.026–0.035 [30]
Table 6. Effect of parameters on the mechanical properties of insulation boards.
SourceModulus of Rupture (MPa)Tensile Strength Parallel to Surface (kPa)Tensile Strength Perpendicular to Surface (kPa)Compressive Strength to 10% Thickness (kPa)
Design
Reactants ratio0.8455 NS0.0045 **0.5830 NS0.6222 NS
Bio-based adhesive content0.0515 NS0.1067 NS<0.0001 **0.0005 **
Reactants ratio x bio-based adhesive content0.0587 NS0.0256 *0.2497 NS0.1562 NS
**: Very significant; NS: Not significant; *: Significant.
Table 7. Physical and mechanical properties of wood fiber insulation boards.
Insulation BoardDensity (kg m−3)Modulus of Rupture (MPa)Tensile Strength Parallel to Surface (kPa)Tensile Strength Perpendicular to Surface (kPa)Compressive Strength to 10% Thickness (kPa)
Board-CG1:CA0.66-14%338 (6) 20.92 (22)672 (17)113 (21)1142 (10)
Board-CG1:CA0.66-20%338 (4)1.10 (25)692 (10)154 (25)1062 (13)
Board-CG1:CA1-14%332 (7)0.91 (29)651 (18)117 (18)1206 (8)
Board-CG1:CA1-20%332 (7)1.13 (23)575 (32)141 (30)1030 (10)
ASTM C208-12 1160–4970.97–2.76345–137923.9–38.3100–105
1 Property requirement; these values represent minimum and maximum values for each property according to the use of insulation board indicated in the American Society for Testing and Materials C208-12 standard. 2 The values represent the coefficient of variation in %.
Table 8. Percentage of porosity of wood fiber insulation boards.
Insulation Board* Total Porosity in %
Board-CG1:CA0.66-14%54.27 (1.82) Aa
Board-CG1:CA0.66-20%51.57 (1.79) Aa
Board-CG1:CA1-14%48.57 (1.53) Ba
Board-CG1:CA1-20%46.36 (1.18) Ba
* The values represent the average of three samples for each insulation board. In (), the values represent the standard error. Data with uppercase and lowercase letters were not statistically different at a 95% level of confidence.

