
Mass Timber Envelopes in Passivhaus Buildings: Designing for Moisture Safety in Hot and Humid Australian Climates

Abstract
:1. Introduction
1.1. Mass Timber and the Passivhaus Standard for Decarbonising the Construction Sector
1.2. The Australian Context
2. Aim and Scope
3. Research Context
3.1. Highly Energy-Efficient Envelopes
3.2. Mass Timber Envelopes
4. Methodology
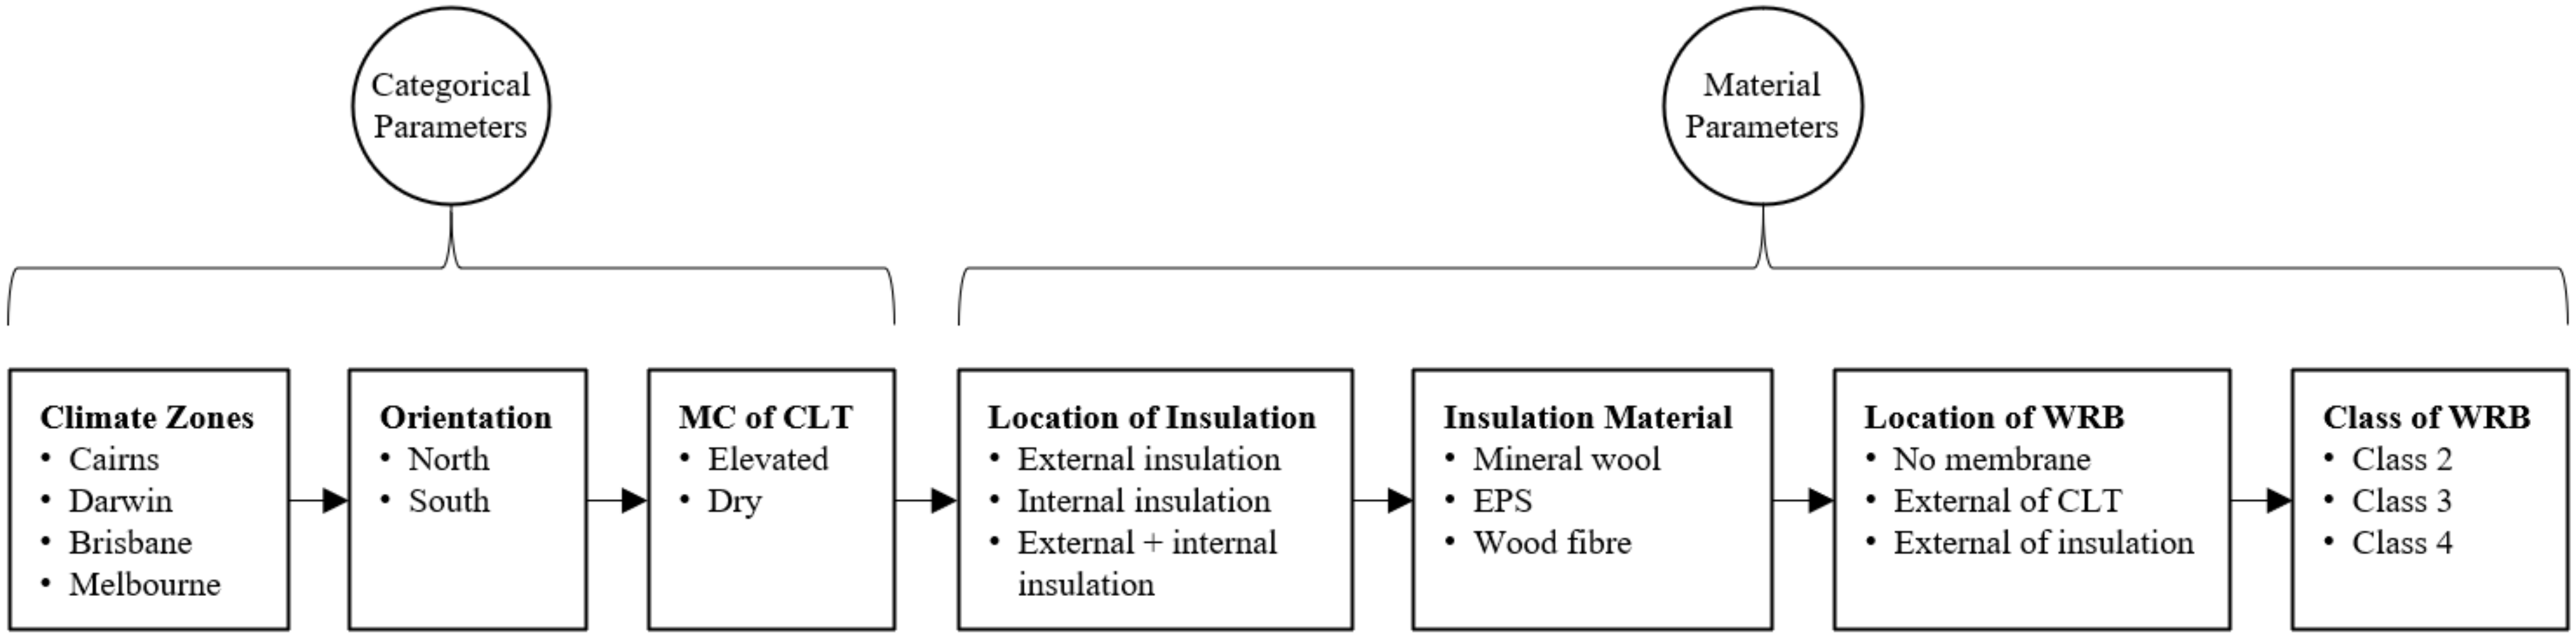
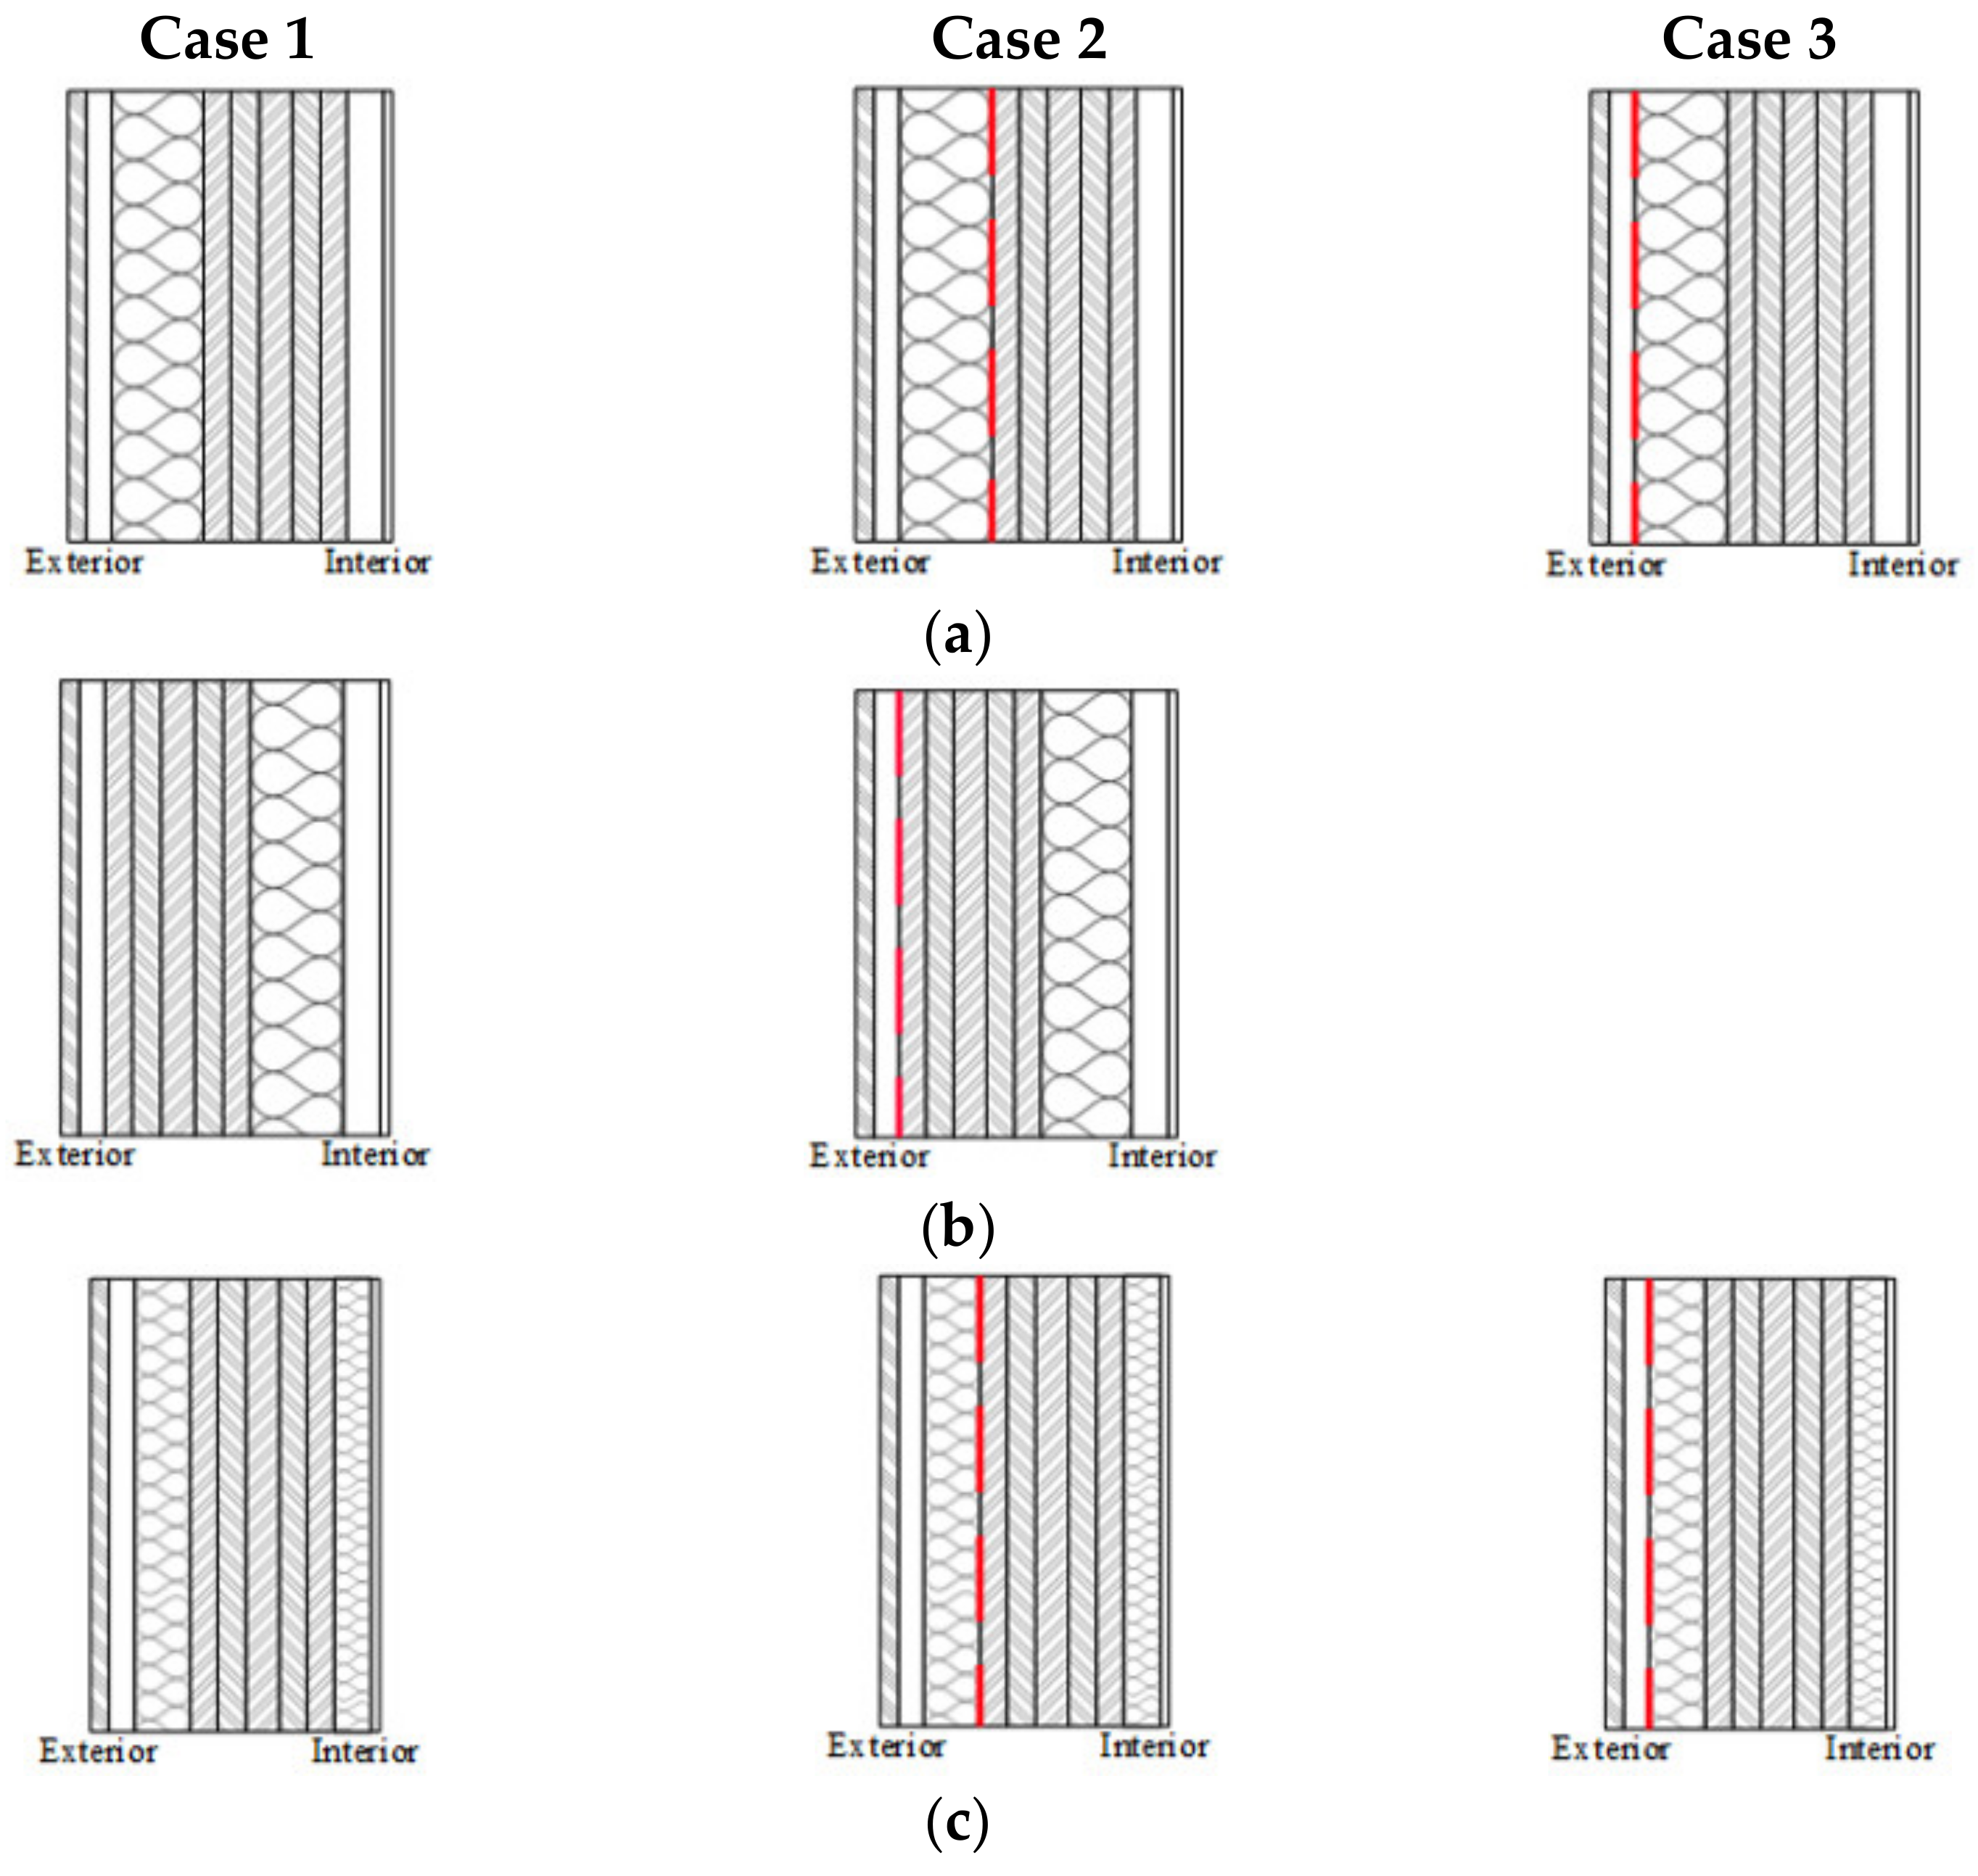
- Three insulation locations: external insulation, internal insulation, and split insulation.
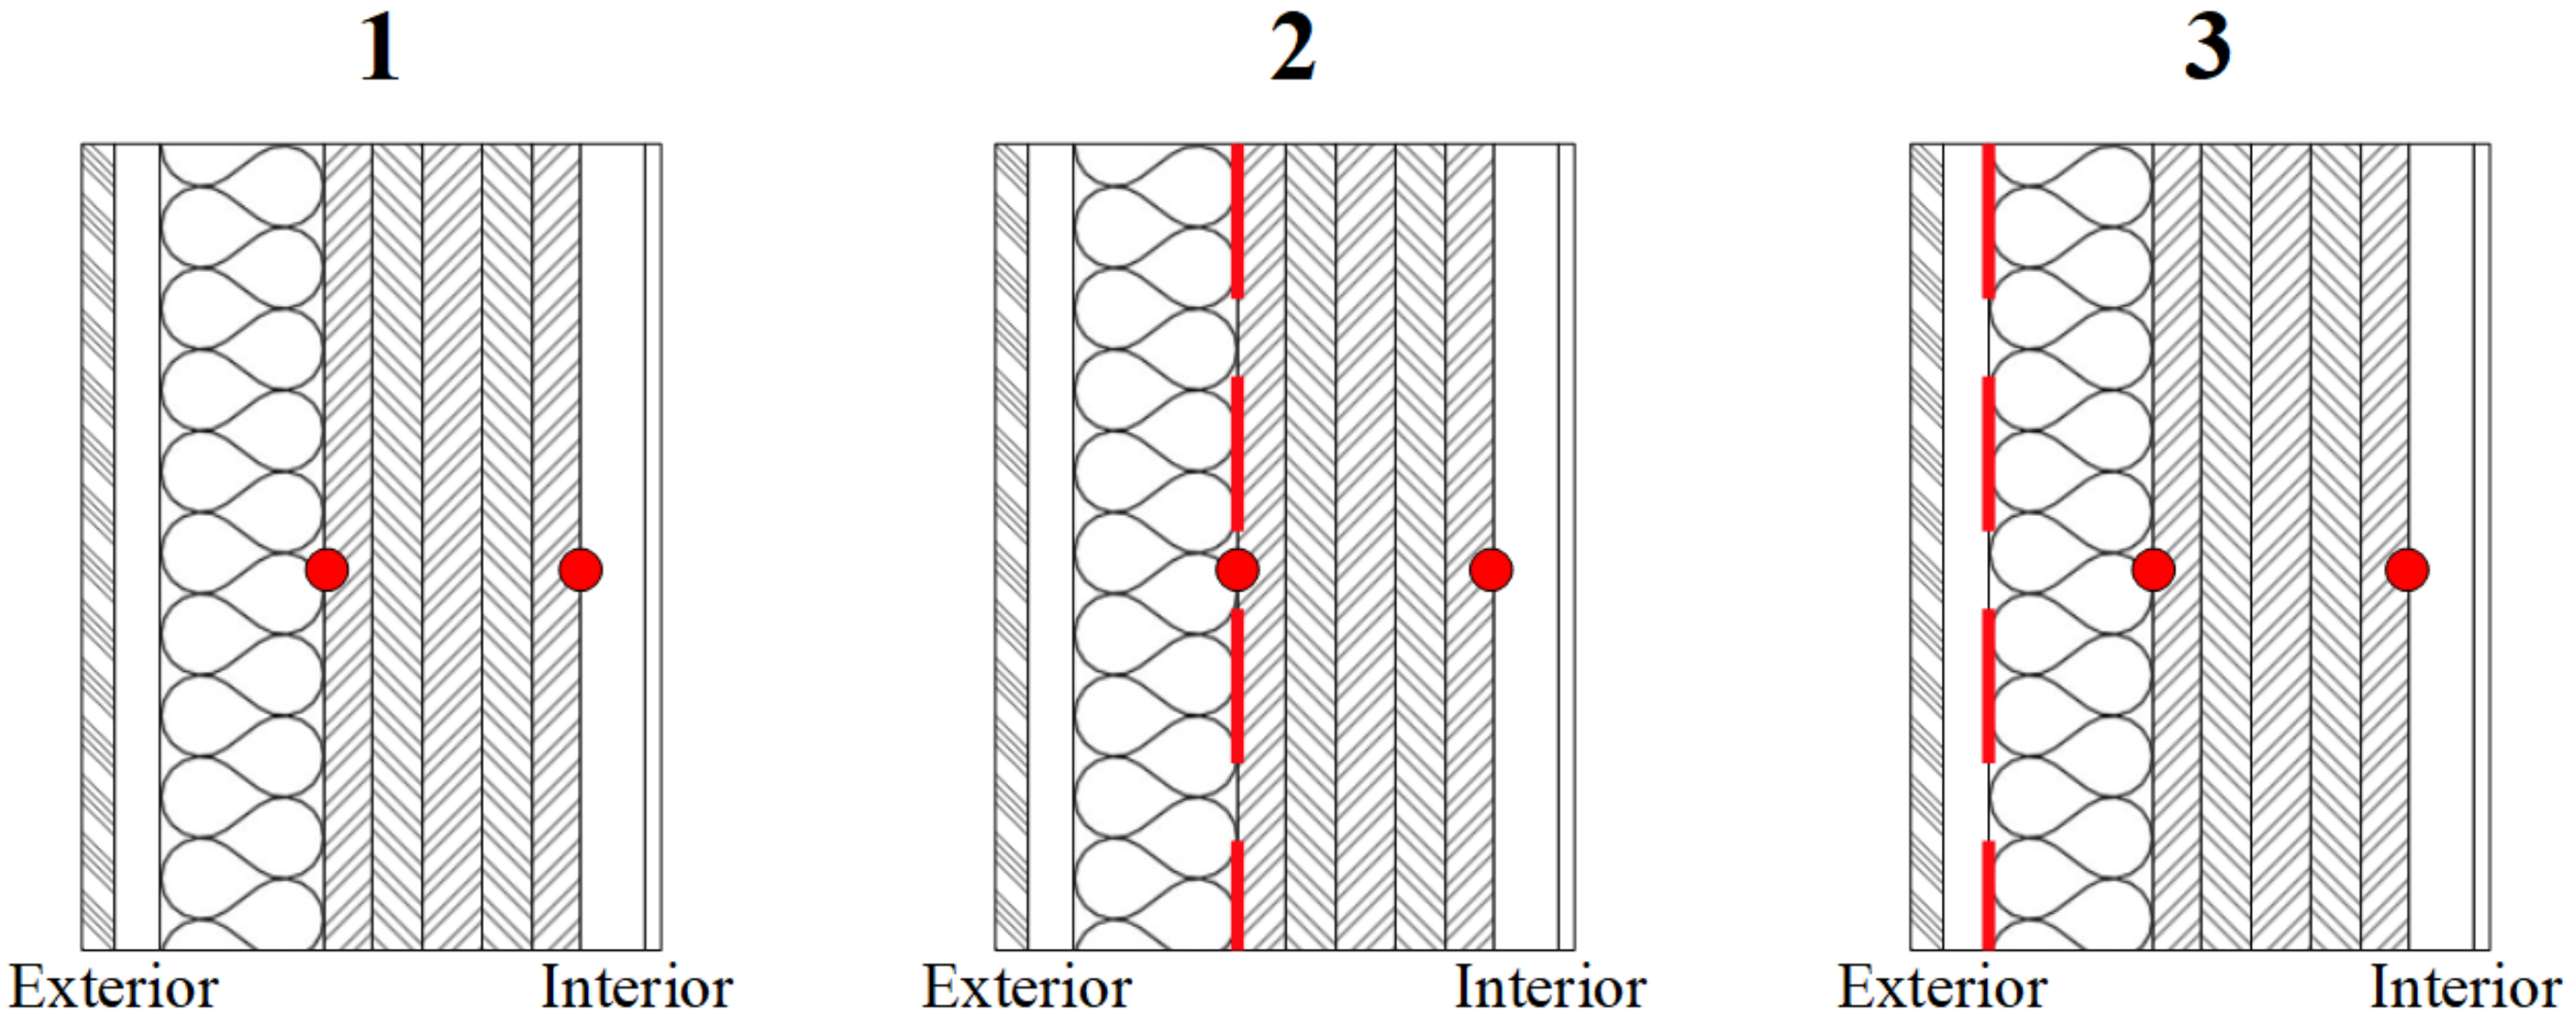
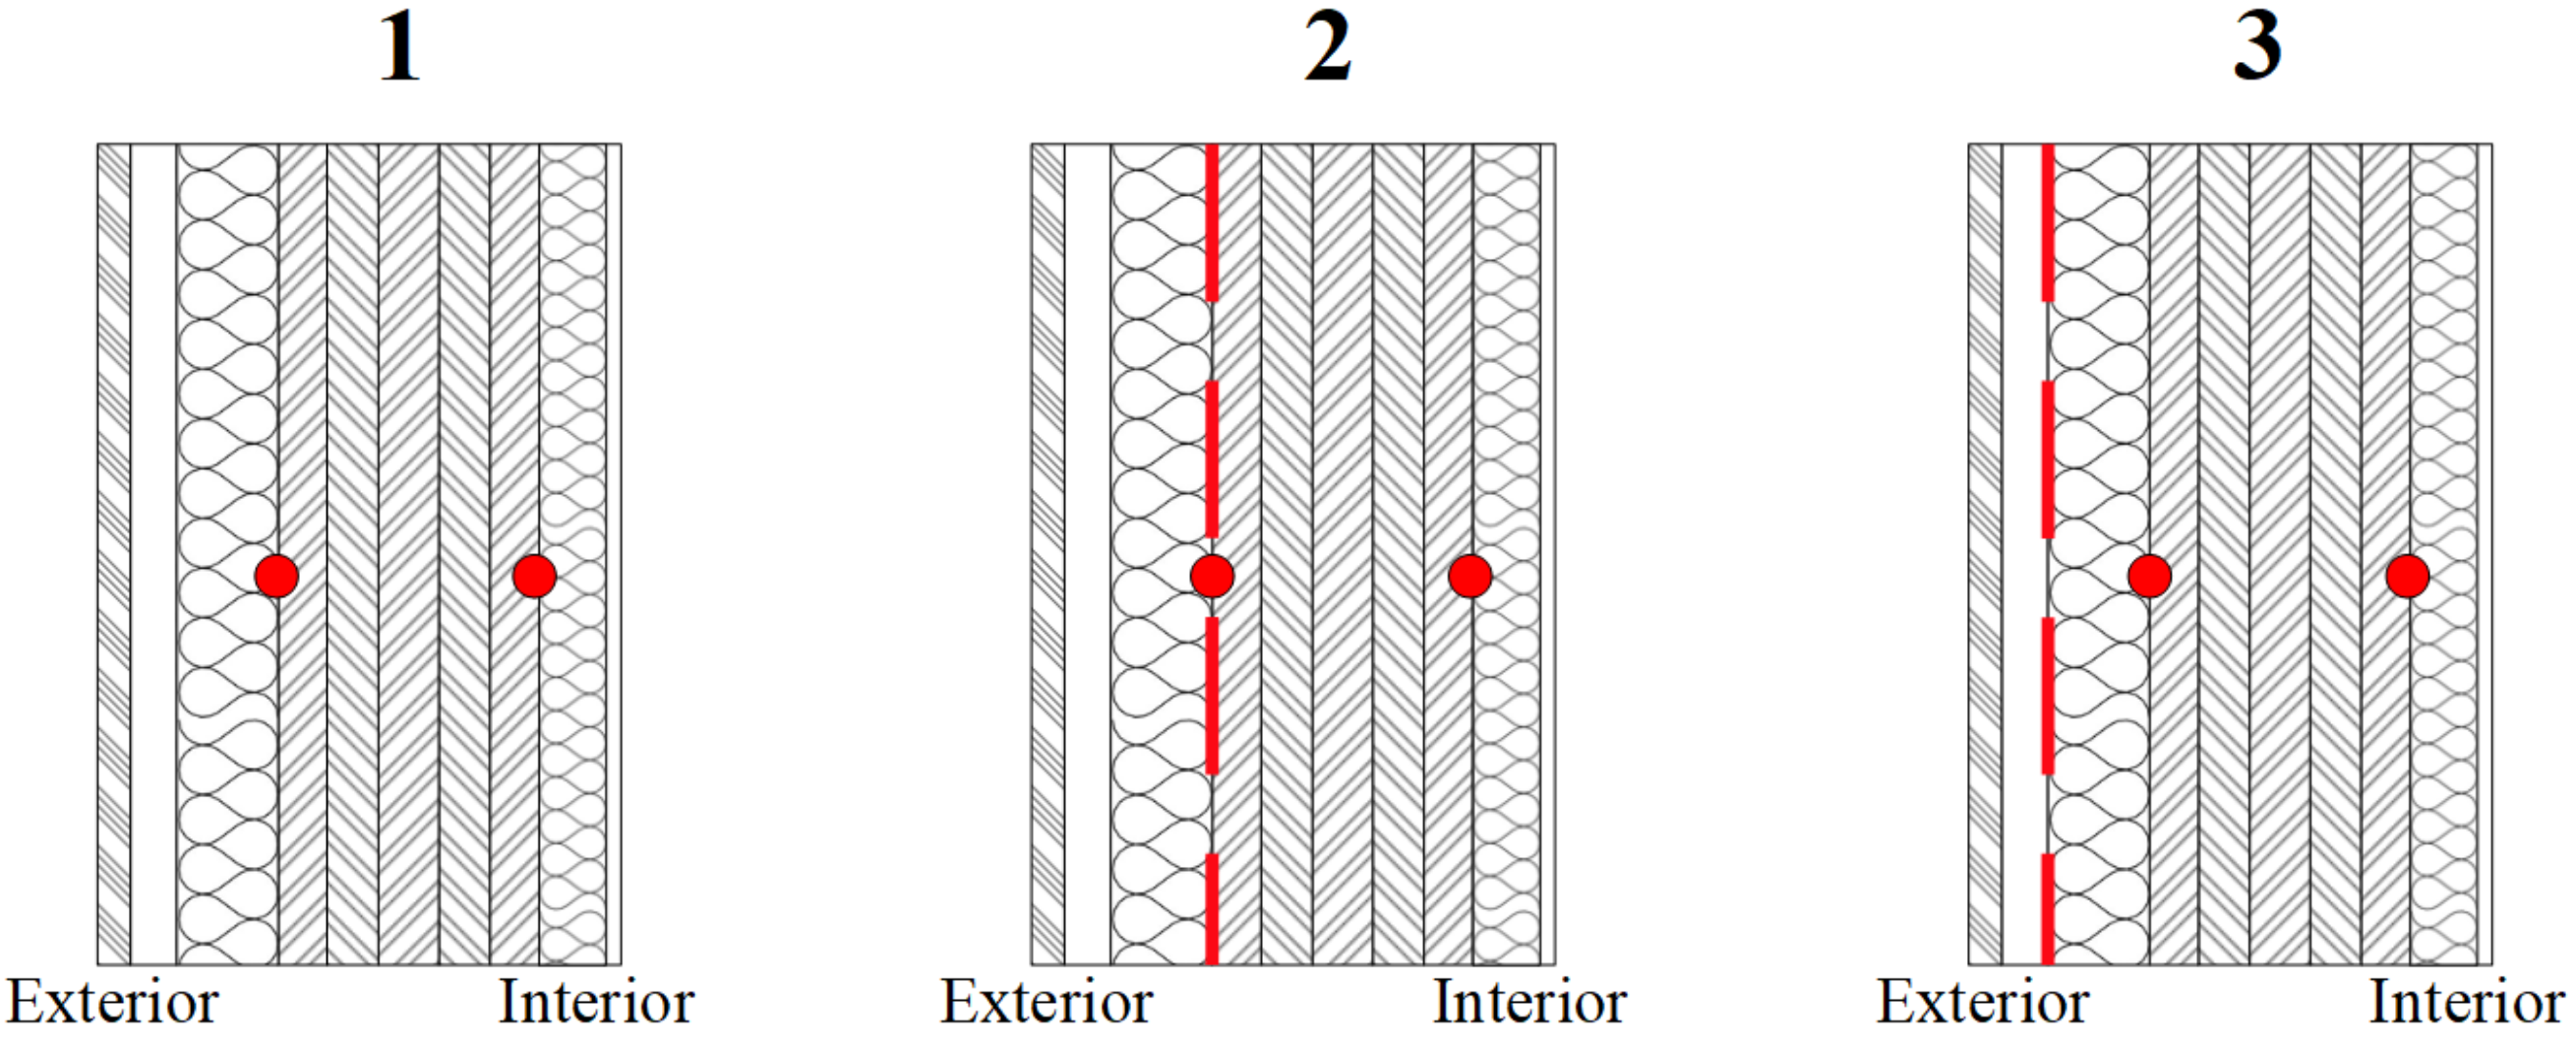
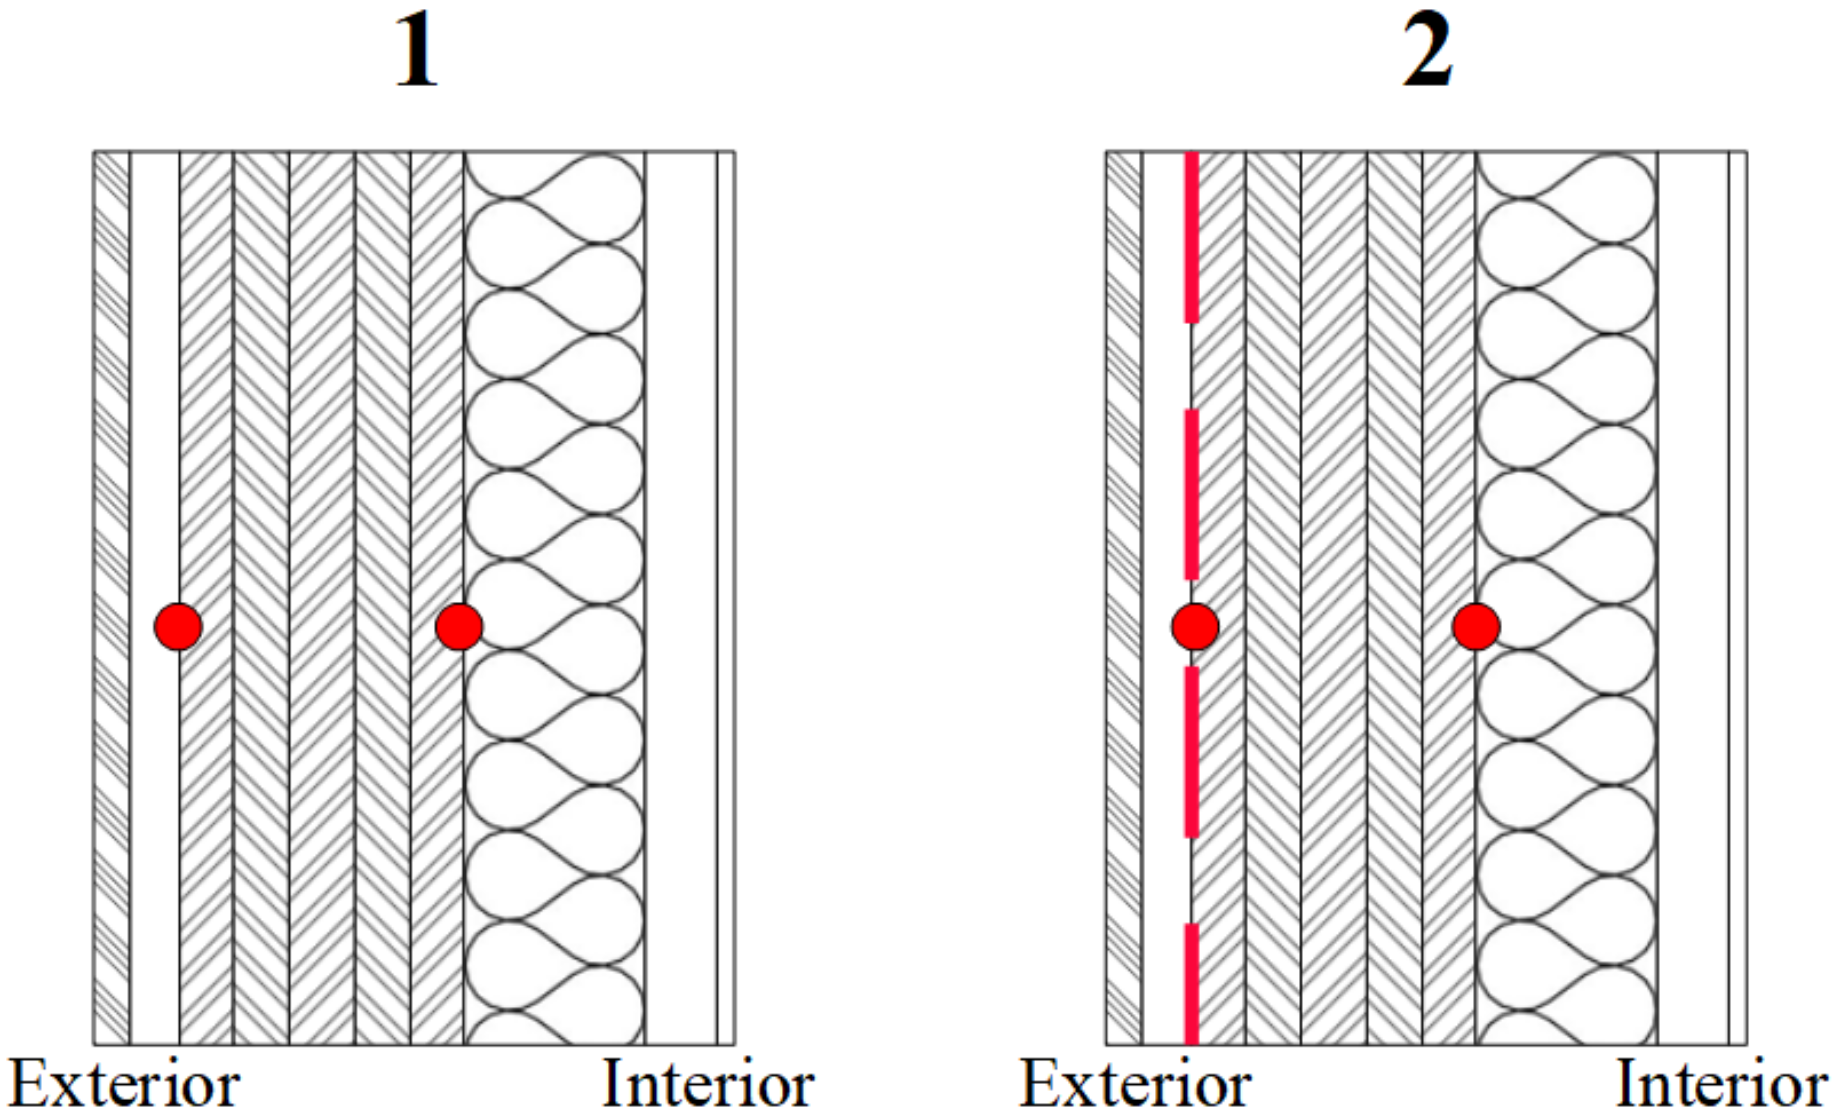
- Three cases WRB locations: Case 1 has no WRB, Case 2 has a WRB adhered to the exterior of the CLT panel, and Case 3 has the WRB located on the exterior of the insulation layer.
- Three types of insulation products have been assessed: mineral wool, EPS, and wood fibre.
- Three classes of WRB have been assessed with different vapour permeance: Classes 2, 3, and 4.
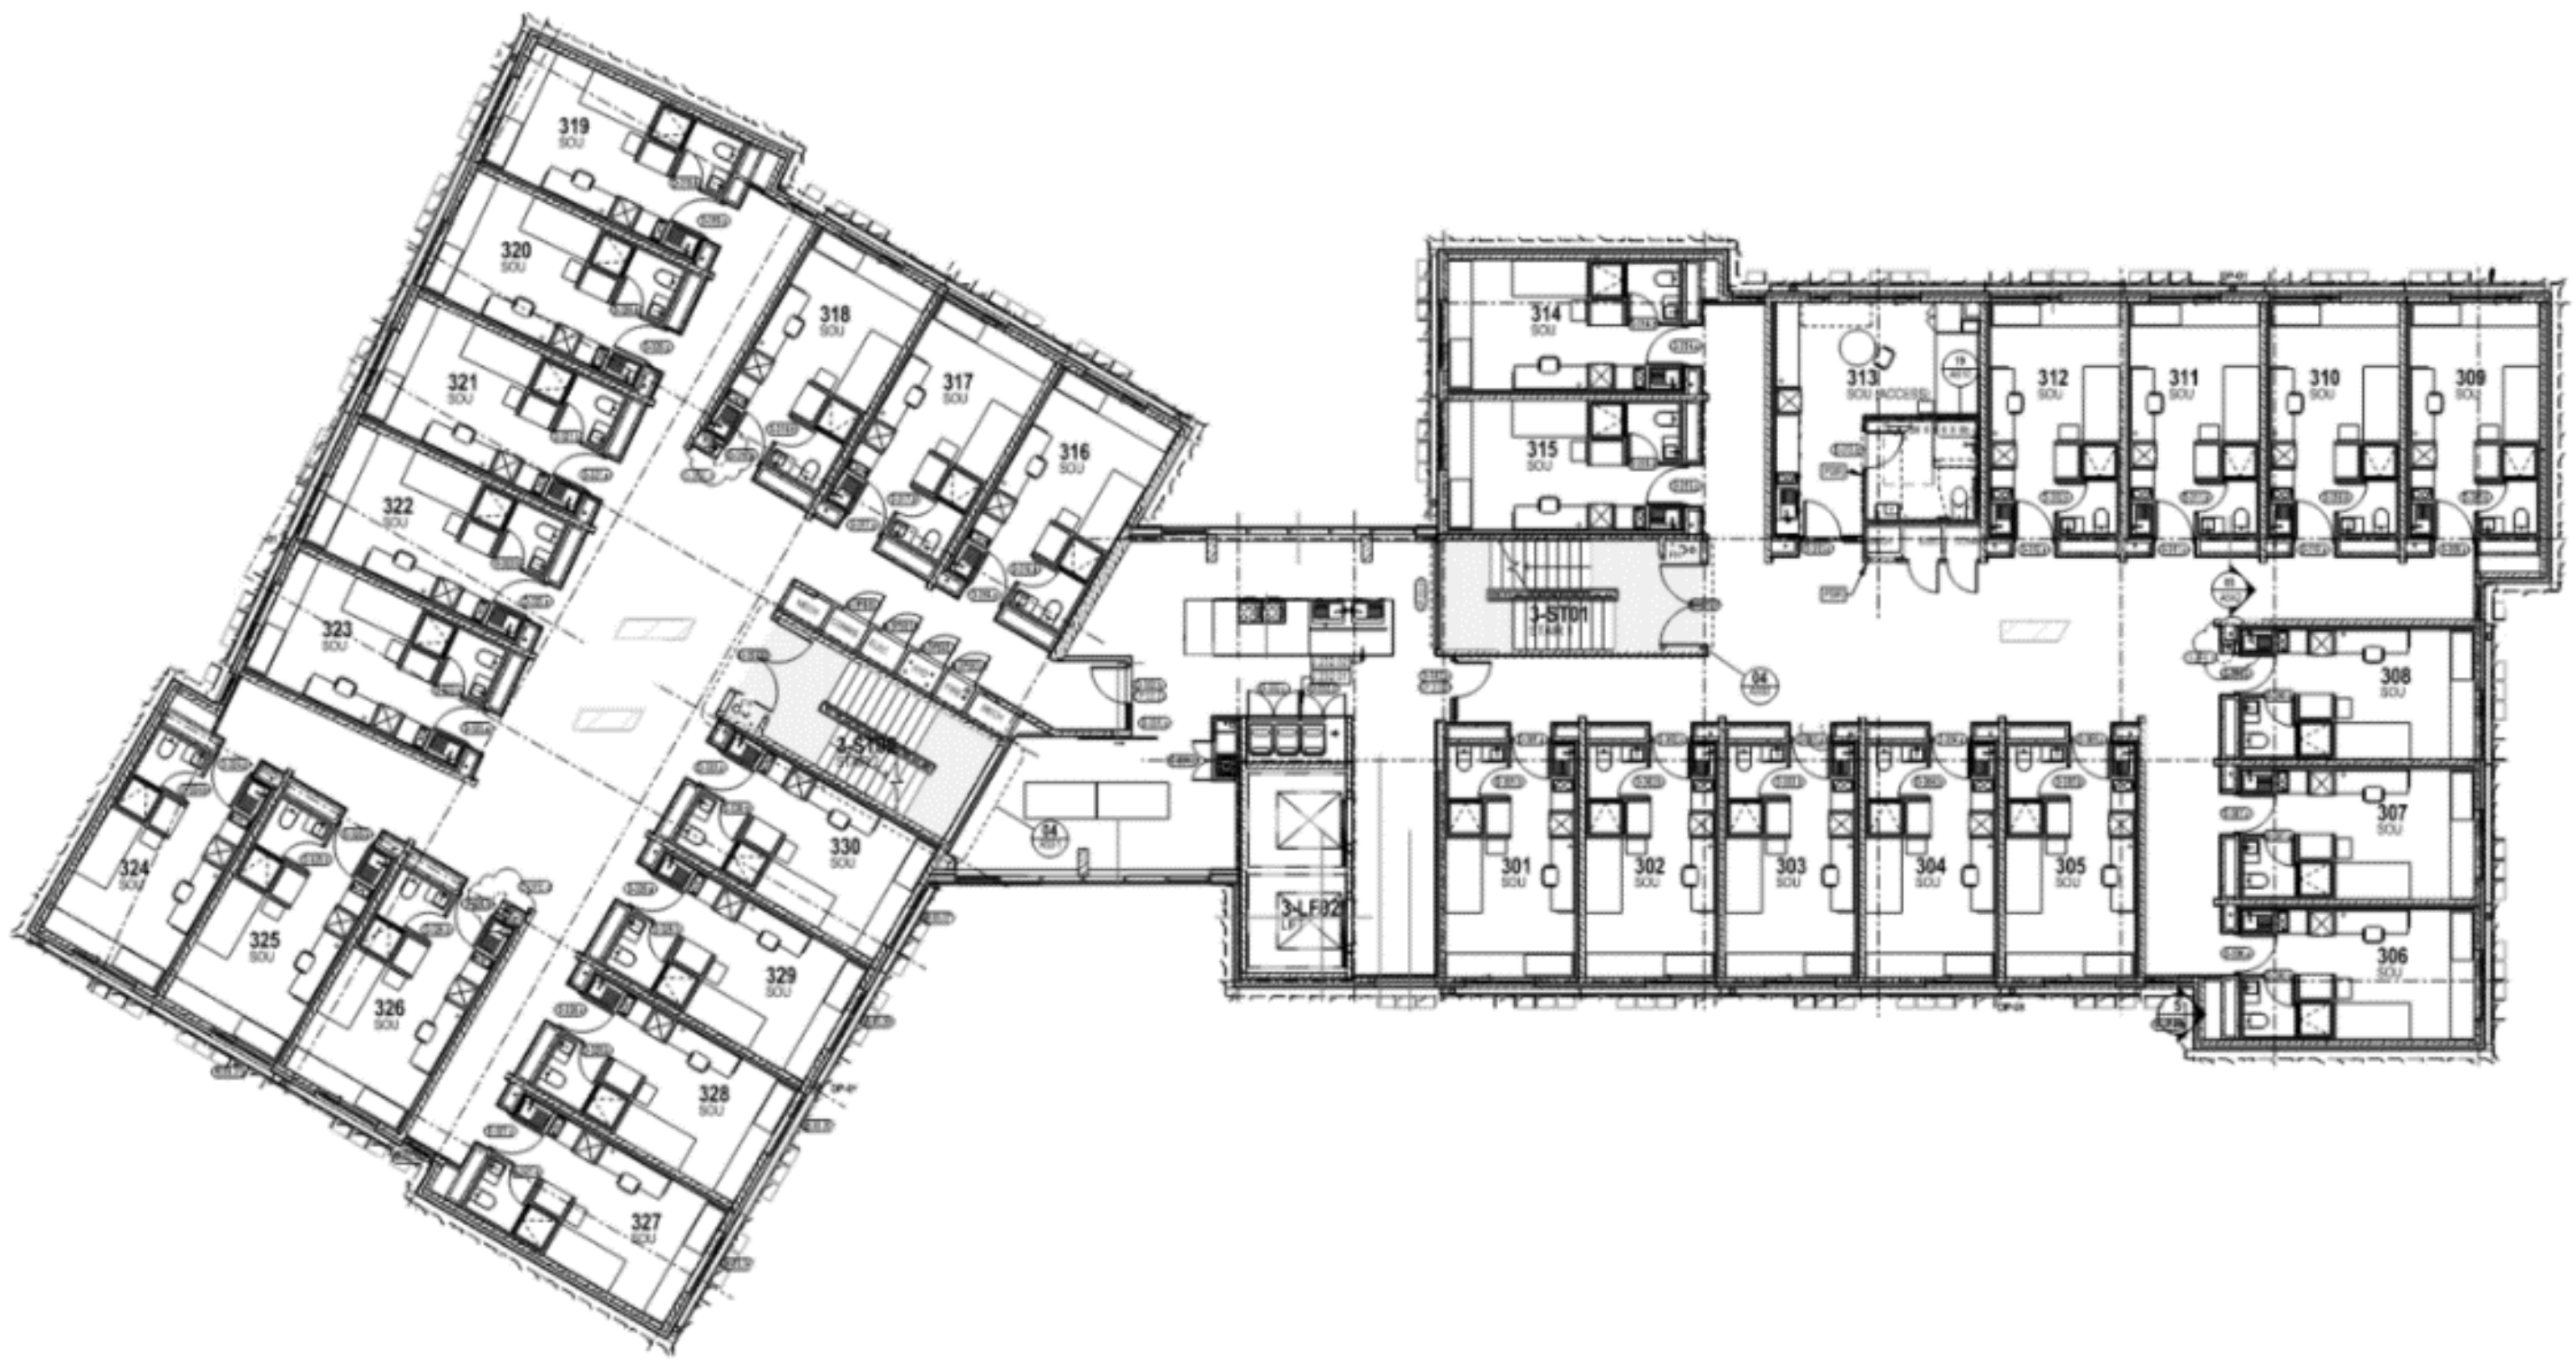
4.1. Identification of a Suitable Case-Study
4.2. Input Data and Assumptions
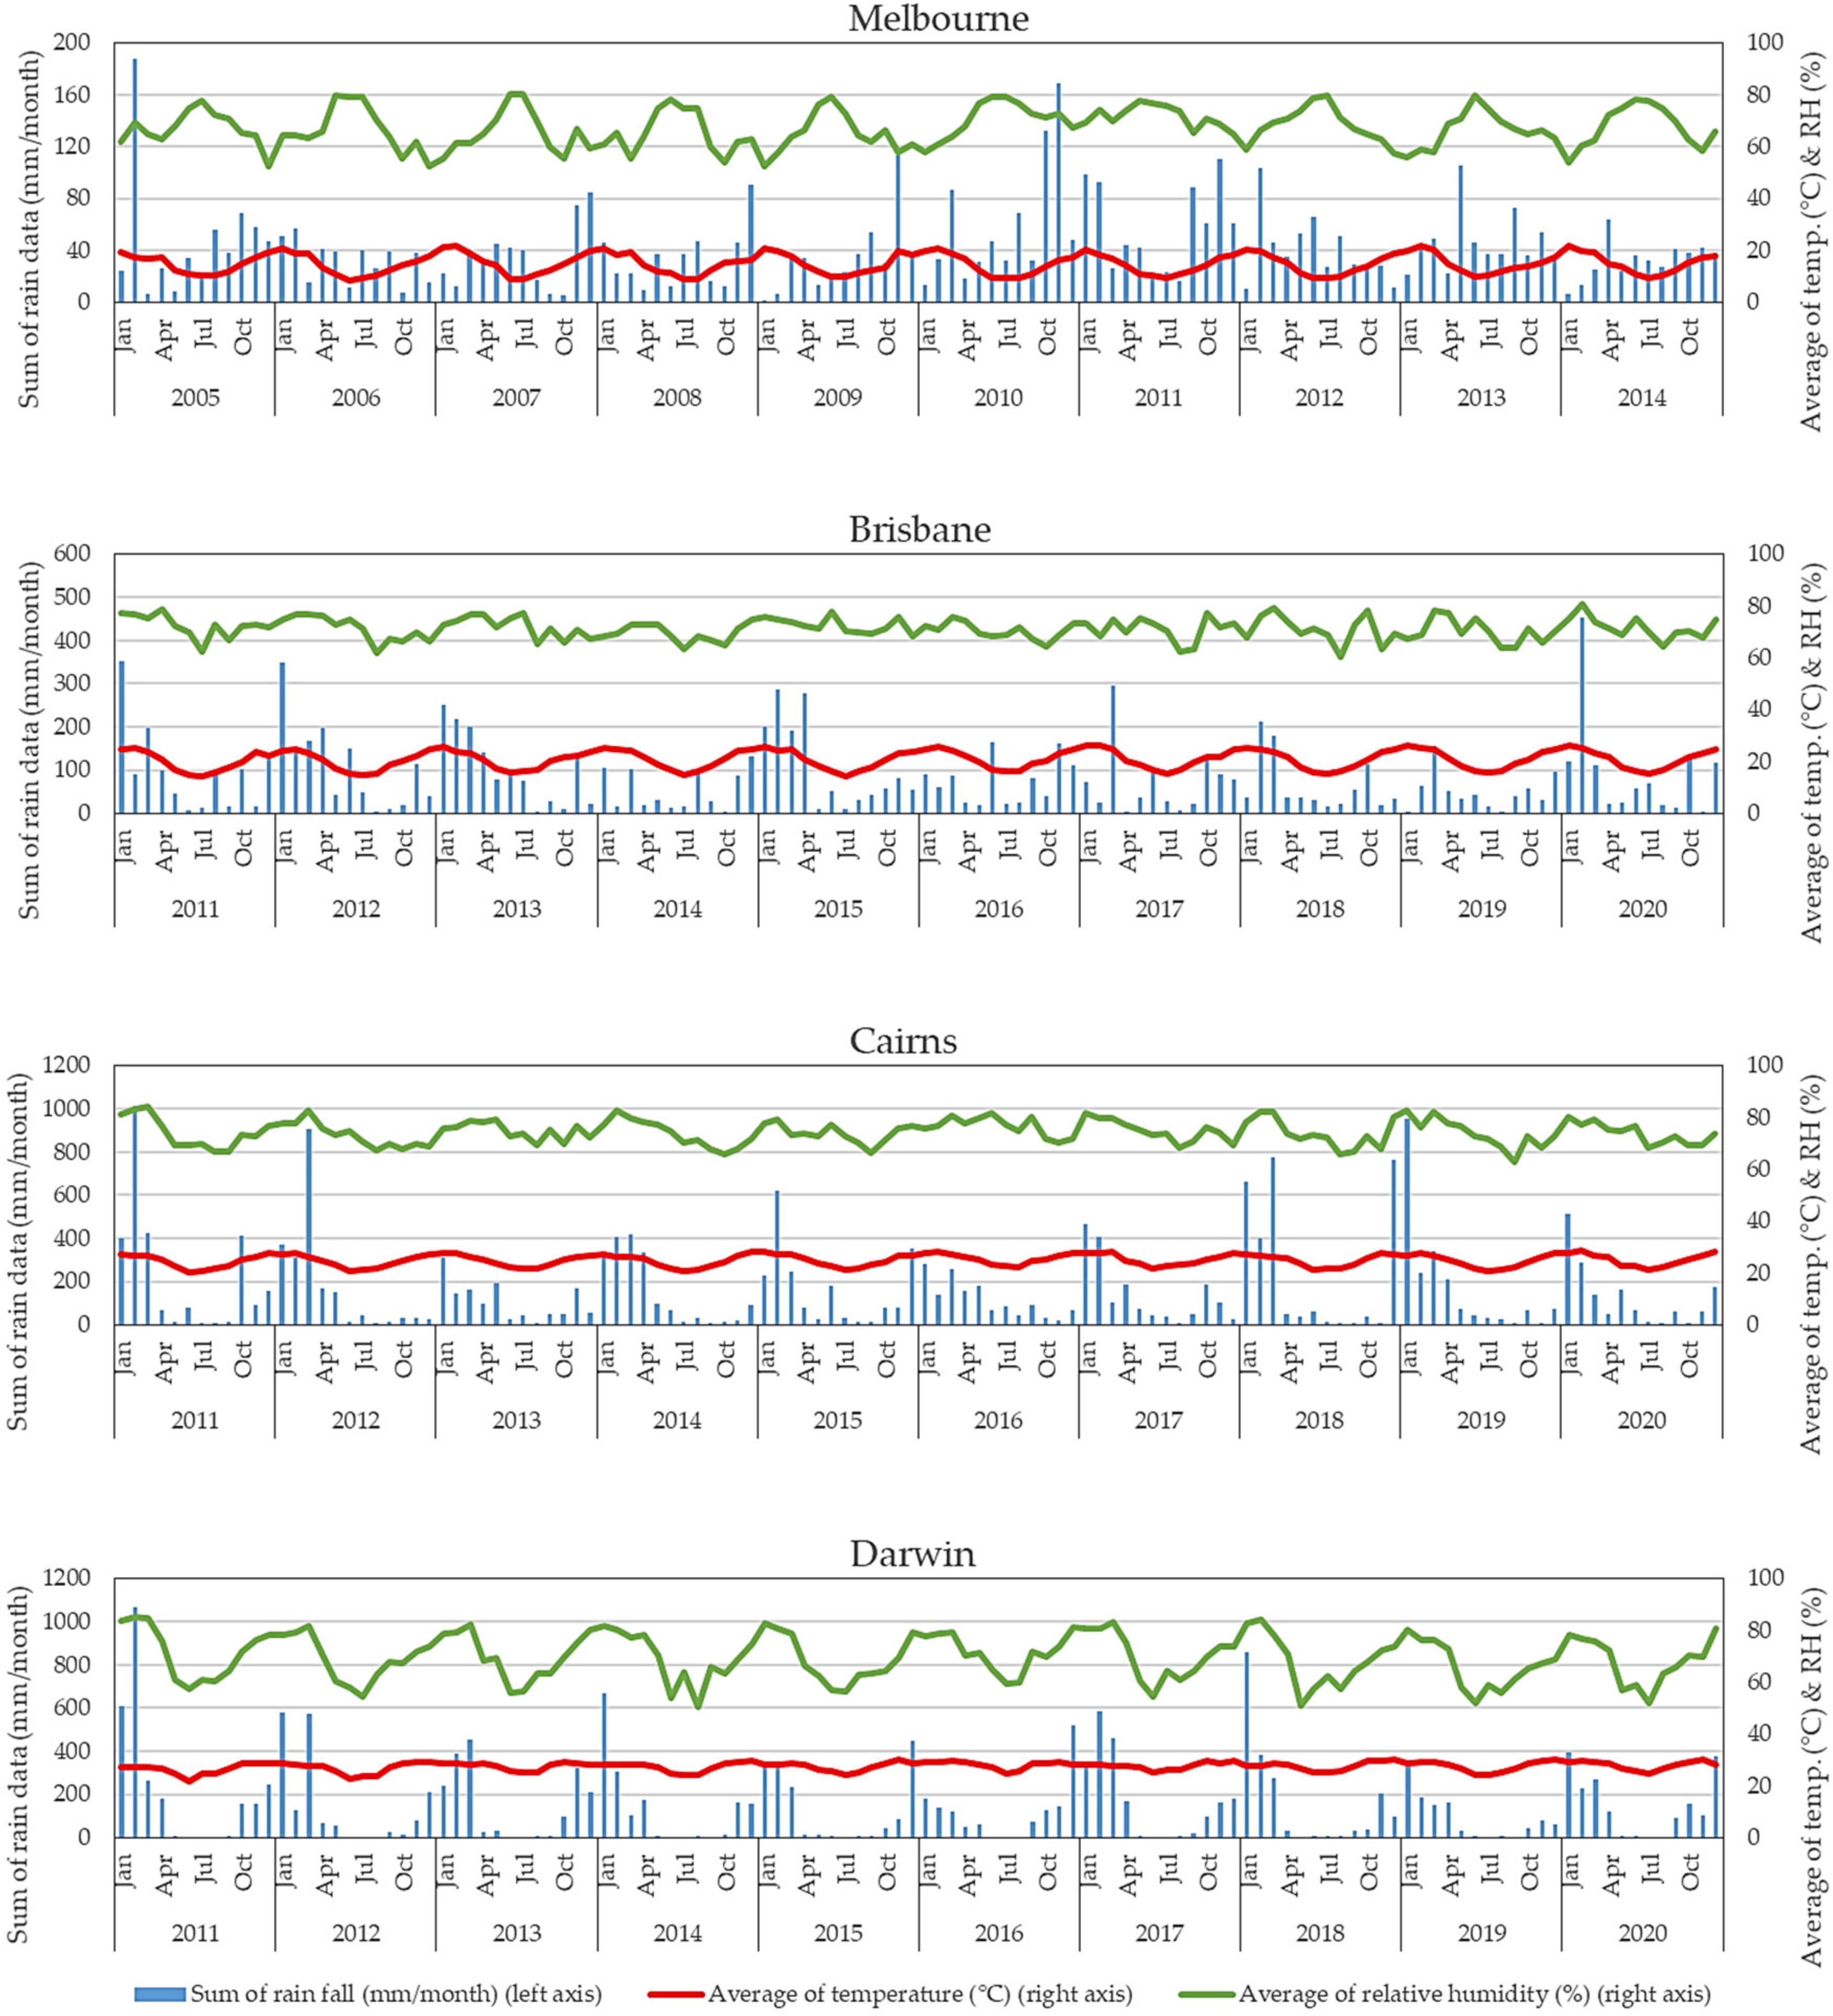
4.2.1. Outdoor Climate and Orientation
4.2.2. Indoor Conditions
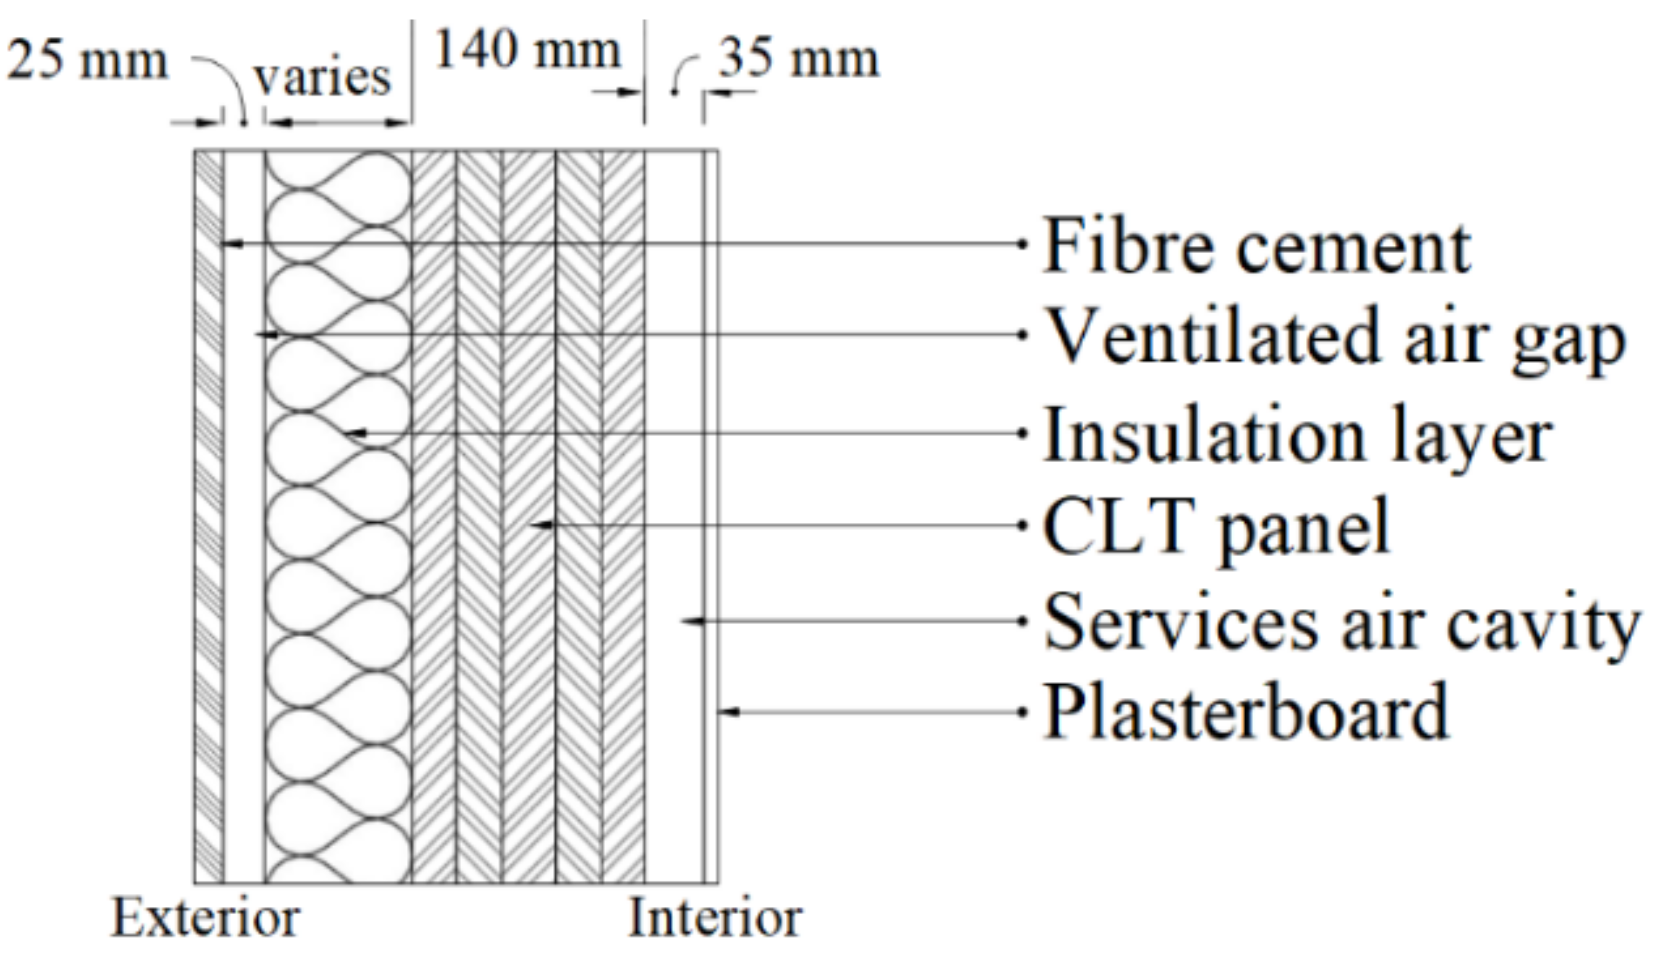
4.2.3. Envelope Performance
4.2.4. Material Properties
4.2.5. Surface Boundaries and Initial Conditions
4.3. Moisture-Safety Criteria
5. Results and Discussion
5.1. External Insulation Cases
5.2. Split Insulation Cases
5.3. Internal Insulation Cases
6. Recommendations
6.1. Tropical Climate Zones Construction Solutions
- Exterior insulation can be used in these climates; however, it is recommended that either vapour impermeable insulation or a WRB with high vapour resistance is installed externally to avoid mould growth on the external surface of the CLT panel. It is critical that they are only installed over dry CLT panels, while the WRB also functions as an airtightness control layer (refer to Table 8 and Table 9).
- Internal insulation can perform well in hot and humid climates. The use of a WRB with high vapour resistance on the external side of the CLT panel is required to reduce the amount of moisture moving into the assembly. Again, it is highly recommended to install the impermeable membrane only over dry CLT panels, and that the WRB also functions as an airtightness control layer (refer to Table 10 and Table 11).
- Vapour impermeable insulation or internal finishes installed internally should be avoided. This is because moisture that ingresses into the assembly, may accumulate without a path to dry out in the internal direction.
- Before installing assembly materials externally with high vapour resistance, it should be ensured that the CLT panels are dry.
- The use of drained and ventilated non-absorptive rainscreen cladding is highly recommended.
6.2. Subtropical and Temperate Climate Zones Construction Solutions
- Internal insulation is generally not recommended particularly in temperate and cold climates, because controlling thermal bridging with internal insulation is complex and may not always be possible. Though internal insulation may be possible in subtropical climates with high vapour resistant WRBs (refer to Table 10 and Table 11).
- Vapour impermeable insulation or WRBs with high vapour resistance installed externally should be avoided. This is because moisture that ingresses into the assembly, may accumulate without a path to dry out in the external direction.
- The use of drained and ventilated non-absorptive rainscreen cladding is highly recommended.
- These strategies may allow for durable CLT wall construction without the need for surface treatment of the panels when combined with both good moisture management and PH standard levels of airtightness, and mechanically controlled ventilation (with energy recovery and dehumidification where appropriate). In addition, they align with principals for low-energy buildings, resulting in high occupant comfort and indoor environmental quality.
6.3. Design-Phase Recommendations
6.4. Construction-Phase Recommendations
7. Limitations
8. Conclusions
Author Contributions
Funding
Institutional Review Board Statement
Informed Consent Statement
Data Availability Statement
Conflicts of Interest
Appendix A. Summary of Protected CLT Results

| Performance Criteria | Critical Surface | |||||||||||||||||||||||||||||||||
| Protected Case 1 | Mineral Wool | EPS | Wood Fibre | Mineral Wool | EPS | Wood Fibre | ||||||||||||||||||||||||||||
| No WRB | No WRB | No WRB | No | No | No | |||||||||||||||||||||||||||||
| Climate | O | A | B | A | B | A | B | WRB | WRB | WRB | ||||||||||||||||||||||||
| Cairns | N | 0.78 | 3.9 | 0.15 | 1.9 | 0.65 | 3.8 | Ext. | Ext. | Ext. | ||||||||||||||||||||||||
| S | 3.76 | 42.9 | 0.47 | 3.19 | 3.56 | 43.6 | Ext. | Ext. | Ext. | |||||||||||||||||||||||||
| Darwin | N | 2.73 | 29.9 | 0.55 | 2.7 | 3.24 | 24.6 | Ext. | Ext. | Ext. | ||||||||||||||||||||||||
| S | 1.45 | 22.5 | 0.3 | 2.7 | 1.24 | 12.7 | Ext. | Ext. | Ext. | |||||||||||||||||||||||||
| Brisbane | N | 0.14 | 0 | 0.03 | 0 | 0.07 | 0 | Ext. | - | - | ||||||||||||||||||||||||
| S | 0.31 | 1.5 | 0.07 | 0.3 | 0.2 | 0.6 | Ext. | Ext. | Ext. | |||||||||||||||||||||||||
| Melbourne | N | 0 | 0 | 0 | 0 | 0.01 | 0 | Ext. | - | - | ||||||||||||||||||||||||
| S | 0.06 | 0 | 0 | 0 | 0 | 0 | Ext. | - | - | |||||||||||||||||||||||||
| Protected Case 2 | Mineral Wool | EPS | Wood Fibre | Mineral Wool | EPS | Wood Fibre | ||||||||||||||||||||||||||||
| Class 2 | Class 3 | Class 4 | Class 2 | Class 3 | Class 4 | Class 2 | Class 3 | Class 4 | Cla. | Cla. | Cla. | Cla. | Cla. | Cla. | Cla. | Cla. | Cla. | |||||||||||||||||
| Climate | O | A | B | A | B | A | B | A | B | A | B | A | B | A | B | A | B | A | B | 2 | 3 | 4 | 2 | 3 | 4 | 2 | 3 | 4 | ||||||
| Cairns | N | 0.06 | 1.1 | 0.48 | 2.7 | 0.68 | 3.8 | 0.15 | 1.9 | 0.12 | 1.8 | 0.15 | 1.9 | 0.61 | 3.6 | 0.47 | 2.9 | 0.61 | 3.6 | Ext. | Ext. | Ext. | Ext. | Ext. | Ext. | Ext. | Ext. | Ext. | ||||||
| S | 0.66 | 8.9 | 2.2 | 34.4 | 3.39 | 41.5 | 0.27 | 2.9 | 0.41 | 3.1 | 0.46 | 3.1 | 0.71 | 14.4 | 2.25 | 35.5 | 3.27 | 42.5 | Ext. | Ext. | Ext. | Ext. | Ext. | Ext. | Ext. | Ext. | Ext. | |||||||
| Darwin | N | 0.75 | 3 | 1.54 | 14.6 | 2.16 | 28.3 | 0.35 | 2.6 | 0.49 | 2.7 | 0.54 | 2.7 | 1 | 4.1 | 1.99 | 11.6 | 2.82 | 20.3 | Ext. | Ext. | Ext. | Ext. | Ext. | Ext. | Ext. | Ext. | Ext. | ||||||
| S | 0.46 | 2.9 | 1.02 | 9.2 | 1.34 | 18.2 | 0.1 | 1.6 | 0.25 | 2.6 | 0.29 | 2.7 | 0.46 | 3.3 | 0.91 | 3.4 | 1.16 | 11.1 | Ext. | Ext. | Ext. | Ext. | Ext. | Ext. | Ext. | Ext. | Ext. | |||||||
| Brisbane | N | 0.03 | 0 | 0.05 | 0 | 0.08 | 0 | 0.01 | 0 | 0.03 | 0 | 0.03 | 0 | 0.03 | 0 | 0.06 | 0.1 | 0.07 | 0.1 | Ext. | Ext. | Ext. | - | - | - | - | Ext. | Ext. | ||||||
| S | 0.08 | 0.4 | 0.14 | 0.4 | 0.23 | 1 | 0.04 | 0.1 | 0.06 | 0.3 | 0.07 | 0.3 | 0.09 | 0.6 | 0.16 | 0.7 | 0.19 | 0.6 | Ext. | Ext. | Ext. | Ext. | Ext. | Ext. | Ext. | Ext. | Ext. | |||||||
| Melbourne | N | 0 | 0 | 0 | 0 | 0 | 0 | 0 | 0 | 0 | 0 | 0 | 0 | 0 | 0 | 0.01 | 0 | 0.01 | 0 | Ext. | Ext. | Ext. | - | - | - | - | - | - | ||||||
| S | 0 | 0 | 0.01 | 0 | 0.04 | 0 | 0 | 0 | 0 | 0 | 0 | 0 | 0 | 0 | 0 | 0 | 0 | 0 | Ext. | Ext. | Ext. | - | - | - | - | - | - | |||||||
| Performance Criteria | Critical Surface | |||||||||||||||||||||||||||||||||
| Protected Case 3 | Mineral Wool | EPS | Wood Fibre | Mineral Wool | EPS | Wood Fibre | ||||||||||||||||||||||||||||
| Class 2 | Class 3 | Class 4 | Class 2 | Class 3 | Class 4 | Class 2 | Class 3 | Class 4 | Cla. | Cla. | Cla. | Cla. | Cla. | Cla. | Cla. | Cla. | Cla. | |||||||||||||||||
| Climate | O | A | B | A | B | A | B | A | B | A | B | A | B | A | B | A | B | A | B | 2 | 3 | 4 | 2 | 3 | 4 | 2 | 3 | 4 | ||||||
| Cairns | N | 0.18 | 2 | 0.47 | 2.2 | 0.65 | 3.6 | 0.05 | 0.9 | 0.17 | 1.9 | 0.2 | 2 | 0.31 | 2.8 | 0.47 | 2.5 | 0.59 | 3.2 | Ext. | Ext. | Ext. | Ext. | Ext. | Ext. | Ext. | Ext. | Ext. | ||||||
| S | 0.56 | 4.9 | 1.52 | 32.4 | 2.95 | 40 | 0.34 | 3.1 | 0.51 | 3.6 | 0.58 | 5.1 | 0.53 | 3.4 | 1.04 | 26.3 | 2.1 | 37.3 | Ext. | Ext. | Ext. | Ext. | Ext. | Ext. | Ext. | Ext. | Ext. | |||||||
| Darwin | N | 0.73 | 2.8 | 1.48 | 14.9 | 2.01 | 28.9 | 0.4 | 2.6 | 0.56 | 2.8 | 0.62 | 2.8 | 0.82 | 3.6 | 1.33 | 8.3 | 1.72 | 19.4 | Ext. | Ext. | Ext. | Ext. | Ext. | Ext. | Ext. | Ext. | Ext. | ||||||
| S | 0.4 | 2.8 | 0.93 | 10.1 | 1.22 | 20.8 | 0.17 | 2.4 | 0.3 | 2.7 | 0.35 | 2.8 | 0.43 | 2.8 | 0.79 | 3 | 1.04 | 10.9 | Ext. | Ext. | Ext. | Ext. | Ext. | Ext. | Ext. | Ext. | Ext. | |||||||
| Brisbane | N | 0.03 | 0 | 0.04 | 0 | 0.06 | 0 | 0.01 | 0 | 0.03 | 0 | 0.03 | 0 | 0.07 | 0.3 | 0.07 | 0.2 | 0.07 | 0.1 | Ext. | Ext. | Ext. | - | - | - | Ext. | Ext. | Ext. | ||||||
| S | 0.12 | 0.4 | 0.2 | 0.7 | 0.31 | 1.3 | 0.06 | 0.3 | 0.08 | 0.4 | 0.08 | 0.4 | 0.13 | 0.8 | 0.17 | 0.8 | 0.21 | 0.7 | Ext. | Ext. | Ext. | Ext. | Ext. | Ext. | Ext. | Ext. | Ext. | |||||||
| Melbourne | N | 0.01 | 0 | 0 | 0 | 0 | 0 | 0 | 0 | 0 | 0 | 0 | 0 | 0.06 | 0.3 | 0.02 | 0 | 0.02 | 0 | Ext. | Ext. | Ext. | - | - | - | Ext. | - | - | ||||||
| S | 0 | 0 | 0 | 0 | 0.01 | 0 | 0 | 0 | 0 | 0 | 0 | 0 | 0.02 | 0 | 0.01 | 0 | 0 | 0 | Ext. | Ext. | Ext. | - | - | - | - | - | - | |||||||
| Protected Case 1 | Mineral Wool | EPS | Wood Fibre | Mineral Wool | EPS | Wood Fibre | ||||||||||||||||||||||||||||
| No WRB | No WRB | No WRB | No | No | No | |||||||||||||||||||||||||||||
| Climate | O | A | B | A | B | A | B | WRB | WRB | WRB | ||||||||||||||||||||||||
| Cairns | N | 0.53 | 3 | 0.1 | 0.7 | 0.49 | 3.2 | Ext. | Ext. | Ext. | ||||||||||||||||||||||||
| S | 3.86 | 35.6 | 0.55 | 6.9 | 3.98 | 38.3 | Ext. | Ext. | Ext. | |||||||||||||||||||||||||
| Darwin | N | 2.15 | 15.2 | 0.68 | 2.6 | 3.71 | 15.4 | Ext. | Ext. | Ext. | ||||||||||||||||||||||||
| S | 1.15 | 8.1 | 0.27 | 2.5 | 1.11 | 7.2 | Ext. | Ext. | Ext. | |||||||||||||||||||||||||
| Brisbane | N | 0.18 | 0 | 0.03 | 0 | 0.08 | 0 | Ext. | - | - | ||||||||||||||||||||||||
| S | 0.4 | 1.7 | 0.07 | 0.2 | 0.19 | 0.5 | Ext. | Ext. | Ext. | |||||||||||||||||||||||||
| Melbourne | N | 0 | 0 | 0 | 0 | 0 | 0 | Ext. | - | - | ||||||||||||||||||||||||
| S | 0.27 | 20.2 | 0 | 0 | 0.01 | 0 | Int. | - | - | |||||||||||||||||||||||||
| Protected Case 2 | Mineral Wool | EPS | Wood Fibre | Mineral Wool | EPS | Wood Fibre | ||||||||||||||||||||||||||||
| Class 2 | Class 3 | Class 4 | Class 2 | Class 3 | Class 4 | Class 2 | Class 3 | Class 4 | Cla. | Cla. | Cla. | Cla. | Cla. | Cla. | Cla. | Cla. | Cla. | |||||||||||||||||
| Climate | O | A | B | A | B | A | B | A | B | A | B | A | B | A | B | A | B | A | B | 2 | 3 | 4 | 2 | 3 | 4 | 2 | 3 | 4 | ||||||
| Cairns | N | 0.43 | 2.8 | 0.28 | 1.8 | 0.43 | 2.8 | 0.09 | 0.6 | 0.05 | 0 | 0.09 | 0.6 | 0.44 | 3 | 0.32 | 2 | 0.44 | 3 | Ext. | Ext. | Ext. | Ext. | - | Ext. | Ext. | Ext. | Ext. | ||||||
| S | 0.5 | 3.9 | 1.65 | 27.5 | 3.28 | 34.6 | 0.22 | 2.4 | 0.44 | 3.1 | 0.53 | 5.8 | 0.61 | 10.4 | 2.14 | 31.4 | 3.46 | 37.3 | Ext. | Ext. | Ext. | Ext. | Ext. | Ext. | Ext. | Ext. | Ext. | |||||||
| Darwin | N | 0.64 | 2.7 | 1.39 | 7.1 | 1.91 | 13.8 | 0.35 | 2.4 | 0.57 | 2.6 | 0.66 | 2.6 | 0.91 | 3.5 | 1.87 | 8.2 | 2.93 | 14.2 | Ext. | Ext. | Ext. | Ext. | Ext. | Ext. | Ext. | Ext. | Ext. | ||||||
| S | 0.27 | 2.1 | 0.71 | 2.6 | 1.05 | 6.6 | 0.02 | 0 | 0.2 | 2.2 | 0.26 | 2.5 | 0.31 | 2.9 | 0.74 | 2.9 | 1.03 | 5.5 | Ext. | Ext. | Ext. | - | Ext. | Ext. | Ext. | Ext. | Ext. | |||||||
| Brisbane | N | 0 | 0 | 0.03 | 0 | 0.1 | 0 | 0 | 0 | 0.02 | 0 | 0.03 | 0 | 0.01 | 0 | 0.04 | 0 | 0.05 | 0 | Ext. | Ext. | Ext. | - | - | - | - | - | - | ||||||
| S | 0.06 | 0.1 | 0.12 | 0.3 | 0.22 | 1.1 | 0.04 | 0 | 0.06 | 0.1 | 0.07 | 0.2 | 0.06 | 0.3 | 0.13 | 0.4 | 0.17 | 0.4 | Ext. | Ext. | Ext. | - | Ext. | Ext. | Ext. | Ext. | Ext. | |||||||
| Melbourne | N | 0 | 0 | 0 | 0 | 0 | 0 | 0 | 0 | 0 | 0 | 0 | 0 | 0 | 0 | 0 | 0 | 0 | 0 | Ext. | Ext. | Ext. | - | - | - | - | - | - | ||||||
| S | 0.28 | 20.6 | 0.02 | 0 | 0.27 | 19.9 | 0 | 0 | 0 | 0 | 0 | 0 | 0 | 0 | 0 | 0 | 0.01 | 0 | Int. | Ext. | Int. | - | - | - | - | - | - | |||||||
| Protected Case 3 | Mineral Wool | EPS | Wood Fibre | Mineral Wool | EPS | Wood Fibre | ||||||||||||||||||||||||||||
| Class 2 | Class 3 | Class 4 | Class 2 | Class 3 | Class 4 | Class 2 | Class 3 | Class 4 | Cla. | Cla. | Cla. | Cla. | Cla. | Cla. | Cla. | Cla. | Cla. | |||||||||||||||||
| Climate | O | A | B | A | B | A | B | A | B | A | B | A | B | A | B | A | B | A | B | 2 | 3 | 4 | 2 | 3 | 4 | 2 | 3 | 4 | ||||||
| Cairns | N | 0.06 | 0.2 | 0.26 | 1.9 | 0.41 | 2.4 | 0.02 | 0 | 0.11 | 1.4 | 0.17 | 1.7 | 0.13 | 1.2 | 0.28 | 2 | 0.42 | 2.3 | Ext. | Ext. | Ext. | - | Ext. | Ext. | Ext. | Ext. | Ext. | ||||||
| S | 0.43 | 3 | 1.24 | 25.3 | 2.81 | 33.8 | 0.33 | 3 | 0.58 | 8.4 | 0.71 | 14.3 | 0.42 | 3.1 | 1.05 | 23.1 | 2.29 | 34 | Ext. | Ext. | Ext. | Ext. | Ext. | Ext. | Ext. | Ext. | Ext. | |||||||
| Darwin | N | 0.6 | 2.6 | 1.3 | 6.3 | 1.79 | 14.2 | 0.42 | 2.5 | 0.66 | 2.6 | 0.79 | 2.7 | 0.64 | 2.9 | 1.24 | 4.6 | 1.68 | 13.4 | Ext. | Ext. | Ext. | Ext. | Ext. | Ext. | Ext. | Ext. | Ext. | ||||||
| S | 0.21 | 2.4 | 0.62 | 2.6 | 0.92 | 7.2 | 0.05 | 0.6 | 0.28 | 2.6 | 0.35 | 2.7 | 0.25 | 2.6 | 0.61 | 2.8 | 0.87 | 5.1 | Ext. | Ext. | Ext. | Ext. | Ext. | Ext. | Ext. | Ext. | Ext. | |||||||
| Brisbane | N | 0.01 | 0 | 0.03 | 0 | 0.05 | 0 | 0 | 0 | 0.01 | 0 | 0.02 | 0 | 0.03 | 0 | 0.04 | 0 | 0.05 | 0 | Ext. | Ext. | Ext. | - | - | - | - | - | - | ||||||
| S | 0.05 | 0.2 | 0.13 | 0.5 | 0.26 | 0.9 | 0.05 | 0.1 | 0.08 | 0.3 | 0.1 | 0.6 | 0.08 | 0.3 | 0.13 | 0.4 | 0.18 | 0.6 | Ext. | Ext. | Ext. | Ext. | Ext. | Ext. | Ext. | Ext. | Ext. | |||||||
| Melbourne | N | 0.01 | 0 | 0 | 0 | 0 | 0 | 0 | 0 | 0 | 0 | 0 | 0 | 0.04 | 0 | 0.02 | 0 | 0.01 | 0 | Ext. | Ext. | Ext. | - | - | - | - | - | - | ||||||
| S | 0.26 | 19.2 | 0.25 | 18.8 | 0.25 | 18.7 | 0 | 0 | 0 | 0 | 0 | 0 | 0.02 | 0 | 0.01 | 0 | 0 | 0 | Int. | Int. | Int. | - | - | - | - | - | - | |||||||
| Protected Case 1 | Mineral Wool | EPS | Wood Fibre | Mineral Wool | EPS | Wood Fibre | ||||||||||||||||||||||||||||
| No WRB | No WRB | No WRB | No | No | No | |||||||||||||||||||||||||||||
| Climate | O | A | B | A | B | A | B | WRB | WRB | WRB | ||||||||||||||||||||||||
| Cairns | N | 0.37 | 1.3 | 0.37 | 1.4 | 0.37 | 1.4 | Ext. | Ext. | Ext. | ||||||||||||||||||||||||
| S | 4.11 | 33.1 | 4.13 | 34.3 | 4.08 | 33 | Ext. | Ext. | Ext. | |||||||||||||||||||||||||
| Darwin | N | 1.84 | 8.4 | 1.82 | 8.6 | 1.85 | 8.4 | Ext. | Ext. | Ext. | ||||||||||||||||||||||||
| S | 0.62 | 1.9 | 0.61 | 1.8 | 0.62 | 1.9 | Ext. | Ext. | Ext. | |||||||||||||||||||||||||
| Brisbane | N | 0.2 | 0 | 0.2 | 0 | 0.2 | 0 | Ext. | - | - | ||||||||||||||||||||||||
| S | 0.5 | 6.7 | 0.51 | 3.8 | 0.49 | 3.6 | Both | Ext. | Ext. | |||||||||||||||||||||||||
| Melbourne | N | 0.12 | 3.5 | 0.02 | 0 | 0.02 | 0 | Int. | - | - | ||||||||||||||||||||||||
| S | 3.43 | 61.5 | 0.16 | 3 | 2.61 | 54.2 | Int. | Both | Int. | |||||||||||||||||||||||||
| Protected Case 2 | Mineral Wool | EPS | Wood Fibre | Mineral Wool | EPS | Wood Fibre | ||||||||||||||||||||||||||||
| Class 2 | Class 3 | Class 4 | Class 2 | Class 3 | Class 4 | Class 2 | Class 3 | Class 4 | Cla. | Cla. | Cla. | Cla. | Cla. | Cla. | Cla. | Cla. | Cla. | |||||||||||||||||
| Climate | O | A | B | A | B | A | B | A | B | A | B | A | B | A | B | A | B | A | B | 2 | 3 | 4 | 2 | 3 | 4 | 2 | 3 | 4 | ||||||
| Cairns | N | 0 | 0 | 0.06 | 0 | 0.18 | 0.4 | 0 | 0 | 0.06 | 0 | 0.18 | 0.3 | 0 | 0 | 0.06 | 0 | 0.18 | 0.4 | Ext. | Ext. | Ext. | - | - | Ext. | - | - | Ext. | ||||||
| S | 0.24 | 2.3 | 0.9 | 17.7 | 2.71 | 29.5 | 0.25 | 2.4 | 1.01 | 19.1 | 2.76 | 30.8 | 0.23 | 2.3 | 0.9 | 17.7 | 2.7 | 29.5 | Ext. | Ext. | Ext. | Ext. | Ext. | Ext. | Ext. | Ext. | Ext. | |||||||
| Darwin | N | 0.35 | 2.2 | 0.94 | 2.8 | 1.43 | 6.3 | 0.37 | 2.3 | 0.94 | 3 | 1.41 | 6.5 | 0.34 | 2.2 | 0.94 | 2.8 | 1.44 | 6.4 | Ext. | Ext. | Ext. | Ext. | Ext. | Ext. | Ext. | Ext. | Ext. | ||||||
| S | 0.01 | 0 | 0.12 | 0.6 | 0.37 | 1.4 | 0.01 | 0 | 0.12 | 0.7 | 0.35 | 1.4 | 0.01 | 0 | 0.13 | 0.7 | 0.37 | 1.5 | Ext. | Ext. | Ext. | - | Ext. | Ext. | - | Ext. | Ext. | |||||||
| Brisbane | N | 0 | 0 | 0.01 | 0 | 0.07 | 0 | 0 | 0 | 0.01 | 0 | 0.07 | 0 | 0.01 | 0 | 0.01 | 0 | 0.07 | 0 | Ext. | Ext. | Ext. | - | - | - | - | - | - | ||||||
| S | 0.29 | 6.6 | 0.3 | 6.5 | 0.3 | 6.5 | 0.03 | 0 | 0.09 | 0.1 | 0.19 | 2.7 | 0.11 | 1.3 | 0.11 | 1.2 | 0.17 | 2.3 | Int. | Int. | Int. | - | Ext. | Ext. | Int. | Int. | Ext. | |||||||
| Melbourne | N | 0.12 | 3.8 | 0.12 | 3.5 | 0.11 | 3.4 | 0 | 0 | 0 | 0 | 0 | 0 | 0 | 0 | 0 | 0 | 0 | 0 | Int. | Int. | Int. | - | - | - | - | - | - | ||||||
| S | 3.45 | 62.2 | 3.43 | 61.5 | 3.42 | 61.4 | 0.13 | 3.5 | 0.11 | 3 | 0.1 | 2.9 | 2.66 | 55.2 | 2.61 | 54.3 | 2.6 | 54.1 | Int. | Int. | Int. | Int. | Int. | Int. | Int. | Int. | Int. | |||||||
Appendix B. Summary of Unprotected CLT Results
| Performance Criteria | Critical Surface | |||||||||||||||||||||||||||||||||
| Unprotected Case 1 | Mineral Wool | EPS | Wood Fibre | Mineral Wool | EPS | Wood Fibre | ||||||||||||||||||||||||||||
| No WRB | No WRB | No WRB | No | No | No | |||||||||||||||||||||||||||||
| Climate | O | A | B | A | B | A | B | WRB | WRB | WRB | ||||||||||||||||||||||||
| Cairns | N | 1.73 | 6.1 | 2.34 | 14 | 1.28 | 5.5 | Ext. | Ext. | Ext. | ||||||||||||||||||||||||
| S | 3.76 | 48.1 | 2.94 | 26 | 3.63 | 48.5 | Ext. | Ext. | Ext. | |||||||||||||||||||||||||
| Darwin | N | 3.2 | 31.7 | 2.61 | 13.7 | 3.67 | 27.4 | Ext. | Ext. | Ext. | ||||||||||||||||||||||||
| S | 2.43 | 26.2 | 2.76 | 17.2 | 1.71 | 16.6 | Ext. | Ext. | Ext. | |||||||||||||||||||||||||
| Brisbane | N | 0.86 | 1.7 | 2.18 | 14.4 | 0.41 | 2 | Ext. | Ext. | Ext. | ||||||||||||||||||||||||
| S | 1.45 | 6.2 | 2.94 | 26.7 | 1.04 | 5.3 | Ext. | Ext. | Ext. | |||||||||||||||||||||||||
| Melbourne | N | 0.2 | 0.4 | 2.72 | 21.8 | 0.14 | 0 | Ext. | Ext. | - | ||||||||||||||||||||||||
| S | 0.53 | 1.4 | 3.06 | 30.2 | 0.15 | 0.5 | Ext. | Ext. | Both | |||||||||||||||||||||||||
| Unprotected Case 2 | Mineral Wool | EPS | Wood Fibre | Mineral Wool | EPS | Wood Fibre | ||||||||||||||||||||||||||||
| Class 2 | Class 3 | Class 4 | Class 2 | Class 3 | Class 4 | Class 2 | Class 3 | Class 4 | Cla. | Cla. | Cla. | Cla. | Cla. | Cla. | Cla. | Cla. | Cla. | |||||||||||||||||
| Climate | O | A | B | A | B | A | B | A | B | A | B | A | B | A | B | A | B | A | B | 2 | 3 | 4 | 2 | 3 | 4 | 2 | 3 | 4 | ||||||
| Cairns | N | 2.57 | 15.5 | 1.9 | 7.3 | 1.78 | 6.2 | 2.32 | 14 | 2.38 | 14.3 | 2.32 | 14 | 1.8 | 6.2 | 1.97 | 7.9 | 1.8 | 6.2 | Ext. | Ext. | Ext. | Ext. | Ext. | Ext. | Ext. | Ext. | Ext. | ||||||
| S | 2.99 | 31.7 | 2.98 | 43.8 | 3.39 | 47.7 | 3.05 | 26 | 2.96 | 25.3 | 2.92 | 25.6 | 3.02 | 35.6 | 2.97 | 45.4 | 3.29 | 48.3 | Ext. | Ext. | Ext. | Ext. | Ext. | Ext. | Ext. | Ext. | Ext. | |||||||
| Darwin | N | 2.63 | 13.4 | 2.67 | 19.6 | 3.03 | 30.6 | 2.62 | 14.3 | 2.59 | 13.7 | 2.59 | 13.6 | 2.79 | 13.8 | 3.15 | 17 | 3.8 | 24 | Ext. | Ext. | Ext. | Ext. | Ext. | Ext. | Ext. | Ext. | Ext. | ||||||
| S | 2.67 | 14.9 | 2.38 | 17.7 | 2.36 | 22.8 | 2.9 | 18.6 | 2.79 | 17.5 | 2.75 | 17 | 2.72 | 15.2 | 2.38 | 13.4 | 2.29 | 16.7 | Ext. | Ext. | Ext. | Ext. | Ext. | Ext. | Ext. | Ext. | Ext. | |||||||
| Brisbane | N | 2.02 | 13.4 | 1.32 | 3.1 | 1 | 2 | 2.55 | 21.6 | 2.29 | 15.3 | 2.18 | 14.4 | 2.08 | 13.7 | 1.47 | 3.6 | 1.12 | 2.9 | Ext. | Ext. | Ext. | Ext. | Ext. | Ext. | Ext. | Ext. | Ext. | ||||||
| S | 2.85 | 25.6 | 1.98 | 15.1 | 1.57 | 6.9 | 3.14 | 29.7 | 2.99 | 27.5 | 2.93 | 26.6 | 2.9 | 26.2 | 2.08 | 15.8 | 1.65 | 7.8 | Ext. | Ext. | Ext. | Ext. | Ext. | Ext. | Ext. | Ext. | Ext. | |||||||
| Melbourne | N | 2.05 | 15.8 | 1.52 | 9.8 | 0.32 | 0.7 | 2.81 | 25.6 | 2.57 | 19.9 | 2.44 | 18.8 | 2.25 | 17 | 1.13 | 3.1 | 0.68 | 1.9 | Ext. | Int. | Ext. | Ext. | Ext. | Ext. | Ext. | Ext. | Ext. | ||||||
| S | 2.69 | 20.1 | 1.55 | 9.9 | 0.65 | 1.6 | 3.28 | 38.6 | 3.01 | 29.3 | 2.92 | 27.5 | 2.84 | 21.9 | 1.46 | 8.9 | 0.99 | 2.7 | Ext. | Int. | Ext. | Ext. | Ext. | Ext. | Ext. | Ext. | Ext. | |||||||
| Performance Criteria | Critical Surface | |||||||||||||||||||||||||||||||||
| Unprotected Case 3 | Mineral Wool | EPS | Wood Fibre | Mineral Wool | EPS | Wood Fibre | ||||||||||||||||||||||||||||
| Class 2 | Class 3 | Class 4 | Class 2 | Class 3 | Class 4 | Class 2 | Class 3 | Class 4 | Cla. | Cla. | Cla. | Cla. | Cla. | Cla. | Cla. | Cla. | Cla. | |||||||||||||||||
| Climate | O | A | B | A | B | A | B | A | B | A | B | A | B | A | B | A | B | A | B | 2 | 3 | 4 | 2 | 3 | 4 | 2 | 3 | 4 | ||||||
| Cairns | N | 2.65 | 14 | 1.95 | 7.5 | 1.79 | 6.4 | 2.55 | 15.4 | 2.4 | 14.2 | 2.36 | 14 | 1.55 | 12 | 1.28 | 6.1 | 1.27 | 5.5 | Ext. | Ext. | Ext. | Ext. | Ext. | Ext. | Ext. | Ext. | Ext. | ||||||
| S | 3.02 | 29.1 | 2.96 | 42.8 | 3.11 | 47.3 | 3.08 | 28 | 3 | 29.1 | 2.99 | 29.3 | 2.64 | 20.1 | 2.55 | 36.9 | 2.69 | 45.2 | Ext. | Ext. | Ext. | Ext. | Ext. | Ext. | Ext. | Ext. | Ext. | |||||||
| Darwin | N | 2.75 | 13.5 | 2.71 | 20.6 | 2.93 | 31.2 | 2.67 | 14.7 | 2.66 | 14 | 2.67 | 13.9 | 1.71 | 12 | 1.81 | 13 | 2.17 | 22.5 | Ext. | Ext. | Ext. | Ext. | Ext. | Ext. | Ext. | Ext. | Ext. | ||||||
| S | 2.8 | 15.4 | 2.53 | 19.3 | 2.43 | 25.4 | 2.93 | 19 | 2.83 | 18 | 2.8 | 17.6 | 2.08 | 13.3 | 1.56 | 11.4 | 1.56 | 15.8 | Ext. | Ext. | Ext. | Ext. | Ext. | Ext. | Ext. | Ext. | Ext. | |||||||
| Brisbane | N | 2.47 | 13.6 | 1.42 | 3.7 | 1.06 | 2.1 | 2.58 | 21.9 | 2.33 | 15.5 | 2.25 | 15.1 | 1.34 | 11 | 0.76 | 3.2 | 0.51 | 2.6 | Ext. | Ext. | Ext. | Ext. | Ext. | Ext. | Ext. | Ext. | Ext. | ||||||
| S | 2.96 | 26 | 2.17 | 15.3 | 1.67 | 7.5 | 3.16 | 30.3 | 3.01 | 27.7 | 2.96 | 27.1 | 2.37 | 19.9 | 1.33 | 15.3 | 1.12 | 7.1 | Ext. | Ext. | Ext. | Ext. | Ext. | Ext. | Ext. | Ext. | Ext. | |||||||
| Melbourne | N | 2.4 | 16.9 | 0.8 | 2 | 0.35 | 0.9 | 2.93 | 27.5 | 2.78 | 22.6 | 2.74 | 22 | 0.79 | 8 | 0.14 | 0 | 0.14 | 0 | Ext. | Ext. | Ext. | Ext. | Ext. | Ext. | Ext. | - | - | ||||||
| S | 3.28 | 20.6 | 1.07 | 4.4 | 0.55 | 1.5 | 3.28 | 39.6 | 3.12 | 31.7 | 3.08 | 31 | 1.35 | 10.6 | 0.15 | 0.3 | 0.15 | 0.1 | Ext. | Ext. | Ext. | Ext. | Ext. | Ext. | Ext. | Both | Int. | |||||||
| Unprotected Case 1 | Mineral Wool | EPS | Wood Fibre | Mineral Wool | EPS | Wood Fibre | ||||||||||||||||||||||||||||
| No WRB | No WRB | No WRB | No | No | No | |||||||||||||||||||||||||||||
| Climate | O | A | B | A | B | A | B | WRB | WRB | WRB | ||||||||||||||||||||||||
| Cairns | N | 1.36 | 3.6 | 2.09 | 11 | 1.2 | 3.9 | Ext. | Int. | Ext. | ||||||||||||||||||||||||
| S | 3.86 | 39.3 | 2.7 | 29.2 | 3.97 | 43.3 | Ext. | Ext. | Ext. | |||||||||||||||||||||||||
| Darwin | N | 3 | 16.5 | 2.29 | 10.6 | 4.12 | 17.8 | Ext. | Ext. | Ext. | ||||||||||||||||||||||||
| S | 2 | 10 | 2.34 | 15.3 | 1.69 | 9.4 | Ext. | Ext. | Ext. | |||||||||||||||||||||||||
| Brisbane | N | 0.55 | 1 | 2.3 | 18.8 | 0.32 | 1.3 | Ext. | Int. | Ext. | ||||||||||||||||||||||||
| S | 1.22 | 6.6 | 2.51 | 25.6 | 1.04 | 6.3 | Ext. | Both | Ext. | |||||||||||||||||||||||||
| Melbourne | N | 0.21 | 0.4 | 2.34 | 27.3 | 0.05 | 0 | Int. | Int. | - | ||||||||||||||||||||||||
| S | 0.98 | 25.2 | 2.81 | 37.5 | 0.45 | 6.6 | Int. | Ext. | Int. | |||||||||||||||||||||||||
| Unprotected Case 2 | Mineral Wool | EPS | Wood Fibre | Mineral Wool | EPS | Wood Fibre | ||||||||||||||||||||||||||||
| Class 2 | Class 3 | Class 4 | Class 2 | Class 3 | Class 4 | Class 2 | Class 3 | Class 4 | Cla. | Cla. | Cla. | Cla. | Cla. | Cla. | Cla. | Cla. | Cla. | |||||||||||||||||
| Climate | O | A | B | A | B | A | B | A | B | A | B | A | B | A | B | A | B | A | B | 2 | 3 | 4 | 2 | 3 | 4 | 2 | 3 | 4 | ||||||
| Cairns | N | 1.44 | 3.6 | 1.63 | 3.5 | 1.44 | 3.6 | 2.04 | 9.8 | 2.04 | 12 | 2.04 | 9.8 | 1.52 | 3.9 | 1.72 | 4 | 1.52 | 3.9 | Ext. | Ext. | Ext. | Int. | Int. | Int. | Ext. | Ext. | Ext. | ||||||
| S | 2.87 | 23.3 | 2.87 | 37.4 | 3.29 | 40.2 | 3.01 | 34.2 | 2.74 | 30.7 | 2.71 | 28.9 | 2.94 | 29.6 | 2.94 | 41 | 3.52 | 43.8 | Ext. | Ext. | Ext. | Ext. | Ext. | Ext. | Ext. | Ext. | Ext. | |||||||
| Darwin | N | 2.33 | 12.6 | 2.46 | 11 | 2.82 | 15.4 | 2.41 | 13.8 | 2.31 | 13.2 | 2.27 | 10.8 | 2.59 | 13 | 2.95 | 12.6 | 3.76 | 16.9 | Ext. | Ext. | Ext. | Ext. | Ext. | Ext. | Ext. | Ext. | Ext. | ||||||
| S | 2.52 | 13.7 | 2.08 | 9.6 | 2.02 | 8.8 | 2.74 | 22.3 | 2.48 | 17.5 | 2.35 | 15.4 | 2.59 | 14.2 | 2.16 | 10.9 | 2.06 | 8.5 | Ext. | Ext. | Ext. | Ext. | Ext. | Ext. | Ext. | Ext. | Ext. | |||||||
| Brisbane | N | 1.74 | 10.6 | 1.11 | 2.3 | 0.69 | 1.5 | 2.26 | 22.5 | 2.26 | 19.1 | 2.26 | 18.8 | 1.8 | 11.6 | 1.2 | 2.8 | 0.83 | 1.8 | Ext. | Ext. | Ext. | Both | Int. | Int. | Ext. | Ext. | Ext. | ||||||
| S | 2.83 | 26.2 | 1.88 | 14.1 | 1.36 | 7.1 | 3.03 | 38.4 | 2.72 | 28.5 | 2.55 | 25.7 | 2.85 | 26.5 | 1.94 | 15.2 | 1.45 | 7.5 | Ext. | Ext. | Ext. | Ext. | Ext. | Ext. | Ext. | Ext. | Ext. | |||||||
| Melbourne | N | 1.94 | 15.7 | 1.7 | 10.4 | 0.23 | 0.4 | 2.75 | 31.7 | 2.99 | 30.2 | 2.31 | 26.9 | 2.09 | 16.7 | 0.94 | 2.3 | 0.47 | 1.2 | Ext. | Int. | Ext. | Ext. | Int. | Int. | Ext. | Ext. | Ext. | ||||||
| S | 2.75 | 26.9 | 2.21 | 19 | 0.95 | 24.8 | 3.21 | 59.2 | 2.97 | 41.2 | 2.81 | 37.5 | 2.85 | 27.5 | 1.37 | 8.5 | 0.86 | 7.6 | Ext. | Int. | Int. | Ext. | Int. | Ext. | Ext. | Ext. | Both | |||||||
| Unprotected Case 3 | Mineral Wool | EPS | Wood Fibre | Mineral Wool | EPS | Wood Fibre | ||||||||||||||||||||||||||||
| Class 2 | Class 3 | Class 4 | Class 2 | Class 3 | Class 4 | Class 2 | Class 3 | Class 4 | Cla. | Cla. | Cla. | Cla. | Cla. | Cla. | Cla. | Cla. | Cla. | |||||||||||||||||
| Climate | O | A | B | A | B | A | B | A | B | A | B | A | B | A | B | A | B | A | B | 2 | 3 | 4 | 2 | 3 | 4 | 2 | 3 | 4 | ||||||
| Cairns | N | 2.08 | 12.5 | 1.67 | 3.3 | 1.46 | 3.5 | 2.22 | 14.9 | 2.08 | 13.2 | 2.08 | 12.1 | 1.58 | 10.1 | 1.32 | 3.4 | 1.23 | 3.6 | Ext. | Ext. | Ext. | Both | Int. | Int. | Ext. | Ext. | Ext. | ||||||
| S | 2.92 | 23.6 | 2.83 | 35.9 | 2.99 | 39.6 | 2.98 | 35.3 | 2.84 | 32.8 | 2.83 | 34.7 | 2.74 | 20 | 2.59 | 33.8 | 2.7 | 41.4 | Ext. | Ext. | Ext. | Ext. | Ext. | Ext. | Ext. | Ext. | Ext. | |||||||
| Darwin | N | 2.4 | 12.6 | 2.44 | 10.7 | 2.69 | 16.5 | 2.5 | 13.9 | 2.46 | 13.2 | 2.44 | 11.6 | 1.78 | 10.1 | 1.9 | 8.3 | 2.17 | 15.7 | Ext. | Ext. | Ext. | Ext. | Ext. | Ext. | Ext. | Ext. | Ext. | ||||||
| S | 2.7 | 14 | 2.08 | 10.3 | 1.97 | 10 | 2.77 | 22.6 | 2.54 | 17.9 | 2.46 | 17.1 | 2.12 | 13.4 | 1.56 | 9.8 | 1.58 | 8.3 | Ext. | Ext. | Ext. | Ext. | Ext. | Ext. | Ext. | Ext. | Ext. | |||||||
| Brisbane | N | 1.87 | 11.1 | 1.16 | 2.6 | 0.77 | 1.6 | 2.3 | 19.8 | 2.3 | 19.2 | 2.3 | 19 | 1.33 | 9.1 | 0.79 | 2.6 | 0.48 | 1.8 | Ext. | Ext. | Ext. | Int. | Int. | Int. | Ext. | Ext. | Ext. | ||||||
| S | 2.93 | 26.9 | 2.09 | 15 | 1.48 | 7.9 | 3.05 | 42 | 2.74 | 28.8 | 2.64 | 27.1 | 2.69 | 24.5 | 1.57 | 15.1 | 1.22 | 8 | Ext. | Ext. | Ext. | Ext. | Ext. | Ext. | Ext. | Ext. | Ext. | |||||||
| Melbourne | N | 2.29 | 16.6 | 0.68 | 1.7 | 0.26 | 0.5 | 2.76 | 31.7 | 2.43 | 28.1 | 2.34 | 27.5 | 1.06 | 11 | 0.05 | 0 | 0.05 | 0 | Ext. | Ext. | Ext. | Ext. | Both | Int. | Ext. | - | - | ||||||
| S | 3.37 | 29.5 | 1.07 | 24 | 0.94 | 23.6 | 3.21 | 59.2 | 2.94 | 40 | 2.85 | 37.8 | 2.1 | 20.1 | 0.43 | 6.5 | 0.44 | 6.4 | Ext. | Both | Int. | Ext. | Ext. | Ext. | Ext. | Int. | Int. | |||||||
| Unprotected Case 1 | Mineral Wool | EPS | Wood Fibre | Mineral Wool | EPS | Wood Fibre | ||||||||||||||||||||||||||||
| No WRB | No WRB | No WRB | No | No | No | |||||||||||||||||||||||||||||
| Climate | O | A | B | A | B | A | B | WRB | WRB | WRB | ||||||||||||||||||||||||
| Cairns | N | 1 | 2.6 | 2.74 | 15.8 | 0.99 | 2.6 | Ext. | Int. | Ext. | ||||||||||||||||||||||||
| S | 4.13 | 35.9 | 4.16 | 38.1 | 4.11 | 35.8 | Ext. | Ext. | Ext. | |||||||||||||||||||||||||
| Darwin | N | 2.44 | 8.8 | 2.74 | 15.9 | 2.43 | 8.9 | Ext. | Int. | Ext. | ||||||||||||||||||||||||
| S | 1.3 | 2.7 | 2.62 | 16.4 | 1.29 | 2.7 | Ext. | Int. | Ext. | |||||||||||||||||||||||||
| Brisbane | N | 0.29 | 0.4 | 2.81 | 19.2 | 0.28 | 0.4 | Ext. | Int. | Ext. | ||||||||||||||||||||||||
| S | 1.14 | 9.2 | 2.76 | 28.6 | 1.12 | 7.7 | Both | Int. | Ext. | |||||||||||||||||||||||||
| Melbourne | N | 0.71 | 9.4 | 2.98 | 29.1 | 0.53 | 3.8 | Int. | Int. | Int. | ||||||||||||||||||||||||
| S | 3.62 | 66.9 | 2.97 | 48 | 2.91 | 60.6 | Int. | Int. | Int. | |||||||||||||||||||||||||
| Unprotected Case 2 | Mineral Wool | EPS | Wood Fibre | Mineral Wool | EPS | Wood Fibre | ||||||||||||||||||||||||||||
| Class 2 | Class 3 | Class 4 | Class 2 | Class 3 | Class 4 | Class 2 | Class 3 | Class 4 | Cla. | Cla. | Cla. | Cla. | Cla. | Cla. | Cla. | Cla. | Cla. | |||||||||||||||||
| Climate | O | A | B | A | B | A | B | A | B | A | B | A | B | A | B | A | B | A | B | 2 | 3 | 4 | 2 | 3 | 4 | 2 | 3 | 4 | ||||||
| Cairns | N | 1.74 | 5.6 | 1.32 | 2.5 | 1.07 | 2 | 2.71 | 18.8 | 2.71 | 16.5 | 2.71 | 15.4 | 1.73 | 5.9 | 1.32 | 2.5 | 1.07 | 2 | Ext. | Ext. | Ext. | Int. | Int. | Int. | Ext. | Ext. | Ext. | ||||||
| S | 2.71 | 17.7 | 2.36 | 25.9 | 2.86 | 33.1 | 2.73 | 34.3 | 2.62 | 31.1 | 3.01 | 35.9 | 2.71 | 18.2 | 2.39 | 25.9 | 2.87 | 33.1 | Ext. | Ext. | Ext. | Ext. | Both | Ext. | Ext. | Ext. | Ext. | |||||||
| Darwin | N | 2.01 | 3.6 | 2 | 3.8 | 2.17 | 7.1 | 2.71 | 17.3 | 2.71 | 15.7 | 2.7 | 15.2 | 2.01 | 5 | 2 | 3.9 | 2.17 | 7.2 | Ext. | Ext. | Ext. | Int. | Int. | Int. | Ext. | Ext. | Ext. | ||||||
| S | 2.17 | 12.1 | 1.54 | 3.4 | 1.3 | 2.7 | 2.59 | 20.1 | 2.59 | 16.9 | 2.58 | 16.3 | 2.16 | 12.3 | 1.54 | 3.4 | 1.3 | 2.7 | Ext. | Ext. | Ext. | Int. | Int. | Int. | Ext. | Ext. | Ext. | |||||||
| Brisbane | N | 1.47 | 6.4 | 0.88 | 1.8 | 0.42 | 0.8 | 2.78 | 25.1 | 2.78 | 19.6 | 2.78 | 19.1 | 1.47 | 6.5 | 0.88 | 1.8 | 0.42 | 0.8 | Ext. | Ext. | Ext. | Int. | Int. | Int. | Ext. | Ext. | Ext. | ||||||
| S | 2.72 | 26.6 | 1.76 | 13.3 | 1.16 | 9.1 | 2.74 | 40.5 | 2.73 | 29.7 | 2.73 | 28.5 | 2.73 | 26.8 | 1.77 | 13.5 | 1.16 | 8.1 | Ext. | Ext. | Both | Ext. | Int. | Int. | Ext. | Ext. | Ext. | |||||||
| Melbourne | N | 0.1 | 2.1 | 0.11 | 2.3 | 0.11 | 2.3 | 2.95 | 39.8 | 2.95 | 29.6 | 2.95 | 28.8 | 1.07 | 9 | 0.99 | 7.7 | 1 | 7.2 | Int. | Int. | Int. | Int. | Int. | Int. | Both | Int. | Int. | ||||||
| S | 3.56 | 57.2 | 3.6 | 56.3 | 3.61 | 55.9 | 2.94 | 81.2 | 2.94 | 48.5 | 2.94 | 47.2 | 3.07 | 66.1 | 3.07 | 63.1 | 3.07 | 62.3 | Int. | Int. | Int. | Int. | Int. | Int. | Int. | Int. | Int. | |||||||
References
- Muszynski, L.; Larasatie, P.; Guerrero, J.; Albee, R.; Hansen, E. Global CLT industry in 2020: Growth beyond the Alpine Region, 2020. In Proceedings of the Society of Wood Science and Technology (SWST) International Convention, Portorož, Slovenia, 13–15 July 2020. [Google Scholar]
- Ürge-Vorsatz, D.; Khosla, R.; Bernhardt, R.; Chan, Y.C.; Vérez, D.; Hu, S.; Cabeza, L.F. Advances Toward a Net-Zero Global Building Sector. Annu. Rev. Environ. Resour. 2020, 45, 227–269. [Google Scholar] [CrossRef]
- Lehmann, S. Low carbon construction systems using prefabricated engineered solid wood panels for urban infill to significantly reduce greenhouse gas emissions. Sustain. Cities Soc. 2013, 6, 57–67. [Google Scholar] [CrossRef]
- Schnieders, J.; Hermelink, A. CEPHEUS results: Measurements and occupants’ satisfaction provide evidence for Passive Houses being an option for sustainable building. Energy Policy 2006, 34, 151–171. [Google Scholar] [CrossRef]
- Chatterjee, S.; Ürge-Vorsatz, D. Measuring the productivity impacts of energy-efficiency: The case of high-efficiency buildings. J. Clean. Prod. 2021, 318, 128535. [Google Scholar] [CrossRef]
- Castro-Alvarez, F.; Vaidyanathan, S.; Bastian, H.; King, J. The 2018 International Energy Efficiency Scorecard. 2018. Available online: https://aceee.org/research-report/i1801 (accessed on 21 December 2019).
- Passipedia. Thermal Comfort Parameters. 2019. Available online: https://passipedia.org/basics/building_physics_-_basics/thermal_comfort/thermal_comfort_parameters (accessed on 23 May 2020).
- Schnieders, J.; Eian, T.D.; Filippi, M.; Florez, J.; Kaufmann, B.; Pallantzas, S.; Paulsen, M.; Reyes, E.; Wassouf, M.; Yeh, S.-C. Design and realisation of the Passive House concept in different climate zones. Energy Effic. 2019, 13, 1561–1604. [Google Scholar] [CrossRef]
- Johnston, D.; Siddall, M.; Ottinger, O.; Peper, S.; Feist, W. Are the Energy Savings of the Passive House Standard Reliable? Springer Nature: Basingstoke, UK, 2020. [Google Scholar]
- Passipedia. Examples. Passive House Database. 2018. Available online: https://passipedia.org/examples (accessed on 11 May 2021).
- Passive House Database. Pages Flat (South Australia). Available online: https://passivehouse-database.org/index.php?lang=en#d_4345 (accessed on 11 May 2021).
- Passive House Institute. Passive House Database. 2019. Available online: https://passivehouse-database.org/index.php?lang=en (accessed on 23 July 2019).
- Solaire Properties. Vanquish. Solaire Properties. 2020. Available online: https://solaireproperties.com.au/project/vanquish/ (accessed on 29 June 2021).
- Passive House Institute. Criteria for the Passive House. EnerPHit and PHI Low Energy Building Standard. 2016. Available online: https://passiv.de/downloads/03_building_criteria_en.pdf (accessed on 4 May 2019).
- Planet Ark. Forté, Docklands, Melbourne. Make It Wood. 2018. Available online: https://makeitwood.org/exemplar-projects/Forte.cfm? (accessed on 24 September 2019).
- Build Australia. New Mass Engineered Timber Building Tops out in Brisbane. New Mass Engineered Timber Building Tops out in Brisbane. 2021. Available online: https://www.buildaustralia.com.au/projects/new-mass-engineered-timber-building-tops-out-in-brisbane/ (accessed on 21 June 2021).
- Kremer, P.; Simmons, M. Overcoming Psychological Barriers to Widespread Acceptance of Mass Timber Construction in Australia. 2016. Available online: https://www.fwpa.com.au/resources/reports/market-access/1140-overcoming-psychological-barriers-to-widespread-acceptance-of-mass-timber-construction-in-australia.html (accessed on 28 July 2019).
- Building Code of Australia. National Construction Code; Australian Building Codes Board: Canberra, Australia, 2019; Volume 1. [Google Scholar]
- Kvande, T.; Bakken, N.; Bergheim, E.; Thue, J.V. Durability of ETICS with Rendering in Norway—Experimental and Field Investigations. Buildings 2018, 8, 93. [Google Scholar] [CrossRef] [Green Version]
- Dewsbury, M.; Law, T.; Henderson, A. Final Report—Investigation of Destructive Condensation in Australian Cool-Temperate Buildings; Technical Report; School of Architecture and Design, University of Tasmania: Launceston, Australia, 2016. [Google Scholar] [CrossRef]
- Law, T. Inquiry into Biotoxin-Related Illnesses in Australia; Technical Report; ArchSciences: Tasmania, Australia, August 2018; p. 32.
- TIAX LLC. Matching the Sensible Heat Ratio of Air Conditioning Equipment with Building Load, Cambridge. 2003. Available online: http://seedengr.com/Making%20the%20Sensible%20Heat%20Ratio%20of%20Air%20Conditioning%20Equipment%20with%20Building%20Load.pdf (accessed on 12 April 2021).
- Kempton, L.; Kokogiannakis, G.; Cooper, P. Mould risk evaluations in residential buildings via site audits and longitudinal monitoring. Build. Environ. 2021, 191, 107584. [Google Scholar] [CrossRef]
- Brambilla, A.; Sangiorgio, A. Mould growth in energy efficient buildings: Causes, health implications and strategies to mitigate the risk. Renew. Sustain. Energy Rev. 2020, 132, 110093. [Google Scholar] [CrossRef]
- Dewsbury, M.; Law, T.; Potgieter, J.; Fitz-Gerald, D.; McComish, B.; Chandler, T.A. Soudan, Scoping Study of Condensation in Residential Buildings. Australian Building Code Board, Australia. 2016. Available online: https://www.abcb.gov.au/Resources/Publications/Research/Scoping-Study-of-Condensation-in-Residential-Buildings (accessed on 1 April 2019).
- Gasparri, E.; Brambilla, A.; Aitchison, A. Hygrothermal analysis of timber-based external walls across different Australian climate zones. In Proceedings of the World Conference on Timber Engineering, Seoul, South Korea, 20–23 August 2018. [Google Scholar]
- Weston, T.A.; Minnich, L.C.; Smegal, J. Evaluation of cladding and water-resistive barrier performance in hot-humid climates using a real-weather, real-time test facility. In Proceedings of the Thermal Performance of the Exterior Envelopes of Whole Buildings XI International Conference, Clearwater Beach, FL, USA, 5–9 December 2008; p. 20. [Google Scholar]
- Lstiburek, J. Understanding Vapor Barriers, Building Science Corporation; BSD-106; Building Science Corporation: Somerville, MA, USA, 2006; p. 29. [Google Scholar]
- Boone, K.; Pascual, X.; Weston, T. Wall dying in hot and humid climates. In Proceedings of the Fourteenth Symposium on Improving Building Systems in Hot and Humid Climates, Richardson, TX, USA, 17–20 May 2004; p. 17. [Google Scholar]
- Seidel, D.J.; Fu, Q.; Randel, W.J.; Reichler, T. Widening of the tropical belt in a changing climate. Nat. Geosci. 2007, 1, 21–24. [Google Scholar] [CrossRef]
- Xu, C.; Kohler, T.A.; Lenton, T.M.; Svenning, J.-C.; Scheffer, M. Future of the human climate niche. Proc. Natl. Acad. Sci. USA 2020, 117, 11350–11355. [Google Scholar] [CrossRef] [PubMed]
- Ürge-Vorsatz, D.; Cabeza, L.F.; Serrano, S.; Barreneche, C.; Petrichenko, K. Heating and cooling energy trends and drivers in buildings. Renew. Sustain. Energy Rev. 2015, 41, 85–98. [Google Scholar] [CrossRef] [Green Version]
- Su, H.; Jiang, J.H.; Neelin, J.D.; Shen, T.J.; Zhai, C.; Yue, Q.; Wang, Z.; Huang, L.; Choi, Y.-S.; Stephens, G.L.; et al. Tightening of tropical ascent and high clouds key to precipitation change in a warmer climate. Nat. Commun. 2017, 8, 15771. [Google Scholar] [CrossRef]
- Lstiburek, J. The Perfect Wall. ASHRAE J. 2007, 49, 74, 76, 78. [Google Scholar]
- The Australian Institute of Refrigeration. Air Conditioning and Heating. In Application Manual DA20: Air Conditioning, Cooling and Comfort in Hot and Humid Tropical Climates, 3rd ed.; The Australian Institute of Refrigeration: Melbourne, VIC, Australia, 2016. [Google Scholar]
- Wang, J.; Stirling, R.; Morris, P.I.; Taylor, A.; Lloyd, J.; Kirker, G.; Lebow, S.; Mankowski, M.; Barnes, H.M.; Morrell, J.J. Durability of mass timber structures: A review of the biological risks. Wood Fiber Sci. 2018, 50, 110–127. [Google Scholar] [CrossRef] [Green Version]
- Lstiburek, J. Moisture Control for Buildings. ASHRAE J. 2002, 44, 36–41. Available online: https://www.buildingscience.com/sites/default/files/migrate/pdf/PA_Moisture_Control_ASHRAE_Lstiburek.pdf (accessed on 22 July 2019).
- Li, J.; Rismanchi, B.; Ngo, T. Feasibility study to estimate the environmental benefits of utilising timber to construct high-rise buildings in Australia. Build. Environ. 2018, 147, 108–120. [Google Scholar] [CrossRef]
- Öberg, J.; Wiege, E. Moisture Risks with CLT-Panels Subjected to Outdoor Climate during Construction: Focus on Mould and Wetting Processes. 2018. Available online: http://kth.diva-portal.org/smash/get/diva2:1222631/FULLTEXT01.pdf (accessed on 29 April 2019).
- Glass, S.; Wang, J.; Eastley, S.; Finch, G. CLT Handbook (US Edition). In CLT Handbook (US Edition); Karacabeyli, E., Douglas, B., Eds.; FP Innovations and Binational Softwood Lumber Council: Pointe-Claire, QC, Canada, 2013; p. 393. [Google Scholar]
- Kukk, V.; Bella, A.; Kers, J.; Kalamees, T. Airtightness of cross-laminated timber envelopes: Influence of moisture content, indoor humidity, orientation, and assembly. J. Build. Eng. 2021, 44, 102610. [Google Scholar] [CrossRef]
- Lstiburek, J.W. BSI-111: Double Play. Building Science Corporation. 2019. Available online: https://www.buildingscience.com/documents/building-science-insights/bsi-111-double-play (accessed on 22 July 2019).
- Brambilla, A.; Gasparri, E. Mould Growth Models and Risk Assessment for Emerging Timber Envelopes in Australia: A Comparative Study. Buildings 2021, 11, 261. [Google Scholar] [CrossRef]
- Straube, J.; Finch, G. Ventilated Wall Claddings: Review. Field Performance, and Hygrothermal Modeling; Research Report 0906; Building Science Corporation: Westford, MA, USA, 2009. [Google Scholar]
- Wang, L.; Ge, H. Hygrothermal performance of cross-laminated timber wall assemblies: A stochastic approach. Build. Environ. 2016, 97, 11–25. [Google Scholar] [CrossRef]
- Gagnon, S.; Pirvu, C. CLT Handbook (Canada Edition); National Library of Canada: Ottawa, ON, Canada, 2011. [Google Scholar]
- Kolb, J. Systems in Timber Engineering Loadbearing Structures and Component Layers; Lignum–Holzwirtschaft Schweiz and DGfH–German Society of Wood Research, Ed.; Birkhäuser: Basel, Switzerland; Boston, MA, USA, 2008. [Google Scholar]
- Peters, B.C.; Perkins, L.E.; Cochrane, G.H.; Zalucki, M.P. Subterranean termite (Blattodea: Termitoidae) pests in metropolitan Brisbane, Australia, 1997–2006: Patterns and implications. Austral. Entomol. 2016, 56, 218–224. [Google Scholar] [CrossRef]
- Zelinka, S.L. Corrosion of Embedded Metals in Wood: An Overview of Recent Research with Implications for Building Moisture Design. ASHRAE Trans. 2013, 119, 442–449. [Google Scholar]
- Mundt-Petersen, S.O.; Harderup, L.-E. Validation of a one-dimensional transient heat and moisture calculation tool under real conditions. ASHRAE Trans. 2013, 1–12. [Google Scholar]
- Peel, M.C.; Finlayson, B.L.; Mcmahon, T.A. Updated world map of the Köppen-Geiger climate classification, Hydrology and Earth System. Sci. Discuss. 2007, 11, 1633–1644. [Google Scholar]
- Pernigotto, G.; Prada, A.; Gasparella, A.; Hensen, J. Analysis and improvement of the representativeness of EN ISO 15927-4 reference years for building energy simulation. J. Build. Perform. Simul. 2013, 7, 391–410. [Google Scholar] [CrossRef] [Green Version]
- Pezoulas, L.; Karagiozis, K. ASHRAE RP-1325: Environmental Weather Loads for Hygrothermal Analysis and Design of Buildings; ASHRAE, Syracuse University: Syracuse, NY, USA, 2011. [Google Scholar]
- Zhang, Q.; Huang, J.; Yang, H. Development of the Typical and Design Weather Data for Asian Locations. J. Asian Arch. Build. Eng. 2002, 1, 49–55. [Google Scholar] [CrossRef] [Green Version]
- Cornick, S.; Dalgliesh, A.; Maref, W. Sensitivity of Hygrothermal Analysis to Uncertainty in Rain Data. J. ASTM Int. 2009, 6, 1–17. Available online: https://www.academia.edu/21429038/Sensitivity_of_Hygrothermal_Analysis_to_Uncertainty_in_Rain_Data (accessed on 16 February 2021). [CrossRef]
- Blocken, B.; Carmeliet, J. Driving Rain on Building Envelopes—II Representative Experimental Data for Driving Rain Estimation. J. Therm. Envel. Build. Sci. 2000, 24, 89–110. [Google Scholar] [CrossRef]
- Strang, M.; Leardini, P.; Brambilla, A.; Gasparri, E. Designing a durable multi-storey cross-laminated timber Passivhaus building in hot and humid Australian climates. In Proceedings of the World Conference Timber Engineering, Santiago, Chile, 9–12 August 2021; p. 10. [Google Scholar]
- Australian Government. Australian Standards: AS NZS 4200.1-2017_Pliable Building Membranes and Underlays; Australian Government: Canberra, Australia, 2017.
- Karacabeyli, E.; Gagnon, S. (Eds.) Canadian CLT Handbook: 2019 Edition; FPInnovations: Pointe-Claire, QC, Canada, 2019. [Google Scholar]
- Kumaran, M.K. RP-1018—A Thermal and Moisture Transport Database for Common Building and Insulating Materials. 2002. Available online: https://www.techstreet.com/standards/rp-1018-a-thermal-and-moisture-transport-database-for-common-building-and-insulating-materials?product_id=1711752 (accessed on 4 October 2019).
- Simpson, Y. Field Evaluation of Ventilation Wetting and Drying of Rainscreen Walls in Coastal British Columbia. Master’s Thesis, Concordia University, Montreal, QC, Canada, April 2010. Available online: https://0-search-proquest-com.brum.beds.ac.uk/docview/804312942/abstract/F230F79B1EC147FCPQ/1 (accessed on 10 February 2020).
- Lacy, R.E. Driving-Rain Maps and the Onslaught of Rain on Buildings; Building Research Station: Helsinki, Finland, 1965. [Google Scholar]
- Viitanen, H.; Ojanen, T. Improved model to predict mold growth in building materials. In Proceedings of the 10th Thermal Performance of the Exterior Envelopes of Whole Buildings Conference, 2–7 December 2007; ASHRAE: Peachtree Corners, GA, USA, 2007. [Google Scholar]
- Ojanen, T.; Viitanen, H.; Peuhkuri, R.; Lähdesmäki, K.; Vinha, J.; Salminen, K. Mold growth modeling of building structures using sensitivity classes of materials. In Proceedings of the Exterior Envelopes of Whole Buildings XI, Buildingx XI Conference, Clearwater Beach, FL, USA, 5–9 November 2010; ASHRAE: Peachtree Corners, GA, USA, 2010. [Google Scholar]
- Harriman, L.; Bundrette, G.; Kittler, R. Humidity Control Design Guide for Commercial and Industrial Buildings; American Society of Heating, Refrigerating and Air-Conditioning Engineers: Atlanta, GA, USA, 2001. [Google Scholar]
- WUFI Pro, Version 6.1, Built-in Software Manual, Online Help-Dialog: Status of Last Calculation—Topic 82; Fraunhofer Institute for Building Physics: Stuttgart, Germany, 2016.
- Langer, S.; Bekö, G.; Bloom, E.; Widheden, A.; Ekberg, L. Indoor air quality in passive and conventional new houses in Sweden. Build. Environ. 2015, 93, 92–100. [Google Scholar] [CrossRef]
- Overton, G. Hygrothermal performance of New Zealand wall constructions—Meeting the durability requirements of the New Zealand Building Code. Can. J. Civ. Eng. 2019, 46, 1063–1073. [Google Scholar] [CrossRef]
- Glass, S.V.; Gatland, S.D.; Ueno, K.; Schumacher, C.J.; Mukhopadhyaya, P.; Fisler, D. Analysis of Improved Criteria for Mold Growth in ASHRAE Standard 160 by Comparison with Field Observations. In Advances in Hygrothermal Performance of Building Envelopes: Materials, Systems and Simulations; Mukhopadhyaya, P., Fisler, D., Eds.; ASTM International: West Conshohocken, PA, USA, 2017; pp. 1–27. [Google Scholar] [CrossRef]
- Recatala, M.A.; Morales, S.G.; Bossche, N.V.D. Experimental assessment of rainwater management of a ventilated façade. J. Build. Phys. 2017, 42, 38–67. [Google Scholar] [CrossRef]
- Rousseau, M.Z.; Poirier, G.F.; Brown, W.C. Pressure Equalization in Rainscreen Wall Systems; Institute for Research in Construction: Montreal, QC, Canada, 1998; p. 6. [Google Scholar]
- Derome, D. The Impact of Sorption History and Hysteresis on Moisture Pattern in a Wood-Framed Building Envelope. In Proceedings of the Performance of Exterior Envelopes of Whole Buildings VIII: Moisture Control Performance Measurements, Clearwater Beach, FL, USA, 2–7 December 2001. [Google Scholar]
- Krus, M.; Holm, A. Simple methods to approximate the liquid transport coefficients describing the absorption and drying. In Proceedings of the 5th Symposium “Building Physics in the Nordic Countries”, Gothenburg, Sweden, 24–26 August 1999; pp. 241–248. [Google Scholar]
- McClung, R.; Ge, H.; Straube, J.; Wang, J. Hygrothermal performance of cross-laminated timber wall assemblies with built-in moisture: Field measurements and simulations. Build. Environ. 2014, 71, 95–110. [Google Scholar] [CrossRef]
- Hakansso, H. Retarded Sorption in Wood: Experimental Study, Analyses and Modelling; Department of Building Science, Lund University, Lund Institute of Technology: Lund, Sweden, 1998. [Google Scholar]


| Climate | Description | City |
|---|---|---|
| Am | Tropical monsoon climate | Cairns |
| Aw | Tropical savanna climate | Darwin |
| Cfa | Humid subtropical climates | Brisbane |
| Cfb | Temperate oceanic climate | Melbourne |
| Condition | Setting |
|---|---|
| System | AC with dehumidification |
| Temperature | Heating set-point of 20 °C Cooling set-point of 26 °C |
| Relative humidity | Relative humidity limit of 70% |
| Air exchange rate | 0.2 air changes per hour |
| Moisture generation | 8.06 × 10⁻⁵ kg/s |
| Classification | Vapour Permeance (µg/Ns) | Equivalent Meters of Still Air, SD Value, (m) |
|---|---|---|
| Class 2 | 0.09 | 2.25 |
| Class 3 | 0.4 | 0.5 |
| Class 4 | 2.17 | 0.09 |
| Material | Thickness (m) | Bulk Density (kg/m3) | Porosity (m3/m3) | Specific Heat Capacity (J/kg K) | Vapour Diffusion Resistance Factor (-) | Thermal Conductivity (W/m·K) |
|---|---|---|---|---|---|---|
| Fibre cement | 0.008 | 1610 | 0.16 | 850 | 83.3 | 0.13 |
| Ventilated air gap | 0.025 | 1.3 | 0.999 | 1000 | 0.56 | 0.13 |
| CLT panel | 0.140 | 500 | 0.858 | 1880 | 1734.4 | 0.119 |
| Services air cavity | 0.035 | 1.3 | 0.999 | 1000 | 0.56 | 0.13 |
| Plasterboard | 0.015 | 850 | 0.65 | 850 | 8.3 | 0.2 |
| Material | Bulk Density (kg/m3) | Porosity (m2/m3) | Specific Heat Capacity (J/kg K) | Water Vapour Diffusion Factor (-) | Thermal Conductivity (W/m·K) |
|---|---|---|---|---|---|
| Mineral wool | 178 | 0.934 | 850 | 1.76 | 0.0336 |
| EPS | 14.8 | 0.99 | 1470 | 73.01 | 0.036 |
| Wood fibre | 155 | 0.981 | 1400 | 3 | 0.042 |
| Climate | Melbourne | Brisbane | Cairns | Darwin |
| R-value (m2 K/W) | 4.45 | 3.56 | 3.56 | 3.86 |
| Mineral Wool (mm) | 90 | 60 | 60 | 70 |
| EPS (mm) | 95 | 63 | 63 | 74 |
| Wood Fibre (mm) | 111 | 74 | 74 | 86 |
| Parameter | Exterior Surface | Interior Surface |
|---|---|---|
| Heat transfer coefficient (W/m2·K) | Wind dependent | 8 |
| Short-wave radiation emissivity | 0.6 | - |
| Long-wave radiation emissivity | 0.9 | - |
| Rain exposure factor | 1.2 | - |
| Rain deposition factor | 0.5 | - |
| Protected Case 1 | Mineral Wool | EPS | Wood Fibre | ||||||||||||||||
| No WRB | No WRB | No WRB | |||||||||||||||||
| Climate | O | A | B | A | B | A | B | ||||||||||||
| Cairns | N | 0.78 | 3.9 | 0.15 | 1.9 | 0.65 | 3.8 | ||||||||||||
| S | 3.76 | 42.9 | 0.47 | 3.1 | 3.56 | 43.6 | |||||||||||||
| Darwin | N | 2.73 | 29.9 | 0.55 | 2.7 | 3.24 | 24.6 | ||||||||||||
| S | 1.45 | 22.5 | 0.3 | 2.7 | 1.24 | 12.7 | |||||||||||||
| Brisbane | N | 0.14 | 0 | 0.03 | 0 | 0.07 | 0 | ||||||||||||
| S | 0.31 | 1.5 | 0.07 | 0.3 | 0.2 | 0.6 | |||||||||||||
| Melbourne | N | 0 | 0 | 0 | 0 | 0.01 | 0 | ||||||||||||
| S | 0.06 | 0 | 0 | 0 | 0 | 0 | |||||||||||||
| Protected Case 2 | Mineral Wool | EPS | Wood Fibre | ||||||||||||||||
| Class 2 | Class 3 | Class 4 | Class 2 | Class 3 | Class 4 | Class 2 | Class 3 | Class 4 | |||||||||||
| Climate | O | A | B | A | B | A | B | A | B | A | B | A | B | A | B | A | B | A | B |
| Cairns | N | 0.06 | 1.1 | 0.48 | 2.7 | 0.68 | 3.8 | 0.15 | 1.9 | 0.12 | 1.8 | 0.15 | 1.9 | 0.61 | 3.6 | 0.47 | 2.9 | 0.61 | 3.6 |
| S | 0.66 | 8.9 | 2.2 | 34.4 | 3.39 | 41.5 | 0.27 | 2.9 | 0.41 | 3.1 | 0.46 | 3.1 | 0.71 | 14.4 | 2.25 | 35.5 | 3.27 | 42.5 | |
| Darwin | N | 0.75 | 3 | 1.54 | 14.6 | 2.16 | 28.3 | 0.35 | 2.6 | 0.49 | 2.7 | 0.54 | 2.7 | 1 | 4.1 | 1.99 | 11.6 | 2.82 | 20.3 |
| S | 0.46 | 2.9 | 1.02 | 9.2 | 1.34 | 18.2 | 0.1 | 1.6 | 0.25 | 2.6 | 0.29 | 2.7 | 0.46 | 3.3 | 0.91 | 3.4 | 1.16 | 11.1 | |
| Brisbane | N | 0.03 | 0 | 0.05 | 0 | 0.08 | 0 | 0.01 | 0 | 0.03 | 0 | 0.03 | 0 | 0.03 | 0 | 0.06 | 0.1 | 0.07 | 0.1 |
| S | 0.08 | 0.4 | 0.14 | 0.4 | 0.23 | 1 | 0.04 | 0.1 | 0.06 | 0.3 | 0.07 | 0.3 | 0.09 | 0.6 | 0.16 | 0.7 | 0.19 | 0.6 | |
| Melbourne | N | 0 | 0 | 0 | 0 | 0 | 0 | 0 | 0 | 0 | 0 | 0 | 0 | 0 | 0 | 0.01 | 0 | 0.01 | 0 |
| S | 0 | 0 | 0.01 | 0 | 0.04 | 0 | 0 | 0 | 0 | 0 | 0 | 0 | 0 | 0 | 0 | 0 | 0 | 0 | |
| Protected Case 3 | Mineral Wool | EPS | Wood Fibre | ||||||||||||||||
| Class 2 | Class 3 | Class 4 | Class 2 | Class 3 | Class 4 | Class 2 | Class 3 | Class 4 | |||||||||||
| Climate | O | A | B | A | B | A | B | A | B | A | B | A | B | A | B | A | B | A | B |
| Cairns | N | 0.18 | 2 | 0.47 | 2.2 | 0.65 | 3.6 | 0.05 | 0.9 | 0.17 | 1.9 | 0.2 | 2 | 0.31 | 2.8 | 0.47 | 2.5 | 0.59 | 3.2 |
| S | 0.56 | 4.9 | 1.52 | 32.4 | 2.95 | 40 | 0.34 | 3.1 | 0.51 | 3.6 | 0.58 | 5.1 | 0.53 | 3.4 | 1.04 | 26.3 | 2.1 | 37.3 | |
| Darwin | N | 0.73 | 2.8 | 1.48 | 14.9 | 2.01 | 28.9 | 0.4 | 2.6 | 0.56 | 2.8 | 0.62 | 2.8 | 0.82 | 3.6 | 1.33 | 8.3 | 1.72 | 19.4 |
| S | 0.4 | 2.8 | 0.93 | 10.1 | 1.22 | 20.8 | 0.17 | 2.4 | 0.3 | 2.7 | 0.35 | 2.8 | 0.43 | 2.8 | 0.79 | 3 | 1.04 | 10.9 | |
| Brisbane | N | 0.03 | 0 | 0.04 | 0 | 0.06 | 0 | 0.01 | 0 | 0.03 | 0 | 0.03 | 0 | 0.07 | 0.3 | 0.07 | 0.2 | 0.07 | 0.1 |
| S | 0.12 | 0.4 | 0.2 | 0.7 | 0.31 | 1.3 | 0.06 | 0.3 | 0.08 | 0.4 | 0.08 | 0.4 | 0.13 | 0.8 | 0.17 | 0.8 | 0.21 | 0.7 | |
| Melbourne | N | 0.01 | 0 | 0 | 0 | 0 | 0 | 0 | 0 | 0 | 0 | 0 | 0 | 0.06 | 0.3 | 0.02 | 0 | 0.02 | 0 |
| S | 0 | 0 | 0 | 0 | 0.01 | 0 | 0 | 0 | 0 | 0 | 0 | 0 | 0.02 | 0 | 0.01 | 0 | 0 | 0 | |
| Unprotected Case 2 | Mineral Wool | EPS | Wood Fibre | ||||||||||||||||
|---|---|---|---|---|---|---|---|---|---|---|---|---|---|---|---|---|---|---|---|
| Class 2 | Class 3 | Class 4 | Class 2 | Class 3 | Class 4 | Class 2 | Class 3 | Class 4 | |||||||||||
| Climate | O | A | B | A | B | A | B | A | B | A | B | A | B | A | B | A | B | A | B |
| Cairns | N | 2.57 | 15.5 | 1.9 | 7.3 | 1.78 | 6.2 | 2.32 | 14 | 2.38 | 14.3 | 2.32 | 14 | 1.8 | 6.2 | 1.97 | 7.9 | 1.8 | 6.2 |
| S | 2.99 | 31.7 | 2.98 | 43.8 | 3.39 | 47.7 | 3.05 | 26 | 2.96 | 25.3 | 2.92 | 25.6 | 3.02 | 35.6 | 2.97 | 45.4 | 3.29 | 48.3 | |
| Darwin | N | 2.63 | 13.4 | 2.67 | 19.6 | 3.03 | 30.6 | 2.62 | 14.3 | 2.59 | 13.7 | 2.59 | 13.6 | 2.79 | 13.8 | 3.15 | 17 | 3.8 | 24 |
| S | 2.67 | 14.9 | 2.38 | 17.7 | 2.36 | 22.8 | 2.9 | 18.6 | 2.79 | 17.5 | 2.75 | 17 | 2.72 | 15.2 | 2.38 | 13.4 | 2.29 | 16.7 | |
| Brisbane | N | 2.02 | 13.4 | 1.32 | 3.1 | 1 | 2 | 2.55 | 21.6 | 2.29 | 15.3 | 2.18 | 14.4 | 2.08 | 13.7 | 1.47 | 3.6 | 1.12 | 2.9 |
| S | 2.85 | 25.6 | 1.98 | 15.1 | 1.57 | 6.9 | 3.14 | 29.7 | 2.99 | 27.5 | 2.93 | 26.6 | 2.9 | 26.2 | 2.08 | 15.8 | 1.65 | 7.8 | |
| Melbourne | N | 2.05 | 15.8 | 1.52 | 9.8 | 0.32 | 0.7 | 2.81 | 25.6 | 2.57 | 19.9 | 2.44 | 18.8 | 2.25 | 17 | 1.13 | 3.1 | 0.68 | 1.9 |
| S | 2.69 | 20.1 | 1.55 | 9.9 | 0.65 | 1.6 | 3.28 | 38.6 | 3.01 | 29.3 | 2.92 | 27.5 | 2.84 | 21.9 | 1.46 | 8.9 | 0.99 | 2.7 | |
| Protected Case 1 | Mineral Wool | EPS | Wood Fibre | ||||||||||||||||
| No WRB | No WRB | No WRB | |||||||||||||||||
| Climate | O | A | B | A | B | A | B | ||||||||||||
| Cairns | N | 0.53 | 3 | 0.1 | 0.7 | 0.49 | 3.2 | ||||||||||||
| S | 3.86 | 35.6 | 0.55 | 6.9 | 3.98 | 38.3 | |||||||||||||
| Darwin | N | 2.15 | 15.2 | 0.68 | 2.6 | 3.71 | 15.4 | ||||||||||||
| S | 1.15 | 8.1 | 0.27 | 2.5 | 1.11 | 7.2 | |||||||||||||
| Brisbane | N | 0.18 | 0 | 0.03 | 0 | 0.08 | 0 | ||||||||||||
| S | 0.4 | 1.7 | 0.07 | 0.2 | 0.19 | 0.5 | |||||||||||||
| Melbourne | N | 0 | 0 | 0 | 0 | 0 | 0 | ||||||||||||
| S | 0.27 | 20.2 | 0 | 0 | 0.01 | 0 | |||||||||||||
| Protected Case 2 | Mineral Wool | EPS | Wood Fibre | ||||||||||||||||
| Class 2 | Class 3 | Class 4 | Class 2 | Class 3 | Class 4 | Class 2 | Class 3 | Class 4 | |||||||||||
| Climate | O | A | B | A | B | A | B | A | B | A | B | A | B | A | B | A | B | A | B |
| Cairns | N | 0.43 | 2.8 | 0.28 | 1.8 | 0.43 | 2.8 | 0.09 | 0.6 | 0.05 | 0 | 0.09 | 0.6 | 0.44 | 3 | 0.32 | 2 | 0.44 | 3 |
| S | 0.5 | 3.9 | 1.65 | 27.5 | 3.28 | 34.6 | 0.22 | 2.4 | 0.44 | 3.1 | 0.53 | 5.8 | 0.61 | 10.4 | 2.14 | 31.4 | 3.46 | 37.3 | |
| Darwin | N | 0.64 | 2.7 | 1.39 | 7.1 | 1.91 | 13.8 | 0.35 | 2.4 | 0.57 | 2.6 | 0.66 | 2.6 | 0.91 | 3.5 | 1.87 | 8.2 | 2.93 | 14.2 |
| S | 0.27 | 2.1 | 0.71 | 2.6 | 1.05 | 6.6 | 0.02 | 0 | 0.2 | 2.2 | 0.26 | 2.5 | 0.31 | 2.9 | 0.74 | 2.9 | 1.03 | 5.5 | |
| Brisbane | N | 0 | 0 | 0.03 | 0 | 0.1 | 0 | 0 | 0 | 0.02 | 0 | 0.03 | 0 | 0.01 | 0 | 0.04 | 0 | 0.05 | 0 |
| S | 0.06 | 0.1 | 0.12 | 0.3 | 0.22 | 1.1 | 0.04 | 0 | 0.06 | 0.1 | 0.07 | 0.2 | 0.06 | 0.3 | 0.13 | 0.4 | 0.17 | 0.4 | |
| Melbourne | N | 0 | 0 | 0 | 0 | 0 | 0 | 0 | 0 | 0 | 0 | 0 | 0 | 0 | 0 | 0 | 0 | 0 | 0 |
| S | 0.28 | 20.6 | 0.02 | 0 | 0.27 | 19.9 | 0 | 0 | 0 | 0 | 0 | 0 | 0 | 0 | 0 | 0 | 0.01 | 0 | |
| Protected Case 3 | Mineral Wool | EPS | Wood Fibre | ||||||||||||||||
| Class 2 | Class 3 | Class 4 | Class 2 | Class 3 | Class 4 | Class 2 | Class 3 | Class 4 | |||||||||||
| Climate | O | A | B | A | B | A | B | A | B | A | B | A | B | A | B | A | B | A | B |
| Cairns | N | 0.06 | 0.2 | 0.26 | 1.9 | 0.41 | 2.4 | 0.02 | 0 | 0.11 | 1.4 | 0.17 | 1.7 | 0.13 | 1.2 | 0.28 | 2 | 0.42 | 2.3 |
| S | 0.43 | 3 | 1.24 | 25.3 | 2.81 | 33.8 | 0.33 | 3 | 0.58 | 8.4 | 0.71 | 14.3 | 0.42 | 3.1 | 1.05 | 23.1 | 2.29 | 34 | |
| Darwin | N | 0.6 | 2.6 | 1.3 | 6.3 | 1.79 | 14.2 | 0.42 | 2.5 | 0.66 | 2.6 | 0.79 | 2.7 | 0.64 | 2.9 | 1.24 | 4.6 | 1.68 | 13.4 |
| S | 0.21 | 2.4 | 0.62 | 2.6 | 0.92 | 7.2 | 0.05 | 0.6 | 0.28 | 2.6 | 0.35 | 2.7 | 0.25 | 2.6 | 0.61 | 2.8 | 0.87 | 5.1 | |
| Brisbane | N | 0.01 | 0 | 0.03 | 0 | 0.05 | 0 | 0 | 0 | 0.01 | 0 | 0.02 | 0 | 0.03 | 0 | 0.04 | 0 | 0.05 | 0 |
| S | 0.05 | 0.2 | 0.13 | 0.5 | 0.26 | 0.9 | 0.05 | 0.1 | 0.08 | 0.3 | 0.1 | 0.6 | 0.08 | 0.3 | 0.13 | 0.4 | 0.18 | 0.6 | |
| Melbourne | N | 0.01 | 0 | 0 | 0 | 0 | 0 | 0 | 0 | 0 | 0 | 0 | 0 | 0.04 | 0 | 0.02 | 0 | 0.01 | 0 |
| S | 0.26 | 19.2 | 0.25 | 18.8 | 0.25 | 18.7 | 0 | 0 | 0 | 0 | 0 | 0 | 0.02 | 0 | 0.01 | 0 | 0 | 0 | |
| Unprotected Case 2 | Mineral Wool | EPS | Wood Fibre | ||||||||||||||||
|---|---|---|---|---|---|---|---|---|---|---|---|---|---|---|---|---|---|---|---|
| Class 2 | Class 3 | Class 4 | Class 2 | Class 3 | Class 4 | Class 2 | Class 3 | Class 4 | |||||||||||
| Climate | O | A | B | A | B | A | B | A | B | A | B | A | B | A | B | A | B | A | B |
| Cairns | N | 1.44 | 3.6 | 1.63 | 3.5 | 1.44 | 3.6 | 2.04 | 9.8 | 2.04 | 12 | 2.04 | 9.8 | 1.52 | 3.9 | 1.72 | 4 | 1.52 | 3.9 |
| S | 2.87 | 23.3 | 2.87 | 37.4 | 3.29 | 40.2 | 3.01 | 34.2 | 2.74 | 30.7 | 2.71 | 28.9 | 2.94 | 29.6 | 2.94 | 41 | 3.52 | 43.8 | |
| Darwin | N | 2.33 | 12.6 | 2.46 | 11 | 2.82 | 15.4 | 2.41 | 13.8 | 2.31 | 13.2 | 2.27 | 10.8 | 2.59 | 13 | 2.95 | 12.6 | 3.76 | 16.9 |
| S | 2.52 | 13.7 | 2.08 | 9.6 | 2.02 | 8.8 | 2.74 | 22.3 | 2.48 | 17.5 | 2.35 | 15.4 | 2.59 | 14.2 | 2.16 | 10.9 | 2.06 | 8.5 | |
| Brisbane | N | 1.74 | 10.6 | 1.11 | 2.3 | 0.69 | 1.5 | 2.26 | 22.5 | 2.26 | 19.1 | 2.26 | 18.8 | 1.8 | 11.6 | 1.2 | 2.8 | 0.83 | 1.8 |
| S | 2.83 | 26.2 | 1.88 | 14.1 | 1.36 | 7.1 | 3.03 | 38.4 | 2.72 | 28.5 | 2.55 | 25.7 | 2.85 | 26.5 | 1.94 | 15.2 | 1.45 | 7.5 | |
| Melbourne | N | 1.94 | 15.7 | 1.7 | 10.4 | 0.23 | 0.4 | 2.75 | 31.7 | 2.99 | 30.2 | 2.31 | 26.9 | 2.09 | 16.7 | 0.94 | 2.3 | 0.47 | 1.2 |
| S | 2.75 | 26.9 | 2.21 | 19 | 0.95 | 24.8 | 3.21 | 59.2 | 2.97 | 41.2 | 2.81 | 37.5 | 2.85 | 27.5 | 1.37 | 8.5 | 0.86 | 7.6 | |
| Protected Case 1 | Mineral Wool | EPS | Wood Fibre | ||||||||||||||||
| No WRB | No WRB | No WRB | |||||||||||||||||
| Climate | O | A | B | A | B | A | B | ||||||||||||
| Cairns | N | 0.37 | 1.3 | 0.37 | 1.4 | 0.37 | 1.4 | ||||||||||||
| S | 4.11 | 33.1 | 4.13 | 34.3 | 4.08 | 33 | |||||||||||||
| Darwin | N | 1.84 | 8.4 | 1.82 | 8.6 | 1.85 | 8.4 | ||||||||||||
| S | 0.62 | 1.9 | 0.61 | 1.8 | 0.62 | 1.9 | |||||||||||||
| Brisbane | N | 0.2 | 0 | 0.2 | 0 | 0.2 | 0 | ||||||||||||
| S | 0.5 | 6.7 | 0.51 | 3.8 | 0.49 | 3.6 | |||||||||||||
| Melbourne | N | 0.12 | 3.5 | 0.02 | 0 | 0.02 | 0 | ||||||||||||
| S | 3.43 | 61.5 | 0.16 | 3 | 2.61 | 54.2 | |||||||||||||
| Protected Case 2 | Mineral Wool | EPS | Wood Fibre | ||||||||||||||||
| Class 2 | Class 3 | Class 4 | Class 2 | Class 3 | Class 4 | Class 2 | Class 3 | Class 4 | |||||||||||
| Climate | O | A | B | A | B | A | B | A | B | A | B | A | B | A | B | A | B | A | B |
| Cairns | N | 0 | 0 | 0.06 | 0 | 0.18 | 0.4 | 0 | 0 | 0.06 | 0 | 0.18 | 0.3 | 0 | 0 | 0.06 | 0 | 0.18 | 0.4 |
| S | 0.24 | 2.3 | 0.9 | 17.7 | 2.71 | 29.5 | 0.25 | 2.4 | 1.01 | 19.1 | 2.76 | 30.8 | 0.23 | 2.3 | 0.9 | 17.7 | 2.7 | 29.5 | |
| Darwin | N | 0.35 | 2.2 | 0.94 | 2.8 | 1.43 | 6.3 | 0.37 | 2.3 | 0.94 | 3 | 1.41 | 6.5 | 0.34 | 2.2 | 0.94 | 2.8 | 1.44 | 6.4 |
| S | 0.01 | 0 | 0.12 | 0.6 | 0.37 | 1.4 | 0.01 | 0 | 0.12 | 0.7 | 0.35 | 1.4 | 0.01 | 0 | 0.13 | 0.7 | 0.37 | 1.5 | |
| Brisbane | N | 0 | 0 | 0.01 | 0 | 0.07 | 0 | 0 | 0 | 0.01 | 0 | 0.07 | 0 | 0.01 | 0 | 0.01 | 0 | 0.07 | 0 |
| S | 0.29 | 6.6 | 0.3 | 6.5 | 0.3 | 6.5 | 0.03 | 0 | 0.09 | 0.1 | 0.19 | 2.7 | 0.11 | 1.3 | 0.11 | 1.2 | 0.17 | 2.3 | |
| Melbourne | N | 0.12 | 3.8 | 0.12 | 3.5 | 0.11 | 3.4 | 0 | 0 | 0 | 0 | 0 | 0 | 0 | 0 | 0 | 0 | 0 | 0 |
| S | 3.45 | 62.2 | 3.43 | 61.5 | 3.42 | 61.4 | 0.13 | 3.5 | 0.11 | 3 | 0.1 | 2.9 | 2.66 | 55.2 | 2.61 | 54.3 | 2.6 | 54.1 | |
| Unprotected Case 2 | Mineral Wool | EPS | Wood Fibre | ||||||||||||||||
|---|---|---|---|---|---|---|---|---|---|---|---|---|---|---|---|---|---|---|---|
| Class 2 | Class 3 | Class 4 | Class 2 | Class 3 | Class 4 | Class 2 | Class 3 | Class 4 | |||||||||||
| Climate | O | A | B | A | B | A | B | A | B | A | B | A | B | A | B | A | B | A | B |
| Cairns | N | 1.74 | 5.6 | 1.32 | 2.5 | 1.07 | 2 | 2.71 | 18.8 | 2.71 | 16.5 | 2.71 | 15.4 | 1.73 | 5.9 | 1.32 | 2.5 | 1.07 | 2 |
| S | 2.71 | 17.7 | 2.36 | 25.9 | 2.86 | 33.1 | 2.73 | 34.3 | 2.62 | 31.1 | 3.01 | 35.9 | 2.71 | 18.2 | 2.39 | 25.9 | 2.87 | 33.1 | |
| Darwin | N | 2.01 | 3.6 | 2 | 3.8 | 2.17 | 7.1 | 2.71 | 17.3 | 2.71 | 15.7 | 2.7 | 15.2 | 2.01 | 5 | 2 | 3.9 | 2.17 | 7.2 |
| S | 2.17 | 12.1 | 1.54 | 3.4 | 1.3 | 2.7 | 2.59 | 20.1 | 2.59 | 16.9 | 2.58 | 16.3 | 2.16 | 12.3 | 1.54 | 3.4 | 1.3 | 2.7 | |
| Brisbane | N | 1.47 | 6.4 | 0.88 | 1.8 | 0.42 | 0.8 | 2.78 | 25.1 | 2.78 | 19.6 | 2.78 | 19.1 | 1.47 | 6.5 | 0.88 | 1.8 | 0.42 | 0.8 |
| S | 2.72 | 26.6 | 1.76 | 13.3 | 1.16 | 9.1 | 2.74 | 40.5 | 2.73 | 29.7 | 2.73 | 28.5 | 2.73 | 26.8 | 1.77 | 13.5 | 1.16 | 8.1 | |
| Melbourne | N | 0.1 | 2.1 | 0.11 | 2.3 | 0.11 | 2.3 | 2.95 | 39.8 | 2.95 | 29.6 | 2.95 | 28.8 | 1.07 | 9 | 0.99 | 7.7 | 1 | 7.2 |
| S | 3.56 | 57.2 | 3.6 | 56.3 | 3.61 | 55.9 | 2.94 | 81.2 | 2.94 | 48.5 | 2.94 | 47.2 | 3.07 | 66.1 | 3.07 | 63.1 | 3.07 | 62.3 | |
Publisher’s Note: MDPI stays neutral with regard to jurisdictional claims in published maps and institutional affiliations. |
© 2021 by the authors. Licensee MDPI, Basel, Switzerland. This article is an open access article distributed under the terms and conditions of the Creative Commons Attribution (CC BY) license (https://creativecommons.org/licenses/by/4.0/).
Share and Cite
Strang, M.; Leardini, P.; Brambilla, A.; Gasparri, E. Mass Timber Envelopes in Passivhaus Buildings: Designing for Moisture Safety in Hot and Humid Australian Climates. Buildings 2021, 11, 478. https://0-doi-org.brum.beds.ac.uk/10.3390/buildings11100478
Strang M, Leardini P, Brambilla A, Gasparri E. Mass Timber Envelopes in Passivhaus Buildings: Designing for Moisture Safety in Hot and Humid Australian Climates. Buildings. 2021; 11(10):478. https://0-doi-org.brum.beds.ac.uk/10.3390/buildings11100478
Chicago/Turabian StyleStrang, Marcus, Paola Leardini, Arianna Brambilla, and Eugenia Gasparri. 2021. "Mass Timber Envelopes in Passivhaus Buildings: Designing for Moisture Safety in Hot and Humid Australian Climates" Buildings 11, no. 10: 478. https://0-doi-org.brum.beds.ac.uk/10.3390/buildings11100478