
Numerical Investigation of Bioaerosol Transport in a Compact Lavatory


1
Ocean College, Zhoushan Campus, Zhejiang University, Hangzhou 310027, China
2
Key Laboratory of Refrigeration and Cryogenic Technology of Zhejiang Province, Institute of Refrigeration and Cryogenics, Zhejiang University, Hangzhou 310027, China
3
Tianjin Key Laboratory of Indoor Air Environmental Quality Control, School of Environmental Science and Engineering, Tianjin University, Tianjin 300072, China
*
Authors to whom correspondence should be addressed.
Buildings 2021, 11(11), 526; https://0-doi-org.brum.beds.ac.uk/10.3390/buildings11110526
Submission received: 15 October 2021
/
Revised: 3 November 2021
/
Accepted: 5 November 2021
/
Published: 8 November 2021
(This article belongs to the Special Issue Toward Immune Buildings: Lessons Learned from the COVID-19 Pandemic and Its Aftermath)
Abstract
:The lavatory is a fertile area for the transmission of infectious disease through bioaerosols between its users. In this study, we built a generic compact lavatory model with a vacuum toilet, and computational fluid dynamics (CFD) is used to evaluate the effects of ventilation and user behaviors on the airflow patterns, and the resulting fates of bioaerosols. Fecal aerosols are readily released into the lavatory during toilet flush. Their concentration rapidly decays in the first 20 s after flushing by deposition or dilution. It takes about 315 s to 348 s for fine bioaerosols (<10 µm in diameter) to decrease to 5% of the initial concentration, while it takes 50 and 100 µm bioaerosols approximately 11 and <1 s, respectively, to completely deposit. The most contaminated surfaces by aerosol deposition include the toilet seat, the bowl, and the nearby walls. The 10 µm aerosols tend to deposit on horizontal surfaces, while the 50 and 100 µm bioaerosols almost always deposit on the bowl. In the presence of a standing thermal manikin, the rising thermal plume alters the flow field and more bioaerosols are carried out from the toilet; a large fraction of aerosols deposit on the manikin’s legs. The respiratory droplets generated by a seated coughing manikin tend to deposit on the floor, legs, and feet of the manikin. In summary, this study reveals the bioaerosol dilution time and the easily contaminated surfaces in a compact lavatory, which will aid the development of control measures against infectious diseases.
1. Introduction
The disease transmission by the lavatory inside built environments or mobile vehicles is a common and important routine. Lavatories harbor the highest risk of pathogen cross-infection. For example, Widdowson et al. [1] investigated the transmission of norovirus on a flight and found that lavatories are closely related to disease transmission. Thus, an in-flight incident of vomiting in the cabin and lavatory on a trans-Pacific flight resulted in an outbreak of gastrointestinal illness among passengers, suggestive of a viral infection, highlighting the potential of aerosol transmission and surface contamination in a closed environment. The spread of the infection may have been facilitated by cross-contamination in the toilet cubicle [2]. Many people are unaware of the risk of airborne dissemination of microbes when flushing a toilet, and the consequent surface contamination that may spread infection within a household via surface-to-hand-to-mouth contact [3]. Pathogens can also be directly transmitted via aerosol droplets generated from feces or vomit in toilets. When the fluid in these aerosols evaporates, the resulting desiccated droplet nuclei, which can also carry pathogens, deposit onto high-touch surfaces such as toilets and handwash sinks. Susceptible persons who contact these contaminated surfaces (i.e., fomites) may transfer the pathogens to their mucous membranes due to poor hygiene habits, such as a lack of hand hygiene, leading to a risk of respiratory infection [4,5]. Moreover, some enteric viruses can remain airborne after flushing, and can cause infection when inhaled and swallowed. Under certain conditions, even when only a small group of people use aircraft toilets, most high-touch surfaces in an aircraft cabin are contaminated in 2 to 3 h, and nearly all touchable surfaces are contaminated in 5 to 6 h [6]. Because of such indirect transmission via fomites, decreasing the contact rate is a relatively more effective measure of reducing infection risk than is increasing the ventilation rate [4].
There have been a few studies of lavatories in the context of transmission routes and the distribution of microbes with pathogenic risk. In toilets, virus exposure mainly occurs during contact with virus-contaminated surfaces [7]. The concentration and incidence of surface contamination are highest nearest to the toilet bowl, particularly on the toilet seat and the toilet bowl rim [8]. It is notable that for the same flush volume, a double-trap siphonic toilet produces approximately only 1/14 of the bioaerosol (concentration) as a wash-down pan [9]. In a hospital-based study, the highest concentrations of Clostridium difficile were recovered from air sampled immediately after flushing, and concentrations declined eight-fold after 60 min and a further threefold after 90 min [10]. Surfaces were contaminated with C. difficile within 90 min after flushing, demonstrating that flushing releases relatively large droplets that contaminate the immediate environment. In addition, toilet plumes can contribute to the transmission of infectious diseases, as flushing may produce substantial quantities of potentially infectious aerosols, to which subsequent toilet users may be exposed [11].
An experimental model enables direct exploration of the characteristics of airflow organization, but the narrowness of an aircraft lavatory imposes some limitations. For example, it is difficult to obtain data suitable for point-by-point comparison with computational fluid dynamics (CFD) results, because the probes of anemometers have relatively large spans; therefore, the measured velocity must be the average of a large number of repeated measurements [12]. Ultrasonic anemometers (UA) can provide three-dimensional, point-by-point airflow information, but UA sensors are expensive, and several sensors are necessary to obtain high-resolution results [13,14]. Particle image velocimetry and volumetric particle-streak velocimetry can also be used to measure flow fields (such as in a cabin model), but these methods require that clear paths are available for optical measurement. This necessitates modification of the geometric conditions of an aircraft lavatory model, meaning that the model no longer accurately represents a real aircraft lavatory, especially when a manikin is involved. This also affects the characterization of particle transport (i.e., airflow patterns) using optical anemometry, as measurements can only be made in spaces that can be penetrated by a laser light sheet. Moreover, it is difficult to maintain sufficient concentrations of diethylhexyl sebacate droplets and tracer particles during a series of long-term experiments [15].
The use of CFD for modeling airflow fields and particle transport is well developed. Several turbulence models, such as Reynolds-averaged Navier–Stokes models, large-eddy simulation models, and detached-eddy simulation models, have been reviewed and tested [13,16,17,18]. The Eulerian and Lagrangian methods are two popular methods for numerically modeling particle distribution in ventilated rooms. The Eulerian method, in which the drift flux model is often used to consider the slippage between the particle phase and the fluid (air) phase [19], is less computationally expensive and is reliable for predicting particle concentrations, especially small-sized particle concentrations [20,21]. The Lagrangian method with the discrete random walk (DRW) model has also performed well in modeling and analyzing particle transport and dispersion [13,22]. However, bioaerosol transport processes during flushing and coughing are in unsteady states; thus, the Lagrangian method may be more accurate than the Eulerian method for analyzing a developing airflow field, because the former better accounts for the physics of airflow and bioaerosol motion [23].
If lavatories are used by people carrying an infectious disease, the disease may be spread via air, or by indirect contact of contaminated surfaces (fomites). Thus, the lavatory ventilation characteristics affecting the dispersion and deposition of bioaerosols must be comprehensively understood. Numerical CFD simulations of the Lagrangian particle tracking method were used in this study to predict generic compact lavatory bioaerosol dispersion and concentration distributions. The simulations explored the effects of a standing manikin flushing a toilet and a seated manikin coughing.
2. Materials and Methods
2.1. Lavatory Model
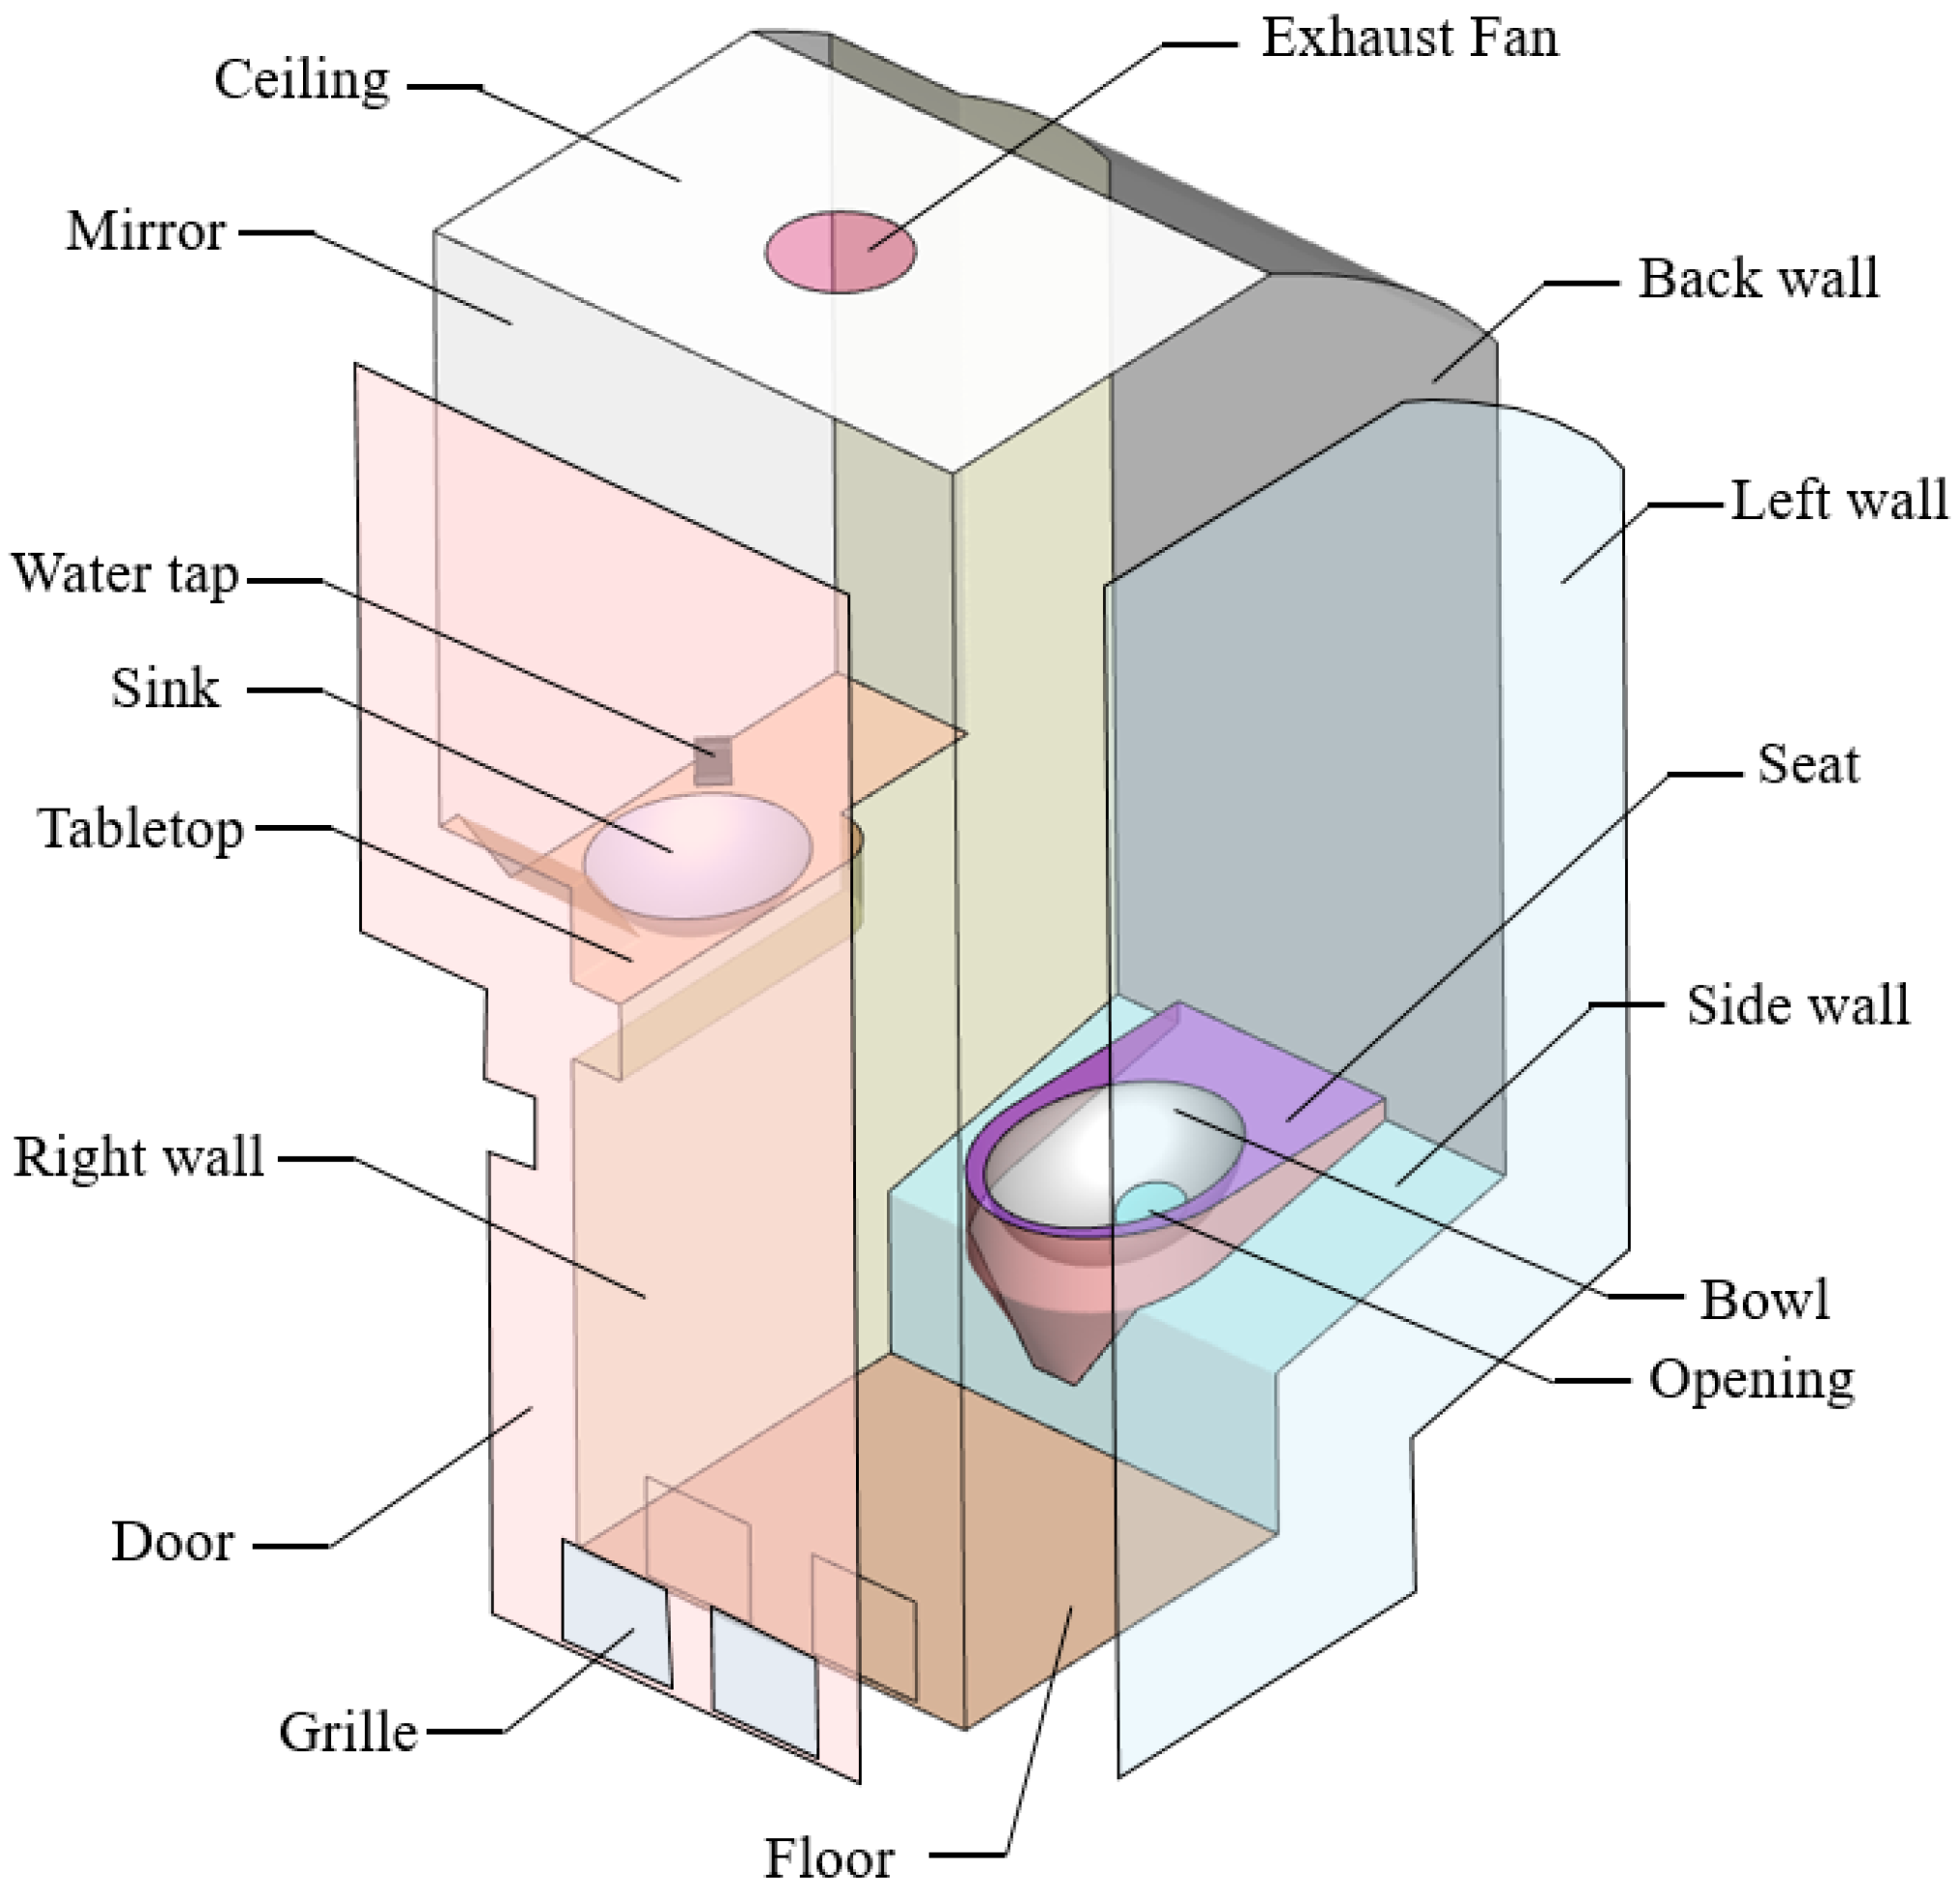
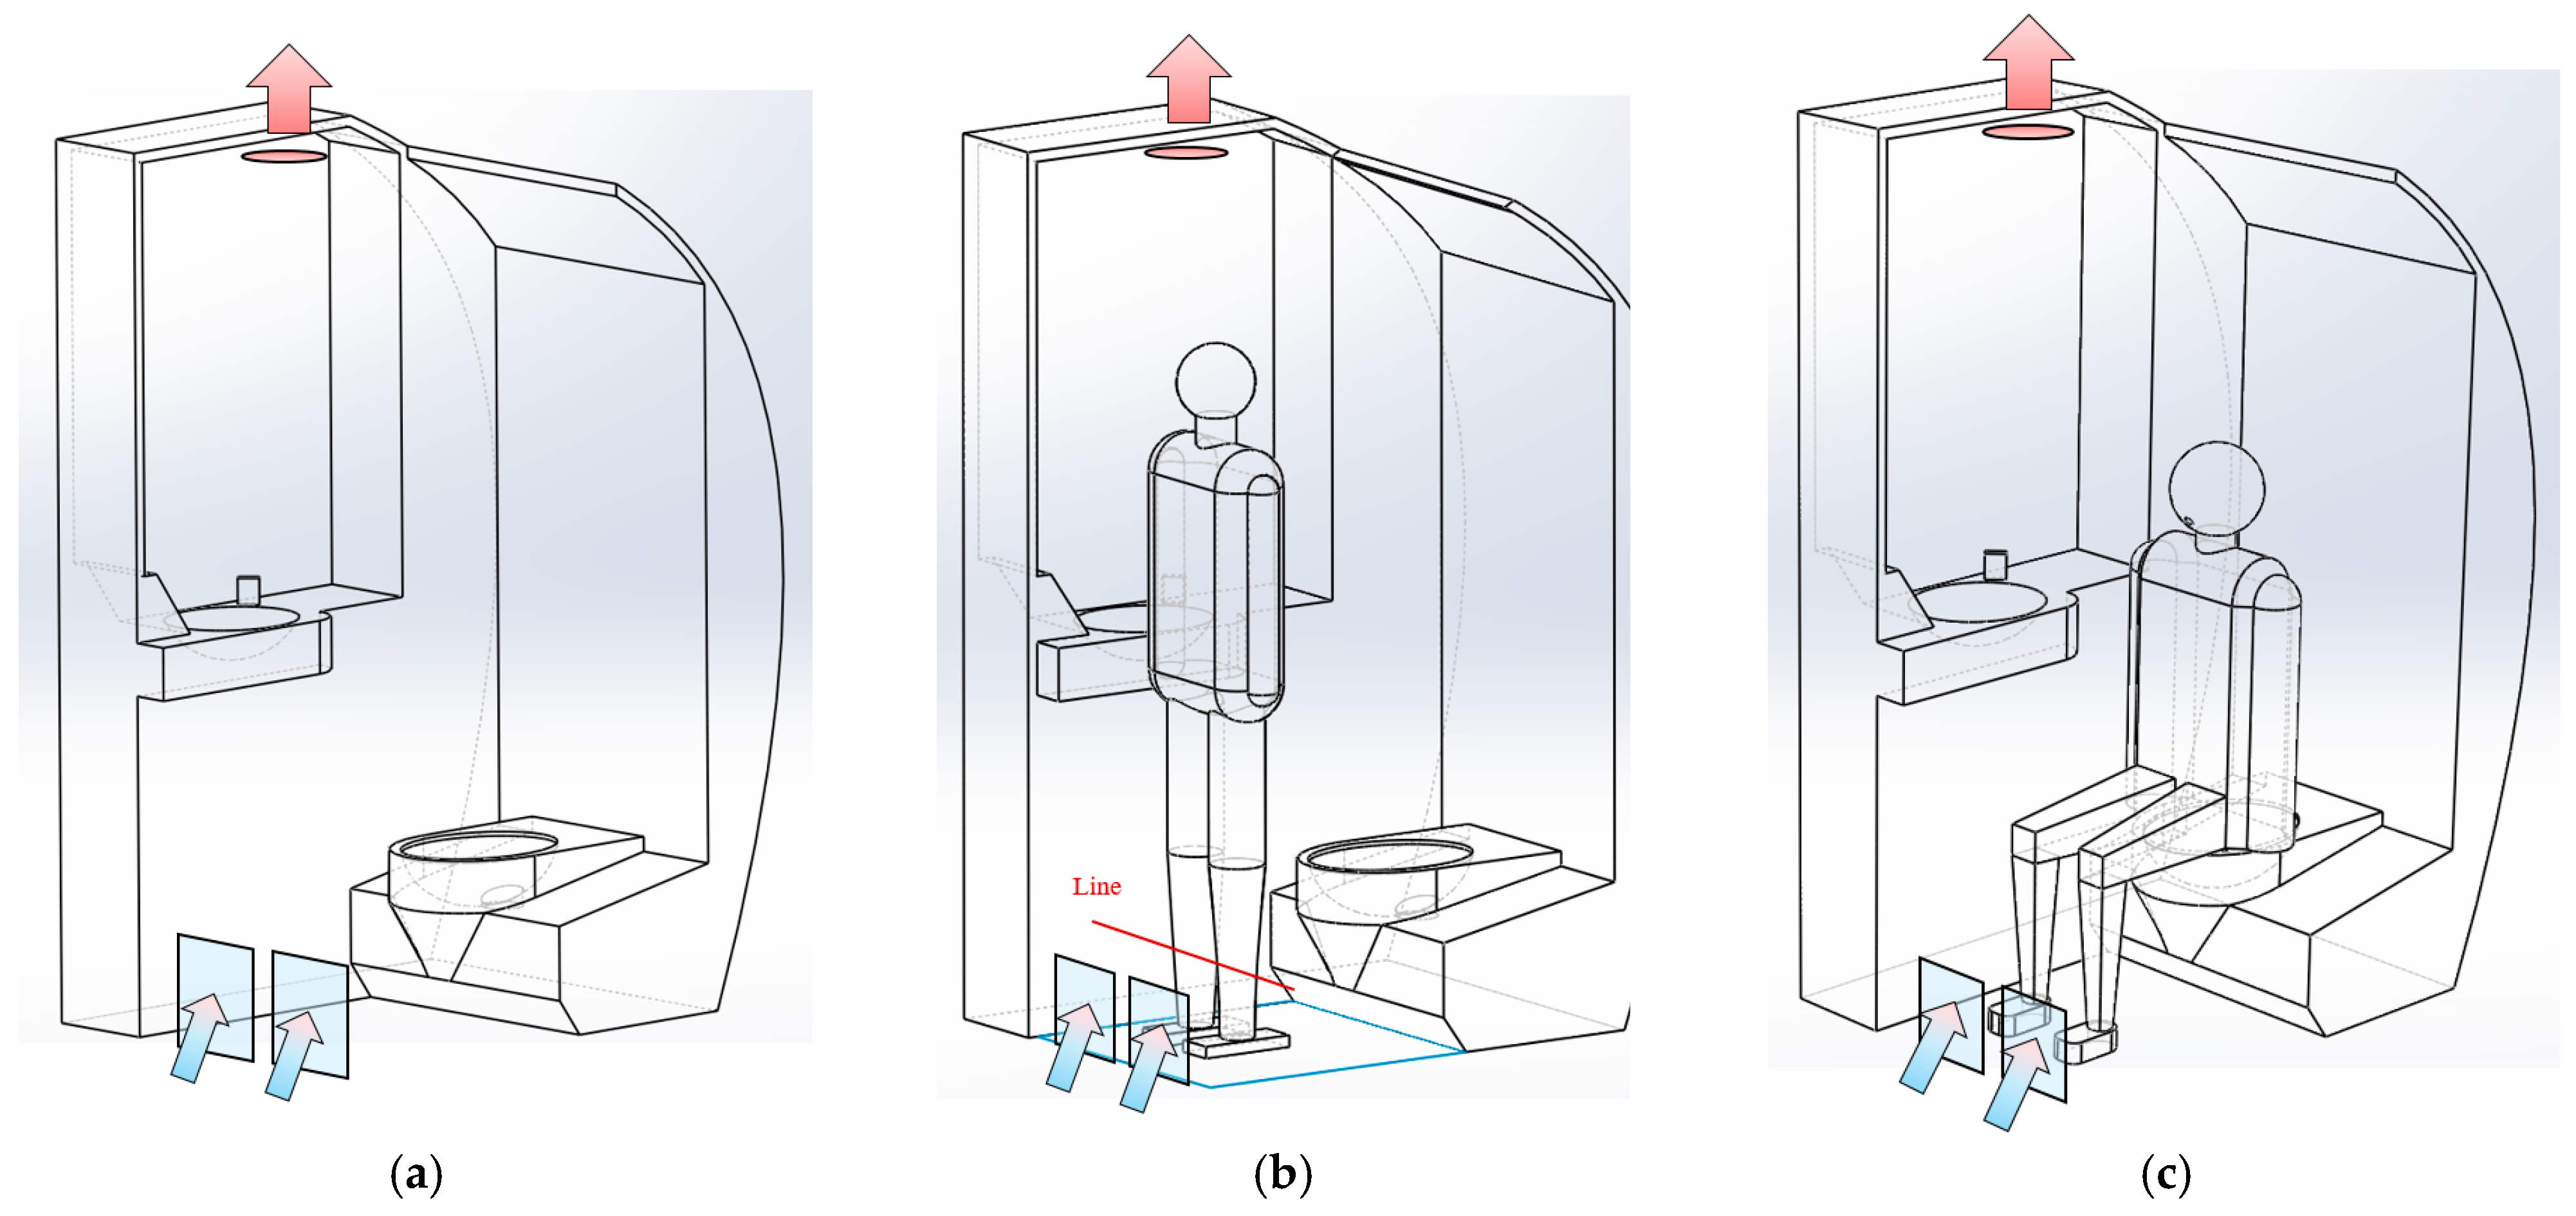
A generic compact lavatory model with vacuum toilet was built in this study (Figure 1), which is representative and can be easily extended to lavatories of aircrafts, trains, or other vehicles. The lavatory is 1.35 m (L) × 1.0125 m (W) × 2.15 m (H) in dimension, and includes a toilet bowl, a sink, a toilet seat, a mirror, a water tap, a tabletop, and walls. The following simplifications were made in replicating the layout of the lavatory. The complex shape of the tap was simplified as rectangle, because a user only touches the top of the tap while washing his/her hands. In addition, only the toilet seat, bowl, and the opening of the vacuum toilet trap were modeled; the other elements were ignored because they are usually small and do not markedly affect the airflow pattern. The diameter of the air outlet is 0.22 m, and the two inlets are 0.2 m × 0.18 m. The user standing in front of the toilet or sitting on the seat is 1.7 m tall. While coughing, the open area of the user’s mouth is 0.004 m2 [24]. The vacuum toilet trap was simplified to an opening of area 0.01 m2, because the complex suction process that occurs in the trap does not influence the flow or the bioaerosols; only the velocity profile needs to be measured. To determine the dispersion and deposition of fecal and respiratory bioaerosols, the following three scenarios (cases) (Figure 2) were considered: flushing the suction toilet, which releases bioaerosols from the bowl into an empty lavatory (i.e., no manikin); a manikin standing in front of the toilet, simulating the influence of a human on the flow field; and a manikin sitting on the toilet and coughing out bioaerosols.
2.2. Mesh and Grid Independence Test
An unstructured tetrahedral grid was used to discretize the volume of the complex lavatory model in ICEM CFD 19.0 (Ansys, Canonsburg, PA, USA), and Robust (Octree) was selected as the generation method. The total number of cells used in the final mesh was determined by a grid-independence test. For example, in Case 2, the airflow changes were analyzed along the horizontal line in Figure 2b, where the main airflow exits from the inlet at high velocity. Figure 3a shows that a grid resolution of 3.7 million is sufficient for predicting low velocities. The mesh details are shown in Figure 3b; a near-wall mesh with four prism layers was also created; with y+ approximately equal to 1, the first layer is 0.01 to 0.2 mm in height. After refinement, the total mesh numbers for Cases 1–3 were, respectively, 3.2 million, 5.1 million, and 4.5 million.
2.3. Numerical Models
The accurate prediction of airflow and turbulence is crucial for the successful modeling of bioaerosol deposition onto surfaces. The commercial CFD software package Ansys Fluent 18.0 (Ansys) was used to simulate airflow patterns and bioaerosol dispersion. We adapted the shear stress transmission (SST) k–ω model by comparing and validating turbulence models, which predict the turbulent kinetic energy k more accurately in the laminar sublayer and thus limit the difference between the isotropic and anisotropic eddy assumptions [25]. The semi-implicit method for pressure-linked equations algorithm was used to model pressure–velocity coupling in airflows. Second-order discretization schemes were used for the convection and viscous terms of the governing equations. A second-order scheme was applied for the pressure terms, and the second-order upwind scheme was applied for all other variables. To track the motion of the bioaerosols after coughing and flushing, the Lagrangian discrete phase model was adopted. The Lagrangian approach tracks the particle phase separately through the flow domain by solving the force momentum equations of particle movement, and by considering drag force and gravitational force [22]. The drag force is the most important force, and it follows the Stokes–Cunningham drag law; in comparison, the other forces—such as Brownian motion forces, thermophoretic forces, and Saffman’s lift forces—are negligible. That is, in ventilated rooms, the latter forces are generally two magnitudes smaller than the Stokesian force, and only become comparable in magnitude to the Stokesian force when fine particles are considered in the flow field [26]. Thus, these forces were ignored in this study. When modeling particle transport and distribution in a turbulent flow, it is important to include the effects of local turbulence intensities on the particle paths and the influence of eddy currents on particle deposition. The DRW therefore uses a stochastic approach to model particle trajectories to reduce the error caused by the random influence of turbulence [23,27].
2.4. Boundary Conditions
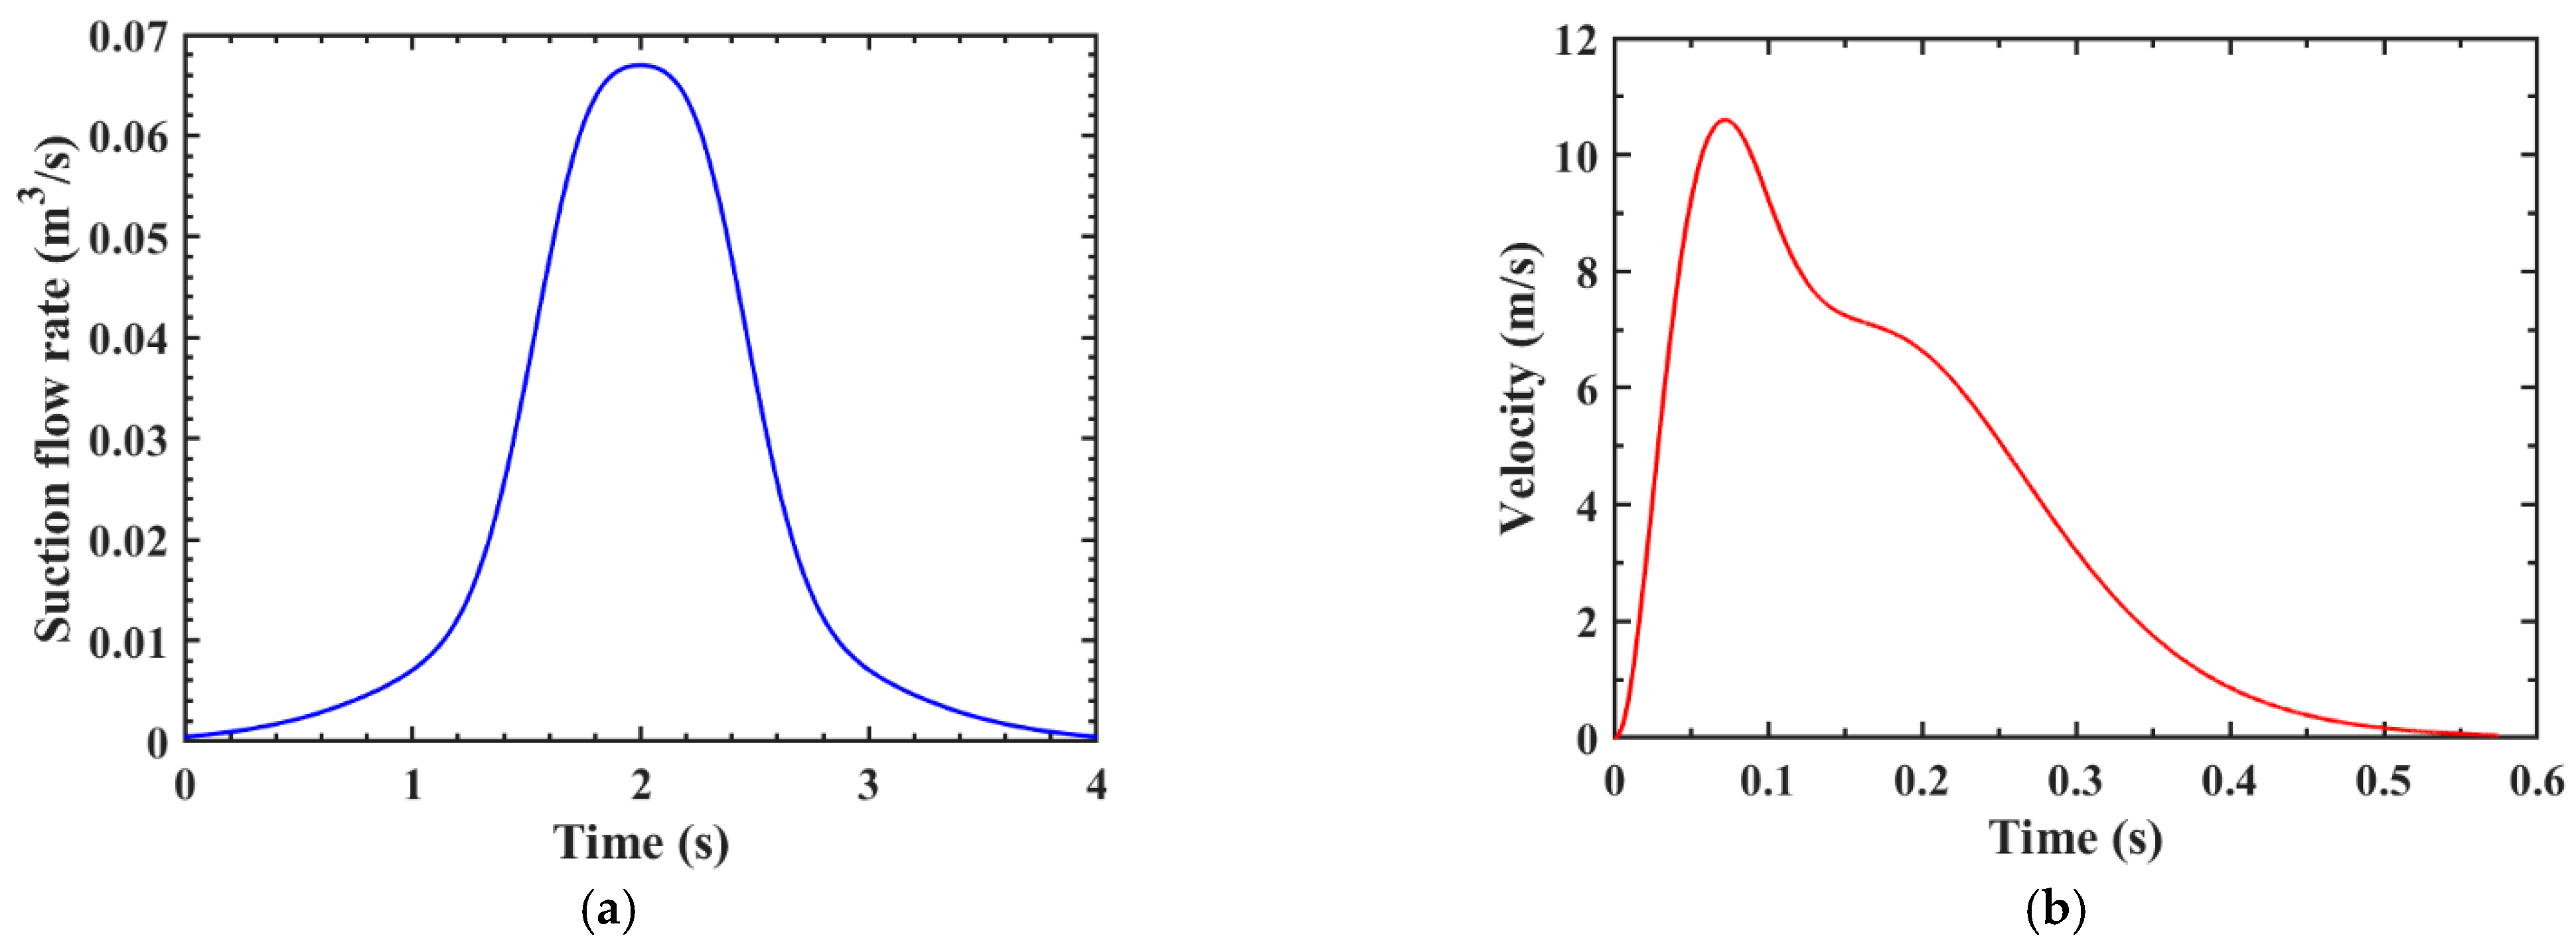
The total volume of the lavatory is 2.11 m3. Air is drawn from the ceiling exhaust (0.038 m2) at a velocity of 0.4627 m/s, with a ventilation rate of 30 air changes per hour [28]. The high air change rate is supposed to dilute the pollution effectively. The lower grille is set as pressure-inlet boundary condition with zero-gauge total pressure. The vacuum toilet suction process lasts for 4 s. The temporal suction flow rate profile at the opening of the vacuum toilet trap (0.01 m2) is shown in Figure 4a; this was obtained from the experimental measurements reported by Li and Zhang [29] and was integrated using a user-defined function (UDF) into Fluent. With each flush, 0.08 m3 of air is drawn. The volume of extraction air directly influences the main stream and disturbs the airflow above the toilet.
The manikin’s coughing process lasted for 0.6 s. The velocity profile of the cough boundary condition (Figure 4b) at the manikin mouth (4 cm2) is represented by a gamma probability distribution function for a 1.7 m tall manikin weighing 70 kg [24,30]. The cough flow rate was generally high in the first half of the coughing period (0–0.25 s), and the maximum velocity of the cough flow reached 10.6 m/s. These boundary conditions were also integrated into Fluent using a UDF.
The temperature of the supply air in all cases was 23 °C. Nonslip boundary conditions were applied to all walls in the CFD simulations, and all walls were assumed to be adiabatic. The Boussinesq approximation was applied to consider the buoyancy effect and human thermal plumes, which is a common approach in indoor airflow simulations [13,26,31]. Heat mainly dissipates from the human body by convection and radiation, and the heat dissipation capacity of a body is approximately 90 W/m2, 40% of which is heat convection. Thus, the convective heat is 36 W, and the average heat flux is 23.8 W/m2 [32].
Bioaerosols are generally treated as passive contaminants that are influenced by flow patterns but exert little effect on flows. Most airborne bacteria and viruses range in size from 0.1 to 18 µm [33]. Pathogen-carrying bioaerosols with an aerodynamic diameter of ≤10 µm are of particular interest because they can reach the alveolar region [34]. When an infected person coughs, they emit pathogen-containing respiratory droplets diversely ranging from 0.1 μm to 1000 μm, and the average size distribution of the coughed droplets is 0.62–15.9 µm [35]. A bioaerosol study by Nicas et al. [34] showed that bioaerosols with diameters 8–100 µm (or larger) account for more than 99.9% of emitted aerosol volume (and therefore more than 99.9% of the pathogens). Particle–particle interactions and the evaporation effect of droplets were not considered in this study, and the droplets were treated as droplet nuclei in the simulation [36]. Five size groups were examined: 1 µm, 5 µm, 10 µm, 50 µm, and 100 µm. The density of the bioaerosols was 1000 kg/m3. To simplify the simulation of the aerosol nuclei formed by the breakup of the water droplets, the bioaerosols were assumed to be released with zero velocity from the inner surface of the toilet bowl by flushing. The bioaerosols released from the mouth followed the trajectory of the cough flow. In this study, a trap treatment and an escape treatment were applied at the walls and the inlets, outlet, and opening of the toilet trap [36].
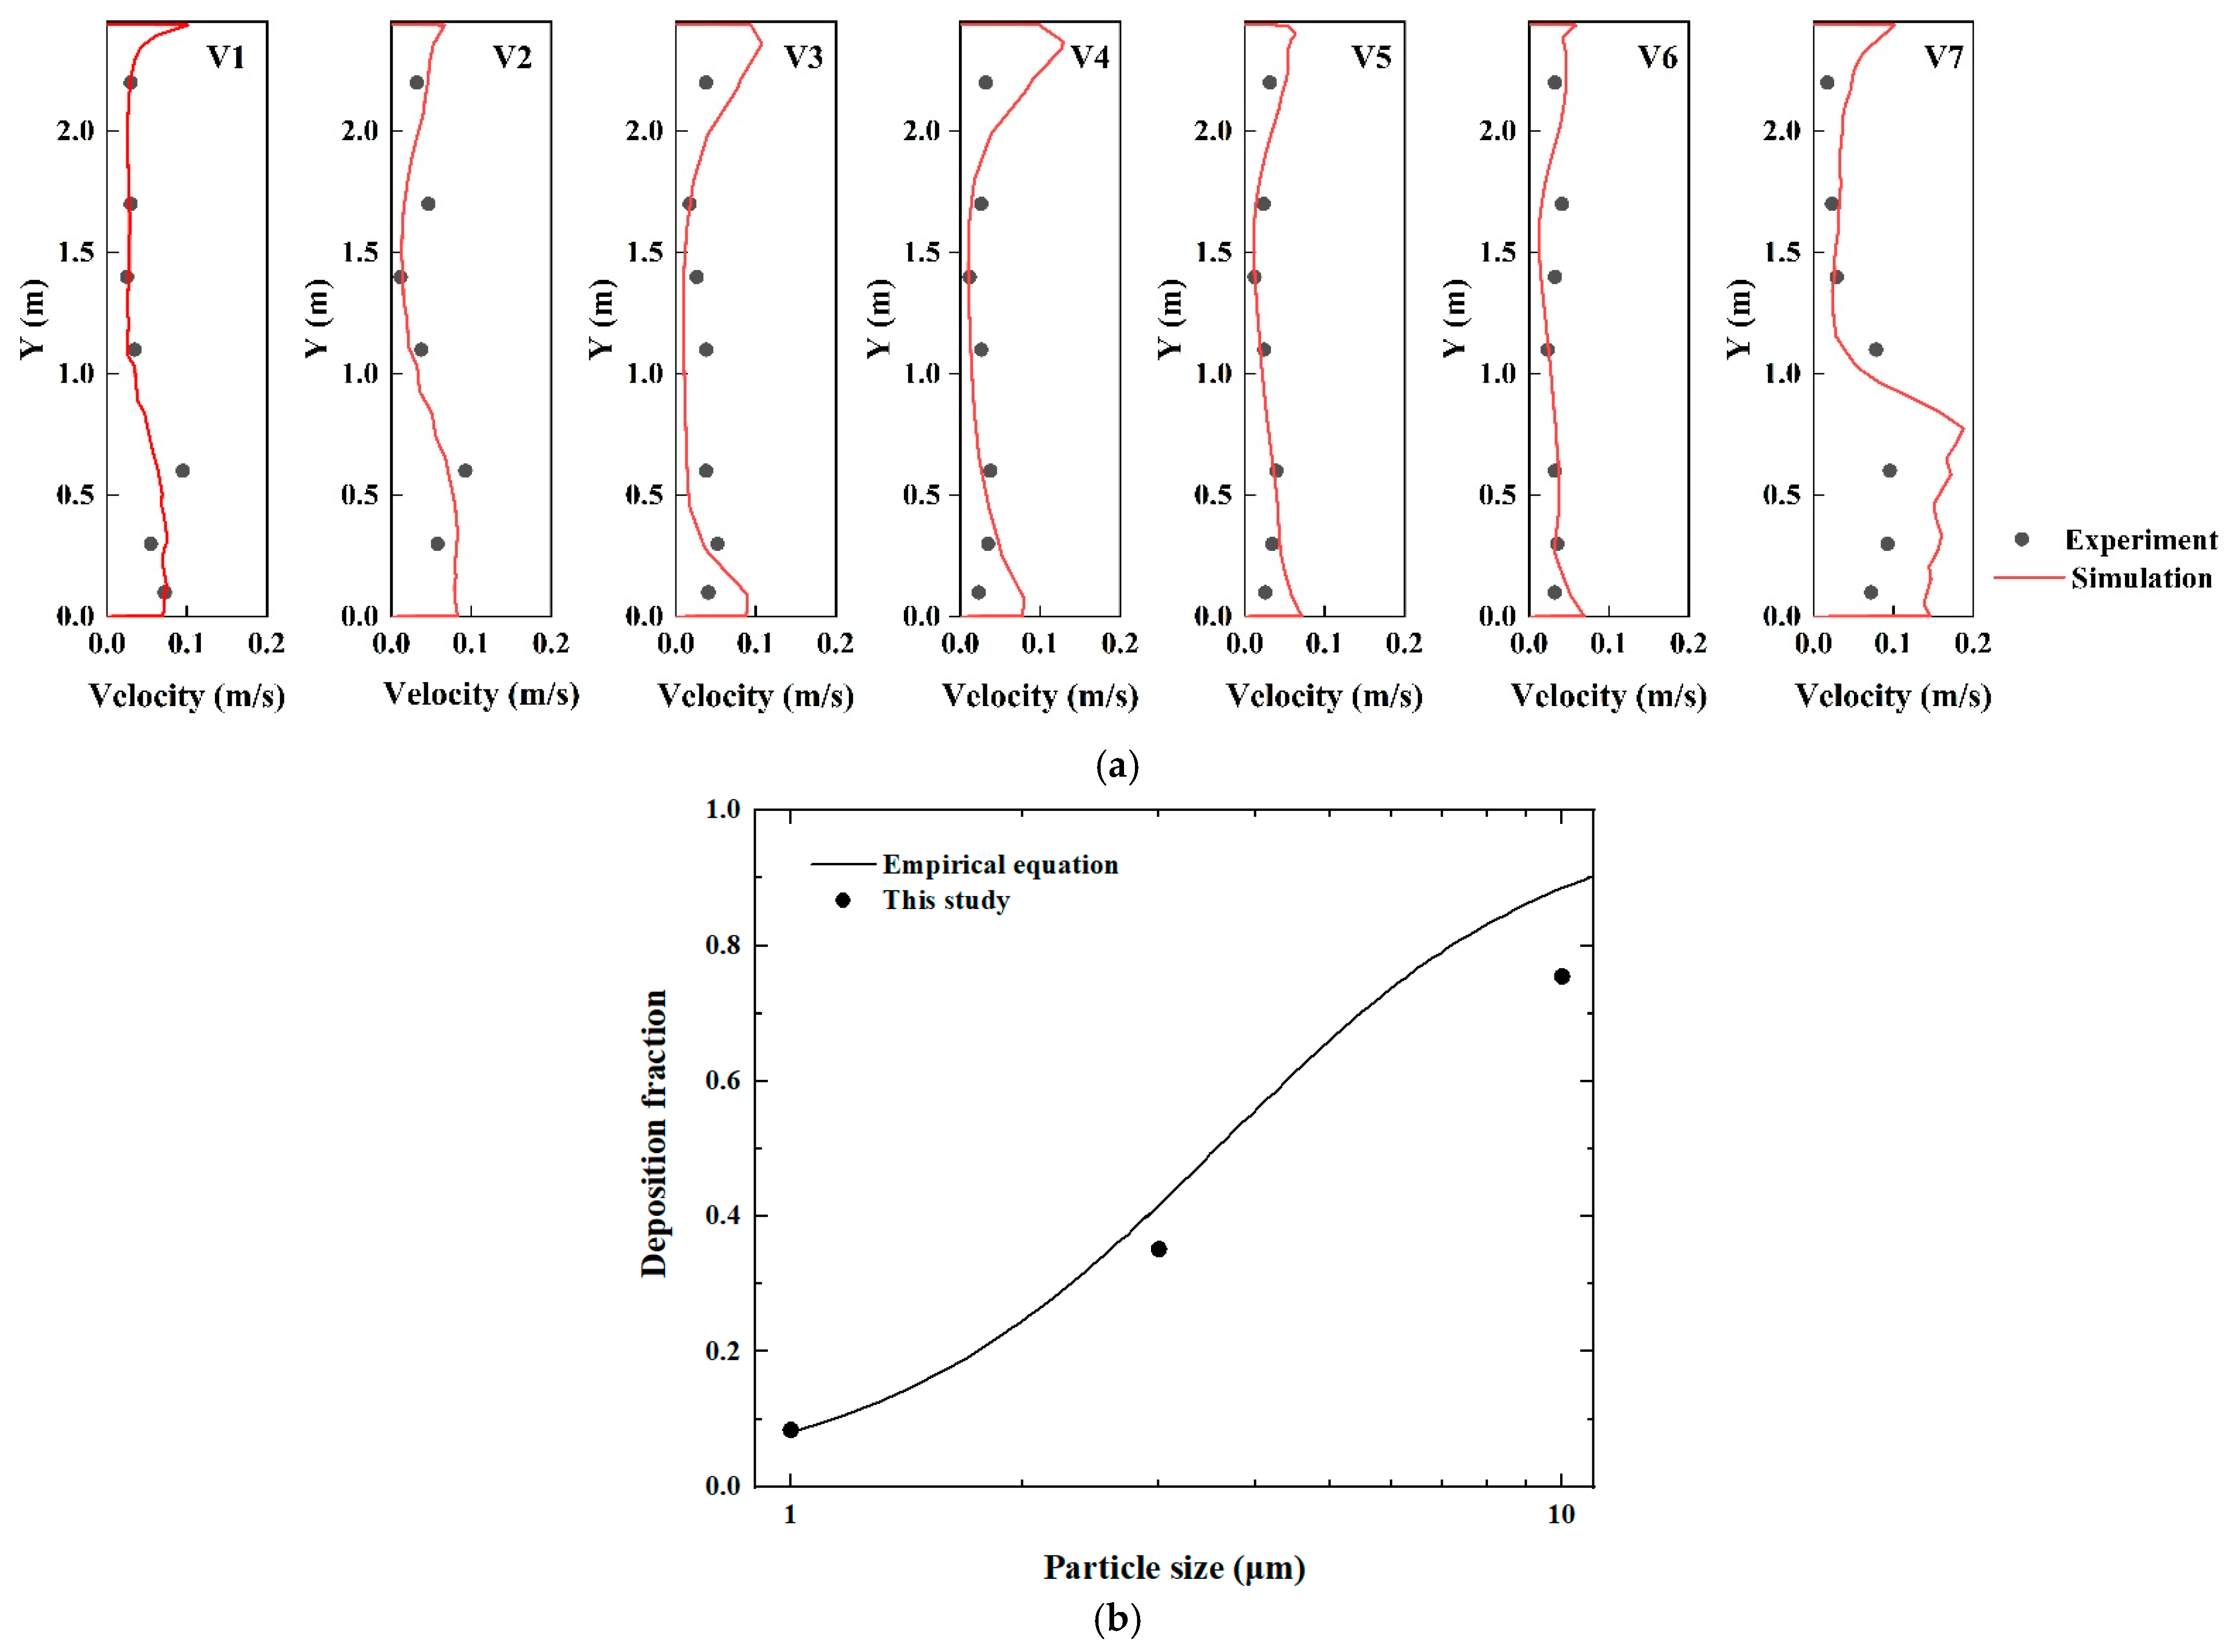
2.5. Validation
A validation should focus on the airflow and bioaerosol deposition in a lavatory with well-defined boundary conditions. However, no experimental data for lavatories are available in the literature. As an alternative, we used data on the distributions of airflows reported by Murakami et al. [37] and Lai and Chen [20], who validated the velocity profile and bioaerosol deposition, respectively. The airflow validation was performed for a full-scale environmental chamber (4.91 m × 2.44 m × 4.31 m) with flow characteristics similar to those in this study (i.e., an air supply on the floor and an exhaust outlet on the ceiling), but with four heated human simulators standing on the floor. We have previously validated this turbulence model and airflow and obtained reasonable results [31]. In the validation study of bioaerosol deposition, the SST k–ω model with the enhanced wall treatment was applied to a model room configuration of dimensions 0.8 m (L) × 0.4 m (W) × 0.4 m (H), with the inlet and outlet both of size 0.04 m× 0.04 m. The inlet velocity was 0.225 m/s. The simulation results agreed very well with the experimental data, as shown in Figure 5. The deposition rate of the bioaerosols (with the diameters of interest) predicted by the current numerical simulations were compared with the results of the empirical equation. The depositions of 1, 3, and 10 µm particles were all well predicted, providing a solid foundation for further study [31].
3. Results
The following three cases were investigated in this study. By examining the background pattern in an empty lavatory, Case 1 is designed to study the effect of ventilation flow and toilet flush on the dispersion, deposition, and dilution of fecal aerosols. The user would stand by while flushing the toilet under some circumstances, so Case 2 is focused on the effect of a thermal manikin on the flow field and bioaerosol dispersion. As for respiratory droplets, as the user would spend considerable time seating on the toilet, we examined the fates of the respiratory droplets generated by a seated manikin coughing, under which scenario the human thermal plume has different interaction pattern with Case 2.
3.1. Flow Field and Bioaerosol Deposition in the Empty Lavatory
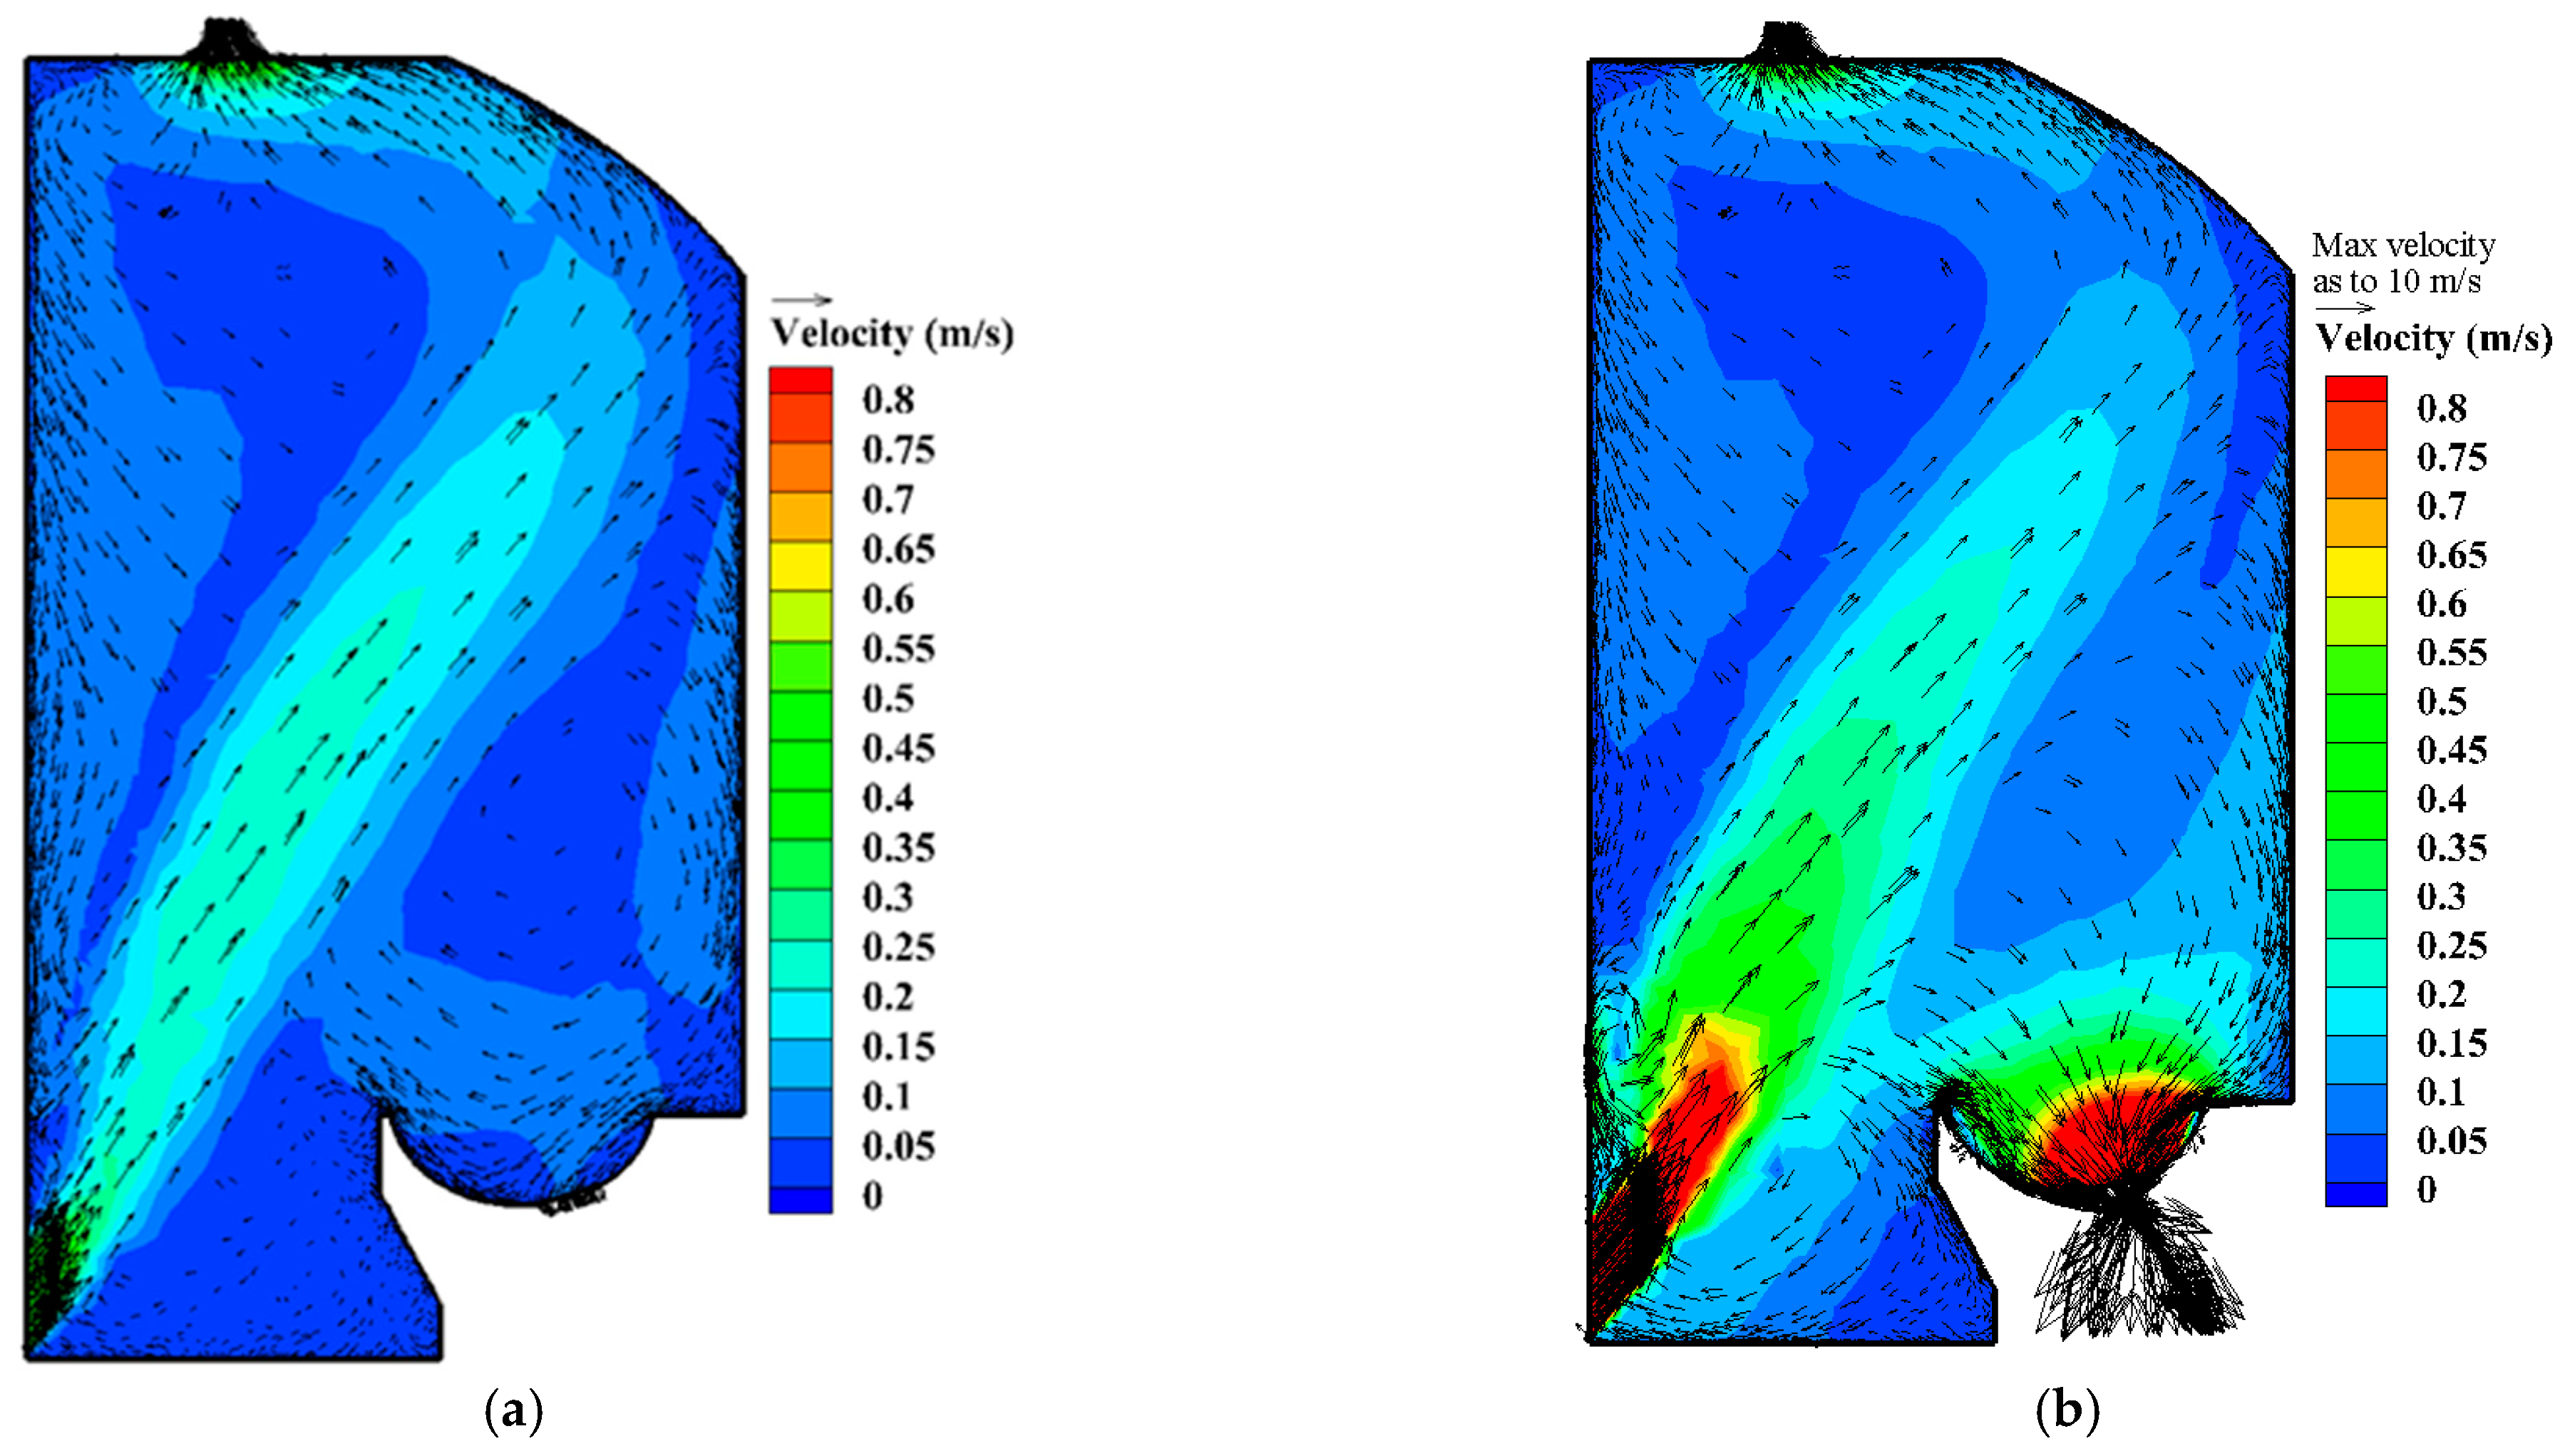
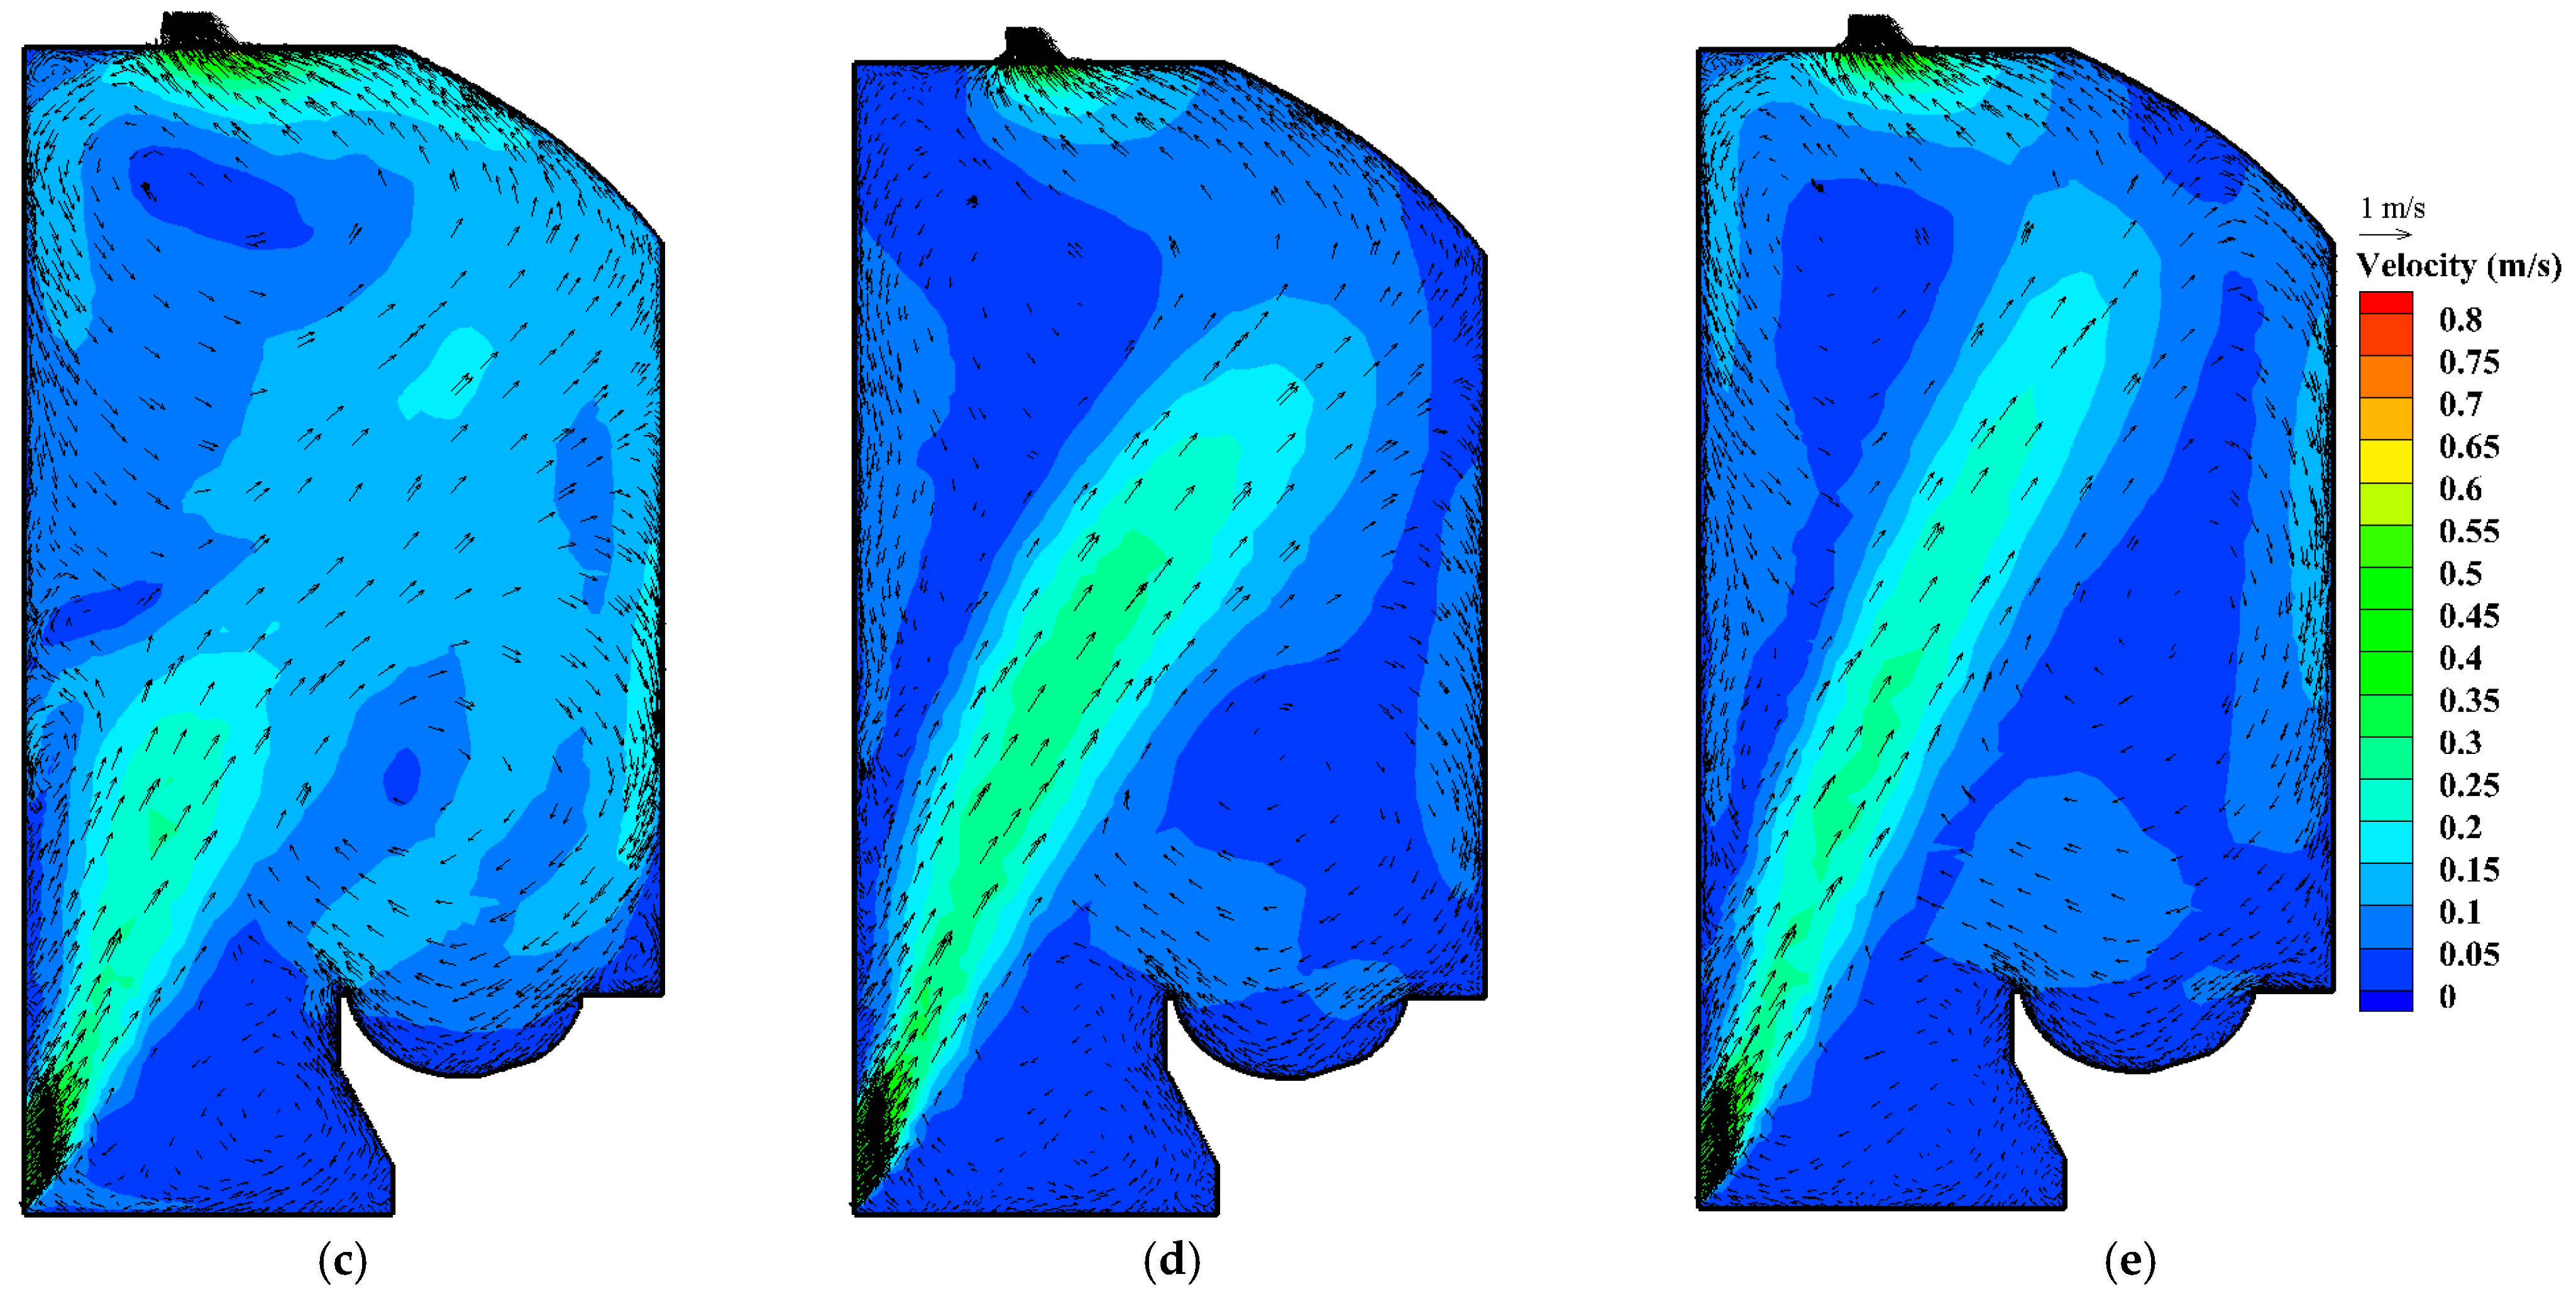
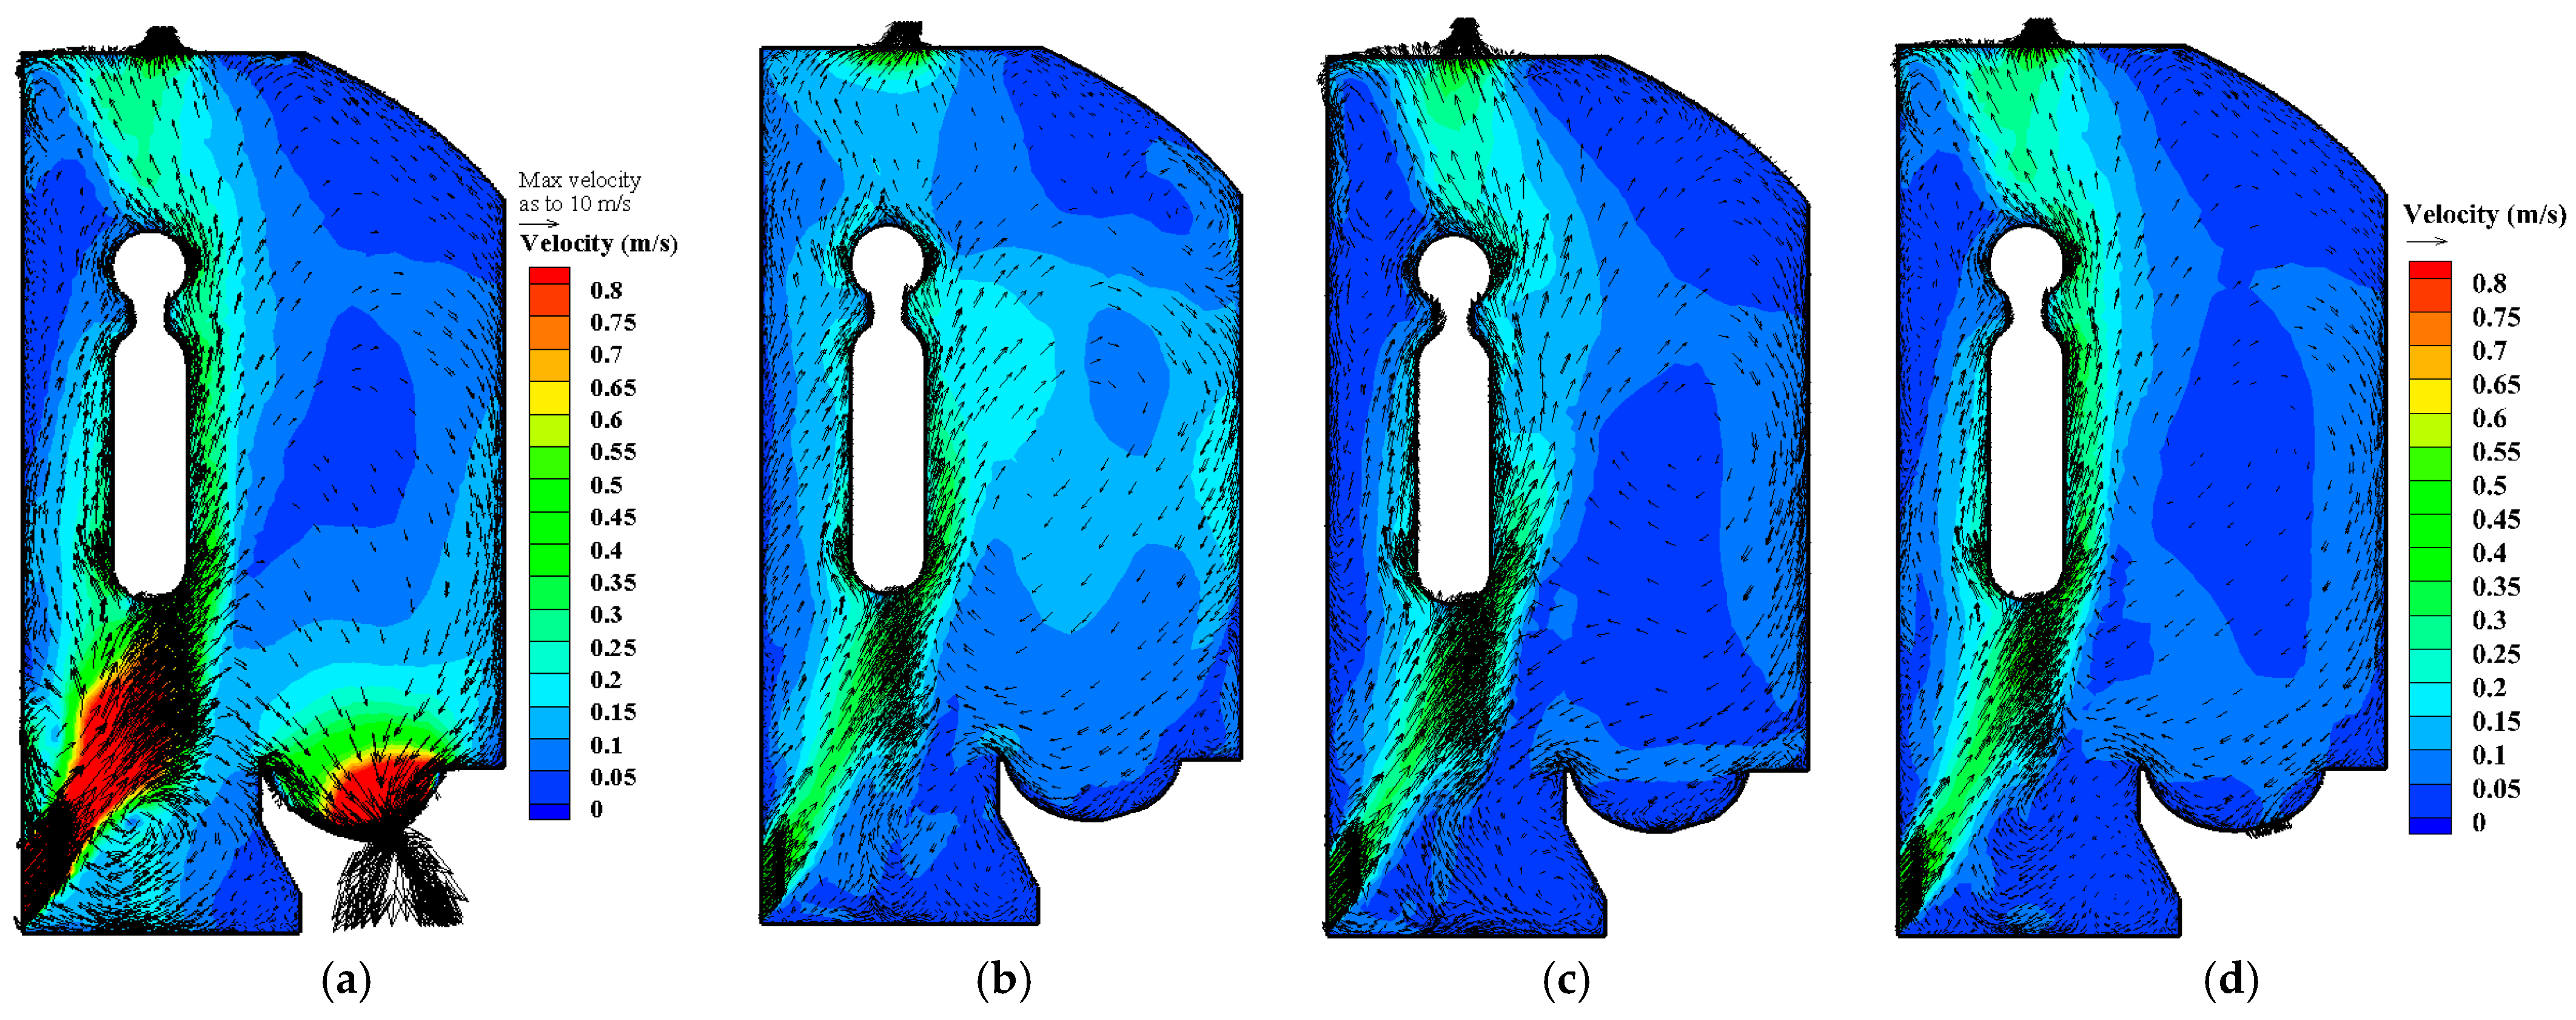
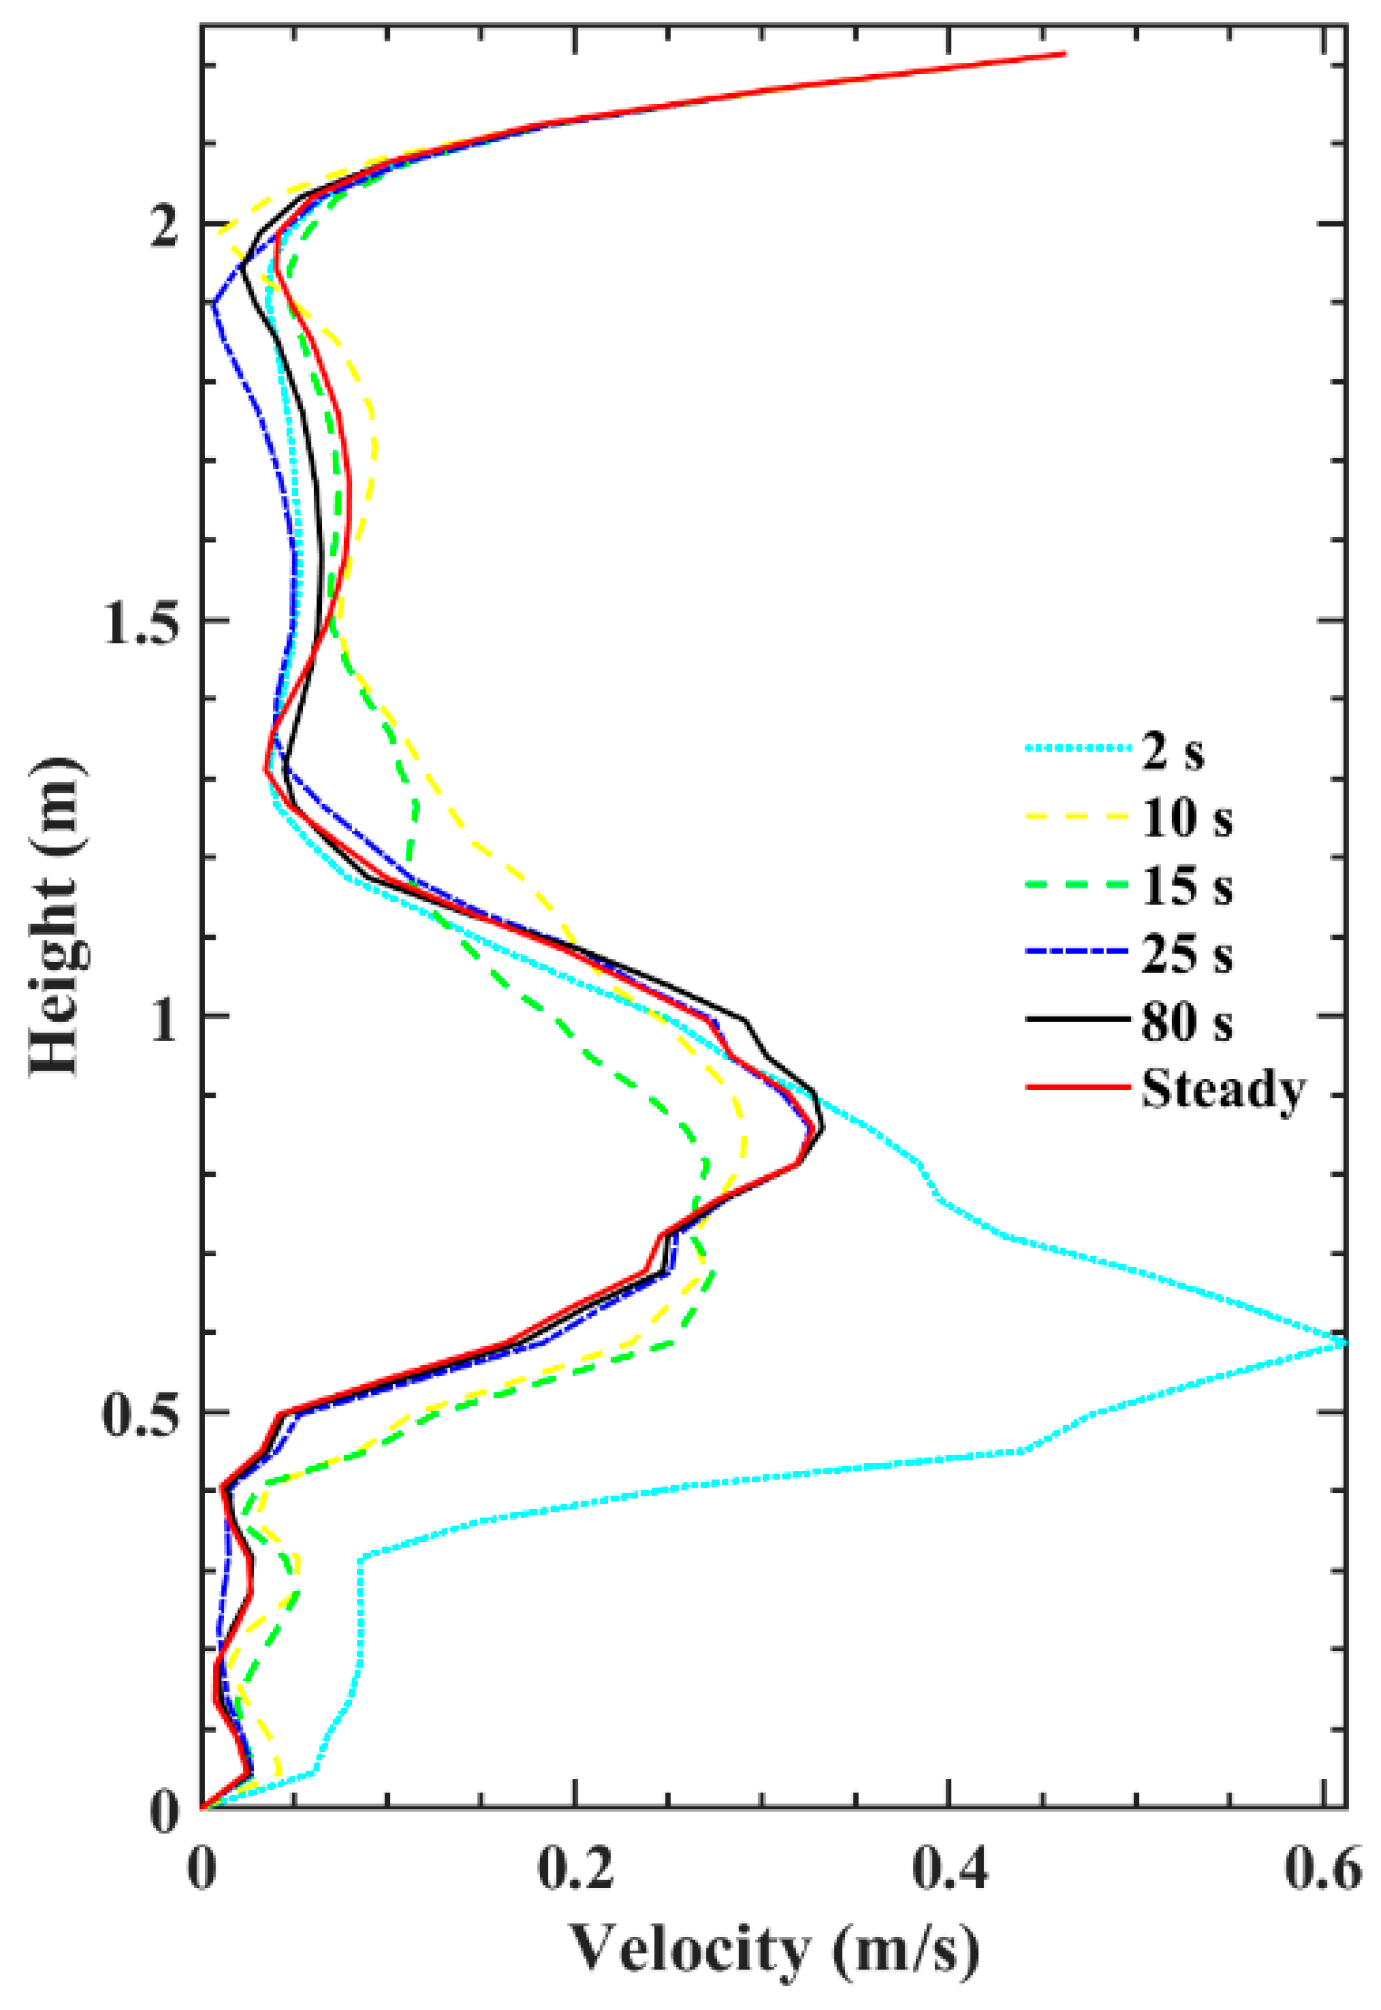
The background airflow pattern is created by the exhaust fan at the ceiling, which draws air from the grille, creating a strong main stream from the grille to the exhaust fan. Then, a clockwise circulation is formed beneath the main stream and above the toilet, and an anticlockwise circulation is formed above the main stream and under the ceiling, as shown in Figure 6a. The majority of the upward circulation is discharged from the outlet, and only a very small volume continues to circulate toward the door and the right side, due to outlet flow restrictions. Nevertheless, this remaining circulation is also discharged eventually. The downward circulation may carry bioaerosols from the inner surface of the toilet bowl, and the bioaerosol trajectory follows the upward flow into the main airflow in Figure 7. The vacuum pump starts to work at t = 0 s, and suction velocity reaches its maximum of 10 m/s at t = 2 s (Figure 6b). The main flow tilts toward the toilet and all airflows under main stream are directed towards the toilet trap; the high-velocity area generated by the suction is concentrated in the toilet. At t = 10 s (Figure 6c), when the suction stops, the upper circulation and downward circulation dominates while the main stream is weakened, within which the bioaerosols being carried out are following the main stream. The flow pattern attenuates to its original status in Figure 6a. The velocity profiles at 10 and 25 s are distinct (Appendix A, Figure A1), while after 25 s, the profiles are similar to the main airflow from the inlet, indicating a well-established flow-field pattern (Figure 6e).
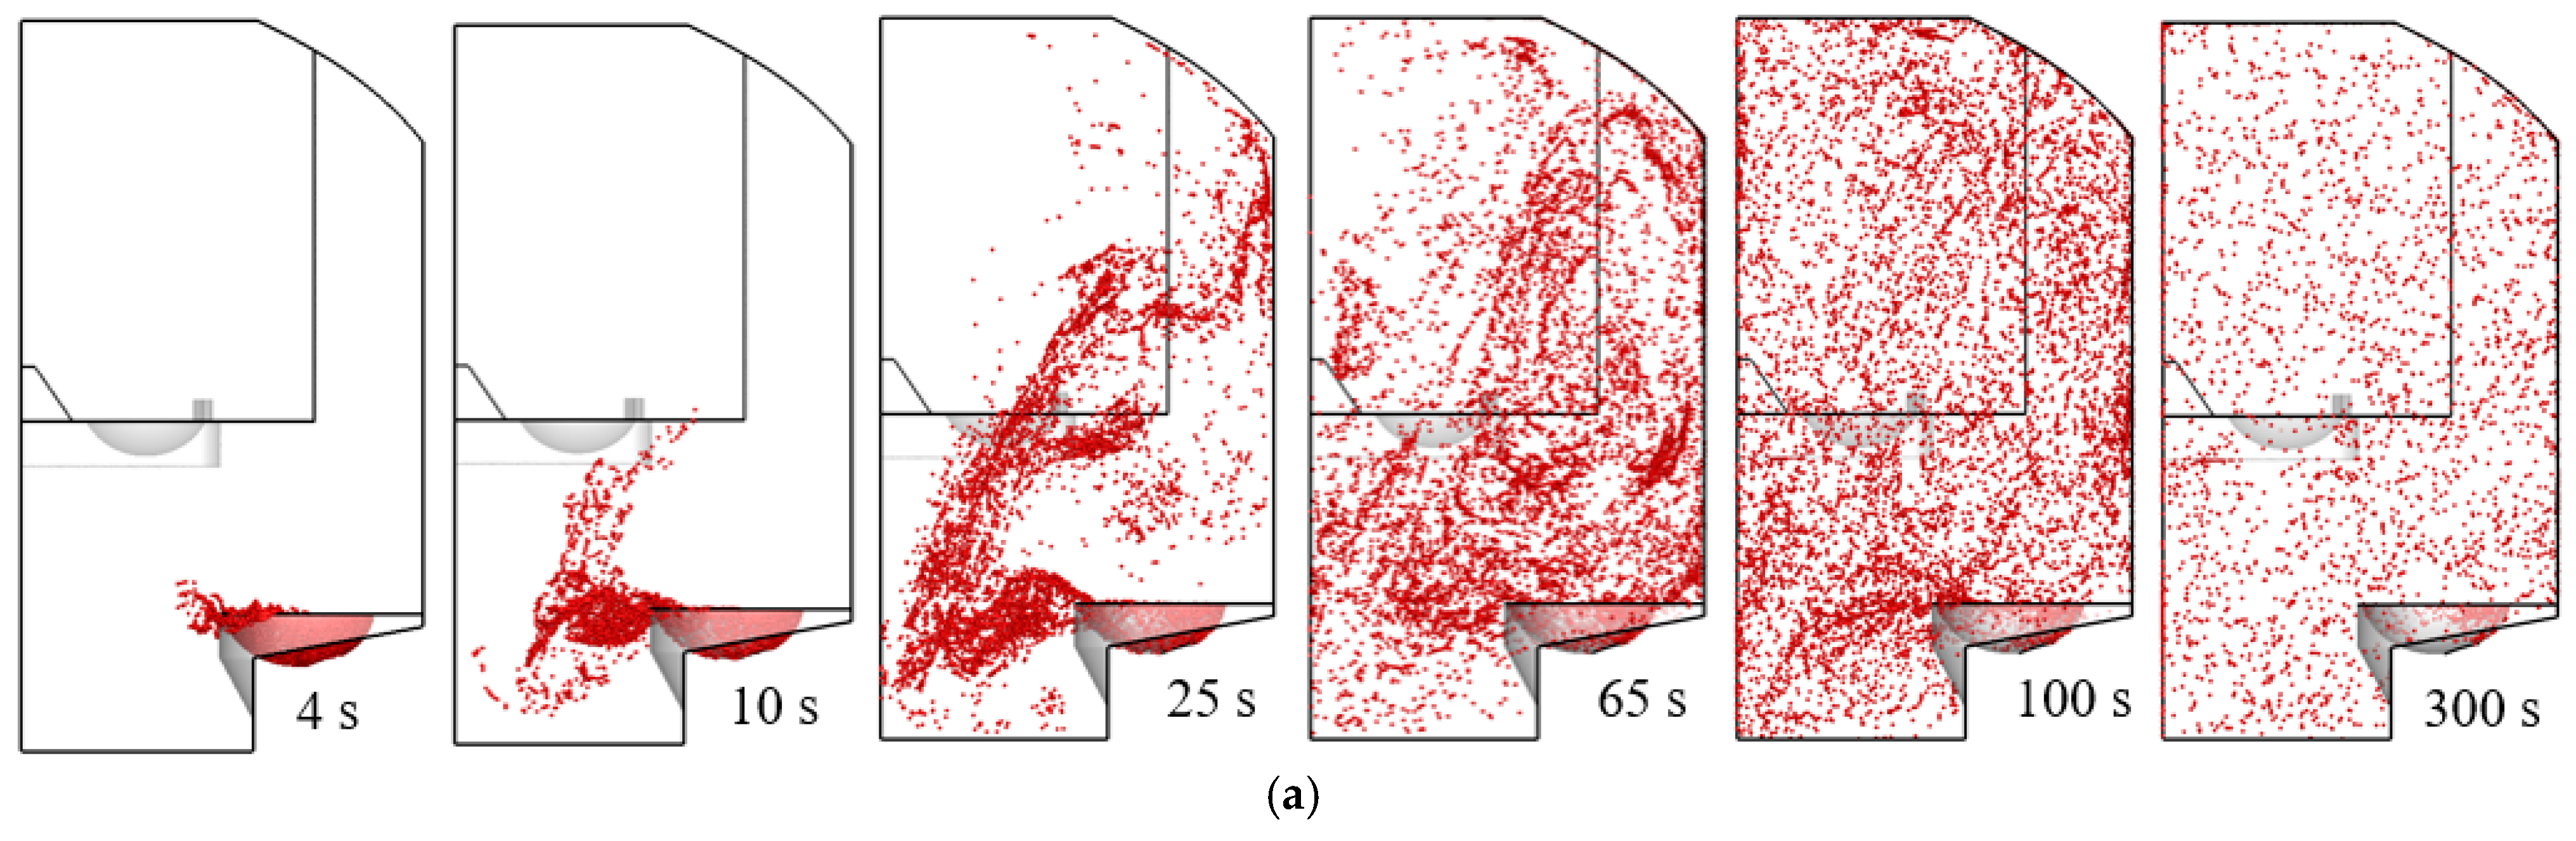
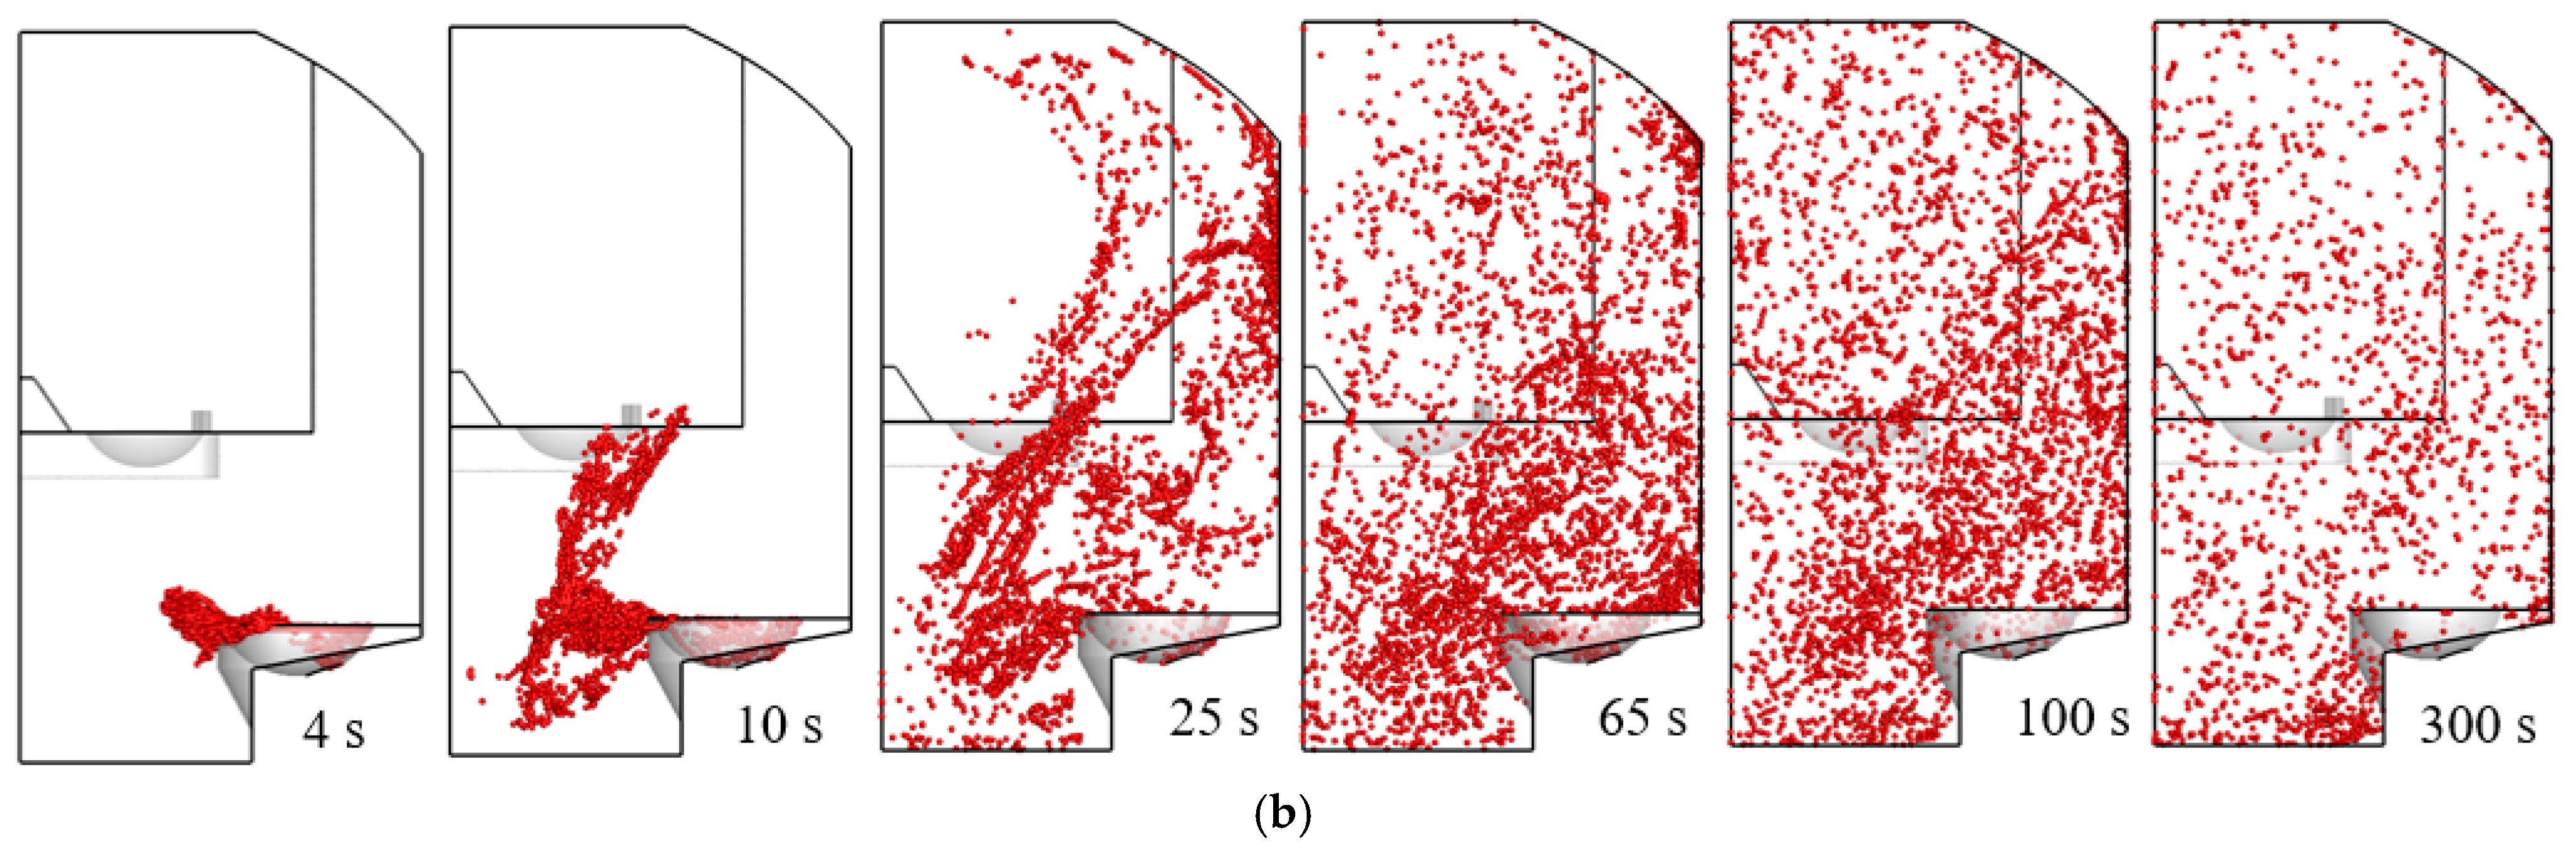
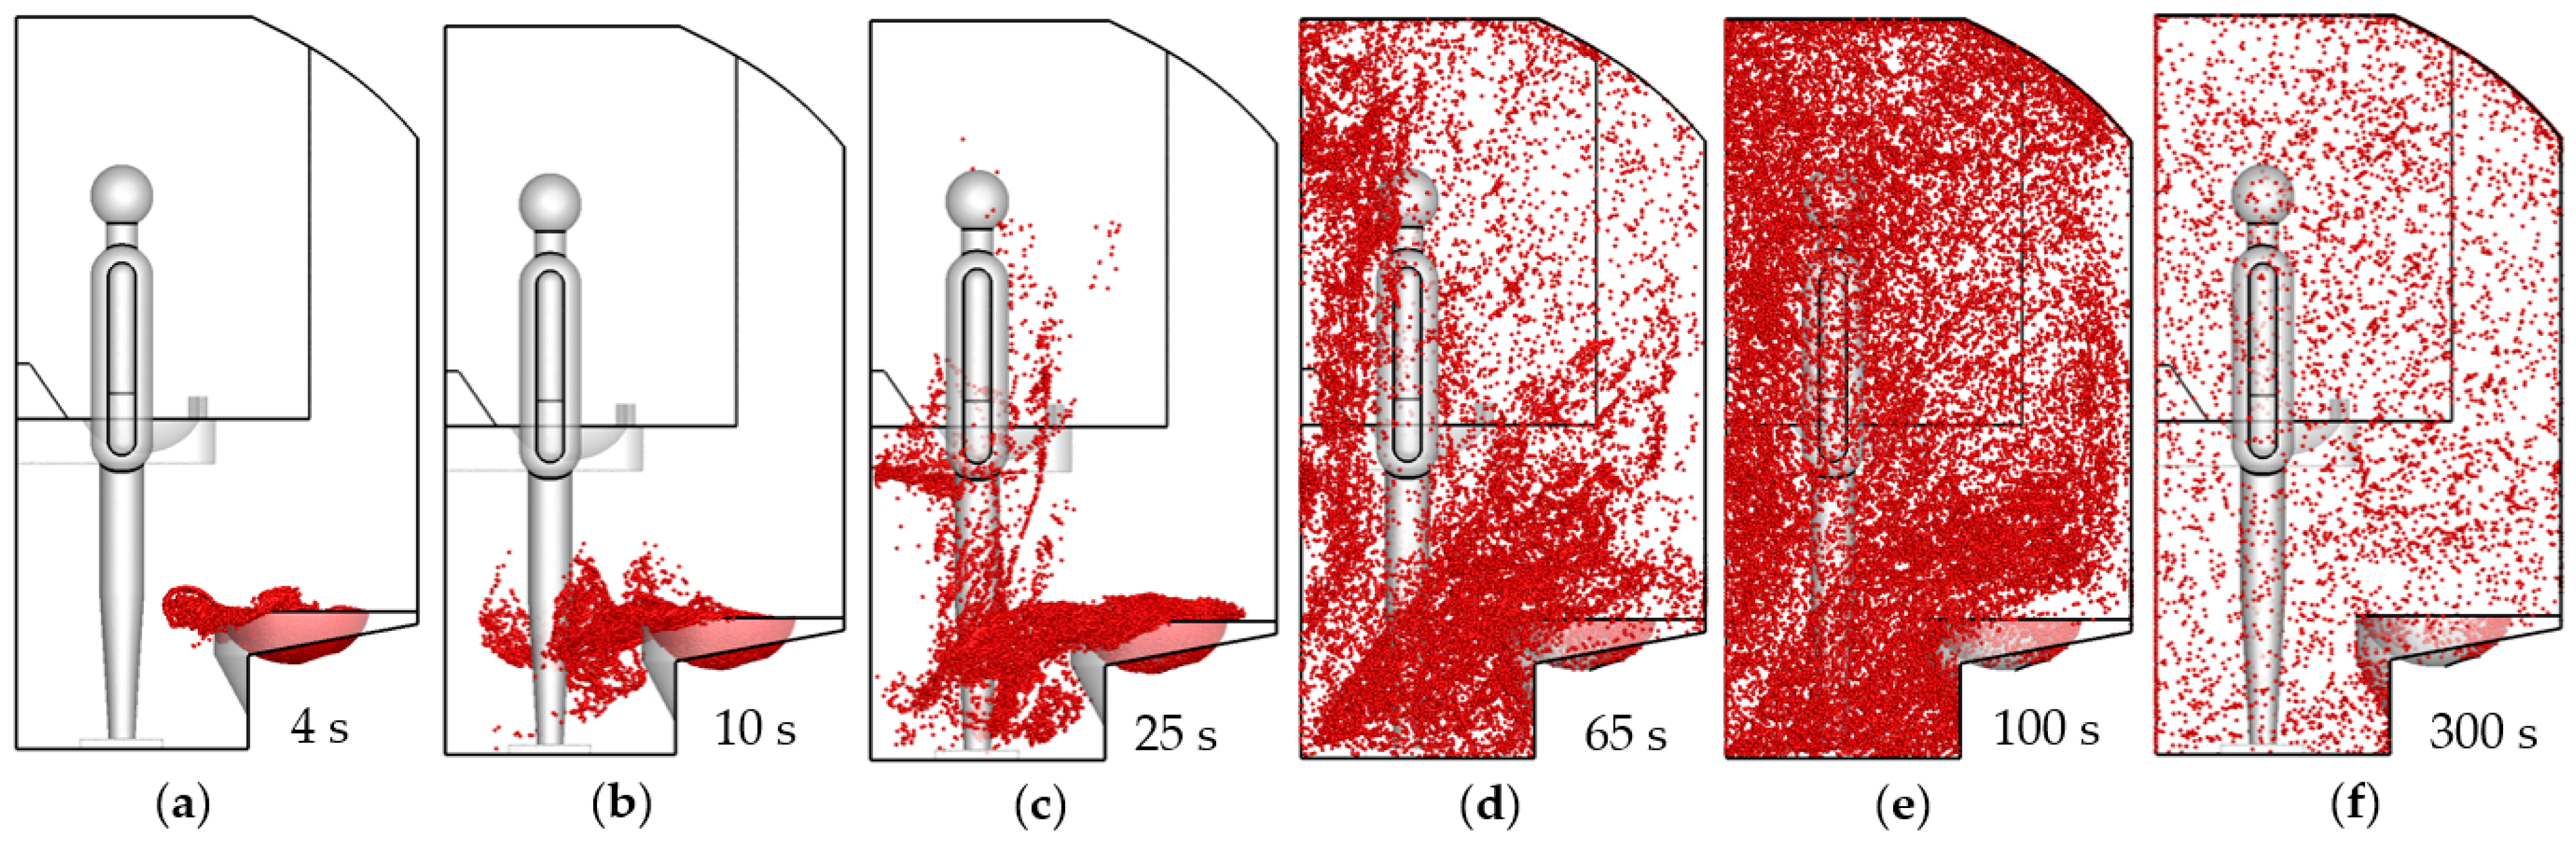
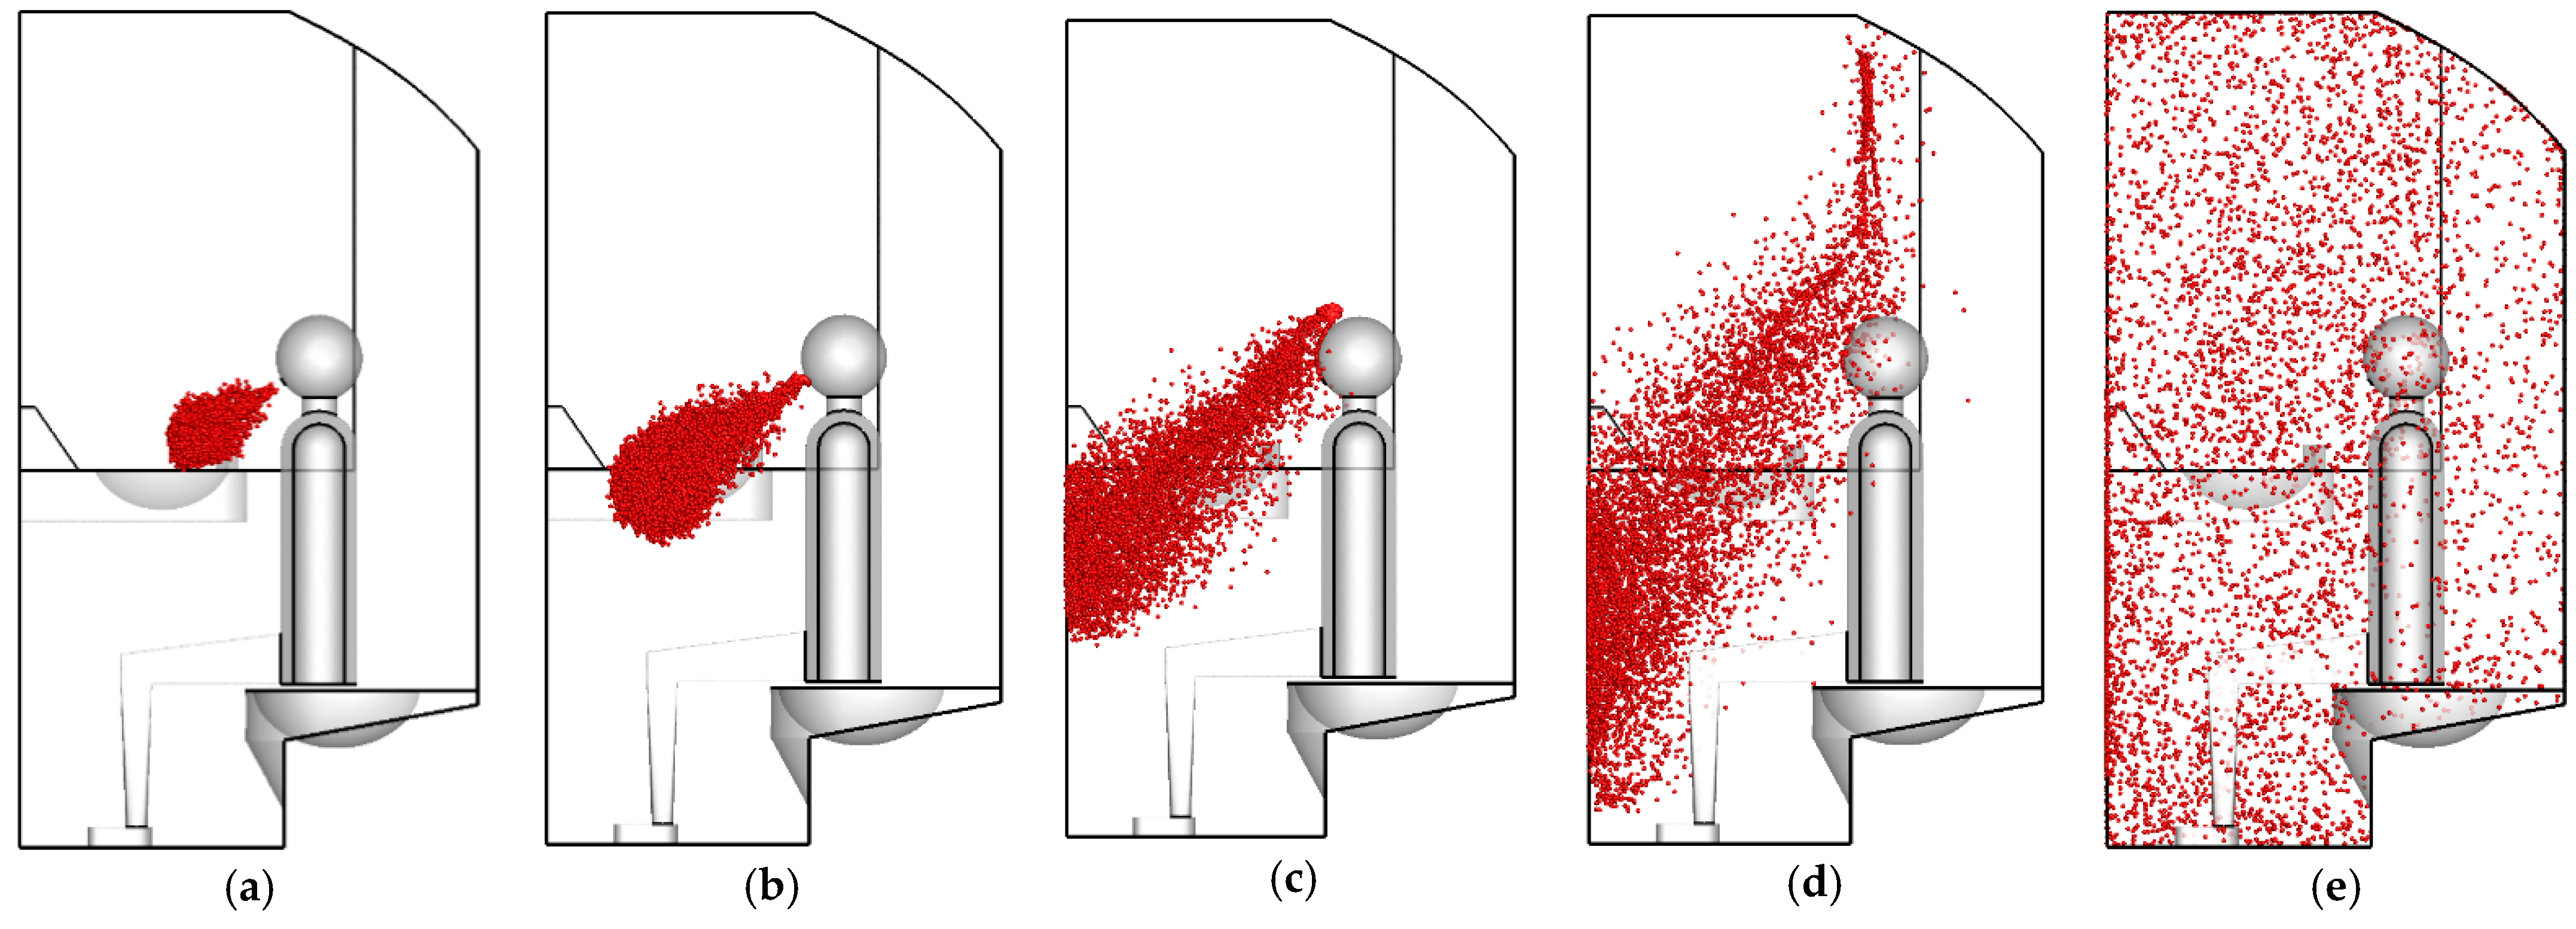
Bioaerosols are generated and released during the suction process; their dispersion patterns are shown in Figure 7. At 4 s, when the toilet flush finishes, bioaerosols are carried out from the front edge of the toilet bowl and are immediately influenced by the main airflow from the inlets, resulting in a small fraction of the bioaerosols being suspended in the air. These bioaerosols first hit the back wall, in the meantime, and part of them are then delivered to the ceiling and removed by the outlet or follow the upper circulation, due to inertia, and settle on the door. The other bioaerosols follow the downward circulation and gather over the toilet. The downward circulation exists all the time and continuously supplies the bioaerosols into main stream and upper circulation to exhaust. Moreover, the bioaerosols are also carried by the upper sideways flow; these are eventually deposited on the right wall, other walls, and the mirror. At 100 s, the bioaerosols fill the entire lavatory. The distributions of 5 and 10 µm bioaerosols exhibit the same pattern as that of the 1 µm bioaerosols, whose Stokes numbers are much lower than 1 and follow the gas streamline perfectly, while the 10 µm bioaerosols tend to gather in the horizontal surface due to the gravity, which shown in Figure 7b. The movement of 50 and 100 µm bioaerosols is strongly affected by gravity; the 100 µm bioaerosols all deposit on the bowl, and only a few 50 µm bioaerosols escape the bowl and deposit on the seat of toilet.
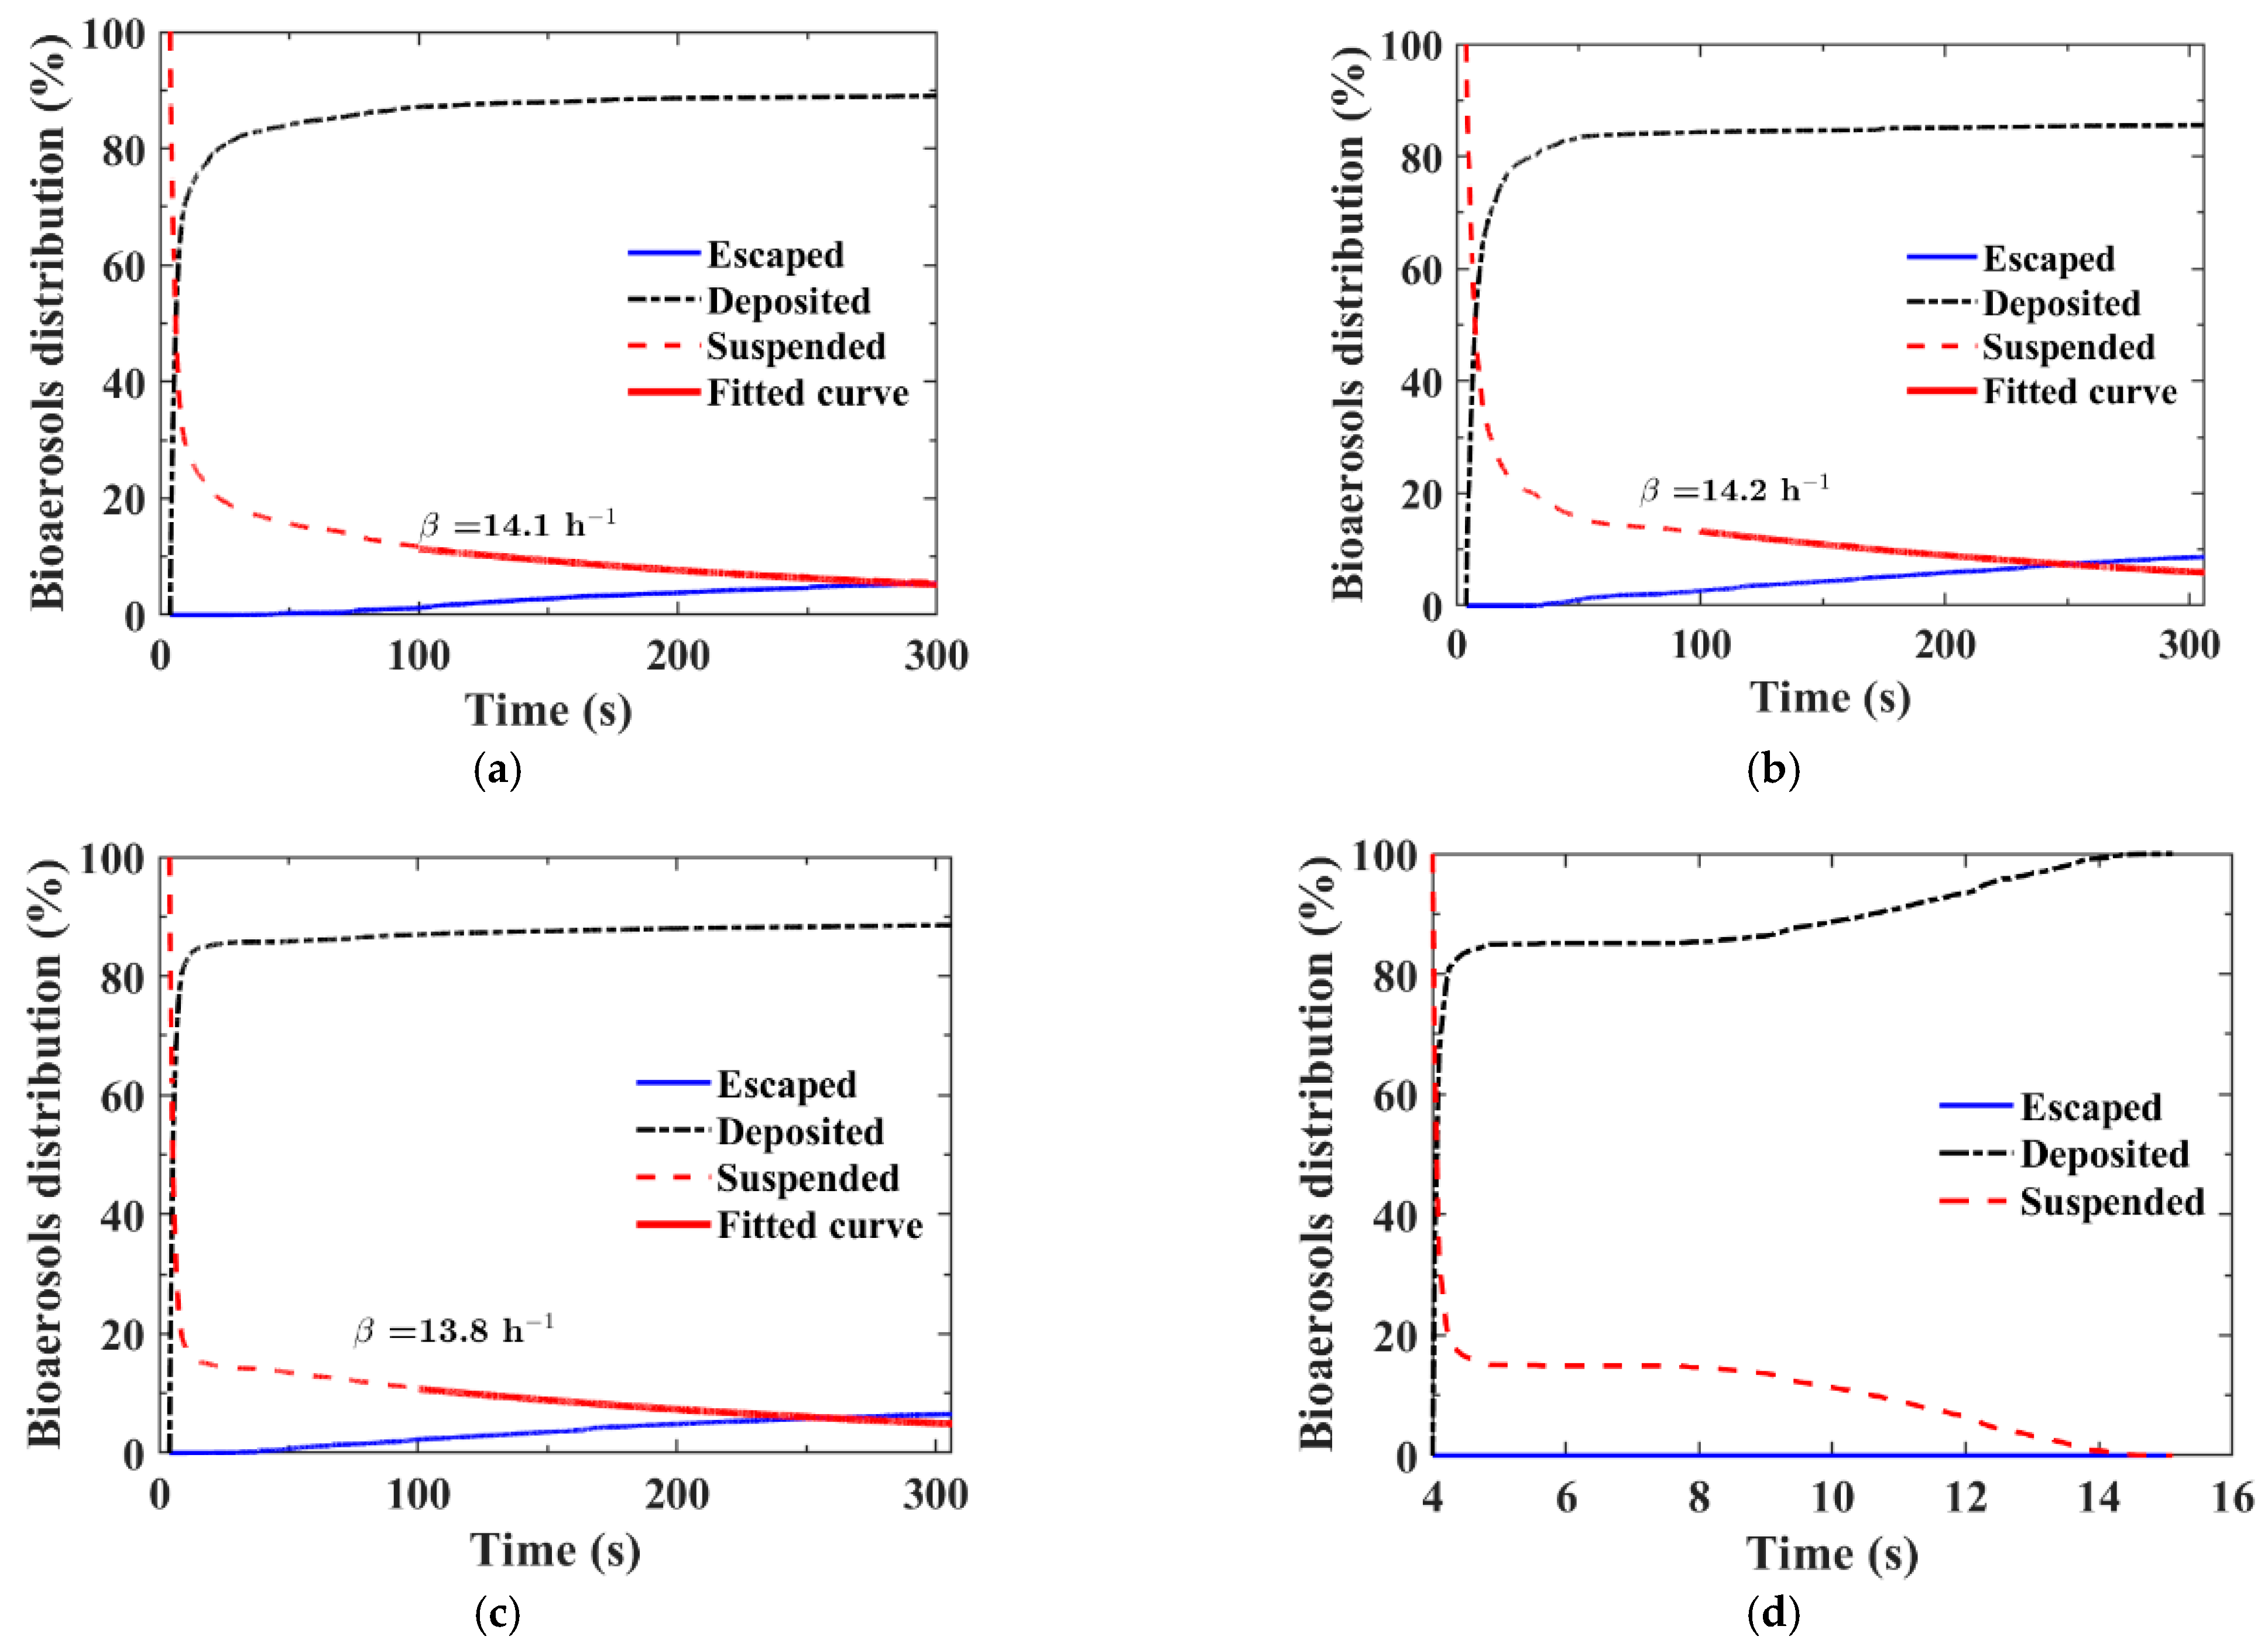
Evolution of these bioaerosol states is shown in Figure 8. Regardless of bioaerosol size, the deposition of bioaerosols mainly occurs within the first 25 s, which is consistent with the evolution of the flow field. As the flow field gradually stabilizes (after 100 s), the number of suspended bioaerosols in the air begins to conform to the empirical equation, as shown in Figure 8. In this analysis, the initial bioaerosol concentration inside the lavatory is the number of bioaerosols at 1 s, when the flushing is complete. The bioaerosol concentration () in the lavatory decays with time according to the following simplified formula [20]:
where is the particle loss rate coefficient (h−1) and , is the air change rate (h−1), is the deposition rate (h−1), and is the elapsed time. By fitting the exponential empirical formula to the numerical model, the particle loss rate coefficient is found to be 14.1 h−1 for 1 µm bioaerosols, 14.2 h−1 for 5 µm bioaerosols, and 13.8 h−1 for 10 µm bioaerosols (Figure 8). However, according to the particle deposition model of Lai and Nazaroff [38], in which the deposition rate is a function of the particle size and the combined rate of air changes ( = 30 h−1), the corresponding empirical particle loss rate coefficients should be 30.0 h−1, 30.9 h−1, and 33.5 h−1. Thus, for all bioaerosol sizes, the numerically simulated particle loss rate coefficient is approximately half the empirical value under well-mixed ventilation conditions. This discrepancy may be due to the unique air distribution pattern in the lavatory (i.e., with an upper and a lower main circulation), which means that after the bioaerosols are released, they are directly captured by the main airflow and persist for long periods in the circulation.
According to Equation (1), when the bioaerosol concentration is reduced to less than 5% of the original concentration, the final deposition time is 315 s for 1 µm bioaerosols, 348 s for 5 µm bioaerosols, and 299 s for 10 µm bioaerosols. For 50 and 100 µm bioaerosols, the times for complete deposition or escape are 15 s and 4.06 s, respectively.
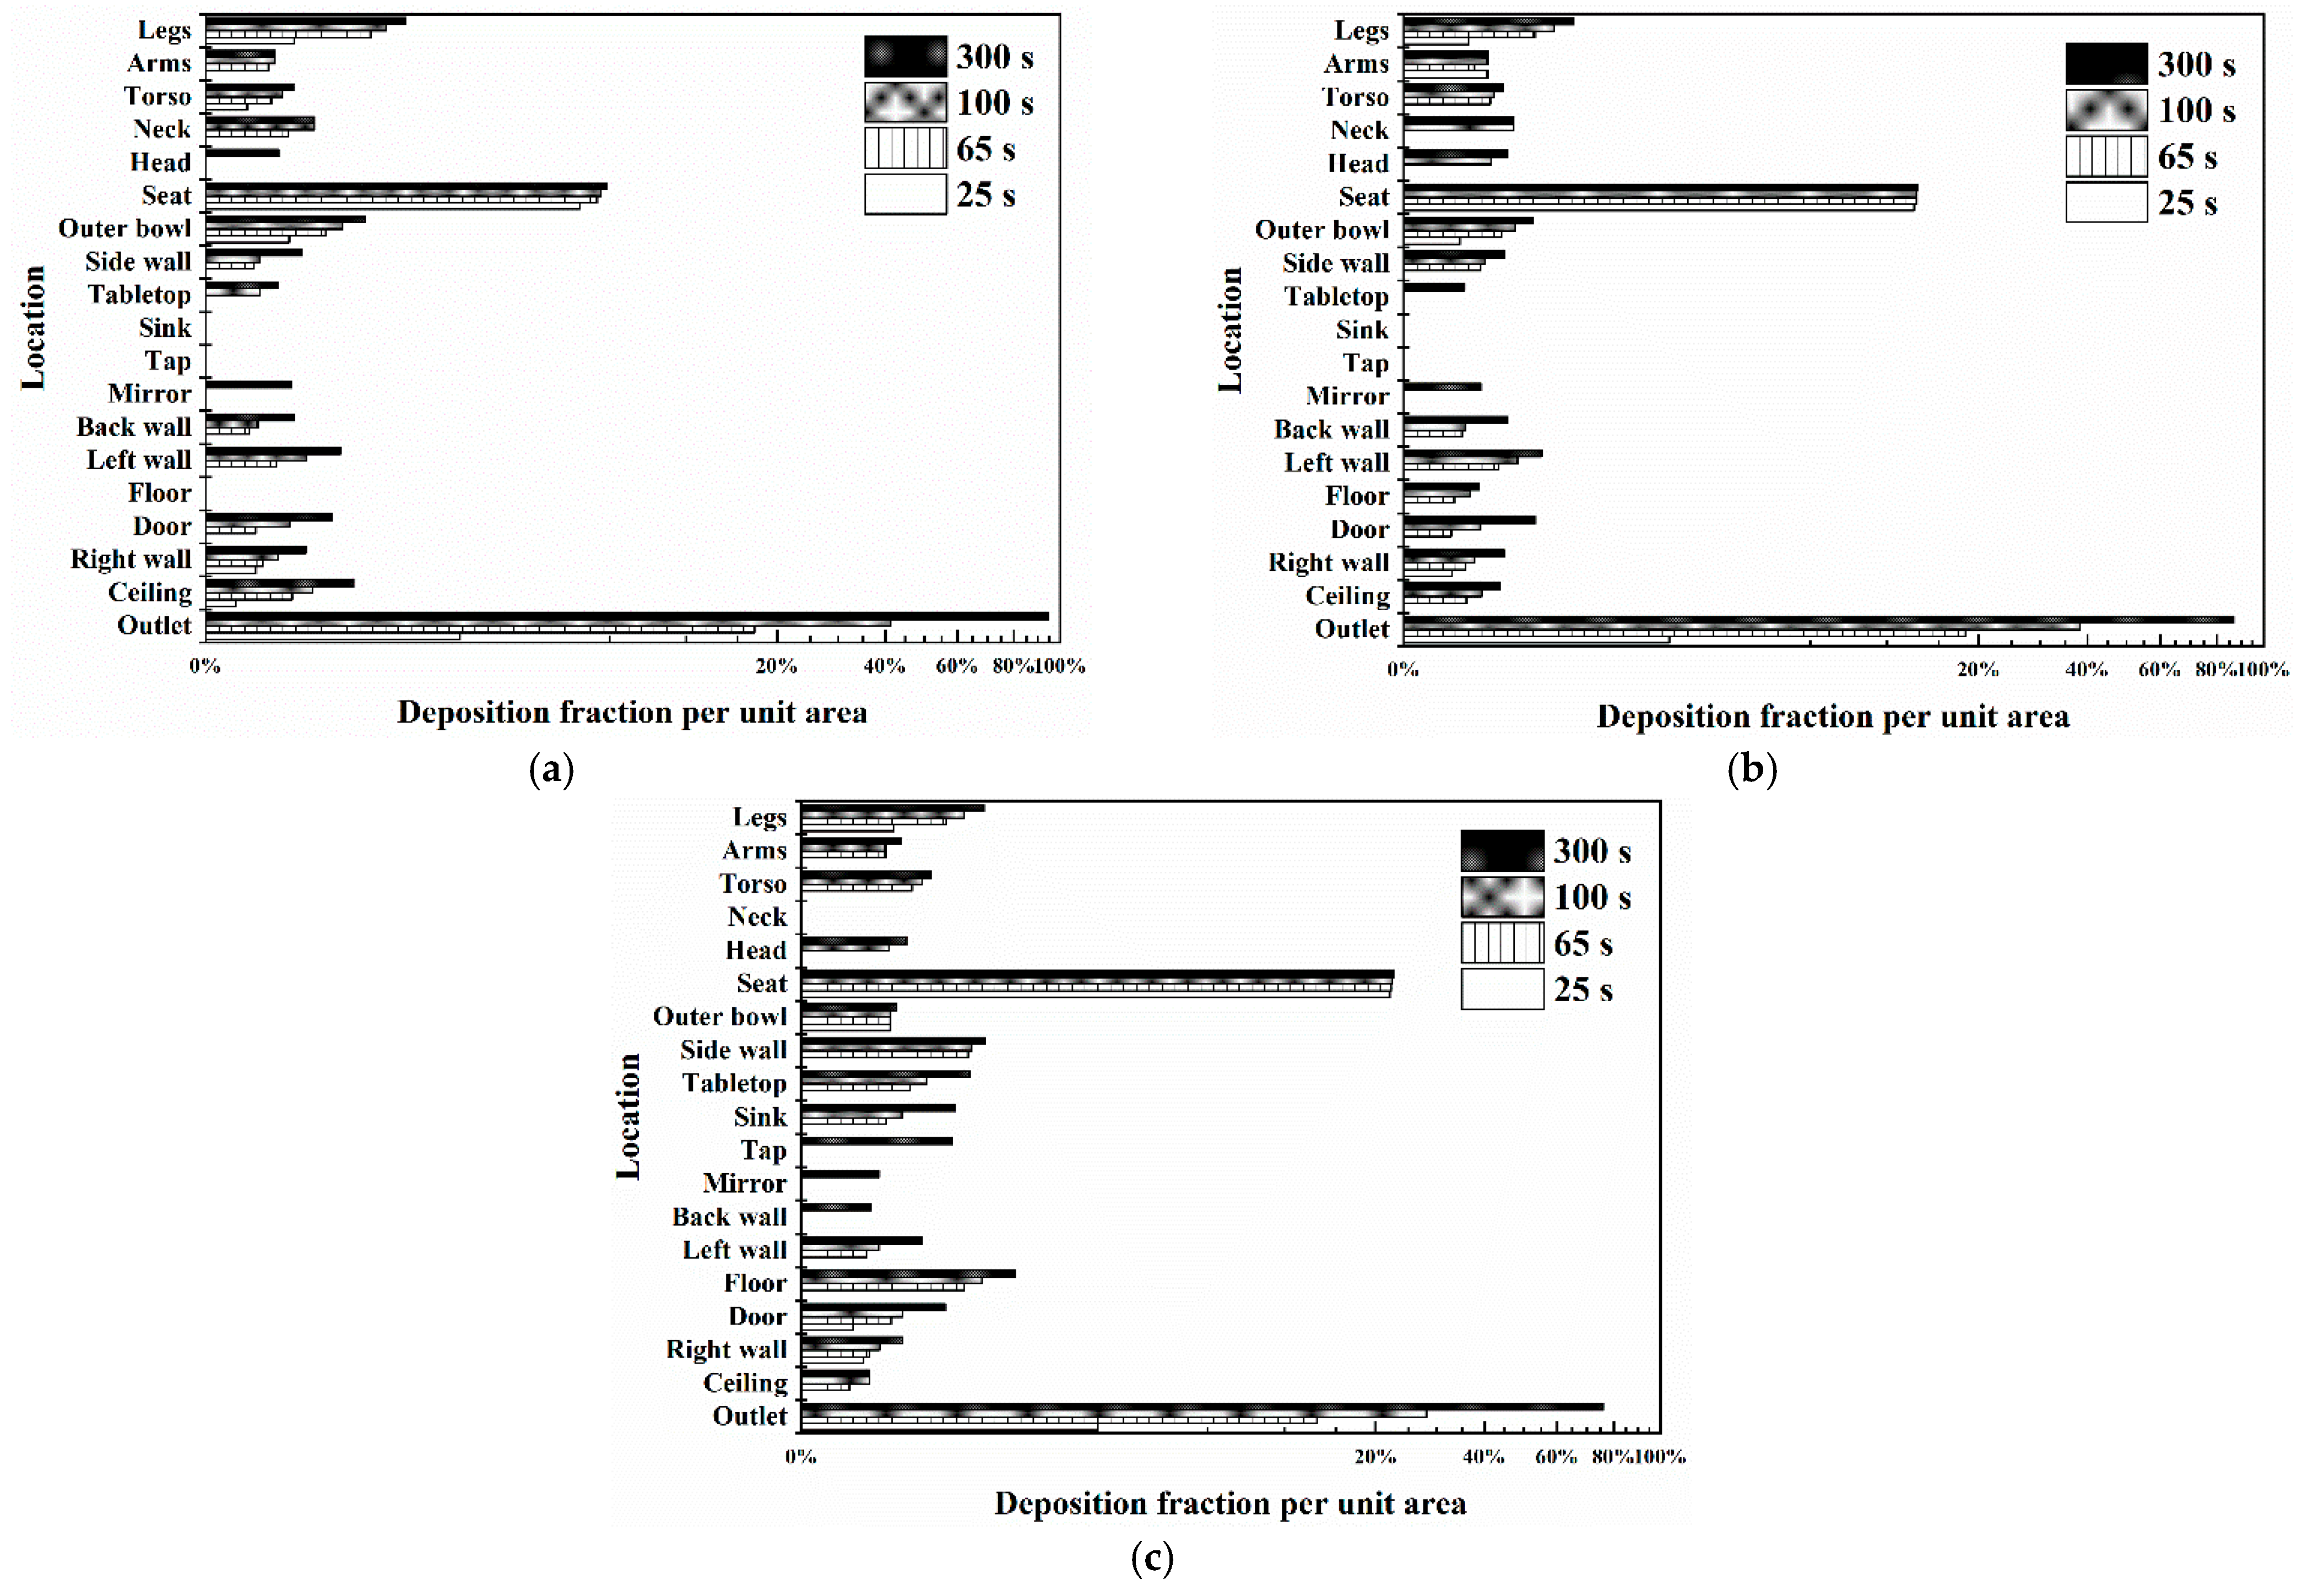
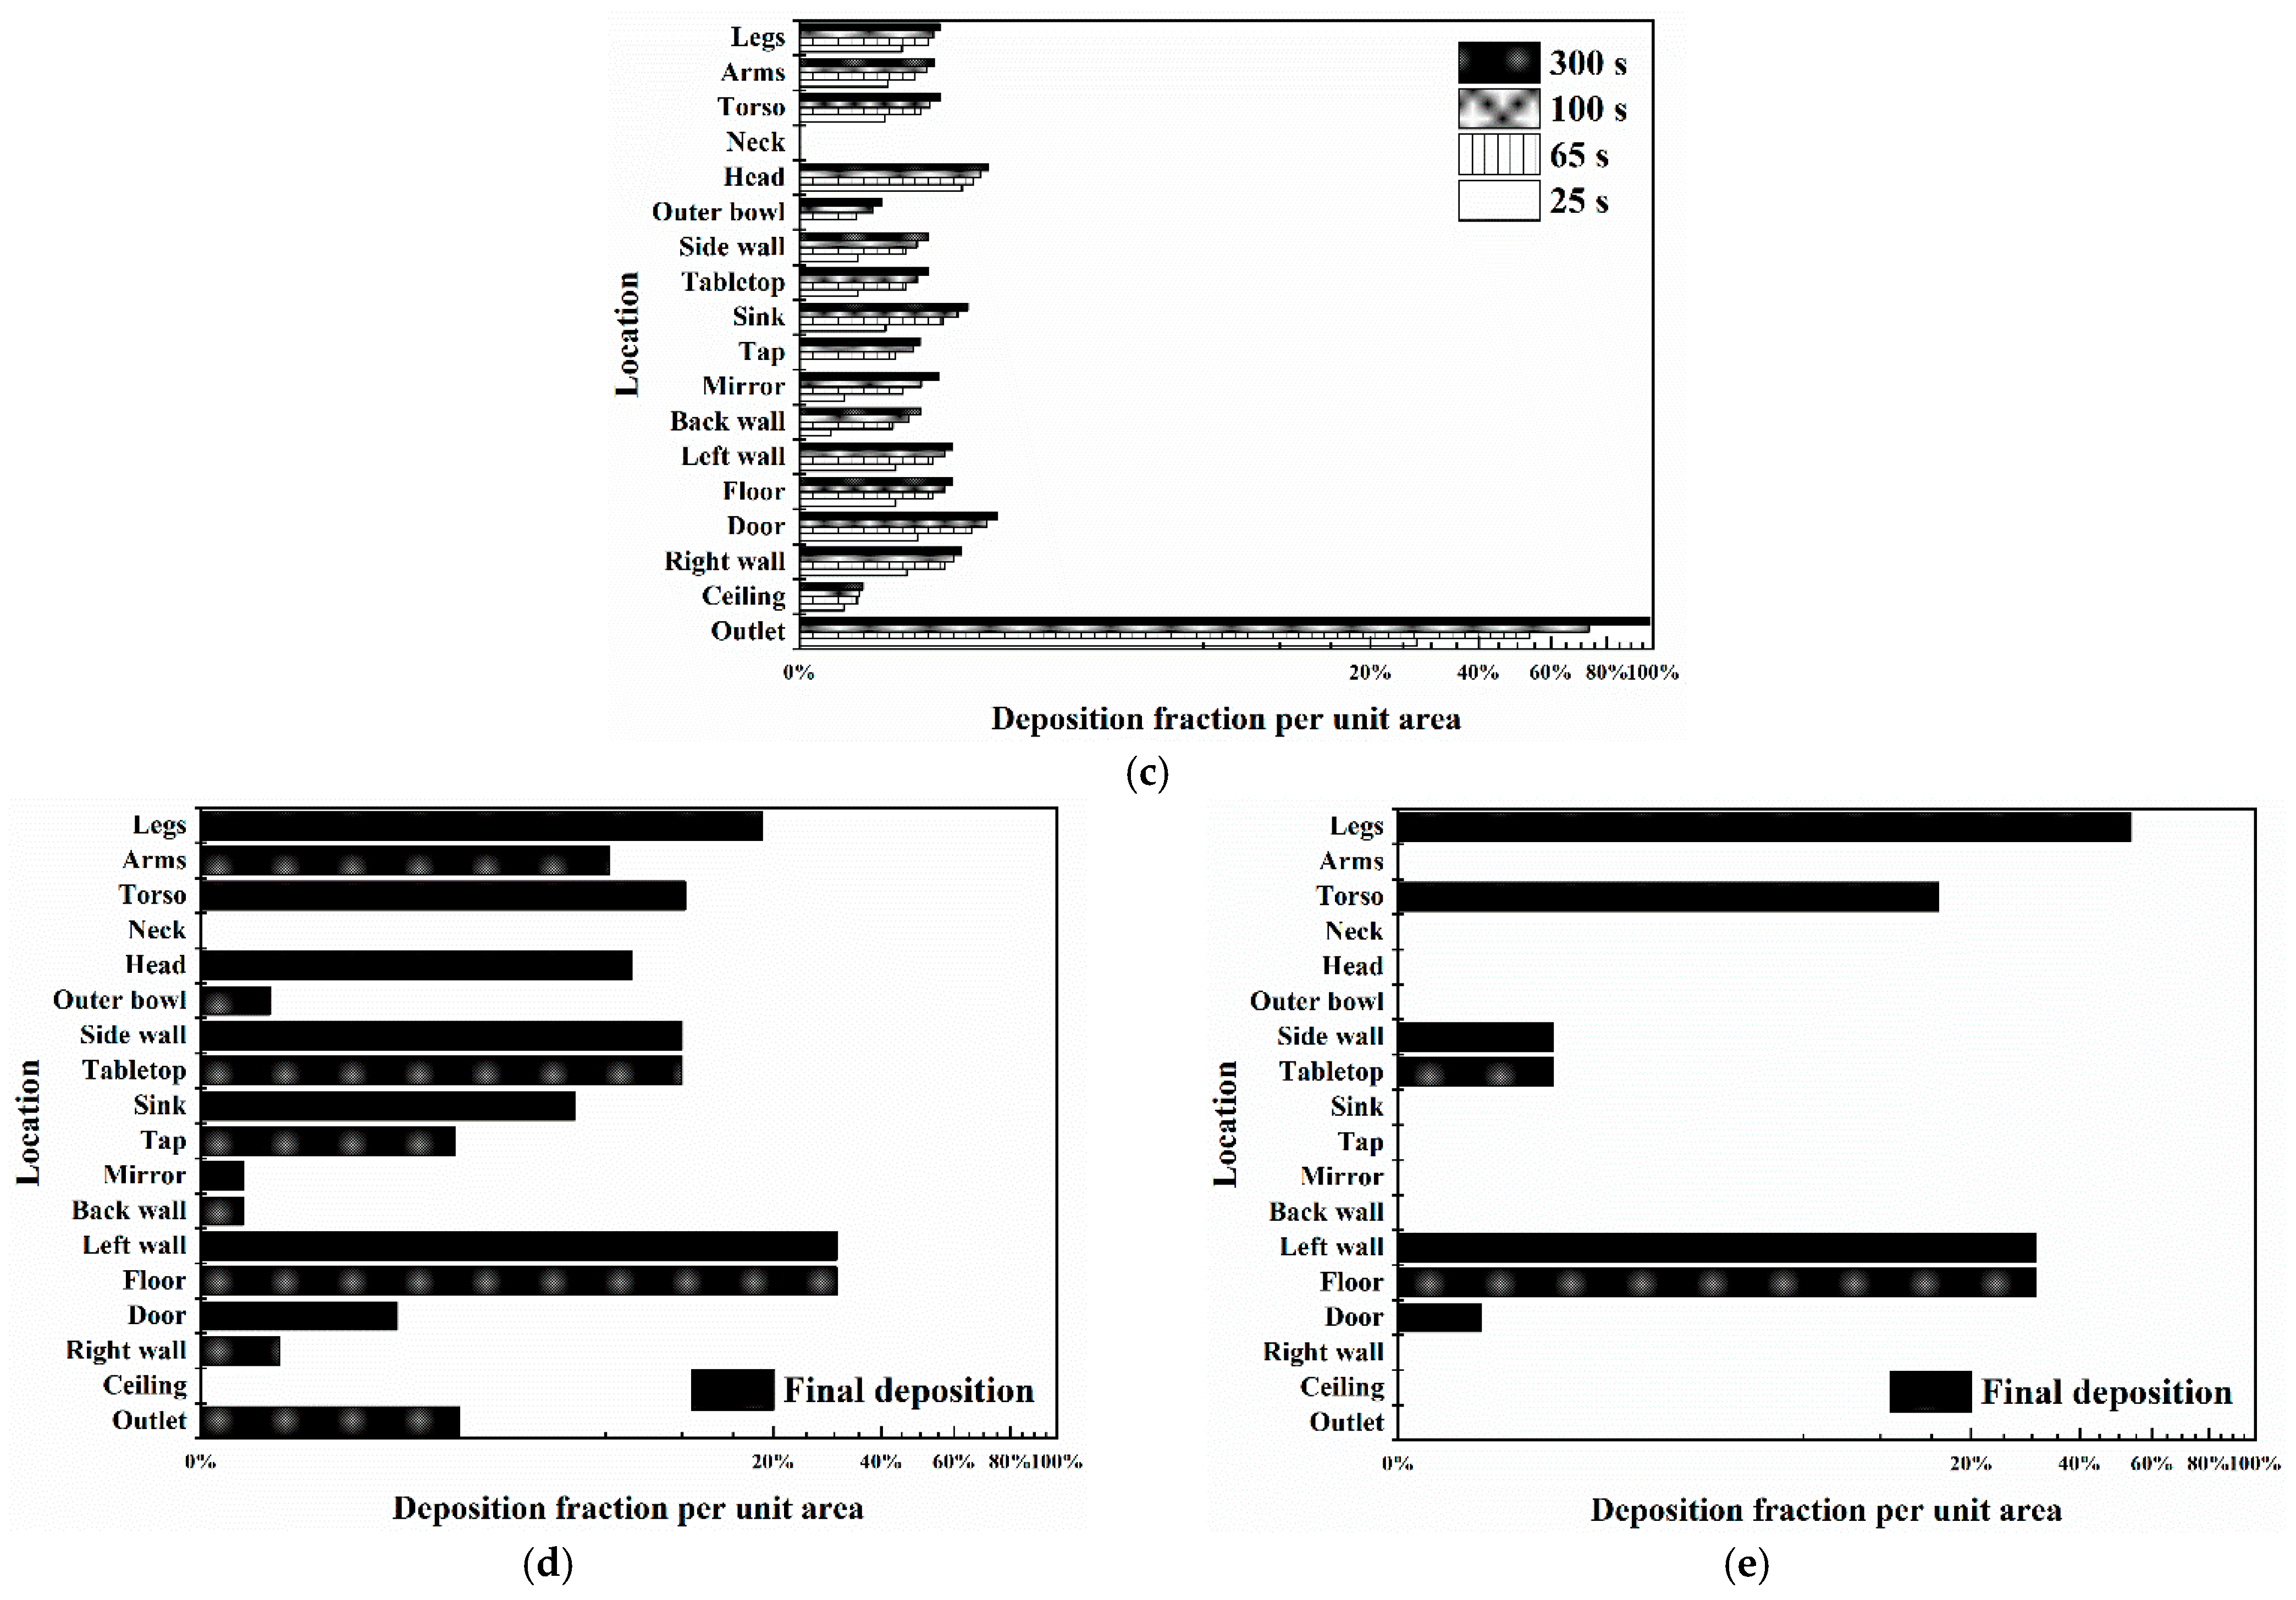
Figure 9 shows the percentage deposition of bioaerosols per unit area at 25 s, 65 s, 100 s, and 300 s for five key bioaerosol diameters. Most deposition occurs within the 100 s after toilet flush, and after 100 s, most bioaerosols are exhausted by the outlet. By the end of the simulation, 77.8% of 1 µm bioaerosols, 62.8% of 5 µm bioaerosols, and 47.7% of 10 µm bioaerosols escaped via the outlet. The seat and the inner surface of the toilet bowl are the first surfaces upon which bioaerosols deposited, followed by the back wall and right wall. Due to the effect of gravity, more 10 µm bioaerosols than smaller bioaerosols tend to deposit on the horizontal surfaces of the floor, tabletop, and sink. In contrast, 1 µm and 5 µm bioaerosols tend to deposit onto the ceiling, as the ceiling is closer to the outlet and as the turbulence intensity is relatively high near the ceiling, and 50 µm bioaerosols are almost always redeposited on the bowl quickly and only a small part is deposited on the seat, while 100 µm bioaerosols all redeposit on the bowl. The results for Case 1 are presented in Table 1, for comparison with Case 2.
3.2. Effect of Heated Standing Manikin
Airflow patterns of Case 2 with a standing thermal manikin after toilet flush are shown in Figure 10. At 2 s, the updraft flows between the legs and supplies the air for suction. Unlike in Case 1, the manikin blocks the flow, and thus the upper circulation is not generated, and the suction effect affects approximately half of the lavatory, around in line with the height of the wash table. With flow attenuation, at 10 s (Figure 10b), the main flow combines with this circulation to form a single circulation in the lavatory above the toilet. The flow carries bioaerosols out of the toilet bowl and deposits them on the legs of the manikin, as shown in Figure 11b. Due to the flow and the buoyancy-driven thermal plume, the bioaerosols travel in the vertical direction to the manikin surface, around which is the main thermal plume (Figure 11c). The distribution pattern of the bioaerosols (Figure 11e) also shows that the bioaerosols fill the entire lavatory and accumulate in the center of the two circulations: (a) above the toilet and in front of the manikin’s waist, and (b) the gap between manikin and door.
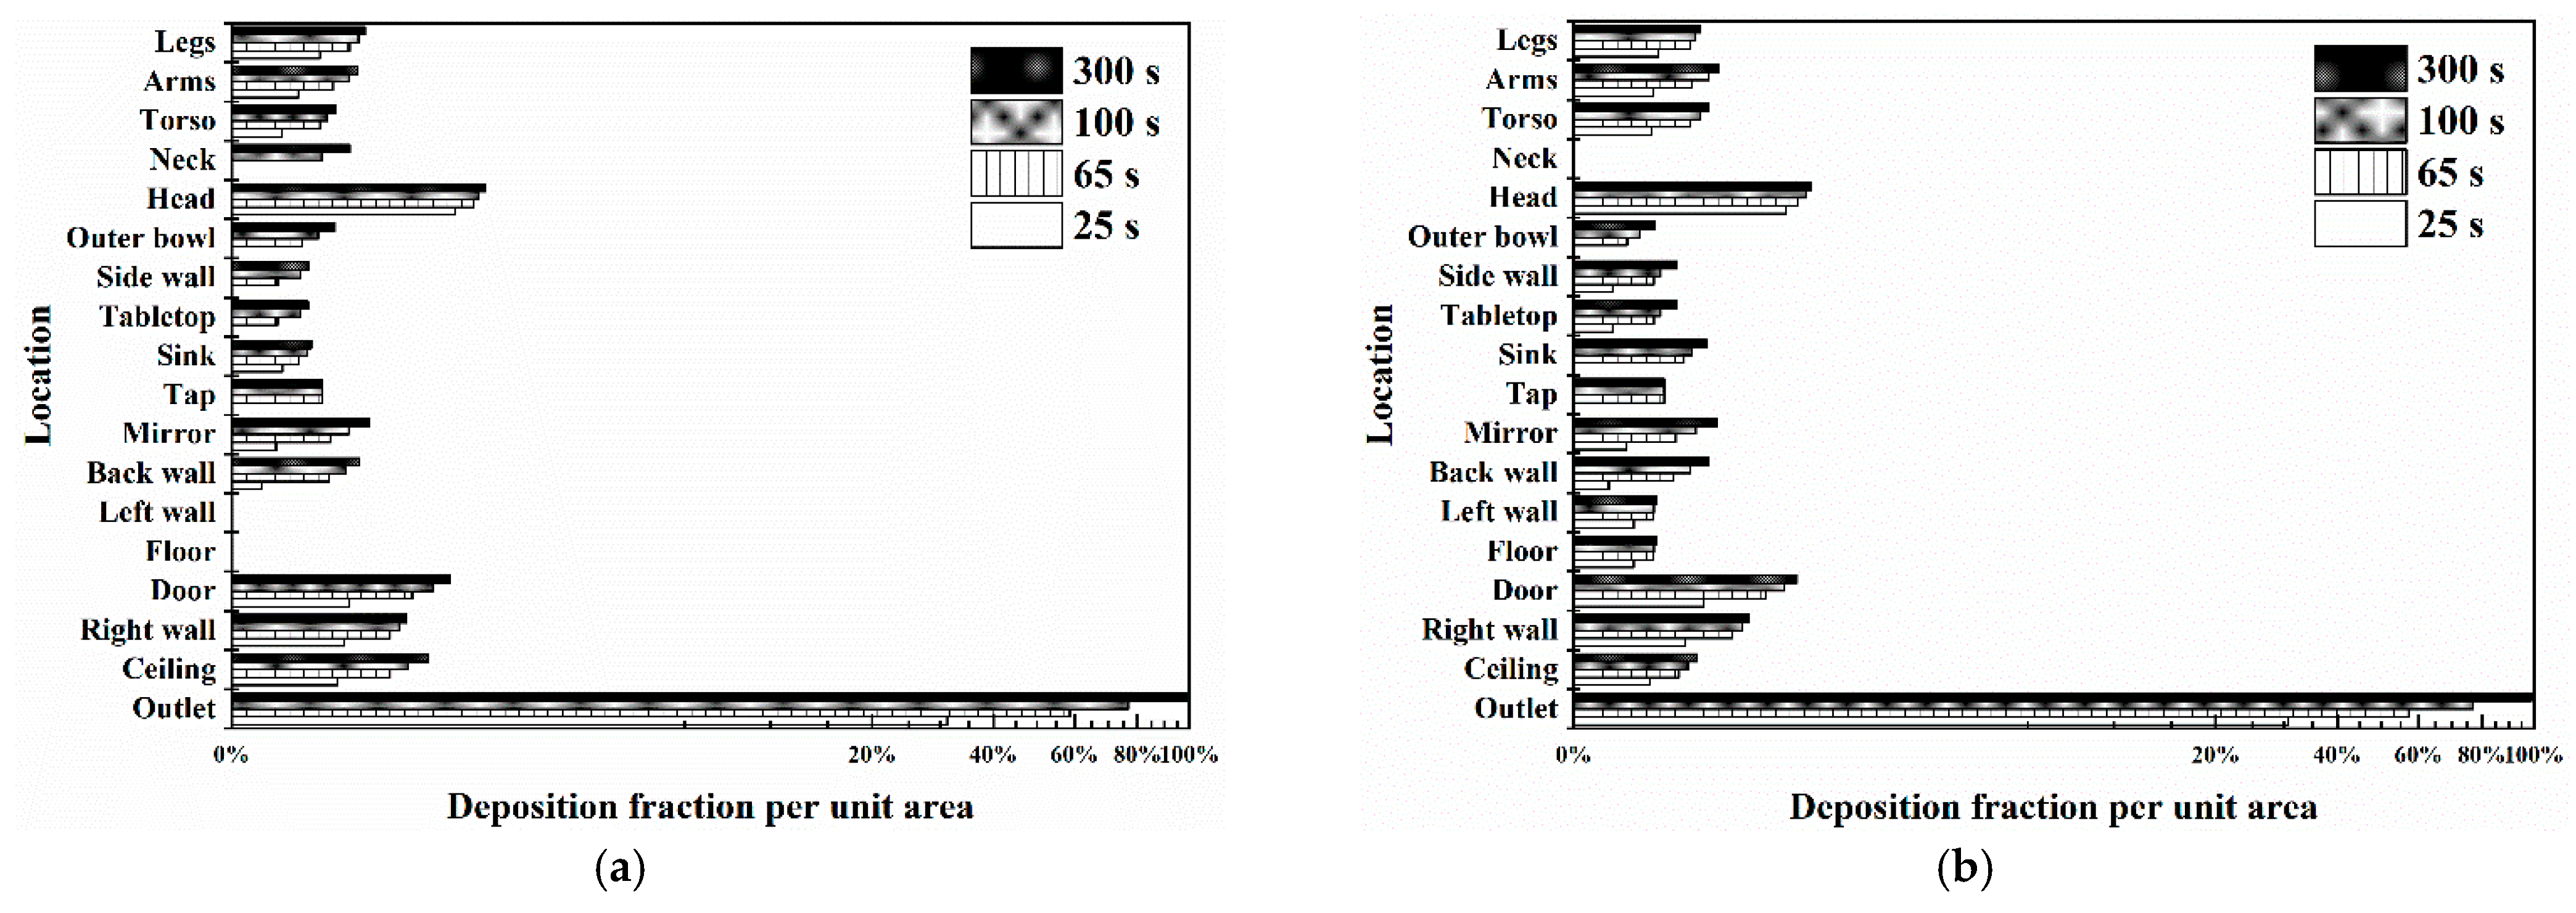
The final deposition time for Case 2 is 344 s for 1 µm bioaerosols, 324 s for 5 µm bioaerosols, and 181 s for 10 µm bioaerosols. For 50 and 100 µm bioaerosols, the final deposition times are 12 s and 4.06 s, respectively. The presence of the manikin increases the time required for the bioaerosols to reduce to 5% of the original concentration. This is because during the rapid deposition period, the strong airflow passes upward along the manikin’s body, reducing the airflow velocity above the toilet and thereby suspending the bioaerosols with lower kinetic energy. The particle loss rate coefficient is 12.6 h−1 for 1 µm bioaerosols, 13.0 h−1 for 5 µm bioaerosols, and 19.8 h−1 for 10 µm bioaerosols. For all bioaerosol sizes, the particle loss coefficients in the stabilized field are higher in Case 2 than in Case 1. The thermal plume creates a constant uprising airflow around the manikin, thereby transporting abundant bioaerosols from lower regions to the head of the manikin, from where they are removed by the outlet. The manikin is thus in the center of a well-mixed and high-kinetic-energy flow and offers a large surface area for deposition. There is substantial bioaerosol deposition on the legs and the body of the manikin (Appendix A, Figure A2), which is due to the characteristics of the airflow circulating between the manikin’s legs. By the end of the simulation, 74.7% of 1 µm bioaerosols, 63.1% of 5 µm bioaerosols, and 46.4% of 10 µm bioaerosols escaped via the outlet. Bioaerosol deposition on the left wall is slightly higher than that on the other walls, as the flow is directed leftward by the manikin’s legs.
3.3. Effect of Coughing in the Lavatory
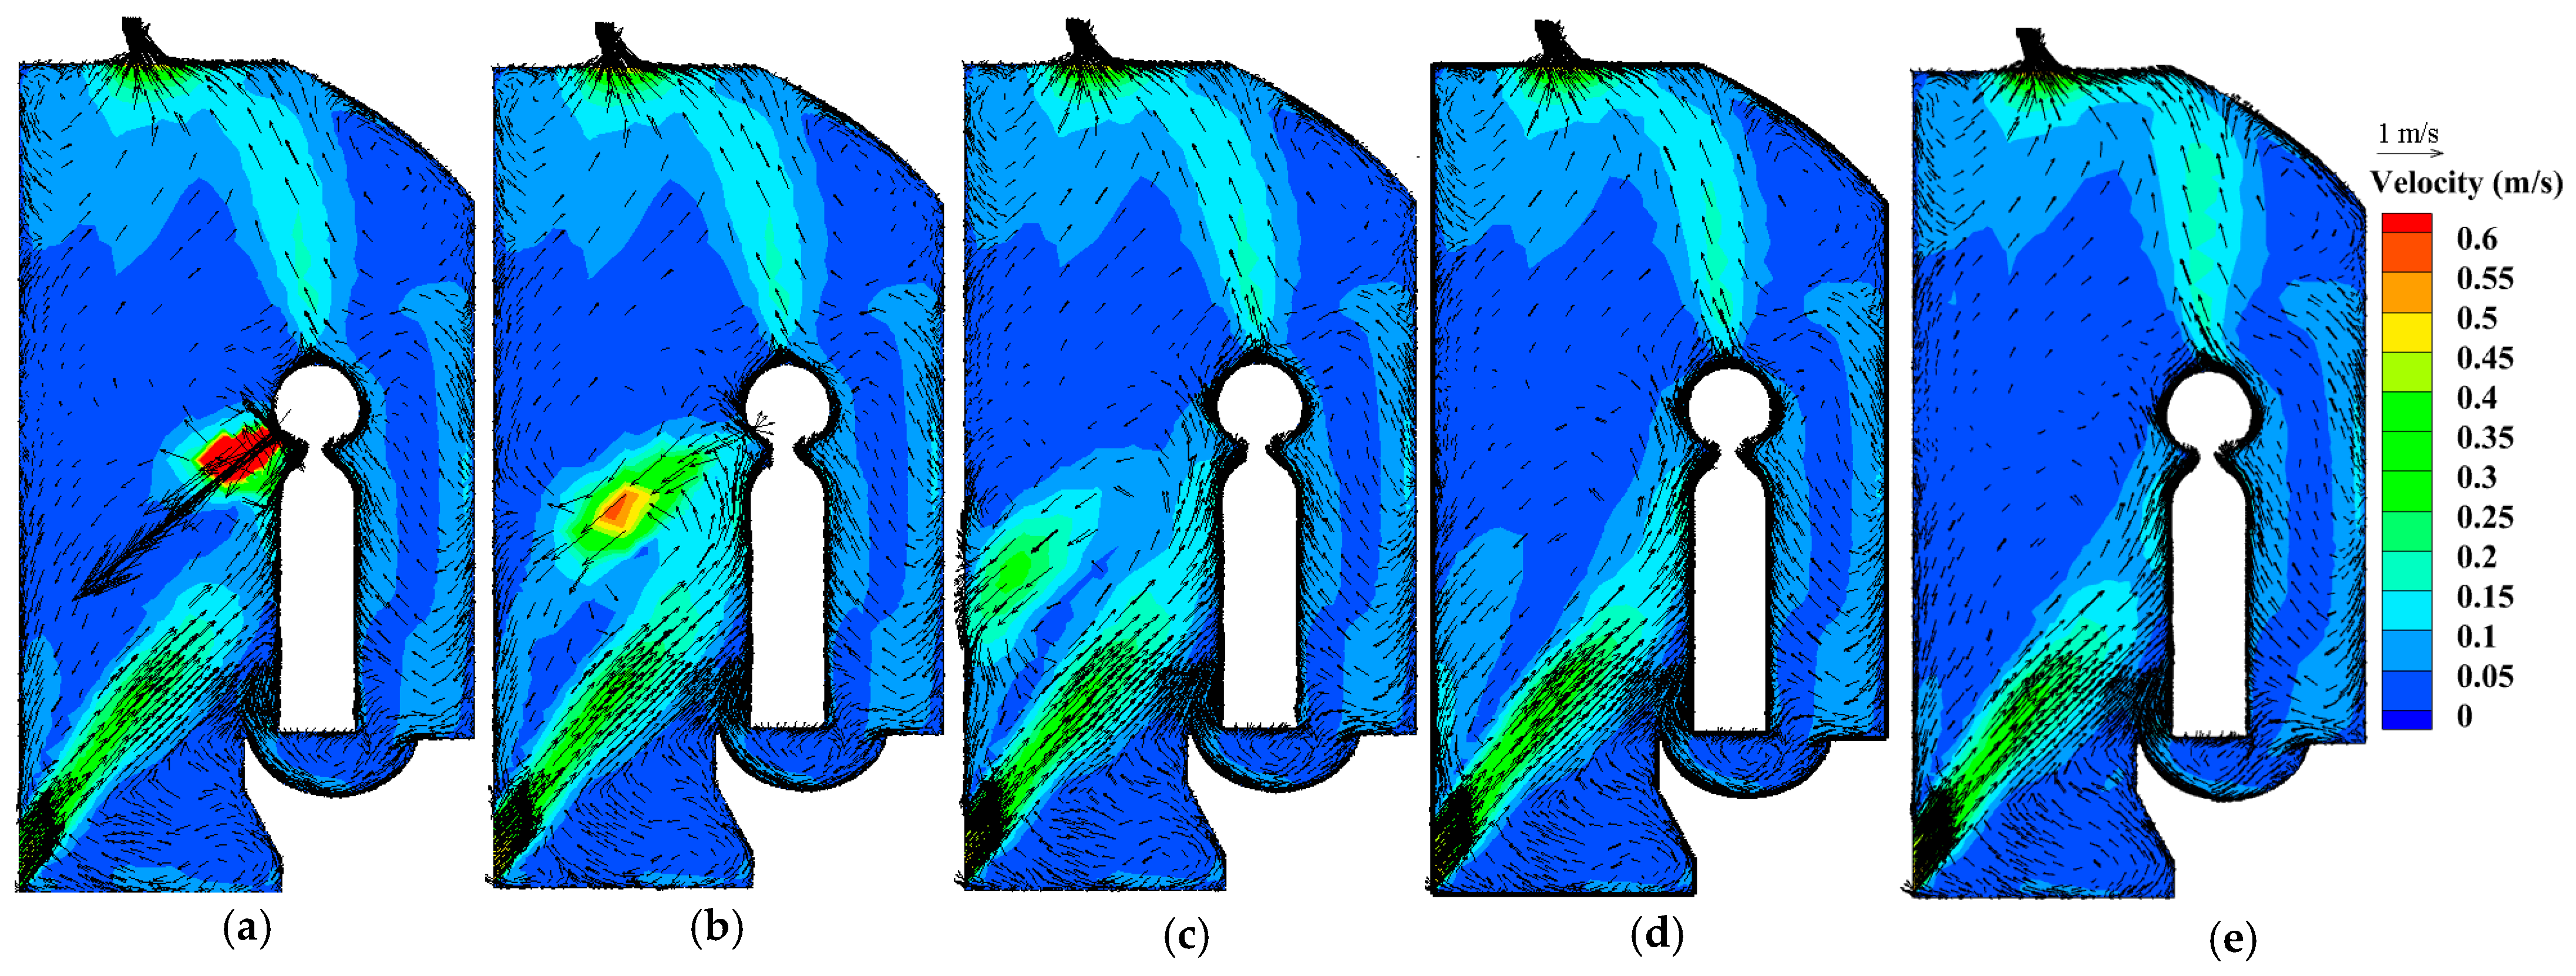
Case 3 explores the trajectories of bioaerosols produced by a user coughing in a seated position. This case demonstrates the consistency of the velocity field and the thermal plume around the manikin. Similar to the manikin in Case 2, the seated manikin directed the incoming flow, and the flow separated at the head due to the thermal plume. There was a small counterclockwise circulation in front of the seated manikin, beginning at the inlet, which may have carried the bioaerosols produced by coughing to the door. The time-dependent velocity vectors and the bioaerosol distribution of the cough flow are illustrated in Figure 12 and Figure 13. The flow fields are captured (a) at 0.1 s (the cough velocity peaks), (b) at 0.6 s (the end of the cough), (c) at 2 s, and (d) when the steady state is reached. Initially, the cough flow maintains its initial shape and trajectory due to its high jet velocity when exiting the source (Figure 12). Because the cough flow lasts only 0.6 s, the velocity fluctuations caused by coughing in Figure 12 are largely unaffected by the spatial velocity field, and the flow field in the lavatory returns to the steady state within a few seconds. In the initial period after the end of the cough, the coughed bioaerosols are rapidly ejected at a velocity close to 10.6 m/s straight toward the door, and are carried and subsequently diluted by the incoming airflow from the inlet. During this process, the flow becomes substantially weaker and is subsequently raised by the thermal plume around the seated manikin. A significant fraction of the bioaerosols gains an upward velocity against gravity, is elevated, and accumulates in the air under the influence of the main airflow and the thermal plume; if not for these influences, the bioaerosols would remain at lower positions or quickly settle on the floor (Figure 13). Especially at 6 s (Figure 13d), the bioaerosols released with low velocity are strongly attracted by the thermal plume and guided to the outlet. The resulting bioaerosol dilution pattern is essentially the same as in Cases 1 and 2.
By the end of the simulation, 68.5% of 1 µm bioaerosols, 65.7% of 5 µm bioaerosols, and 61.3% of 10 µm bioaerosols escaped via the outlet. Almost all of the 50 and 100 µm bioaerosols were completely deposited in the lavatory by 116 and 9 s, respectively. The final size-wise bioaerosol deposition pattern varies considerably and is somewhat random, probably due to the relatively few bioaerosols released by coughing relative to Cases 1 and 2 (Appendix A, Figure A3). Because the head and the manikin’s leg and torso are located in the path of the main airflow from the inlet to the thermal plume, small bioaerosols that fall into the circulation above the main airflow are caught in the main airflow and carried to the part of manikin. The cough is directed towards the door and therefore the fraction per unit area of bioaerosols deposited on the door is also significantly higher. Larger bioaerosols tend to deposit on the floor, and on the manikin’s legs and feet, rather than on the door.
4. Discussion
The risk of disease transmission in aircraft lavatories mainly arises from the large number of bioaerosols generated during toilet flushing and human respiratory activities. The poor ventilation pattern in aircraft lavatories prolongs the dwelling time of these bioaerosols. Our results show that bioaerosols can be suspended in a lavatory for as long as 299 s, even 348 s, after toilet flushing, meaning that subsequent toilet users face a risk of exposure to these suspended bioaerosols. Furthermore, bioaerosols tended to deposit on surfaces, such as the toilet seat, the outer surface of the bowl, the back wall, and the right wall, and these surfaces may be responsible for the fomite transmission of infectious diseases.
The dispersion, deposition, and dilution of bioaerosols are determined by the source characteristics and the flow pattern. For 1 and 5 µm suspended bioaerosols, the dwelling time and particle loss rate coefficient are similar for Case 1 and Case 2, which are, respectively, 315 s to 348 s and 14 h−1, but the 10 µm bioaerosols for Case 2 dwell at about 181 s with 19.8 h−1 particle loss rate coefficient. In the presence of a heated manikin simulating a human standing in front of the toilet, the rising thermal plume alters the flow field and weakens the impact of main stream from the inlet near the toilet so that more bioaerosols are carried out and tend to deposit in the seat and surfaces around the toilet than Case 1, e.g., on the sidewall: the percentage of the amount of bioaerosols deposited on the seat in Case 2 is 5% larger than that in Case 1. More than 2% of whole fecal aerosols released deposited on legs. There is also a relative reduction in the amount of deposition per unit area on the outlet and back wall and an increase on the door and left wall. The thermal plume in both Case 2 and Case 3 serves to converge and direct the airflow towards the outlet, but the overall velocity above the toilet in Case 2 is reduced because the standing manikin blocks the main stream, accentuating the effect of the human thermal plume, so that the difference in upward exhaust between different diameter of bioaerosols is more obvious: the number percentages of bioaerosols exhausted from the outlet are 74.7%, 63.1%, and 46.4% for the standing manikin case, while they are all around 74% for seated manikin case.
This study presented one specific compact lavatory model with a certain air distribution pattern. A similar structure of compact lavatory is commonly used in aircraft planes, trains, and watercrafts. Slightly different from the current air distribution pattern, Airbus series airplanes apply some personalized nozzles at the height of the washing table or other locations for supplying fresh air and reducing the bioaerosols concentration in the breathing zone. There is another air distribution pattern, where the exhaust is located under the toilet and the air supply is on the ceiling and the grille on the door. Shorter distances between the toilet and exhaust air vent are found to be more capable of improving the local air quality [39], which is widely used in Boeing series airplanes and the newest Airbus A350. However, there may be air circulations at the corner of the ceiling, which prolongs the dwelling time of bioaerosols. The exact locations of air supply, exhaust fan, and the personalized nozzles are modified by the structure of the lavatory for need, such as on the floor, side walls, or near the toilet for local ventilation. More detailed and specific ventilation of aircraft lavatories will be investigated in future study.
Aside from routine surface sanitization inside lavatories, improving indoor ventilation and air quality can help maintain hygiene and safety [40]. Flushing with the toilet lid closed is the easiest and recommended way to improve the removal efficiency and decay rates of contaminant bioaerosols in a lavatory. Best et al. [10] found that flushing with a closed toilet lid significantly reduced the amount of C. difficile spores deposited on surfaces. However, this solution requires compliance at the individual level, which might be difficult. Second, higher ventilation rates and shorter distances between the toilet and the exhaust air vent have been found to be capable of increasing local air quality and contaminant removal efficiency [39]. The lavatories studied in this paper already have a high ventilation rate, and it is not energy-efficient to further increase this ventilation rate. Thus, as bioaerosol movement and distribution may differ significantly depending on ventilation characteristics [26], the ventilation pattern could instead be improved. Third, far-ultraviolet radiation can kill pathogens deposited on a surface, but human exposure to direct radiation is a health risk. Seo et al. [41] proposed a novel filter, consisting of an ionizer and catalyst materials that are installed underneath a toilet seat, that has a series of suction holes. The system sucks in contaminated air inside the toilet bowl, and then blocks its outflow by entraining outside fresh air into the toilet bowl. Thus, it is indeed possible to block some of the bioaerosols from being carried out by circulation. However, the bioaerosols generated by violent velocity changes during flushing will escape even this control system.
This study has some limitations. First, the movements of a toilet user, such as touching the flush button, turning around, walking, and opening the door, were not considered. This movement disturbs the flow field and directly affects the removal and deposition of bioaerosols in a lavatory. Second, the structure and inlet/outlet locations of lavatories vary in different vehicles, leading to varied ventilation characteristics. These differences will be explored in future studies. Third, the evaporation of fecal aerosols and respiratory droplets was not considered. Nevertheless, the evaporation process was shown to not affect the fates of droplets smaller than 20 µm [22].
5. Conclusions
In this study, the flow characteristics and the release, dilution, and deposition of bioaerosols in a compact lavatory with vacuum toilet were investigated. Based on the results obtained, the following conclusions can be drawn:
- After toilet flush, a rising plume is formed, which drives fecal aerosols to spread to the entire lavatory within 100 s. The time required to reduce the bioaerosols to 5% of the total bioaerosol mass after toilet flush was estimated to be approximately 315 s to 348 s for 1, 5, and 10 µm bioaerosols, 11 s for 50 µm bioaerosols, and 0.06 s for 100 µm bioaerosols.
- Almost all of the fecal aerosols deposited on the bowl, and less than 1% escaped into the lavatory; these escaping bioaerosols tended to deposit on surfaces close to the bowl, especially the toilet seat. In an empty lavatory (i.e., without a manikin), the concentration of bioaerosols was highest on the back wall and the right wall, and the 10 μm bioaerosols tended to deposit on horizontal surfaces.
- With a manikin standing in front of the toilet, the bioaerosols deposited in large quantities on the manikin’s legs, as they were carried out by the airflow. In addition, the bioaerosols deposited on and accumulated in the airflow circulation at the manikin’s waist and the gap between the manikin and the door for long periods of time.
- With the manikin coughing in a seated position, a circulation above the inlet collected and raised the coughed bioaerosols, due to the combined effect of the thermal plume and the diluted main airflow. Therefore, there was a high risk of exposure along the path of the main airflow, and as the cough is directed towards the door, the fraction per unit area of bioaerosols deposited on the door is also significantly higher. As the size of the bioaerosols increased, they tended to increasingly deposit on the floor, and on the legs and feet of the manikin, rather than on the door.
Author Contributions
Conceptualization, methodology, validation, investigation, software, J.W. (Jingyuan Wan), J.W. (Jianjian Wei), and T.Z.; formal analysis, J.W. (Jingyuan Wan) and J.W. (Jianjian Wei); resources, J.W. (Jianjian Wei), and T.Z.; data curation, T.Z.; writing-original draft preparation, J.W. (Jingyuan Wan), J.W. (Jianjian Wei); writing-review and editing, all authors; visualization, J.W. (Jingyuan Wan) and J.W. (Jianjian Wei); supervision, Y.L. and T.Z. All authors have read and agreed to the published version of the manuscript.
Funding
This study was supported by the Natural Science Foundation of Zhejiang Province (LY20E080018) and the National Natural Science Foundation of China (52111530186). The APC was funded by T.Z.
Institutional Review Board Statement
Not applicable.
Informed Consent Statement
Not applicable.
Data Availability Statement
The data used to support the findings of this study are included within the article. The original details of the data presented in this study are available on request from the corresponding author.
Conflicts of Interest
The authors declare no conflict of interest.
Appendix A
The Appendix consists of velocity profiles of the middle cross-section of the outlet flushing by time (Figure A1), final deposition of bioaerosols per unit area for Case 2 by size (Figure A2), and final deposition of bioaerosols per unit area for Case 3 by size (Figure A3).
Figure A1.
Velocity profiles of the middle cross-section of the outlet flushing by time.

Figure A2.
Final deposition of bioaerosols per unit area for Case 2 by size: (a) 1 µm; (b) 5 µm; (c) 10 µm.
Figure A2.
Final deposition of bioaerosols per unit area for Case 2 by size: (a) 1 µm; (b) 5 µm; (c) 10 µm.

Figure A3.
Final deposition of bioaerosols per unit area for Case 3 by size: (a) 1 µm; (b) 5 µm; (c) 10 µm; (d) 50 µm; (e) 100 µm.
Figure A3.
Final deposition of bioaerosols per unit area for Case 3 by size: (a) 1 µm; (b) 5 µm; (c) 10 µm; (d) 50 µm; (e) 100 µm.


References
- Widdowson, M.A.; Glass, R.; Monroe, S.; Beard, R.S.; Bateman, J.W.; Lurie, P.; Johnson, C. Probable Transmission of Norovirus on an Airplane. JAMA 2005, 293, 1859–1860. [Google Scholar]
- Holmes, J.D.; Simmons, G.C. Gastrointestinal Illness Associated with a Long-Haul Flight. Epidemiol. Infect. 2009, 137, 441–447. [Google Scholar] [CrossRef]
- Barker, J.; Jones, M.V. The Potential Spread of Infection Caused by Aerosol Contamination of Surfaces after Flushing a Domestic Toilet. J. Appl. Microbiol. 2005, 99, 339–347. [Google Scholar] [CrossRef]
- Sze-To, G.N.; Yang, Y.; Kwan, J.K.C.; Yu, S.C.T.; Chao, C.Y.H. Effects of Surface Material, Ventilation, and Human Behavior on Indirect Contact Transmission Risk of Respiratory Infection. Risk Anal. 2014, 34, 818–830. [Google Scholar] [CrossRef] [PubMed]
- Schaumburg, F.; Köck, R.; Leendertz, F.H.; Becker, K. Airport Door Handles and the Global Spread of Antimicrobial-Resistant Bacteria: A Cross Sectional Study. Clin. Microbiol. Infect. 2016, 22, 1010–1011. [Google Scholar] [CrossRef]
- Lei, H.; Li, Y.; Xiao, S.; Yang, X.; Lin, C.; Norris, S.L.; Wei, D.; Hu, Z.; Ji, S. Logistic Growth of a Surface Contamination Network and Its Role in Disease Spread. Sci. Rep. 2017, 7, 14826. [Google Scholar] [CrossRef] [PubMed]
- Verani, M.; Bigazzi, R.; Carducci, A. Viral Contamination of Aerosol and Surfaces through Toilet Use in Health Care and Other Settings. Am. J. Infect. Control. 2014, 42, 758–762. [Google Scholar] [CrossRef]
- Sassi, H.P.; Reynolds, K.A.; Pepper, I.L.; Gerba, C.P. Evaluation of Hospital-Grade Disinfectants on Viral Deposition on Surfaces after Toilet Flushing. Am. J. Infect. Control 2018, 46, 507–511. [Google Scholar] [CrossRef] [Green Version]
- Bound, W.; Atkinson, R. Bacterial aerosol from water closets. Lancet 1966, 287, 1369–1370. [Google Scholar] [CrossRef]
- Best, E.L.; Sandoe, J.A.T.; Wilcox, M.H. Potential for Aerosolization of Clostridium Difficile after Flushing Toilets: The Role of Toilet Lids in Reducing Environmental Contamination Risk. J. Hosp. Infect. 2012, 80, 1–5. [Google Scholar] [CrossRef]
- Johnson, D.L.; Mead, K.R.; Lynch, R.A.; Hirst, D.V.L. Lifting the Lid on Toilet Plume Aerosol: A Literature Review with Suggestions for Future Research. Am. J. Infect. Control 2013, 41, 254–258. [Google Scholar] [CrossRef]
- Liu, J.; Zhu, X.; Cao, X.; Li, J.; Sun, H. Experimental Research on the Influence of Natural Convection on the Flow Field in the Cabin Mockup. Tianjin Daxue Xuebao (Ziran Kexue yu Gongcheng Jishu Ban)/Journal Tianjin Univ. Sci. Technol. 2016, 49, 221–230. [Google Scholar] [CrossRef]
- Zhang, Z.; Chen, X.; Mazumdar, S.; Zhang, T.; Chen, Q. Experimental and Numerical Investigation of Airflow and Contaminant Transport in an Airliner Cabin Mockup. Build. Environ. 2009, 44, 85–94. [Google Scholar] [CrossRef] [Green Version]
- Liu, W.; Wen, J.; Chao, J.; Yin, W.; Shen, C.; Lai, D.; Lin, C.H.; Liu, J.; Sun, H.; Chen, Q. Accurate and High-Resolution Boundary Conditions and Flow Fields in the First-Class Cabin of an MD-82 Commercial Airliner. Atmos. Environ. 2012, 56, 33–44. [Google Scholar] [CrossRef]
- Li, J.; Liu, J.; Cao, X.; Jiang, N. Experimental Study of Transient Air Distribution of a Jet Collision Region in an Aircraft Cabin Mock-Up. Energy Build. 2016, 127, 786–793. [Google Scholar] [CrossRef]
- You, R.; Chen, J.; Shi, Z.; Liu, W.; Lin, C.H.; Wei, D.; Chen, Q. Experimental and Numerical Study of Airflow Distribution in an Aircraft Cabin Mock-up with a Gasper On. J. Build. Perform. Simul. 2016, 9, 555–566. [Google Scholar] [CrossRef]
- Zhang, T.T.; Li, P.; Wang, S. A Personal Air Distribution System with Air Terminals Embedded in Chair Armrests on Commercial Airplanes. Build. Environ. 2012, 47, 89–99. [Google Scholar] [CrossRef]
- Liu, W.; Wen, J.; Lin, C.H.; Liu, J.; Long, Z.; Chen, Q. Evaluation of Various Categories of Turbulence Models for Predicting Air Distribution in an Airliner Cabin. Build. Environ. 2013, 65, 118–131. [Google Scholar] [CrossRef]
- Chen, C.; Liu, W.; Li, F.; Lin, C.H.; Liu, J.; Pei, J.; Chen, Q. A Hybrid Model for Investigating Transient Particle Transport in Enclosed Environments. Build. Environ. 2013, 62, 45–54. [Google Scholar] [CrossRef]
- Lai, A.C.K.; Chen, F. Modeling Particle Deposition and Distribution in a Chamber with a Two-Equation Reynolds-Averaged Navier-Stokes Model. J. Aerosol Sci. 2006, 37, 1770–1780. [Google Scholar] [CrossRef]
- Zhao, B.; Chen, C.; Tan, Z. Modeling of Ultrafine Particle Dispersion in Indoor Environments with an Improved Drift Flux Model. J. Aerosol Sci. 2009, 40, 29–43. [Google Scholar] [CrossRef]
- Chen, C.; Zhao, B. Some Questions on Dispersion of Human Exhaled Droplets in Ventilation Room: Answers from Numerical Investigation. Indoor Air 2010, 20, 95–111. [Google Scholar] [CrossRef] [PubMed]
- Wang, M.; Lin, C.H.; Chen, Q. Advanced Turbulence Models for Predicting Particle Transport in Enclosed Environments. Build. Environment 2012, 47, 40–49. [Google Scholar] [CrossRef]
- Wei, J.; Li, Y. Human Cough as a Two-Stage Jet and Its Role in Particle Transport. PLoS ONE 2017, 12, e0169235. [Google Scholar] [CrossRef] [Green Version]
- Chen, X.; Feng, Y.; Zhong, W.; Kleinstreuer, C. Numerical Investigation of the Interaction, Transport and Deposition of Multicomponent Droplets in a Simple Mouth-Throat Model. J. Aerosol Sci. 2017, 105, 108–127. [Google Scholar] [CrossRef]
- Zhao, B.; Zhang, Y.; Li, X.; Yang, X.; Huang, D. Comparison of Indoor Aerosol Particle Concentration and Deposition in Different Ventilated Rooms by Numerical Method. Build. Environ. 2004, 39, 1–8. [Google Scholar] [CrossRef]
- Kiasadegh, M.; Emdad, H.; Ahmadi, G.; Abouali, O. Transient Numerical Simulation of Airflow and Fibrous Particles in a Human Upper Airway Model. J. Aerosol Sci. 2020, 140, 105480. [Google Scholar] [CrossRef]
- Li, M.; Zhao, B.; Tu, J.; Yan, Y. Study on the Carbon Dioxide Lockup Phenomenon in Aircraft Cabin by Computational Fluid Dynamics. Build. Simul. 2015, 8, 431–441. [Google Scholar] [CrossRef]
- Li, P.; Zhang, T.T. Transient Airflow and Particle Transmission after Flushing Toilet in a Lavatory on Airplane. In Proceedings of the Healthy Buildings, Changsha, China, 22–25 October 2019; pp. 1–4. [Google Scholar]
- Gupta, J.K.; Lin, C.H.; Chen, Q. Flow Dynamics and Characterization of a Cough. Indoor Air 2009, 19, 517–525. [Google Scholar] [CrossRef]
- Wang, L.; Dai, X.; Wei, J.; Ai, Z.; Fan, Y.; Tang, L. Numerical Comparison of the Efficiency of Mixing Ventilation and Impinging Jet Ventilation for Exhaled Particle Removal in a Model Intensive Care Unit. Build. Environ. 2021, 200, 107955. [Google Scholar] [CrossRef]
- Li, X.; Yan, Y.; Tu, J. The Simplification of Computer Simulated Persons (CSPs) in CFD Models of Occupied Indoor Spaces. Build. Environ. 2015, 93, 155–164. [Google Scholar] [CrossRef]
- Kowalski, W.J.; Bahnfleth, W.P.; Whittam, T.S. Filtration of Airborne Microorganisms: Modeling and Prediction. ASHRAE Trans. 1999, 105, 4–17. [Google Scholar]
- Nicas, M.; Nazaroff, W.W.; Hubbard, A. Toward Understanding the Risk of Secondary Airborne Infection: Emission of Respirable Pathogens. J. Occup. Environ. Hyg. 2005, 2, 143–154. [Google Scholar] [CrossRef] [PubMed]
- Yang, S.; Lee, G.W.M.; Chen, C.M.; Wu, C.C.; Yu, K.P. The Size and Concentration of Droplets Generated by Coughing in Human Subjects. J. Aerosol Med. Depos. Clear. Eff. Lung 2007, 20, 484–494. [Google Scholar] [CrossRef]
- Makhoul, A.; Ghali, K.; Ghaddar, N.; Chakroun, W. Investigation of Particle Transport in Offices Equipped with Ceiling-Mounted Personalized Ventilators. Build. Environ. 2013, 63, 97–107. [Google Scholar] [CrossRef]
- Murakami, S.; Kato, S.; Nagano, S.; Tanaka, Y. Diffusion Characteristics of Airborne Particles with Gravitational Settling in a Convection-Dominant Indoor Flow Field. ASHRAE Trans. 1992, 98, 82–97. [Google Scholar]
- Lai, A.C.K.; Nazaroff, W.W. Modeling Indoor Particle Deposition from Turbulent Flow onto Smooth Surfaces. J. Aerosol Sci. 2000, 31, 463–476. [Google Scholar] [CrossRef]
- Tung, Y.C.; Hu, S.C.; Tsai, T.Y. Influence of Bathroom Ventilation Rates and Toilet Location on Odor Removal. Build. Environ. 2009, 44, 1810–1817. [Google Scholar] [CrossRef]
- Tang, J.W.; Marr, L.C.; Li, Y.; Dancer, S.J. Covid-19 Has Redefined Airborne Transmission. BMJ 2021, 373, n913. [Google Scholar] [CrossRef] [PubMed]
- Seo, Y.; Seouk Park, I. Study for Flow and Mass Transfer in Toilet Bowl by Using Toilet Seat Adopting Odor/Bacteria Suction Feature. Build. Environ. 2013, 67, 46–55. [Google Scholar] [CrossRef]
Figure 1.
Schematic of the aircraft lavatory model.

Figure 2.
Three investigated scenarios (cases): (a) flushing in an empty lavatory; (b) a standing manikin flushing; (c) a seated manikin coughing.
Figure 2.
Three investigated scenarios (cases): (a) flushing in an empty lavatory; (b) a standing manikin flushing; (c) a seated manikin coughing.

Figure 3.
(a) Grid independence test; (b) illustration of the final mesh for Case 2.

Figure 4.
(a) Temporal suction flow rate profile at the opening of the vacuum toilet trap; (b) temporal velocity profile at the mouth of the manikin during coughing.
Figure 4.
(a) Temporal suction flow rate profile at the opening of the vacuum toilet trap; (b) temporal velocity profile at the mouth of the manikin during coughing.

Figure 5.
Comparison of experimental data and numerical calculation results in terms of (a) velocity and (b) particle deposition fraction.
Figure 5.
Comparison of experimental data and numerical calculation results in terms of (a) velocity and (b) particle deposition fraction.

Figure 6.
Velocity field at the symmetrical plane of the toilet for Case 1 after flushing (t = 0 when toilet flush starts) at (a) steady state; (b) 2 s; (c) 10 s; (d) 25 s; (e) 65 s.
Figure 6.
Velocity field at the symmetrical plane of the toilet for Case 1 after flushing (t = 0 when toilet flush starts) at (a) steady state; (b) 2 s; (c) 10 s; (d) 25 s; (e) 65 s.


Figure 7.
Time series of fecal aerosol distribution patterns for Case 1: (a) 1 µm; (b) 10 µm.


Figure 8.
States of bioaerosols, and the empirical exponential fit to the number of suspended bioaerosols for Case 1 by size: (a) 1 µm; (b) 5 µm; (c) 10 µm; (d) 50 µm.
Figure 8.
States of bioaerosols, and the empirical exponential fit to the number of suspended bioaerosols for Case 1 by size: (a) 1 µm; (b) 5 µm; (c) 10 µm; (d) 50 µm.

Figure 9.
The final deposition of bioaerosols per unit area for Case 1: (a) 1 µm; (b) 5 µm; (c) 10 µm.
Figure 9.
The final deposition of bioaerosols per unit area for Case 1: (a) 1 µm; (b) 5 µm; (c) 10 µm.

Figure 10.
Time series of air distribution in the middle cross-section of the toilet for Case 2 at (a) 2 s; (b) 10 s; (c) 25 s; (d) steady state.
Figure 10.
Time series of air distribution in the middle cross-section of the toilet for Case 2 at (a) 2 s; (b) 10 s; (c) 25 s; (d) steady state.

Figure 11.
Time series of 1 µm bioaerosol distribution pattern for Case 2 at (a) 4 s; (b) 10 s; (c) 25 s; (d) 65 s; (e) 100 s; (f) 300 s.
Figure 11.
Time series of 1 µm bioaerosol distribution pattern for Case 2 at (a) 4 s; (b) 10 s; (c) 25 s; (d) 65 s; (e) 100 s; (f) 300 s.

Figure 12.
Time series of air distribution in the middle cross-section of the toilet for Case 3 at (a) 0.1 s; (b) 0.6 s; (c) 2 s; (d) 6 s; (e) 36 s.
Figure 12.
Time series of air distribution in the middle cross-section of the toilet for Case 3 at (a) 0.1 s; (b) 0.6 s; (c) 2 s; (d) 6 s; (e) 36 s.

Figure 13.
Time series of 1 µm bioaerosol distribution pattern for Case 3 at (a) 0.2 s; (b) 0.6 s; (c) 2 s; (d) 6 s; (e) 36 s.
Figure 13.
Time series of 1 µm bioaerosol distribution pattern for Case 3 at (a) 0.2 s; (b) 0.6 s; (c) 2 s; (d) 6 s; (e) 36 s.


Table 1.
Comparison of Case 1 and Case 2 in terms of bioaerosol fates and ventilation efficiency.
| Case | Diameter (μm) | Particle Loss Rate Coefficient β (h−1) | Empirical Particle Loss Rate Coefficients in Well-Mixed Room (h−1) | The Time Bioaerosols Concentration Reached 5% of the Original Concentration (s) | Bioaerosols Number Fraction Exhausted from Outlet |
|---|---|---|---|---|---|
| Case 1 | 1 | 14.1 | 30.0 | 315 | 77.8% |
| 5 | 14.2 | 30.9 | 348 | 62.8% | |
| 10 | 13.8 | 33.5 | 299 | 47.7% | |
| 50 | / | / | 15 | 0 | |
| 100 | / | / | 4.06 | 0 | |
| Case 2 | 1 | 12.6 | 30.0 | 344 | 74.7% |
| 5 | 13.0 | 30.9 | 324 | 63.1% | |
| 10 | 19.8 | 33.5 | 181 | 46.4% | |
| 50 | / | / | 12 | 0 | |
| 100 | / | / | 4.06 | 0 |
Publisher’s Note: MDPI stays neutral with regard to jurisdictional claims in published maps and institutional affiliations. |
© 2021 by the authors. Licensee MDPI, Basel, Switzerland. This article is an open access article distributed under the terms and conditions of the Creative Commons Attribution (CC BY) license (https://creativecommons.org/licenses/by/4.0/).
Share and Cite
MDPI and ACS Style
Wan, J.; Wei, J.; Lin, Y.; Zhang, T. Numerical Investigation of Bioaerosol Transport in a Compact Lavatory. Buildings 2021, 11, 526. https://0-doi-org.brum.beds.ac.uk/10.3390/buildings11110526
AMA Style
Wan J, Wei J, Lin Y, Zhang T. Numerical Investigation of Bioaerosol Transport in a Compact Lavatory. Buildings. 2021; 11(11):526. https://0-doi-org.brum.beds.ac.uk/10.3390/buildings11110526
Chicago/Turabian StyleWan, Jingyuan, Jianjian Wei, Yingtien Lin, and Tengfei (Tim) Zhang. 2021. "Numerical Investigation of Bioaerosol Transport in a Compact Lavatory" Buildings 11, no. 11: 526. https://0-doi-org.brum.beds.ac.uk/10.3390/buildings11110526
Note that from the first issue of 2016, this journal uses article numbers instead of page numbers. See further details here.