Article

Effect of Frequency Characteristics of Ground Motion on Response of Tuned Mass Damper Controlled Inelastic Concrete Frame

by
Md Motiur Rahman
1,2,
Tahmina Tasnim Nahar
1,2 and
Dookie Kim
3,*
1
Department of Civil and Environmental Engineering, Kunsan National University, Gunsan-si, Jeollabuk-do 54150, Korea
2
Department of Civil Engineering, Pabna University of Science and Technology, Pabna 6600, Bangladesh
3
Department of Civil and Environmental Engineering, Kongju National University, Cheonan-si, Chungnam 31080, Korea
*
Author to whom correspondence should be addressed.
Submission received: 4 February 2021 / Revised: 15 February 2021 / Accepted: 16 February 2021 / Published: 20 February 2021
(This article belongs to the Section Building Structures)

Abstract

:
This paper investigates the performance of tuned mass damper (TMD) and dynamic behavior of TMD-controlled concrete structure considering the ground motion (GM) characteristics based on frequency content. The effectiveness of TMD in reducing the structural response and probability of collapse of the building frames are affected by the frequency characteristics of GMs. To attenuate the seismic vibration of the buildings, the TMD controlled building has been designed based on the modal analysis (modal frequencies and modal mass participation ratio). In this study, to investigate the performance of TMD, four different heights (i.e., 3, 5, 10, 20 stories) inelastic concrete moment-resisting frames equipped with TMDs are developed using an open-source finite element software. A series of numerical analyses have been conducted using sixty earthquakes classified into three categories corresponding to low, medium, and high-frequency characteristics of GMs. To evaluate the proposed strategy, peak lateral displacements, inter-story drift, and the probability of collapse using fragility analysis have been investigated through the structures equipped with and without TMD. The results appraise the effect of TMD and compare the seismic responses of earthquake frequency contents and the vibration control system of the inelastic building frames.

1. Introduction

The unpredictable natural hazard has a great impact on the structural responses which leads to damage in the concrete frame. Several devices can be efficiently installed in the building structure to mitigate the possible damage. In building structures, inducement of vibration due to earthquake excitation and strong winds is a very common issue. Therefore, complementary vibration control devices are needed to reduce the response of structures owing to different types of loads. A huge amount of vibration controlling devices have been introduced in different studies, such as active mass damper (AMD) [1], semi-active control system [2], damping isolation system [3], etc. which act as active controlling devices; and tuned liquid column damper (TLCD) [4], friction damper [5], tuned mass damper (TMD) [6] which act as passive controlling devices. Apart from these, some other control devices were used in recent years as named by semi-active and hybrid systems. The main strategies of such kind of structural vibration control systems are to exhaust the earthquake and wind-induced input energy, which can decrease the consequences of the intense worsened tremble on the most vulnerable parts of the frame structures.
The TMD is a kind of passive vibration control device that is used widely in many civil and mechanical engineering applications. Besides controlling the dynamic response of structures, it is also popular because of its ease of installation, robustness, and usefulness [7]. Generally, a TMD comprising of a mass, a linear spring, and a damper is included with the structural system, typically installed on the building roof. As the workability of a TMD system is extremely dependent on its parameter, the design is an important issue. When the most dominant response of the structure becomes the first mode, the TMD can work effectively. Five methodologies have been adopted in this study to compare the determined result of the optimum tuning parameters of a TMD. The methodology explained in Krenk and Høgsberg [8] investigated the calibration of the TMD parameters without considering the structural damping, whereas Rüdinger [9] explained the optimal methodology with nonlinear power-law viscous damper excited by white noise. The third methodology explained that the design of the TMD followed the perturbation solutions [10]. According to Den Hartog [11], the design of the TMD follows the perturbation solutions. Moreover, Warburton [12] proposed the optimum frequency and optimal damping ratio of TMD for random vibration. Among these five design criteria, the methodology explained in Rüdinger [9] found very effective value for optimal determination of the TMD parameters. Consequently, using the effective parameters for TMD design, the performance in the building as a passive vibration control device has been carried out for four different RCC frame heights (i.e., 3, 5, 10, 20 stories). To evaluate the response behavior under different frequency characteristics of ground motion (GM), one low-rise (3 stories), two mid-rise (5 and 10 stories), and one high-rise (20 stories) buildings were evaluated with and without TMD.
In the present study, the taken moment-resisting RCC frames are designed considering the wind and earthquake load based on KBC. The finite element analysis software OpenSees and the visualization software FeView helped to model the two-dimensional frames by considering the concentrated plasticity model approach as well. The dynamic structural behavior is carried out considering the nonlinear performance of the beam-column joints, where the zero-length spring elements and the rotational springs at both of the joints end [13,14].
The principal objective of the study is to investigate the performance of TMD controlled RCC building frames subjected to wind and seismic excitation. The fragility analysis for three different frequency contents of the selected GMs will demonstrate the influence of the earthquake frequency content of the TMD performance. To analyze the structural response at different damage levels (slight, moderate, extensive, and severe) [15], the incremental dynamic analysis (IDA) method by Baker [16] has been adopted. At the same time, this study also shows the TMD controlling effect on the peak lateral displacement and inter-story drift ratio as well. Therefore, by adopting this methodology the engineers can identify the TMD-equipped building response in different earthquake levels as well as in different GM frequency contents.

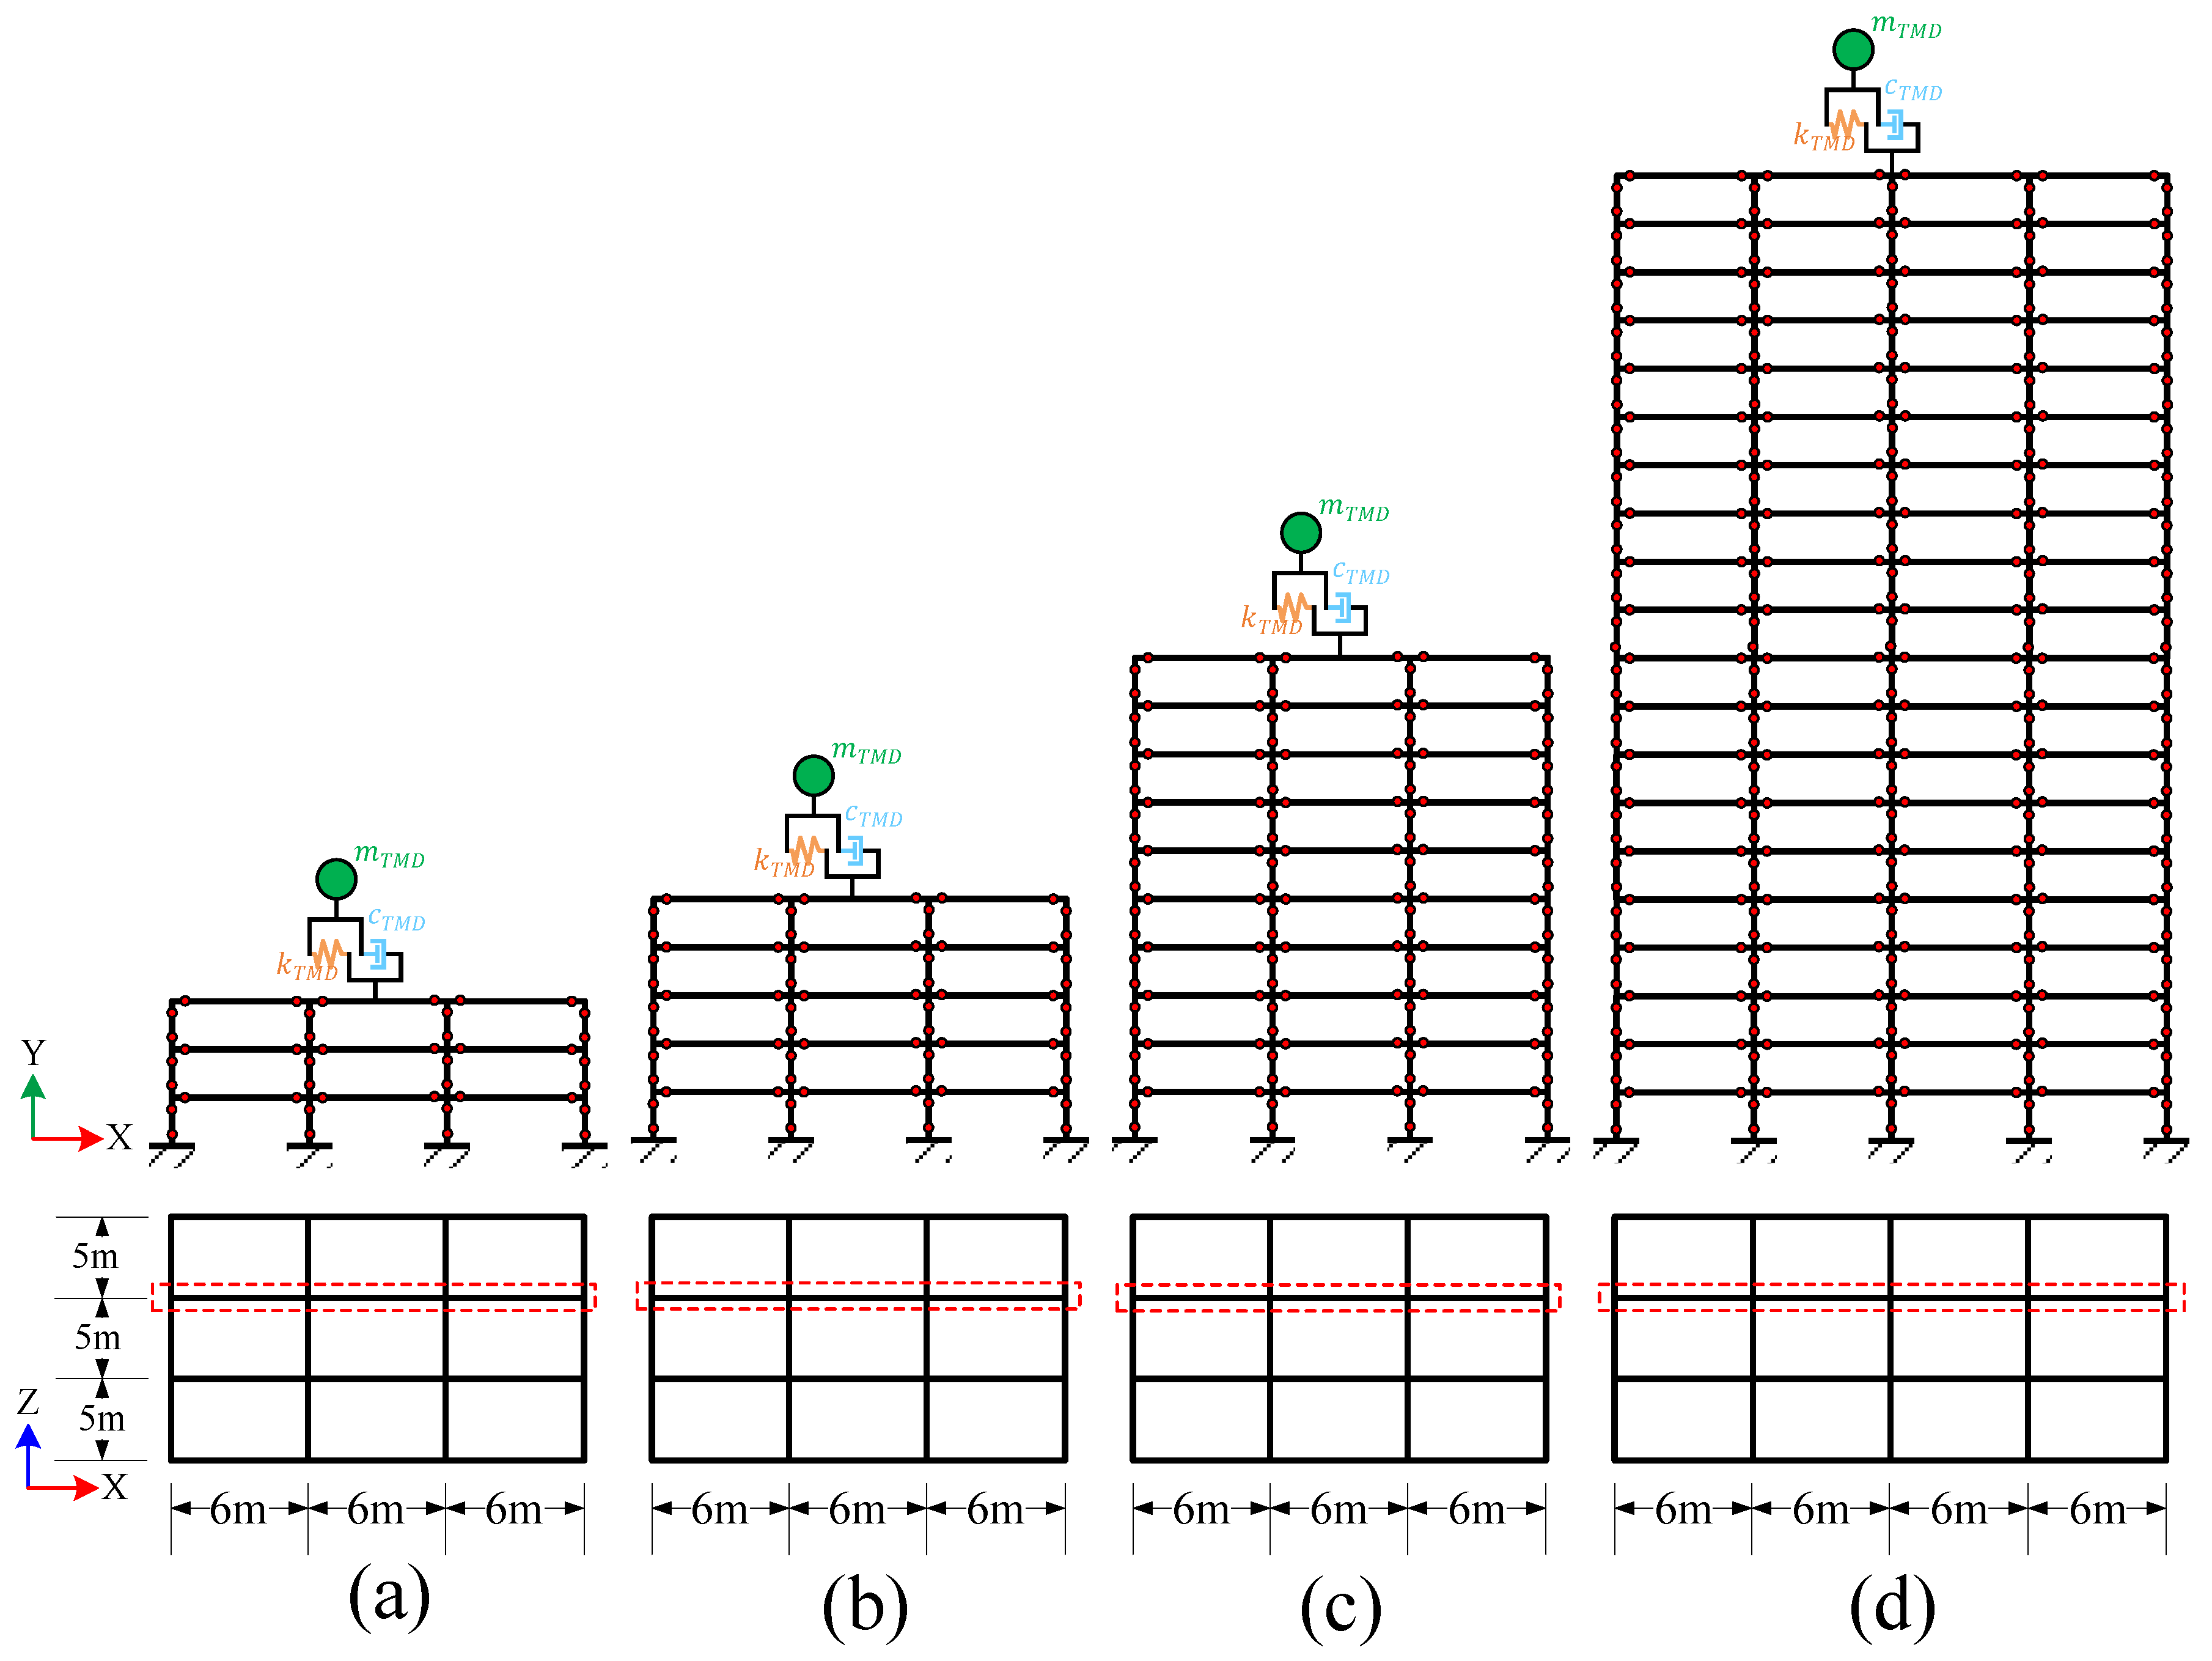
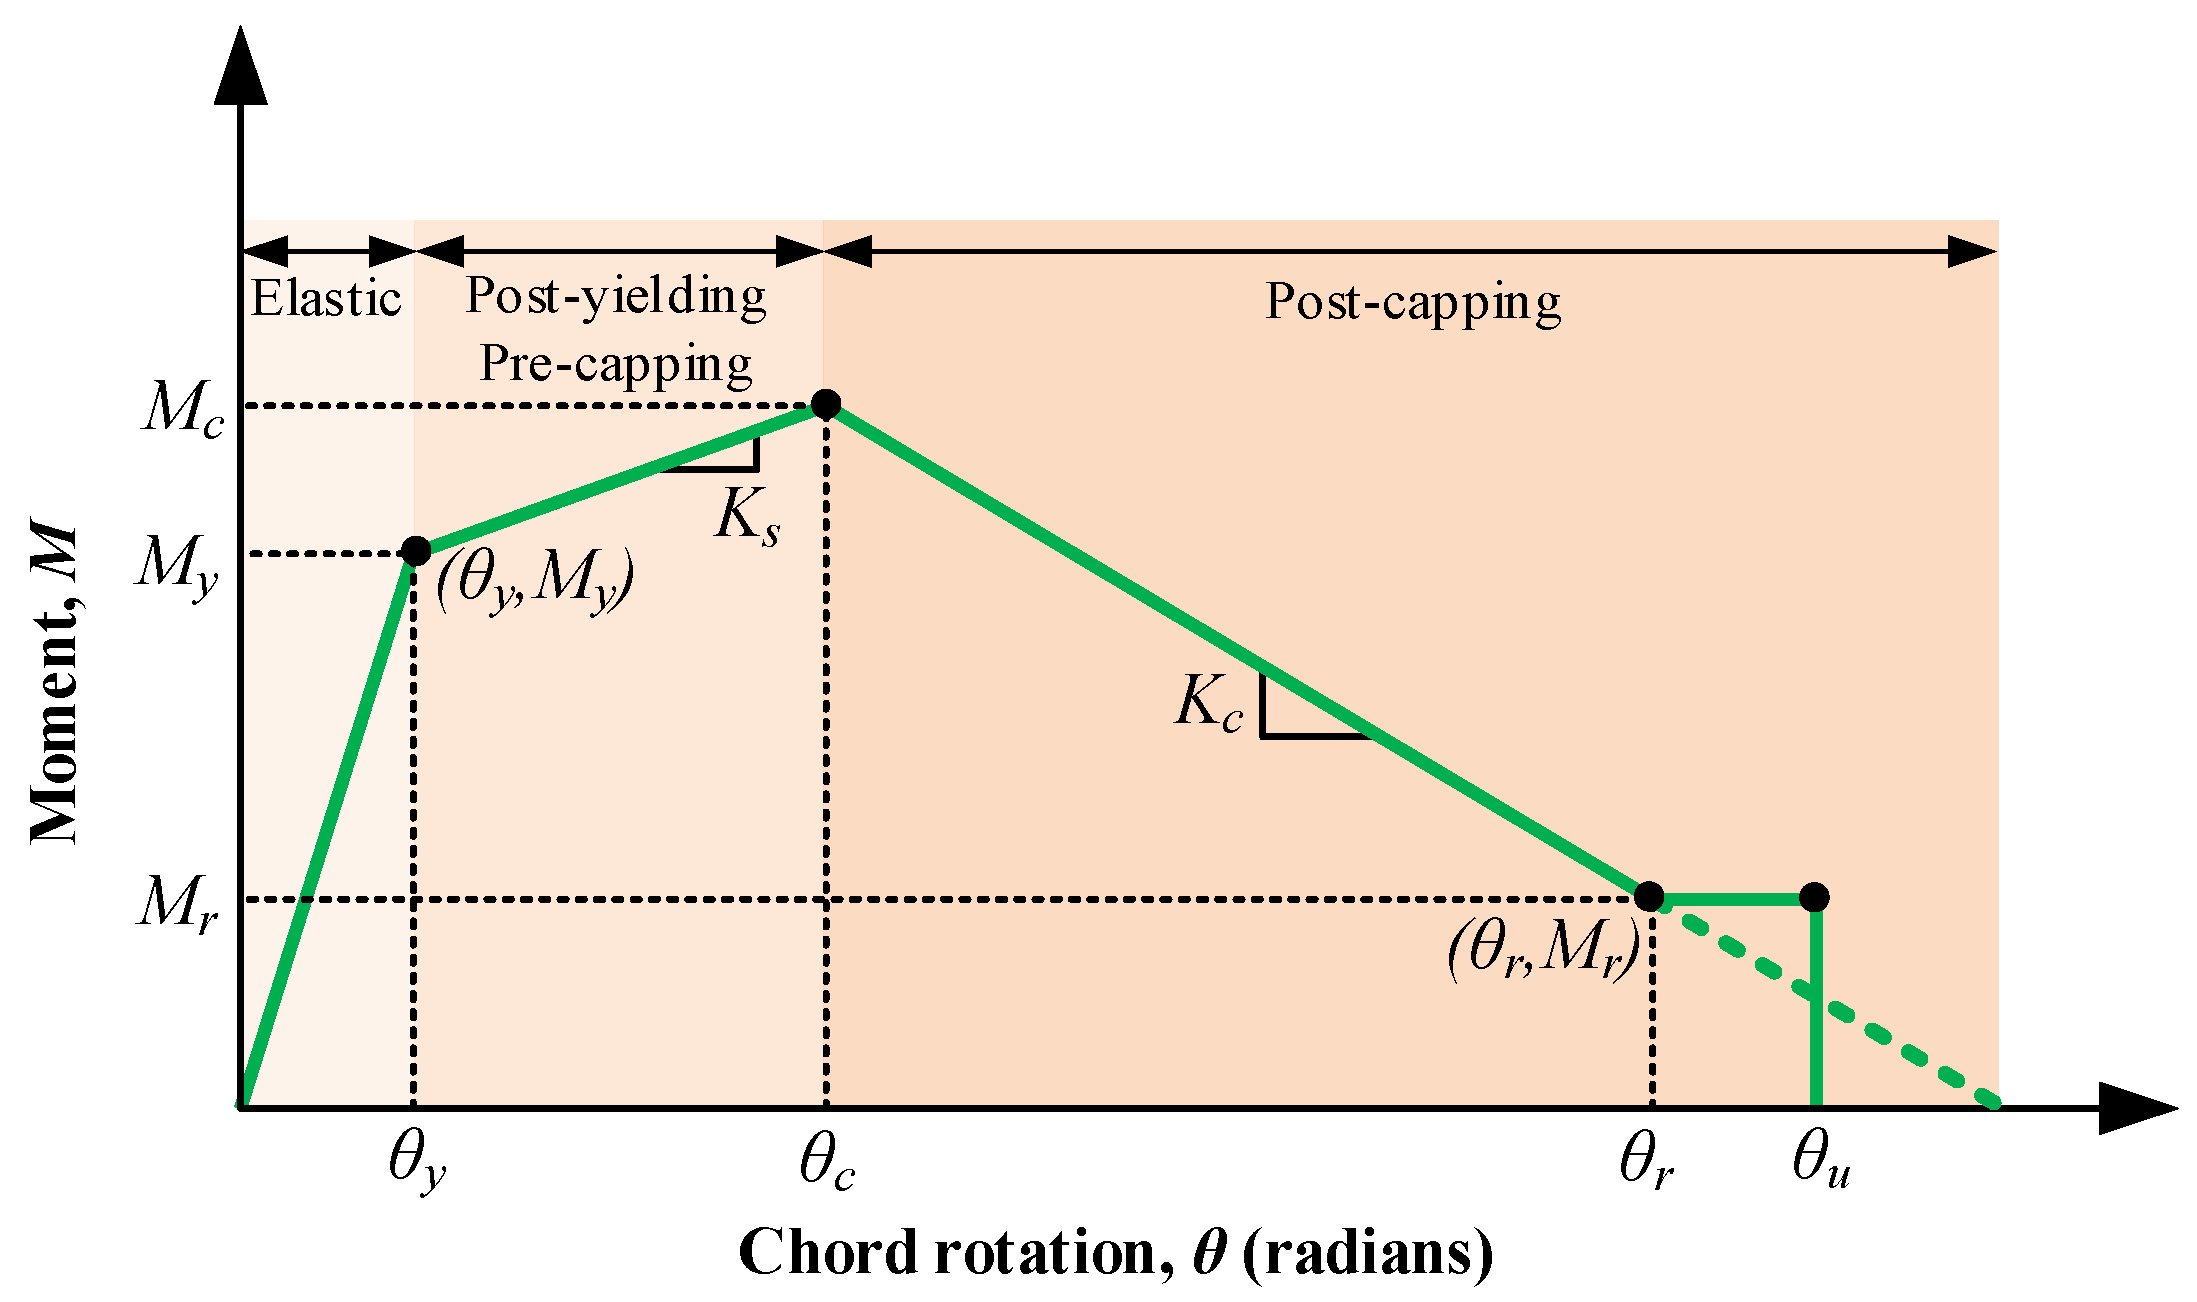
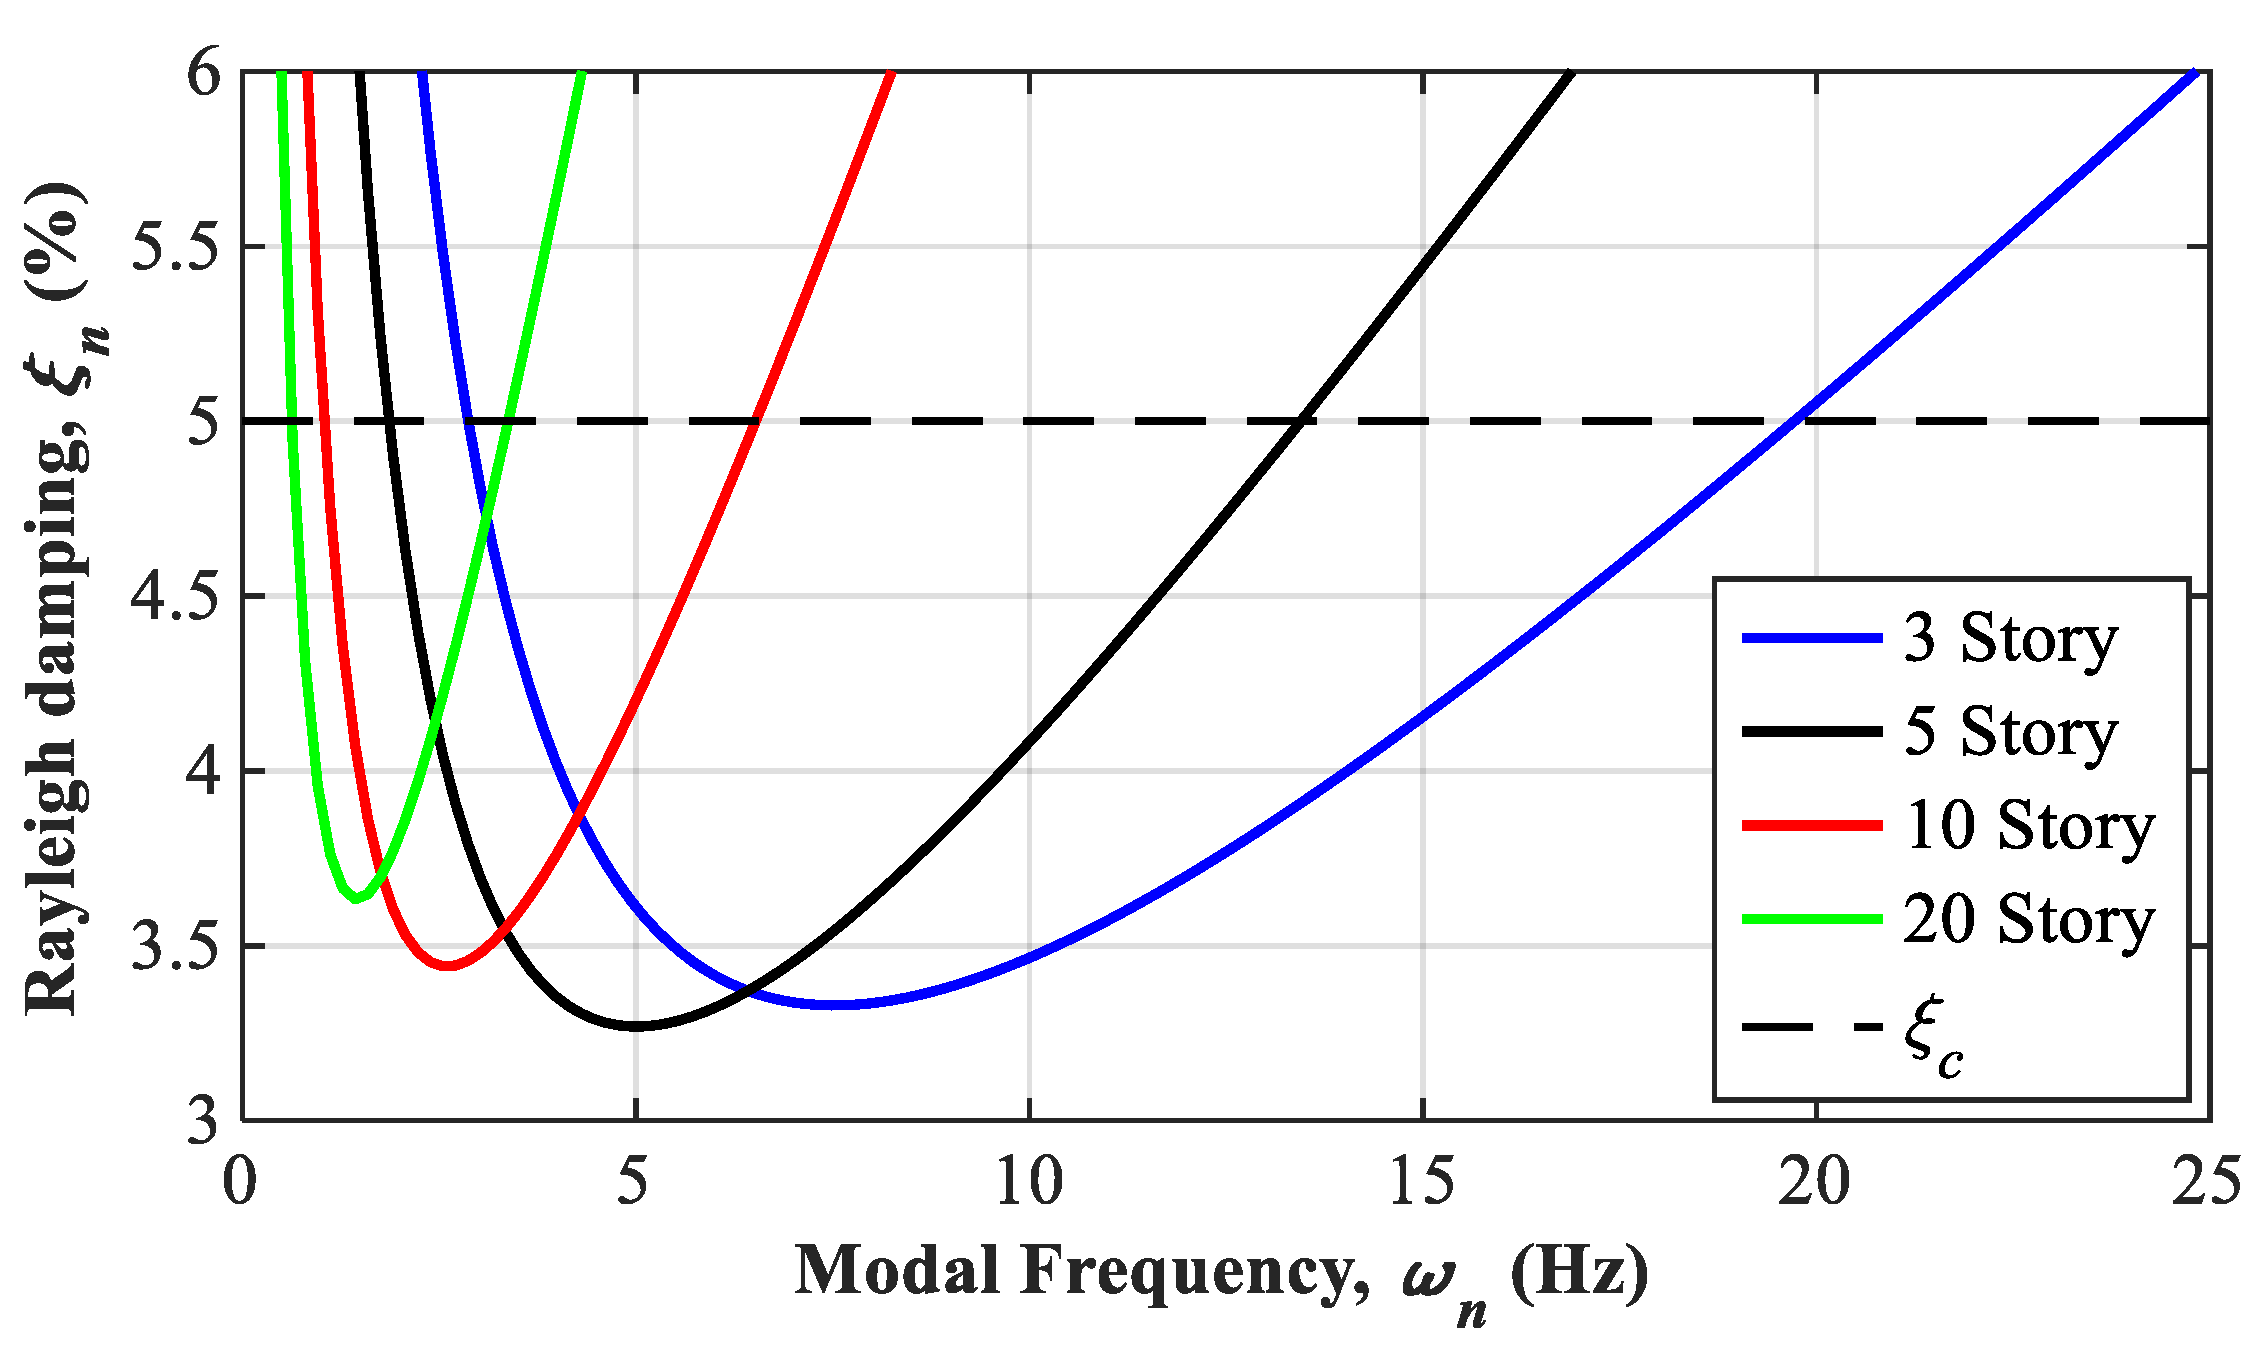
2. Numerical Modeling of the Building Frame

This section texturizes that the buildings are originally designed based on Korean Building Code (KBC) 2016 [17] by space frame with 3 bay (5 m width) in the z-direction, which is perpendicular to the drawing (Figure 1). Then the two-dimensional numerical concrete moment-resisting frame layout as shown in Figure 1 has been taken to analyze the effect of TMD. The frame layout from the three-dimensional building with story numbers of 3, 5, 10, 20 is modeled using OpenSees [18]. During the design, the dead load and the live loads were 4.6 and 2.5 kN/m2, respectively [17,19]. The basic content of the designed wind load and seismic load based on KBC is explained in Table 1.
The concentrated plasticity model approach is used to represent the non-linear behavior of the beam-column element through two end springs (rotational), which are connected by an elastic element. This rotational spring employs a bilinear material model based on the modified Ibarra Krawinkler Deterioration Model [20,21] as shown in Figure 2 obtained from [20].
Here, the zero-length spring elements connect the elastic frame elements to the beam-column joint nodes to assign the inelastic behavior. The location of zero-length elements as joint nodes is represented in Figure 1. As beam-column elements are assumed to be elastic, the effective stiffness is considered to reduce the strength for inelastic behaviors. According to ACI 318-11 [23], the effective stiffness of beam and column is applied by reducing the moment of inertia ( I g ) of frame as 0.35 I g and 0.70 I g , respectively. It also assumed that the structural components are not shear critical, i.e., shear failure is not considered during modeling the frames.
P-Δ is the second-order effect on the structure and represented as geometric nonlinearity effect, which plays an important role in the analysis of the structure, and it is necessary for sufficiently accurate methods to predict the P-Δ effect on the seismic collapse capacity structures under seismic excitations [24]. It states explicitly the nonlinear geometric effect of a large tensile or compressive direct stress upon transverse bending and shear behavior. Based on Malley et al. [25], in local member P-Δ effects are not so important but in the case of global structural response for nonlinear time history analysis P-Δ effects should be incorporated into the structure. This study carries by the global response of the structure with and without TMD, so the P-Δ effect due to gravity load was considered.
In the context of the nonlinear dynamic analysis, Rayleigh damping corresponding to 5% of critical damping ( ξ c ) was applied based on the previous studies [26,27,28,29]. Based on Chopra [30], the Rayleigh damping ( ζ n ) for the corresponding modal frequencies ( ω n ) is mathematically represented by the following Equation (1):
ξ n = 1 ω n ( ξ c ω i ω j ω i + ω j ) + ω n ( ξ c 1 ω i + ω j )
where ω i and ω j are the natural frequencies for the ith and jth modes, respectively, and where the 1 and 3 modes are represented in this study as the ith and jth modes, respectively. The Rayleigh damping using Equation (1) for the considered 4 buildings is shown in Figure 3.

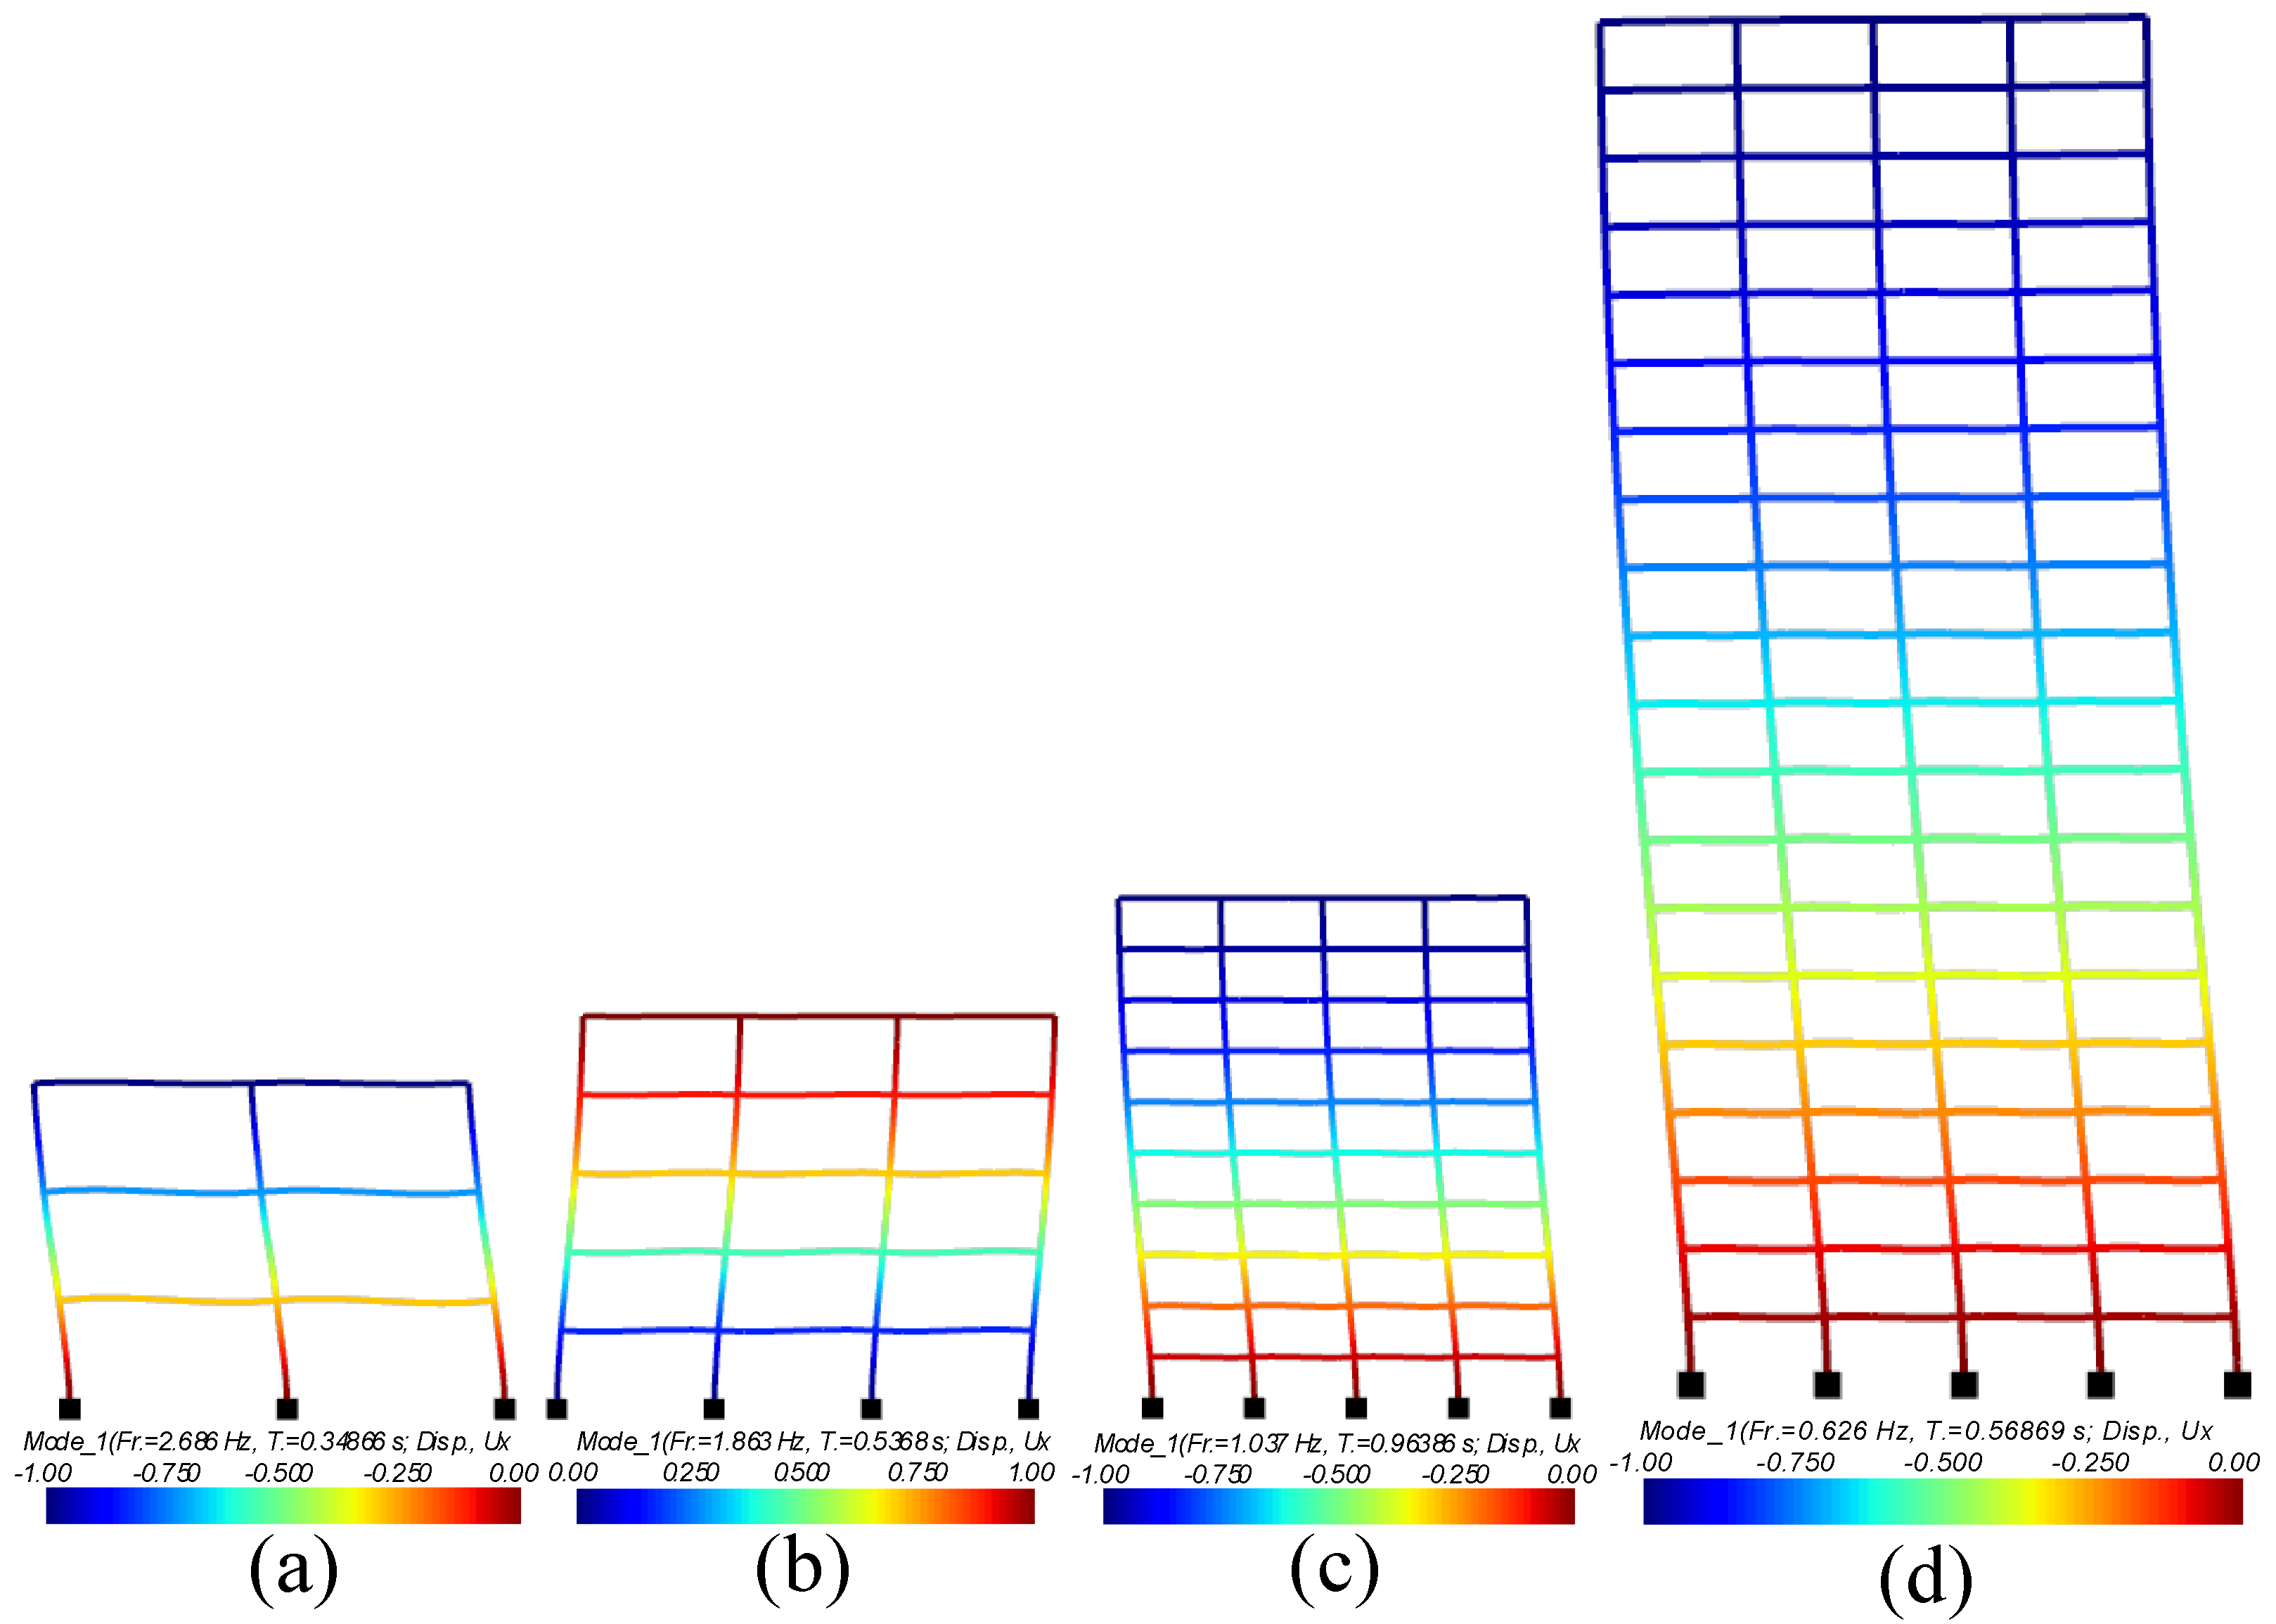
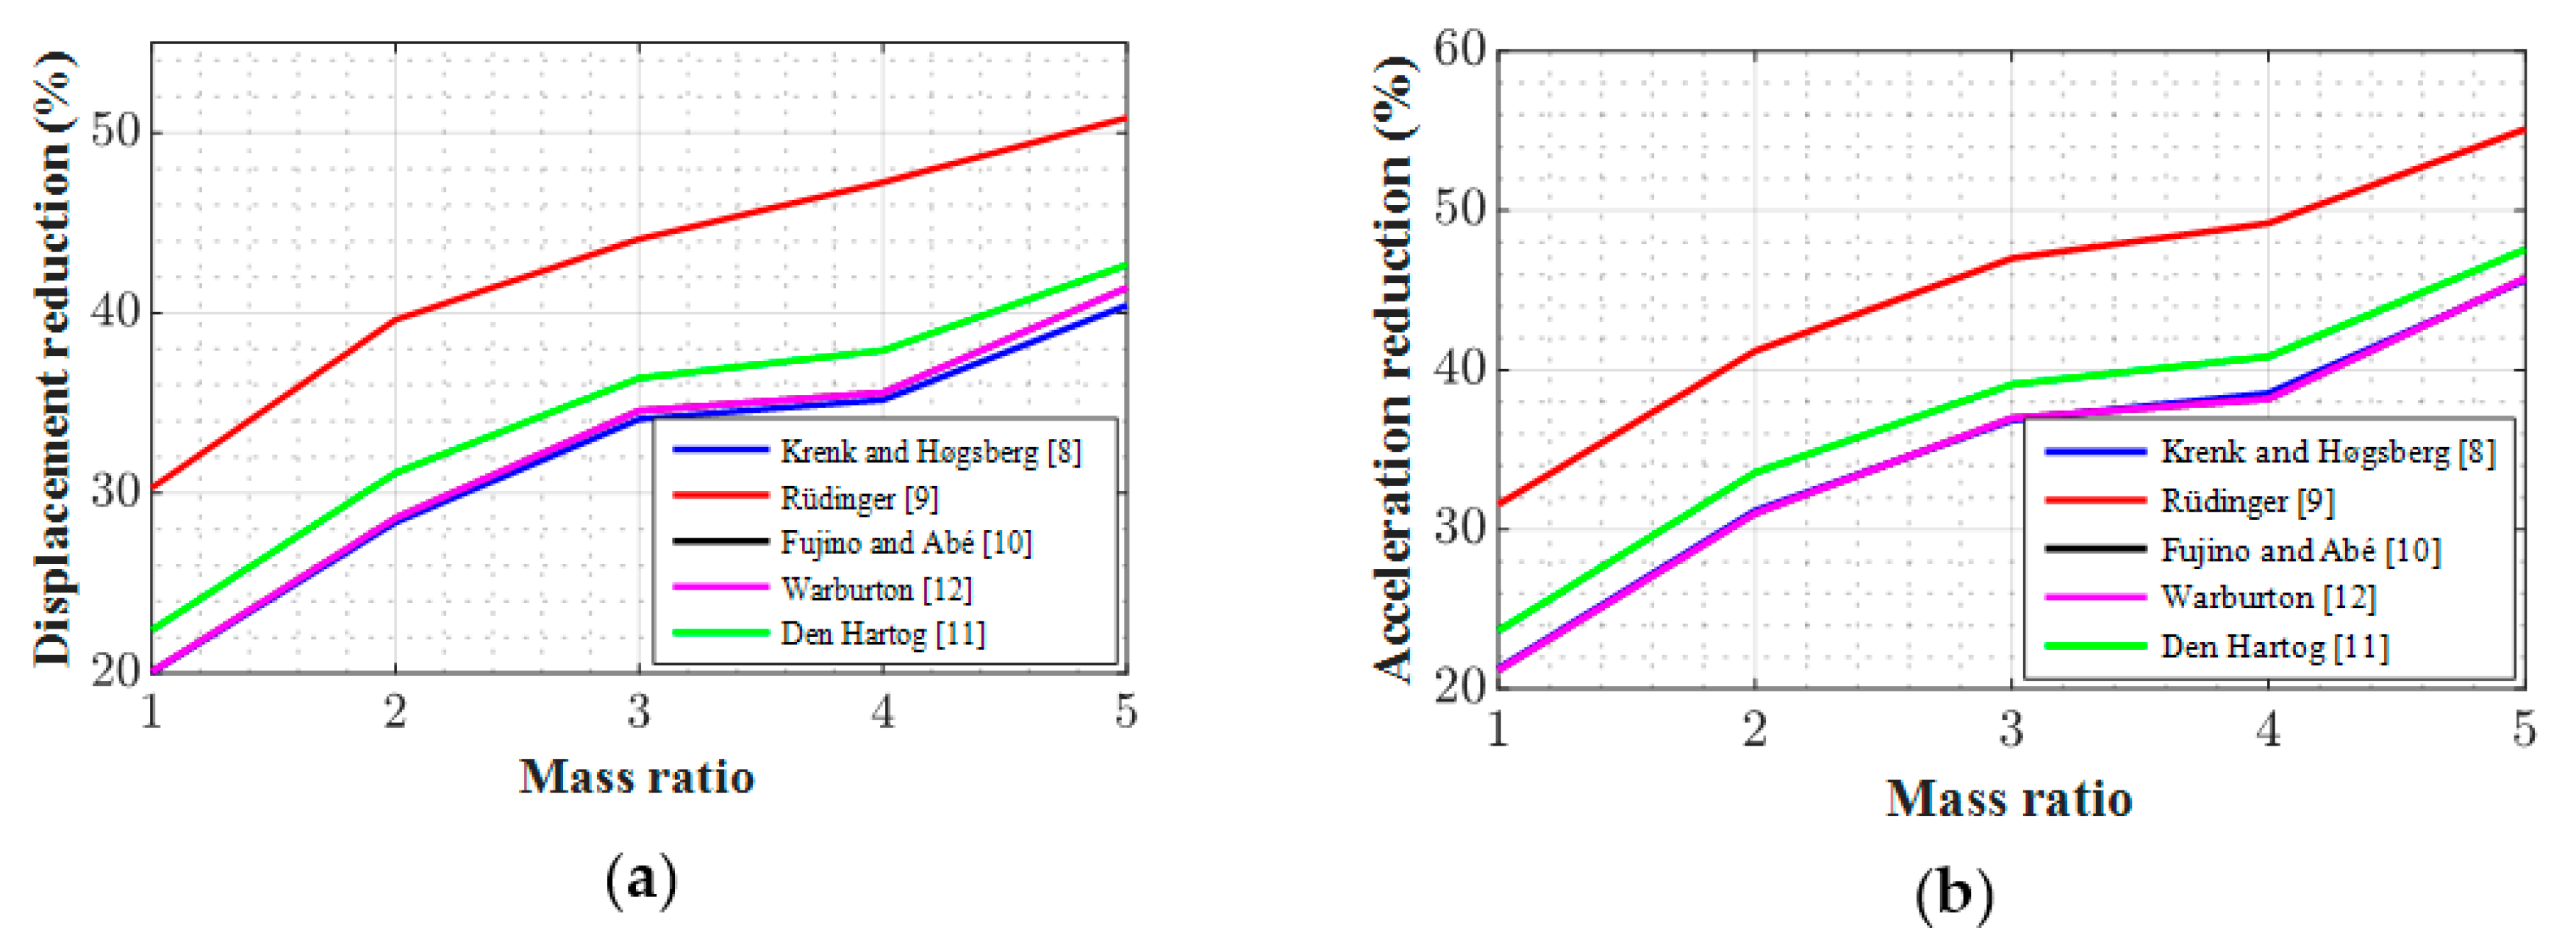
3. Modal Analysis and Model Validation

Modal analysis is the basic study to calculate natural frequencies and to establish the dynamic characteristics of structures under seismic excitation. This analysis follows the concept which separates a vibration system into its most dominating modes [31]. The system under seismic excitation consists of such vibrating masses and elements that can withstand the displacement of the masses. At the same time, the elements account for either the elastic or inelastic springs and energy-absorbing or frictional systems [31]. Moreover, this part is very important in the context of the design of the vibration control (active or passive) device like TMD for the structures. Global natural frequency represents the overall stiffness of the structure. The natural frequencies and the stiffness of the structures are inversely proportional to each other. The structural vibration mainly depends on the self frequencies and the excitation frequencies. Some current codes provide guidelines regarding the treatment of live loads for the seismic mass. The seismic mass will consist of a full dead load and 25% of the design live load. For this reason, the total mass is also considered as the summation of self-weight, dead load, and 25% of the live load.
Through modal analysis, the vibration period (T) of the building frames is computed in the elastic range for the 1st mode of each building and listed in Table 2. According to Moniri [28], the modal frequencies in a nonlinear system are continuously changing after entering the inelastic range. It is not possible to provide each step’s natural frequencies after yielding the structures so that only the modes for the elastic range are enlisted in Table 2 and the fundamental mode shapes are shown in Figure 4. The building frame was modeled by OpenSees and post-processing and visualization were carried out by the FeView tool [32].
For the validation of the design fundamental period of the structure, FEA results are compared to the existing building design standards [17,33]. Almost every seismic design standard provides empirical equations to approximately estimate the fundamental period of buildings. According to AIK [17] and ASCE [33], the approximate fundamental period ( T a ) in s can be determined by Equations (2) and (3), respectively.
T a = C T h n 3 / 4
T a = C t h n x
where C T = 0.073 , C t = 0.0466 , x = 0.9 for moment-resisting concrete frames and h n is the height in m above the base to the highest level of the building. The obtained results (Table 2) from the FEA indicated that the fundamental periods (1st mode) satisfy the required standard from codes.

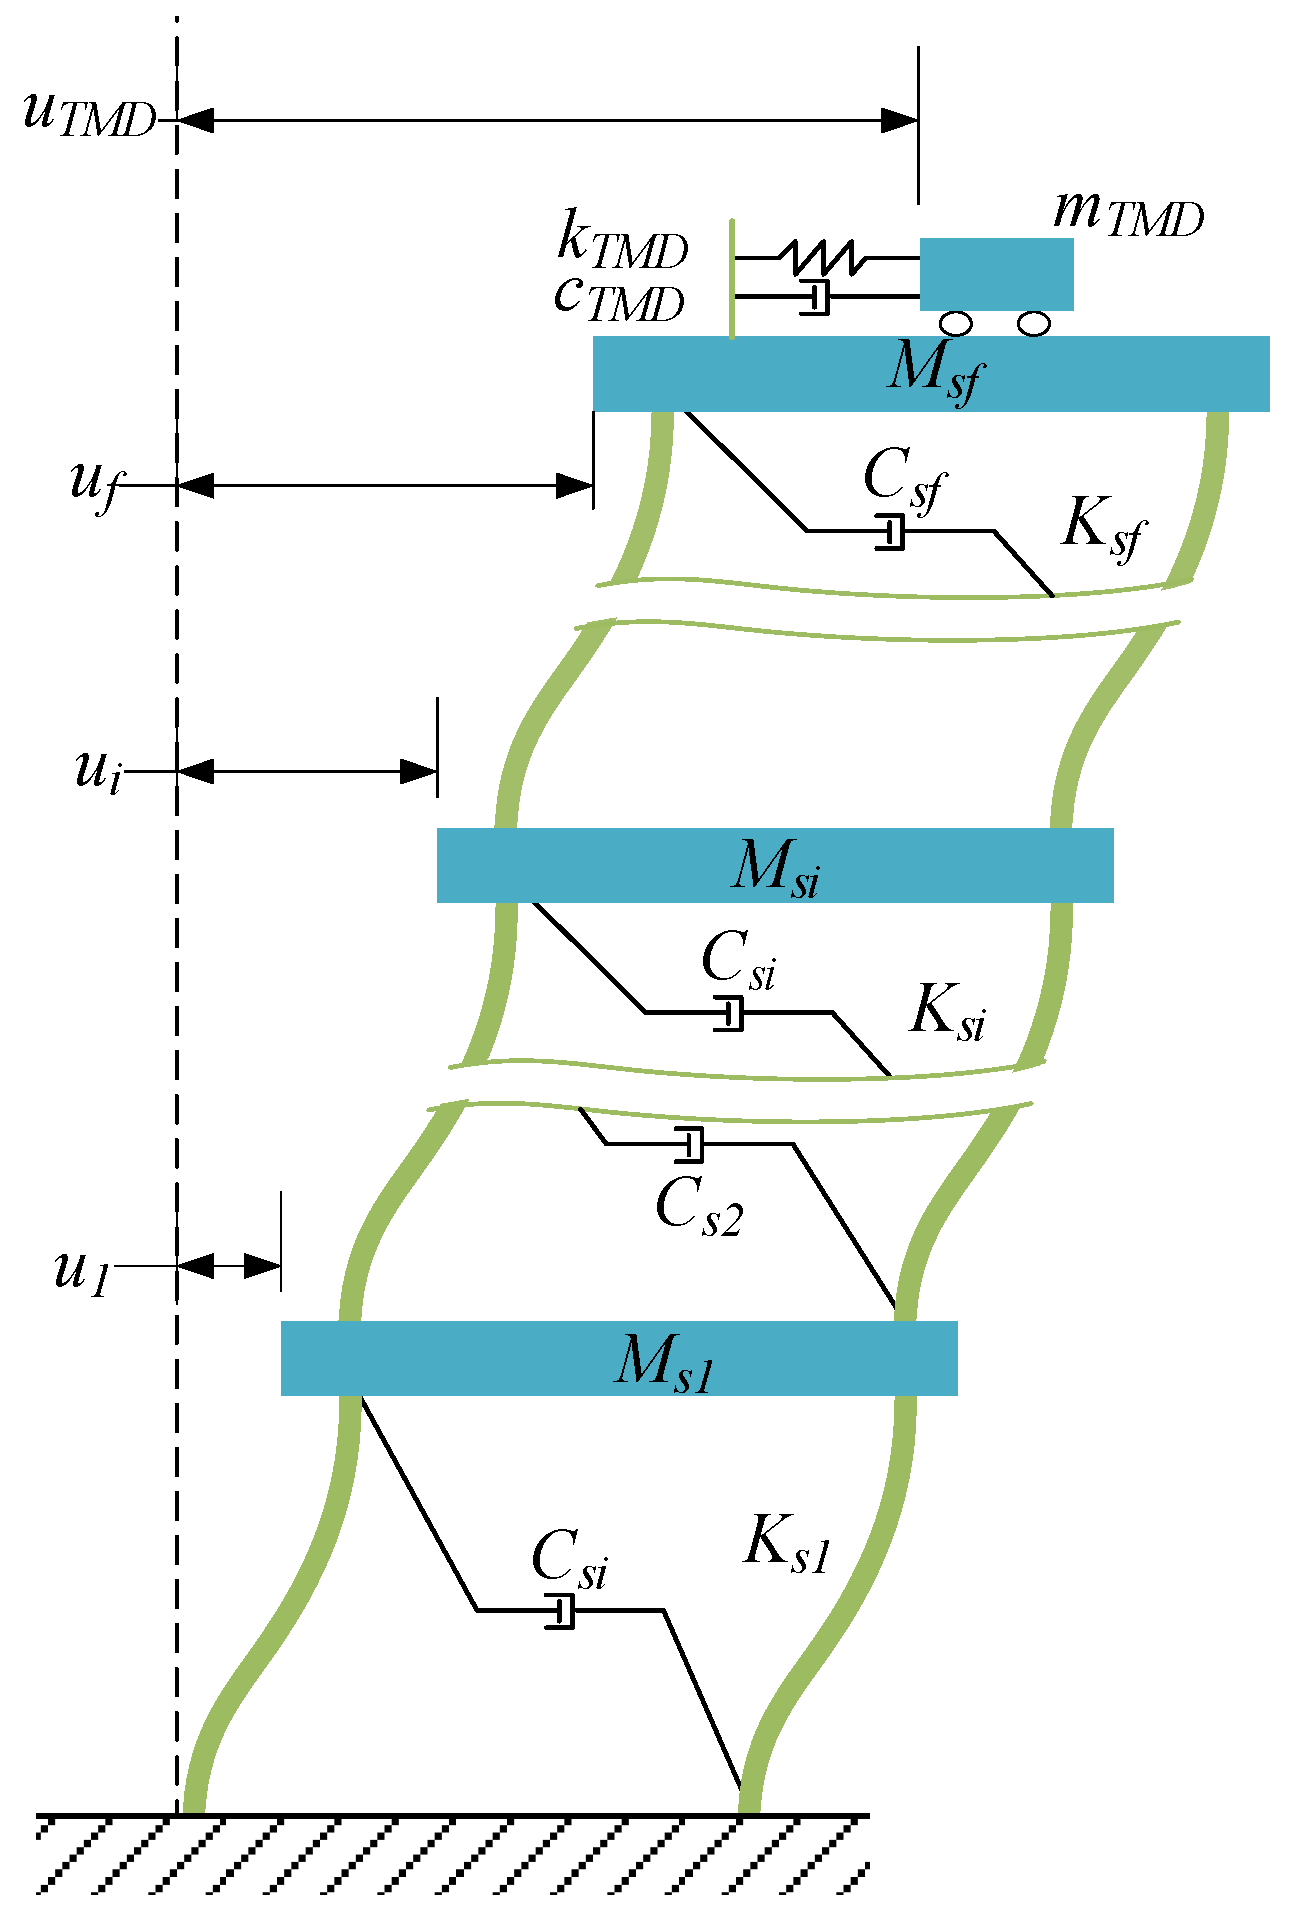
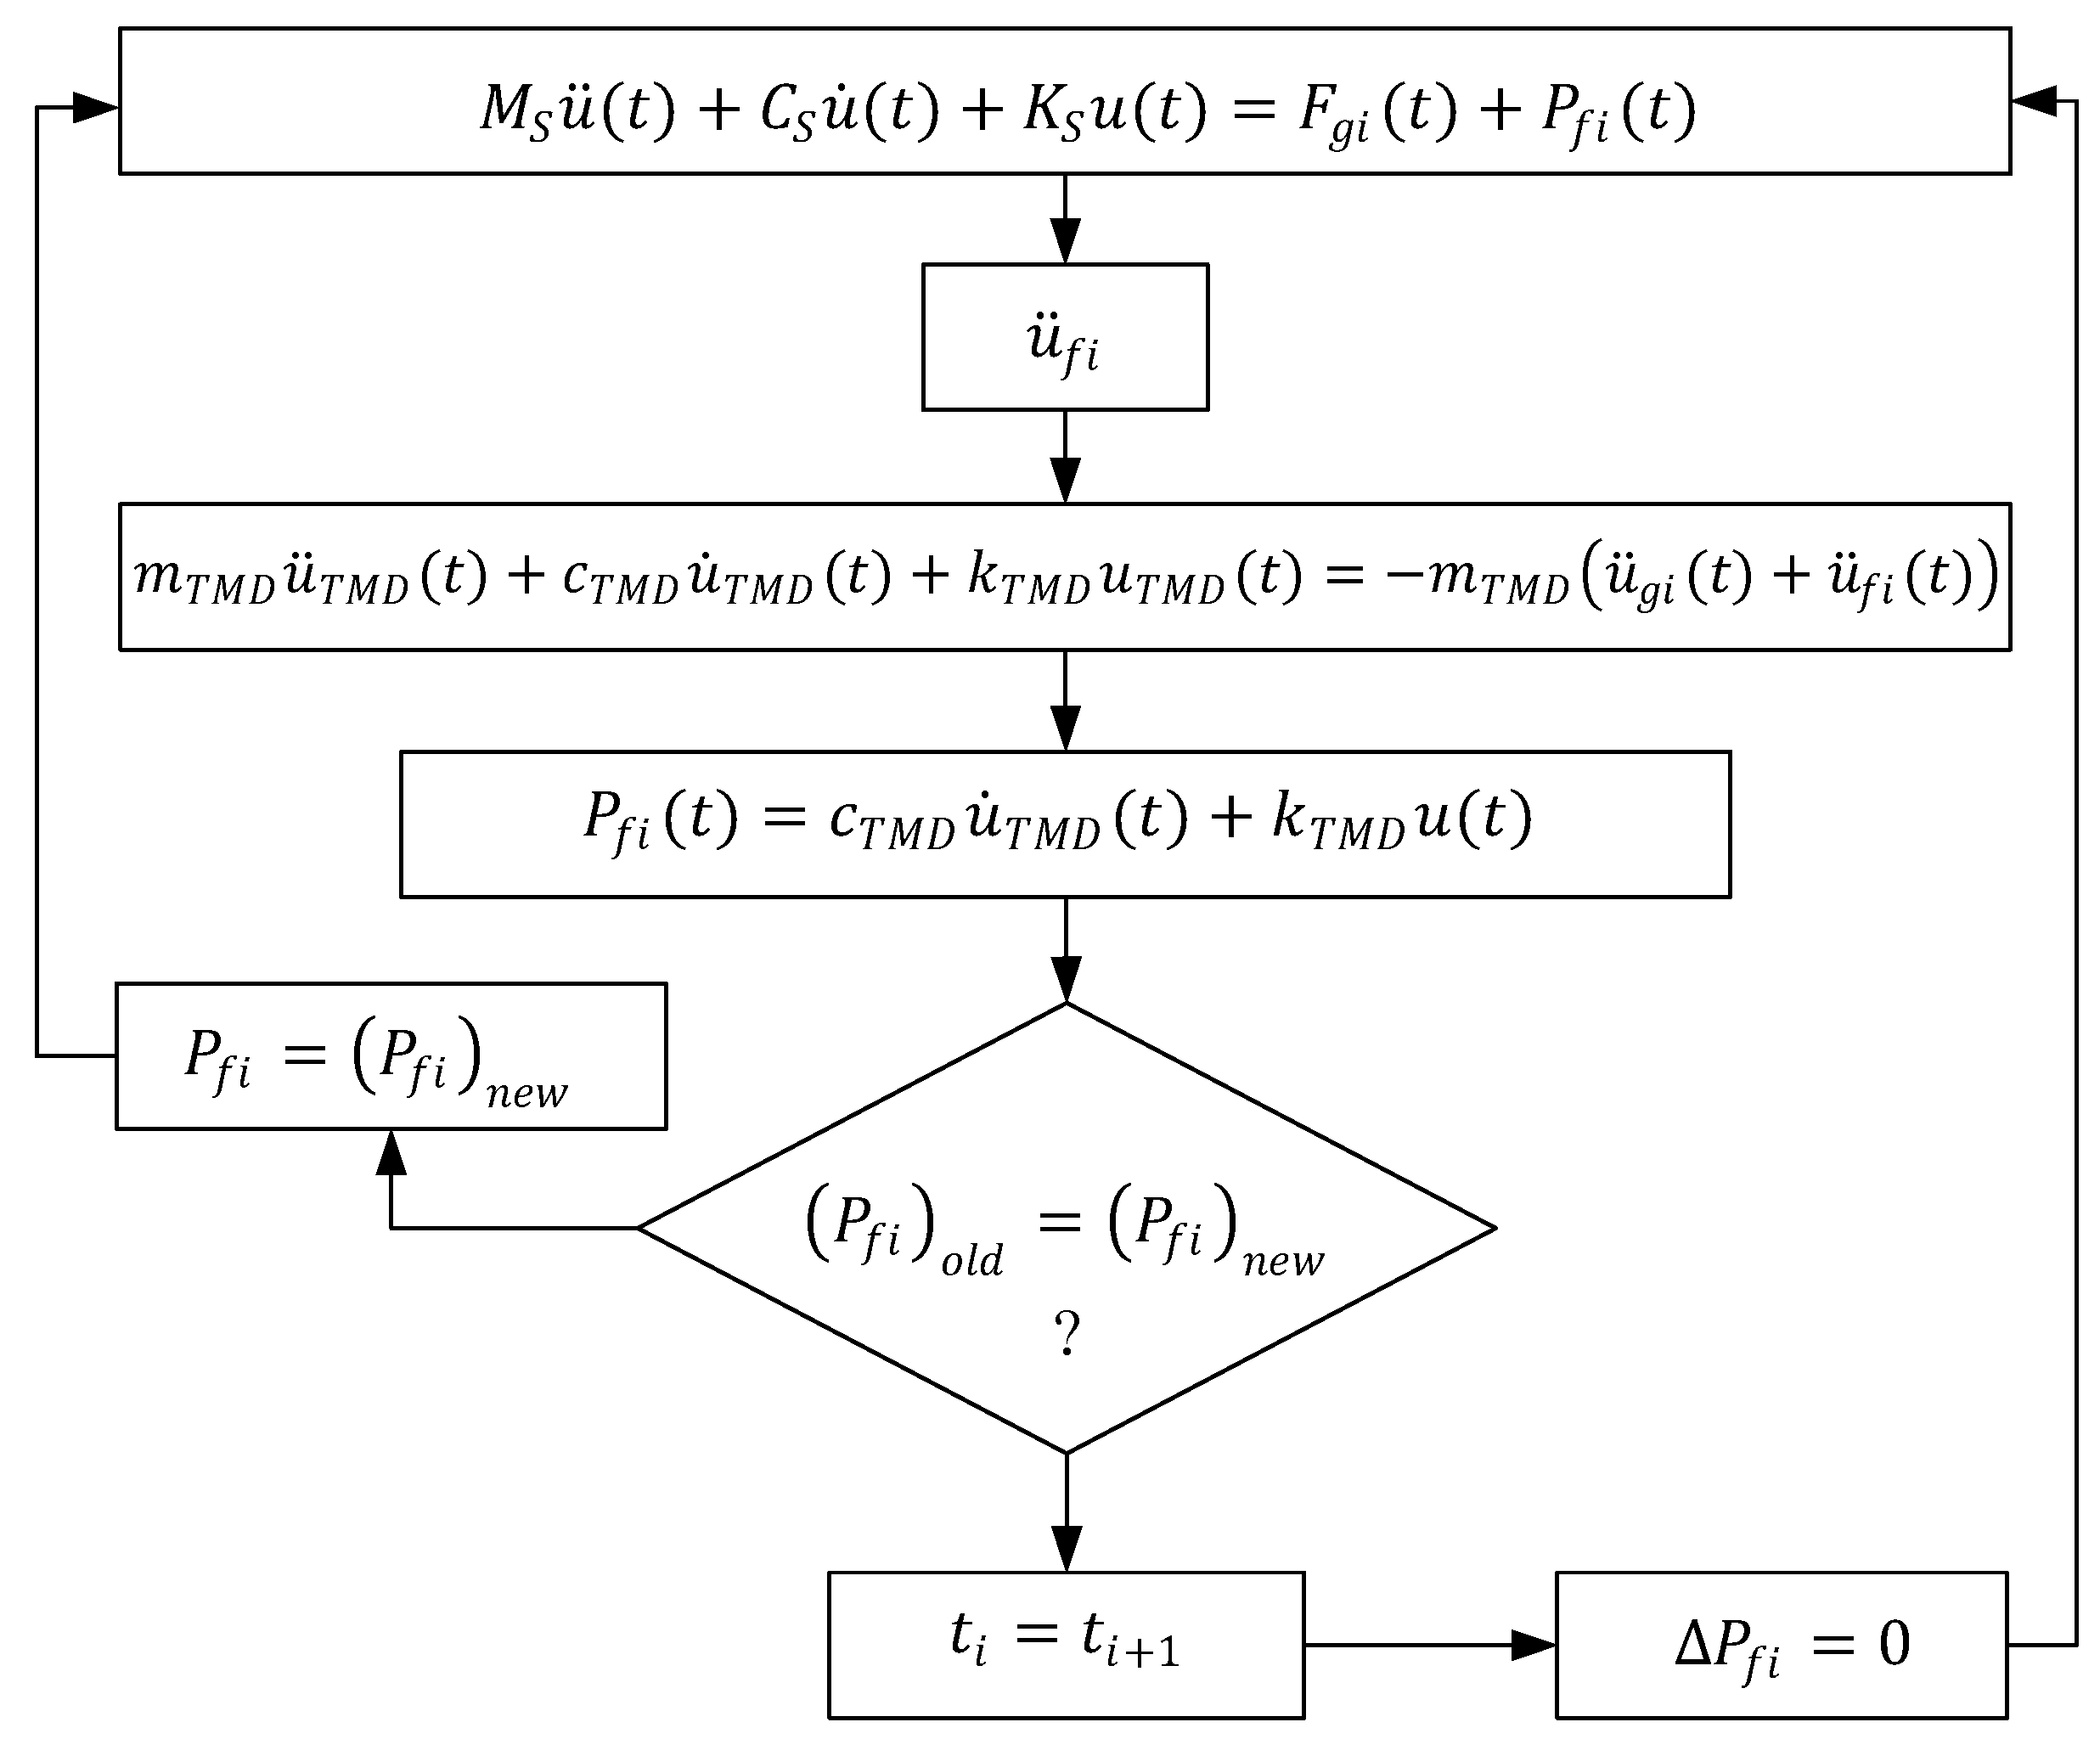
4. Building Modeling with TMD

The TMD device is well-known as a vibration control device that is installed in a specific zone in a structure, to reduce the amplitude of vibration to an acceptable intensity whenever a heavy seismic excitation or high winds hit the structure. The TMD increases the modal damping for the selected control modes, which helps to reduce the response of the structure under seismic loading excitation.
TMD consists of a mass ( m T M D ) , a spring (stiffness,   k T M D ), and a damper (damping, c T M D ) that is attached to the building as shown in Figure 5. Considering the TMD is placed at the top of the building frame, the governing equation for the building frame (as primary structure) and the TMD (as a secondary component) can be expressed as Equations (4) and (5), respectively.
M S u ¨ ( t ) + C S u ˙ ( t ) + K S u ( t ) = F g i ( t ) + P f i ( t )
m T M D u ¨ T M D ( t ) + c T M D u ˙ T M D ( t ) + k T M D u T M D ( t ) = m T M D ( u ¨ g i ( t ) + u ¨ f i ( t ) )
where M S , C S , and K S are the deterministic mass, damping, and stiffness matrices; u ¨ , u ˙ , and u are the relative displacement, velocity, and acceleration vectors referred to each degree of freedom of the main structure, respectively; F g i = M s I u ¨ g is the force generated by seismic excitation ( I = ( 1 , , n ) T ); P f i ( = k T M D u T M D + c T M D u ˙ T M D ) is the force for the TMD on the attached floor of the structure; u ¨ T M D , u ˙ T M D , and u T M D denotes the displacement, velocity, and acceleration of the TMD; u ¨ f i is the acceleration that produces on the TMD attached floor. To consider the P-Δ effect, the nonlinear terms are included in calculating the stiffness matrix ( K S ) of the main structure. Therefore, K S is the sum of elastic stiffness matrix ( K E ) and geometric stiffness matrix ( K G ) , e.g., K S = K E + K G .
For the numerical approach, the effectiveness of TMD is explained in Figure 6. The interactive force ( P f i ) at the initial stateof each time step is assumed to be null. The incremental acceleration of the story ( u ¨ f i ) is added to incremental acceleration activated on the base ( u ¨ g i ) to form the total excitement acceleration applied to TMD. The equation of motion for TMD leads to determine the incremental values of acceleration, velocity, and displacements of TMD as shown in Figure 6. To measure the effectiveness of the TMD, the seismic response of the building frames with and without TMD subjected to ground motion with different frequency contents are analyzed and compared to each other.
The important feature of TMD is the tuning of frequencies, that is the frequency of TMD can help to control optimal structures. The frequency ratio (or tuning ratio) between the frequency of the TMD ( ω T M D ) and the fundamental frequency (in this study first mode considered as a fundamental mode) of the main can be expressed by Equation (6):
γ = ω T M D ω s , I
The mass ratio can be defined by Equation (7):
μ = m T M D Φ s , I T M s Φ s , I
where Φ s , I T is the first mode shape of the building, normalized to the top floor, and ω s , I is the fundamental frequency of the building structure which is considered for the first mode of vibration.
The frequency and damping ratio of TMD are defined by Equation (8) and Equation (9), respectively:
ω T M D = k T M D m T M D
ξ T M D = c T M D 2 ω T M D m T M D
Because of various uncertainties inherent in the properties of both the TMD and the structure, the perfect tuning is very difficult to achieve [34]. The most important parameter of the TMD is the tuning frequency. According to Datta [34], Kaynia, et al. [35], the optimum mitigation in the response of the main structure can be achieved when γ is equal or close to unity. However, previous researchers have presented equations for the optimum values of the parameters of the TMD using different criteria or approaches to control effectively the main structural responses. A summary of some of them is provided in Table 3. Most researchers present optimum values of the damping ratio ( ξ o p t ) and frequency ratio ( γ o p t ) based on a given mass ratio ( μ ).
The most effective optimum values of γ o p t and ξ o p t were then determined by the comparative studies of above mention formulas (Table 3), considering the primary structure as a single degree of freedom (SDF) (mass: 10-ton, modal frequency: 3 Hz). The SDF primary system with and without TMD was excited by sine sweep (frequency range: 0.1 Hz to 20 Hz, amplitude: 9.81 m/s2, analysis time: 10 s, sampling frequency: 512) so that we can get the maximum response, as well as maximum efficiency of TMD. From the responses, it was shown that equations expressed by Rüdinger [9] tuned the structure more than others in both displacement and acceleration responses, as shown in Figure 7.

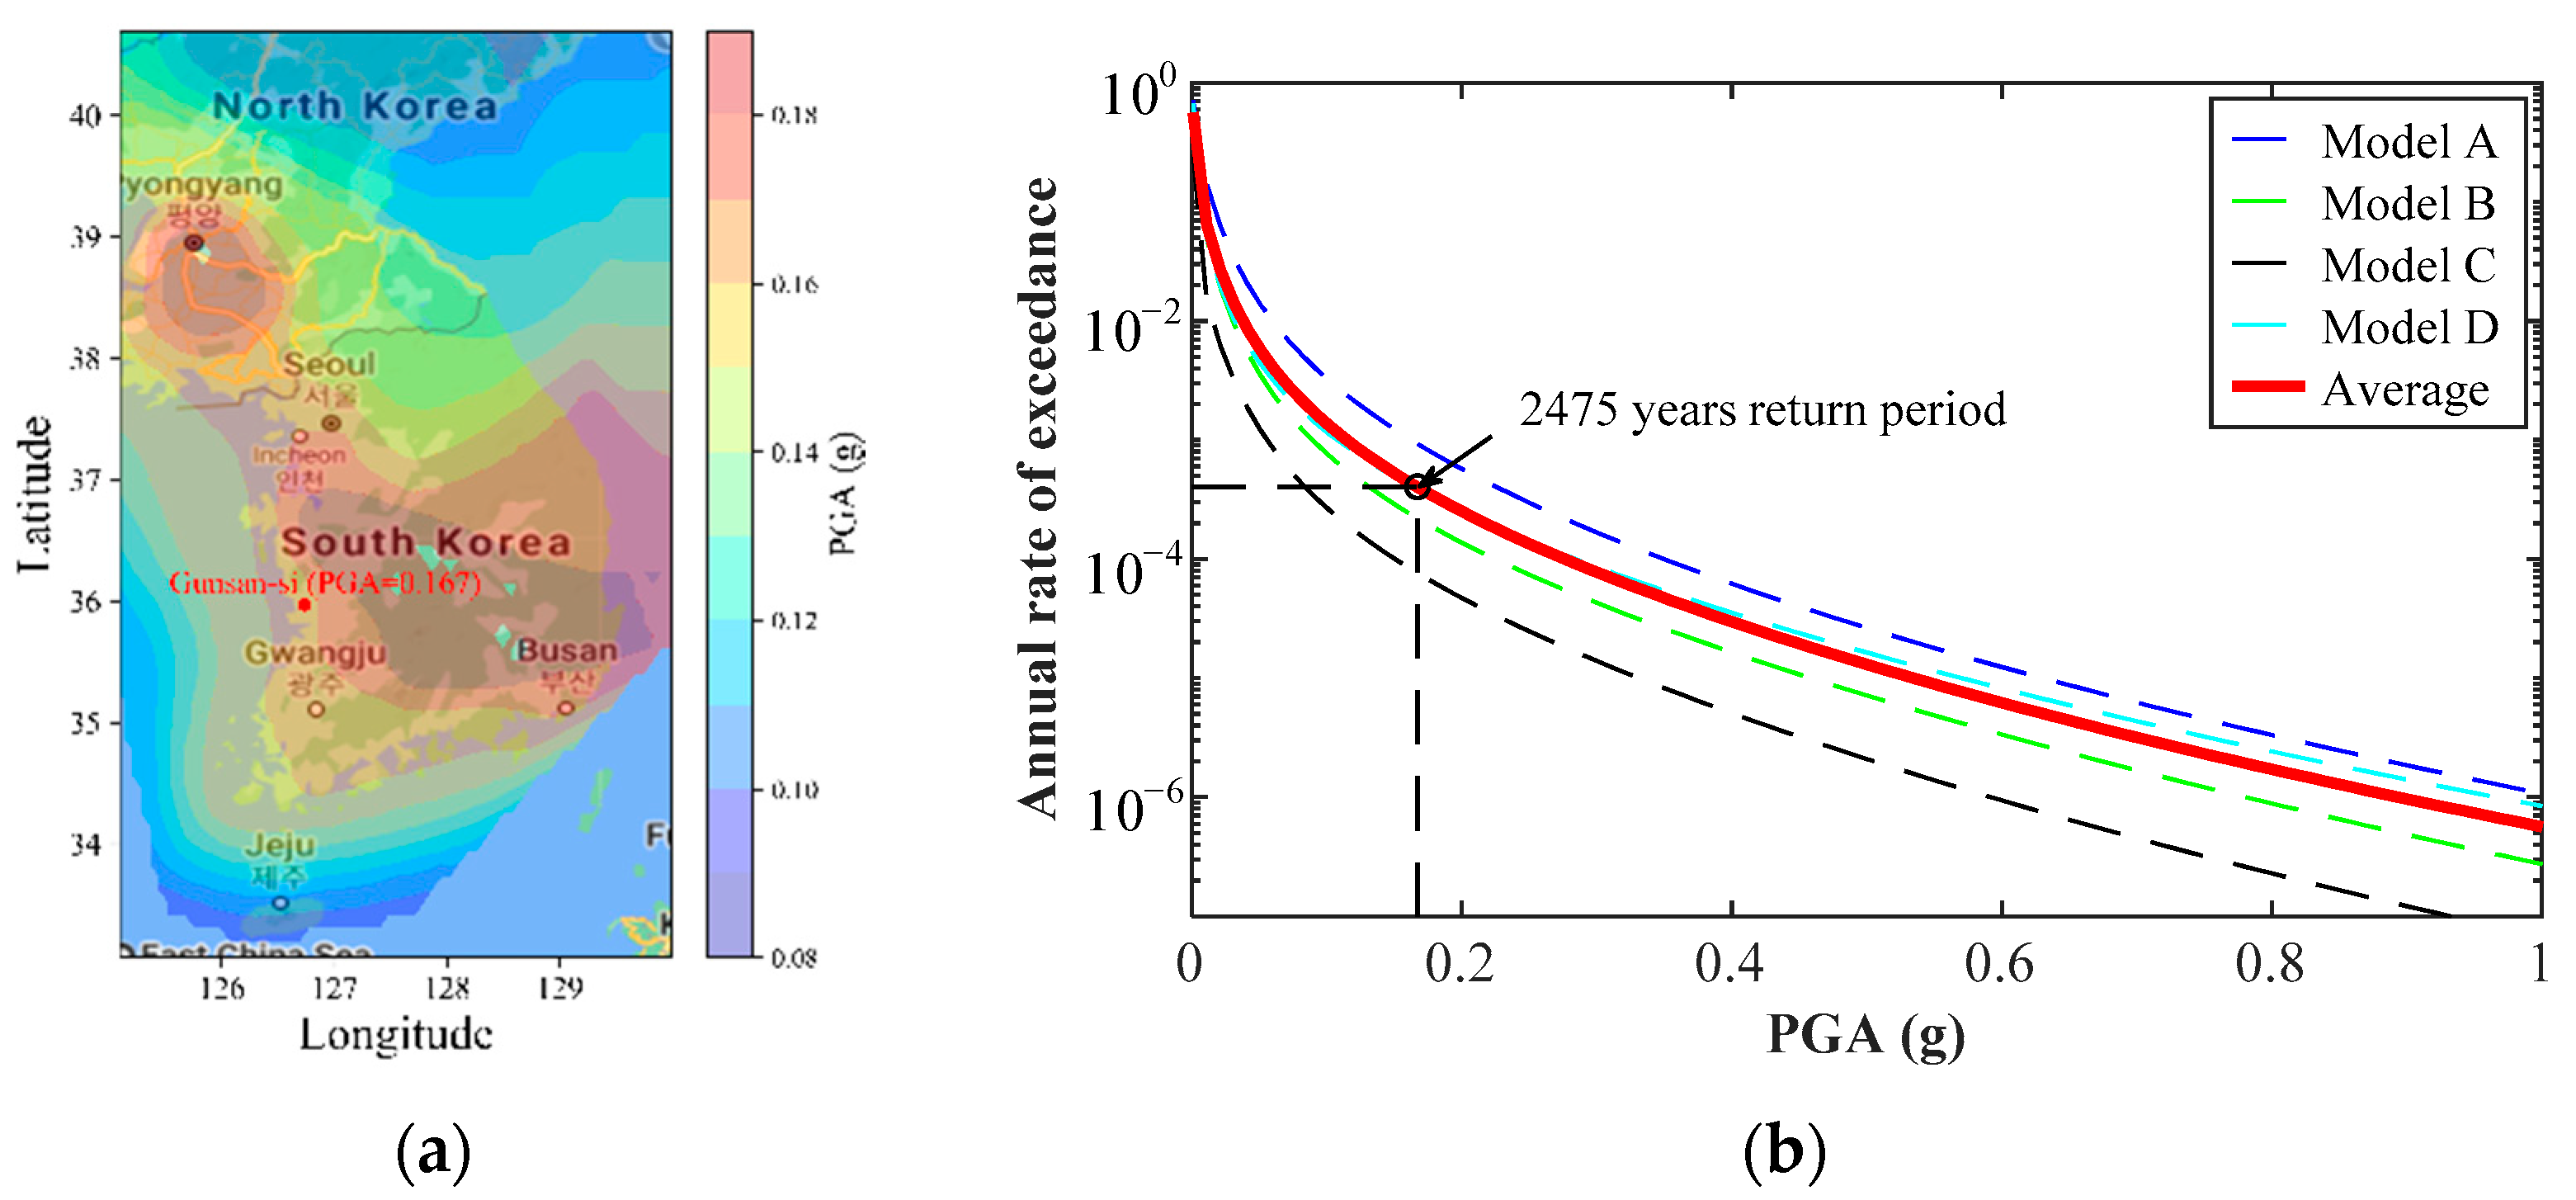
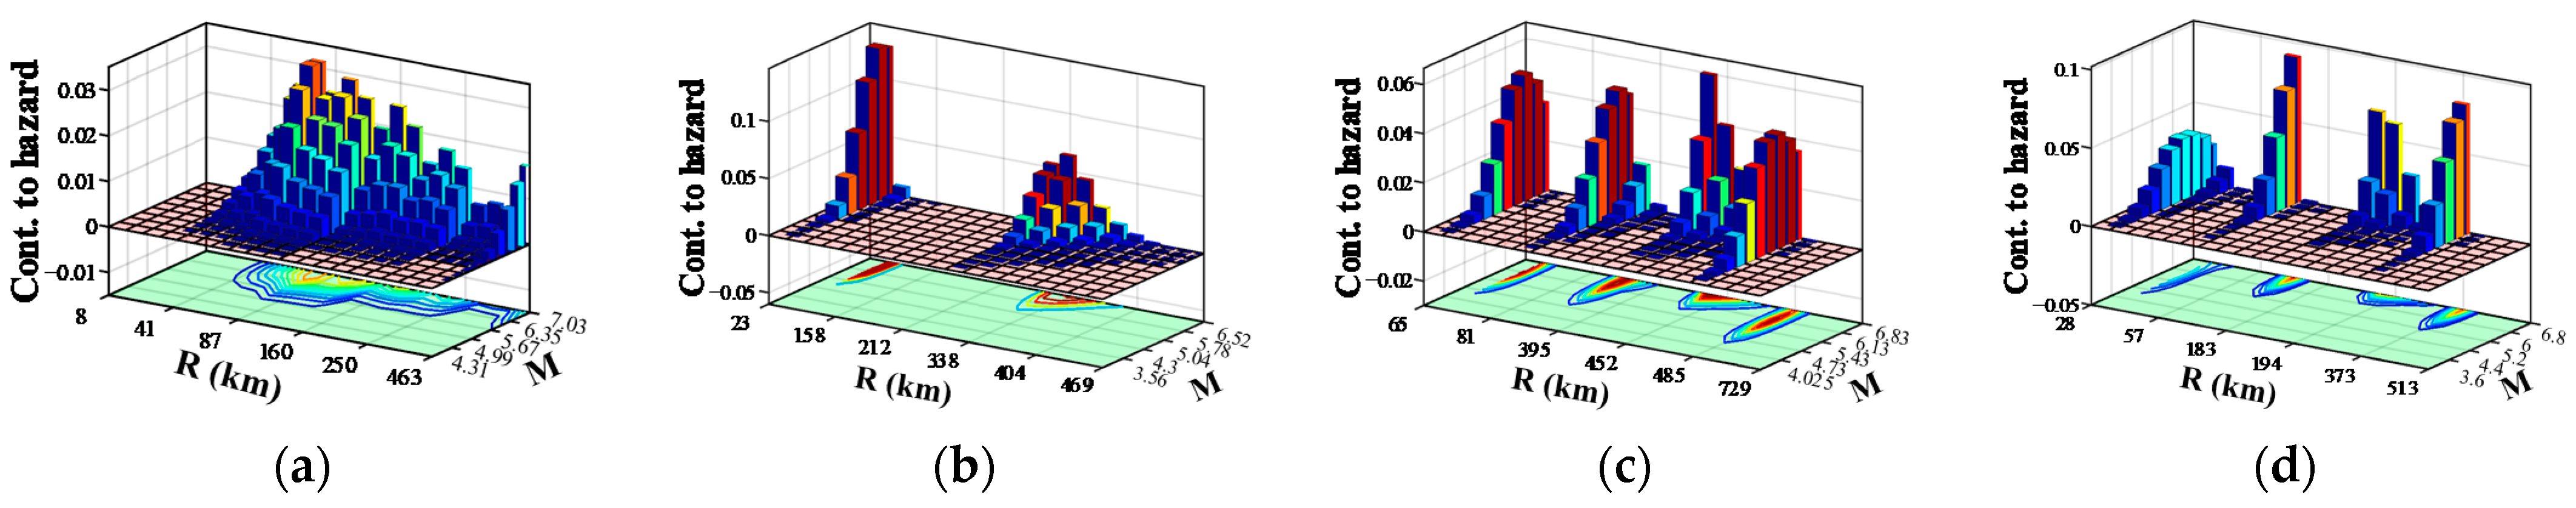
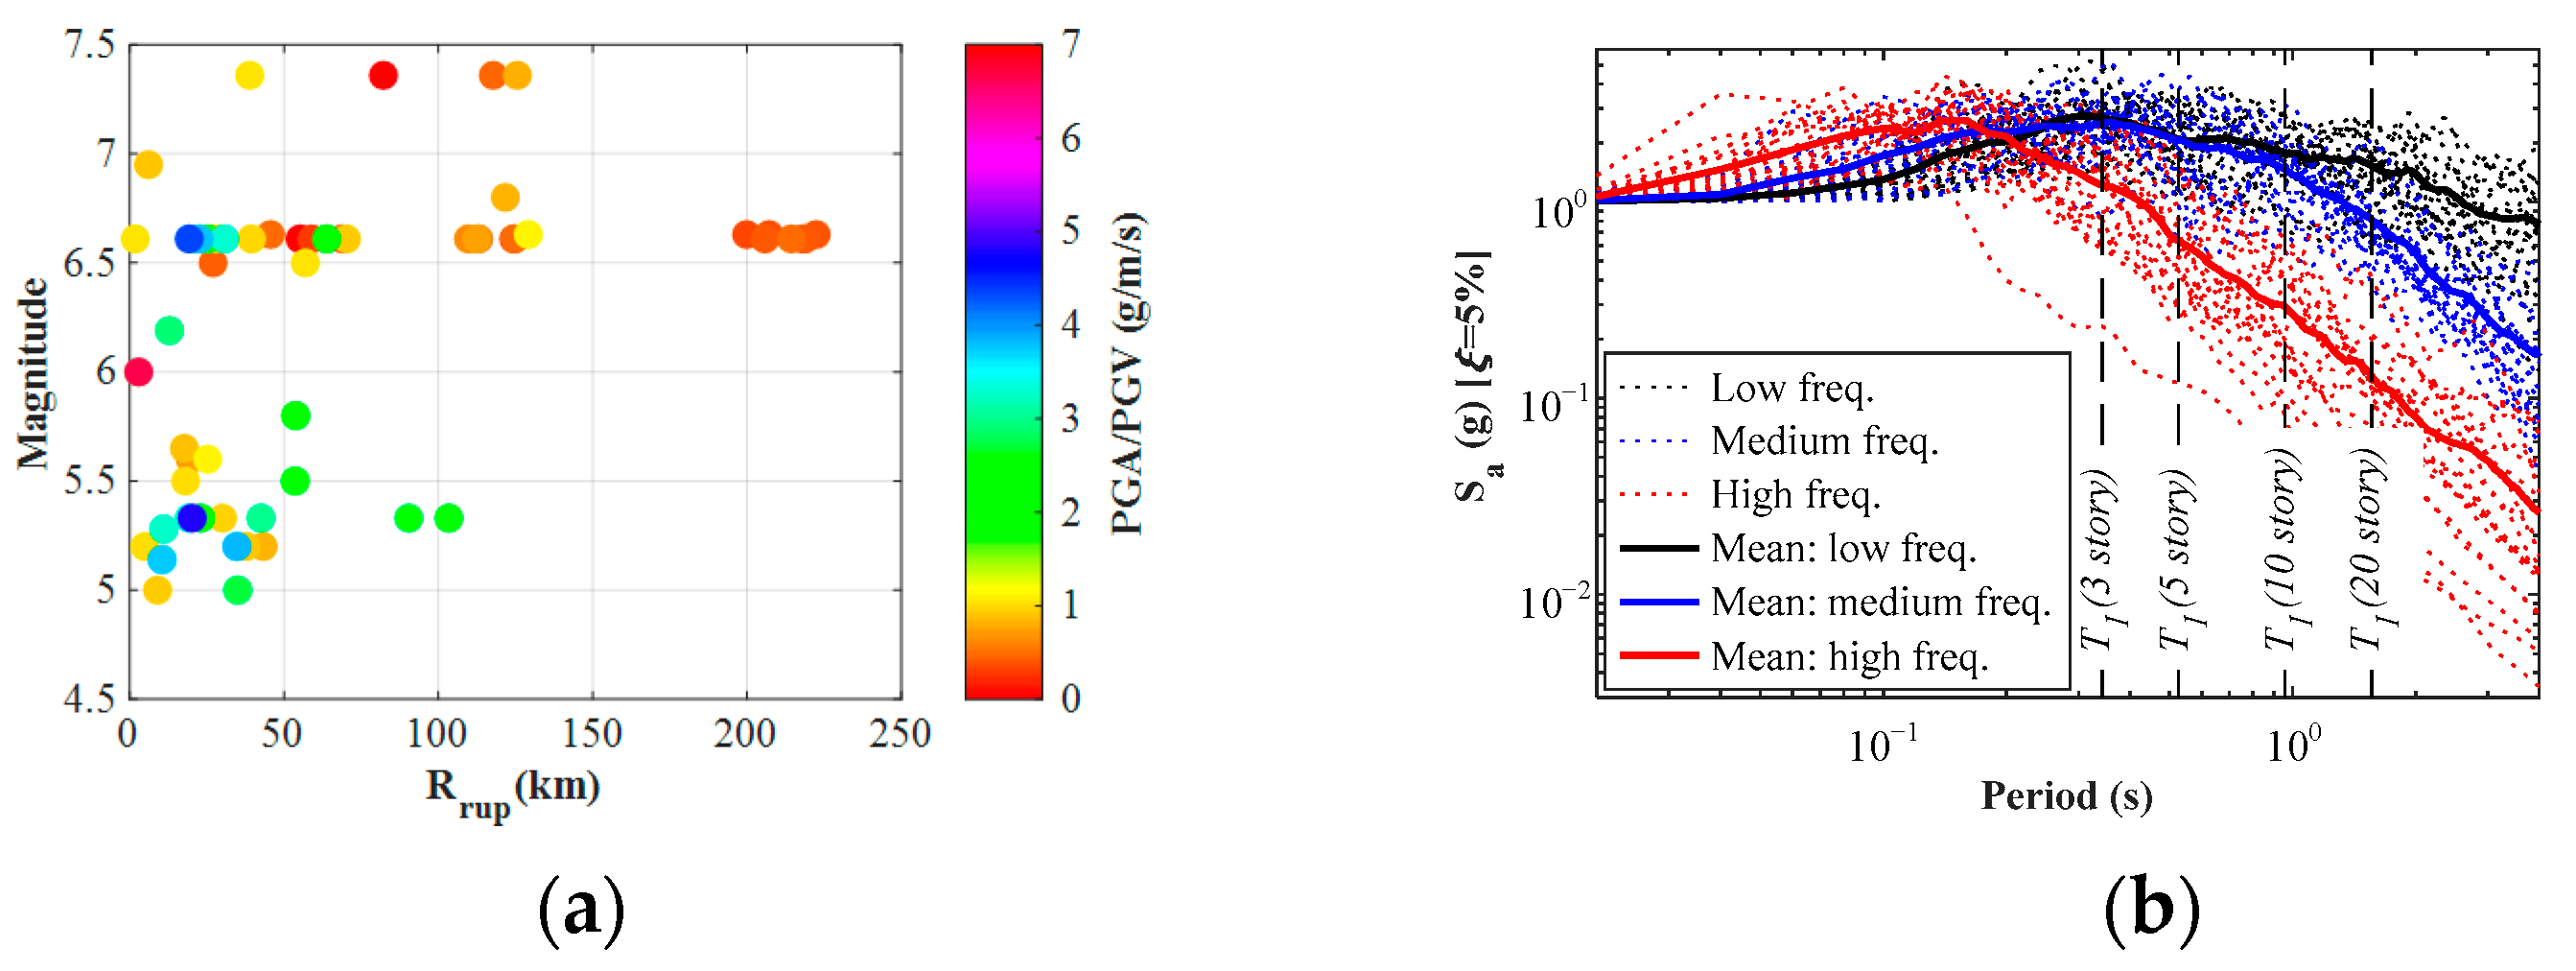
5. Selection of Ground Motions

This section focuses on the GM selection criteria, as well as the specific GM category that depends on the frequency characteristics. Frequency characteristics of GM correlate with the ratio of peak ground acceleration (PGA) to peak ground velocity (PGV), and account for many seismo-tectonic features and seismic site effects [36]. Three categories of ground motions were selected based on the PGA/PGV according to earlier research [37,38,39].
Low-frequency content (LFC) (PGA/PGV less than 0.8 g/m/s): taken 20 EQs.
Medium-frequency content (MFC) (PGA/PGV between 0.8 and 1.2 g/m/s): taken 20 EQs.
High-frequency content (HFC) (PGA/PGV greater than 1.2 g/m/s): taken 20 EQs.
The randomness of GM was achieved by taking 60 original earthquakes (EQs) datasets from the PEER database [40]. The steps elapse to determine the most vulnerable seismic contribution to the 2% of 50 years shaking (2475 years of returned period) through the site seismic model taken in the Korean peninsula as shown in Figure 8a. Then a set of GM can be selected either from PEER [40] or artificially generated EQs [41]. This study is followed by the GM selection from PEER through analyzing the seismic hazard analysis for the building location. According to Choun et al. [42], the seismic record of Korea is divided into four seismic source models (Model A, Model B, Model C, and Model D). Therefore, the disaggregation plot is illustrated based on the seismic hazard analysis as shown in Figure 8b for each model with the most effective range for magnitude (M) and distance (R). The hazard analysis and the disaggregation curve are performed by PSHRisk-tool [43]. The analysis of Figure 9 shows that the seismic Model B contributes the most to the site; the maximum effective rupture distance is 277 m and the minimum magnitude is 5. A round range of moment magnitude (5.0 to 7.5) and the closest ruptured distance ranges (0 km to 250 km ) are adopted to select the GMs for reducing the computational efforts as shown in Figure 10a. Figure 10b shows the clear effect of the comparison of input data with different categories of earthquake considering frequency characteristics.

6. Results Analysis and Discussion

The results of the analyses of building frames affected by GMs with low, medium, and high-frequency characteristics are presented here. The response, including inelastic effects, was evaluated. As the TMD parameters from Rüdinger [9] can perform better (Figure 7), for further analysis those parameters were used to get more effective results. Selected GM records were applied to the horizontal direction of the numeric model as the input seismic excitations. The result analysis comprises plotting and comparisons of peak story displacement, inter-story drift ratio (IDR), and fragility curves.

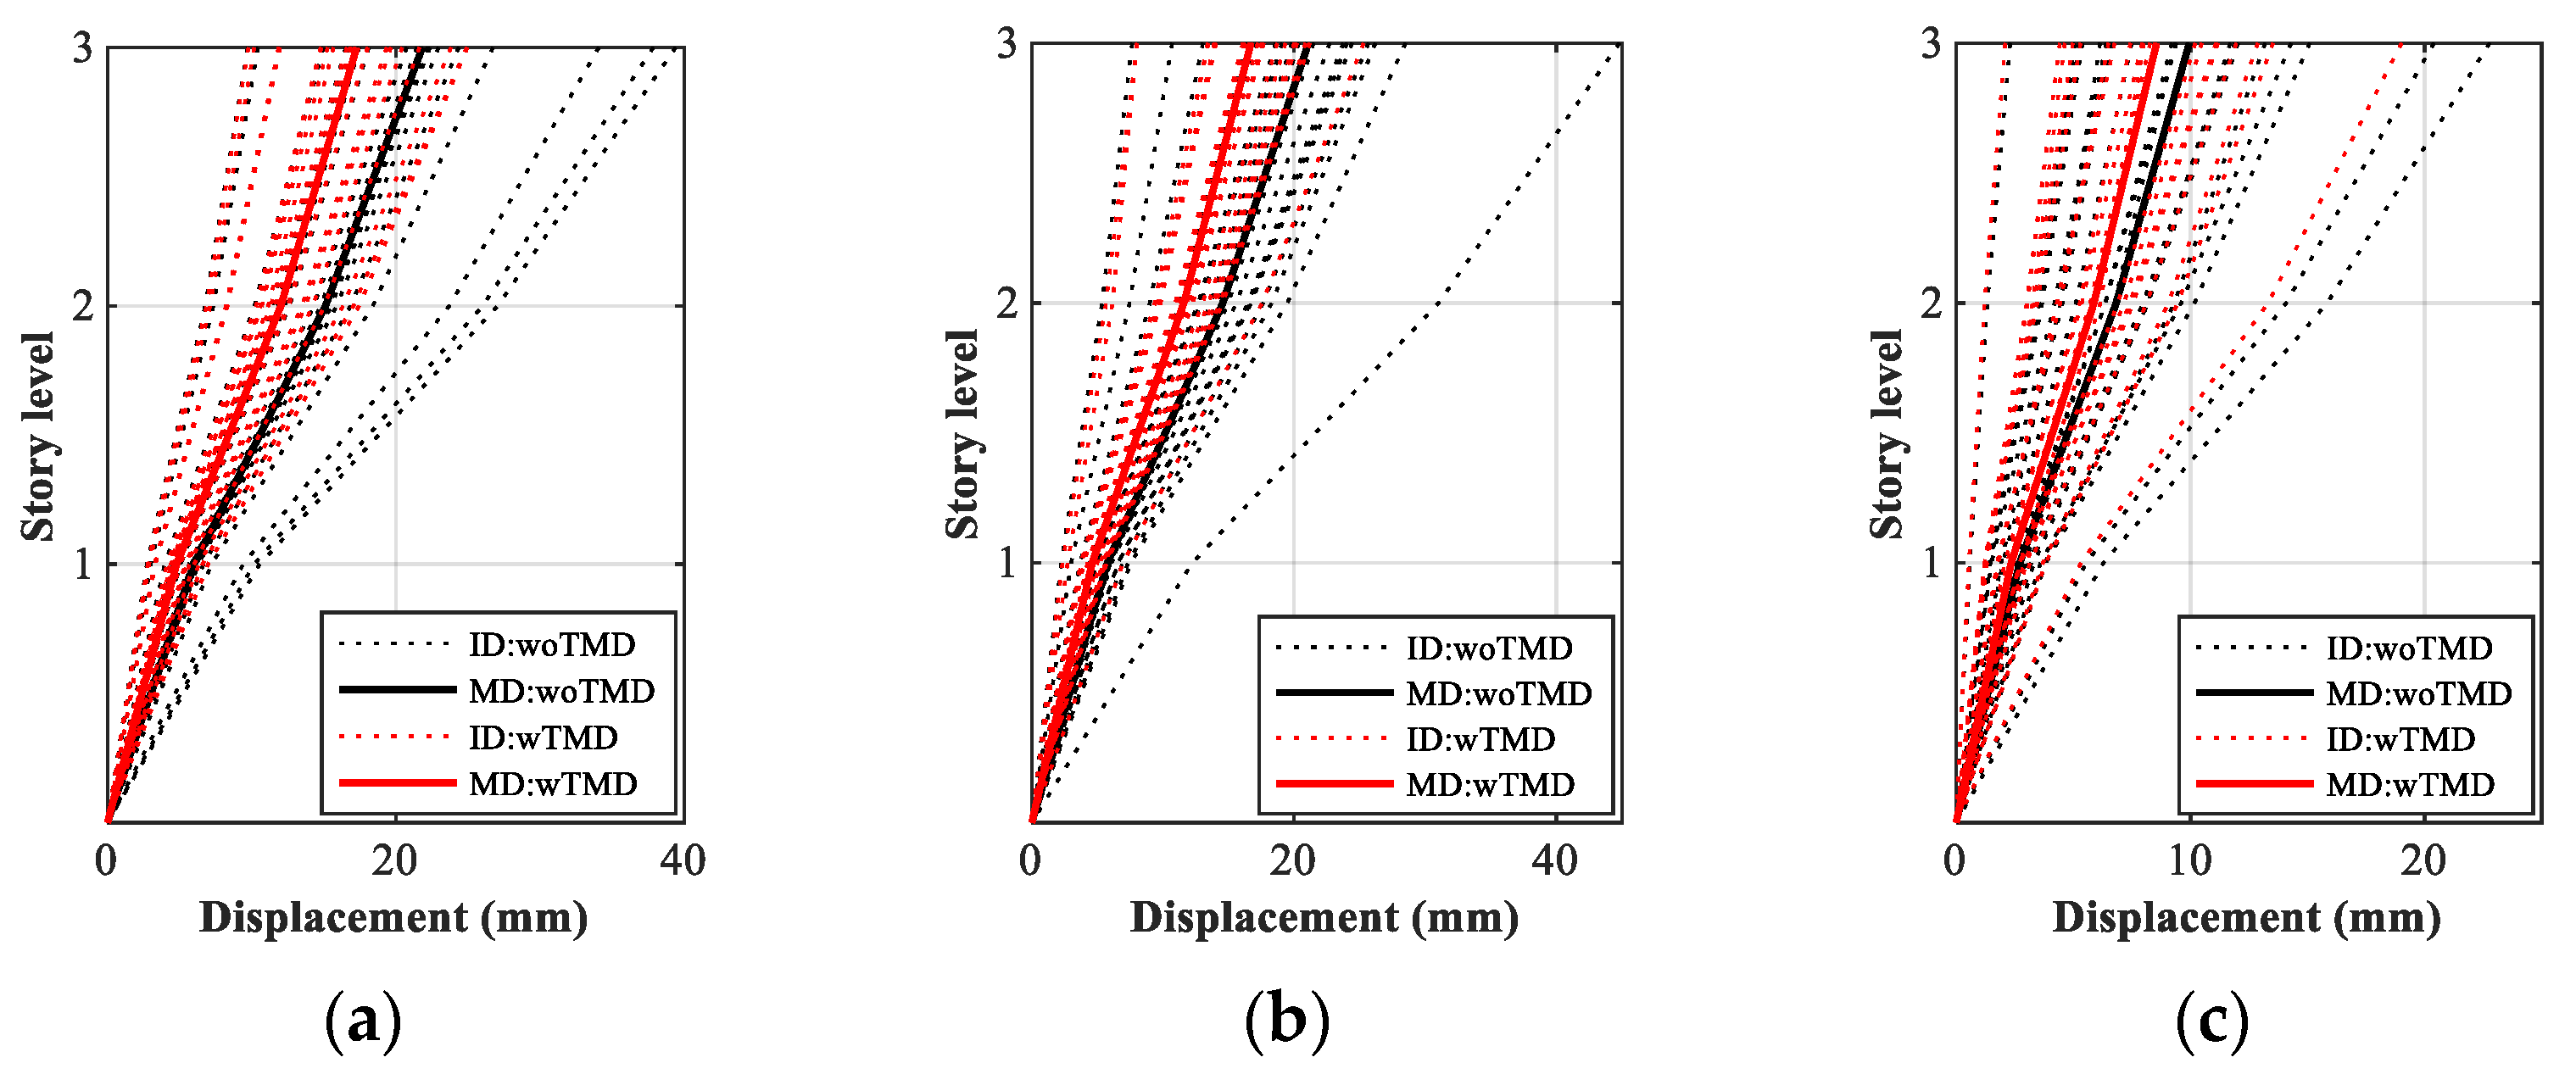
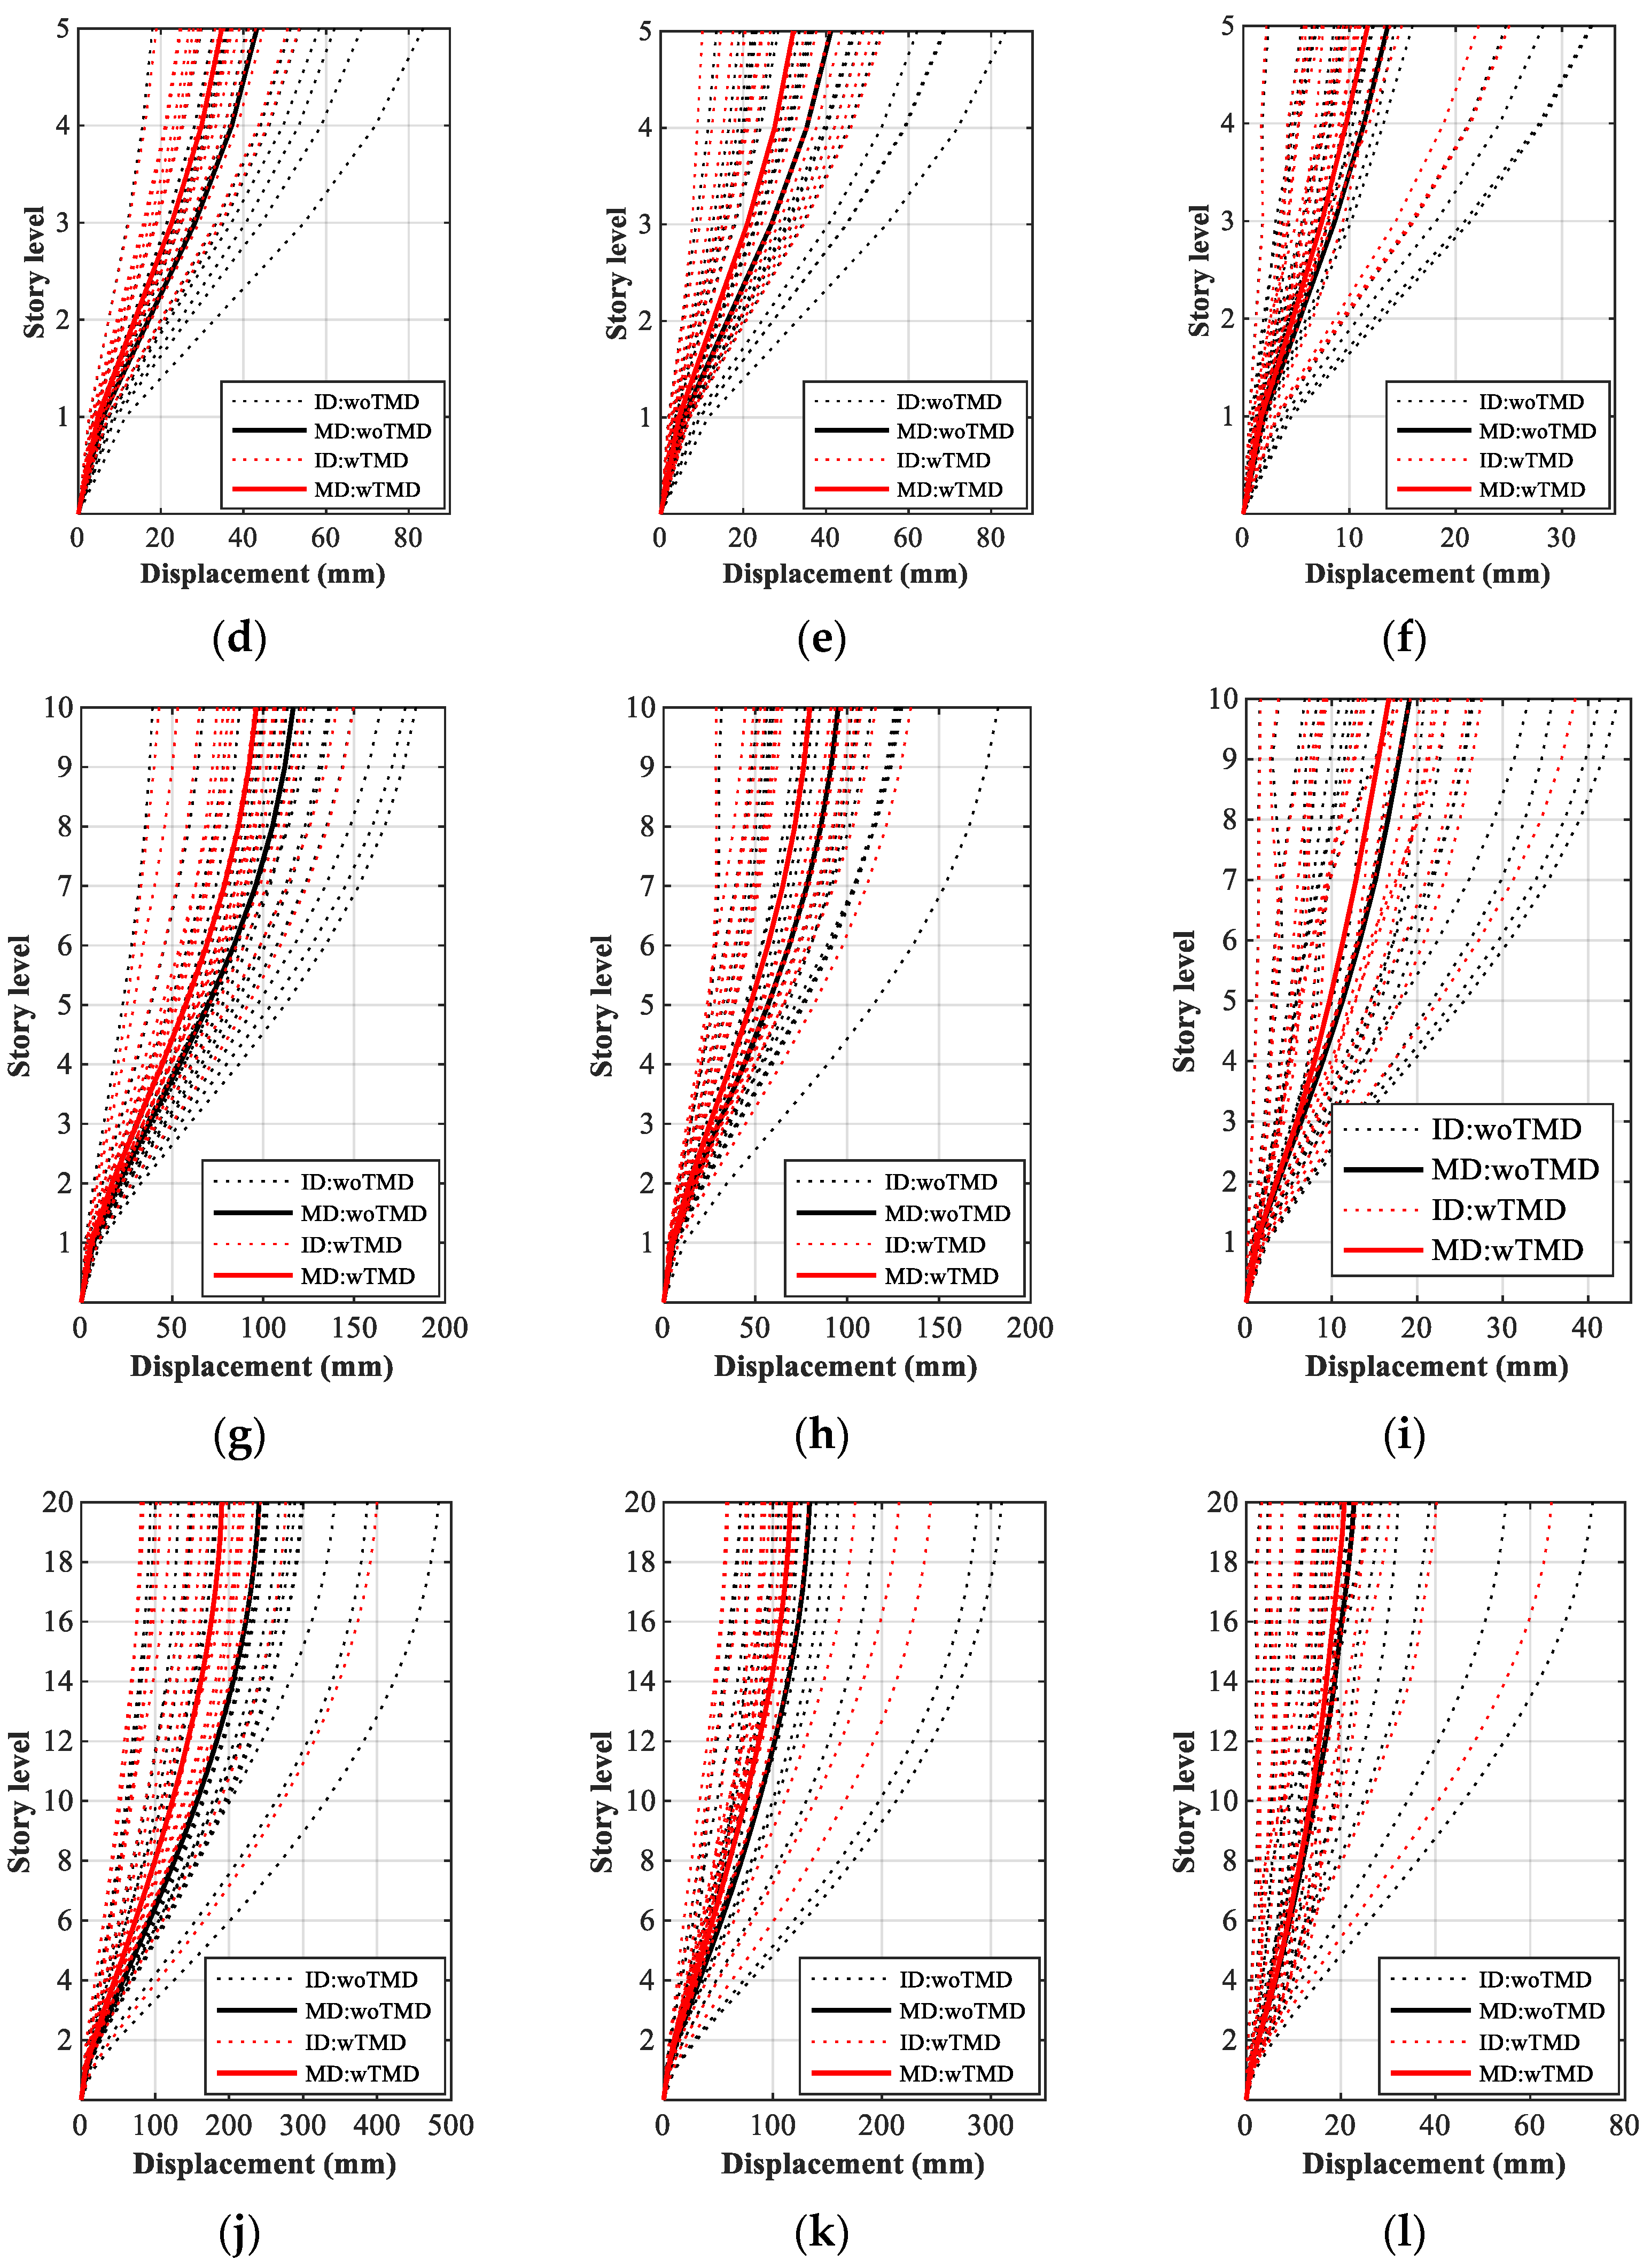
6.1. Peak Story Displacement

The ordering of the peak story displacement of the building performed from all simulations of the categories of GMs, with and without TMD, has been plotted in Figure 11. In Figure 11 the response for the individual data (ID) of responses due to the input GM is indicated by the dotted line and the response for the mean data (MD) is identified by the solid line. To clear the comparison of the peak story displacement between the with and without TMD, the responses for the MD have been taken into consideration. The result analysis showed that the response to the ordering of the peak displacement increases along the building heights and applying the TMD reduces the structural response in all categories of the selected GMs.
The reduction of peak displacement due to TMD installation is not only influenced by the frequency characteristics of GM but also by the story heights. As we analyze the result as shown in Figure 11, the TMD has a great influence on the response for the all-story height for LFC. In contrast with the LFC, if the same is constructed in the HFC zone, there will be no such effect for the TMD installation. However, it seems to be an isolated result from the other GM frequency content zone. It can be textualized after analyzing the behavior of all taken story heights for the MFC zone is that, from low to the mid-rise building (here 3, 5, and 10 stories) the peak displacement reduction is noticeable. In terms of the high-rise building case, this reduction looks very low. The response monitored from Figure 11 leads that in the three and five stories’ buildings, the displacement does not differ in LFC to HFC, but it becomes high with increasing the story height.
However, in 20 stories the structure shows the resonant in the HFC; as a result, the reduction for TMD device becomes ineffective. At the same time, it is concluded that the peak displacement is much more prominent in the LFC zone. The TMD shows a great performance. For all GMs, the nonlinear time history analysis was conducted for the maximum considered earthquake (MCE) level (2475 years return period), which was 0.167 g (Figure 8a).

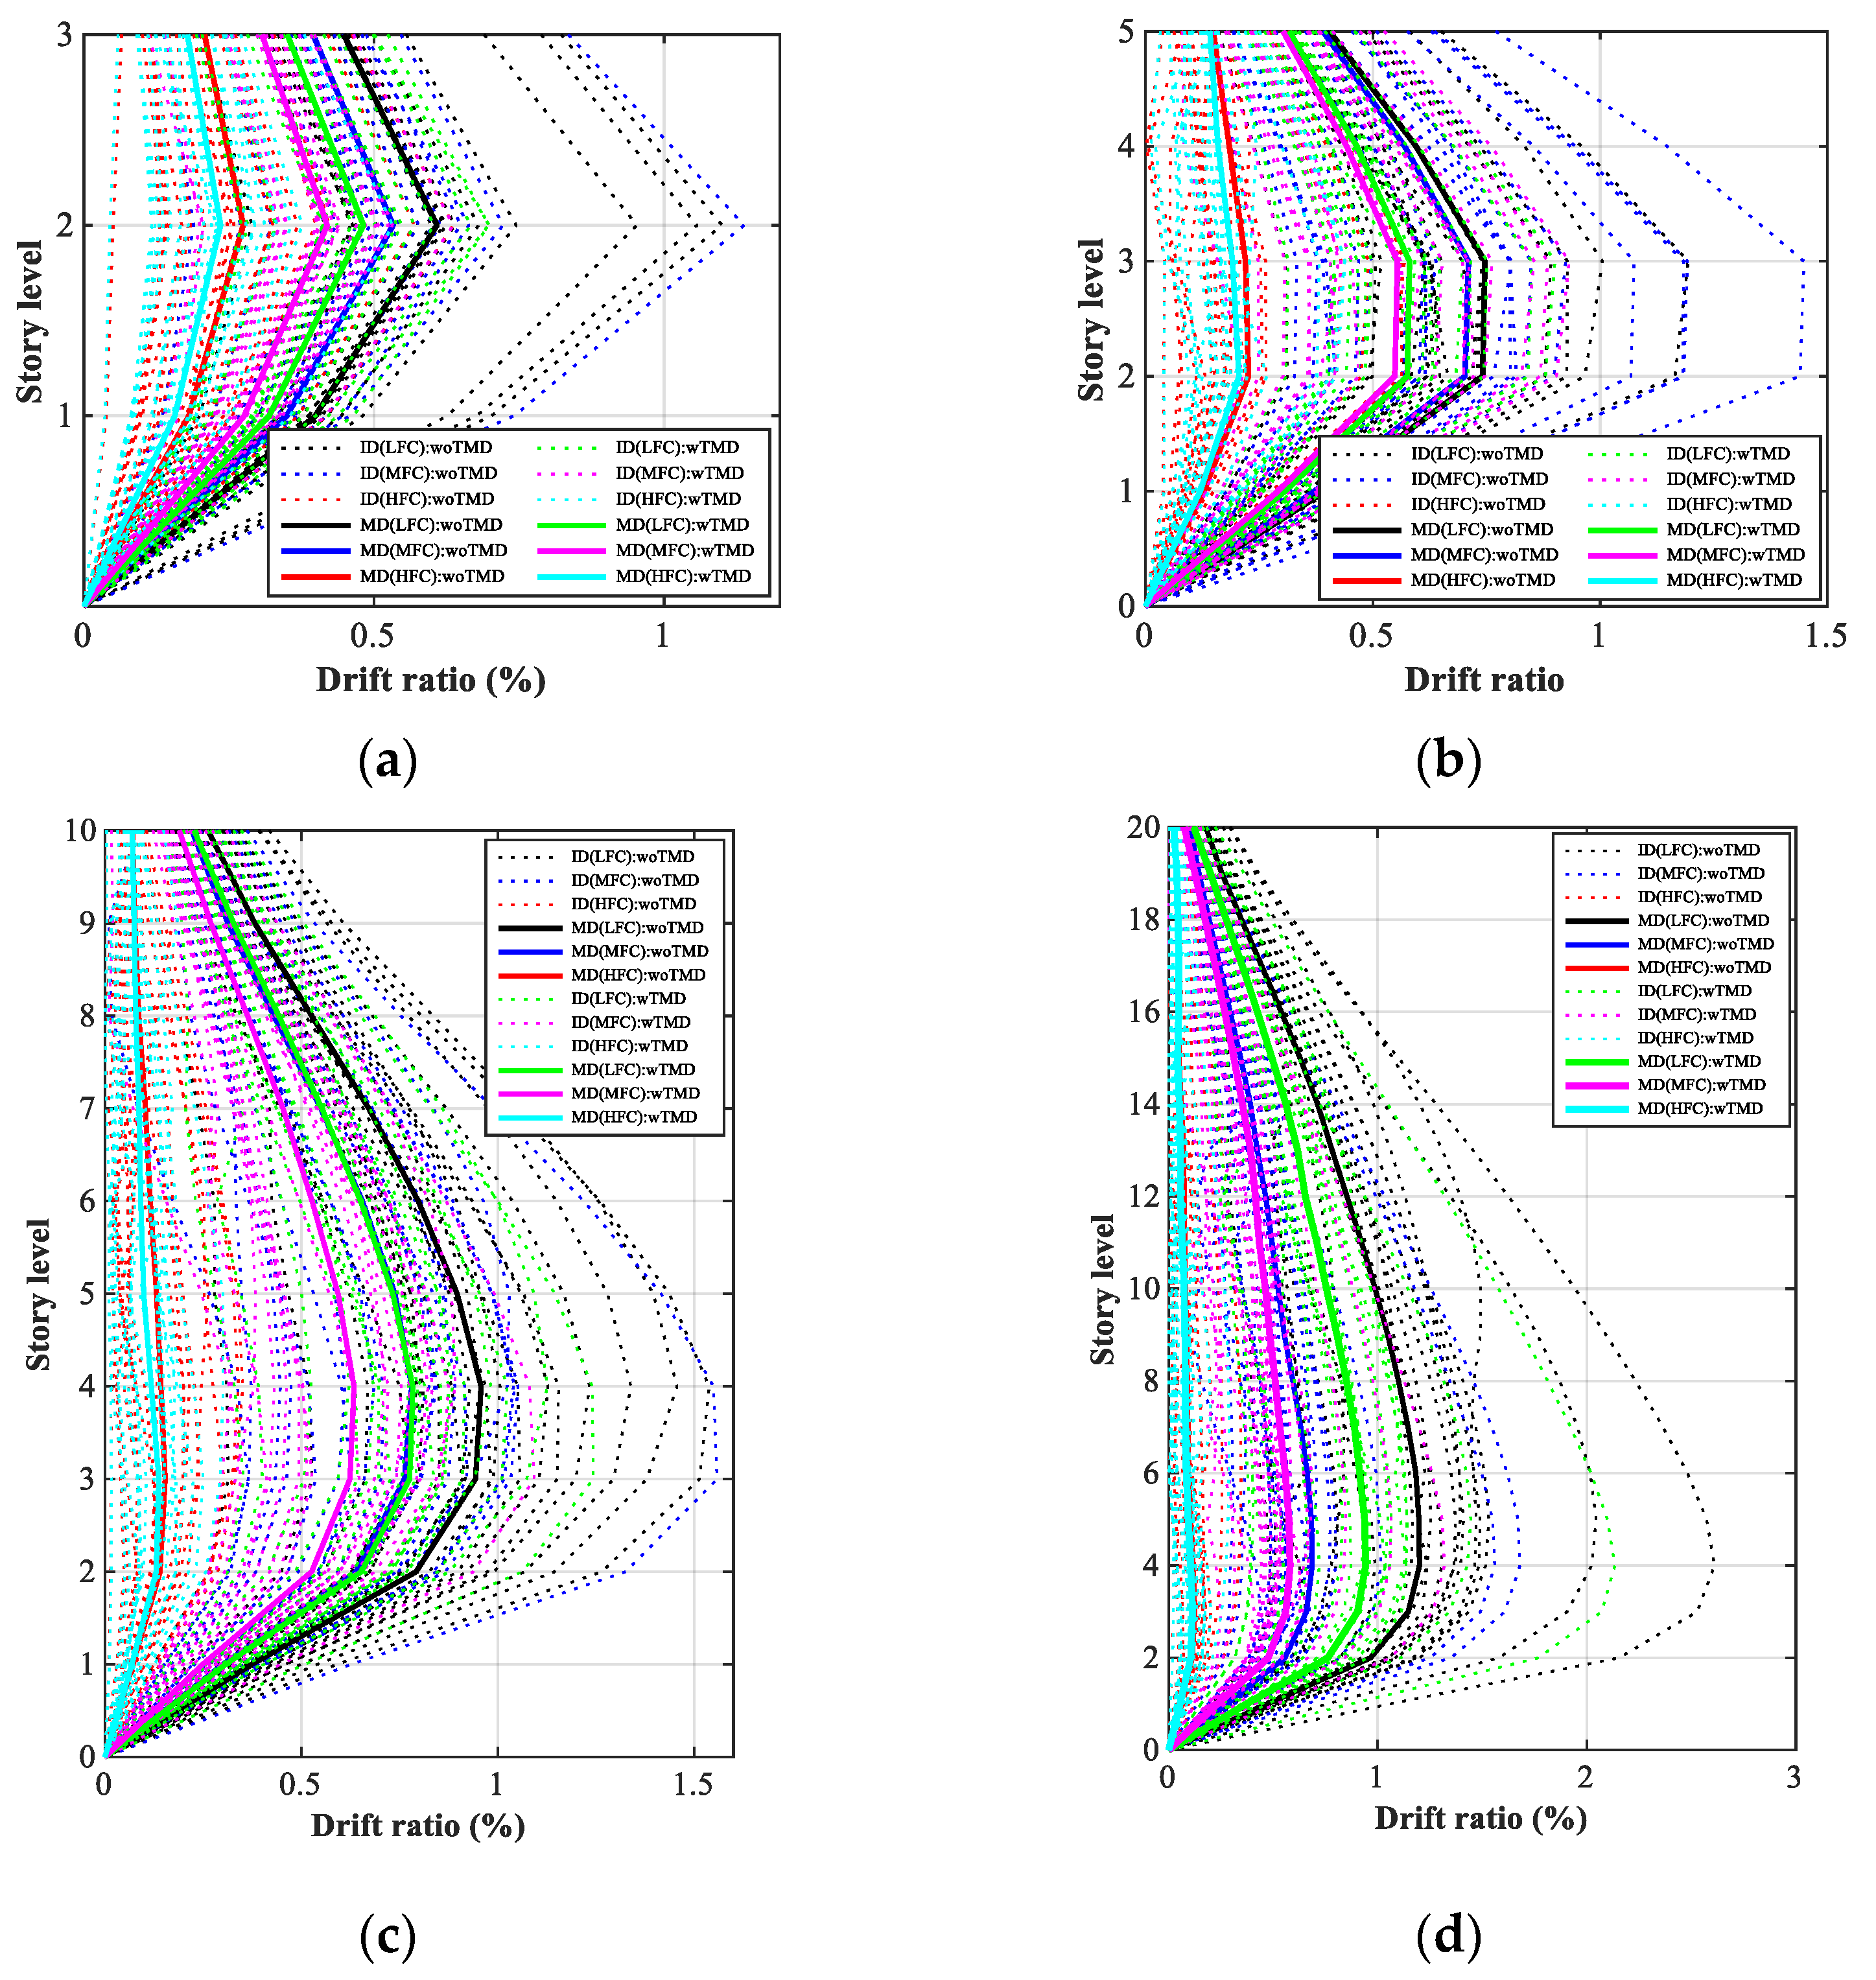
6.2. Interstory Drift

The inter-story drift ratio is one of the main engineering parameters for a building structure for performance evaluations, which is also a widely used parameter generally defined as the relative displacement between two consecutive floors. To develop the measurement capacity against an earthquake, the seismic analysis can be carried out as the parameter of inter-story drift.
According to FEMA 356 [44], the building performance level is divided into four categories, where the respective standard for maximum inter-story drift ratios limits had been determined. Not only that, but inter-story drift also plays an important role in damage detection parameters [45] in the experiment [46], as well as simulation research. In accordance with simulation, this section shows the inter-story drift ratio for each story height as shown in Figure 12. Each frame was excited with the maximum considered earthquake (MCE) in the South Korean selected region (Gunsan-si) as 0.167 g (Figure 8a) of each 60 earthquakes, whose return period is 2475 years.
This illustration aims to quantify the TMD control in inter-story drift ratio, as well as different frequency content level of GM. As this parameter is a significant index for structural design, it should not go beyond the standard values in the required level. From Figure 12, it is notified that the controlling effect of TMD in the HFC is much smaller because at this zone the inter-story drift ratio is less than other zones without TMD case. Similar to the previous section, the inter-story drift ratio is also mostly dominated by the TMD in the LFC zone in all story height.

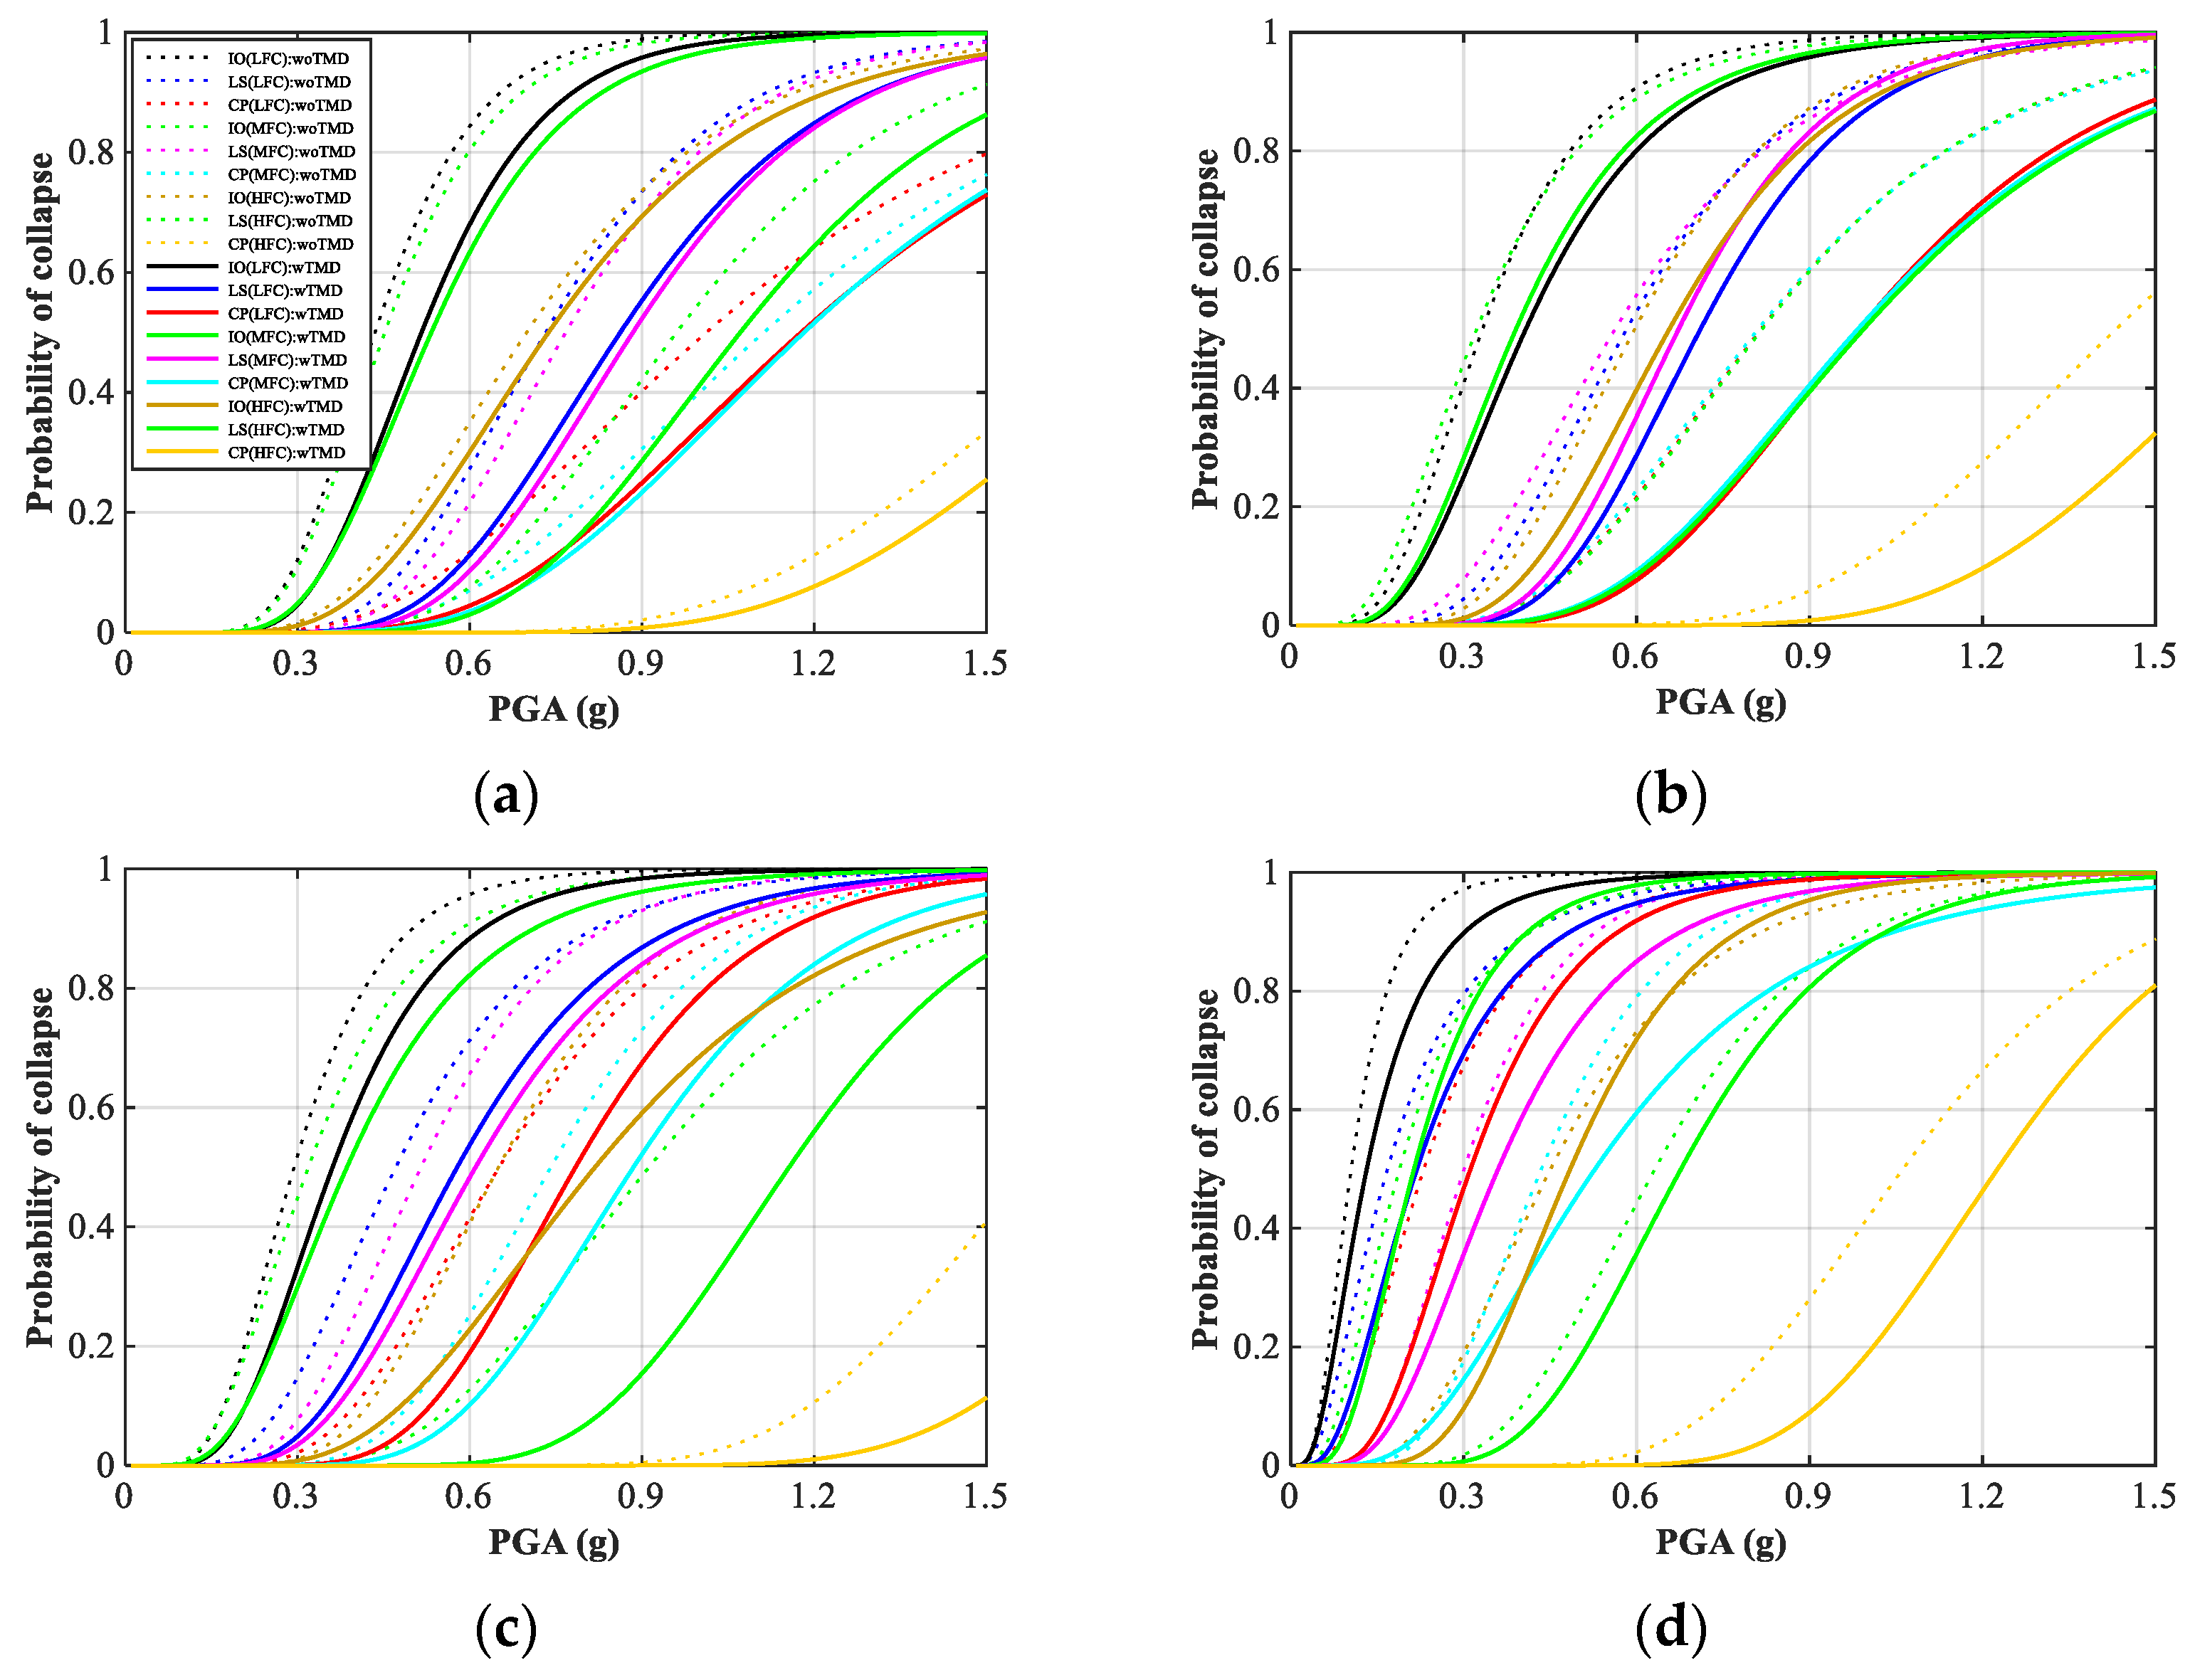
6.3. Fragility Analysis

For the engineering structures, the IDA-based fragility analysis can be expressed by the intensity measure (IM) as cumulative absolute velocity (CAV), cumulative absolute displacement (CAD), arias intensity (AI), spectral acceleration (Sa), spectral displacement (Sd), peak ground acceleration (PGA), etc. In this study, the PGA has been used to express the IM in IDA. As IDA is involved in performing a series of dynamic analyses of a structural model under a set of GMs, each GM is scaled up to a range of IM. The EQs were scaled to such a level of force to excite the structure through the IDA method so that the structure experienced an ultimate collapse after showing the elastic to inelastic behavior. The structural response can be presented by the IDA with scaler IMs and damage measure (DM) used as an engineering demand parameter (EDP). The traditional way is for PGA to show the structural response by the simplest feature [47,48]. However, in this study, the PGA has been used to express the IM in IDA and the MGs were scaled to such a level of force that the structure experienced an ultimate collapse after showing the elastic to inelastic behavior. Therefore, the responses can be expressed by IM and at the same time, as well as the damage measure (DM) used as an engineering demand parameter (EDP), where typical choices are the maximum understory drift, the individual peak story drifts, damage index (based on displacement, energy dissipation, etc.), and the peak floor accelerations. From HAZUS, as explained in the previous section, this study considered three levels of inter-story drift ratio as a limit state standard for concrete frame: (1) 1% indicates the intermediate occupancy (IO), (2) 2% indicates the life safety (LS) and (3) 4% indicates the collapse (CP) [44].
The seismically exciting structure is subjected to damage to such an extent as during ground shaking, the seismic analysis can be carried out through fragility analysis. With a lot of computational efforts, the fragility curve shows a relationship between the probability of exceeding taken limits of EDPs and the exceedance of damage [49]. Mathematically the fragility function can be expressed as follows:
P ( C | I M ) = φ [ l n ( I M θ ) β ]
where at I M = x , P denotes the GM probability which motivates the structural collapse, φ (   ) is the function of standard normal cumulative distribution, θ is the median, β is the standard deviation of the IM, and lastly, C is the damage state [16]. The fragility parameters followed in this study are the maximum likelihood estimation (MLE) [16,50], where the determination of the parameters can be made by the following:
L i k e l i h o o d = ( i = 1 m P ( C | I M ) ) ( 1 P ( C | I M m a x ) ) n m
{ θ ^ , β ^ } = a a r g   m a x θ , β i = 1 m { l n P ( C | I M ) } + ( n m ) l n ( 1 P ( C | I M ) )
where the number of IM intensities are notified by m, p =   1 (when the case exceeds the limit state (LS)) or p =   0 (not exceed the LS) and q =   1 p . The fragility curve is exposed from elastic to the collapse level for a set of GM by IDA.
By adopting the MLE, each building frame was excited with 60 GMs to show the seismic failure probability with and without TMD. Table 4 listed the fragility parameters from the MLE for different frequency contents and three different earthquake levels as explained above. Using these parameters, the fragility curves for each story height equipped without and with TMD are illustrated in Figure 13.
The TMD facilities reduce the damage by decreasing the inter-story drift ratio in different amounts according to the frequency content. As we looked at the inter-story drift is notifiable in the LFC zone than the HFC, the failure probability becomes more in the LFC than the HFC zone. This is also focused on Figure 13 for the three and five story building frame. However, as the story height increases, there is a little bit of change that can be feasible. The reduction of the inter-story drift ratio for the TMD equipped structures looks much less in the 20-story height structures, which shows that TMD performance becomes almost ineffective in high-rise buildings. It can also be textualized by the result analysis that it is better to apply the TMD in the LFC and MFC zone of any story building. In addition, the maximum reduction in damage mitigation monitored from Figure 13 is MFC in intermediate occupancy (IO) level. The performance of the frame increases due to the installation of TMD, which is shown in Table 5. From Table 5 it can be concluded that the TMD is more effective in the case of a high-rise building (20 stories) when it is excited by LFC GMs. The capacity increases up to 26% at CP structural performance level considering the mean fragility function. The effectiveness of TMD is similar for each story height due to MFC GMs. HFC GMs are more responsive for mid-rise buildings but in the case of high-rise buildings, the performance of TMD is not so much noticeable.

7. Conclusions

To show the TMD effect on the low, moderate, and high-rise building, this study investigated the seismic performance of 3, 5, 10, and 20-story building frames for three different frequency contents (low, medium, and high) and three different earthquake levels (IO, LS, and CP). The numerical assumption was considered as the concentrated plasticity model approach to represent the nonlinear behavior of the beam-column element through two end springs. The frames are designed according to the Korean Building Code (KBC) 2016 [16] and the two-dimensional frame has been taken to model (OpenSees and FeView) with and without TMD. The analysis was done through the result investigation of the effectiveness of the TMD system in reducing the peak lateral displacement and inter-story drift ratio. The fragility curves corresponding to the failure of each with and without the controlled building frame showed such effectiveness of TMD, which is the function of different categories of GM. From the investigation, the following conclusions can be drawn:
  • TMD installation at any height of the RCC building can reduce peak lateral displacement but not in the same manner. The controlling performance is also influenced by the GM frequency content and this is shown mostly in the LFC zone in all story heights. The idealization has also been made that if the same building is constructed in the HFC zone, the peak displacement reduction will be much less.
  • For low to mid-rise buildings, the peak displacement reduction is noticeable in MFC zone. But, for high-rise buildings, this reduction looks very low.
  • The TMD is more effective in the case of a high-rise building (20 stories) when it is excited by LFC GMs. The capacity increases up to 26% at CP structural performance level considering the mean fragility function.
  • The effectiveness of TMD is similar for each story height due to MFC GMs. However, HFC GMs are more responsive for mid-rise buildings but in the case of high-rise buildings, the performance of TMD is not so noticeable.
  • At 20-story height, the result looked less than the other story height taken in this study. It is also clarified that the specific GM characteristics affect the TMD performance and the reduction is greater in the LFC zone than the HFC zone in all cases as well.

Author Contributions

Conceptualization, M.M.R. and T.T.N.; data curation, M.M.R. and T.T.N.; formal analysis, M.M.R.; investigation, D.K.; methodology, M.M.R. and T.T.N.; project administration, D.K.; resources, D.K.; software, M.M.R. and T.T.N.; validation, M.M.R., T.T.N. and D.K.; visualization, M.M.R. and T.T.N.; writing—original draft, M.M.R.; writing—review and editing, M.M.R., T.T.N. and D.K. All authors have read and agreed to the published version of the manuscript.

Funding

The National Research Foundation of Korea Grant funded by the Korean Government (NRF-2018R1A2B2005519) supported this work.

Institutional Review Board Statement

Not applicable.

Informed Consent Statement

Not applicable.

Data Availability Statement

The data presented in this study are available on request from the corresponding author.

Conflicts of Interest

The authors declare no conflict of interest.

References

  1. Gattulli, V.; Ghanem, R. Adaptive control of flow-induced oscillations including vortex effects. Int. J. Non Linear Mech. 1999, 34, 853–868. [Google Scholar] [CrossRef]
  2. Soong, T.; Spencer, B. Active, semi-active and hybrid control of structures. Bull. N. Z. Soc. Earthq. Eng. 2000, 33, 387–402. [Google Scholar] [CrossRef] [Green Version]
  3. Ou, J.; Long, X.; Li, Q.; Xiao, Y. Vibration control of steel jacket offshore platform structures with damping isolation systems. Eng. Struct. 2007, 29, 1525–1538. [Google Scholar] [CrossRef]
  4. Tanveer, M.; Usman, M.; Khan, I.U.; Ahmad, S.; Hanif, A.; Farooq, S.H. Application of tuned liquid column ball damper (TLCBD) for improved vibration control performance of multi-storey structure. PLoS ONE 2019, 14, e0224436. [Google Scholar] [CrossRef] [PubMed]
  5. Mantilla, J.S.; Gómez, D.; Thomson, P. Structural Control Using a Semiactive Friction Damper. In Special Topics in Structural Dynamics; Miao, D.D., Tarazaga, P., Castellini, P., Eds.; Springer: Cham, Switzerland, 2016; Volume 6, pp. 175–183. [Google Scholar]
  6. Radmard Rahmani, H.; Könke, C. Seismic control of tall buildings using distributed multiple tuned mass dampers. Adv. Civ. Eng. 2019, 2019, 6480384. [Google Scholar] [CrossRef]
  7. Wang, A.-P.; Lin, Y.-H. Vibration control of a tall building subjected to earthquake excitation. J. Sound Vib. 2007, 299, 757–773. [Google Scholar] [CrossRef]
  8. Krenk, S.; Høgsberg, J. Tuned mass absorbers on damped structures under random load. Probab. Eng. Mech. 2008, 23, 408–415. [Google Scholar] [CrossRef]
  9. Rüdinger, F. Optimal vibration absorber with nonlinear viscous power law damping and white noise excitation. J. Eng. Mech. 2006, 132, 46–53. [Google Scholar] [CrossRef]
  10. Fujino, Y.; Abé, M. Design formulas for tuned mass dampers based on a perturbation technique. Earthq. Eng. Struct. Dyn. 1993, 22, 833–854. [Google Scholar] [CrossRef]
  11. Den Hartog, J.P. Mechanical Vibrations; McGraw-Hill: New York, NY, USA, 1956. [Google Scholar]
  12. Warburton, G.B. Optimum absorber parameters for various combinations of response and excitation parameters. Earthq. Eng. Struct. Dyn. 1982, 10, 381–401. [Google Scholar] [CrossRef]
  13. Dadkhah, M.; Kamgar, R.; Heidarzadeh, H.; Jakubczyk-Gałczyńska, A.; Jankowski, R. Improvement of Performance Level of Steel Moment-Resisting Frames Using Tuned Mass Damper System. Appl. Sci. 2020, 10, 3403. [Google Scholar] [CrossRef]
  14. Mazzoni, S.; McKenna, F.; Scott, M.H.; Fenves, G.L. The Open System for Earthquake Engineering Simulation (OpenSEES): OpenSees Command Language Manual; Pacific Earthquake Engineering Research (PEER): Berkeley, CA, USA, 2006. [Google Scholar]
  15. Andonov, A.; Apostolov, K. Displacement-based seismic capacity assessment of concrete dams. In Proceedings of the 15th World Conference on Earthquake Engineering, Lisbon, Portugal, 24–28 September 2012. [Google Scholar]
  16. Baker, J.W. Efficient analytical fragility function fitting using dynamic structural analysis. Earthq. Spectra 2015, 31, 579–599. [Google Scholar] [CrossRef]
  17. AIK. Korean Building Code-Structural; Architectural Institute of Korea: Seoul, Korea, 2016. [Google Scholar]
  18. McKenna, F. OpenSees: Open system for earthquake engineering simulation. Comput. Sci. Eng. 2006, 13, 58–66. [Google Scholar] [CrossRef]
  19. Kim, S. Seismic performance evaluation of high-rise steel buildings dependent on wind exposures. Adv. Mech. Eng. 2019, 11, 1–12. [Google Scholar] [CrossRef]
  20. Ibarra, L.F.; Medina, R.A.; Krawinkler, H. Hysteretic models that incorporate strength and stiffness deterioration. Earthq. Eng. Struct. Dyn. 2005, 34, 1489–1511. [Google Scholar] [CrossRef]
  21. Lignos, D.G.; Krawinkler, H. Deterioration modeling of steel components in support of collapse prediction of steel moment frames under earthquake loading. J. Struct. Eng. 2011, 137, 1291–1302. [Google Scholar] [CrossRef] [Green Version]
  22. Yu, I.; Kim, J.; Jeong, S. Development of probability wind speed map based on frequency analysis. Spat. Inf. Res. 2016, 24, 577–587. [Google Scholar] [CrossRef]
  23. ACI. Building Code Requirements for Structural Concrete; ACI 318-11; American Concrete Institute: Farmington Hills, MI, USA, 2011; p. 503. [Google Scholar]
  24. Mohebi, B.; Kazemi, F.; Yakhchalian, M. Investigating the P-Delta effects on the seismic collapse capacity of adjacent structures. In Proceedings of the 16th European Conference on Earthquake Engineering, Thessaloniki, Greece, 18–21 June 2018; pp. 1–11. [Google Scholar]
  25. Malley, J.; Dierlein, G.; Krawinkler, H.; Maffei, J.; Pourzanjani, M.; Wallace, J.; Heintz, J. Modeling and Acceptance Criteria for Seismic Design and Analysis of Tall Buildings; PEER/ATC-72-1; Applied Technology Council: Berkeley, CA, USA, 2010. [Google Scholar]
  26. Visnjic, T.; Panagiotou, M.; Moehle, J.P. Seismic response of 20-story-tall reinforced-concrete special moment-resisting frames designed with current code provisions. Earthq. Spectr. 2015, 31, 869–893. [Google Scholar] [CrossRef]
  27. Esmaili, O.; Grant Ludwig, L.; Zareian, F. Improved performance-based seismic assessment of buildings by utilizing Bayesian statistics. Earthq. Eng. Struct. Dyn. 2016, 45, 581–597. [Google Scholar] [CrossRef]
  28. Moniri, H. Evaluation of seismic performance of reinforced concrete (RC) buildings under near-field earthquakes. Int. J. Adv. Struct. Eng. 2017, 9, 13–25. [Google Scholar] [CrossRef] [Green Version]
  29. Esmaili, O.; Zareian, F. Preliminary design of moment-resisting frame buildings for tolerable financial loss. J. Struct. Eng. 2019, 145, 04019059. [Google Scholar] [CrossRef]
  30. Chopra, A.K. Dynamics of Structures: Theory and Applications to Earthquake Engineering, 4th ed.; Prentice Hall: Upper Saddle River, NJ, USA, 2012. [Google Scholar]
  31. Stockdale, W.K. Modal Analysis Methods in Seismic Design for Buildings; M-132; Construction Engineering Research Laboratory: Champaign, IL, USA, 1975; p. 37. [Google Scholar]
  32. Rahman, M.M.; Nahar, T.T.; Kim, D. FeView: Finite Element Visualization for Opensees; Structural System Lab.: Cheonan-si, Korea, 2020. [Google Scholar]
  33. ASCE. ASCE/SEI 7–16: Minimum Design Loads and Associated Criteria for Buildings and Other Structures; American Society of Civil Engineers: Reston, VA, USA, 2017. [Google Scholar]
  34. Datta, T.K. Seismic Analysis of Structures; John Wiley & Sons: South Tower, Singapore, 2010. [Google Scholar]
  35. Kaynia, A.M.; Biggs, J.M.; Veneziano, D. Seismic effectiveness of tuned mass dampers. J. Struct. Division 1981, 107, 1465–1484. [Google Scholar] [CrossRef]
  36. Pavel, F.; Lungu, D. Correlations between frequency content indicators of strong ground motions and PGV. J. Earthq. Eng. 2013, 17, 543–559. [Google Scholar] [CrossRef]
  37. Moon, D.-S.; Lee, Y.-J.; Lee, S. Fragility analysis of space reinforced concrete frame structures with structural irregularity in plan. J. Struct. Eng. 2018, 144, 04018096. [Google Scholar] [CrossRef]
  38. Zhu, T.J.; Heidebrecht, A.C.; Tso, W.K. Effect of peak ground acceleration to velocity ratio on ductility demand of inelastic systems. Earthq. Eng. Struct. Dyn. 1988, 16, 63–79. [Google Scholar] [CrossRef]
  39. Bommer, J.J.; Elnashai, A.S.; Weir, A.G. Compatible acceleration and displacement spectra for seismic design codes. In Proceedings of the 12th World Conference on Earthquake Engineering, Auckland, New Zealand, 30 January–4 February 2000; pp. 1–8. [Google Scholar]
  40. PEER. PEER Ground Motion Database. Available online: https://ngawest2.berkeley.edu/ (accessed on 1 January 2020).
  41. Mashayekhi, M.; Estekanchi, H.E.; Vafai, H.; Mirfarhadi, S.A. Development of hysteretic energy compatible endurance time excitations and its application. Eng. Struct. 2018, 177, 753–769. [Google Scholar] [CrossRef]
  42. Choun, Y.S.; Choi, I.K.; Ohtori, Y.; Shiba, Y.; Nakajima, M. Korea-Japan Joint Research on Development of Seismic Capacity Evaluation and Enhancement Technology Considering Near-Fault Effects; KAERI/RR-2688/2006; Korea Atomic Energy Research Institute: Daejon, Korea, 2003; p. 158. [Google Scholar]
  43. Nahar, T.T.; Rahman, M.M.; Kim, D. PSHRisk-Tool: A Python-Based Computational Tool for Developing Site Seismic Hazard Analysis and Failure Risk Assessment of Infrastructure. Appl. Sci. 2020, 10, 7487. [Google Scholar] [CrossRef]
  44. ASCE. Prestandard and Commentary for The Seismic Rehabilitation of Buildings; FEMA-356; Federal Emergency Management Agency: Washington, DC, USA, 2000. [Google Scholar]
  45. Hwang, S.-H.; Lignos, D.G. Assessment of structural damage detection methods for steel structures using full-scale experimental data and nonlinear analysis. Bull. Earthq. Eng. 2018, 16, 2971–2999. [Google Scholar] [CrossRef] [Green Version]
  46. Okazaki, T.; Lignos, D.G.; Hikino, T.; Kajiwara, K. Dynamic response of a chevron concentrically braced frame. J. Struct. Eng. 2013, 139, 515–525. [Google Scholar] [CrossRef] [Green Version]
  47. Shinozuka, M.; Feng, M.Q.; Lee, J.; Naganuma, T. Statistical analysis of fragility curves. J. Eng. Mech. 2000, 126, 1224–1231. [Google Scholar] [CrossRef] [Green Version]
  48. Choi, E.; DesRoches, R.; Nielson, B. Seismic fragility of typical bridges in moderate seismic zones. Eng. Struct. 2004, 26, 187–199. [Google Scholar] [CrossRef]
  49. Kennedy, R.; Ravindra, M. Seismic fragilities for nuclear power plant risk studies. Nucl. Eng. Des. 1984, 79, 47–68. [Google Scholar] [CrossRef]
  50. Mandal, T.K.; Ghosh, S.; Pujari, N.N. Seismic fragility analysis of a typical Indian PHWR containment: Comparison of fragility models. Struct. Saf. 2016, 58, 11–19. [Google Scholar] [CrossRef]
Figure 1. Structural layout of the building frame (for all frames: bay width = 6 m and story height = 3 m): (a) 3 story; (b) 5 story; (c) 10 story; (d) 20 story.
Buildings 11 00074 g001
Figure 2. Modified Ibarra Krawinkler moment-rotation relationship for a beam-column joint element.
Buildings 11 00074 g002
Figure 3. Rayleigh damping ratio with the natural frequency.
Buildings 11 00074 g003
Figure 4. Fundamental modes shapes: (a) 3 story; (b) 5 story; (c) 10 story; (d) 20 story.
Buildings 11 00074 g004
Figure 5. Schematic diagram of a tuned mass damper (TMD) attached to the building top.
Buildings 11 00074 g005
Figure 6. Mathematical technique for the effectiveness of TMD.
Buildings 11 00074 g006
Figure 7. Comparison of the structural response for measuring the effectiveness of TMD: (a) displacement reduction; (b) acceleration reduction.
Buildings 11 00074 g007
Figure 8. Seismic hazard evaluation: (a) seismicity maps in the Korean peninsula for 2475 years returned period; (b) seismic hazard curve in the building site (Gunsan-si, South Korea) for four seismic models in South Korea.
Buildings 11 00074 g008
Figure 9. Disaggregation plot for most contributing earthquake range selection from four seismic source models in Korea: (a) model A; (b) model B; (c) model C; (d) model D.
Buildings 11 00074 g009
Figure 10. Selected ground motion (GMs): (a) scatter plot; (b) response spectra of input GMs.
Buildings 11 00074 g010
Figure 11. Story displacement of building frames under different categories of GMs: (a) 3 story (LFC); (b) 3 story (MFC); (c) 3 story (HFC); (d) 5 story (LFC); (e) 5 story (MFC); (f) 5 story (HFC); (g) 10 story (LFC); (h) 10 story (MFC); (i) 10 story (HFC); (j) 20 story (LFC); (k) 20 story (MFC); (l) 10 story (HFC).
Buildings 11 00074 g011aBuildings 11 00074 g011b
Figure 12. Story displacement of building frames under different categories of GMs: (a) 3 story; (b) 5 story; (c) 10 story; (d) 20 story.
Buildings 11 00074 g012
Figure 13. Fragility curves equipped with and without the TMD building frame: (a) 3 story; (b) 5 story; (c) 10 story; (d) 20 story.
Buildings 11 00074 g013
Table 1. Wind and seismic design load conditions.
Load TypeContentValueRemarks
Wind loadDesign wind speed 26.5 m/sGunsan-si, Korea for 50 years [22]
Topographic factor ( K z t )1Flat areas are not affected by mountains, hills, and slopes. Classification of importance: 1 [17]
Importance factor ( I w )1
Seismic load0.2 s spectral acceleration ( S s )0.55 gReturned period: 2400 (Earthquake for collapse prevention level)
Site class: SB
[17]
1 s spectral acceleration ( S 1 )0.22 g
Short-period site coefficient ( F a )1
Long-period site coefficient ( F v )1
Table 2. Dynamic characteristics of the building frames.
Story No.T (s)
1st Mode
T (s)
1st Mode
AIK [17]ASCE [33]FEA
(This Study)
30.3790.3370.349
50.5560.5010.537
100.9360.9950.964
201.5741.8571.597
Table 3. Dynamic characteristics of the building frames.
Ref. Frequency   Ratio   ( γ o p t ) Damping   Ratio , ( ξ o p t )
Krenk and Høgsberg [8] 1 1 + μ 1 2 μ 1 + μ
Rüdinger [9] 2 + μ 2 ( 1 + μ ) 2 μ ( 4 + 3 μ ) 4 ( 1 + μ ) 3
Fujino and Abé [10] 1 0.5 μ 1 + μ 1 2 μ ( 1 + 3 μ / 4 ) ( 1 + μ ) ( 1 + 0.5 μ )
Warburton [12] 1 0.5 μ 1 + μ μ ( 1 μ / 4 ) 4 ( 1 + μ ) ( 1 0.5 μ )
Den Hartog [11] 1 1 + μ 3 μ 8 ( 1 + μ ) 3
Table 4. Dynamic characteristics of the building frames.
Story GMs Freq. Char.Damage States
(woTMD)(wTMD)
IOLSCPIOLSCP
θβθβθβθβθβθΒ
3 storyLow0.4350.3180.7320.3301.0120.4720.5160.3220.8620.3211.1770.397
Medium0.4520.3310.7670.3141.1120.4180.5330.3460.8840.3061.1820.375
High0.6990.3990.9600.3281.7170.3170.7370.3951.0710.3081.8170.291
5 storyLow0.3330.4460.5830.3910.8160.3920.4080.4570.7110.3020.9860.347
Medium0.3230.5090.5630.4440.8110.4040.3910.4590.6730.3020.9840.372
High0.5970.3610.8180.3891.4320.2960.6570.3490.9940.3691.6920.264
10 storyLow0.2940.4150.4710.4310.6510.3820.3610.4260.5780.3960.7840.304
Medium0.3190.4730.5150.3780.7410.3170.3860.4780.6100.3910.8850.306
High0.6500.3370.9120.3681.5770.2190.8180.4161.1560.2461.9140.202
20 storyLow0.1050.5510.1680.7050.2310.5810.1320.6470.2190.6200.3120.468
Medium0.1890.6170.3010.4420.4350.3990.2140.5100.3600.4930.5280.534
High0.4510.4630.6320.3551.0620.2850.4850.3680.6770.3301.2260.230
Table 5. Seismic capacity increases due to TMD at mean fragility function.
StoryGMs Freq. Char.Capacity Raise
IOLSCP
3 storyLow16%15%14%
Medium15%13%6%
High5%10%6%
5 storyLow18%18%17%
Medium17%16%18%
High9%18%15%
10 storyLow19%19%17%
Medium17%16%16%
High21%21%18%
20 storyLow20%23%26%
Medium12%16%18%
High7%7%13%
Publisher’s Note: MDPI stays neutral with regard to jurisdictional claims in published maps and institutional affiliations.

