
A Taxonomy of Sources of Waste in BIM Information Flows


Department of Construction Engineering, École de Technologie Supérieure, 1100 Notre-Dame Street West, Montreal, QC H3C 1K3, Canada
*
Author to whom correspondence should be addressed.
Buildings 2021, 11(7), 291; https://0-doi-org.brum.beds.ac.uk/10.3390/buildings11070291
Submission received: 3 June 2021
/
Revised: 29 June 2021
/
Accepted: 1 July 2021
/
Published: 4 July 2021
(This article belongs to the Section Construction Management, and Computers & Digitization)
Abstract
:Since its introduction, Building Information Modelling has evolved into a major technology in the construction industry, where information flows play a major role. However, the very presence of waste within these flows prevents the technology from reaching its full potential. This paper aims to develop a taxonomy focused on the sources of waste within information flows in BIM projects, as existing taxonomies focus primarily on work and material flows. Using a collaborative design science research approach, the study was divided into two phases: first, semi-structured interviews were used to collect data on BIM practices. The data was then used to identify similarities and contradictions in the information flows using process maps. Second, the ShareLab approach was used to validate the findings through a common agreement. The paper’s main contribution is the taxonomy of sources of waste in BIM project information flows, as it closes knowledge gaps in one of the main flows of construction projects. Another contribution is its use of a new approach to validate an artefact in a Design Science Research methodology named the ShareLab approach.
1. Introduction
BIM was introduced to the construction industry with the aim of improving productivity thanks, in part, to centralized information [1]. Initially, BIM was largely considered to be a tool designed as a 3D digital model [2,3]. However, traditional construction processes are compatible with the use of BIM technologies. This requires an evolution of construction industry practices to adapt to the new BIM related processes [4]. Today, the different dimensions of BIM, also called nD modelling, are revolutionizing construction practices and technologies [5].
An improved collaboration and interoperability between project stakeholders are fundamental in the BIM approach. This explains the major role of information flow within BIM processes. In order to guarantee the efficiency of the BIM approach, information flow quality must be optimal. A potential solution to a recurring problem is to identify and eliminate sources of waste in the flow of information. This solution has, in fact, been implemented in other flows found in construction processes. In that regard, certain tools, approaches, and techniques have been developed to improve work flows [6,7] and material flows [8,9]. The information flow is part of the three main flows found in construction processes, the others being work and material flows. These three flows are interrelated [10]. Existing research focuses on specific cases of waste, without necessarily defining the cause, and without seeking to classify and/or prioritize the sources [11,12]. Implementations focusing solely one or two flow types thus provide only partial solutions. Regarding waste, taxonomies have been developed to improve processes related to work and material flows, whereas none has been established for information flows. Some waste sources are present in multiple flows, while others are specific to a single flow. Thus, when using existing taxonomies developed for the work or material flows, the sources of waste specific to the information flows go untouched, as they are not identified. With the advent of BIM, eliminating waste within information flows offers the best opportunities for major gains in quality, predictability and productivity.
The objective of the present research is to form a taxonomy of waste sources in BIM information flows. This research choice was motivated by the need to improve productivity in construction projects, with a focus on information flows. This is due to the role of information in BIM implementation at the industrial scale becoming central to the management and delivery of construction projects. The impact of waste elimination for information flow management is significantly broader than for other flows, as it covers the entire lifecycle of a project. The National Institute of Standards and Technology (NIST) report (2004) is the only literature that has studied and quantified the issues of waste in the management of information flows throughout the building lifecycle [13]. This article presents the results of an exploratory research aiming to improve the entire life cycle of BIM construction projects. The use of a taxonomy allowed to facilitate the description and analysis of the results and to communicate knowledge [14].
This research is based on an exploratory approach involving inductive reasoning [15]. Data collection was realized in collaboration with BIM consultants, one client and professionals from four different fields of the Canadian construction industry (architecture, MEP engineering, general contractor, and MEP contractor) on commercial and residential type constructions. Additionally, Design-Build and Design-Bid-Build projects were studied, as well as three BIM dimensions: 3D with the use of BIM Execution Plan (BEP) and the Level of Development (LOD), 6D with sustainability, and 7D with operation and maintenance. This extensive data collection allowed a complete and more accurate picture of information flows in construction processes.
This paper starts with a literature review focusing on the sources of waste within the information flows of the different BIM dimensions. A description of the methodology used for the research follows, along with a presentation of the participants in the study. The next section provides the results and their analysis, with the generation of a taxonomy of the sources of waste in the information flows of BIM projects. Finally, the last section summarizes the paper’s contributions and limitations, and presents the conclusions and recommendations for future work.
2. The Concept of Waste in BIM Information Flows
2.1. Information Flow and Waste
The concept of flow has been used in the manufacturing industry for decades through the use of Lean production. One of the five key principles of Lean thinking involves improving the flow by implementing continuous improvement [16]. Based on the same principles, Lean thinking has been adapted to the construction industry to improve its processes. However, with the emergence of new approaches such as BIM, new processes have been developed, with information flow playing a major role [17]. Indeed, the BIM implementation was designed to provide a centralized platform aimed at facilitating information sharing [18]. These authors provided a guide describing a structured procedure for creating and implementing BIM in a construction project. However, several barriers have been identified as being at the root of problems that prevent us reaping the benefits of BIM. These include a lack of BIM coordination, the quantity and quality of information exchanged between the parties involved, resistance to change, a lack of understanding of the entire information flows process, and a lack of a common shared vision [19]. Indeed, a recent scientometric analysis concluded that an extension of collaboration between parties in off-site construction would enhance dialogue and debate on ideas and initiative for future work [20], showing that these issues are still present to this day.
These issues highlight the notion of waste and its impact on BIM projects. Ohno [21] was the first to develop a taxonomy of sources of waste. This taxonomy is oriented toward waste in production, with a focus on work and material flows. The notion of taxonomy is used in the model of Knowledge Management (KM) as a means of communicating knowledge [14]. In their paper, Sarayreh et al. [22] explain the SECI model, developed to establish a knowledge transfer process. According to this model, the transfer of knowledge is divided into four processes: Socialization, Externalization, Combination, and Internalization. In the context of this paper, two of these processes are used. The first is Externalization, which proceeds through the use of dialogue, interviews, and workshops. The process is used to transform implicit knowledge into explicit knowledge. The second is Combination which, for its part, is the process of conveying the explicit knowledge into various forms, such as documents, databases, and taxonomies [22].
Koskela et al. [23] identified the need to develop a taxonomy of waste sources specific to construction, as the seven production wastes defined by Ohno do not reflect the specific nature of the production systems of this industry. From this, researchers developed a taxonomy oriented toward the management of construction projects, more suited for the construction industry [24]. This taxonomy focuses on the same types of flows, but adds the human component, as it plays an important role in every step of a construction project, whereas in production, most of the work is automated. Both taxonomies, however, do not take information flows into account. The same can be said of construction waste minimization approaches, techniques and tools, in which case research tends to focus on work and material flow wastes. For example, Liu et al. [25] conducted a literature review on existing waste minimization tools, approaches, and techniques in the construction industry, and how BIM could aid in waste reduction. Their aim was to identify existing BIM practices and tools to help design out waste in construction projects. However, they only focused on material waste. More recently, the same authors developed a BIM-aided construction waste minimization framework based on their literature review [26]. The same observation can be made, as they only focused on material waste when developing their framework. Several other research efforts have come up with ways to reduce waste in construction, such as using a combination BIM/Lean to develop a framework designed to eliminate waste in the design phase [27] or producing a taxonomy of waste based on the TFV theory, with a focus on work and material flows [28]. Dubler, Messner, and Anumba [11] provided an adaptation of Ohno’s seven wastes of production in the information exchange process. However, information exchange is only a small part of the information flow, and the seven wastes of production do not cover all the sources of waste in construction, and especially in terms of information flow. More recently, Issa and Alqurashi [29] proposed a model for evaluating causes of waste depending on Lean implementation in construction projects. The authors provide extensive results, with 42 identified sources of waste, and identify a correlation between the levels of waste and lean implementation levels. Similar to previous research, the focus was made primarily on the work flows, with little mention of the information flows. A different approach was used by Khalesi et al. [30], with a focus on one important consequence of waste that is rework. The authors then identified and categorized all the causes of rework to analyze how BIM technologies could benefit in processing and predicting them. The causes are categorized into seven categories, but there is no category for the production, exchange, and management of information.
There is clearly a gap in the literature regarding waste in the information flow in construction. Indeed, a recent bibliometrics analysis of the literature on BIM revealed that BIM research is mostly distributed in nine fields [31]. The notion of information flow is one of them, but the notion of waste is not mentioned. Another bibliometric analysis revealed that the research on BIM in structural engineering was directed towards information systems and information management between 2013 and 2015, but this is no longer the case [32]. The issue is that, with the implementation of new techniques such as Lean construction or BIM, the amount of information generated in construction has drastically increased and changed information flows. The use of BIM processes, practices, and tools shows potential as information flow is central to BIM implementation.
2.2. BIM Dimensions
BIM plays a bigger and bigger role in construction with every passing day. A systemic review pointed out the increase in adoption of digital technologies such as BIM in off-site construction [33]. The study also indicated a great potential to implement these technologies to improve the construction processes. However, these technologies also mean an increase in the amount of information, and a need to improve information flows. In their paper, Jung and Lee [34] illustrated the status of global BIM adoption from several perspectives. Despite the limited data on hand, the authors managed to show that BIM has been adopted worldwide, with the rate increasing steadily. The evolution of practices and technologies has also contributed to this revolution, particularly with the arrival of the different dimensions of BIM, also called nD modelling [35]. Today, there are five BIM dimensions recognized in the construction industry, namely: BIM 3D (i.e., BEP and LOD), BIM 4D (scheduling), BIM 5D (estimating), BIM 6D (sustainability) and BIM 7D (facility management applications). Other dimensions exist, but are not included in the present research as they are not officially recognized. Regarding information flow and the notion of waste at the 3D level, Eastman et al. [36] dedicate an entire chapter to the exchange of information between different actors without dealing with the concept of waste. The same can be observed in more recent research projects, which provide procedures or guidelines to improve information exchange through the BIM BEP [37,38] or to improve information transfer through BIM LOD [39]. These two recent research studies are based on increasing the level of standardization in BIM projects. The BEP is a report generated to implement BIM on a project that provides formalized protocols respecting the production and exchange of information and the identification of roles and responsibilities [18]. The LOD concept takes the form of a matrix to provide protocols on the number of details injected into the BIM model at any point in the project. It also enables actors to improve the reliability of the models [40].
Regarding BIM 4D and 5D, both are implemented during the design and construction phases of the project, with the goal of ensuring better cost and scheduling controls. Indeed, BIM 4D is a process that allows the planning, scheduling, and sequencing of the construction phase. BIM 5D is the process of adding the cost to the components of the information model. These dimensions can be distinguished from BIM 3D in that they are presented as solutions to problems in information flows. In their research Umar et al. [41] described the impact of BIM 4D on Integrated Project Delivery (IPD). According to the authors, BIM 4D allows to enhance project planning and minimize resource waste, with an improved coordination and final product quality and a time and cost reduction. Moreover, Park et al. [42] presented a database-supported and web-based visualization method allowing the improvement of information exchange of 4D BIM. Their goal was to improve the communication and coordination among stakeholders while reducing information delay and issues with consistency. The same observations can be made regarding the use of BIM 5D in construction projects. Indeed, Vigneault et al. [43] developed an innovative framework of 5D BIM solutions through a systematic review for construction cost management.
Finally, for BIM 6D and BIM 7D, both dimensions are also implemented during the design phase with the goal of ensuring that the construction operation and maintenance phase proceeds smoothly. Indeed, BIM 6D is a set of simulation tools implemented to accurately predict energy consumption requirements, thus ensuring sustainability and cost efficiency. Farzaneh et al. [44] proposed a framework design to create a Building Energy Model (BEM) embedded in the BIM model to be used in the design phase by professionals. The framework would help implement the BIM 6D tools, in addition to providing more information within the BIM models. BIM 7D is an approach designed to track and bring together all information related to the facility management process within the BIM model. Both BIM 6D and BIM 7D are used to optimize the operation and maintenance of a building during its entire life. Tan et al. [45] identified information gaps during the transfer from the construction to the operation and maintenance of the building. For example, the authors identified issues between as-built drawings and actual structures due to modifications made in the designs, creating information gaps. Another gap identified was the lack of availability of the relevant Operation and Maintenance manuals. Through a qualitative research study, the authors proposed the development of an integrated knowledge sharing model to tackle these gaps. As is observed with BIM 6D, this study provides a solution to better implement BIM 7D in construction projects, but also requires the generation of more information within the BIM model. While BIM 4D and 5D use information from the 3D model to operate, BIM 6D and 7D add information to the 3D model to improve it. This is why the focus of this paper is on the BIM 3D, 6D, and 7D dimensions.
2.3. Gaps in Knowledge
Numerous analyses of the literature indicate that BIM has a positive impact on information flow. BIM is a disruptive approach to information production and exchange, in which a shared digital model is used for the creation of building drawings and visualizations. Moreover, BIM also significantly modifies all of the key processes used in a building construction [46]. Furthermore, due to the disruptive approach, there is a lack of knowledge regarding the design process in a BIM project, as it was pointed out by Saoud et al. [47], where the authors developed a method to predict the impacts of change with building information models. Their method provides one way of improving productivity, efficiency, and quality in BIM construction projects.
However, the references studied during this review also identify gaps in knowledge regarding the identification of sources of waste within information flow. Furthermore, the current problem is that the identification of waste is based only on sources identified from the study of work and material flows. Indeed, the sources identified by Ohno [21], with the taxonomy of waste on the management of material flow in production, and the sources identified by Howell, Koskela, Macomber, and Bodek [24], with the taxonomy of waste on the management of work flow in construction project management, do not take into account the sources of waste specific to the information flow. This is explained by the fact that the data studied in both flows are inherently different. In the work flow, the study of sources of waste is based on its activities, and it is its state of fulfillment that predominates, whereas in the information flow, the study of waste is based on the utility and/or value of the information. To respond to this gap, this paper proposes a taxonomy of the sources of waste in the information flows of BIM processes. At this time, there is a significant differential between what is known in theory regarding information flow waste and what is observed in practice. This fact has been discussed in this literature review with the identification of barriers and issues in BIM implementation made by several studies. The taxonomy presented in this paper aims to provide professionals with sufficient knowledge on how to identify issues in the information flows in all their future projects.
3. Methodology
The research design used in this research is based on a collaborative design science research approach influenced by Simon’s arguments for the science of the artificial, where the conclusion of the research would present as a new artefact or technological rules, providing a framework on how a determined objective can be reached [48]. The collaborative component provided a framework, allowing researchers to work closely with the professionals in designing the artefact to contribute to the knowledge and solve practical issues at the same time [49]. It is divided into two phases: firstly, semi-structured interviews to capture BIM practices within the different specialties involved in a BIM project, and secondly, use of the ShareLab approach to validate the sources of waste identified in the BIM information flows.
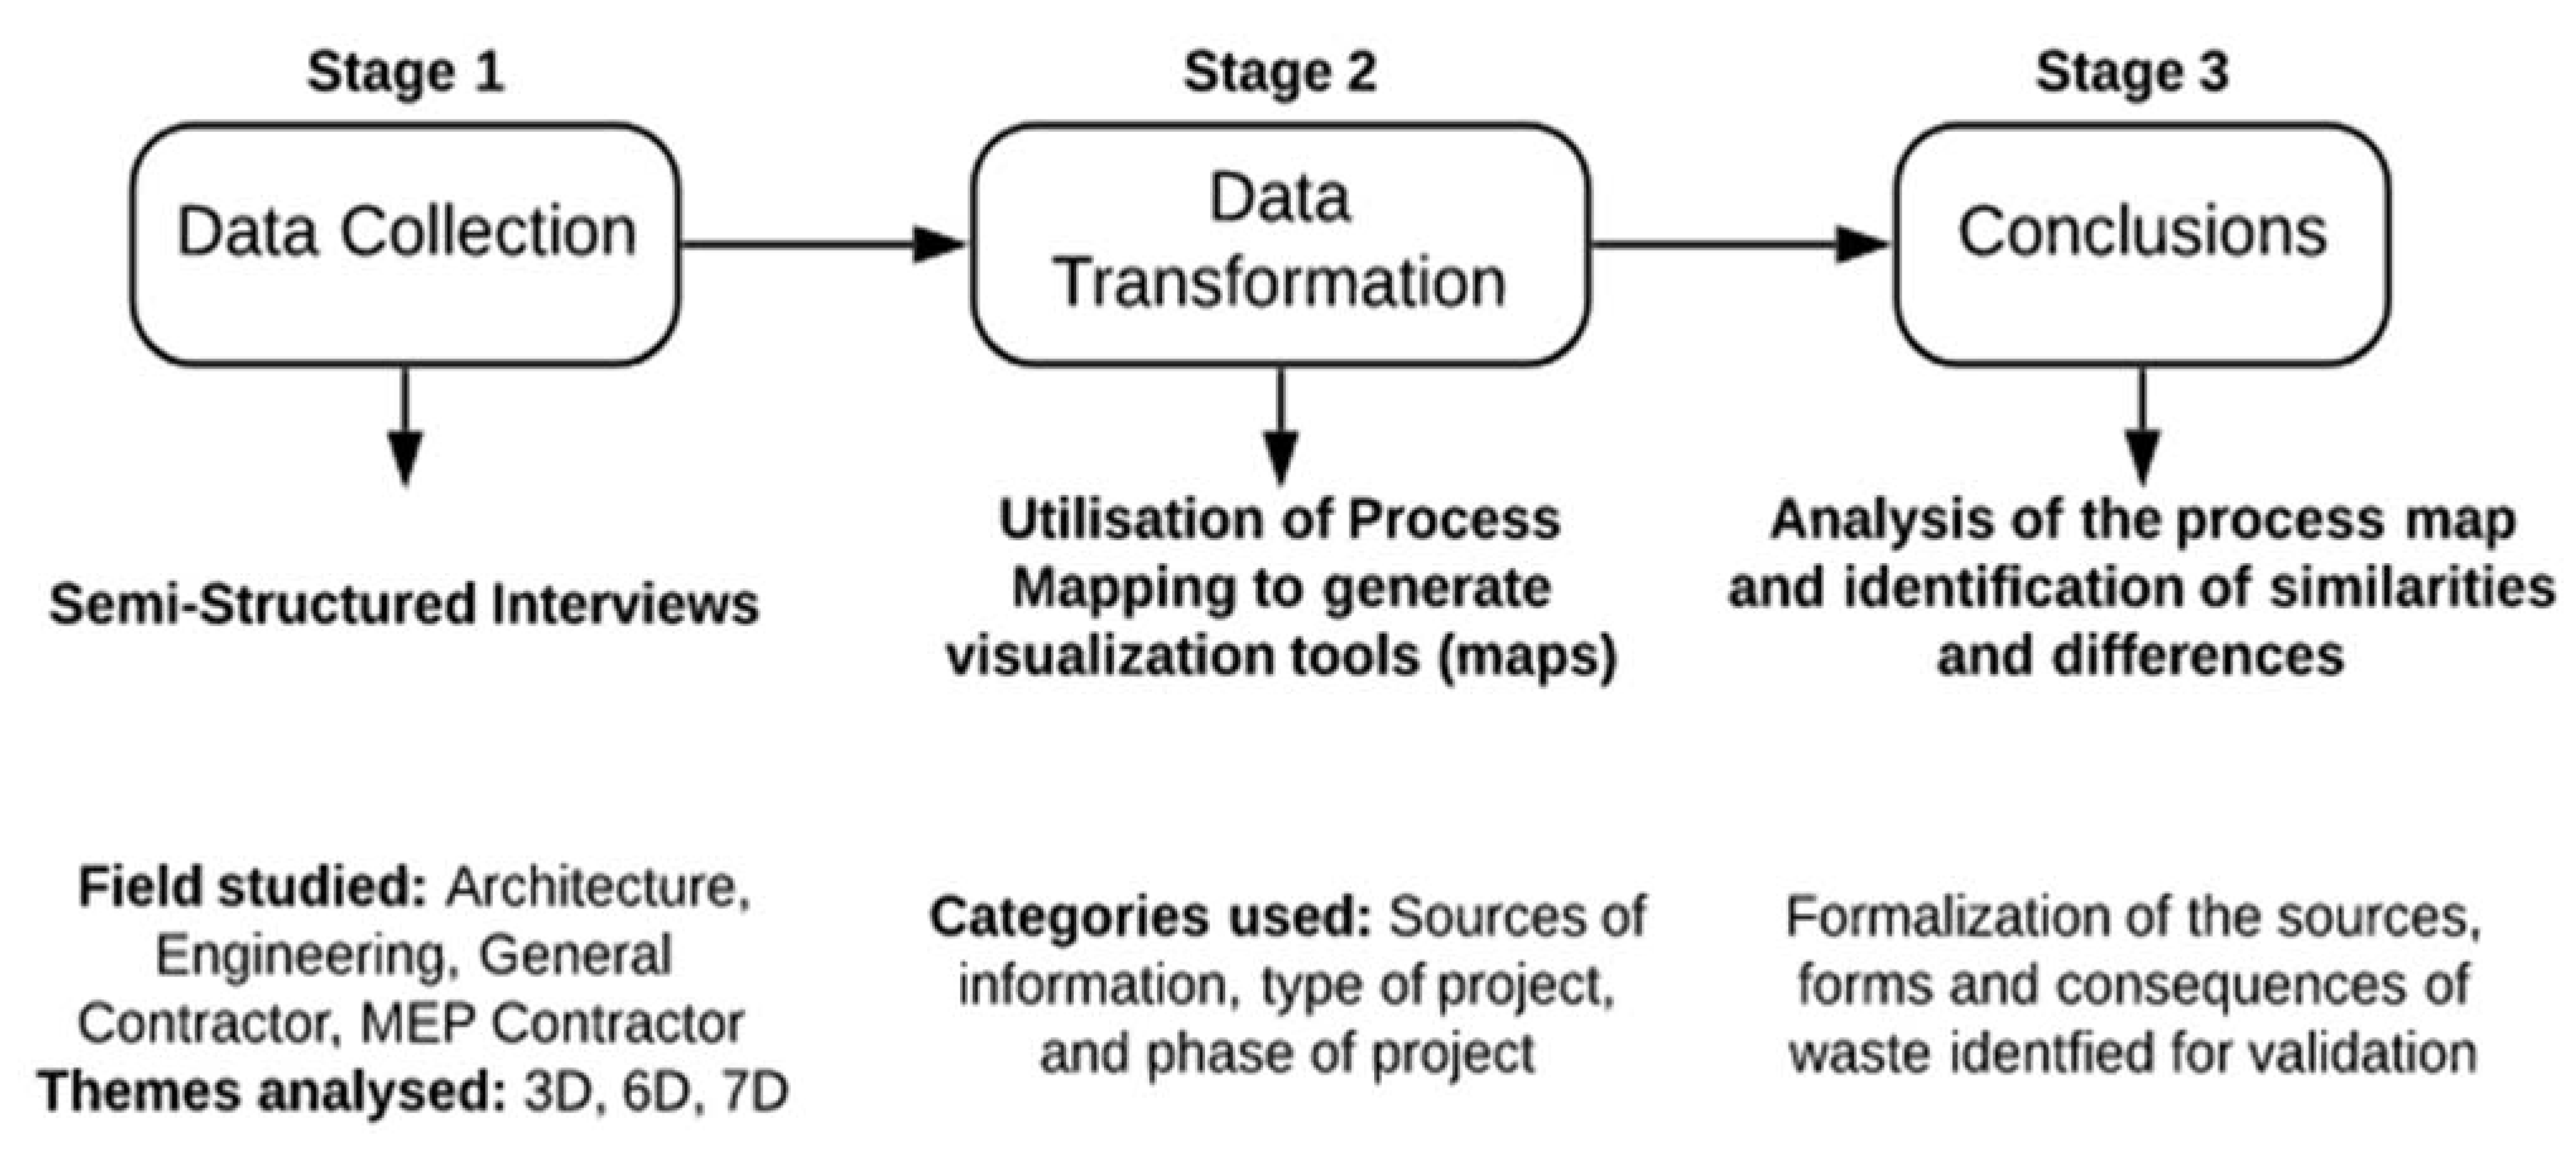
The first phase of the research took place with BIM consultants, one client, and professionals from four different fields of the construction industry (architect, MEP engineer, general contractor, and MEP contractor) and covered their BIM practices, the way they share information, their use and understanding of a BIM execution plan (BEP) and the level of development (LOD), and the issues they encounter with these tools in managing BIM information. This research was part of a larger study around the research theme of improving productivity in the construction industry through the optimization of the production, exchange, and management of information. This allowed access to data from other research studies conducted within the laboratory. First, raw data from semi-structured interviews conducted as part of a research project covering the application of the BEP [50] was used for the 3D BIM dimension. Second, data from a thesis based on developing a BIM–BEM framework to support the design process [51] was used for the 6D BIM dimension. Finally, the last portion of the data used for this research was obtained in part through five one-and-a-half-hour-long semi-structured interviews and, on the other hand, using raw data from semi-structured interviews realized in the context of a Master’s thesis focused on the evaluation of a BIM model’s LOD [52]. Both data from other research and data collected during this research were analyzed following the three stages (Figure 1) proposed by Miles and Huberman [53].
Stage 1—Data collection: In addition to data from other research, semi-structured interviews were used to collect additional data at this stage of the research. Several fields and dimensions were studied to obtain as complete a picture of the information flows in the design and construction processes as possible, as shown in Table 1.
Stage 2—Data transformation: The goal here was to identify contradictions and issues in information flows through the generation of visualization tools in the form of process maps using BPMN notation. Three categories were used during the mapping to aid in the analysis: (1) the source of the information (architects, engineers, general contractors, MEP contractors, BIM consultant, or client); (2) the type of project delivery modes discussed (Design Build or Design Bid Build), as the information flow varies from one mode to another, potentially generating different sources of waste; and (3) the phase of the project (design or construction phase). A process map was generated for each actor, type, and phase of project, for a total of 16 maps. The maps show the work flow between the different actors and the input and output of information for each activity for the design and the construction phases.
Stage 3—Conclusions: The goal of this last stage was to analyze the interviews’ verbatims and the process maps created to identify similarities, differences, and issues between the actors’ processes. This allowed the identification of sources, issues, and consequences of waste in information flows.
For the second phase of the research, a ShareLab was used as a validation process for the artefact created. This approach was devised by the LUCID laboratory. The ShareLab cycle is composed of the following steps: build trust, establish common ground, define shared items, and ensure synchronization [54]. The main interest of the ShareLab approach in this context was to develop a consensus among involved professionals from various fields of the construction industry.
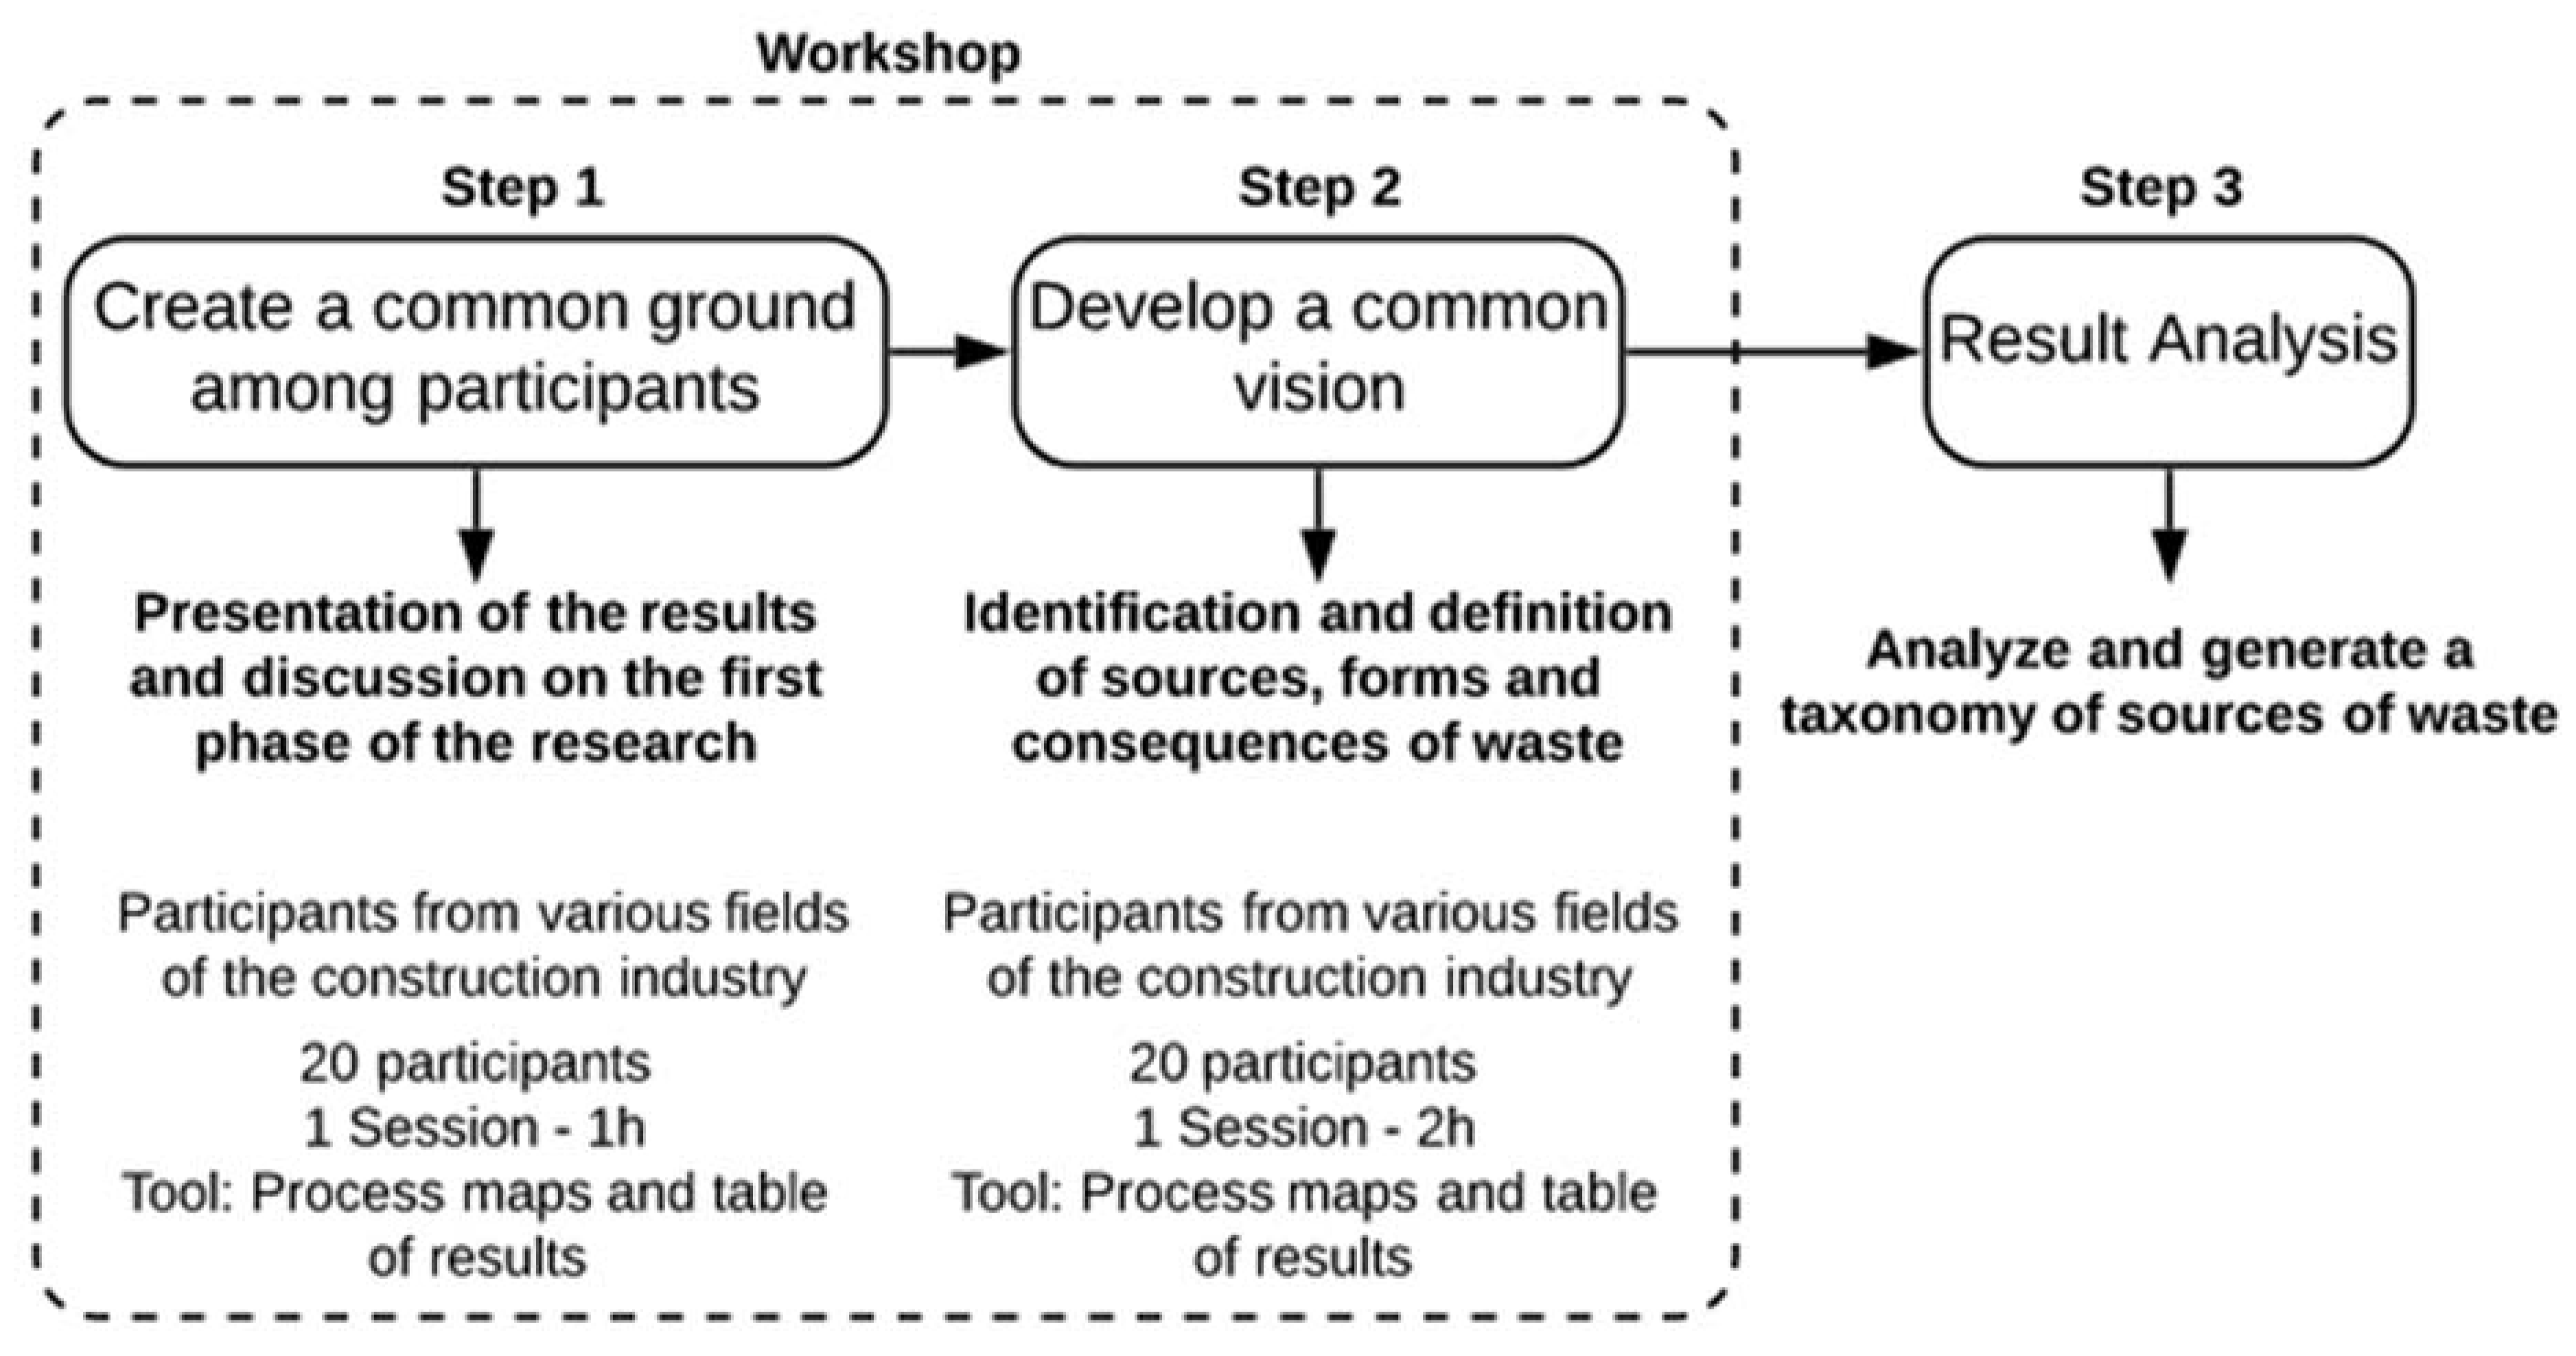
This ShareLab was divided into three steps (Figure 2). A one-day workshop was conducted, and included the first two steps. The visualization through process maps prepared during the first step of the research was used to help build a common ground on the understanding of the BIM information processing and potential sources of waste.
Step 1—Create a common ground among participants: this step consisted of gathering all the participants together to facilitate exchanges and discussions. A presentation of the results, including the process maps generated during the first phase of the research, was given. All the participants present during the workshop took part in the first phase of the research, at one point or another. There was a total of 20 participants, with five architects, five engineers, three general contractors, and seven MEP contractors. The presentation also served as a reminder of the context, scope, and goal of the research. The context of this research was to provide solutions to the need to improve productivity in the construction industry. The scope was focused on one of the needs of the industry, namely, redefining the design rules and methods by developing a framework to optimize the information flows and reduce waste in the production of information. Given the gap identified during the review of this paper and the context, the goal of the ShareLab workshop was to validate a taxonomy of sources of waste, specific to the information flows of construction projects. At the end of the presentation, the participants were given the opportunity to exchange their respective opinions in order to identify similarities between their approaches for managing BIM information, and a consensus was reached among all 20 participants on the goal of the workshop.
Step 2—Develop a common vision: the goal of this step was to identify and define the sources, issues, and consequences of waste. During the workshop, each source, issue, and consequence of waste was validated by the participants. By the end, the sources were ranked in order of importance through the participants’ votes. This two-hour workshop brought together the same participants as the first session.
Step 3—Result Analysis: the goal of this step was to analyze the results and generate a taxonomy of sources of waste in the information flows of construction projects.
These three steps of the ShareLab approach used during this research represent a form of validation of the results. Indeed, according to constructive research theory, a validation can be obtained through the approval and endorsement by professionals of the recommendations and/or conclusions presented [55].
4. Results
The results are divided into two sections. The first section presents the data analysis that allowed the identification of the sources of waste within the information flows. The second section provides the validation of the analysis results with the creation of a taxonomy, using the ShareLab approach.
4.1. Data Analysis
A qualitative data analysis process (first phase of the research) allowed us to create an exhaustive list of waste sources in the information flows of design and construction processes. Table 2 below presents the list of issues identified during the data analysis, as well as the dimensions in which they were identified. These issues were identified through an analysis of the interviews’ verbatims and of the process maps. The analyses also confirmed what is present in the literature, as some of the issues identified are mentioned in separate research works, such as issues with communication, lack of interoperability, resistance to change [18], the lack of coordination [17], or contractual relationships and unclear roles [56]. However, it is important to note that all the issues presented in Table 2 were identified in the data collected during this study, and are not derived from the literature. From these issues, a list of sources was created to provide a concise taxonomy. Some issues were regrouped into a single source of waste due to their strong link with one another. For example, a definition can easily regroup the type of project and contract into one source of waste. Finally, each source was placed in one of three categories of waste: human, process, or technology. A definition of each source is given below.
A total of 21 issues were identified during the data analysis. In terms of their nature, frequency, potential impact and/or link to others, the issues were grouped together within one of the eight sources of waste shown in Table 2. Indeed, some, such as the lack of communication and coordination, were complementary. Others described the same issue, but with a different formulation. Examples include the limitation of the tools and a lack of interoperability. Following the analysis and identification of the sources of waste, a definition was formulated for each source.
Each of the sources was observed in one or more of the BIM dimensions studied during the present research. The eight sources are divided into three categories, namely, (1) Human, (2) Process, and (3) Technology. These three categories were based on the literature and on the fact that, together, they represent the main parts of an organization [57]. These categories help better understand the reasons and the impacts of each source of waste. Furthermore, they are useful for professionals, as they narrow the identification of waste within their own processes. All issues were grouped together during the first phase of the research, and were part of the results presented during the ShareLab for validation.
The “Process” category groups together four sources of waste. First, the type of project and contract has a major influence on waste during information processing. Indeed, depending on the type of project (Design-Build, Design-Bid-Build, Integrated Project Delivery, etc.), the nature of the contract signed will differ. In a Design-Bid-Build or Design-Build project, there is fragmentation of contracts, and as each professional is linked only with the client, as well as the general contractor, information sharing represents a risk, which leads to rework. For example, the sub-contractor must redo the models as the professionals do not want to provide them. Additionally, professionals will produce models to generate 2D plans as this is the format that acts as a contract to document the work to be done and, therefore, the model is not designed to be reused for construction. On the other hand, in an IPD project, a general contract links all actors, thus generating a common need and/or goal for the actors to gather around. The choice of project and contract will influence communication, coordination, the work flow, and the processes. Second, the lack of communication and coordination is, in part, linked to the previous source, as the contract type will greatly influence the relationship between the parties involved. Moreover, the traditional silo working structure in the construction industry tends to limit communication and coordination between the parties involved. Third, the lack of quality control of the processes that can be explained by a lack of specific requirements regarding the identification, definition, and communication of needs. Finally, the lack of standards is linked to a lack of rigor and an absence of work rules. The second category, “Technology”, is composed of only one source of waste, that is, tools limitation. Every year, BIM tools are developed and improved with the goal of optimizing BIM implementation. However, there are still problems of interoperability and a lack of maturity of BIM software. This results in problems with information transfer.
Three sources of waste were associated with the last category, “Human”. First, lack of trust between stakeholders of a same process or project can be explained by several reasons, such as previous bad experiences, or new encounters for which trust needs to be built. Second, resistance to change is linked to a fear of changing habits, of finding oneself in an uncomfortable situation. It also leads to a significant lack of motivation, withdrawal, and a loss of investment. Third, lack of competence and knowledge is in part linked to the previous source, with a resistance to incorporating changes, but it can also be linked to a lack of formation.
The issues identified are discussed in the next section, as they were used during the ShareLab workshop in the waste taxonomy validation process. The section presents the three stages of the ShareLab approach, as well as a discussion of the results obtained.
4.2. Validation of the Taxonomy through Sharelab Approach
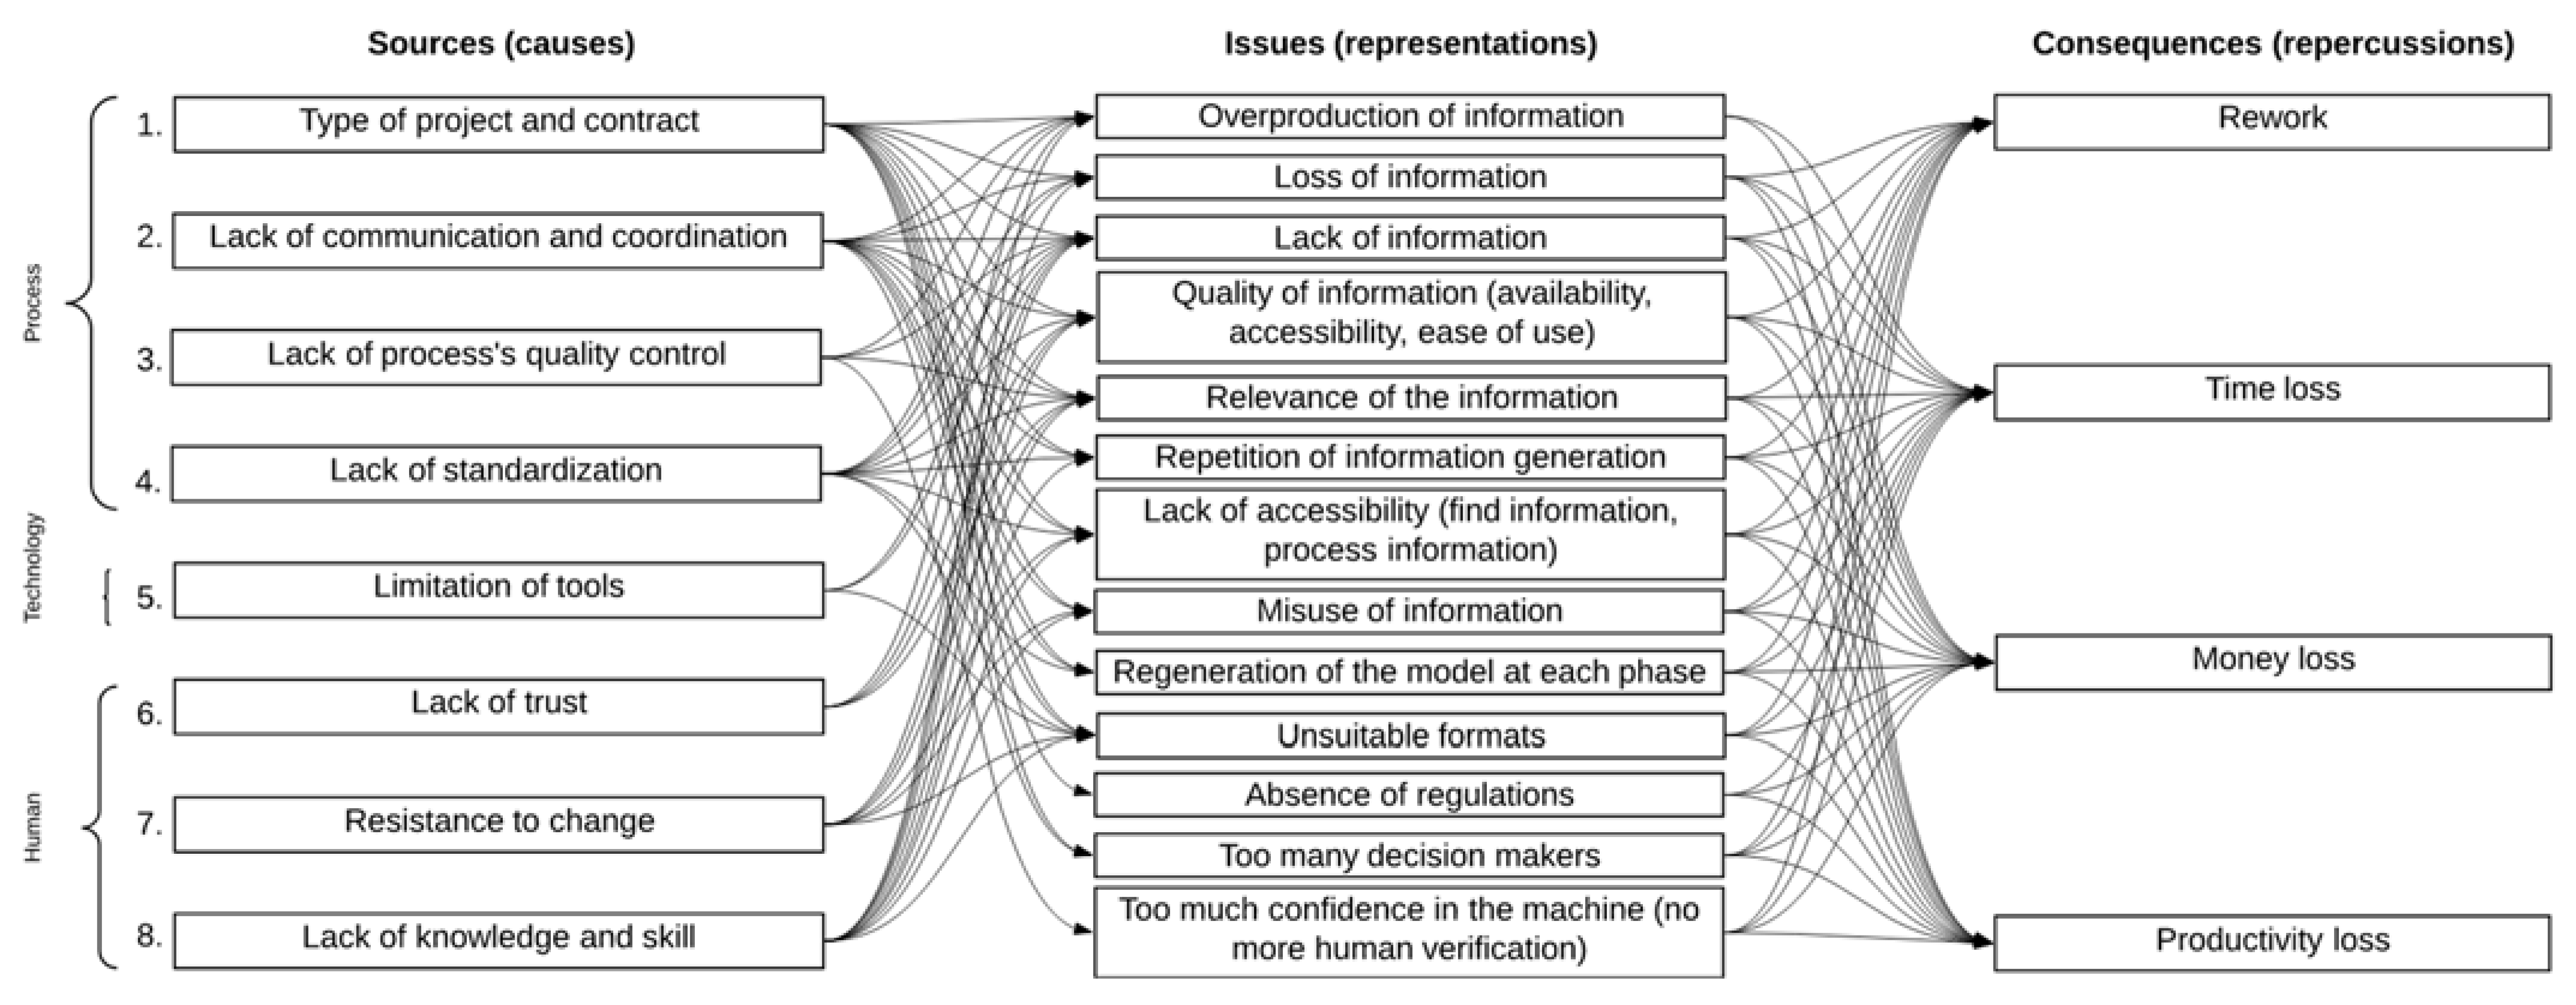
The first step of the workshop allowed us to obtain a consensus on the goal of the workshop among the participants following the presentation of the results and a period of exchange regarding their respective opinions. The second step followed, with the same 20 participants. A presentation of the list of sources, issues, and consequences of waste identified was given. A definition of each source was presented, along with a list of issues and consequences (Figure 3).
Figure 3 shows the links between the sources, issues, and consequences of waste in the information flows. All the links presented in the figure were identified during the analysis of the verbatims of the interviews and/or the process maps generated from the interviews. Indeed, the figure is simply a representation of all the information given, identified, or mentioned by the professional during the data collection stage. Each source is not limited to just one issue; it can be observed that each source can be represented by several issues, and that each issue is not limited to one source. This figure shows that the sources of waste identified are all interconnected. Of course, it is possible to reduce waste by tackling one or several sources. Using the Pareto principle—where 20 percent of the sources are responsible for 80 percent of the waste—and identifying and first tackling the sources with the most impact would decrease the amount of work needed to reduce waste within the information flows.
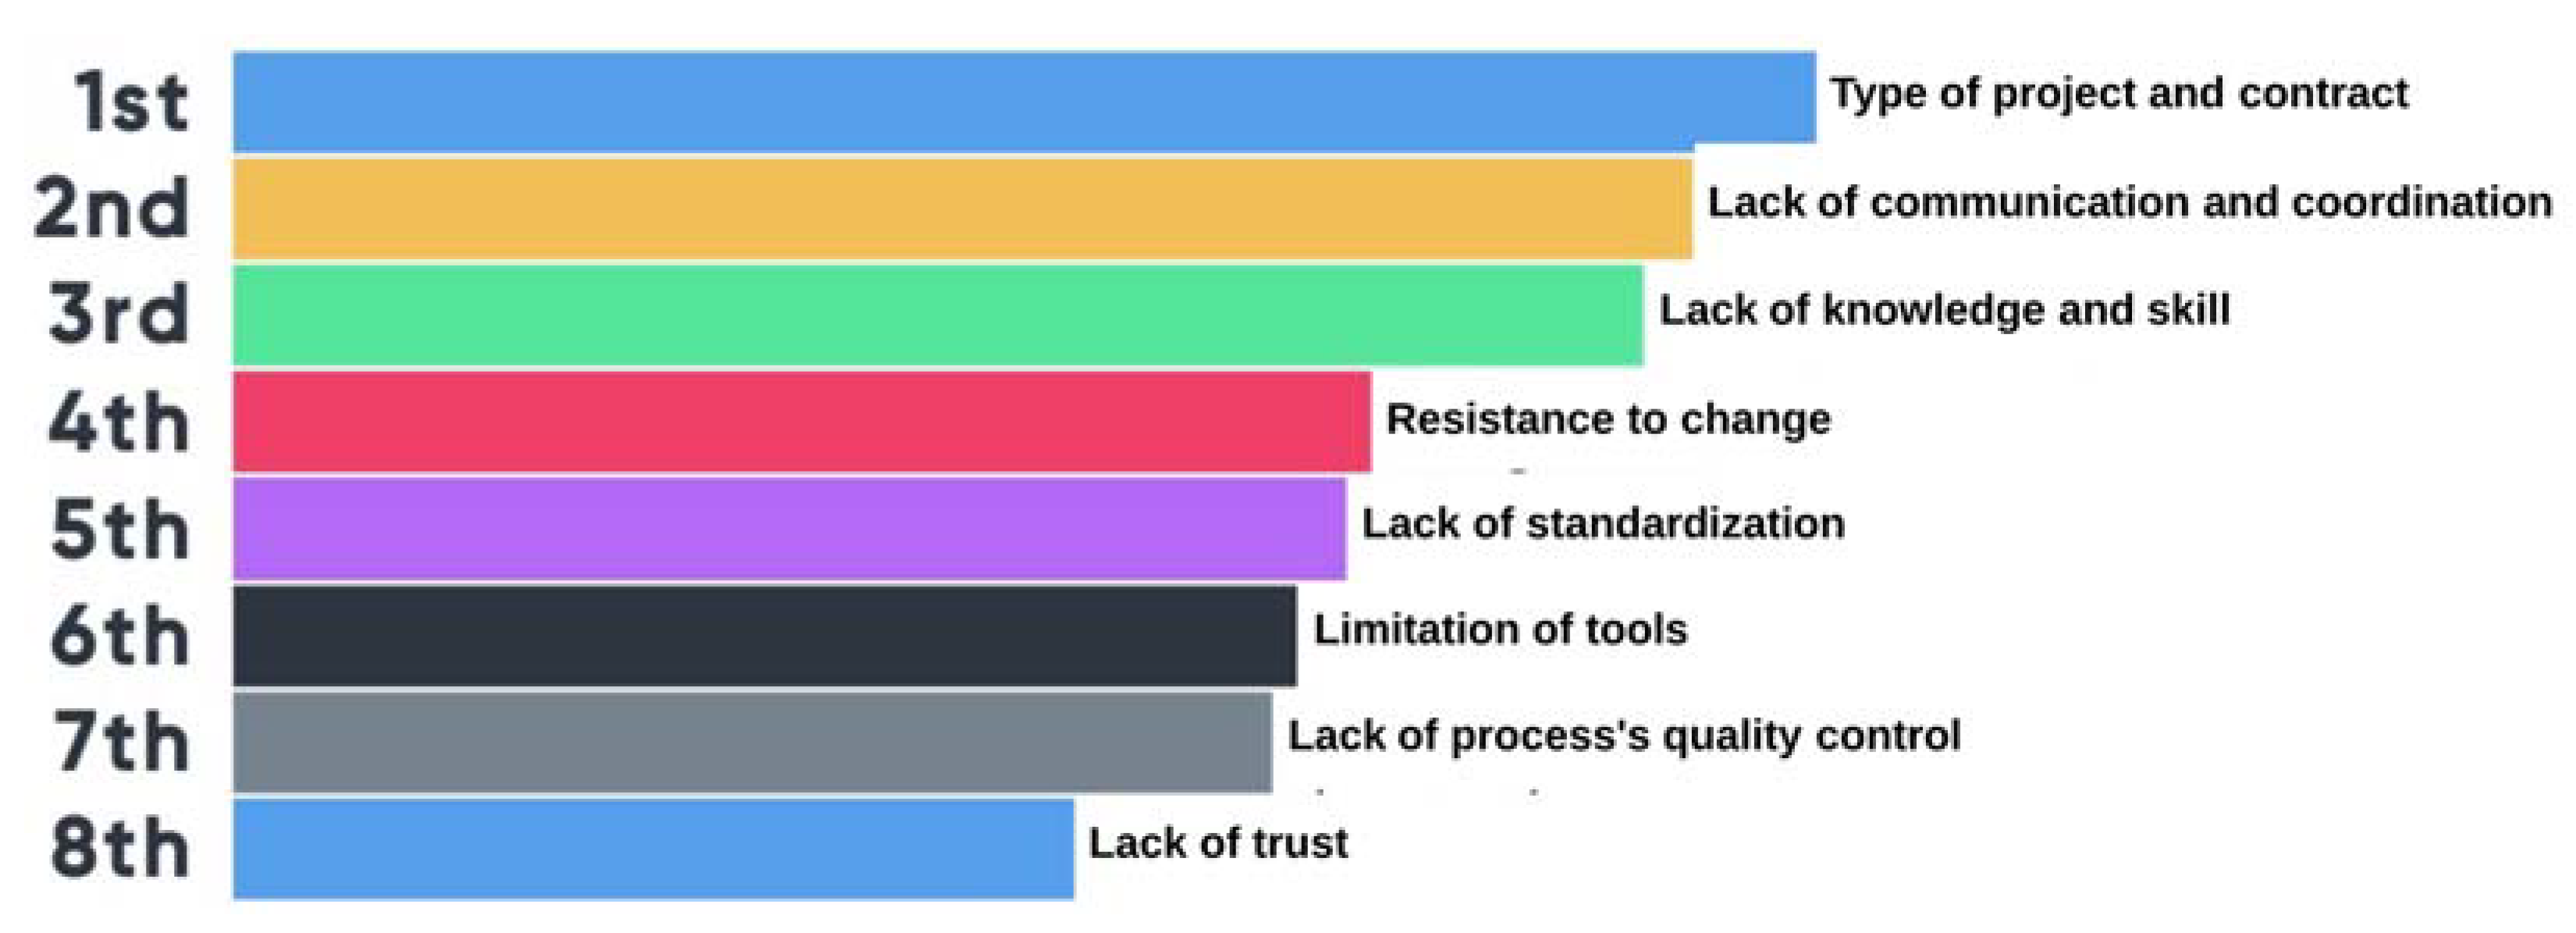
The last item of the workshop was to obtain a consensus among the participants on the results presented. The use of a questionnaire allowed us to validate the eight sources of waste and also ranked them in order of impact on a project according to the professional’s experience (Figure 4). This ranking allows the use of the Pareto principle on the most impactful sources of waste. In this questionnaire, an option was given to the participants to provide additional sources they felt could be part of the taxonomy and how would they be ranked. Four additional sources were proposed by all the participants: commitment from management, motivation, excessive expectations, and too much confidence. However, after further discussion regarding the ranking, there was a consensus that these four propositions needed to be tackled before the start of a project, and could not be classified as sources of waste within the information flows.
This ranking provides vital information to the project and/or BIM manager when working with BIM to identify and eliminate sources of waste from their information flows. Indeed, the lack of time and/or resources does not always allow the project or BIM manager to tackle each source of waste within a project. With this ranking, the focus can be put on the most impactful sources of waste first. With more and more projects being carried out focusing on reducing waste, the BIM manager will be better able to tackle the sources of waste with a lower impact.
5. Discussion
Taxonomies have long been used for sources of waste in the production and construction industries. Tools, techniques, taxonomies, and approaches mostly focus on improving work and material flows. This discussion carries out a comparison of the proposed taxonomy with the one developed by Dubler, Messner, and Anumba [11], which is adapted from the manufacturing to the information exchange process in construction. Table 3 below provides a list of the sources of waste for both taxonomies. A major difference between the two is that the proposed taxonomy was developed specifically for the information flows in construction projects, whereas the other was adapted from waste identified more than 30 years ago for material flows in the manufacturing industry. Indeed, over the last 30 years, new tools, technologies, and approaches have been developed, and the amount of information in projects has increased drastically.
In their adaptation, Dubler, Messner, and Anumba [11] adapted each source of waste from the manufacturing industry to the information exchange process in construction. Comparing each adapted source of waste with those from the proposed taxonomy of this paper, it can be seen that the latter considers each of the adapted sources, and also provides two new ones. The following paragraph provides the meaning of the adaptation for each source of waste to the construction industry.
The overproduction source was transformed to producing more information than required and doing revisions to the model after release. This source is linked to four out of the eight sources of waste in the proposed taxonomy (1, 2, 5, and 7). The inventory source was converted to an early delivery of information and using Push instead of Pull—also meaning using what is provided. This source is linked to three out of the eight sources of waste in the proposed taxonomy (1, 2, and 5). The extra processing steps source was changed to generating a high level of details than necessary. This source is linked to four out of the eight sources of waste in the proposed taxonomy (1, 2, 5, and 7). The motion source was modified to not using a central location to share the model and transferring more often than necessary. This source is linked to three out of the eight sources of waste in the proposed taxonomy (1, 2, and 5). The defects source was adapted to providing inaccurate or wrong information. This source is linked to three out of the eight sources of waste in the proposed taxonomy (2, 5, and 7). The waiting source was converted to waiting for the delivery of information. This source is linked to three out of the eight sources of waste in the proposed taxonomy (1, 2, and 5). Finally, the transportation source was adapted to issues in transfer of information, with an unsuitable format and version. This source is linked to two out of the eight sources of waste in the proposed taxonomy (5 and 6).
This research brings novelty to the field with the creation of this taxonomy, as there was no existing taxonomy focusing on waste in the information flows. There is still a limited understanding of the waste in the production and exchange of information in the AEC industry, while the management of information has received much less attention than the management of the work and material flows. In addition to the taxonomy proposed by Dubler, Messner, and Anumba [11] and discussed in this section, Bajjou et al. [58] proposed, more recently, an adaptation of the seven wastes from Ohno [21]. However, this attempt does not focus on the information flows.
Regarding the solution aspect to the presence of waste in the information flows. There are currently several potential solutions in the form of tools, approaches or techniques that can be used to remove waste. However, a solution can only be implemented on an identified issue. Indeed, a few studies can be found in the literature with propositions of approaches to reduce waste in the information flows. Tribelsky and Sacks [59] proposed to collect quantitative data on sources of waste to evaluate the quality of information flows. However, qualitative data is absent in this proposition while it plays a major role with information flows. Al Hattab and Hamzeh [60] compared traditional and BIM-based information flows in design phases in an attempt to improve the information flow in BIM processes, but only focused on one source of waste which was issues in sharing information. Lastly, Dubler, Messner, and Anumba [11], as discussed in this section adapted the seven wastes from production to construction to improve the information flows of construction. However, their study did not consider the human dimension as a source of waste. Each study found in the literature on the subject lacks a complete picture of waste within the information flows. The proposed taxonomy is useful, as it provides a description, identification, and classification of the sources of waste present within the information flows, as well as a better understanding of these flows in construction projects.
6. Conclusions
The main contribution of this paper is the creation of a taxonomy of waste sources specific to information flows. The combination of data collected from several research studies conducted in the GRIDD laboratory provided a large database, allowing a more complete analysis. In addition, the perspectives of the different actors present in construction projects was gathered, in addition to a study of several BIM dimensions. Another way the paper contributes to knowledge is through its use of the ShareLab approach as a validation tool. This approach provides a new way to validate an artefact in a Design Science Research method. At the practical level, this paper’s main contribution is its provision of a defined frame allowing professionals to identify sources of waste within the information flows in construction projects. The use of this taxonomy is optimal when associated with a visualization tool such as Value Stream Mapping or Process Mapping. This tool in turn helps professionals reduce rework and work time, and financial and productivity losses.
The presence of waste in construction is a widespread issue which impacts all of the actors and the phases in a construction project. Given the ever-growing importance of information in construction, particularly in BIM projects, there is need for optimized information flows to tackle the related waste issues. Extensive research has been conducted, involving work and material flows in construction, with tools and approaches developed to improve them. A taxonomy of seven sources of waste was created more than forty years ago to tackle waste in the manufacturing industry. A few years ago, this was adapted to tackle waste in the construction industry, with a total of 10 sources. However, these taxonomies are not adapted to the waste found in the information flows.
The taxonomy developed in this research comprises a total of eight sources of waste. Three of them are linked to the human element: (1) lack of trust, (2) resistance to change, and (3) lack of knowledge and skill. Four sources are linked to the process: (4) type of project and contract, (5) lack of communication and coordination, (6) lack of process’s quality control, and (7) lack of standardization. Finally, one is linked to technology: (8) limitation of tools. The use of a ShareLab approach allowed a validation of the findings with the participation of 20 professionals from various backgrounds. Through exchanges and discussions, the eight sources of waste identified were accepted via a consensus and ranked in order of impact on BIM projects. This research also demonstrated that all sources of waste are linked, and must be tackled as a whole.
The main conclusion that can be drawn after comparing both taxonomies in the discussion section is that the proposed taxonomy provides a new category of waste that was not considered in the previous one. Indeed, as mentioned in the results section, three categories represent the main parts of an organization, namely, human, process, and technology. However, as shown in the comparison presented, no waste source in the existing taxonomy considers the human category. This can be explained by the fact that the sources of waste were first identified in the manufacturing industry, where the human category is less crucial than in the construction industry. Moreover, each source of the proposed taxonomy provides more information than does the existing one, as each of them covers more issues than the existing ones.
There are some limitations associated with this research. The data collected and the results generated are all linked to the construction industry in the region of Quebec, Canada. This means that the findings may be different in another country, due to different practices. Moreover, the constant evolution of the AEC industry, and the new construction projects starting every day, can generate potential new data to expand this taxonomy as all construction projects are different and can generate unique cases and new issues.
It has been demonstrated in several research studies that all flows in construction projects are interrelated. In the future, research can be conducted to combine existing taxonomies of waste from other flows with the one created here to help reduce global waste in construction projects. Moreover, future research can focus on developing or identifying solutions for each source of waste in this taxonomy.
Author Contributions
Conceptualization, M.M. and J.M.; methodology, M.M. and J.M.; writing–original draft, M.M.; writing–review, M.M. and D.F. and C.O.-P. All authors have read and agreed to the published version of the manuscript.
Funding
This research was financially supported by the National Sciences and Engineering Research Council.
Institutional Review Board Statement
Not applicable.
Informed Consent Statement
Not applicable.
Data Availability Statement
The data are available on request from the corresponding author.
Acknowledgments
The authors would like to thank the National Sciences and Engineering Research Council which financially supported this project.
Conflicts of Interest
The authors declare no conflict of interest.
References
- Eadie, R.; Odeyinka, H.; Browne, M.; McKeown, C.; Yohanis, M. Building Information Modelling Adoption: An Analysis of the Barriers to Implementation. J. Eng. Archit. 2014, 2, 77–101. [Google Scholar]
- Penttilä, H. Early architectural design and BIM. In Computer-Aided Architectural Design Futures (CAADFutures); Springer: Dordrecht, The Netherlands, 2007; pp. 291–302. [Google Scholar]
- Succar, B. Building information modelling framework: A research and delivery foundation for industry stakeholders. Autom. Constr. 2009, 18, 357–375. [Google Scholar] [CrossRef]
- Messner, J.; Anumba, C.; Dubler, C.; Goodman, S.; Kasprzak, C.; Kreider, R.; Leicht, R.; Saluja, C.; Zikic, N. BIM Project Execution Planning Guide (v. 2.2); The Computer Integrated Construction Research Program (CIC), Penn State University: State College, PA, USA, 2019. [Google Scholar]
- Charef, R.; Alaka, H.; Emmitt, S. Beyond the third dimension of BIM: A systematic review of literature and assessment of professional views. J. Build. Eng. 2018, 19, 242–257. [Google Scholar] [CrossRef]
- Olivieri, H.; Seppänen, O.; Granja, A.D. Improving workflow and resource usage in construction schedules through location-based management system (LBMS). Constr. Manag. Econ. 2018, 36, 109–124. [Google Scholar] [CrossRef] [Green Version]
- Heigermoser, D.; de Soto, B.G.; Abbott, E.L.S.; Chua, D.K.H. BIM-based Last Planner System tool for improving construction project management. Autom. Constr. 2019, 104, 246–254. [Google Scholar] [CrossRef]
- Turner, D.A.; Williams, I.D.; Kemp, S. Combined material flow analysis and life cycle assessment as a support tool for solid waste management decision making. J. Clean. Prod. 2016, 129, 234–248. [Google Scholar] [CrossRef] [Green Version]
- Vilaysouk, X.; Schandl, H.; Murakam, S. A comprehensive material flow account for Lao PDR to inform environmental and sustainability policy. J. Ind. Ecol. 2019, 23, 649–662. [Google Scholar] [CrossRef]
- Turk, Z. Construction IT: Definition, Framework and Research Issues; Faculty of Civil and Geodetic Engineering: Ljubljana, Slovenia, 2000; pp. 17–32. [Google Scholar]
- Dubler, C.R.; Messner, J.I.; Anumba, C.J. Using Lean Theory to Identify Waste Associated with Information Exchanges on a Building Project. In Construction Research Congress 2010: Innovation for Reshaping Construction Practice; ASCE: Reston, VA, USA, 2010; pp. 708–716. [Google Scholar]
- Mirarchi, C.; Pasini, D.; Pavan, A.; Daniotti, B. Automated IFC-Based Processes in the construction sector: A Method for Improving the information Flow. In Proceedings of the LC3 2017: Volume I—Proceedings of the Joint Conference on Computing in Construction (JC3), Heraklion, Greece, 4–7 July 2017; pp. 491–498. [Google Scholar]
- Gallaher, M.P.; O’Connor, A.C.; Dettbarn, J.L.J.; Gilday, L.T. Cost Analysis of Inadequate Interoperability in the U.S. Capital Facilities Industry; National Institute of Standards and Technology (NIST): Gaithersburg, MD, USA, 2004. [Google Scholar]
- Ein-Dor, P. Taxonomie of knowledge. In Encyclopedia of Knowledge Management, 2nd ed.; IGI Global: Hershey, PA, USA, 2011; pp. 1490–1499. [Google Scholar]
- Woo, S.E.; O’Boyle, E.H.; Spector, P.E. Best practices in developing, conducting, and evaluating inductive research. Hum. Resour. Manag. Rev. 2017, 27, 255–264. [Google Scholar] [CrossRef]
- Solaimani, S.; Van Der Veen, J.; Sobek II, D.K.; Gulyaz, E.; Venugopal, V. On the application of Lean principles and practices to innovation management a systematic review. TQM J. 2019, 31. [Google Scholar] [CrossRef]
- Zhang, R.; Liu, A.M.M.; Chan, I.Y.S. Effects of Quality and Quantity of Information Processing on Design Coordination Performance. World J. Eng. Technol. 2018, 6, 41–49. [Google Scholar] [CrossRef] [Green Version]
- Michaud, M.; Forgues, E.-C.; Carignan, V.; Forgues, D.; Ouellet-Plamondon, C. A lean approach to optimize BIM information flow using value stream mapping. J. Inf. Technol. Constr. 2019, 24, 472–488. [Google Scholar] [CrossRef]
- Forgues, E.-C.; Carignan, V.; Forgues, D.; Rajeb, S.B. A framework for improving collaboration patterns in BIM projects. In International Conference on Cooperative Design, Visualization and Engineering; Springer: Berlin/Heidelberg, Germany, 2016; pp. 34–42. [Google Scholar]
- Hosseini, M.R.; Martek, I.; Zavadskas, E.K.; Aibinu, A.A.; Arashpour, M.; Chileshe, N. Critical evaluation of off-site construction research: A Scientometric analysis. Autom. Constr. 2018, 87, 235–247. [Google Scholar] [CrossRef]
- Ohno, T. Toyota Production System: Beyond Large-Scale Production; Productivity Press: New York, NY, USA, 1988. [Google Scholar]
- Sarayreh, B.; Mardawi, A.; Aldmour, R. Comparative study: The Nonaka model of knowledge management. Int. J. Eng. Adv. Technol. 2012, 1, 45–48. [Google Scholar]
- Koskela, L.; Bolviken, T.; Rooke, J. Which are the wastes of construction? In Proceedings of the IGLC-21, Fortazela, Brazil, 31 July–2 August 2013; pp. 3–12. [Google Scholar]
- Emond, C. SlideShare—L’AgiLean (Agile + Lean) à la Rescousse de tous nos Projets (Publics et Autres). Available online: https://fr.slideshare.net/claudee/gp-qubec2014agi-leance (accessed on 15 February 2015).
- Liu, Z.; Osmani, M.; Demian, P.; Baldwin, A.N. The potential use of BIM to aid construction waste minimalisation. In Proceedings of the CIB W78-W102, Sophia Antipolis, France, 26–28 October 2011. [Google Scholar]
- Liu, Z.; Osmani, M.; Demian, P.; Baldwin, A. A BIM-aided construction waste minimisation framework. Autom. Constr. 2015, 59, 1–23. [Google Scholar] [CrossRef] [Green Version]
- Mollasalehi, S.; Fleming, A.; Talebi, S.; Underwood, J. Development of an Experimental Waste Framework Based on Bim/Lean Concept in Construction Design. In Proceedings of the 24th Annual Conference of the International Group for Lean Construction, Boston, MA, USA, 20–22 July 2016; pp. 193–202. [Google Scholar]
- Bolviken, T.; Rooke, J.; Koskela, L. The waste of production in construction—A TFV based taxonomy. In Proceedings of the IGLC-22, Oslo, Norway, 25–27 June 2014; pp. 811–822. [Google Scholar]
- Issa, U.H.; Alqurashi, M. A Model for Evaluating Causes of Wastes and Lean Implementation in Construction Projects. J. Civ. Eng. Manag. 2020, 26, 331–342. [Google Scholar] [CrossRef] [Green Version]
- Khalesi, H.; Balali, A.; Valipour, A.; Antucheviciene, J.; Migilinskas, D.; Zigmund, V. Application of Hybrid SWARA–BIM in Reducing Reworks of Building Construction Projects from the Perspective of Time. Sustainability 2020, 12, 8927. [Google Scholar] [CrossRef]
- Wen, Q.-J.; Ren, Z.-J.; Lu, H.; Wu, J.-F. The progress and trend of BIM research: A bibliometrics-based visualization analysis. Autom. Constr. 2021, 124, 103558. [Google Scholar] [CrossRef]
- Vilutiene, T.; Kalibatiene, D.; Hosseini, M.R.; Pellicer, E.; Zavadskas, E.K. Building Information Modeling (BIM) for Structural Engineering: A Bibliometric Analysis of the Literature. Adv. Civ. Eng. 2019, 2019. [Google Scholar] [CrossRef]
- Wang, M.; Wang, C.C.; Sepasgozar, S.; Zlatanova, S. A Systematic Review of Digital Technology Adoption in Off-Site Construction: Current Status and Future Direction towards Industry 4.0. Buildings 2020, 10, 204. [Google Scholar] [CrossRef]
- Jung, W.; Lee, G. The Status of BIM Adoption on Six Continents. Int. J. Civil Environ. Eng. 2015, 9, 521–526. [Google Scholar]
- Azhar, S.; Khalfan, M.; Maqsood, T. Building Information Modeling (BIM): Now and Beyond. Aust. J. Constr. Econ. Build. 2012, 12, 15–28. [Google Scholar]
- Eastman, C.; Teicholz, P.; Sacks, R.; Liston, K. BIM Handbook: A Guide to Building Information Modeling for Owners, Managers, Designers, Engineers and Contractors, 2nd ed.; John Wiley & Sons: Hoboken, NJ, USA, 2011. [Google Scholar]
- Gerçek, B. BIM Execution Process of Construction Companies for Building Projects; Izmir Institute of Technology: Urla, İzmir, Turkey, 2016. [Google Scholar]
- Hadzaman, N.A.H.; Takim, R.; Fadhil, A.-H.N.M. An exploratory study: Building information modelling execution plan (BEP) procedure in mega construction projects. Malays. Constr. Res. J. 2016, 18, 29–40. [Google Scholar]
- Wu, Y.; Xu, N. BIM Information Collaborative Framework Based on Supply Chain Management. In Proceedings of the ICCREM 2014: Smart Construction and Management in the Context of New Technology, Kunming, China, 27–28 September 2014; pp. 199–207. [Google Scholar]
- Latiffi, A.A.; Brahim, J.; Mohd, S.; Fathi, M.S. Building Information Modeling (BIM): Exploring Level of Development (LOD) in Construction Projects. Appl. Mech. Mater. 2015, 773–774, 933–937. [Google Scholar] [CrossRef] [Green Version]
- Umar, U.A.; Shafiq, N.; Malakahmad, A.; Nurudin, M.F.; Khamidi, M.F.; Farhan, S.A.; Gardezi, S.S.S. 4D BIM application in AEC industry: Impact on integrated project delivery. Res. J. Appl. Sci. Eng. Technol. 2015, 10, 547–552. [Google Scholar] [CrossRef]
- Park, J.; Cai, H.; Dunston, P.S.; Ghasemkhani, H. Database-Supported and Web-Based Visualization for Daily 4D BIM. J. Constr. Eng. Manag. 2017, 143, 04017078. [Google Scholar] [CrossRef]
- Vigneault, M.-A.; Boton, C.; Chong, H.-Y.; Cooper-Cooke, B. An Innovative Framework of 5D BIM Solutions for Construction Cost Management: A Systematic Review. Arch. Comput. Methods Eng. 2020, 27, 1013–1030. [Google Scholar] [CrossRef]
- Farzaneh, A.; Carriere, J.; Forgues, D.; Monfet, D. Framework for Using Building Information Modeling to Create a Building Energy Model. J. Archit. Eng. 2018, 24, 05018001. [Google Scholar] [CrossRef]
- Tan, A.Z.T.; Zaman, A.; Sutrisna, M. Enabling an effective knowledge and information flow between the phases of building construction and facilities management. Facilities 2018, 36, 151–170. [Google Scholar] [CrossRef] [Green Version]
- Sacks, R.; Eastman, C.; Lee, G.; Teicholz, P. BIM Handbook: A Guide to Building Information Modeling for Owners, Managers, Designers, Engineers and Contractors, 3rd ed.; John Wiley & Sons: Hoboken, NJ, USA, 2018. [Google Scholar]
- Saoud, L.A.; Omran, J.; Hassan, B.; Vilutiene, T.; Kiaulakis, A. A Method to Predict Change Propagation Within Building Information Model. J. Civ. Eng. Manag. 2017, 23, 836–846. [Google Scholar] [CrossRef]
- Koskela, L. Why is management research irrelevant? Constr. Manag. Econ. 2017, 35, 4–23. [Google Scholar] [CrossRef]
- Otto, B.; Österle, H. Principles for Knowledge Creation in Collaborative Design Science Research. In Proceedings of the Thrity Third International Conference on Information Systems, Orlando, FL, USA, 16–19 December 2012; pp. 1–16. [Google Scholar]
- Quenneville, M.-Y. Application et Efficacité du Plan de Gestion BIM (PGB) pour la Construction d’un Centre Hospitalier de Grande Envergure au Québec; École de Technologie Supérieure: Montreal, QC, Canada, 2019. [Google Scholar]
- Farzaneh, A. Development of BIM-BEM Framework to Support the Design Process; École de Technlogie Supérieure: Montreal, QC, Canada, 2019. [Google Scholar]
- Marchioni, V. Évaluation du Niveau de Développement des Maquettes Numériques du BIM Pour les Entrepreneurs Spécialisés de la Construction au Québec; École de Technologie Supérieure: Montreal, QC, Canada, 2018. [Google Scholar]
- Miles, M.B.; Huberman, A.M. Analyse des Données Qualitatives; De Boeck: Brussels, Belgium, 2003. [Google Scholar]
- Ben Rajeb, S.; Senciuc, A.; Pluchinotta, I. ShareLab, Support for Collective Intelligence. 1 Deadline, 11 Designers, 1 Project. In Proceedings of the COLLA’15, 5th International Conference on Advanced Collaborative Networks, Systems and Applications, St. Julians, Malta, 11–16 October 2015; pp. 27–33. [Google Scholar]
- Lukka, K. The Key Issues of Applying the Constructive Approach to Field Research. In Management Expertise for the New Millennium; Reponen, T., Ed.; Publications of the Turku School of Economics, Series A-1; University of Turku: Turku, Finland, 2000; pp. 113–128. [Google Scholar]
- Fan, S.-L.; Chong, H.-Y.; Liao, P.-C.; Lee, C.-Y. Latent Provisions for Building Information Modeling (BIM) Contracts: A Social Network Analysis Approach. KSCE J. Civ. Eng. 2019, 23, 1427–1435. [Google Scholar] [CrossRef] [Green Version]
- Koskela, L.; Dave, B. Process and IT (Editorial). Constr. Innov. 2008, 8, 244–249. [Google Scholar] [CrossRef] [Green Version]
- Bajjou, M.S.; Chafi, A.; En-Nadi, A. A comparative study between lean construction and the traditional production system. Int. J. Eng. Res. Afr. 2017, 29, 118–132. [Google Scholar] [CrossRef]
- Tribelsky, E.; Sacks, R. An Empirical Study of Information Flows in Multidisciplinary Civil Engineering Design Teams using Lean Measures. Archit. Eng. Des. Manag. 2011, 7, 85–101. [Google Scholar] [CrossRef]
- Al Hattab, M.; Hamzeh, F. Information Flow Comparison Between Traditional and BIM-Based Projects in the Design Phase. In Proceedings of the 21st Annual Conference of the International Group for Lean Construction, Fortaleze, Brazil, 31 July–2 August 2013; pp. 761–770. [Google Scholar]
Figure 1.
Stages of qualitative data analysis.

Figure 2.
Steps of the ShareLab approach.

Figure 3.
Link between sources, issues and consequences of waste in information flows.

Figure 4.
Ranking of the sources of waste validated in order of impact.


Table 1.
Sources of data and data collection.
| Stakeholders | Roles | Dimensions Studied | Sources of Data |
|---|---|---|---|
| BIM consultant | BIM Consultant | BEP | Semi-structured interviews’ verbatims [50] |
| General Contractor | BIM Manager | ||
| Engineering | BIM Manager | ||
| Architecture | BIM Manager | ||
| Client | Client Representative | ||
| BIM Consultant | BIM/BEM Consultant | BIM/BEM 6D | [51] |
| Architecture | Project Manager | BEP/LOD and Facility Management | Semi-structured interviews’ verbatims [52] + Semi-structured interviews |
| Architect | |||
| Engineering | Project Manager | ||
| General Contractor | Project Manager | ||
| MEP Contractor | Project/BIM Manager |
Table 2.
Sources of waste identified in the information flows through data analysis.
| LOD | BEP | 6D | 7D | Issues Identified (Data Analysis) | Sources of Waste | Category |
|---|---|---|---|---|---|---|
| X | X | X | X | Type of project | Type of project and contract | Process |
| X | X | X | X | Type of contract | ||
| X | X | X | Lack of communication | Lack of communication and coordination | ||
| X | X | X | Lack of coordination | |||
| X | X | Unclear role | ||||
| X | X | Undefined responsibilities | ||||
| X | X | X | Semantics and language | |||
| X | X | Lack of collaboration | ||||
| X | X | X | X | Lack of control quality processes | Lack of control quality processes | |
| X | X | X | X | Lack of standards | Lack of standards | |
| X | X | Data presentation | ||||
| X | X | X | Organization | |||
| X | X | X | X | Limitation of tools | Limitation of tools | Technology |
| X | X | Lack of interoperability | ||||
| X | X | X | Technical issues (software) | |||
| X | X | X | Lack of trust | Lack of trust | Human | |
| X | X | X | X | Resistance to change | Resistance to change | |
| X | X | Blinder | ||||
| X | X | Lack of motivation | ||||
| X | X | X | X | Lack of competence | Lack of competence and knowledge | |
| X | X | X | X | Lack of knowledge |
Table 3.
Comparison of taxonomies.
| Proposed Taxonomy of Sources of Waste in the Information Flow | Taxonomy Adapted from Ohno [11,21] |
|---|---|
| 1. Type of project and contract | 1. Overproduction |
| 2. Lack of communication and coordination | 2. Inventory |
| 3. Lack of knowledge and skills | 3. Extra processing steps |
| 4. Resistance to change | 4. Motion |
| 5. Lack of standardization | 5. Defects |
| 6. Limitation of tools | 6. Waiting |
| 7. Lack of process’s quality control | 7. Transportation |
| 8. Lack of trust |
Publisher’s Note: MDPI stays neutral with regard to jurisdictional claims in published maps and institutional affiliations. |
© 2021 by the authors. Licensee MDPI, Basel, Switzerland. This article is an open access article distributed under the terms and conditions of the Creative Commons Attribution (CC BY) license (https://creativecommons.org/licenses/by/4.0/).
Share and Cite
MDPI and ACS Style
Michaud, M.; Meyer, J.; Forgues, D.; Ouellet-Plamondon, C. A Taxonomy of Sources of Waste in BIM Information Flows. Buildings 2021, 11, 291. https://0-doi-org.brum.beds.ac.uk/10.3390/buildings11070291
AMA Style
Michaud M, Meyer J, Forgues D, Ouellet-Plamondon C. A Taxonomy of Sources of Waste in BIM Information Flows. Buildings. 2021; 11(7):291. https://0-doi-org.brum.beds.ac.uk/10.3390/buildings11070291
Chicago/Turabian StyleMichaud, Martin, Julien Meyer, Daniel Forgues, and Claudiane Ouellet-Plamondon. 2021. "A Taxonomy of Sources of Waste in BIM Information Flows" Buildings 11, no. 7: 291. https://0-doi-org.brum.beds.ac.uk/10.3390/buildings11070291
Note that from the first issue of 2016, this journal uses article numbers instead of page numbers. See further details here.