
Simplified Approach for Seismic Performance Assessment of Dry-Joint Masonry Arch Bridges


1
Department of Civil Engineering, Middle East Technical University, Ankara 06800, Turkey
2
Department of Civil Engineering, Hacettepe University, Ankara 06800, Turkey
*
Author to whom correspondence should be addressed.
Buildings 2021, 11(7), 313; https://0-doi-org.brum.beds.ac.uk/10.3390/buildings11070313
Submission received: 11 June 2021
/
Revised: 6 July 2021
/
Accepted: 13 July 2021
/
Published: 20 July 2021
(This article belongs to the Section Building Structures)
Abstract
:The seismic performance assessment of dry-joint masonry arches is challenging because of their unique structural characteristics. Widely used assessment methods developed for frame-type structures require the use of a material-dependent section response. In contrast, the response of a dry-joint arch is not dependent on the material capacity but characterized by the sustainment of stability, primarily depending on rigid body rotation or sliding motion at the interfaces between the adjacent voussoirs. A hybrid methodology, combining a simple finite element micro model with principles of limit analysis method, is proposed in this work for the seismic performance assessment of these structures. The nonlinearity is concentrated at interfaces of the model by means of shear and compression-only axial springs. Kinematic conditions yielding a possible collapse mechanism were traced at every step of the time history analysis by checking the failure of individual interfaces. The procedure is applied to an ancient dry-joint Roman arch bridge in close proximity to the North Anatolian fault subject to significant seismic risk. Along with the performance of the system in its current state, the effects of retrofitting measures were investigated in the scope of this study.
1. Introduction
Spanning rivers and valleys via bridges made only of cut-stones remains one of the most fascinating achievements of civil engineering practice dating back 2000 years. Using natural stones from the earth, cutting them into a wedge shape and arranging these into an arch form have proven to be a robust and solid technique using axial compression as the primary load-carrying mechanism. Considering the typical economic life of recently built bridges and the maintenance requirements throughout their service, one can better perceive the perfection of the simplicity of dry-joint stone masonry bridges standing thousands of years without maintenance. Many such bridges are still in service in Europe, the United Kingdom, and the Middle East.
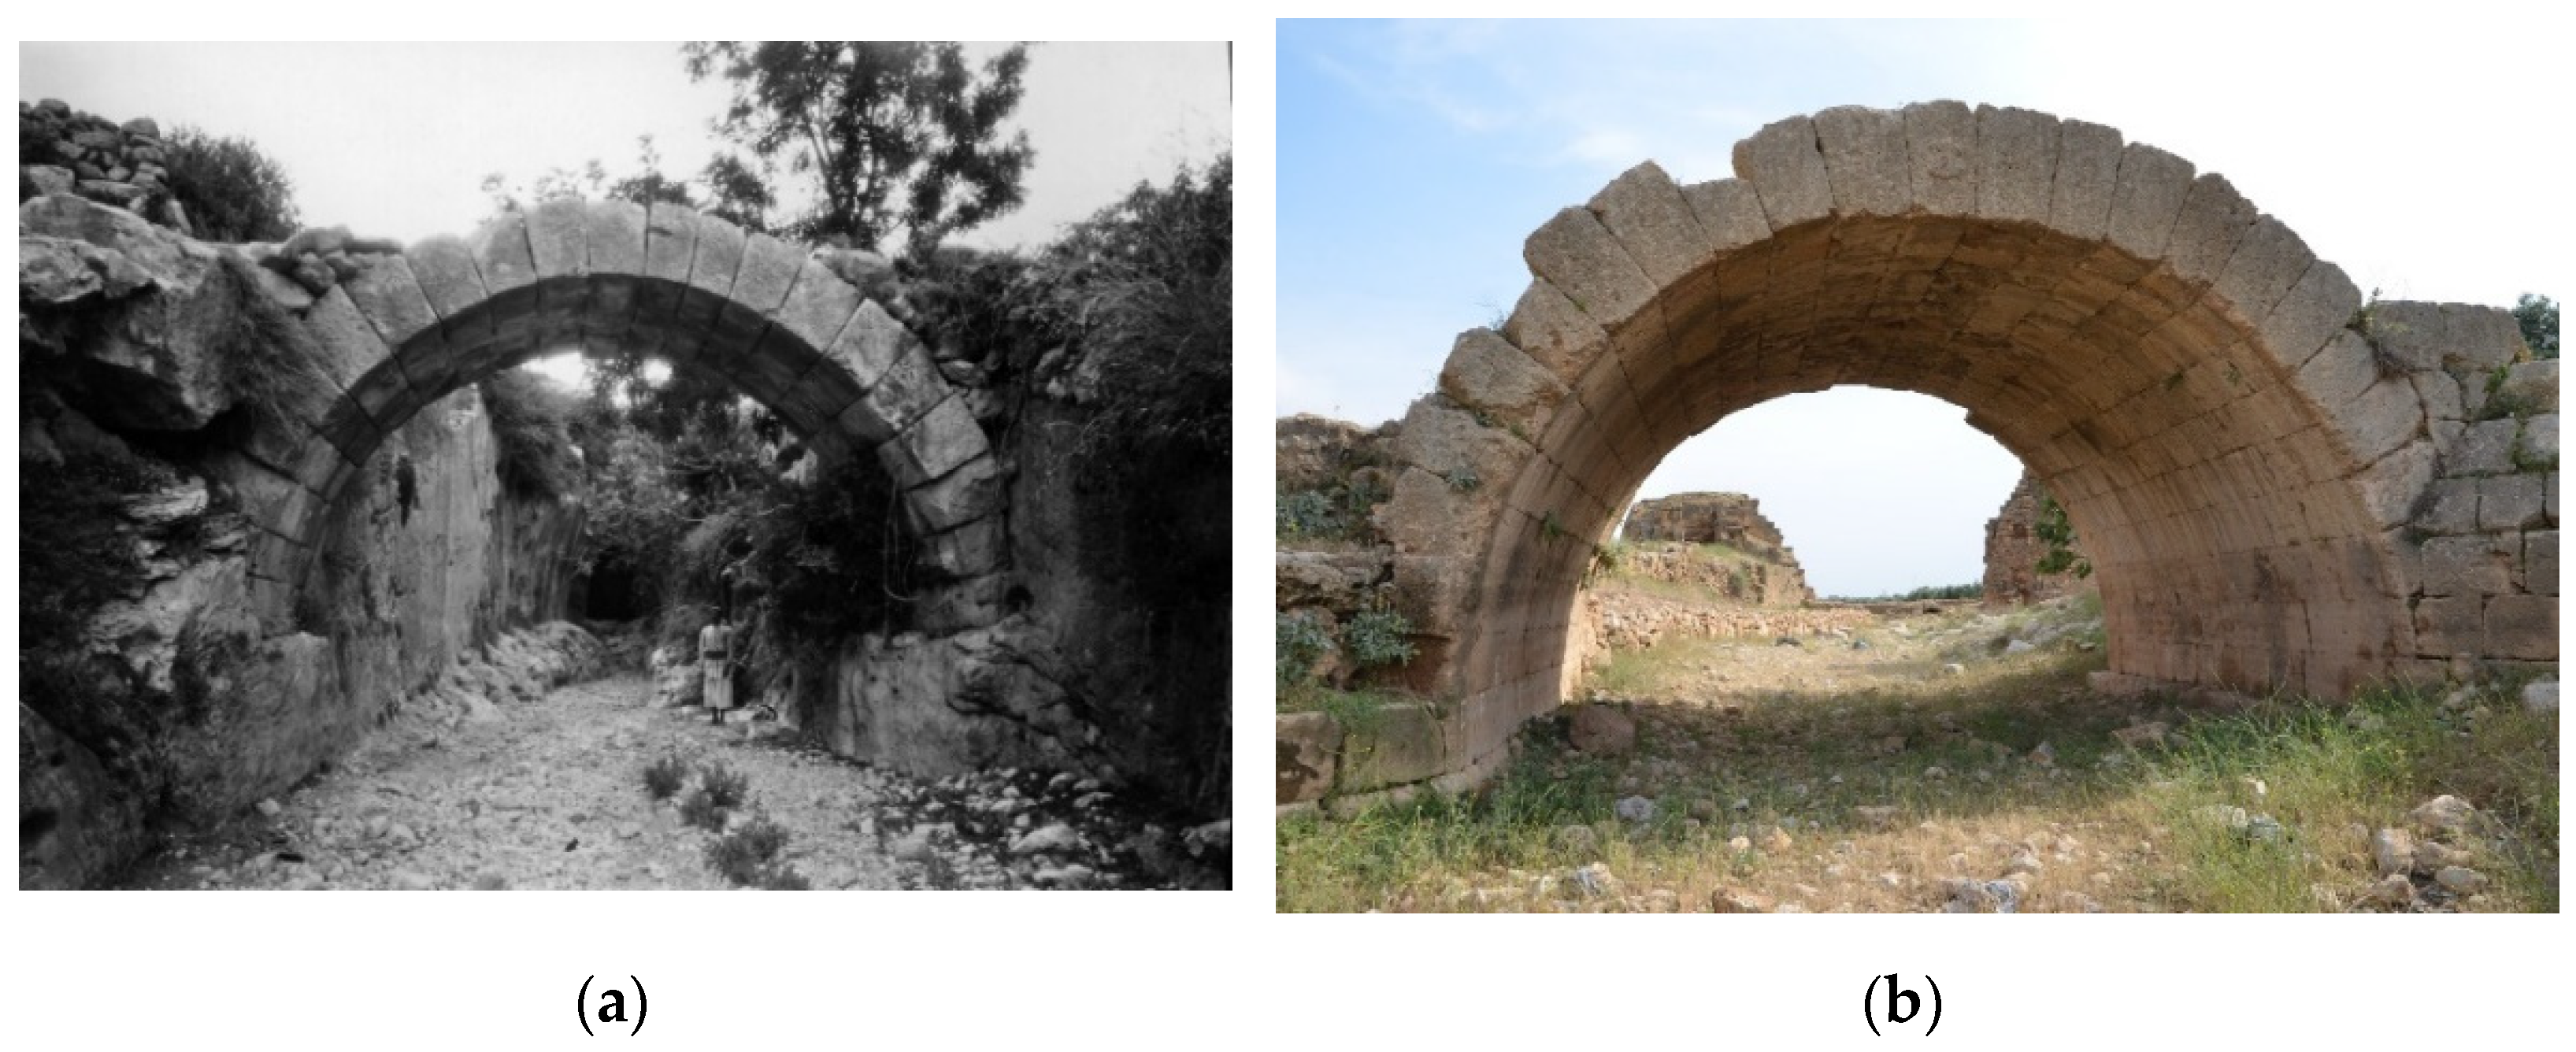
Turkey has a rich cultural heritage in historical construction as Anatolia hosted many different civilizations throughout history. A total of 1646 historical bridges attributed to the Hittites (1), the Romans (128), the Byzantines (22), the Seljuks (150), the Ottoman Empire (1280), and the early Turkish Republic (64) were documented in Turkey (numbers in parentheses indicate bridges associated to each civilization) [1]. Two examples of dry-joint masonry bridges in Turkey built during the Roman and Byzantine eras are illustrated in Figure 1. Abandoned for an extensive period, many of these require proper restoration and retrofitting operations to preserve their shape and function [2]. These structures are also subject to seismic risk significant in the Anatolian peninsula [3]. Consequently, proper restoration and retrofitting for these structures is compulsory in order to avoid loss of cultural heritage. The difficulties in the rehabilitation of these monuments have led to the development of guidelines for the assessment and retrofit of these structures [4].
Dry-joint arches are characterized by rigid stone block units separated by distinctive no-tension interfaces where the plastic rotations and translations are concentrated. Thus, the numerical models required for analysis should reflect the unique behavior of these structures. The limit analysis method is one of the most reliable methods because it provides the failure mechanisms and the associated collapse loads beyond the elastic limit. However, the limit analysis method lacks a detailed description of seismic effect. The seismic safety of the dry-joint arch is simply performed by comparing the expected peak ground acceleration (PGA) with the acceleration value necessary to form a mechanism [5]. In this study, a practical finite element model composed of elastic shell elements and no-tension springs is developed to simulate the seismic behavior of dry-joint masonry bridges with backfills combining time history analysis with the limit analysis method. The formation of possible failure mechanisms was evaluated during time history analysis by performing eccentricity and sliding checks at interfaces investigating rotational hinge formation and rigid body sliding.
The method mentioned above is applied to determine the seismic safety of a dry-joint Roman masonry arch bridge (i.e., the Prusias ad Hypium bridge) in this study. The subject system has been preserved with only minor deteriorations that do not endanger its safety under gravity loads. However, the bridge is located in an active seismic zone; the expected PGA under design-level earthquake with a 475-year return period is defined as 0.56 g in the recent Turkish building earthquake code [6]. A 2D analytical model of the bridge was created to assess the seismic safety of the bridge, assuming plane stress conditions. The voussoirs making up the bridge were modeled with elastic shell elements following the laser scanning survey, while the interaction among masonry elements and the masonry-backfill was represented by compression-only axial and shear springs. The seismic performance of the system was assessed for the existing system, followed by the evaluation of the retrofitted counterpart.
2. Details of Numerical Modeling Technique
Dry-joint arches have unique structural characteristics. The voussoirs are rigid members whose equilibrium is satisfied through contact forces with the adjacent blocks. The thrust between stone blocks due to the arching effect and the corresponding friction forces are the main components maintaining the structural stability; the interfaces between blocks are unable to transfer tensile forces. Typically, the stresses in stone masonry bridges are only a tiny fraction of the material capacity; failure under eccentric loading conditions is often due to the disturbance of the arch form through rotation and sliding at the interfaces rather than a lack of material strength [7]. According to Heyman’s theorem [8], the collapse occurs when a thrust line, representing the path of the compressive force resultants, cannot be drawn within the arch boundaries. A rotational hinge is formed when the thrust line is tangent to the arch’s intrados or extrados. The progressive formation of a fourth hinge transforms the stable arch into an unstable collapse mechanism [9].
The load capacity of these types of structures is traditionally calculated by the limit analysis method [10]. The limit analysis method has been implemented in open-code [11] and commercial [12] software in order to calculate the ultimate load capacities of masonry arch bridges. Nevertheless, neither the dynamic load can be effectively idealized or practically applied, similar to the gravity loading while using the limit analysis method for seismic loads. The evaluation of the capacity of the arch to the horizontal loads requires estimating the collapse mechanism and determining the ground acceleration that activates this mechanism [13], which requires some experience and professional judgment. Numerical procedures relying on iterative methods to identify the collapse mechanisms of arch bridges were proposed by different researchers for this regard [14,15]. Alternatively, sophisticated numerical models demanding a careful characterization of the material are required to simulate seismic behavior more efficiently. Discrete element modeling [16,17,18,19,20,21], finite element macro modeling [22], and finite element micro modeling [23] are versatile tools utilized for the nonlinear dynamic and static analysis of masonry arch bridges [24]. Researchers apply zero-thickness line interfaces in finite element micro-modeling and point-contact elements for discrete element modeling approaches. Therefore, the interaction between the elements is defined as variants of contact elements [19]. Although these modeling approaches were proven to be good alternatives, they are not practical due to their computational cost and dependence on material characterization. Therefore, a different outlook is required to put the complex analysis formulations and the simple finite element analysis techniques together.
The literature on the numerical modelling of dry-joint masonry arch bridges generally concentrated on the simulations under vertical effects or support movements [25,26,27,28,29,30]. Furthermore, the current state-of-the-art numerical modelling of dry-joint masonry arch bridges is mainly dependent on some special contact elements and modified constitutive laws to incorporate the large displacement effects [25,26]. Compared to the ultimate load capacity determination of masonry arch bridges under vertical loading, the seismic assessment is a more complicated task involving uncertainties related to seismic demand and structural response. Therefore, the seismic assessment of these types of structures generally requires mentioned advanced modeling techniques. However, simplified methodologies enable engineers to use customary analysis tools to solve complicated problems [31]. A detailed comparison of advantages and shortcomings of assessment methods requiring simple and complicated numerical models was illustrated by Sarhosis et al. [32].
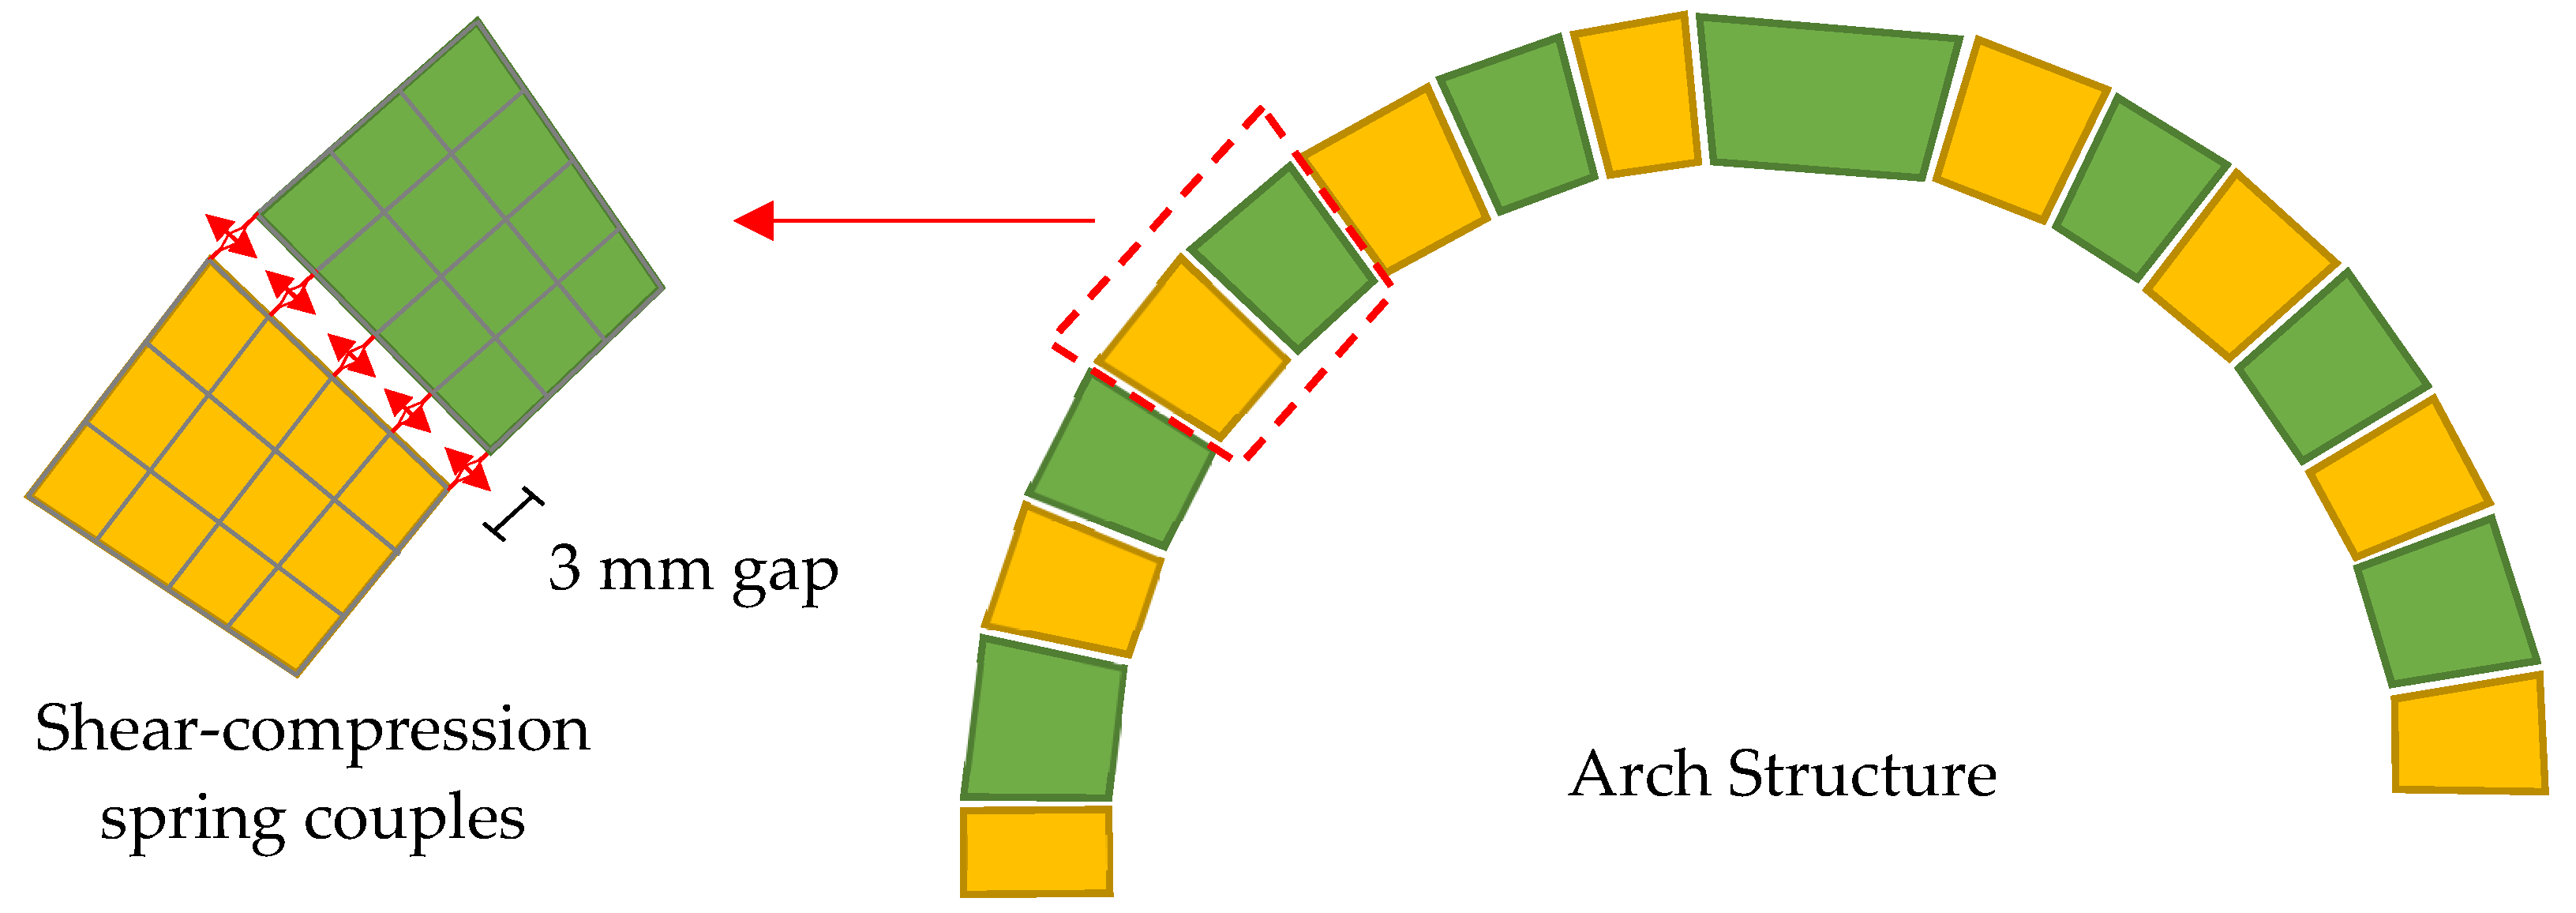
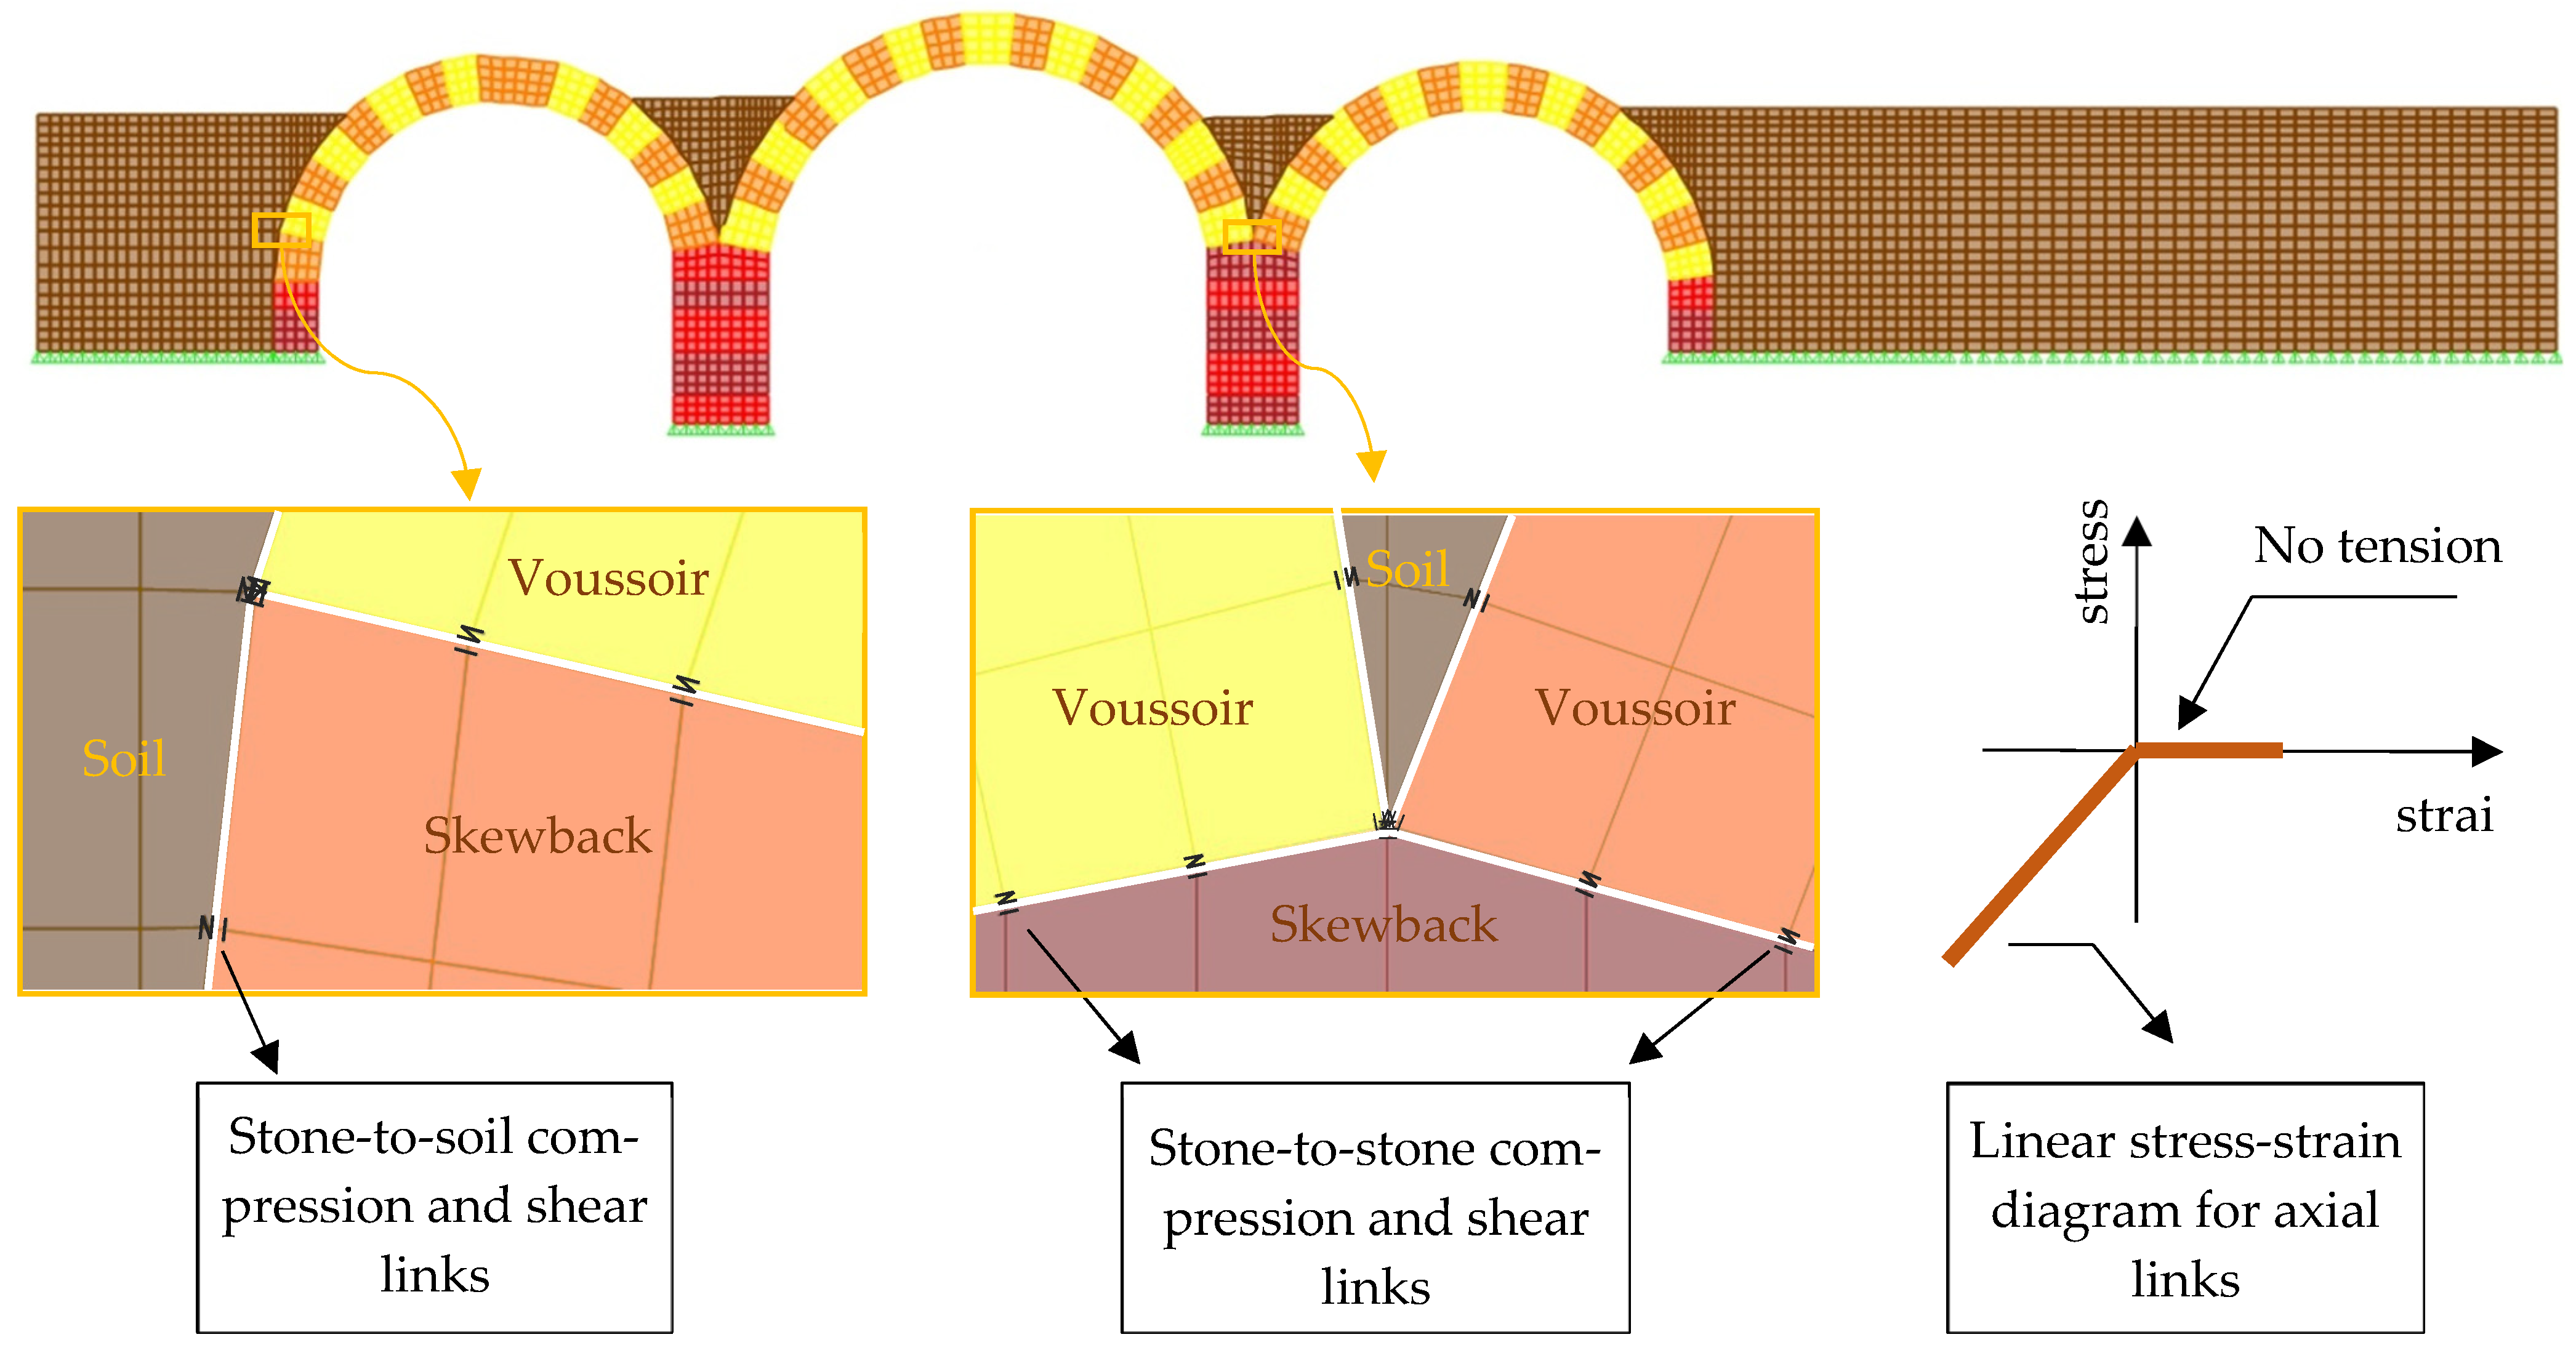
A hybrid methodology incorporating the finite element method and the limit analysis method is proposed in this study. The simplicity of the modeling technique allows the use of commercial software for modelling using elastic shell elements for the stone blocks. The possible unstable behavior of the interface between stone-to-stone and stone-to-soil joints is simulated by utilizing compression-only axial and shear hinges perpendicular and parallel to the interface axis, respectively (Figure 2). The shell elements are meshed using a reasonable mesh size, resulting in four elements and five shear-compression spring couples in the arch’s thickness. The stone blocks were separated with 3 mm gaps (interface thickness). The stiffness constants for stone-to-stone and stone-to-soil springs were used in accordance with the proposed values for dry-stone masonry arch bridges [33,34]. The 2D modelling approach utilized in this study is deemed appropriate for most cases except skewed geometries and 3D non-symmetric loading conditions [35]. The presence of spandrels was neglected, disregarding their positive contribution and staying on the conservative side.
While performing the time history analysis, the stability of each interface should be checked at every step. To this end, sliding and hinging failures were checked as limit state criteria in the proposed modeling technique.
Criterion 1—Sliding failure: The adjacent stones start to slide with respect to each other once the shear demand at the interface exceeds the friction resistance provided by the axial load. The Coulomb friction coefficient for a specific interface is calculated by dividing the sum of shear forces on the shear springs by the sum of axial loads on the axial springs located on a specific interface. A threshold is assigned for friction coefficient (i.e., µlimit = 0.60), and each interface is checked throughout the time history analysis using Equation (1).
Criterion 2—Hinging: A rotational hinge is formed if the eccentricity on any interface reaches the limiting value (elimit) of 0.5 (Equation (2)). This criterion ensures that the thrust line is tangent to the arch’s intrados or extrados, indicating the formation of a plastic hinge. Practically, it implies that four out of five axial links at an interface have zero axial load due to no tension condition, and that compressive force is transferred through the fifth link located at the intrados or the extrados of the arch.
The proposed method is based on monitoring the interface elements between stone blocks for the exceedance of sliding or hinging capacity. The thrust line is continuously updated during the seismic excitation checking the occurrence of a kinematic condition yielding to the collapse mechanisms, as mentioned by Block [36]: “The line of thrust can also give information about possible collapse mechanisms. Anywhere the line touches the boundaries of the structure, a hinge may be created, and this suggests a possible kinematic mechanism”. Whenever the total number of hinging and sliding failures reach four in an individual arch ring, the arch is classified as locally collapsed. If the failure includes the interface failure of the piers, the mechanism is classified as semi-global or global, as described by [14].
The Rayleigh damping coefficients were calculated for a damping ratio of 5% at the first and the last modes in the effective lateral direction. This application prevents any overestimation of damping for effective modes in the lateral directions. In the proposed method, the time history analysis was performed by using Newmark’s implicit integration algorithm.
3. Validation of the Utilized Model
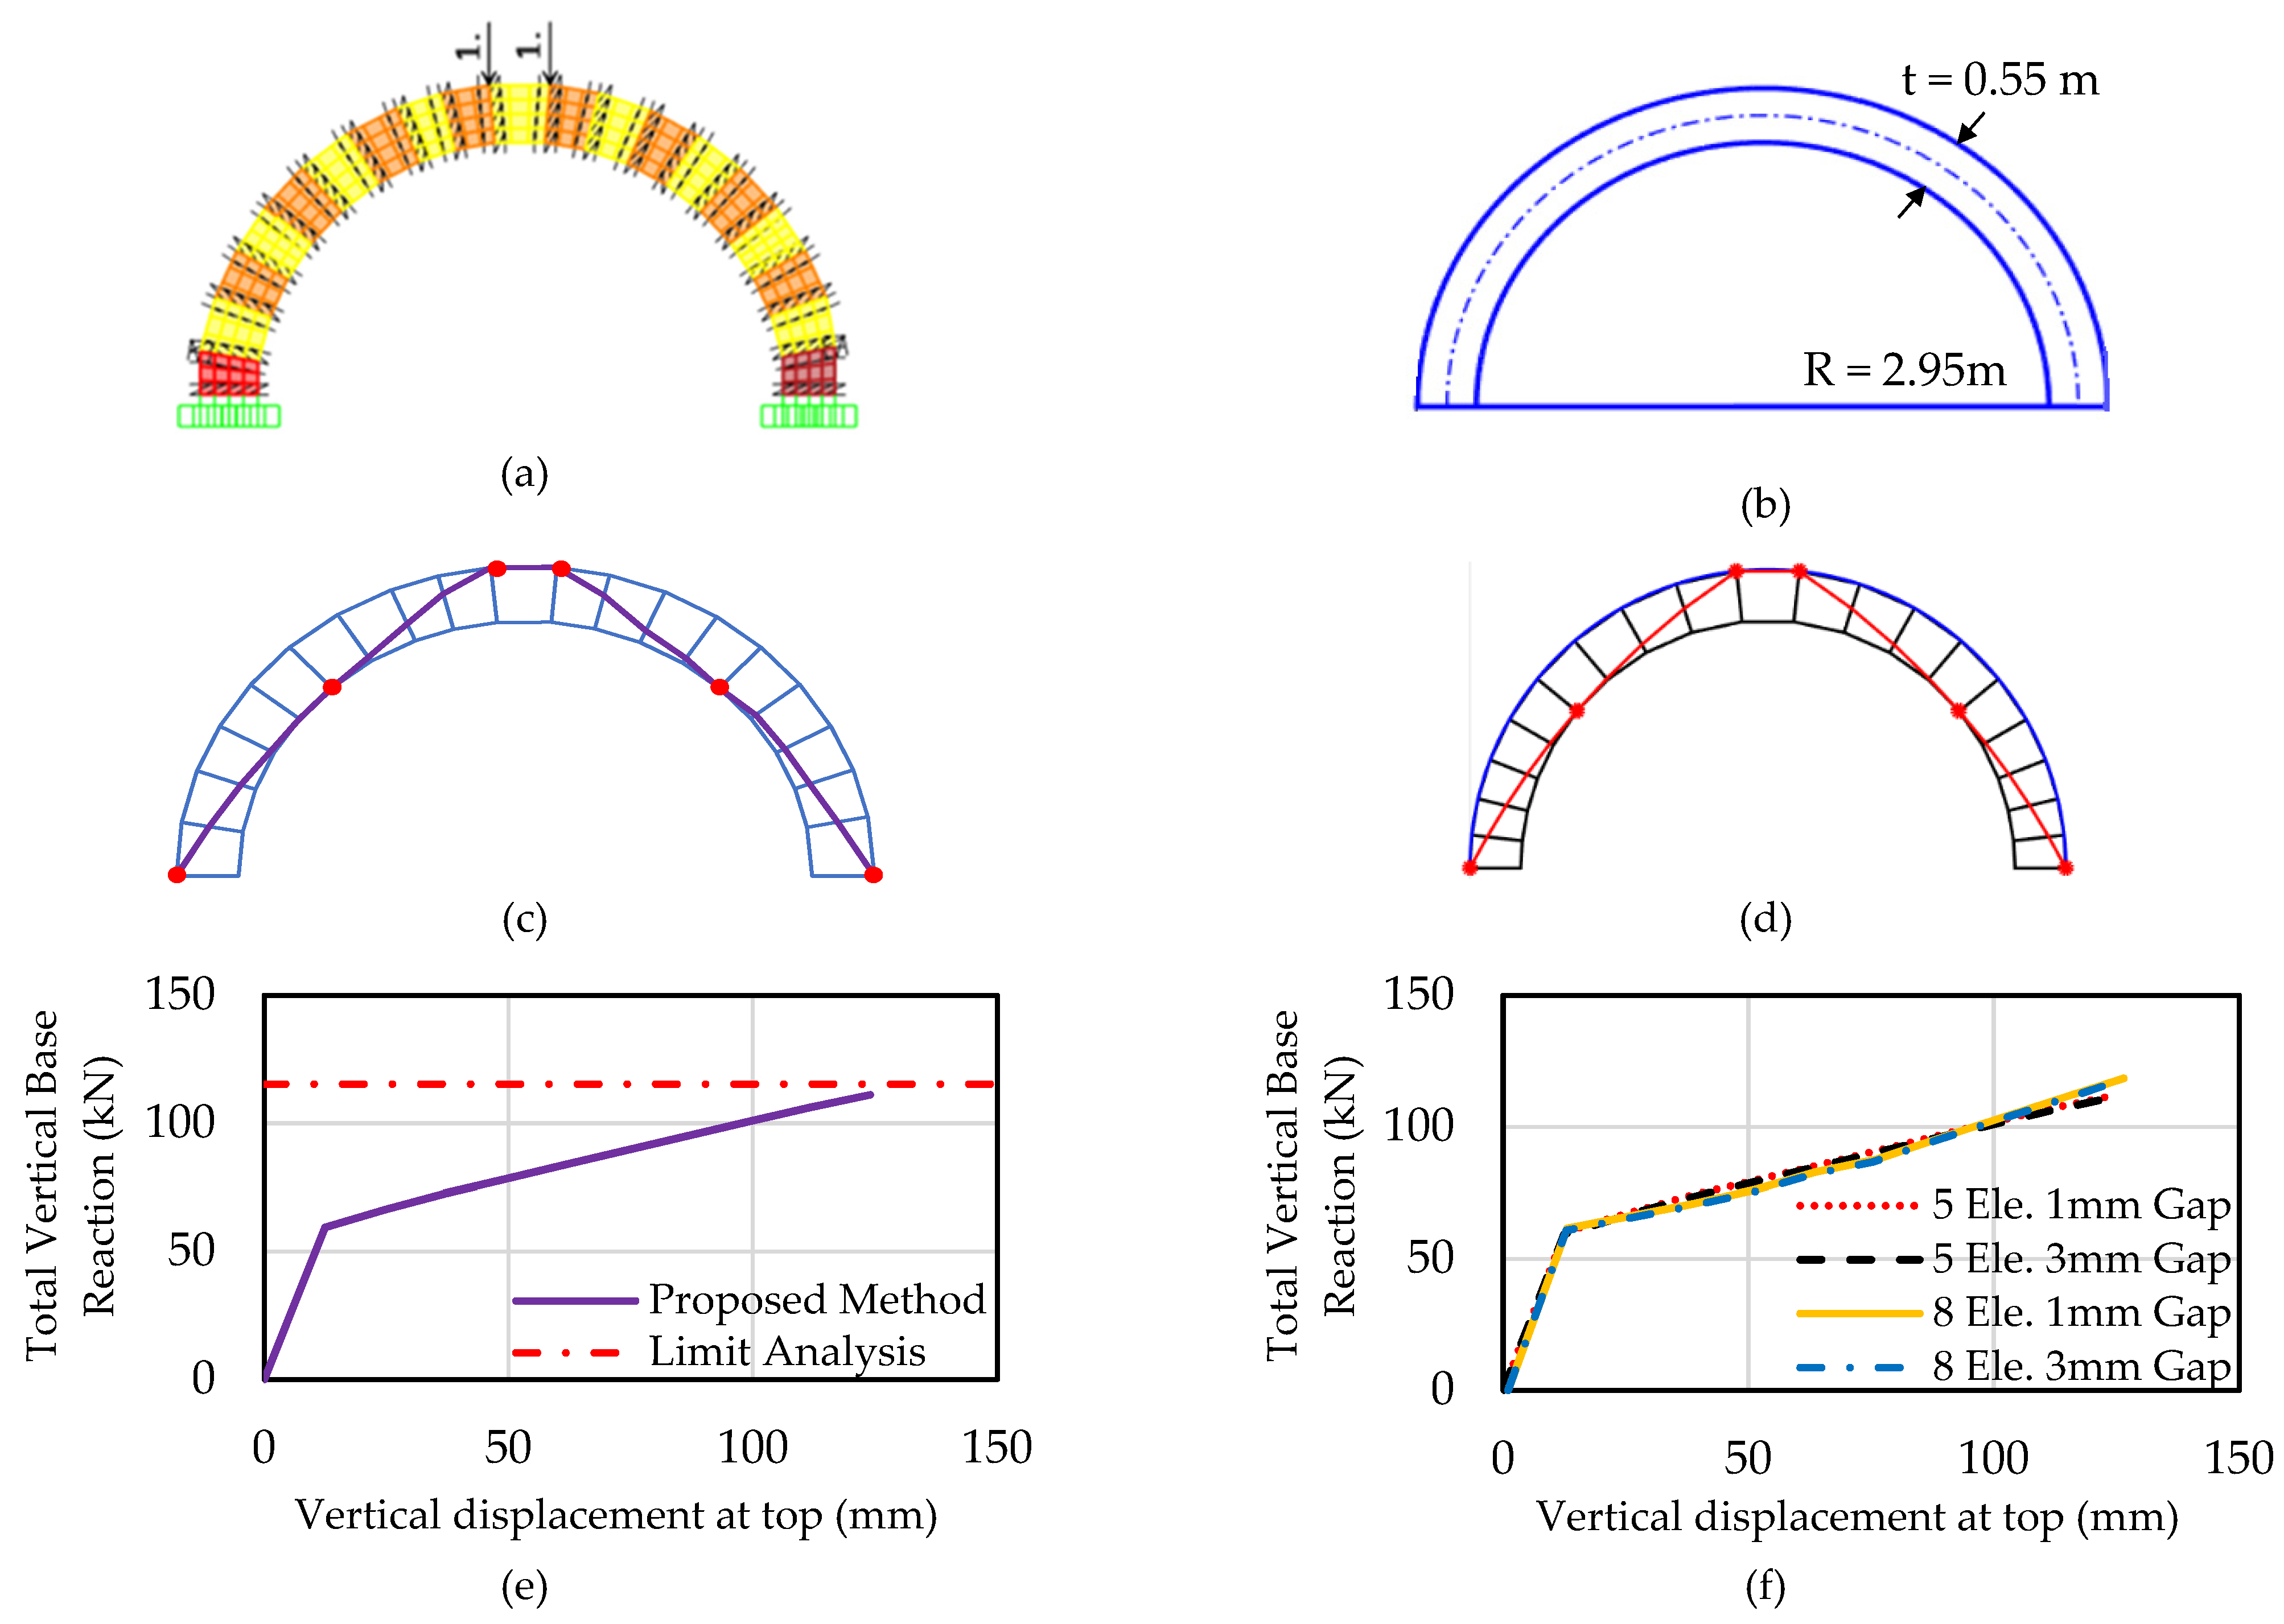
The proposed simple finite element micro-model developed with SAP2000 software was validated with ArchNURBS [11], an experimentally validated software based on limit analysis. A sample arch structure with a radius of 2.95 m, a thickness of 0.55 m, and a width of 1m was modeled and analyzed under vertical point loads. To this end, vertical pushover analysis was performed in SAP2000 software by using the proposed modelling approach. Two vertical downward loads were incrementally applied and the capacity curve was obtained. This capacity curve was compared with the ultimate load calculated from the limit analysis. The proposed model captures both the ultimate load and the failure pattern with high accuracy (Figure 3). The bilinear trend in the pushover curve derived from SAP2000 analyses is due to the symmetry of the geometry and loading conditions. The first deviation from the initial slope marks the formation of hinges at the bottom, the second slight change in slope corresponds to the formation of hinges at the top, and the ultimate load is reached upon simultaneous formation of hinges at the mid-height, forcing the arch into an unstable mechanism.
Additionally, the mesh sensitivity analysis was performed to test the influence of the selected mesh size and gap dimension on the analysis results. To this end, the arch bridge used in the validation of the proposed model was utilized. In this part, the pushover analysis results for models with five links per voussoir with a 1mm gap, five links per voussoir with a 3 mm gap, eight links per voussoir with a 1 mm gap, and eight links per voussoir with a 3 mm gap were determined. The comparison of all pushover curves (Figure 3f) indicates that the selection of the gap size and the mesh intensity had a limited effect on both the maximum load and ultimate displacement capacities. Therefore, five link elements per voussoir with a gap size of 3 mm were used for the following analyses.
4. Application of the Proposed Method
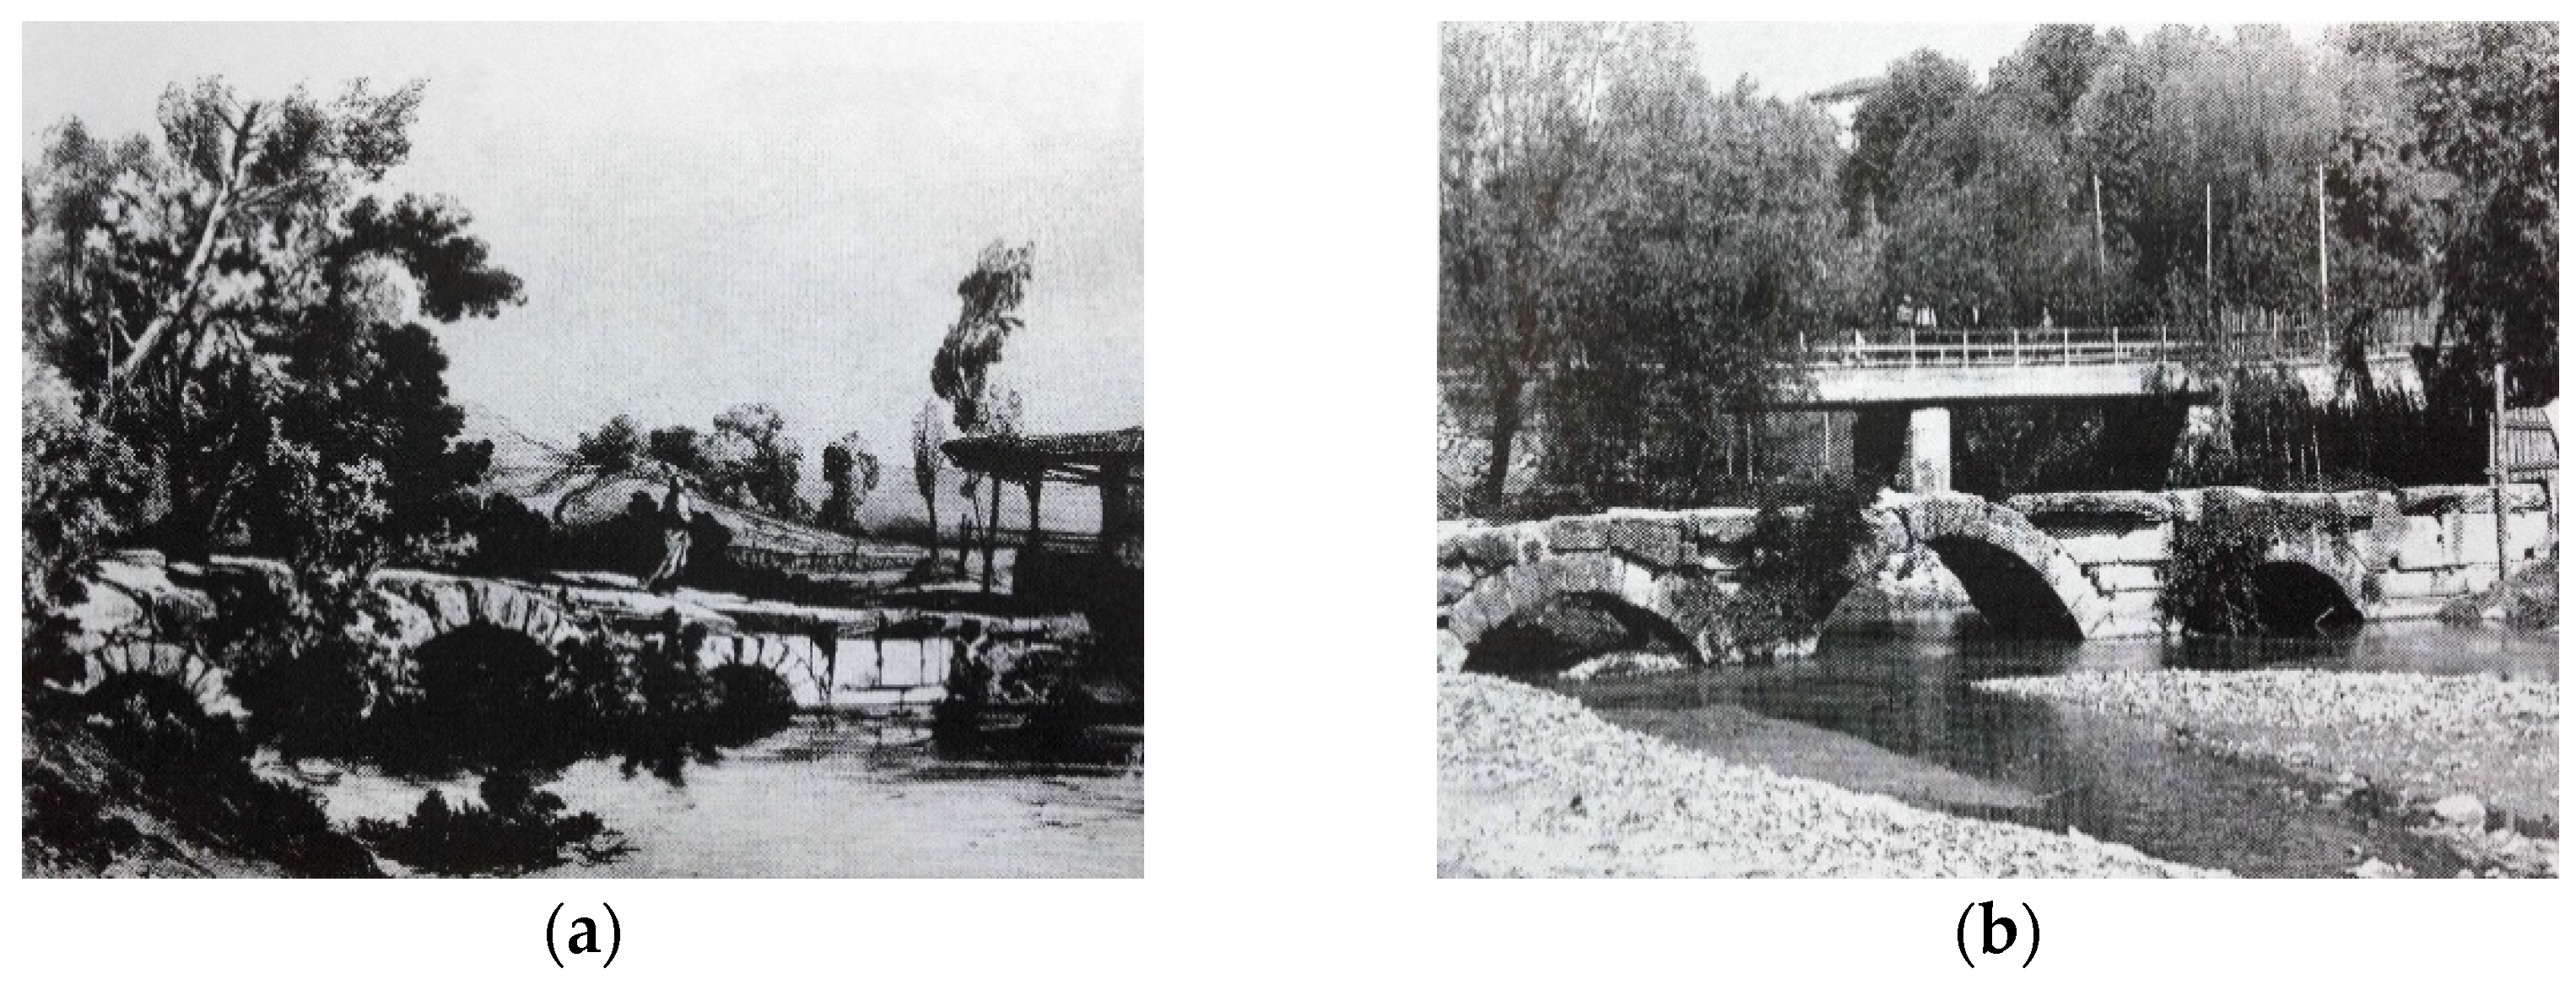
The proposed assessment method was applied to an ancient dry-stone masonry arch bridge (i.e., the Prusias ad Hypium bridge) located in the Konuralp district of Duzce city, Turkey. It is located at 40.906456° east latitude and 31.142084° north longitude, where the Düzce-Akcakoca road crosses over the Tabakhane stream. According to [37], the bridge was likely built between 69–96 AC during the Roman period in order to connect the Byzantines (Istanbul) to Ancyra (Ankara) main road to the Black Sea. A watercolor drawing of the bridge by painter Jules Laurens was published in Xavier Hommaire De Hell’s travelogue written in 1854 (Figure 4a). The bridge, actively used until the 1960s, was abandoned due to a flood in 1963. A photograph from the German Archeology Institute archive (Figure 4b) illustrates that, although decommissioned, the structure was still in reasonably good condition after the flood. The Prusias ad Hypium Bridge was registered as a monument by the Turkish High Council of Antiquities and Monuments in 1978.
A restoration and restitution effort of the system by archeological excavation was undertaken by ANB Architecture and Restoration Co. under the supervision of the Turkish Directorate of State Highways [40]. A detailed site survey including 3D laser scanning and drone-aided photography was used to obtain the geometric discretization of the bridge (Figure 5). Accumulated debris around the central piers was excavated in order to reveal the foundation and the pier geometries.
4.1. Details on the Structural Form
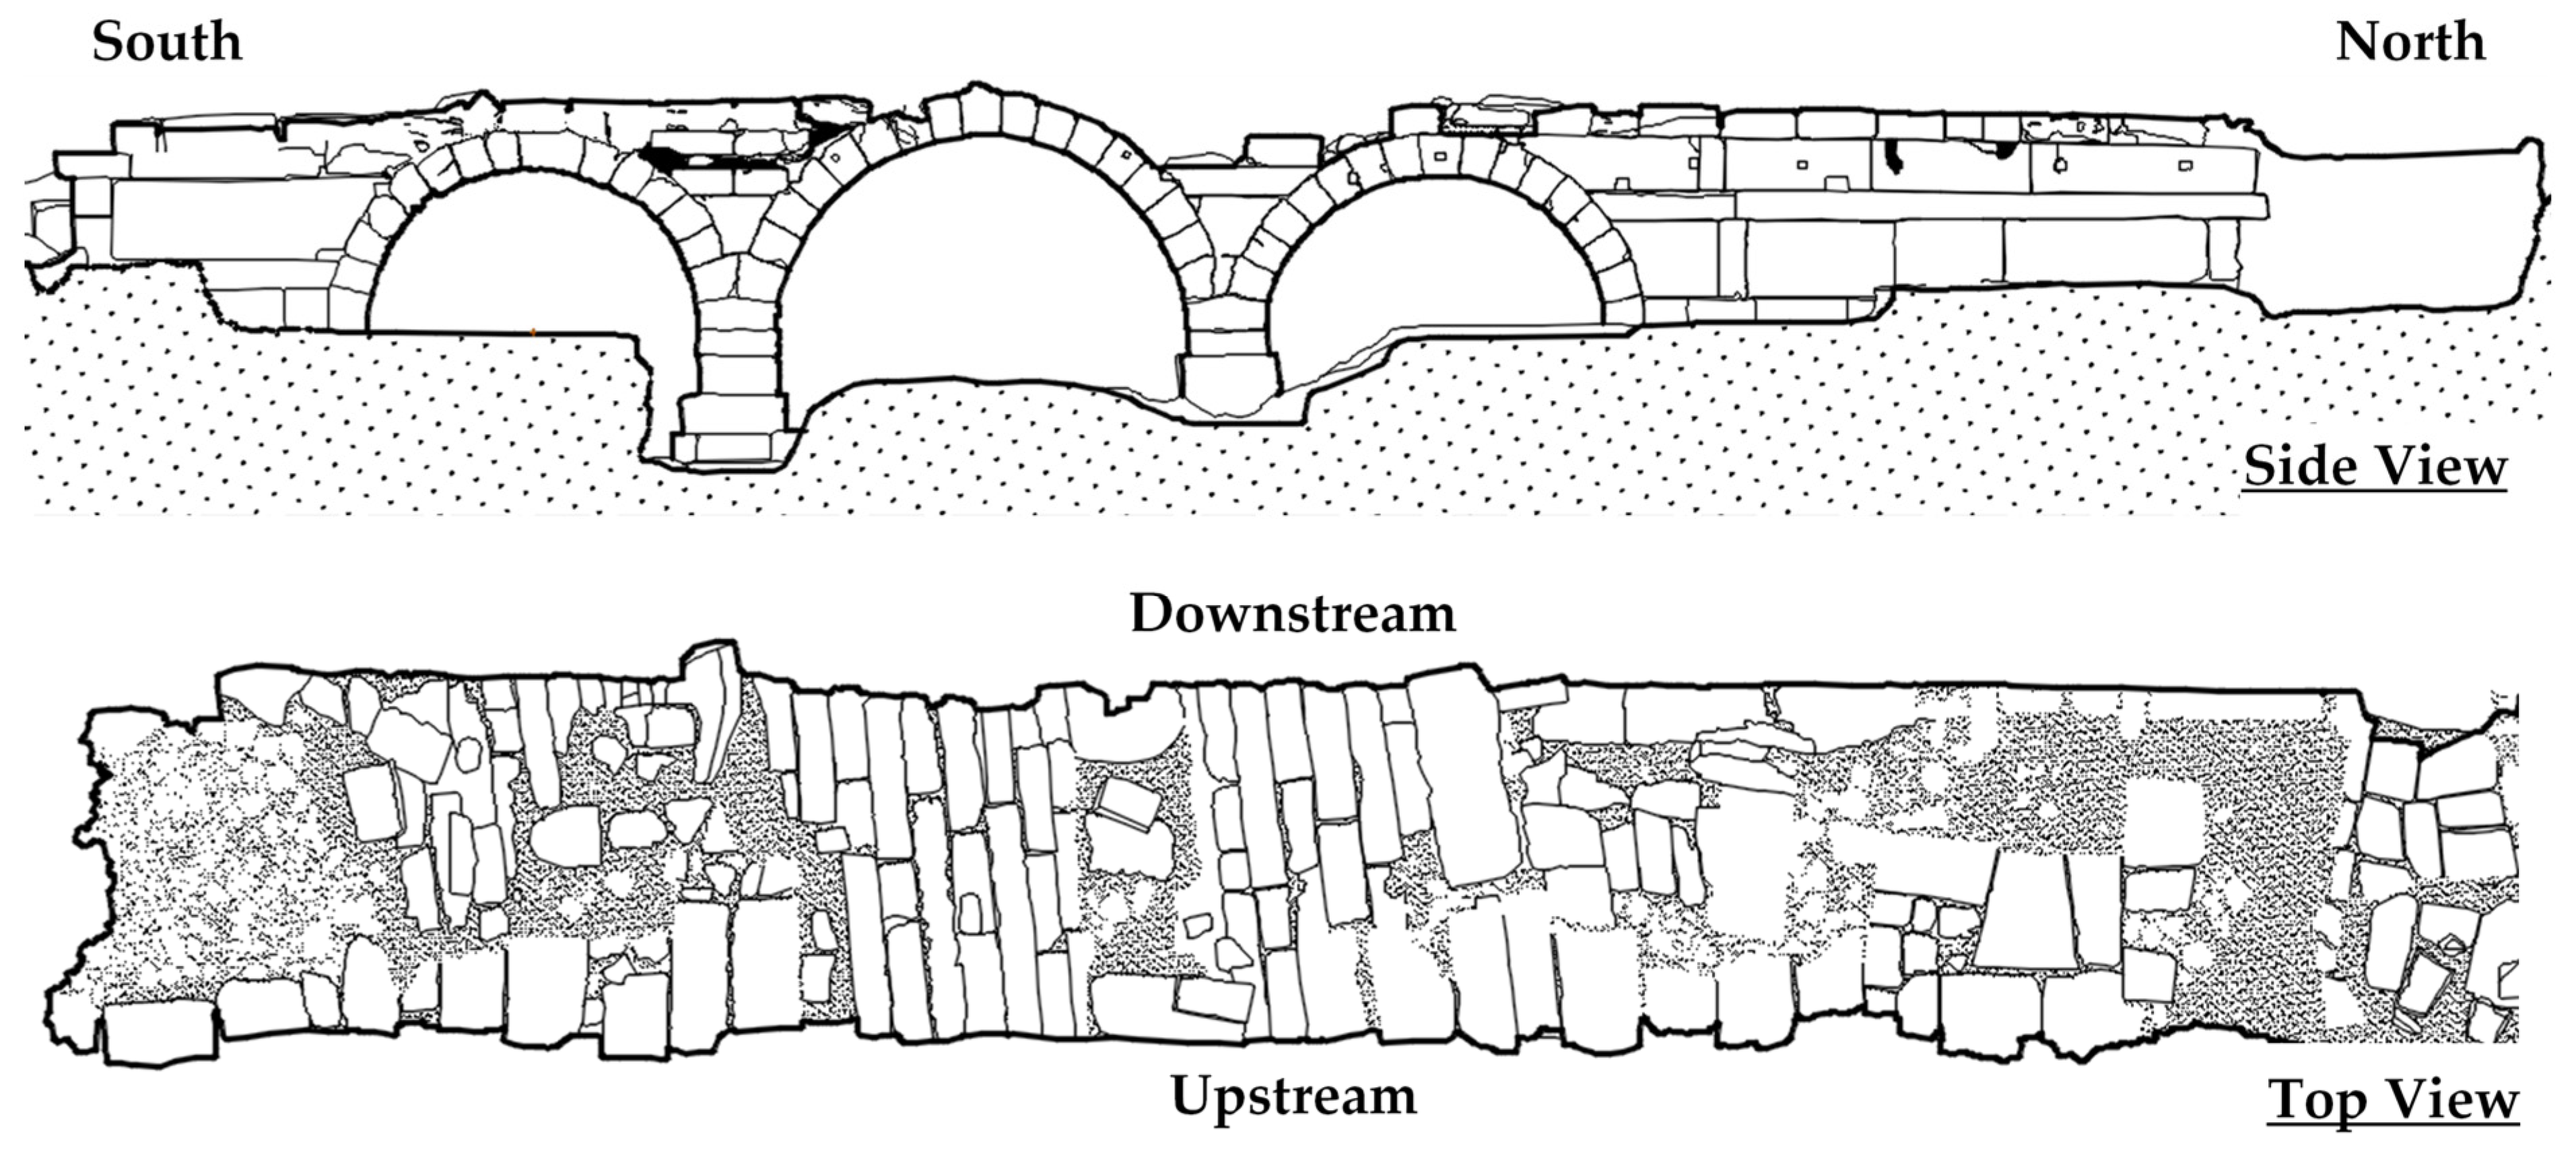
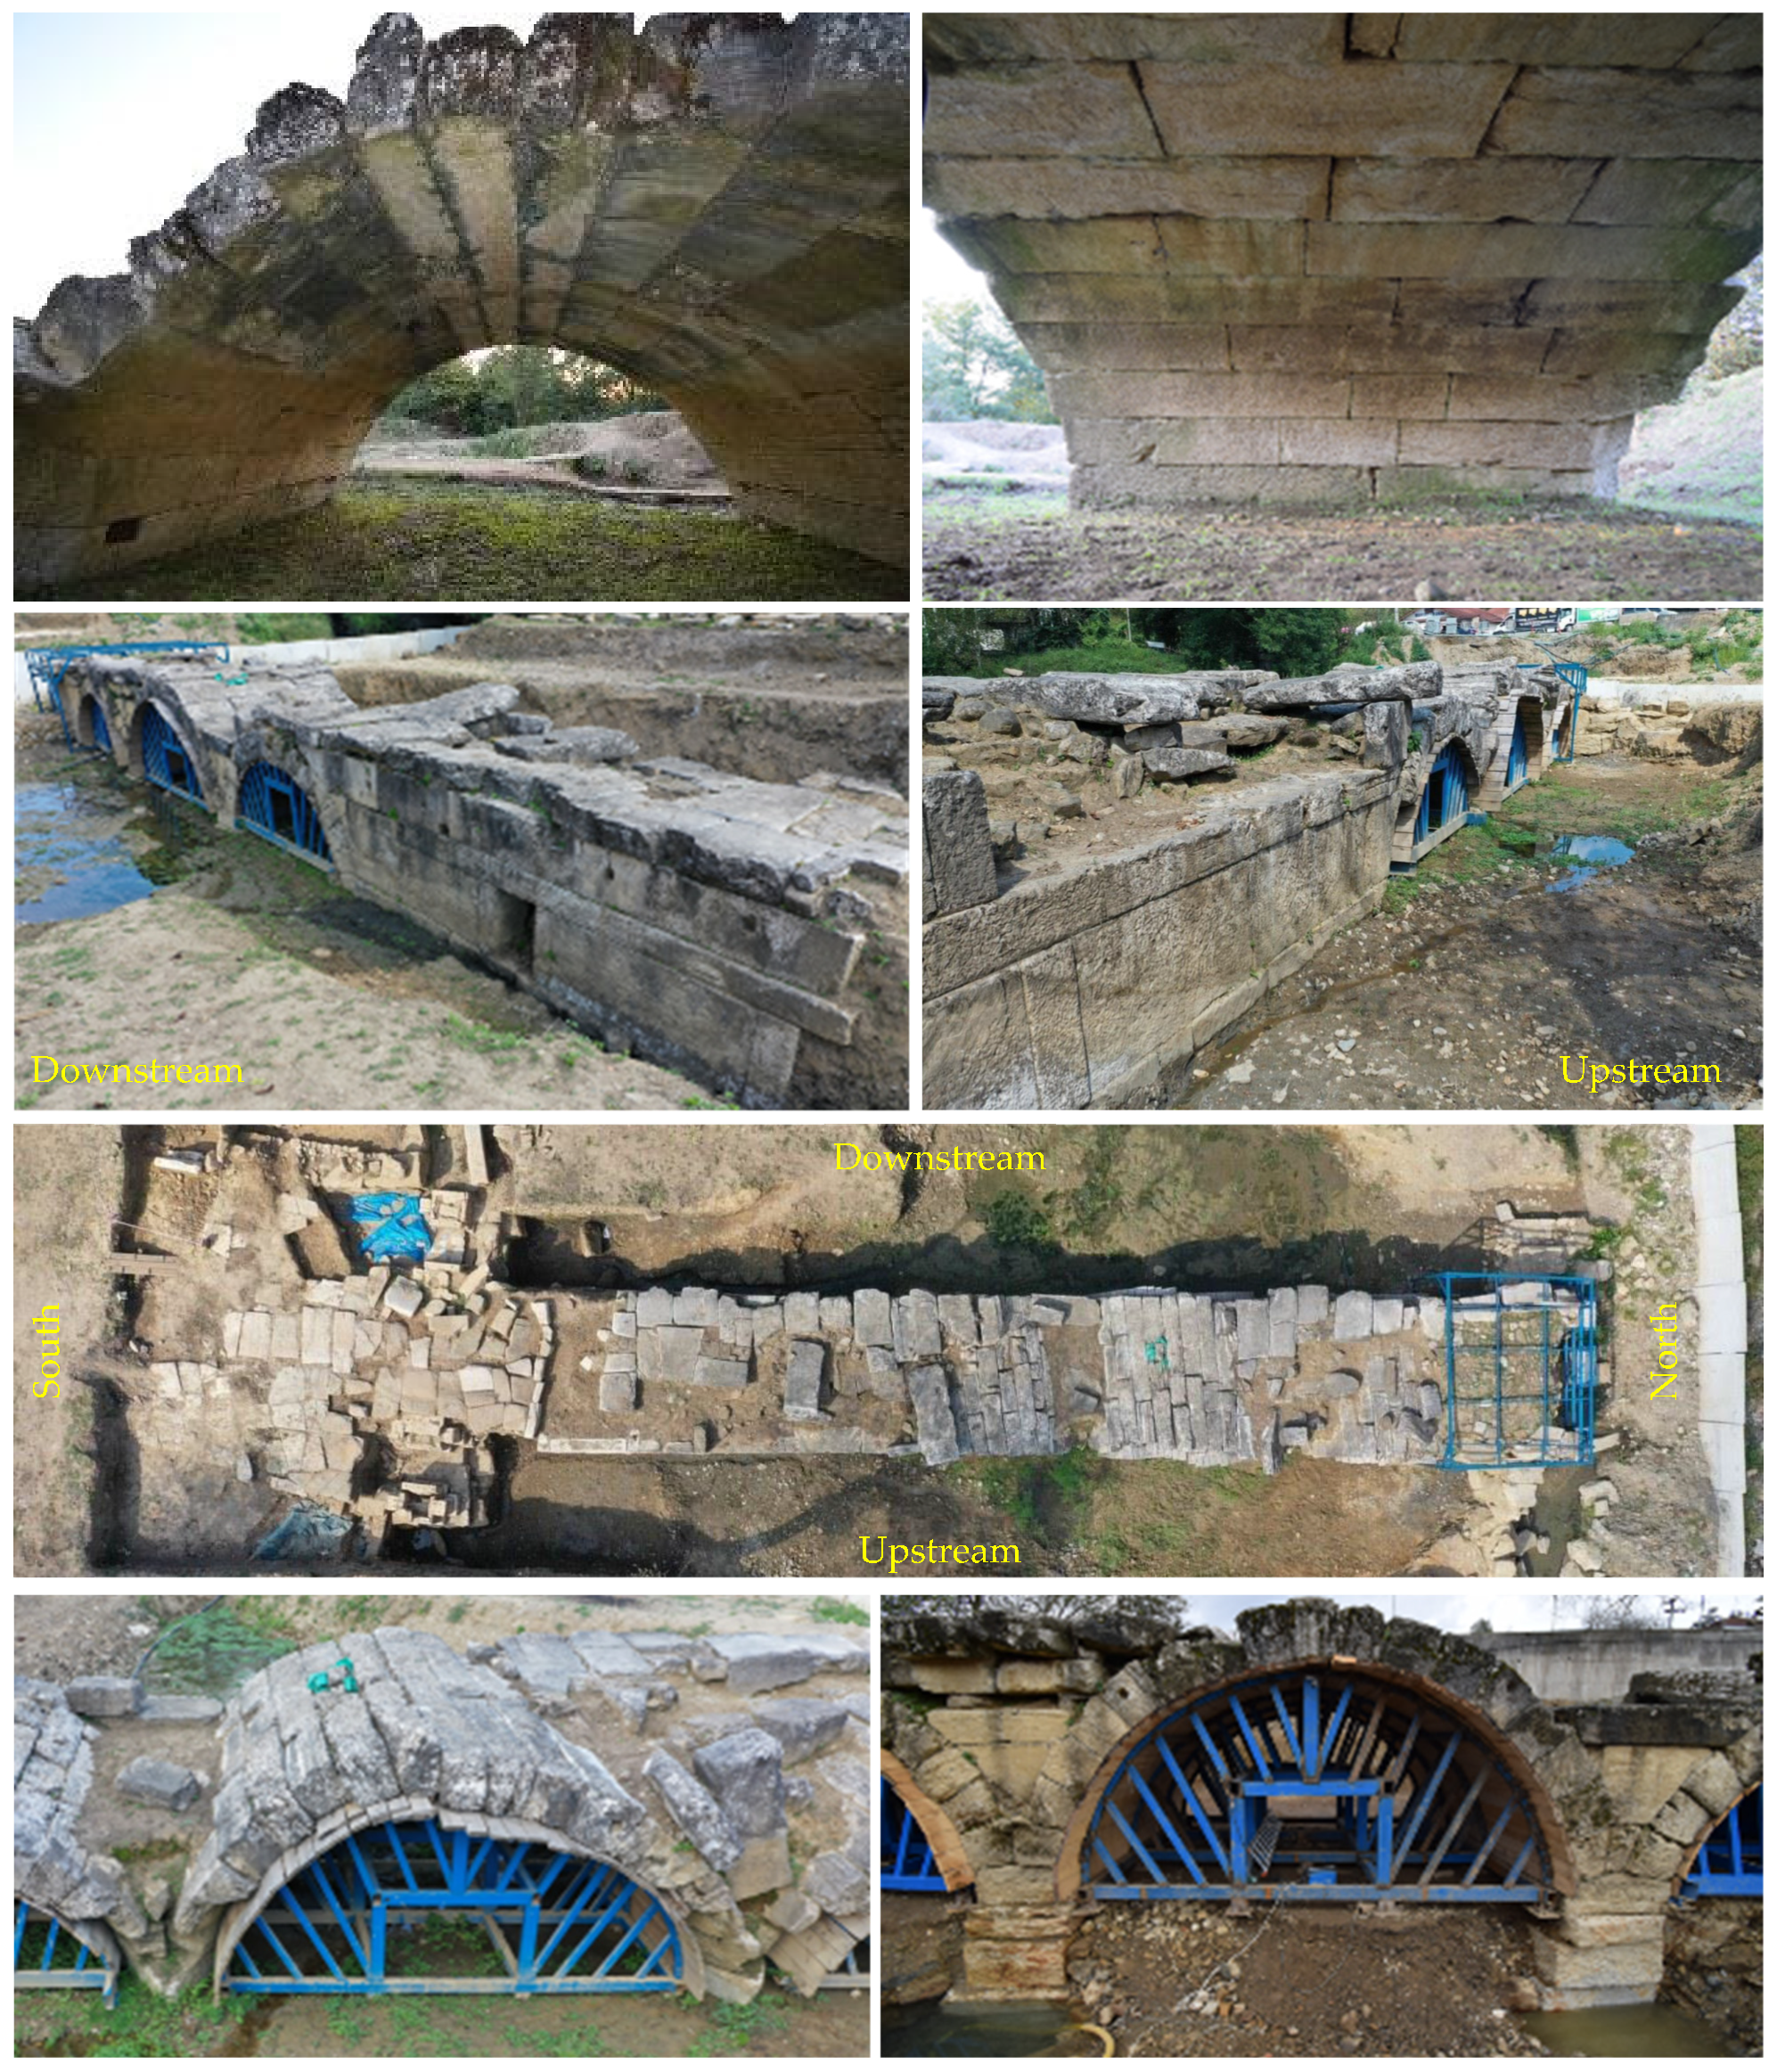
The case study, Prusias ad Hypium Bridge, is a 3-span dry-stone masonry arch bridge. The bridge site is shown from various angles in Figure 6. The sidewalls support the abutments in the longitudinal axis of the bridge. The sidewalls and spandrels are made of rectangular stone blocks. While the southern sidewall’s length is 10 m, only a 2.8 m long portion of the northern sidewall is preserved due to the change in the stream bed. Soil backfill inside the stone shell of the spandrels are partly eroded.
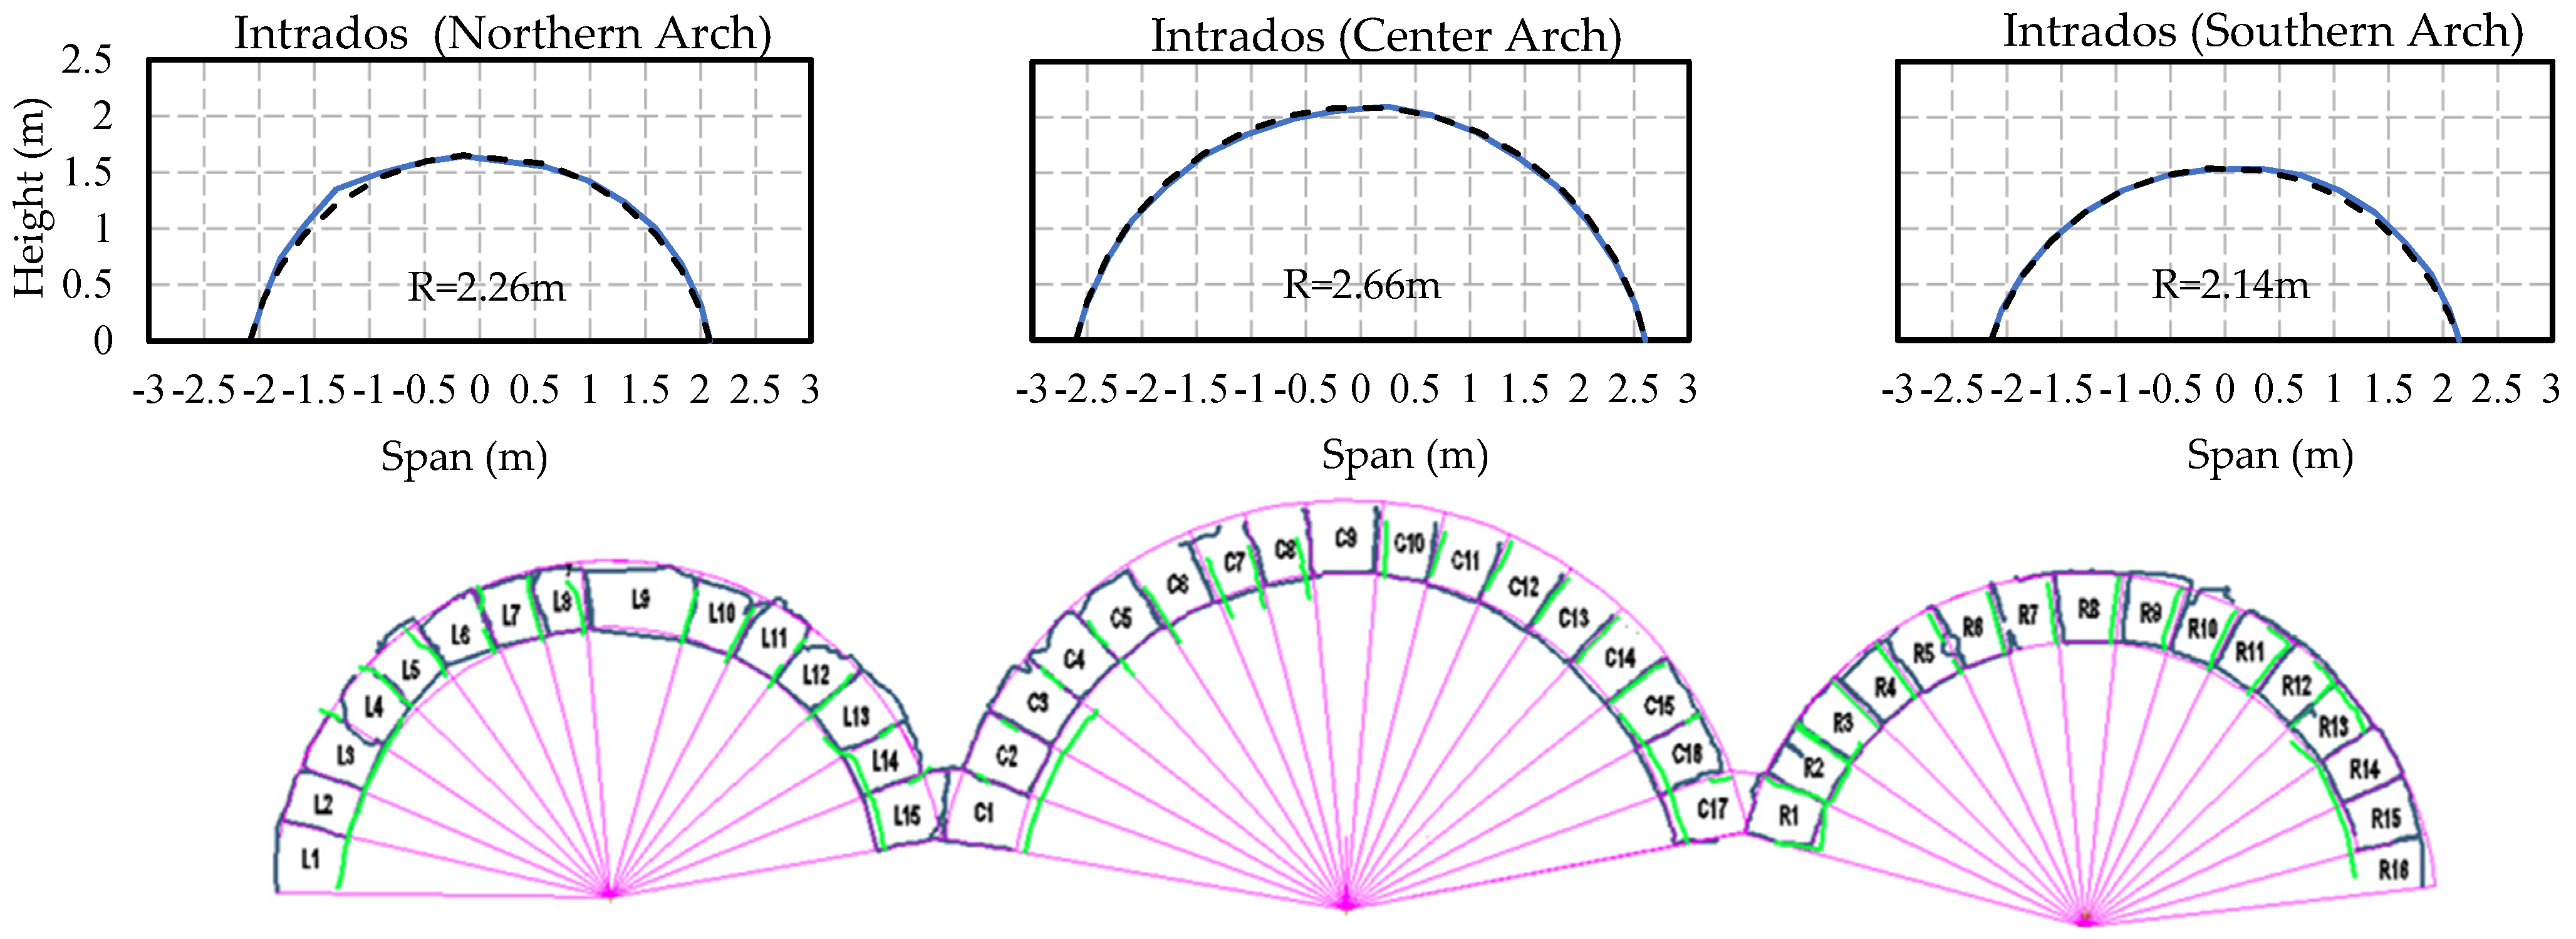
The bridges deck is 30.25 m long and 4.70 m wide. The arches are supported by two piers. All three arches supporting the deck have single-centered circular geometry with thicknesses varying between 0.52–0.58 m. The arches are formed with two to four stone blocks in the transverse direction; each stone weighs around 0.5 to 1.5 tons. Clamp binders or mortar were not used between the adjacent blocks. The two central piers are protected against floods on the upstream side by cutwaters with triangular sections. The geometrical properties of the arches considering the centerline are provided in Table 1.
The laser scanning survey revealed that the geometry of the arches is very close to the semi-circle curves expressed by the mathematical equations (Figure 7); it might be stated that no significant loss of shape was observed. Correspondingly, the stone blocks forming the arches were modeled in accordance with the semi-circle geometry in order to ease the discretization of the system.
4.2. Material Characterization and Seismicity
In addition to the material characterization of the stone blocks and the backfill soil, the numerical model requires the axial and shear stiffnesses of the links defined at the block interfaces. Inter block and block-to-soil link parameters were chosen based on the range of values proposed from the experimental studies conducted at the Laboratory for Testing of Construction Materials in the University of Porto [33,34] for similar stone masonry arch bridges. The material properties utilized in the analysis model are shown in Table 2. The utilized surface contact parameters also conform with similar analytical studies [41].
The Prusias ad Hypium Bridge is located in a very seismically active region; the seismic demands in horizontal and vertical directions is likely to have a decisive role in the bridge’s structural safety. Considering that the bridge was built between 69–96 AD and was actively used until flooding in 1963, it is understood that it survived many severe earthquakes and floods in its service life of approximately 2000 years. The major earthquakes (i.e., Mw > 5.5) in the North Anatolian fault from the instrumented period are listed in Table 3 [42]. It should be noted that the epicenter of the Mw = 7.2 Duzce earthquake that occurred on 12 November 1999 was only 15 km away from the bridge site. The estimated peak ground acceleration (PGA) values at the site, predicted using the ground motion prediction equations, are also presented in the table [43].
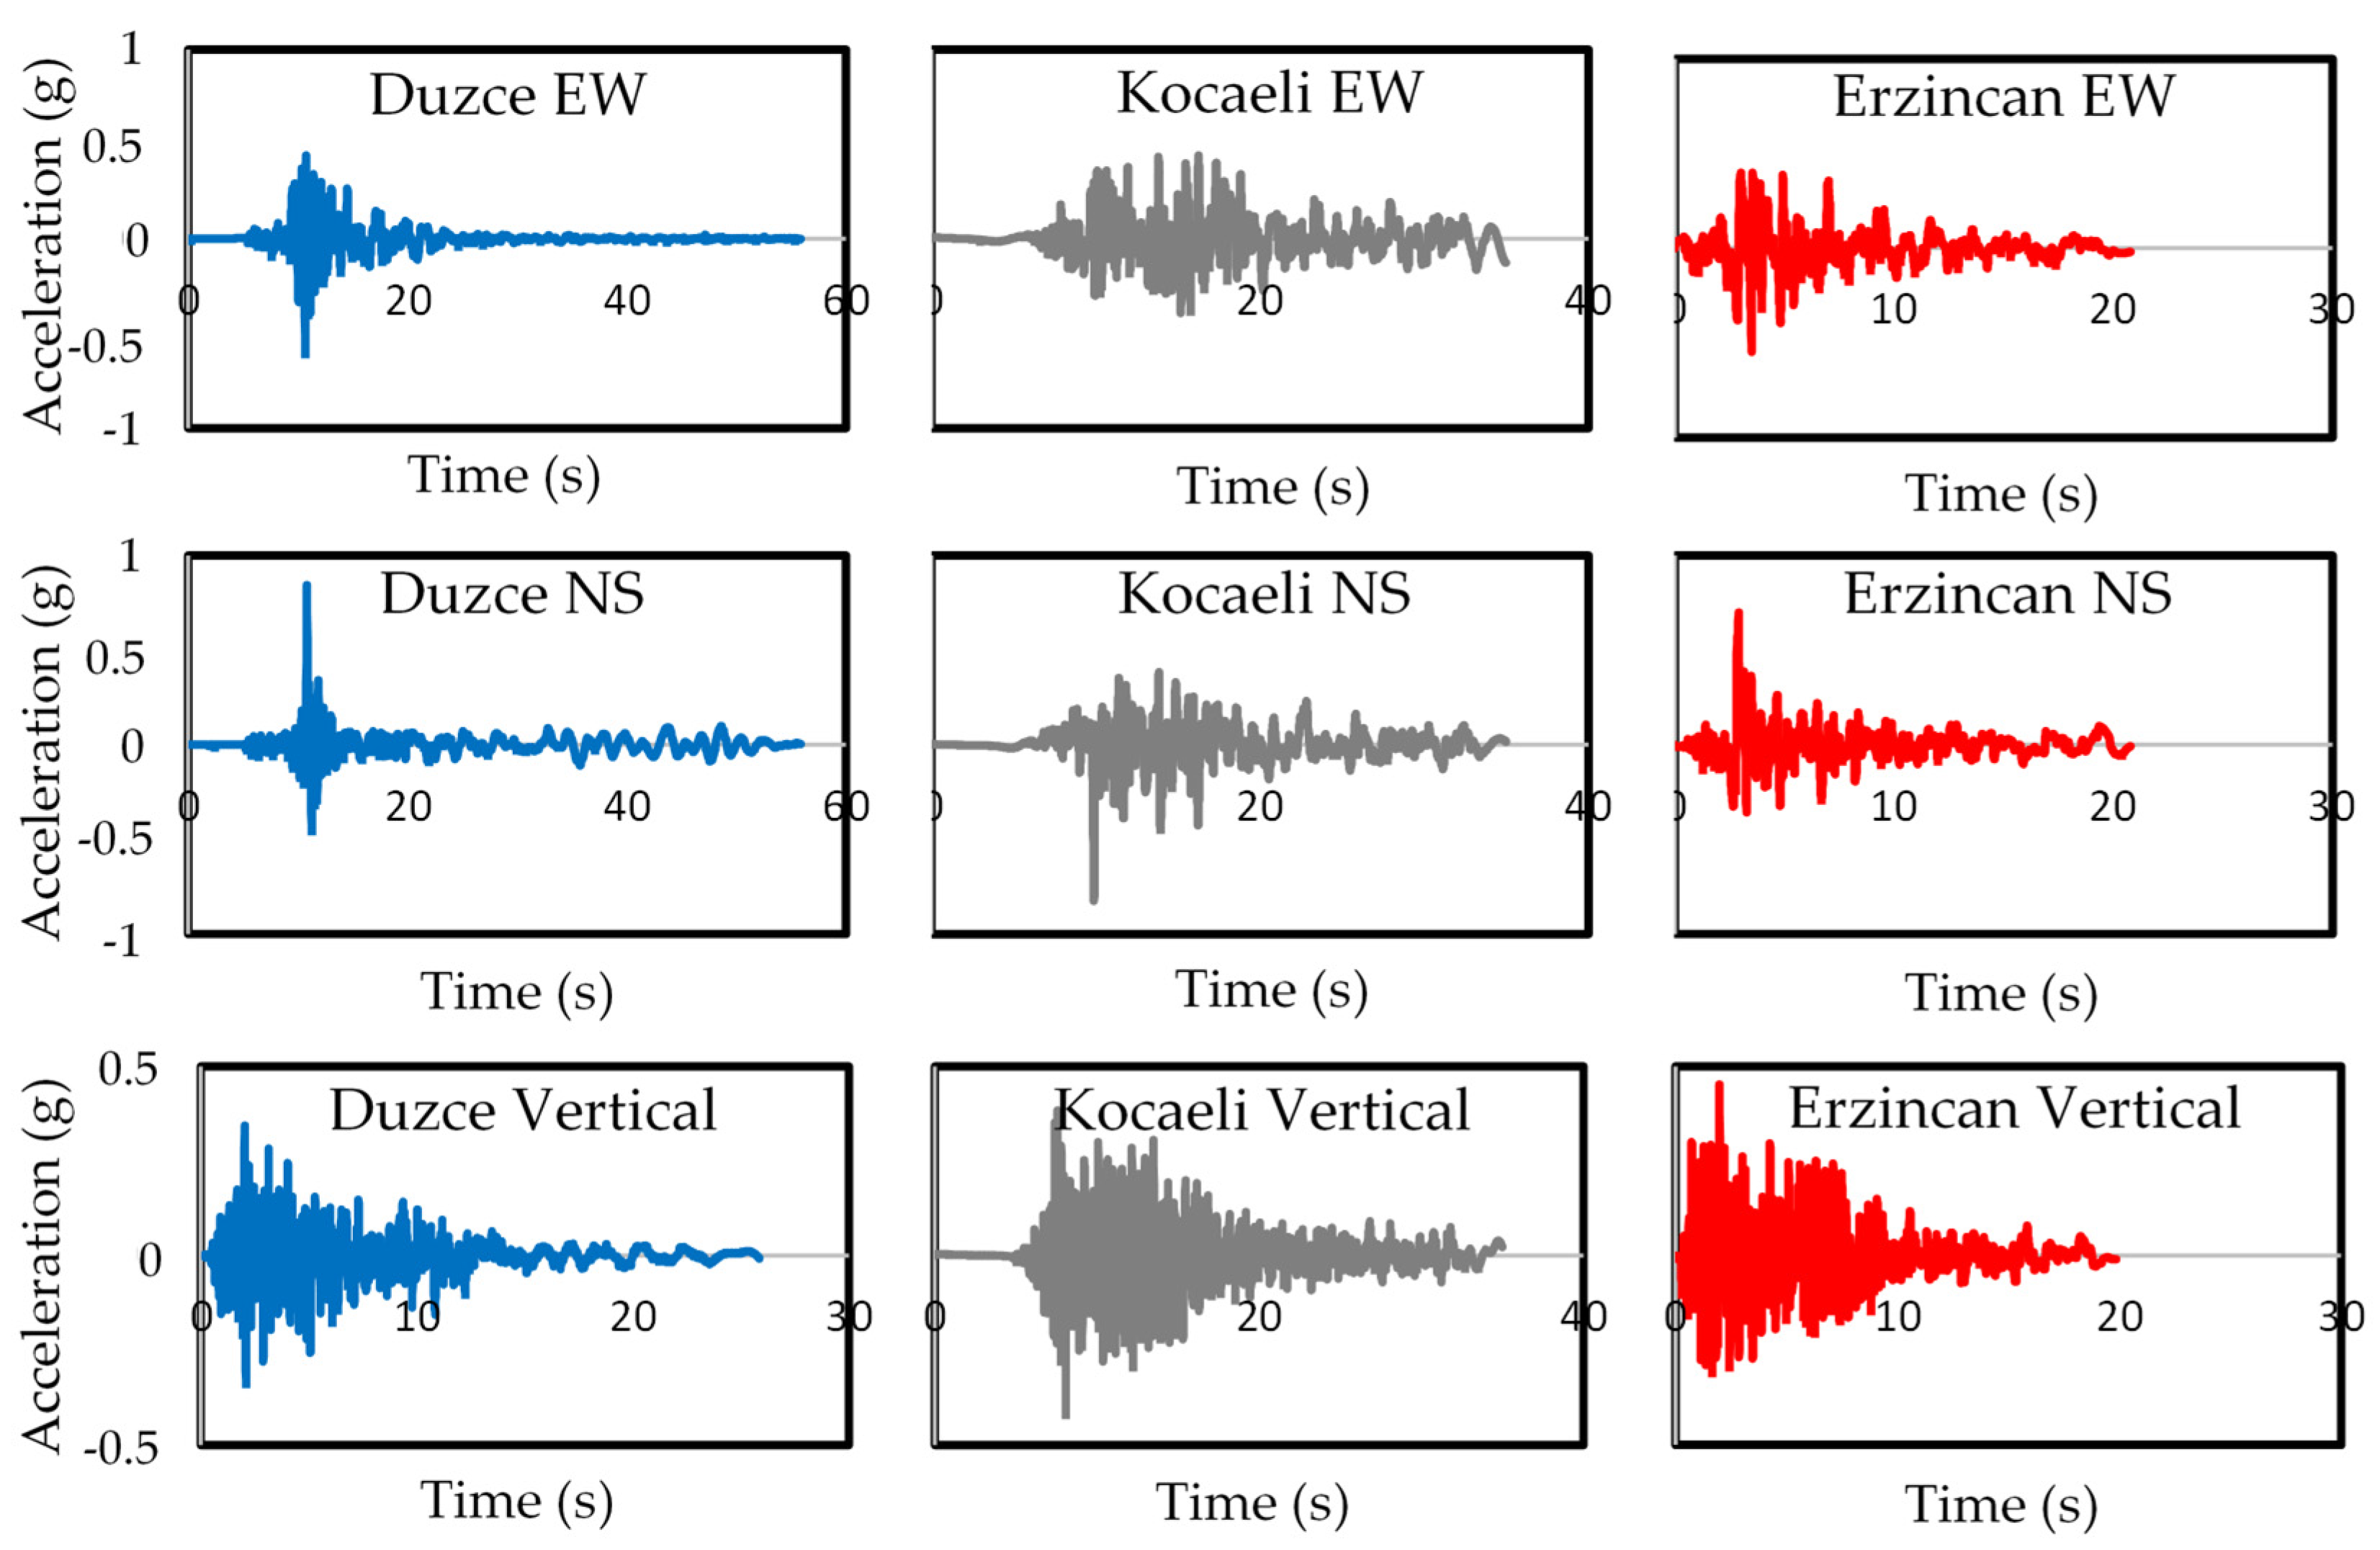
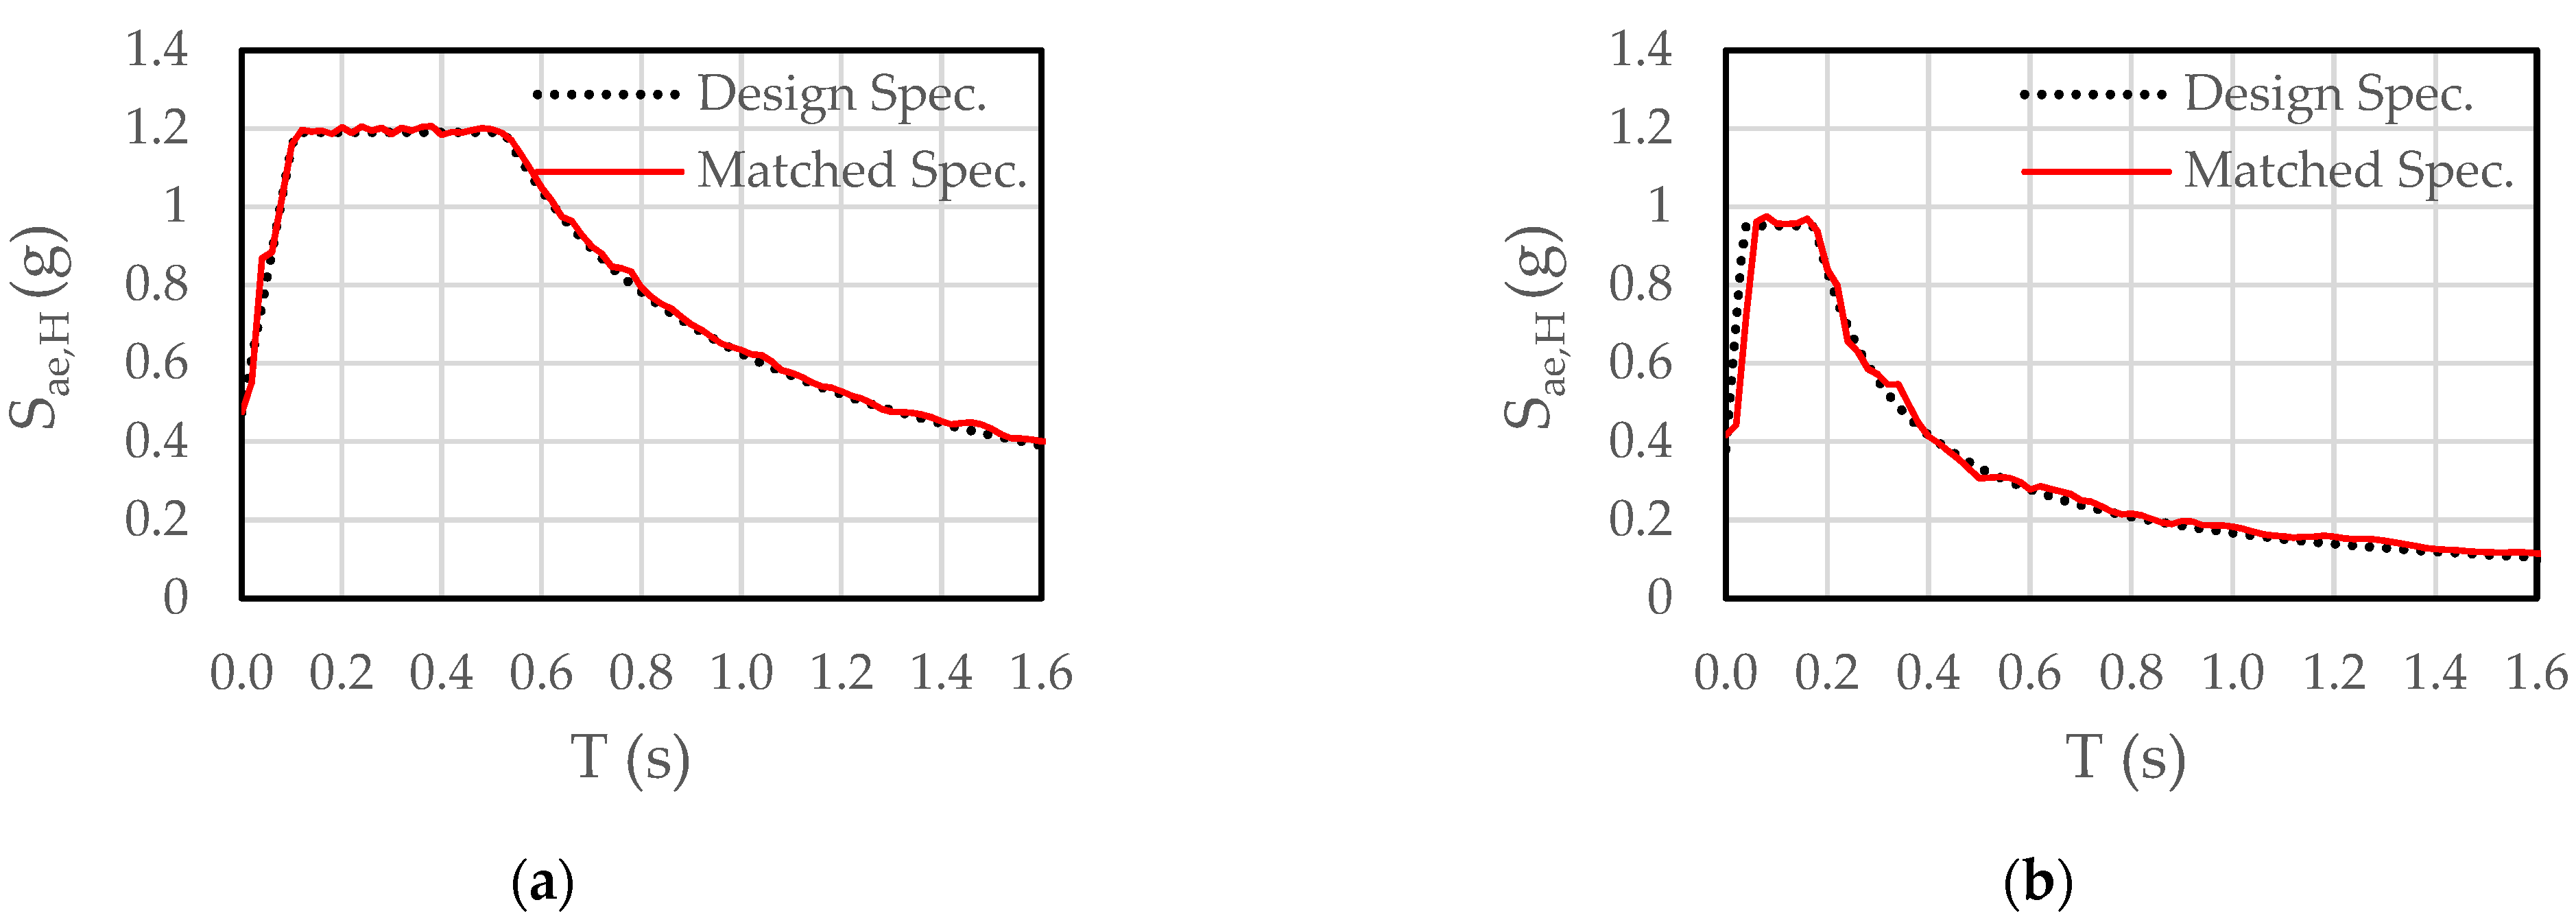
The assessment and the retrofit of the bridge was conducted in accordance with the principles of seismic evaluation defined in the aforementioned earthquake risk management guideline for historic buildings [4]. Considering the historical importance of the bridge and the risk posed to human life in the case of a seismic event, life safety performance was considered for the design-level earthquake (i.e., 10% probability of exceedance in 50 years). This performance level required the non-exceedance of material or section capacities under the simultaneous application of gravity and reduced earthquake loads. The site-specific seismic demand was calculated according to TBEC2018 [6] considering the exact location of the bridge. Soft soil conditions (i.e., soil class D) were used as suggested in the absence of a geotechnical report for the site. For this earthquake hazard level, the short period spectral acceleration (SS), long-period spectral acceleration (S1), and peak ground acceleration (PGA) were determined as 1.140 g, 0.315 g, and 0.470 g, respectively. Nine ground motions (6 horizontal and 3 vertical) were matched to the determined site-specific design spectrum. Vertical components of the earthquakes were also included simultaneously with horizontal components, as damage mechanism of bridges were reported to be influenced by combined loading [44]. The acceleration-time records of the utilized ground motions in two perpendicular directions, scaled to the mentioned hazard level, are shown in Figure 8.
4.3. Seismic Evaluation of the Existing Bridge
The numerical model of the case study was formed in the SAP2000 software [45]. Out-of-plane failure was neglected as the transverse capacity was calculated as approximately twice the longitudinal capacity for a similar bridge [46]. The details of the numerical model are illustrated in Figure 10. The adjacent stone blocks and soil contacts were connected with shear links and no-tension axial links with 3 mm interface thickness. In addition, the far-ends of the soil were left free in the numerical models.
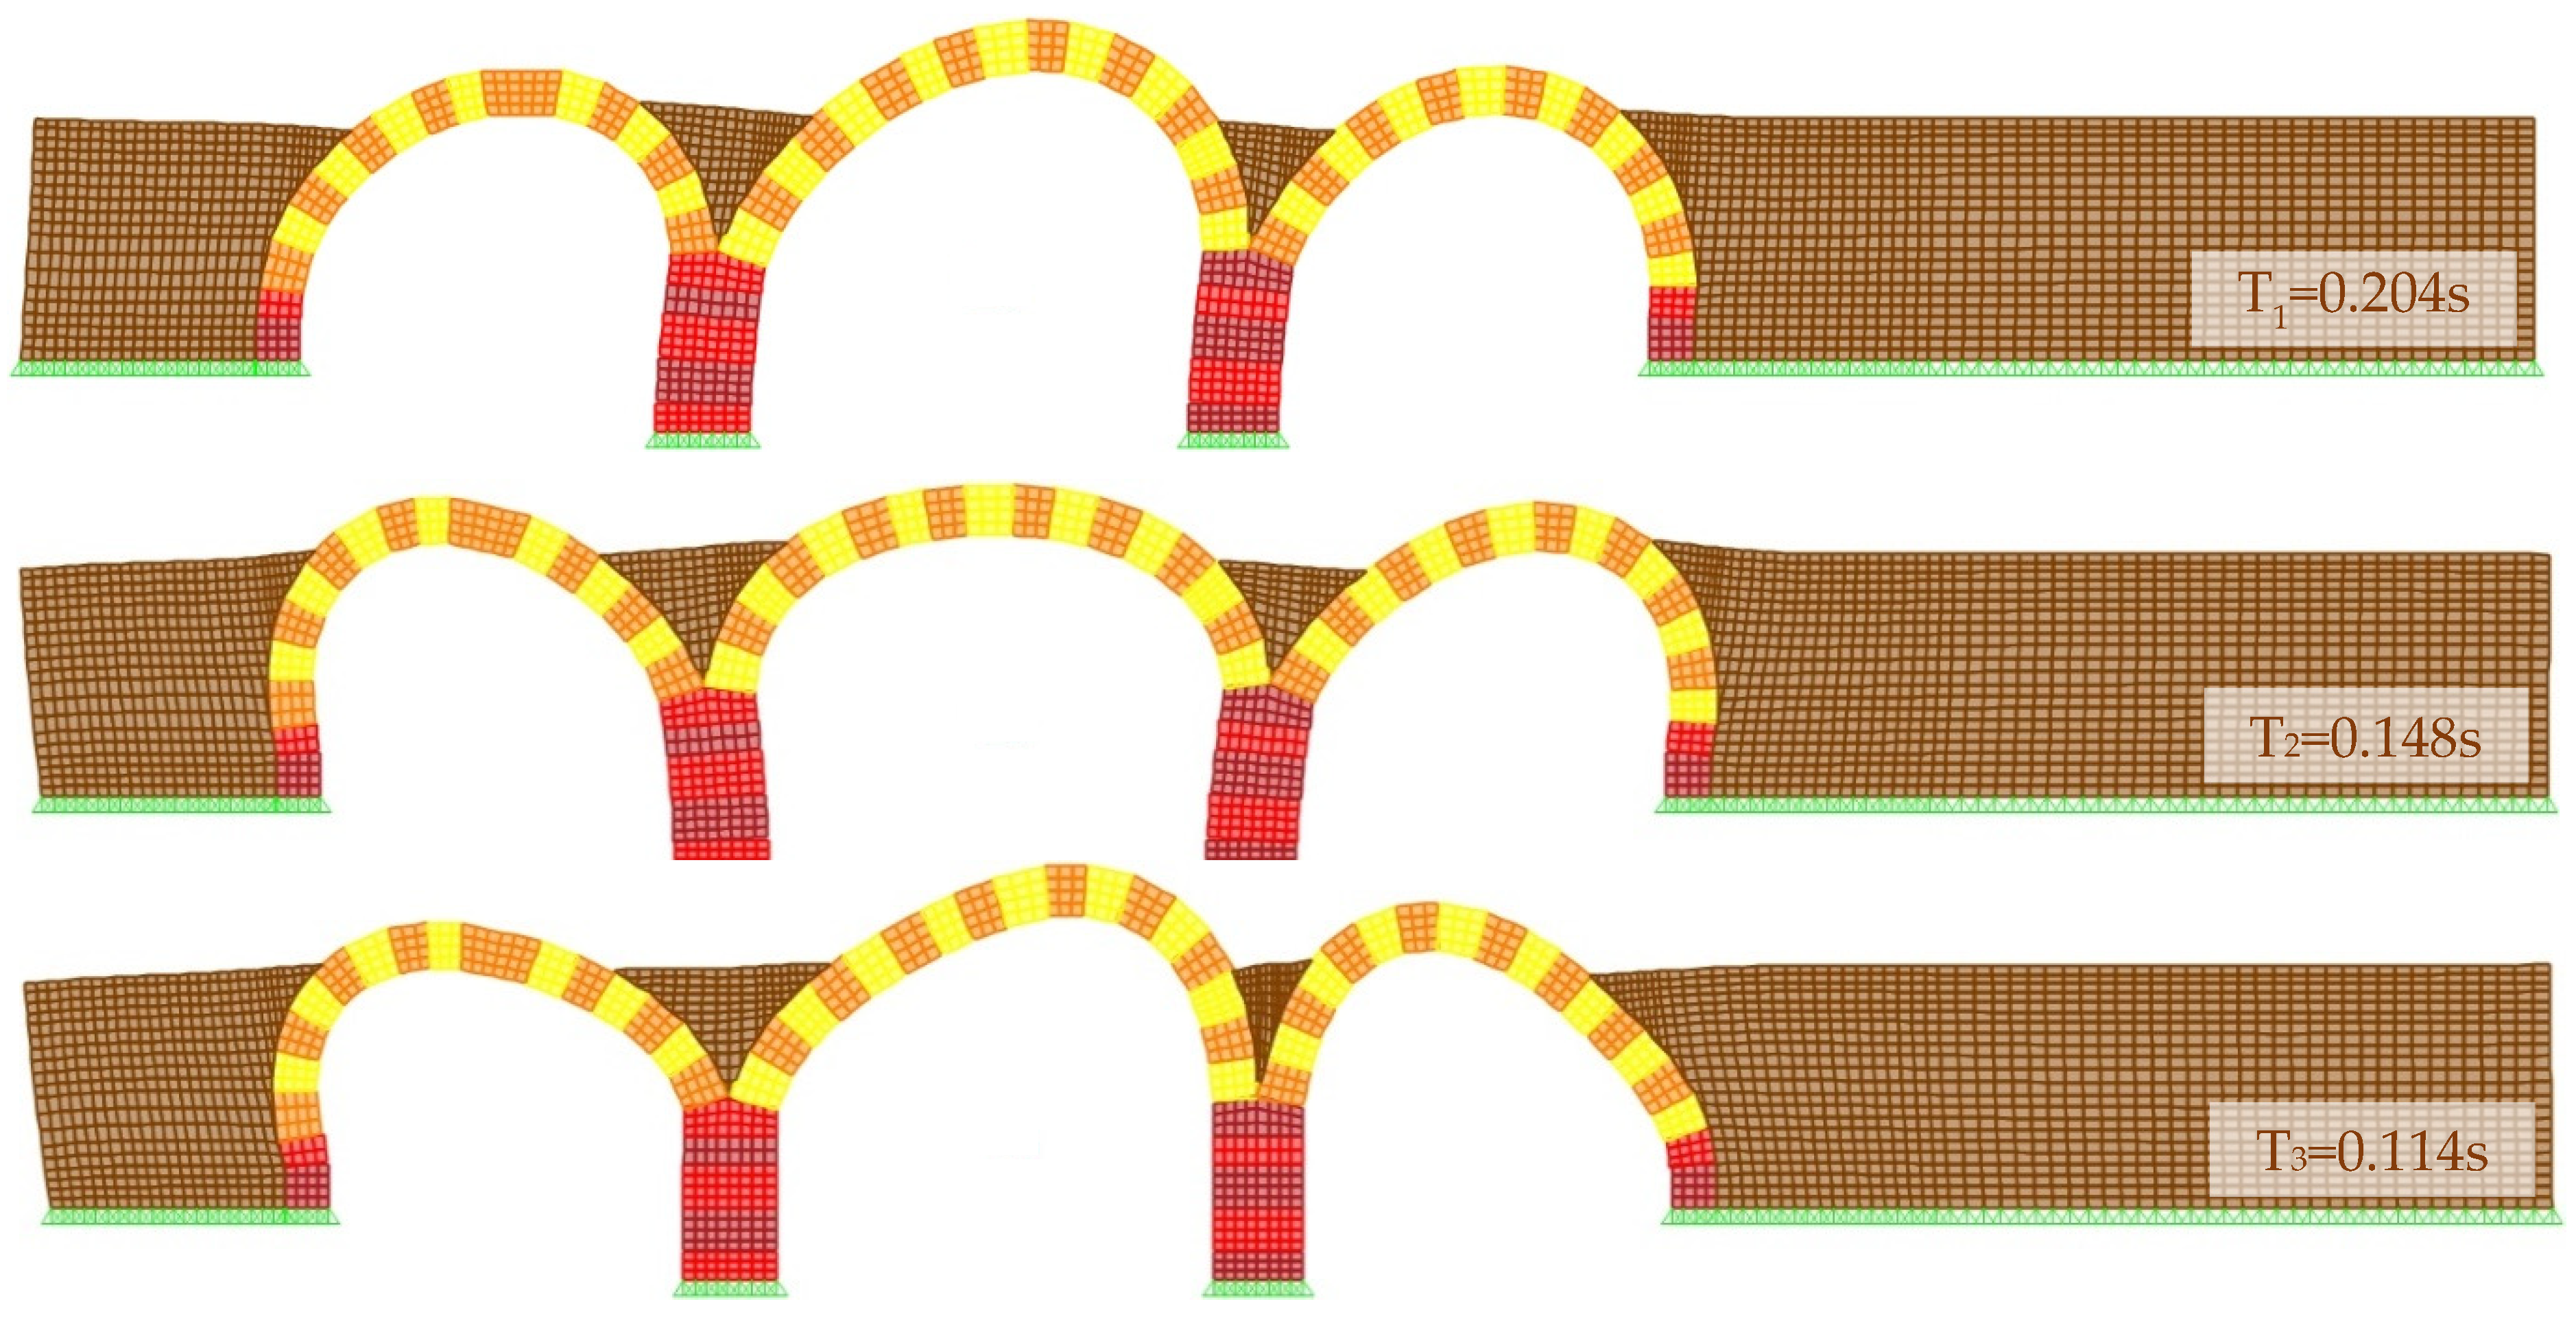
The modal analysis results for the system is presented in Figure 11. The first three mode shapes showed that the numerical model was able to capture the dynamic properties of the bridge. No local modes were obtained in this analysis.
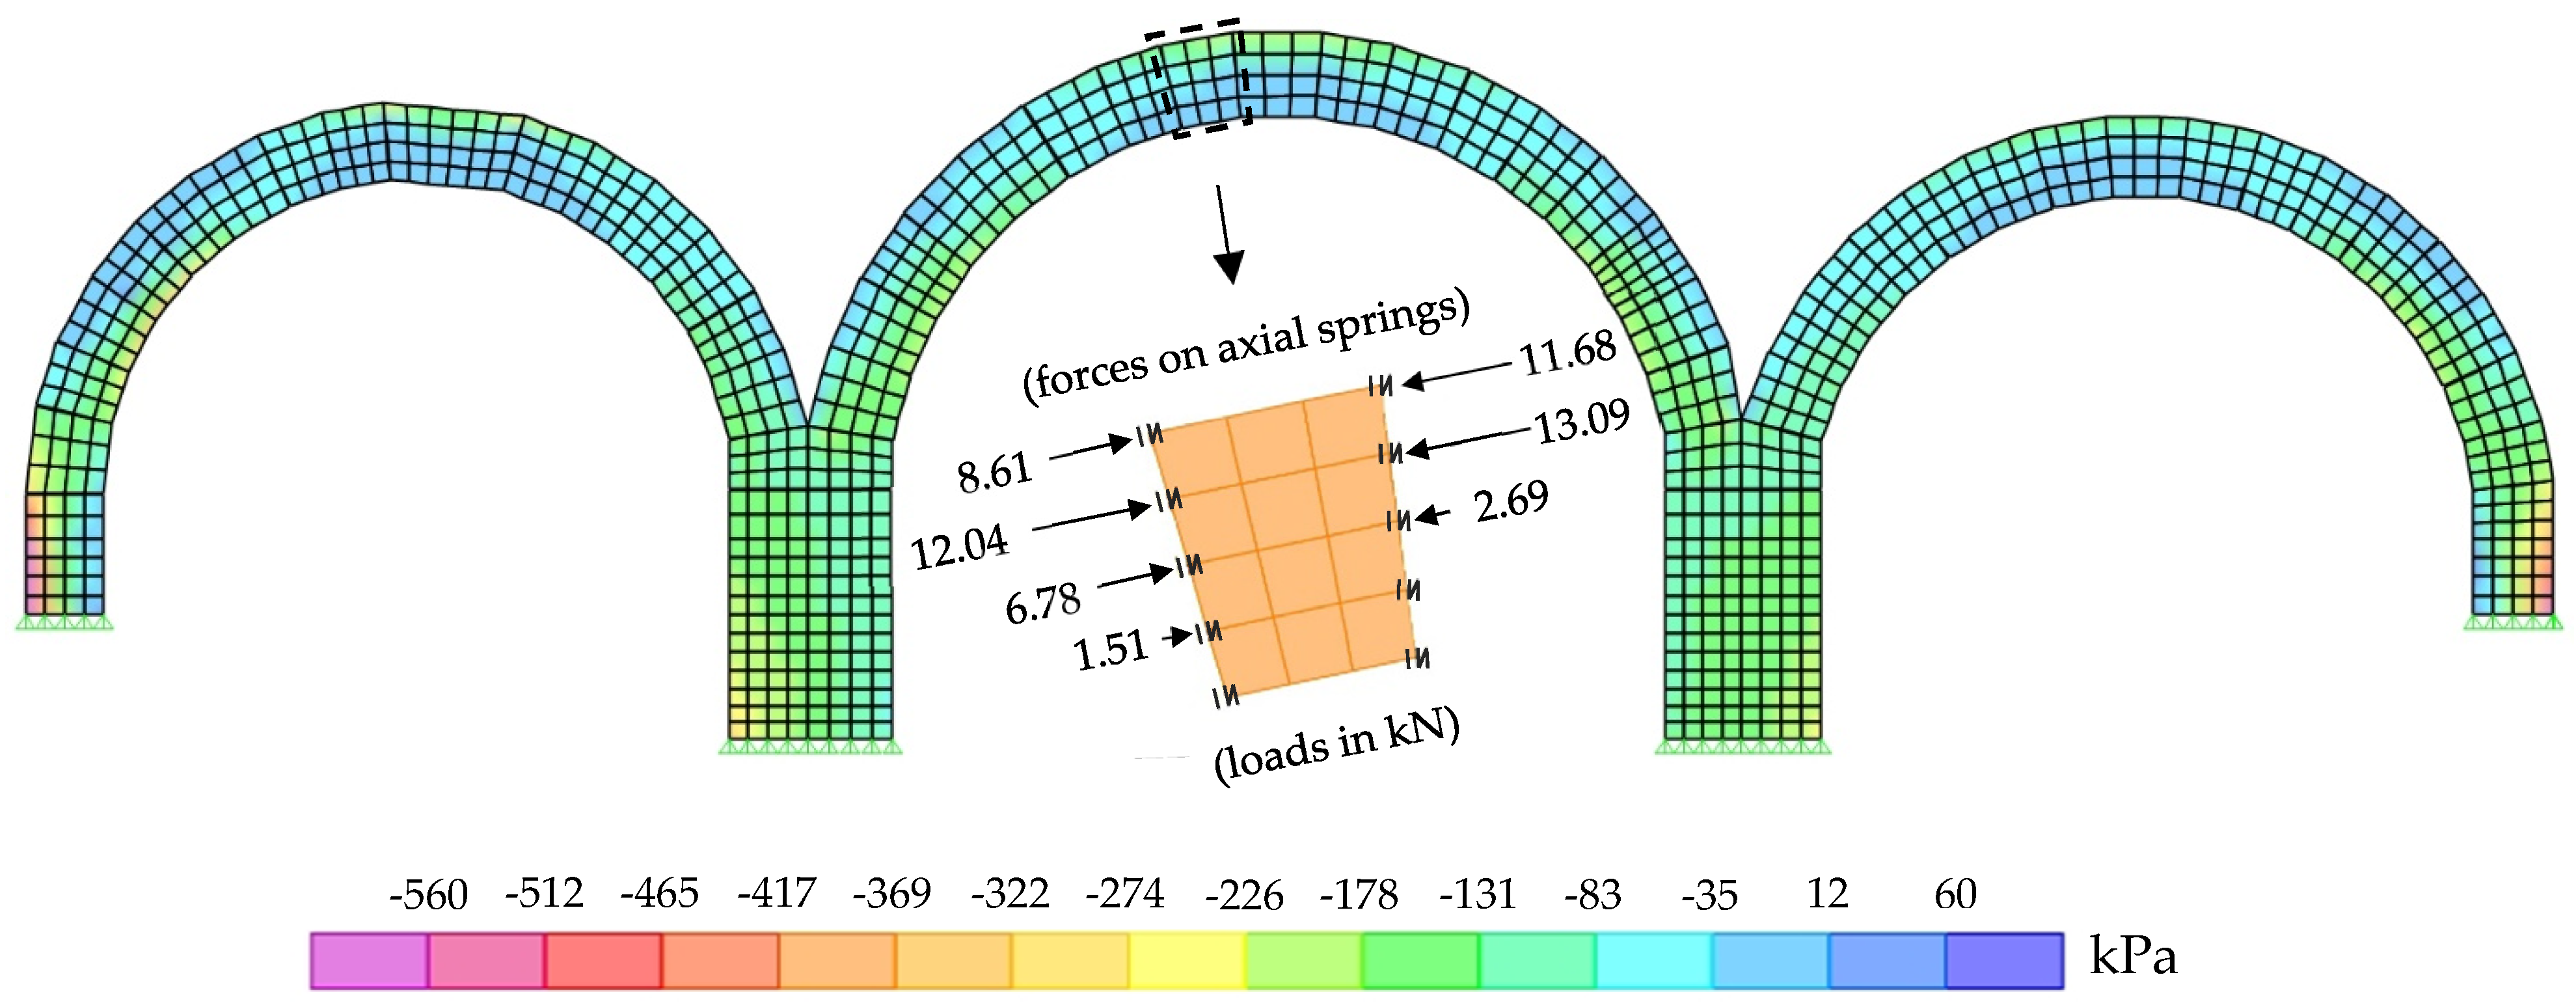
The results of the nonlinear dead load analysis under the self-weight of the bridge are summarized in Figure 12. Axial forces on links around a selected voussoir located in the central arch are illustrated in detail to show the flow of the axial forces. It should be noted that the weight of the voussoir and the forces on the shear links was not shown in the free body diagram in order to avoid complicating the figure. As expected, the maximum principal compressive stress in the arch stones was around 0.6 MPa, which is well below the compressive strength. In addition, the limits defined for sliding and hinging of the interfaces (i.e., Equations (1) and (2)) were not exceeded, implying that the existing bridge has no problem with the service loads in the vertical direction.
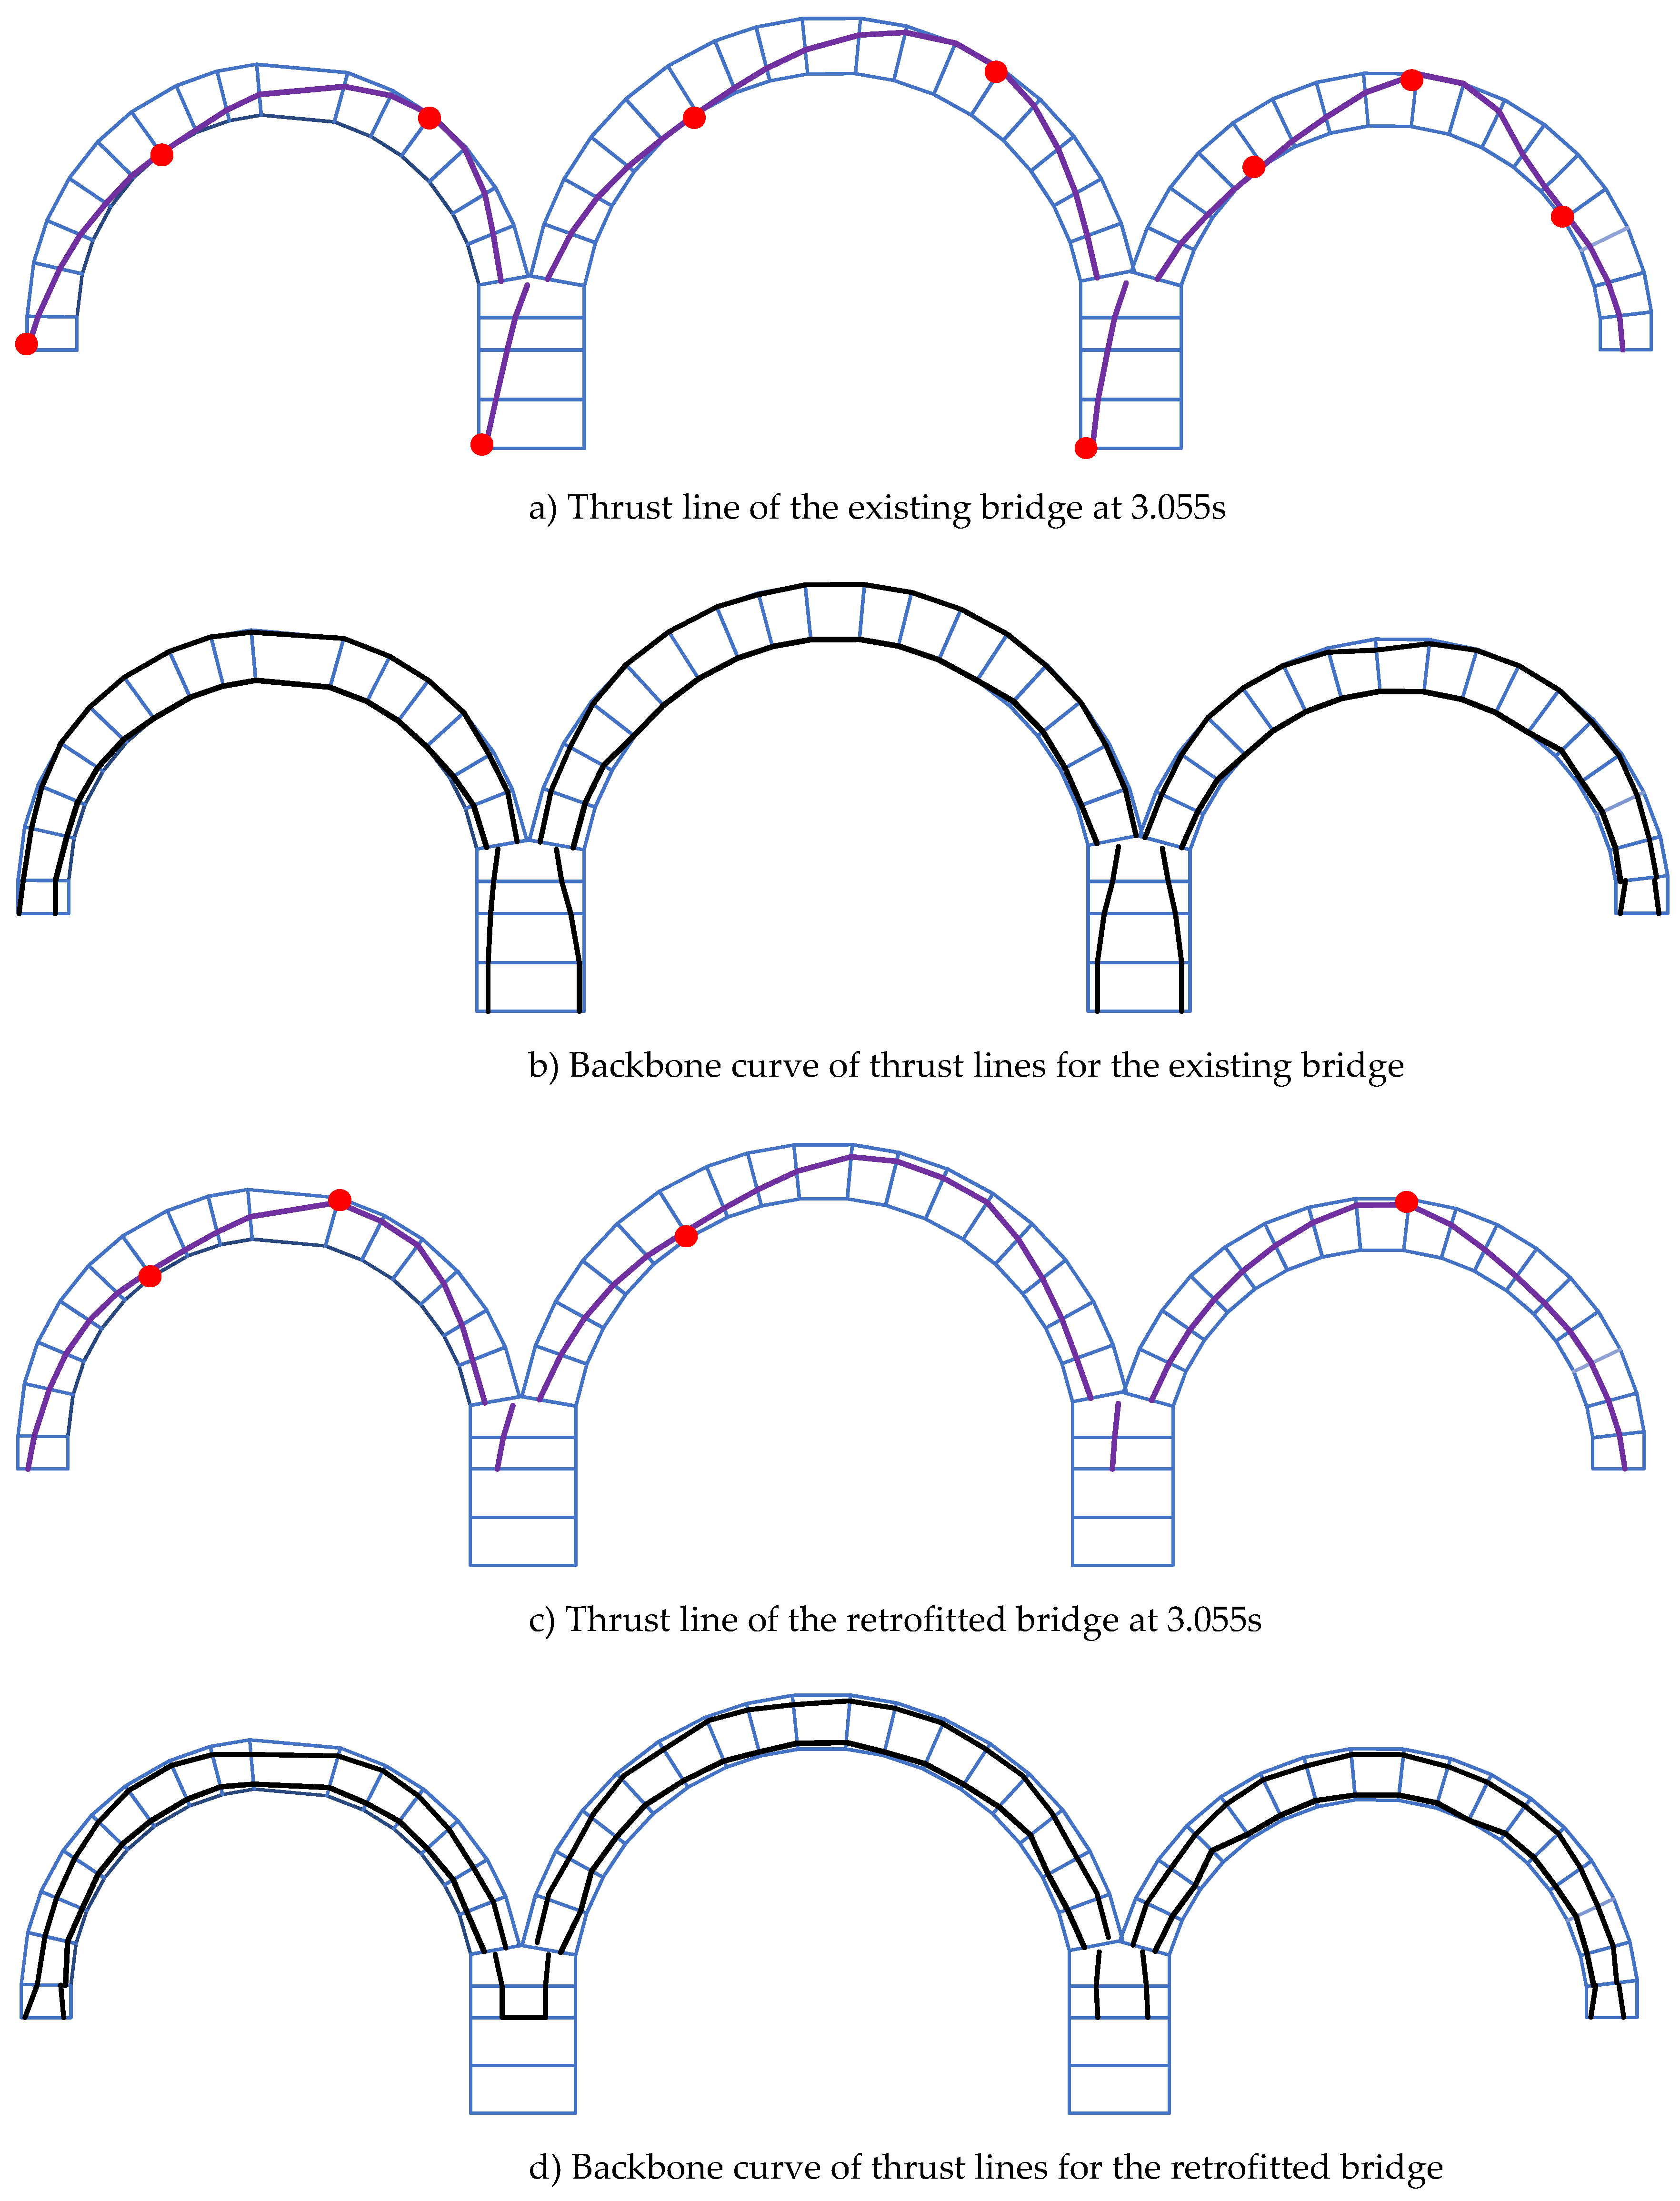
Finally, the seismic performance of the bridge was determined by conducting time history analyses with derived ground motion couples. The horizontal and vertical earthquake loading were applied simultaneously after the nonlinear dead load analysis. The collapse mechanism was attained for the existing bridge under all ground motion couples. For example, the thrust line showing a global mechanism formation at time 3.055 s of the EW component of the Erzincan earthquake is presented in Figure 13a, illustrating the mechanism at this instant. The rotation hinges, identified within 8% margin of safety from the analysis (i.e., eccentricities between ±0.46 and ±0.50), are shown with red circles on the figure. The backbone curves of the thrust lines during the same earthquake are also shown in Figure 13b. The earthquake demands resulted in hinging at various interfaces at different instants. The results showed that the bridge at its current state cannot satisfy life safety performance requirements under the defined earthquake scenario.
4.4. Retrofit of the Bridge
The following applications were chosen to improve the seismic performance of the bridge:
- The effective heights of piers were reduced by 0.80m by placing fill material around the pier foundations. This intervention aims to prevent hinging observed in the bridge piers due to the overturning moments.
- The ruined northern sidewall was partially restored and restrained with a retaining wall in the longitudinal direction which would restrict the lateral motion of the bridge in the longitudinal direction.
- The missing spandrels were rebuilt, and lime-added compacted sand was used as a backfill between the spandrels.
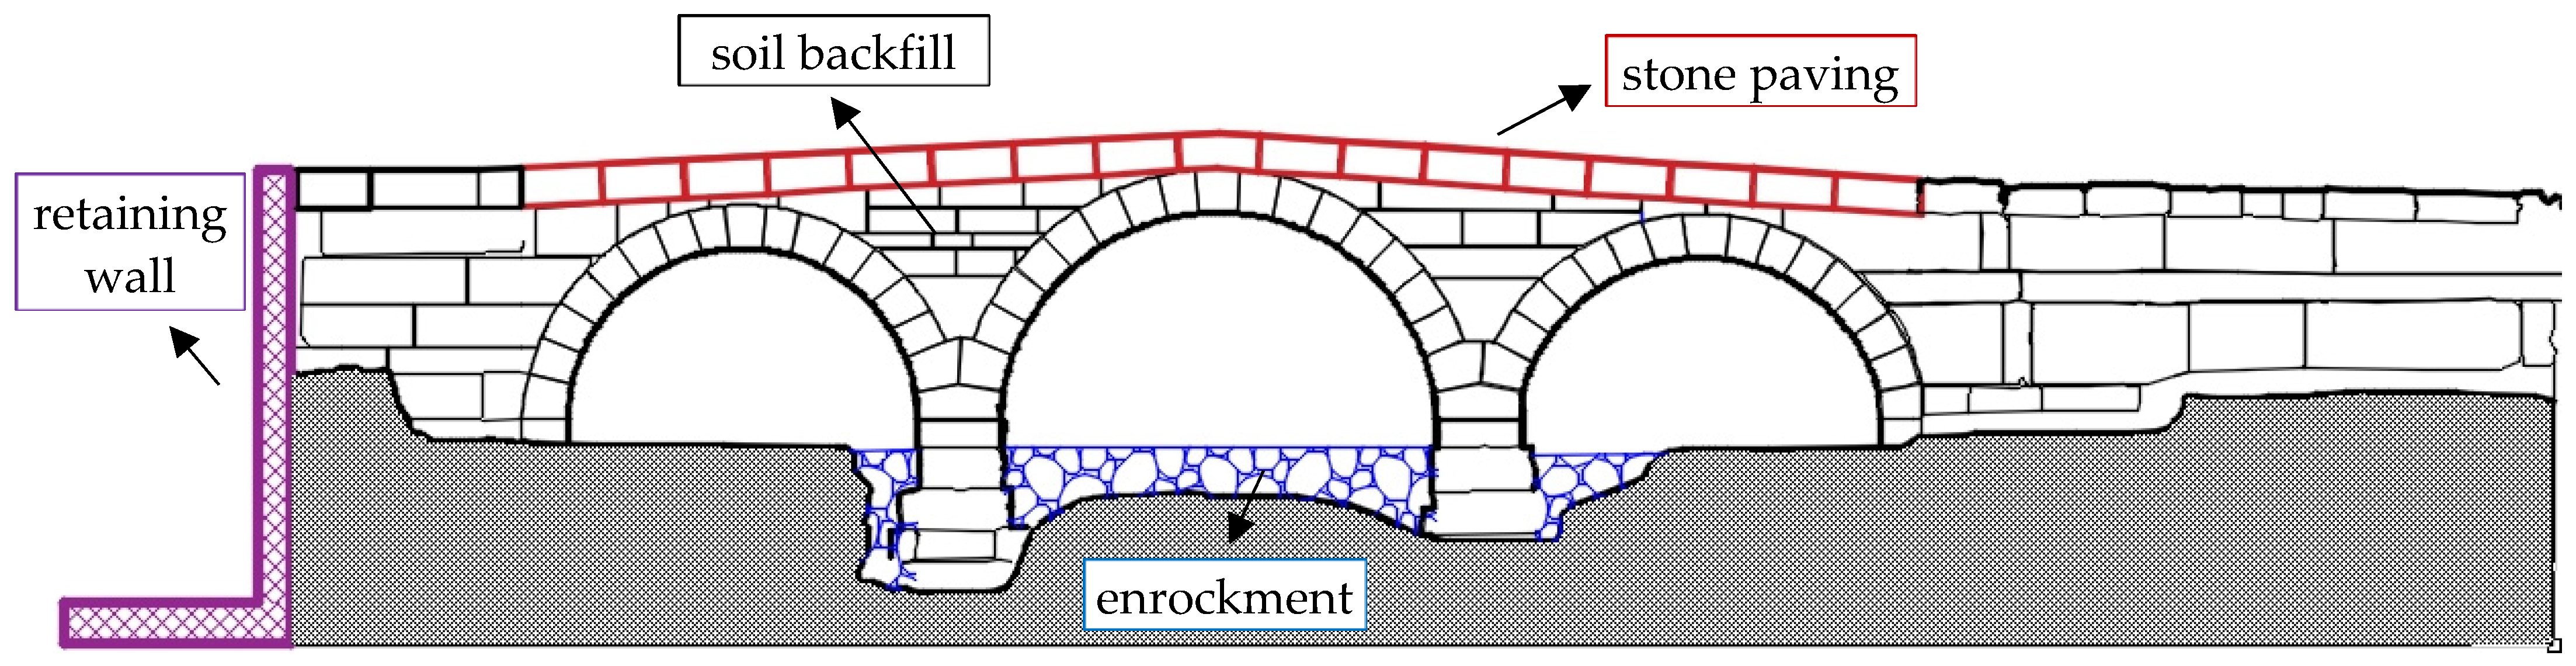
- Cut-stones were placed on the backfill as paving stones. During this operation, a compacted layer of broken stones mixed with lime was also laid between the paving stones and the backfill, as described in the Dictionary of Greek and Roman Antiquities [47]. Together with the previous measure, this intervention should increase the vertical axial pressure on the arches, increasing the friction resistance and limiting the eccentricities.
The sketch of the listed interventions is presented in Figure 14. The structural model of the bridge was updated following these measures and the analyses were repeated. It was observed that the slip and rotation demands at the interfaces were reduced for each earthquake load case. For comparison with the results for the current state, the thrust line for the same earthquake ground motion is plotted for the restored system in Figure 13c at the same instant. The bridge performed better without any signs of local or global mechanisms. The backbone curves of the thrust lines for the restored bridge are closer to the center lines, as illustrated in Figure 13d.
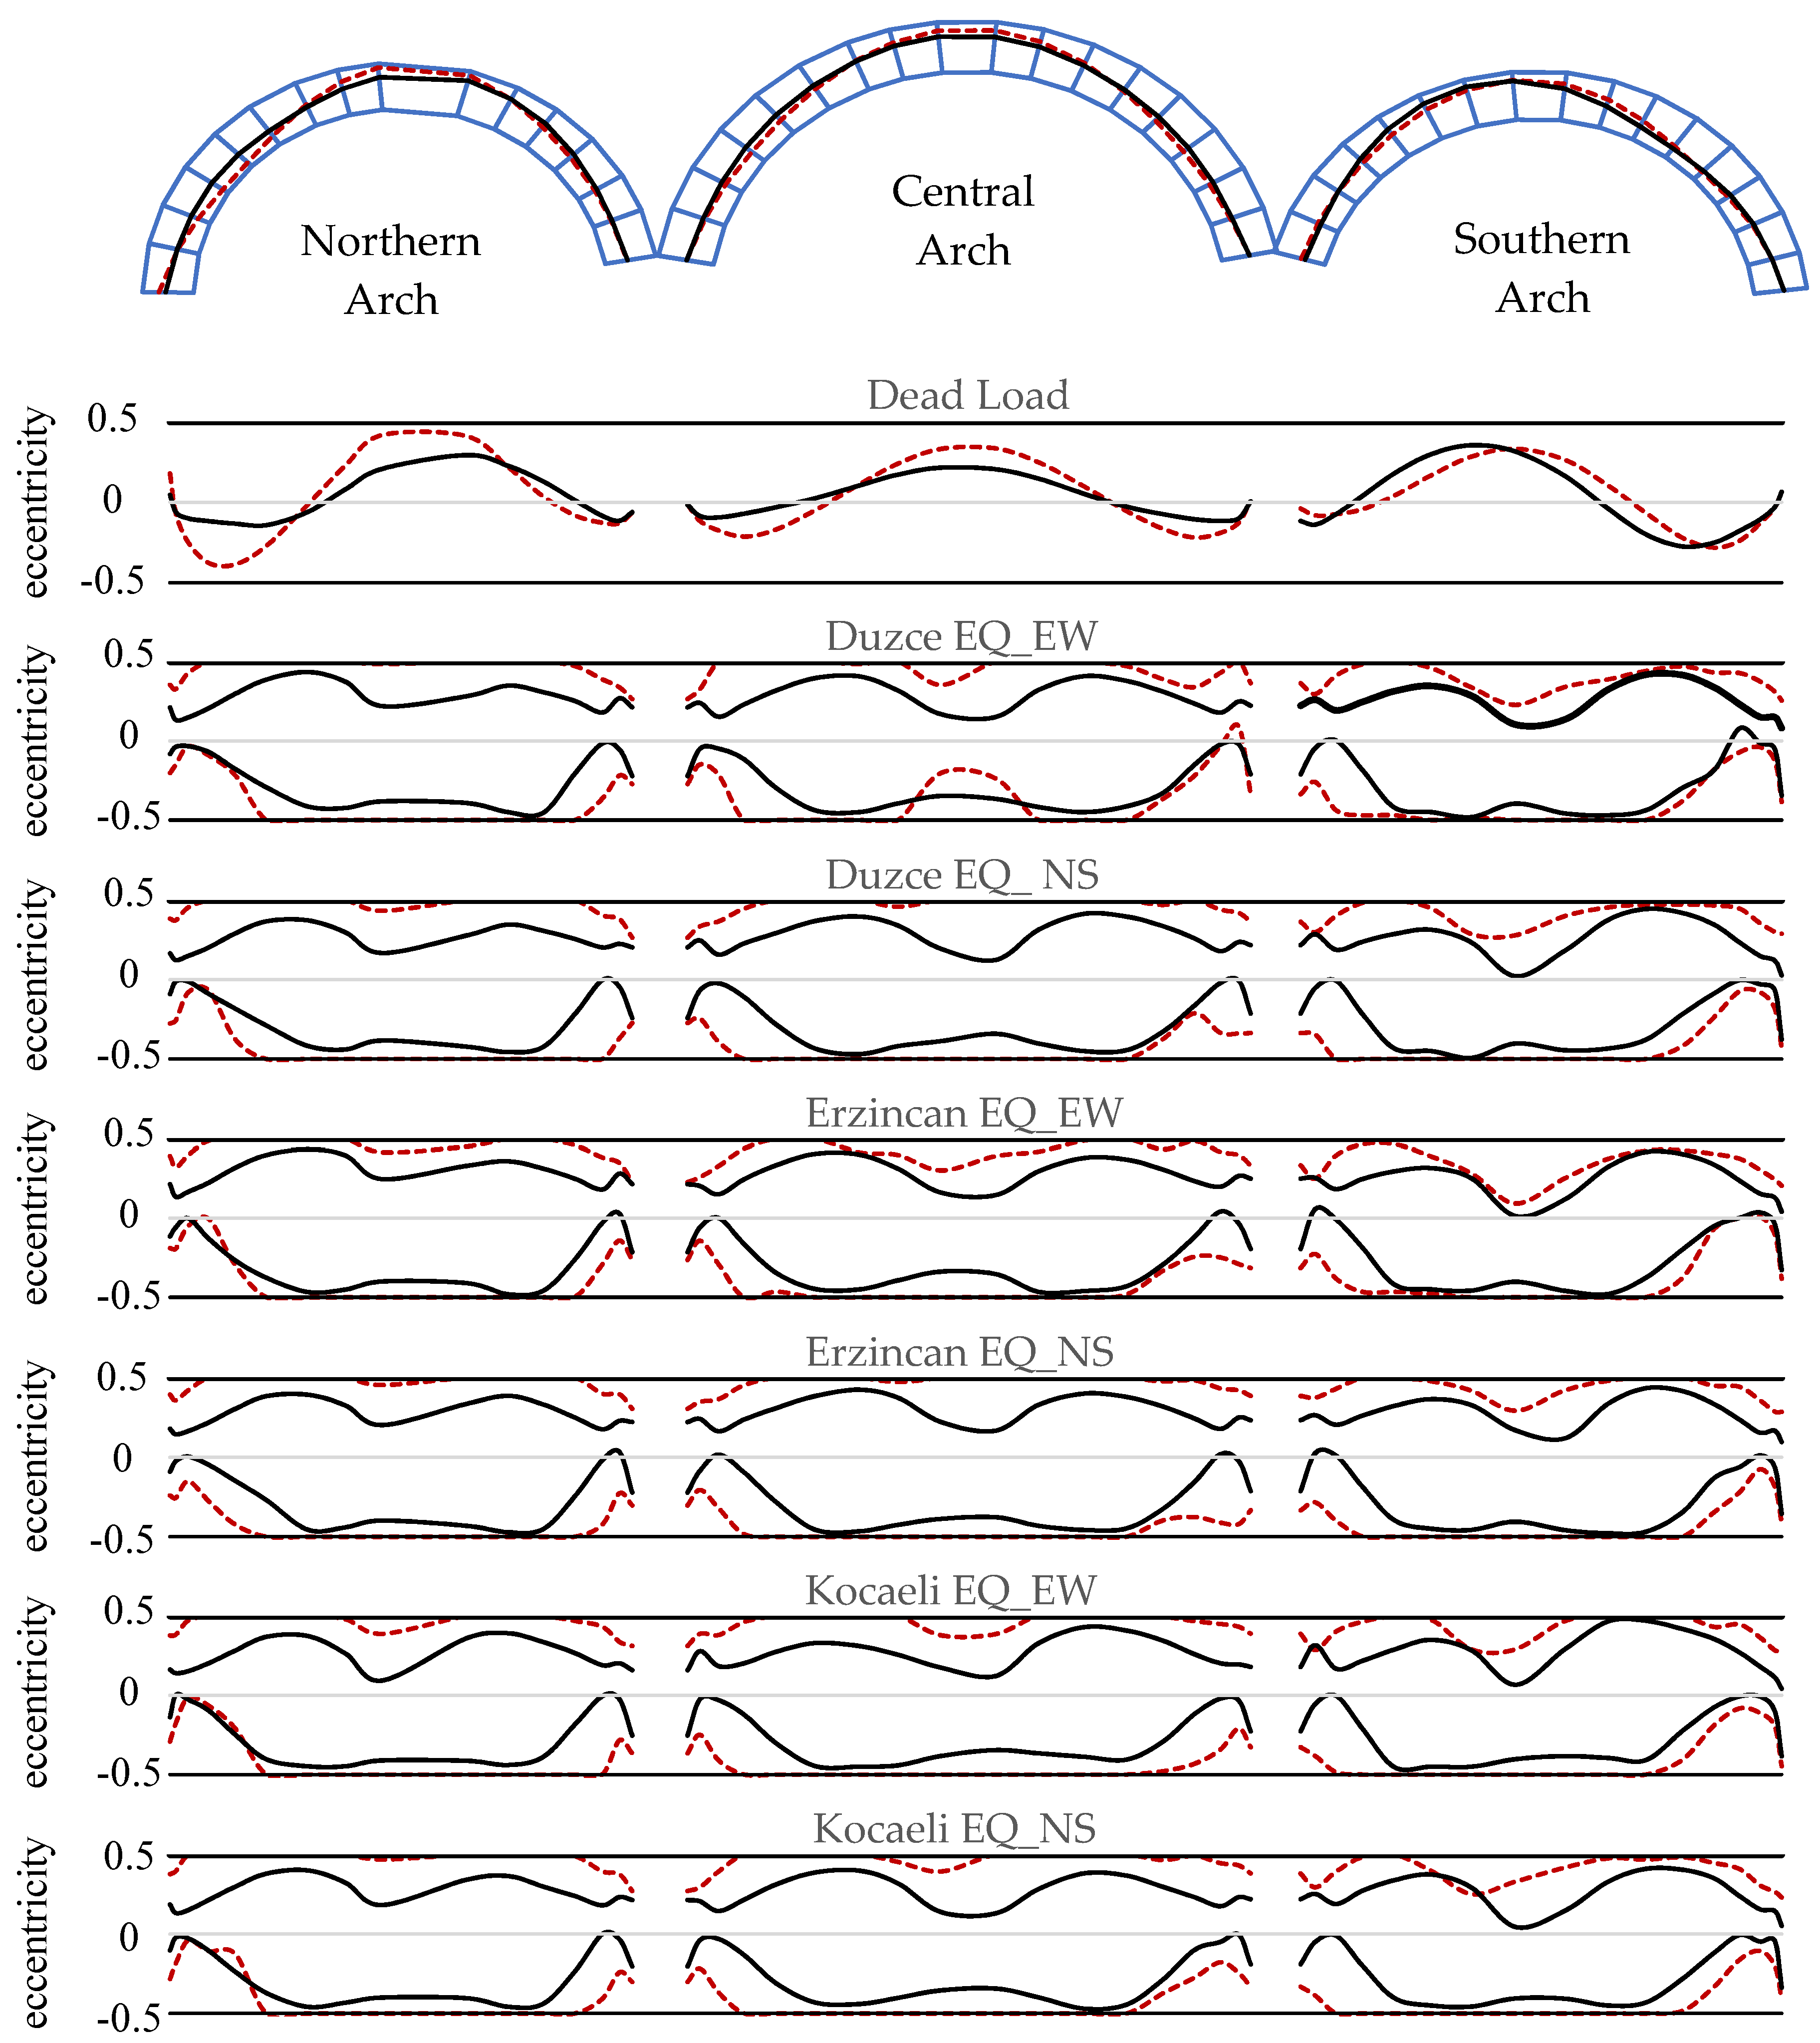
The influence of earthquake ground motion input on the response of the bridge was investigated by plotting the backbone curves of eccentricity demands in the arch rings (Figure 15). These curves represent maximum eccentricity reached at interfaces, clarifying the most forced regions of the arches during the time history analysis. The bottom and upper limits of eccentricity (i.e., e = −0.5 and e = +0.5) correspond to the thrust line passing through the intrados and the extrados, respectively. In order to compare the earthquake demands with the dead load, eccentricity backbones under the dead load were also presented at the top row. It could be inferred that eccentricity demands were observed similarly for different ground excitations. This observation is valid for both the original and the retrofitted structure. In addition, a sufficient number of hinges were formed on the original bridge to cause a loss of stability under the effect of all selected ground motions. On the contrary, the retrofitted bridge experienced limited hinging under the same scenarios.
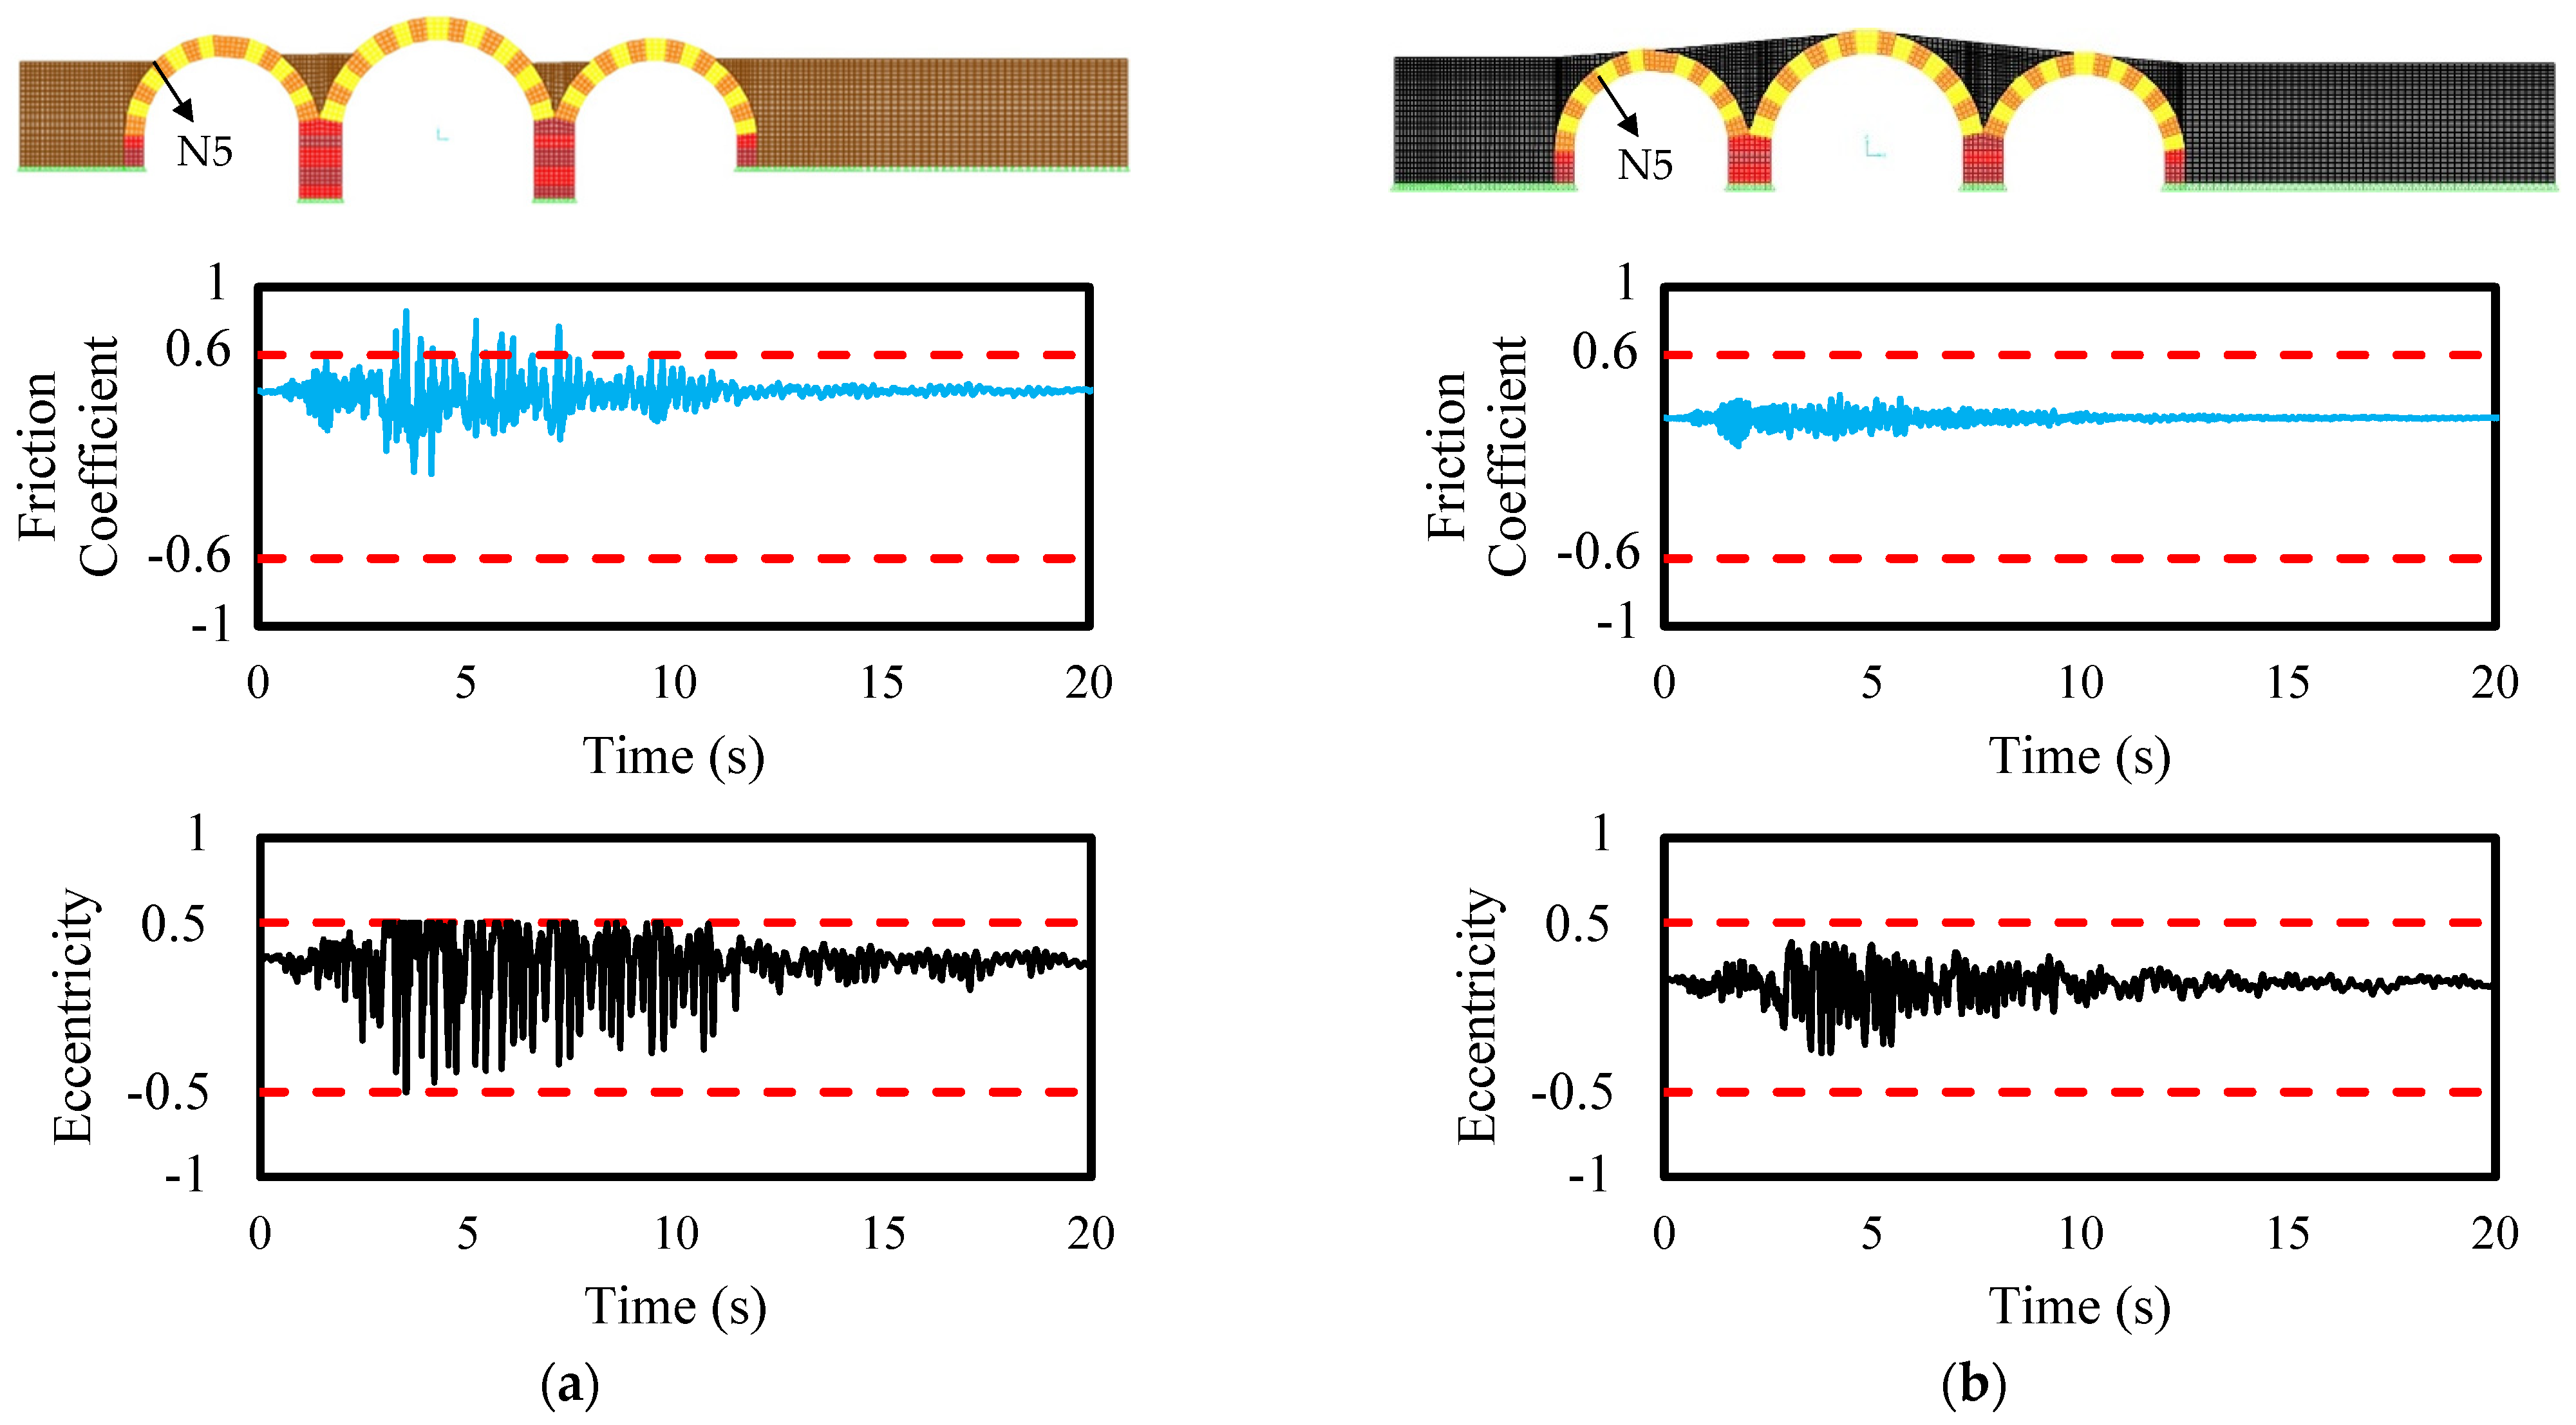
The behavior of the existing and restored bridges was also compared using the response of a selected interface located at the northern arch. Figure 16 expresses the shear demand on the interface as a time-dependent friction coefficient as well as the eccentricity value for both cases along with the limit values. Although the exceedance of the defined limit for an individual interface does not indicate failure, the reduction in the rotation and the sliding demands were apparent for the restored bridge. These results show that the bridge, in its current state, would not meet the expected seismic performance standard for the defined hazard level, yet the restored bridge performs satisfactorily without going into a failure mechanism through the formation of hinging and sliding at the interfaces.
5. Summary and Conclusions
Dry-joint masonry bridges are unique structures whose response is not dependent on the material capacity but is characterized by stability which primarily depends on the rotation or sliding motion at the interfaces. These bridges resist external loads via compression thrusts. Whenever this compression thrust falls inside the arch ring and the pier thickness, and whenever it is large enough to resist shear demand at the cohesionless interfaces between the stone blocks, the structure stays safe. In contrast, any violation of these physical criteria leads to movements at the interfaces that manifest themselves as rigid body rotation or translation (i.e., hinging and sliding) on the body. Exceedance of the sliding capacity or hinging in a specific interface would not threaten the stability of the system due to the redundancy of the arch form. However, if the adequate number of hinges required for a failure mechanism formed simultaneously, a progressive collapse would be triggered. In other words, unlike most other structures, the failure of dry-joint arches is not through the exceedance of material capacities, but the disturbance of the stable arch form through rotational and sliding motions at the interfaces.
Estimating the failure mechanism under a specific loading, and computing the corresponding failure load without extensive material characterization, makes the limit analysis method an effective and widely used procedure. However, this well-known limit analysis technique has some limitations in incorporating the dynamic nature of earthquake loading. The evaluation of the capacity under lateral loads calls for estimating the collapse mechanism and the corresponding horizontal load multiplier activating the prescribed mechanism.
A hybrid methodology combining the versatility of the finite element method and the limit analysis method is proposed in this study to overcome this problem. The proposed method was dependent on the continuous tracing of the probable mechanism formations, including local and global mechanisms. Therefore, at each step of time history analysis, the stress distribution for all interfaces was obtained and a thrust line was drawn. After that, the generated thrust line was checked for local or global failure mechanisms. When this continuous thrust line yielded a mechanism, the analysis was halted. Although there was a probability of having local failure modes in this proposed method, the authors did not encounter any local failure mechanisms during the analysis of the case study bridge.
The simplicity of the proposed technique allows the use of any commercial software for modeling. In this method, the stone blocks were modeled by elastic shell elements, whereas the nonlinear behavior of the interface between stone-to-stone and stone-to-soil joints was simulated by utilizing compression-only axial link elements perpendicular to the interface axis and shear hinges parallel to the interface axis. The shell elements were meshed using a reasonable mesh size, resulting in four elements and five shear-compression spring couples on the arch’s thickness. The proposed approach enables performing time history analysis of dry-joint masonry arch structures considering vertical and horizontal components of ground motion with reasonable computational effort.
The proposed method was applied to assess a Roman dry-arch masonry bridge located in a seismically active region in Turkey. It was shown that the unsatisfactory performance of the bridge was enhanced by retrofitting measures, such as rebuilding the damaged spandrels, sidewalls, pavement, and the implementation of backfilling.
Author Contributions
Conceptualization, I.O.D.; methodology, I.O.D., A.A.; software, A.A., I.O.D.; validation, A.A.; formal analysis, A.A.; investigation, I.O.D., A.A.; resources, I.O.D.; writing—original draft preparation, A.A.; writing—review and editing, I.O.D., A.A.; visualization, I.O.D., A.A. Both authors have read and agreed to the published version of the manuscript.
Funding
This research received no external funding.
Data Availability Statement
The data presented in this study are available on reasonable request from the corresponding author.
Acknowledgments
The authors are grateful for the support and companion of ANB Architecture and Restoration team, namely Arch. Umut Bilgiç, M.Arch. Merve Çolak and Arch. Serkan Songur. Permissions from the Turkish General Directorate of Highways and Princeton University to use graphical material are deeply appreciated. English editing support provided by Yalın Arıcı was gratefully acknowledged.
Conflicts of Interest
The authors declare no conflict of interest.
References
- Halifeoǧlu, F.M.; Sert, H.; Yilmaz, S. Tarihi kurt köprüsü (mihrapli köprü, vezirköprü) restorasyonu proje ve uygulama çalişmalari. Metu J. Fac. Archit. 2013, 30, 81–104. [Google Scholar] [CrossRef]
- Ural, A.; Doğangün, A. Arch bridges in East Blacksea Region of Turkey and effects of infill materials on a sample bridge. In Proceedings of the 5th International Conference on Arch Bridges, Funchal, Madeira, 12–14 September 2007. [Google Scholar]
- Duman, T.Y.; Çan, T.; Emre, Ö.; Kadirioğlu, F.T.; Baştürk, N.B.; Kılıç, T.; Arslan, S.; Özalp, S.; Kartal, R.F.; Kalafat, D.; et al. Seismotectonic database of Turkey. Bull. Earthq. Eng. 2018, 16, 3277–3316. [Google Scholar] [CrossRef]
- Earthquake Risk Management Guide for Historic Buildings; Turkish Directorate General of Foundations: Ankara, Turkey, 2017; ISBN 978-975-19-6779-4.
- Clemente, P. Introduction to dynamics of stone arches. Earthq. Eng. Struct. Dyn. 1998, 27, 513–522. [Google Scholar] [CrossRef]
- Turkish Building Earthquake Code 2018: Specification for Building Design Under Earthquake Effects; Turkish Ministry of Environment and Urbanization: Ankara, Turkey, 2018.
- Heyman, J. The Stone Skeleton: Structural Engineering of Masonry Architecture; Cambridge University Press: Cambridge, UK, 1995. [Google Scholar]
- Heyman, J. The safety of masonry arches. Int. J. Mech. Sci. 1968, 11, 363–385. [Google Scholar] [CrossRef]
- Nobile, L.; Bartolomeo, V. Structural analysis of Historical Masonry Arches: State-of-the-art and recent developments. Int. J. Math. Model. Methods Appl. Sci. 2015, 9, 338–344. [Google Scholar]
- Gilbert, M. Limit analysis applied to masonry arch bridges: State-of-the-art and recent developments. In Proceedings of the 5th International Conference on Arch Bridges (ARCH’07), Funchal, Madeira, 12–14 September 2007; pp. 13–28. [Google Scholar]
- Chiozzi, A.; Malagù, M.; Tralli, A.; Cazzani, A. ArchNURBS: NURBS-Based Tool for the Structural Safety Assessment of Masonry Arches in MATLAB. J. Comput. Civ. Eng. 2016, 30, 04015010. [Google Scholar] [CrossRef]
- Gilbert, M. RING: A 2D rigid-block analysis program for masonry arch bridges. In Proceedings of the International Conference on Arch Bridges, Paris, France, 19–21 September 2001; pp. 459–464. [Google Scholar]
- Da Porto, F.; Franchetti, P.; Grendene, M.; Ranzato, L.; Valluzzi, M.; Modena, C. Structural capacity of masonry arch bridges to horizontal loads. In Proceedings of the 5th International Conference on Arch Bridges, Funchal, Madeira, 12–14 September 2007. [Google Scholar]
- De Luca, A.; Giordano, A.; Mele, E. A simplified procedure for assessing the seismic capacity of masonry arches. Eng. Struct. 2004, 26, 1915–1929. [Google Scholar] [CrossRef]
- Cavalagli, N.; Gusella, V.; Severini, L. Lateral loads carrying capacity and minimum thickness of circular and pointed masonry arches. Int. J. Mech. Sci. 2016, 115–116, 645–656. [Google Scholar] [CrossRef]
- Lemos, J.V. Discrete element modeling of masonry structures. Int. J. Archit. Herit. 2007, 1, 190–213. [Google Scholar] [CrossRef]
- Smoljanović, H.; Živaljić, N.; Nikolić, Ž. A combined finite-discrete element analysis of dry stone masonry structures. Eng. Struct. 2013, 52, 89–100. [Google Scholar] [CrossRef]
- Lourenço, P.B.; Oliveira, D.V.; Roca, P.; Orduña, A. Dry Joint Stone Masonry Walls Subjected to In-Plane Combined Loading. J. Struct. Eng. 2005, 131, 1665–1673. [Google Scholar] [CrossRef] [Green Version]
- Bui, T.T.; Limam, A.; Sarhosis, V.; Hjiaj, M. Discrete element modelling of the in-plane and out-of-plane behaviour of dry-joint masonry wall constructions. Eng. Struct. 2017, 136, 277–294. [Google Scholar] [CrossRef] [Green Version]
- Pulatsu, B.; Erdogmus, E.; Bretas, E.M. Parametric Study on Masonry Arches Using 2D Discrete-Element Modeling. J. Archit. Eng. 2018, 24, 04018005. [Google Scholar] [CrossRef] [Green Version]
- Smoljanović, H.; Živaljić, N.; Nikolić, Ž.; Munjiza, A. Numerical analysis of 3D dry-stone masonry structures by combined finite-discrete element method. Int. J. Solids Struct. 2018, 136–137, 150–167. [Google Scholar] [CrossRef]
- Gönen, S.; Soyöz, S. Reliability-based seismic performance of masonry arch bridges. Struct. Infrastruct. Eng. 2021, 1–16. [Google Scholar] [CrossRef]
- Gaetani, A.; Bianchini, N.; Lourenço, P.B. Simplified micro-modelling of masonry cross vaults: Stereotomy and interface issues. Int. J. Mason. Res. Innov. 2021, 6, 97–125. [Google Scholar] [CrossRef]
- Pelà, L.; Aprile, A.; Benedetti, A. Seismic assessment of masonry arch bridges. Eng. Struct. 2009, 31, 1777–1788. [Google Scholar] [CrossRef]
- Bernat-Maso, E.; Gil, L.; Marce-Nogue, J. The structural performance of arches made of few vossoirs with dry-joints. Struct. Eng. Mech. An Int. J. 2012, 44, 775–799. [Google Scholar] [CrossRef]
- Pantò, B.; Cannizzaro, F.; Caddemi, S.; Caliò, I.; Chácara, C.; Lourenço, P.B. Nonlinear modelling of curved masonry structures after seismic retrofit through FRP reinforcing. Buildings 2017, 7, 79. [Google Scholar] [CrossRef] [Green Version]
- Stockdale, G.; Milani, G.; Sarhosis, V. Increase in seismic resistance for a full-scale dry stack masonry arch subjected to hinge control. Key Eng. Mater. 2019, 817, 221–228. [Google Scholar] [CrossRef]
- Saygili, Ö.; Lemos, J.V. Investigation of the structural dynamic behavior of the frontinus gate. Appl. Sci. 2020, 10, 5821. [Google Scholar] [CrossRef]
- Stockdale, G.L.; Sarhosis, V.; Milani, G. Seismic Capacity and Multi-Mechanism Analysis for Dry-Stack Masonry Arches Subjected to Hinge Control; Springer: Dordrecht, The Netherlands, 2020; Volume 18, ISBN 0123456789. [Google Scholar]
- Ferrero, C.; Calderini, C.; Portioli, F.; Roca, P. Large displacement analysis of dry-joint masonry arches subject to inclined support movements. Eng. Struct. 2021, 238, 112244. [Google Scholar] [CrossRef]
- Aldemir, A.; Erberik, M.A.; Demirel, I.O.; Sucuoǧlu, H. Seismic performance assessment of unreinforced masonry buildings with a hybrid modeling approach. Earthq. Spectra 2013, 29, 33–57. [Google Scholar] [CrossRef]
- Sarhosis, V.; De Santis, S.; de Felice, G. A review of experimental investigations and assessment methods for masonry arch bridges. Struct. Infrastruct. Eng. 2016, 12, 1439–1464. [Google Scholar] [CrossRef]
- Costa, C.; Arede, A.; Costa, A. Mechanical characterization of the constituent materials of stone arch bridges. Int. Mason. Conf. 2014, 2014, 1–12. [Google Scholar]
- Costa, C.; Arêde, A.; Morais, M.; Aníbal, A. Detailed FE and de Modelling of Stone Masonry Arch Bridges for the Assessment of Load-carrying Capacity. Procedia Eng. 2015, 114, 854–861. [Google Scholar] [CrossRef] [Green Version]
- Milani, G.; Lourenço, P.B. 3D nonlinear behavior of masonry arch bridges. Comput. Struct. 2012, 110–111, 133–150. [Google Scholar] [CrossRef] [Green Version]
- Block, P. Equilibrium Systems Studies in Masonry Structure; Massachusetts Institute of Technology: Cambridge, MA, USA, 2005. [Google Scholar]
- Kadioglu, M. Prusias ad Hypium Bridge Historical Research and Archeology Report; General Directorate of Highways: Ankara, Turkey, 2019. [Google Scholar]
- Hommaire de Hell, X. Voyage en Turquie et en Perse; Paris, France, 1854; Available online: https://archive.org/details/voyageenturquie00basgoog/page/n9 (accessed on 17 July 2021).
- Zeyrek, T.H.; Çelik, B. Prusias ad Hypium—Kieros Anadolu’nun Kuzeybatısında Antik Bir Kent; Egyınları: Istanbul, Turkey, 2005. [Google Scholar]
- Konuralp Bridge Surveying and Restitution Technical Report; General Directorate of Highways: Ankara, Turkey, 2020.
- Bayraktar, A.; Hökelekli, E. Seismic Performances of Different Spandrel Wall Strengthening Techniques in Masonry Arch Bridges. Int. J. Archit. Herit. 2020, 1–19. [Google Scholar] [CrossRef]
- Kadirioğlu, F.T.; Kartal, R.F.; Kılıç, T.; Kalafat, D.; Duman, T.Y.; Özalp, S.; Emre, Ö. An Improved Earthquake Catalogue (M ≥ 4.0) for Turkey and Near Surrounding (1900–2012). In Proceedings of the Second European Conference on Earthquake Engineering, İstanbul, Turkey, 25–29 August 2014; pp. 411–422. [Google Scholar]
- Boore, D.M.; Atkinson, G.M. Ground-motion prediction equations for the average horizontal component of PGA, PGV, and 5%-damped PSA at spectral periods between 0.01 s and 10.0 s. Earthq. Spectra 2008, 24, 99–138. [Google Scholar] [CrossRef] [Green Version]
- Gönen, S.; Soyöz, S. Seismic analysis of a masonry arch bridge using multiple methodologies. Eng. Struct. 2021, 226. [Google Scholar] [CrossRef]
- SAP2000 Integrated Software for Structural Analysis and Design; Version 22.0.0; Computer and Structures: Walnut Creek, CA, USA, 2020.
- Gencturk, B.; Mullapudi, T.R.S.; Kilic, S.A.; Erdik, M. Capacity Assessment of the Titus Tunnel Bridge Using Analytical and Numerical Techniques. J. Perform. Constr. Facil. 2014, 28, 349–362. [Google Scholar] [CrossRef] [Green Version]
- Smith, W. Dictionary of Greek and Roman Antiquitiese, 3rd ed.; John Murray: London, UK, 1890. [Google Scholar]
Figure 1.
Dry-joint masonry arch bridges in Turkey: (a) Titus tunnel bridge, Hatay (Princeton Antioch expedition archives); (b) Dara stone bridge, Mardin (turkisharchaeonews.net, accessed on 1 July 2021).
Figure 1.
Dry-joint masonry arch bridges in Turkey: (a) Titus tunnel bridge, Hatay (Princeton Antioch expedition archives); (b) Dara stone bridge, Mardin (turkisharchaeonews.net, accessed on 1 July 2021).

Figure 2.
Interface modeling.

Figure 3.
Comparison of limit analysis and proposed modelling: (a) Proposed model; (b) ArchNURBS model; (c) Hinging (proposed model); (d) Hinging (ArchNURBS); (e) Capacity curves and (f) Mesh Sensitivity Results.
Figure 3.
Comparison of limit analysis and proposed modelling: (a) Proposed model; (b) ArchNURBS model; (c) Hinging (proposed model); (d) Hinging (ArchNURBS); (e) Capacity curves and (f) Mesh Sensitivity Results.

Figure 4.
Case study bridge images: (a) Watercolor painting adapted from [38]; (b) Photograph adapted from [39].

Figure 5.
Survey drawings of the case study bridge (courtesy of ANB Architecture).

Figure 6.
Site photographs of the case study bridge.

Figure 7.
Measured arch geometry and estimated mathematical forms (blue: downstream measurement, green: upstream measurement, pink: semi-circle fit).
Figure 7.
Measured arch geometry and estimated mathematical forms (blue: downstream measurement, green: upstream measurement, pink: semi-circle fit).

Figure 8.
Site-specific ground motions used in the numerical analysis.

Figure 9.
Site-specific design spectrums: (a) Horizontal; (b) Vertical.

Figure 10.
Numerical model details of the case study bridge.

Figure 11.
Modal analysis results for the existing bridge.

Figure 12.
Dead load analysis results for the existing bridge (backfill excluded from the figure).

Figure 13.
Line of thrust for the existing and retrofitted bridges under Erzincan EQ (EW).

Figure 14.
Retrofitting measures taken for the bridge.

Figure 15.
Backbone eccentricity curves (dotted lines: existing bridge, continuous lines: retrofitted bridge).
Figure 15.
Backbone eccentricity curves (dotted lines: existing bridge, continuous lines: retrofitted bridge).

Figure 16.
Time history analysis results for interface N5 under Erzincan EQ_EW: (a) Existing bridge; (b) Retrofitted bridge.
Figure 16.
Time history analysis results for interface N5 under Erzincan EQ_EW: (a) Existing bridge; (b) Retrofitted bridge.


Table 1.
Geometrical characterization of the case study bridge arches.
| Property | Main Arch | Northern Arch | Southern Arch |
|---|---|---|---|
| Span | 5.81 m | 4.71 m | 4.89 m |
| Rise | 2.41 m | 1.89 m | 1.86 m |
| Thickness | 0.577 m | 0.527 m | 0.546 m |
| Angle of embrace | 159o | 157o | 150o |
| Number of stones | 17 | 14 | 15 |
Table 2.
Summary of material and interface properties.
| Costa et al. (2014) | Prusias ad Hypium Bridge | |
|---|---|---|
| Stone Blocks | ||
| Compressive strength | 51.0–66.9 MPa | 56.0 MPa |
| Unit weight | 24.1–26.4 kN/m3 | 26.0 kN/m3 |
| Modulus of elasticity | 22,400–39,200 MPa | 30,000 MPa |
| Shear modulus | - | 12,500 MPa |
| Soil Backfill | ||
| Unit weight | 16.3 kN/m3 | 18 kN/m3 |
| Modulus of elasticity | 6.25–23.75 MPa | 6.25 MPa |
| Shear modulus | - | 2.60 MPa |
| Stone to Stone Links | ||
| Axial stiffness | 1.33–1.98 MPa/mm | 1.48 MPa/mm |
| Shear stiffness | 0.05–0.97 MPa/mm | 0.30 MPa/mm |
| Friction coefficient, µ | 0.57 | 0.60 |
| Soil to Stone Links | ||
| Axial stiffness | 0.10–0.53 MPa/mm | 0.30 MPa/mm |
| Shear stiffness | 0.09–0.40 MPa/mm | 0.24 MPa/mm |
Table 3.
Major recorded seismic events close to the case study bridge.
| Date | Mw | Location | Repi (km) | Lifes Loss | Injured People | Intensity (MSK) | PGA (g) |
|---|---|---|---|---|---|---|---|
| 20.06.1943 | 6.6 | Adapazari-Hendek | 35.0 1 | 336 | 234 | VIII | 0.192 |
| 01.02.1944 | 7.3 | Bolu-Gerede | 90.0 1 | 3959 | - | X | 0.125 |
| 26.05.1957 | 7.1 | Bolu-Abant | 35.0 1 | 52 | 101 | X | 0.233 |
| 22.07.1967 | 6.8 | Bolu-Mudurnu | 50.0 1 | 83 | - | X | 0.172 |
| 17.08.1999 | 7.5 | Kocaeli-Golcuk | 109.0 | 18,373 | 48,901 | X | 0.108 |
| 12.11.1999 | 7.1 | Duzce | 15.4 | 710 | 2679 | X | 0.299 |
1 Distance to the center of the corresponding district specified in the location column.
Publisher’s Note: MDPI stays neutral with regard to jurisdictional claims in published maps and institutional affiliations. |
© 2021 by the authors. Licensee MDPI, Basel, Switzerland. This article is an open access article distributed under the terms and conditions of the Creative Commons Attribution (CC BY) license (https://creativecommons.org/licenses/by/4.0/).
Share and Cite
MDPI and ACS Style
Demirel, I.O.; Aldemir, A. Simplified Approach for Seismic Performance Assessment of Dry-Joint Masonry Arch Bridges. Buildings 2021, 11, 313. https://0-doi-org.brum.beds.ac.uk/10.3390/buildings11070313
AMA Style
Demirel IO, Aldemir A. Simplified Approach for Seismic Performance Assessment of Dry-Joint Masonry Arch Bridges. Buildings. 2021; 11(7):313. https://0-doi-org.brum.beds.ac.uk/10.3390/buildings11070313
Chicago/Turabian StyleDemirel, Ismail Ozan, and Alper Aldemir. 2021. "Simplified Approach for Seismic Performance Assessment of Dry-Joint Masonry Arch Bridges" Buildings 11, no. 7: 313. https://0-doi-org.brum.beds.ac.uk/10.3390/buildings11070313
Note that from the first issue of 2016, this journal uses article numbers instead of page numbers. See further details here.