
Evaluating the Indoor Air Quality after Renovation at the Greens in Dubai, United Arab Emirates


Department of Architecture, College of Architecture, Art and Design, Ajman University, Ajman P.O. Box 346, United Arab Emirates
*
Author to whom correspondence should be addressed.
Buildings 2021, 11(8), 353; https://0-doi-org.brum.beds.ac.uk/10.3390/buildings11080353
Submission received: 8 July 2021
/
Revised: 6 August 2021
/
Accepted: 11 August 2021
/
Published: 15 August 2021
(This article belongs to the Special Issue Emerging Methodologies and Technologies for Assessing the Impact of Air Quality and Thermal, Visual, and Acoustic Comfort on Indoor Environmental Quality)
Abstract
:The Public Health and Safety Department of Dubai Municipality had evaluated the indoor air quality in public buildings in 2013, then established the IAQ (Indoor Air Quality) regulation. Even though IAQ in public building is in control, indoor air pollution in new and renovated housing is still very problematic. The objective of this paper is to measure the indoor air quality of the residential unit in an apartment after renovation to evaluate the actual condition and to analyze the influential factors. As a methodology, field measurements, resident interviews, and observations were conducted for 20 residential units to investigate basic information, renovation contents, ventilation characteristics, and SBS (Sick Building Syndrome) symptoms. The results showed that renovation related to the indoor air quality was the replacement of finishing materials. It was statistically proven that the average CO2 for each house was 683–2309.4 ppm, and 15 houses exceeded the WHO IAQ standards. TVOC had an average concentration of 0–3.0 ppm per house, exceeding the standard in 10 houses. Formaldehyde (CH2O) had an average concentration of 0–1.02 ppm per house, exceeding the WHO IAQ standard (0.1 ppm) in 12 houses. However, even though the indoor air quality was polluted, the residents were hardly aware of it based on subjective response survey. As the amount of renovation increases, the concentration of formaldehyde (CH2O) increases significantly, and excessive renovation should be avoided. This study will serve as a basic dataset to suggest that the new IAQ regulation not be compulsory for residents; rather, they must induce contractors with stipulation to maintain IAQ during and after renovation.
1. Introduction
Since 2000, global awareness on indoor air quality in new buildings such as the Sick Building Syndrome (SBS) has been increased [1,2,3], and related laws and regulations have been enacted in each country [4,5,6]. Toxic materials, improper ventilation, high temperature, and humidity are the main reasons for indoor air pollution in our homes. Since indoor air pollution is mostly caused by the sources that release toxic gases or particles into the air, the first solution for IAQ is to use sustainable building materials. Recently, the importance of Indoor Air Quality (IAQ) not only in new buildings but also in existing buildings has been highlighted [7,8,9]. The United Arab Emirates (UAE) has a desert climate with sweltering summers, with annual 120 mm rainfall [10]. Due to rapid urbanization with population growth, massive volume of unproven/unrated building materials were used for fast-track construction [11,12,13]. After The Public Health and Safety Department of Dubai Municipality had initiated to evaluate the indoor air in public buildings such as in educational institutions, universities, schools, nurseries, kindergartens, and health care centers in 2013 [14], they established the IAQ (Indoor Air Quality) stipulation with less than 0.08 ppm (parts per million) of formaldehyde, less than 300 micrograms/m3 of TVOC (Total Volatile Organic Compound), and less than 150 micrograms/m3 of suspended particulates (less than 10 microns) in 8 h of continuous monitoring prior to occupancy [15,16]. According to Bani et al. (2020) and Nazzal (2015), indoor air quality was measured in 12 newly built and remodeled villas in 7 Emirates in United Arab Emirates in 2014 and, as a result, formaldehyde (CH2O) and carbon dioxide (CO2) concentrations were detected 2 to 10 times higher than the standard value in all houses [17,18]. In other words, not only the public buildings mentioned above, but also indoor air pollution in housing (new villas, remodeled villas, and residential villas) are also very problematic [19,20]. However, surveys on indoor air quality are being conducted centered on public facilities and schools in Dubai [21,22]. Relatively less research was done on residential buildings, where residents spend most of the time [23]. Unlike public buildings, residential buildings are different from public buildings since the owner is responsible for improving indoor air quality [24]. However, to date, most of the studies on indoor air pollution related to housing have been on the indoor air quality of new villas or apartment buildings related to Sick Building Syndrome (SBS) [25,26]. There have been only few studies on existing villas related to hazardous air pollutants such as formaldehyde (CH2O) and volatile organic compounds (VOCs) [27,28]. Home renovations such as changing the internal structure or finishing materials are frequently occurring in old villas and apartments in Dubai. The start of rapid urbanization of Dubai dates to early 2000s, and those projects are deteriorating due to old conditions [29,30]. Therefore, the study on the indoor air quality of renovated villas or apartments in Dubai is meaningful [31]. This study is to measure the Indoor Air Quality (IAQ) of the apartment where the resident lives after renovation. The purpose of this study is to understand the actual situation of IAQ after renovation and to analyze the influencing factors.
2. Materials and Methods
The Greens Dubai project was developed by Emaar Properties and completed in 2002 [32]. It is in one of a prime locations in Dubai, the Al Thanyya area next to Sheikh Zayed Road, E11, with easy access to Al Khail Road, E44 [33] (Figure 1). The Greens Dubai is close to Emaar’s Emirates Living Project such as The Springs, Emirates Hills, and The Meadows, and close to hubs such as Dubai Marina, Dubai Internet City, and Jumeirah Lakes Towers [34]. The Greens Dubai is composed of 6156 homes (one-, two-, three-, and four-bedroom apartments), 36 buildings across 10 complexes, and 20,500 residents from 145 nationalities [35] (Figure 2). Since it has been settled in 20 years, The Greens becomes a serene residential area surrounded by tall trees and dotted with lakes [36]. It is described as a small self-contained town within a larger city, safe, with pedestrian friendly walkways, large greenery, and human-scaled low-rise buildings [33]. The problem in early housing projects in Dubai is that housing units are aging and require serous renovation to maintain the market values [37]. The cost of a two-bedroom apartment unit of 1.2 million AED (Arab Emirates Dirhams) can be sold up to 1.45 million AED and a 1.8 million AED three-bedroom apartment unit could be sold up to 2.2 million AED with the adequate renovation [38]. Our interview with the interior design company specialized in refurbishment in The Greens mentioned that their clients do not hesitate to renovate their older apartments to increase the values with optimal investment for maximum returns [39]. They had witnessed a rapid increase in interest for home renovation in The Greens since clients know they will take advantage of the convenient location when selling their properties.
Sick Building Syndrome (SBS), mostly caused by formaldehyde (CH2O) and volatile organic compounds (VOCs) from building materials, has been one of the serious research topics only in the past 10 years [40,41]. SBS symptoms are eye, nose, and throat irritation, headaches, lethargy, difficulty concentrating, and sometimes dizziness, nausea, and chest tightness [42,43]. Table 1 shows the effects of each hazardous substance on the human body [44].
These chemicals are generated from unrated building materials such as adhesives, varnishes, paints, and tiles in newly built or renovated buildings. Even with minimum amount, it can have serious impact on human body [45,46]. Formaldehyde (CH2O) is emitted from wood, plywood, and furniture, and VOCs are emitted from textile products of household appliances [47,48] (Table 2).
Table 3 shows the most advanced countries’ IAQ standards with detailed regulations. According to WHO standard guideline, the average exposure time is also specified, suggesting the standard in detail according to the exposure time [49,50]. Regarding European IAQ standards, the Air Quality Guidelines for Europe were already established in 1987 with WHO [51]. In the States, EPA (Environmental Protection Agency) and ASHRAE (The American Society of Heating, Refrigerating and Air Conditioning Engineers) set the ventilation regulations for maintaining the indoor air quality [52,53].
The field survey was conducted for 20 one-bedroom and two-bedroom units where residents did renovation in the previous 6 month at The Greens in Dubai [54]. In addition to on-site measurement, resident interviews and observations were also conducted [55]. The main purpose of this study is to understand the actual status, and no factors (area or number of families) were considered other than the scope of ‘apartments that have been renovated within last 6 month’ when selecting the survey subjects [56,57]. After getting the permission from The Greens management office, field survey target apartments were selected based on residents’ willingness to cooperate. The survey was conducted from 20 January to 24April 2020. The average outdoor temperature in January was 19.1 °C (High: 23.9 °C, Low: 14.3 °C), February was 20.5 °C (High: 25.4 °C, Low: 15.5 °C), March was 23.6 °C (High: 28.9 °C, Low: 18.3 °C), and April was 27.5 °C (High: 33.3 °C, Low: 21.7 °C). However, due to Dubai’s constant hot desert climate, most of the apartment buildings including The Greens use central air conditioning all year long. This is the reason why field survey excluded outdoor temperature from the variables. In accordance with the COVID-19 safety rules, social distancing was observed, and interviews and on-site measurements were conducted while wearing a mask (Table 4).
Field measurement was conducted by observing and recording related factors from residents’ behavioral patterns while measuring IAQ [58,59]. The air pollutants for measurement were formaldehyde (CH2O) and Total Volatile Organic Components (TVOC) regarding interior renovation, carbon monoxide (CO), carbon dioxide (CO2), and Total Suspended Particles (TSP) regarding indoor air pollution in residential units [60]. The measurement method of this study is based on the WHO standards, and it was measured at a location of 1.5 m from the center of the living room from 10 am to 6 pm (8 h) with residents on site (Table 5).
As the first step in measuring formaldehyde (CH2O) concentration, before sampling, all windows facing the outside air and interior furniture doors are continuously opened for at least 30 min to perform natural ventilation in advance. As the second step, close all openings (windows, doors, and ventilation openings) facing the outside air for more than 5 h to prevent airflow between the indoor and outdoor areas. At this time, the doors of the furniture and the built-in cabinet are opened to allow the movement of air, and the emitted pollutants are collected. In the third step, after 5 h, a sample is collected with a DNPH (2,4-Dinitrophenylhydrazine) cartridge. The cartridge is rolled up with tinfoil to block any possible light effects. At this time, both the natural and forced ventilation are sealed and samples are collected. Ozone scrubber is used when collecting air samples, and 15 L is collected for 20 min using a precise mini suction pump (0.5 mL/min). The air sample collected in the last step is precisely analyzed by HPLC (High Performance Liquid Chromatography). In the TVOC concentration measurement method, the two steps of the formaldehyde (CH2O) sampling method are the same, and a Tenan-TA tube is used in the third step. In the last step, the air sample collected is precisely analyzed by GC/MS (Gas Chromatographic/Mas Spectroscopy). However, since the device used in this study is a direct-reading method for instantaneous values, it is a method of measuring instantaneous concentrations multiple times, unlike the collection method of process test methods [61,62]. In addition, since this study also aims to identify the influencing factors, it has the meaning of multiple measurements to collect time-variation values rather than one-time measurements in one building. To avoid the errors of manual reading, 2 minimum and maximum readings were excluded especially from the measurement of formaldehyde (CH2O) and Total Suspended Particles (TSP).
Resident interview and observation survey were conducted to investigate basic items (residential space characteristics and resident characteristics), renovation contents for each space, ventilation characteristics, and SBS symptoms using interview papers. The interview paper was prepared based on literature review and previous research, and SBS symptoms were investigated on a 5-step scale [63]. In addition, the researcher observed, recorded, and took photos of the renovation contents to understand in detail the structural change (balcony extension), replacement of finishing materials, replacement of windows and doors, and the type of furniture installed or purchased.
3. Results
3.1. Field Survey
The characteristics of resident interviewees and their families are as follows: The average age of the respondents was 38.1 years old, and the top 2 categories for employment are housewives (60%) and professionals (20%). In terms of education, 45% had a college degree and 30% had a high school diploma. As for the number of families, the top 2 categories are 4-people households (50%) and 3-people households (30%), with an average of 3.4 people. The percentage of annual income brackets are 250,000–300,000 AED (20%), 200,000–250,000 AED (25%), and 150,000–200,000 AED (20%). Regarding the health status before moving in, 55% said ‘No Symptoms’, but ‘Allergic Diseases (allergic rhinitis, asthma, food/animal/skin allergy)’ were 20%, atopic dermatitis 15%, and indigestion 5%.
As for the renovation summary of surveyed house, 10 houses were renovated in all spaces and 10 houses were partially renovated. The renovation companies were mostly interior fit-out companies, and there were 4 houses in which kitchen furniture companies also participated. In case of high-end interior design, there were 2 houses (Table 6).
Regarding the renovation of the living room, there were many housing units with balcony (64.4%), and the floor and wall finishing materials of living room were replaced most of the time.
Over 86.7% of the surveyed housing units have had their finishing materials replaced. In case of floors, it was found that many housing units (46.2%) had replaced them with marble. Regarding doors, most of the housing units (74.7%) had painted doors. As for storage furniture, in case of children’s rooms, built-in cabinets, bookcases, and desks were made (38.3%) or branded products (37.4%) were purchased.
As for the detailed description of replaced finishing materials, general wallpaper with wallpaper adhesive was used (72.6%) for ceilings and walls. As for the floor, it was found that many houses chose marble (46.2%) or laminated floor with general adhesive (39.2%). Molding was found to be replaced (53.4%) frequently. For kitchens, most of the housing units (68.4%) had sink replacement, and when replacing the finishing materials, ordinary wallpaper and general adhesives were used for the ceiling and walls (72.2%), and the floors were installed with laminated floor (44.1%). It was found that the entrance hall was renovated in most of the cases (79.2%). As for the finishing materials, it was found that the ceiling and walls were replaced with general adhesives (54.2%) or tiles (45.6%). Most of the bathrooms had cabinet replacement (84.1%) and door painting (56.2%). Many houses had replaced sanitary equipment and mirrors, and, as for finishing materials, tiles (94.1%) were mainly used for walls and floors, and various choices were made such as panel installation (89.2%) for ceilings.
The results of the survey interview on the daily ventilation method until the measurement date after renovation are as follows. For ventilation, it was found that the living room window (74.6%) is the most used, and 25.1% of the housing units are ventilated using all windows in the house. When ventilation was performed using a window, 1~2 times a day (65.0%) was the most common. In addition, as for the opening time for ventilation using a window, more than 30 min are 60.0%, and 10 to 20 min and less than 10 min are 20.0%, respectively. As for the use of the ventilation fan in the bathroom, it is frequently used when using the toilet. The kitchen hood is the most used for the case of cooking food with a substantial amount of smoke and smell (76.2%), and for the case of cooking all food (23.6%).
Regarding the Sick Building Syndrome (SBS) symptoms immediately after the renovation, respondents answered with ‘never suffer (25.0%)’, ‘almost never suffer’ (55%), ‘slightly suffer’ (15%), and ‘suffer a lot’ (5%) (Table 7).
3.2. Field Survey Results
Table 8 shows the measurement results and indoor air pollutants of 20 renovated housing units in The Greens, Dubai.
The measurement of the indoor air pollutants of a few residential units had the result of high fluctuation. Based on our observation, the concentration of CO2 increased in cases of using gas range for cooking, more residents in the unit, or physical activities in the unit. The concentration of CO increased when residents used gas range for cooking, and the measuring point reached closer to that of the parking. The concentration of CO2 and CO decreased in cases of increasing the time and frequency of opening the door and window, using kitchen hood after cooking, or using air purifier.
3.2.1. Carbon Dioxide (CO2)
The range of CO2 concentration by housing unit was 682.4–2308.2 ppm. A total of 15 houses exceeded the CO2 concentration of WHO IAQ standards (less than 920 ppm). The difference between the maximum concentration and the minimum concentration for each house was 229–2062 ppm, showing a large change over time (Figure 3).
3.2.2. Carbon Monoxide (CO)
The average concentration of CO is 0.3–6.2 ppm, all of them are lower than WHO IAQ standard (10 ppm), and the difference between the maximum and minimum concentrations of each housing unit was 0.9–6.7 ppm (Figure 4).
3.2.3. Total Suspended Particles (TSP)
The average concentration of Total Suspended Particles (TSP) was 0.9–74.7 µg/m3, and all houses were lower than WHO IAQ standard (100 µg/m3). The difference between the maximum and minimum concentrations in each house was 11–99 µg/m3. Even in the same housing unit, large fluctuations occurred over time (Figure 5). The fluctuations were related to the residents’ activities such as indoor exercise, cleaning, or cooking, as well as additional renovation activities such as curtain installation or floor fixing. The concentration of TSP decreased when the door or windows were opened.
There was a high fluctuation of TVOC and formaldehyde (CH2O) when new furniture was delivered and when the existing furniture was covered with new sheet. Moreover, in the case of indoor exercise, such as children’s play with dolls or pillows, nail polish, use of hair spray, and use of fabric softener, the concentration of TVOC and formaldehyde (CH2O) increased.
3.2.4. Total Volatile Organic Compounds (TVOC)
The average concentration of TVOC per house is 0.00–2.98 ppm. A total of 10 houses were higher than the WHO IAQ standard (0.18 ppm: 0.6 mg/m3). The TVOC concentration was extremely serious. In addition, the difference between the maximum and minimum concentrations in each house was large, ranging from 0.00 to 4.02 ppm (Figure 6).
3.2.5. Formaldehyde (CH2O)
The average concentration of formaldehyde (CH2O) in each house was 0.00–1.01 ppm, and a total of 12 houses were higher than the WHO IAQ standard (0.1 ppm). The condition of formaldehyde (CH2O) concentration was serious and the difference between the maximum and minimum concentrations in each house was 0–0.70 ppm (Figure 7).
3.3. Indoor Air pollutants Analysis
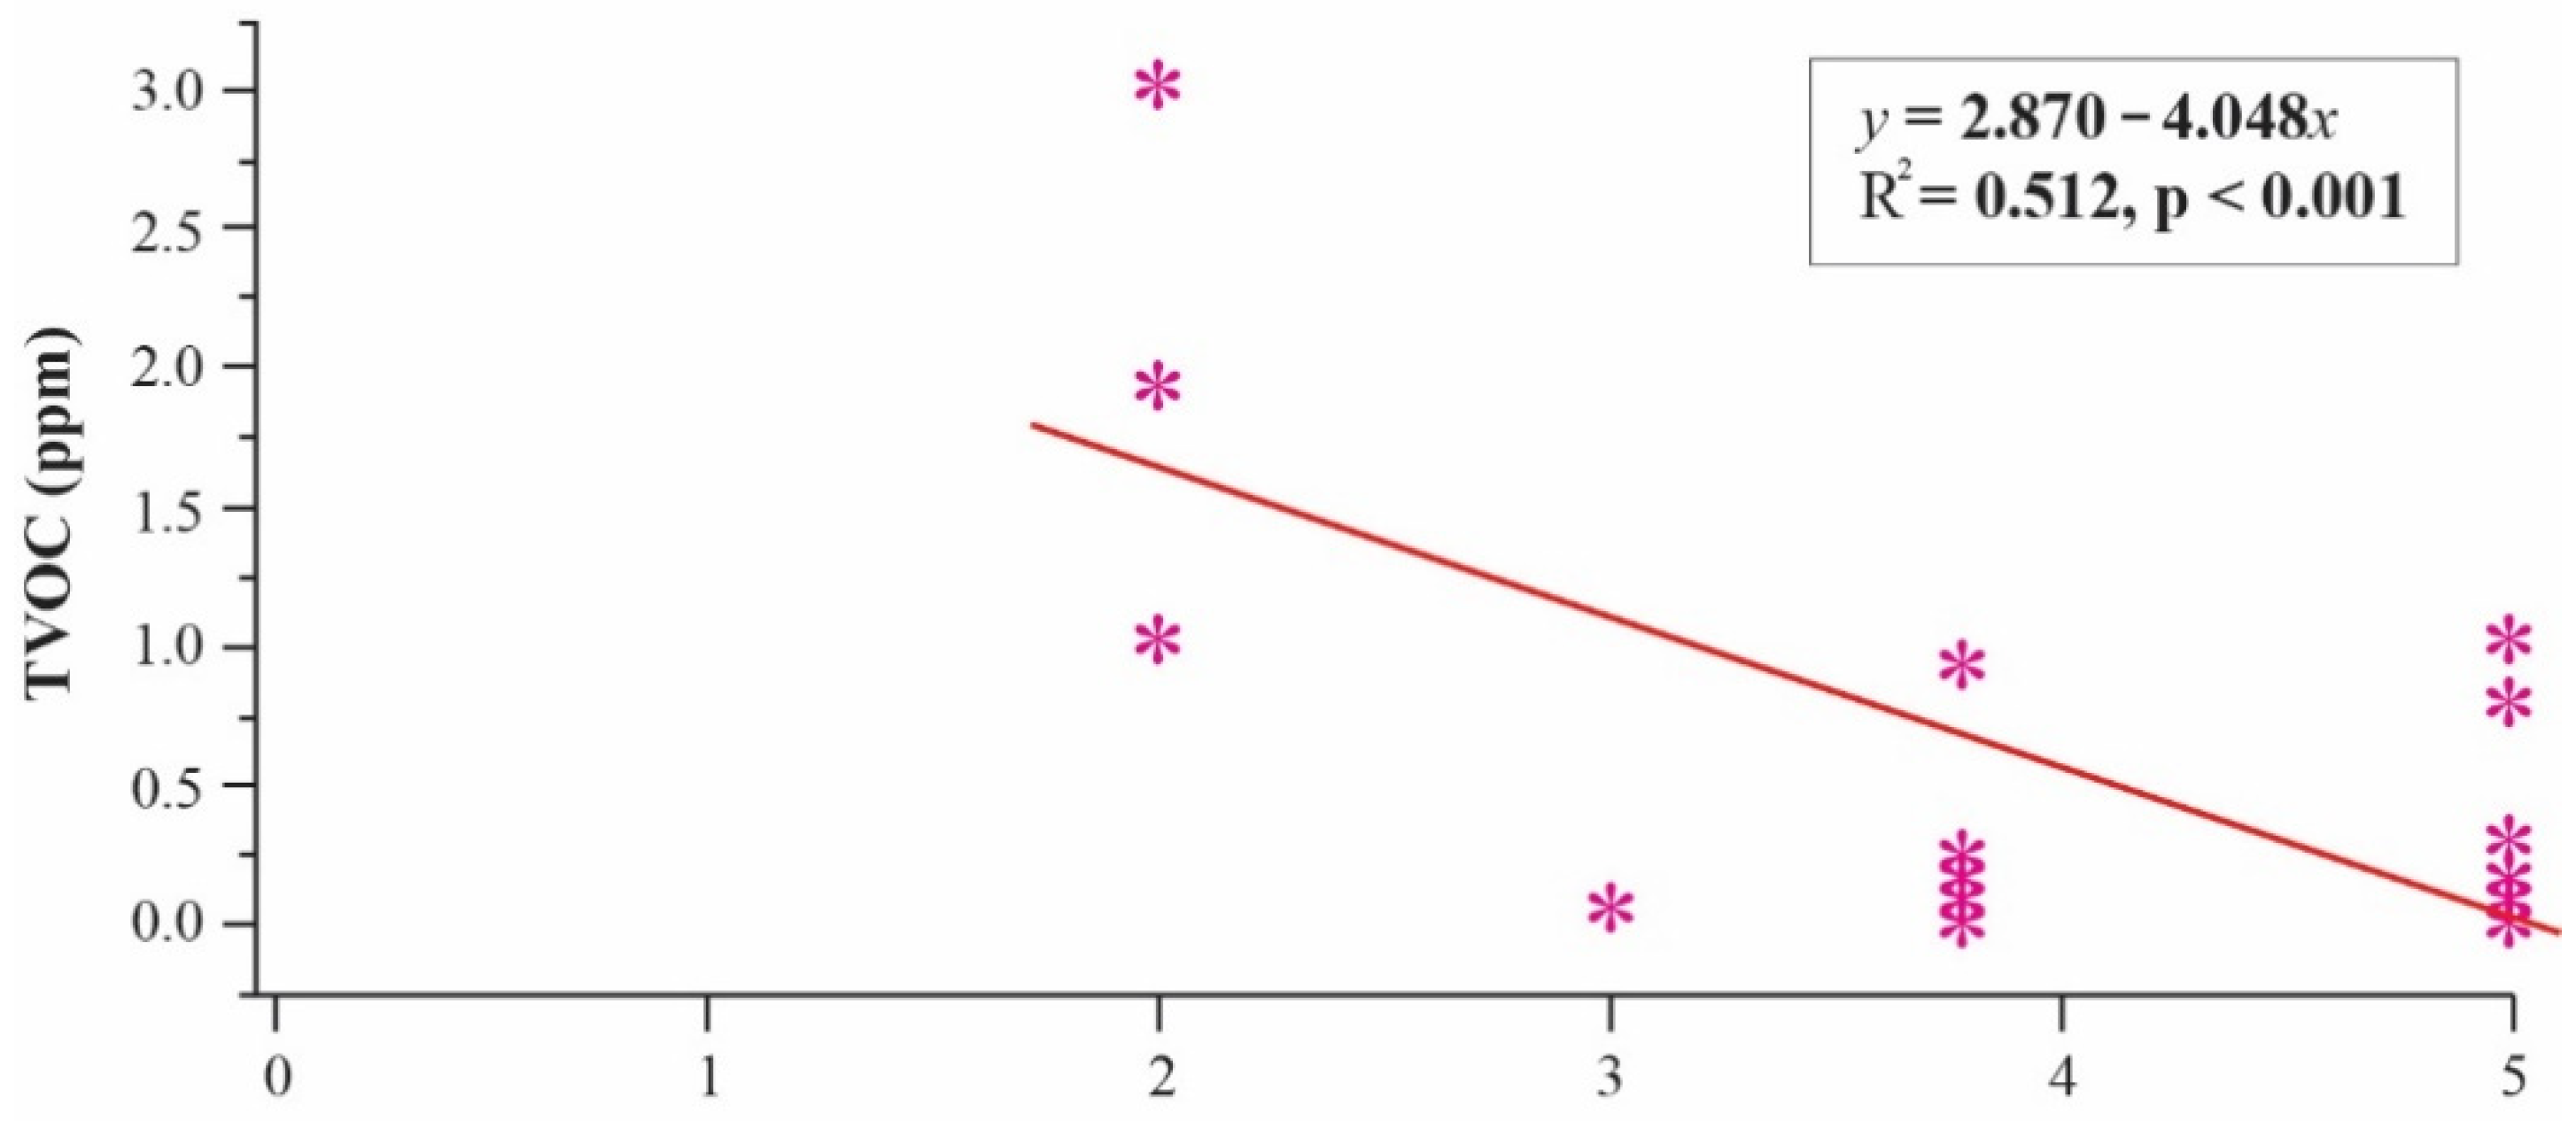
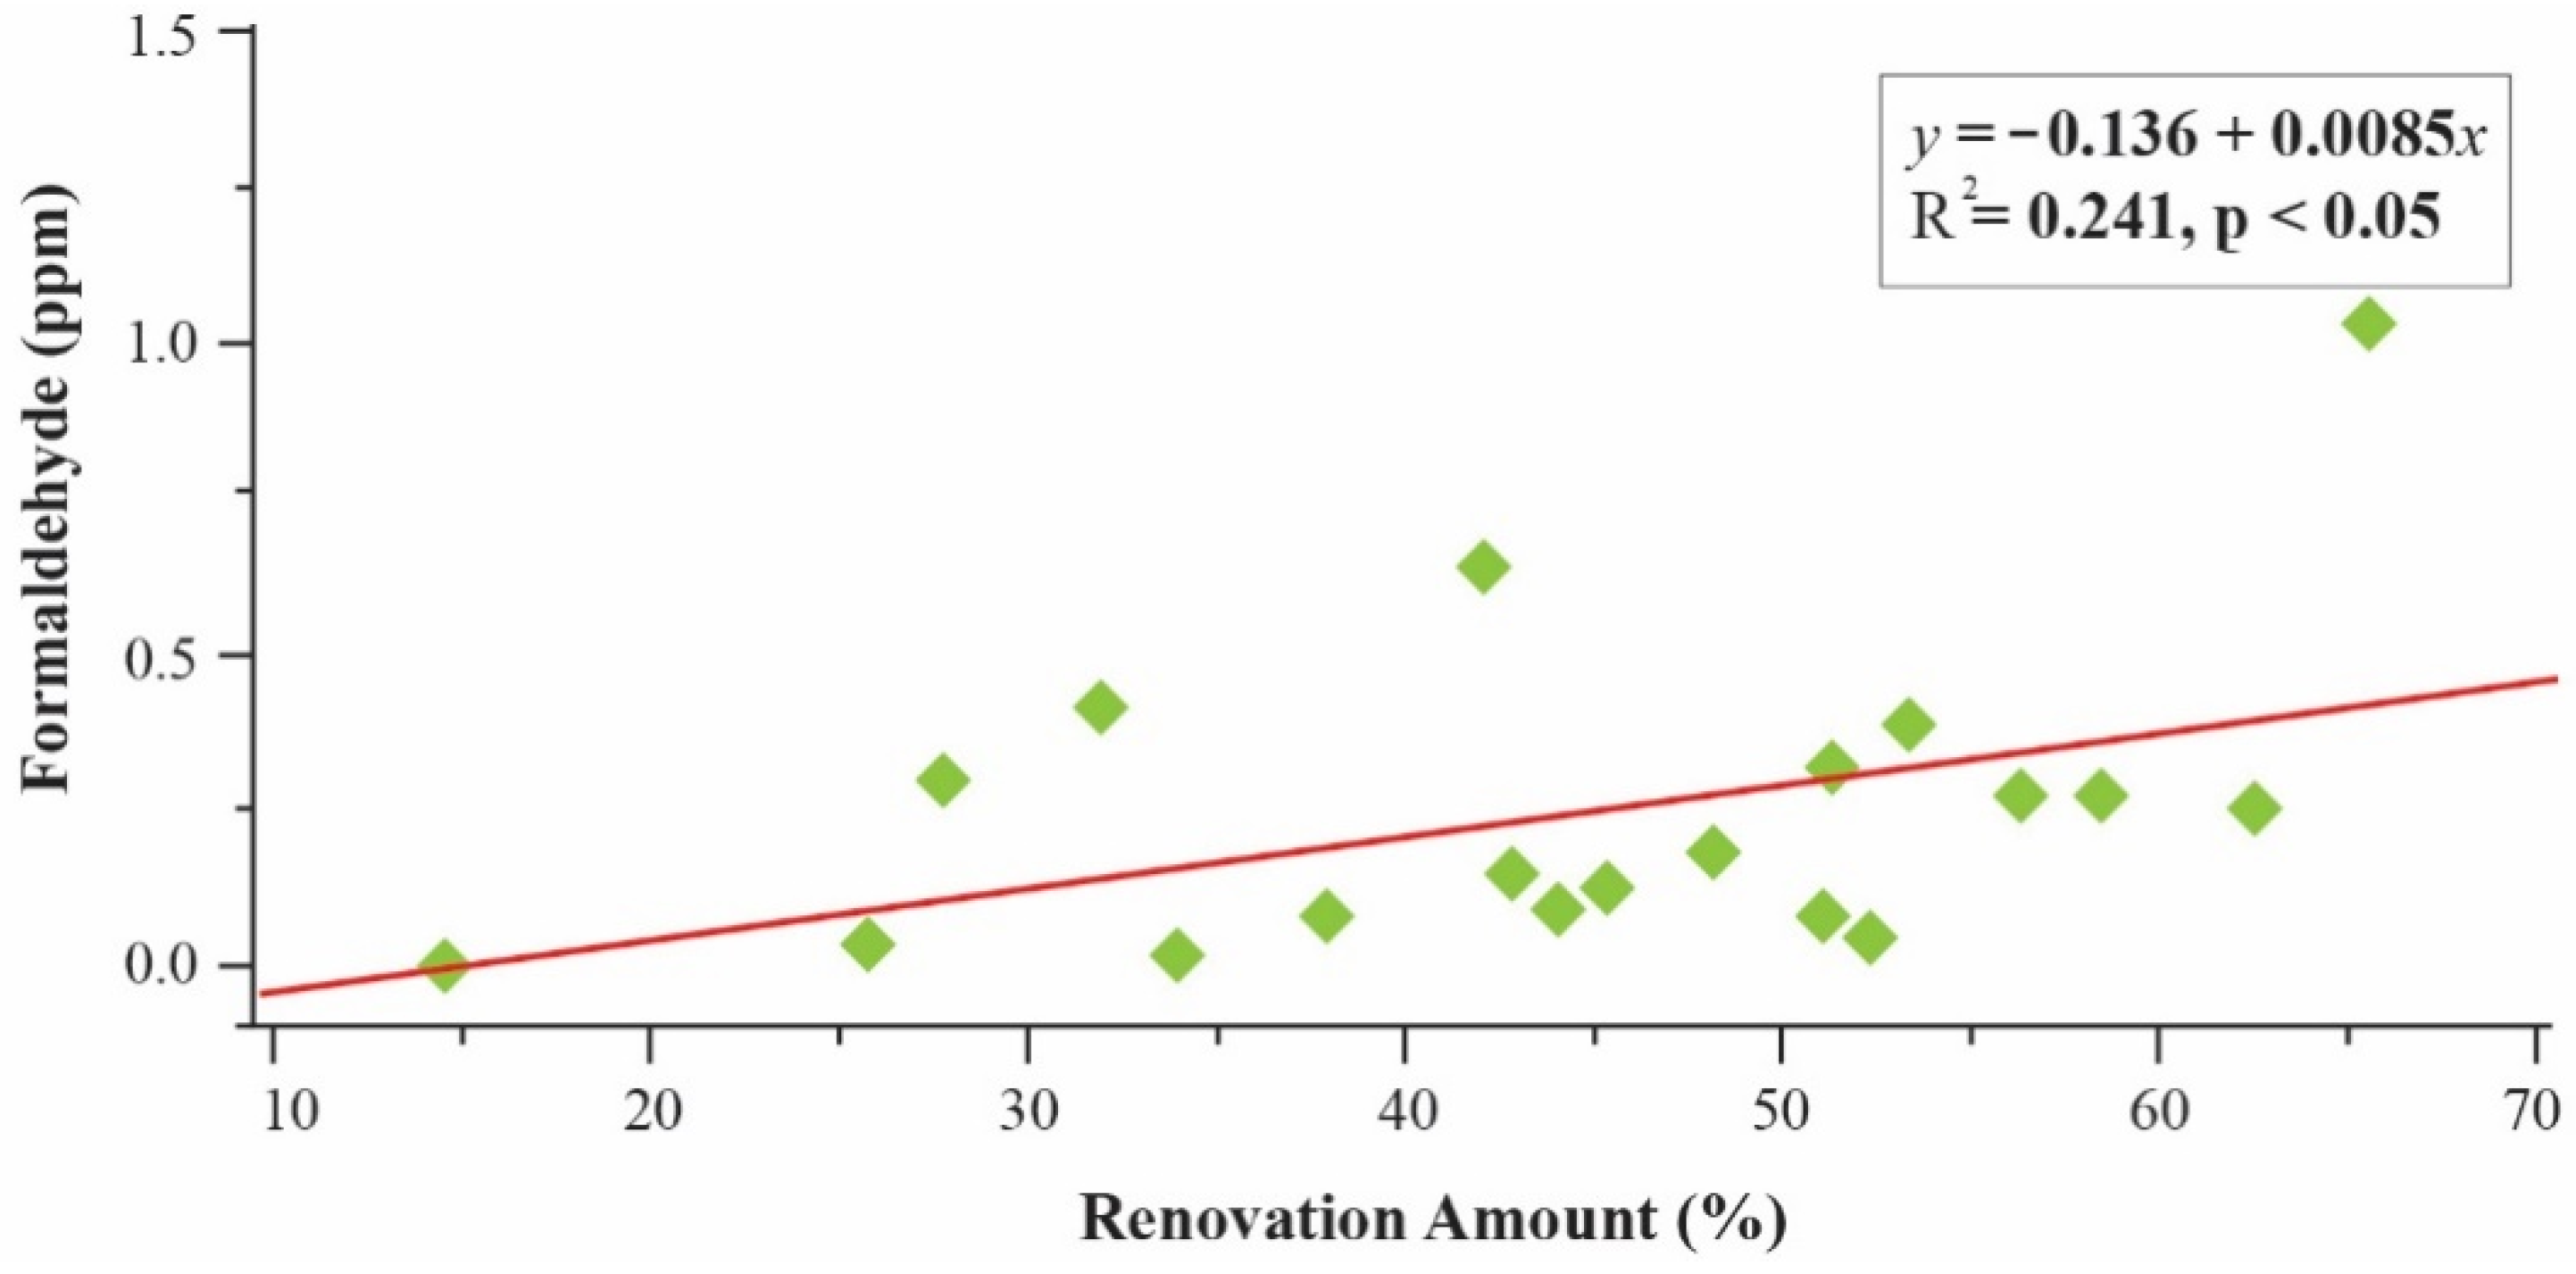
There was a significant correlation between TVOC and daily ventilation (p < 0.01) and days after renovation (p < 0.05). Formaldehyde (CH2O) and renovation amount (p < 0.05) and daily ventilation (p < 0.01) also showed a significant correlation. TVOC concentration is lowered to below WHO standard (0.18 ppm), 36 days after renovation (Figure 8). In the house after renovation, the higher the daily ventilation volume, the lower the TVOC, and formaldehyde (CH2O) would be below WHO standard (Figure 9). Formaldehyde (CH2O) is lowered to less than WHO standard (0.1 ppm) when renovation is less than 28% (Figure 10). This refers to the extent to which only the finishing materials of the living room, master bedroom, children’s room 1 and 2, and kitchen were replaced. The above results are consistent with the results of high concentrations of TVOC and formaldehyde (CH2O) in highly renovated houses, in previous studies. It was confirmed from the results of a study in which the VOC concentration decreased as the ventilation rate increased, calling for the exchange of ventilation equipment in houses in order to improve indoor air quality (Figure 11).
On the measurement day, it was observed that the CO2 concentration changed rapidly when using a gas stove and ventilating in each house [64]. The concentration was also changed by the change in the number of occupants, and it was increased with the children running around [65]. It decreased due to the opening and closing of each window and door connected to the outside, and with the use of a kitchen hood and air purifier. The CO concentration was observed to change rapidly when using a gas stove and when ventilating [66]. In addition, in the graph analysis for each house measured, the CO concentration increased according to the location of the house (in the case of the first floor near the parking lot). The factors for the decrease were the opening time of windows and doors connected to the outside, and the use of kitchen hoods and air purifiers. In the graph analysis for each measured house, Total Suspended Particles (TSP) showed occupants’ activities (cleaning and children playing) and additional renovation activities (arranging luggage, installing curtains, and repairing floors), influx of fine dust from outside when windows were opened, and cooking food for a long time. It was decreased by opening each window and the door connected to the outside.
TVOC and formaldehyde (CH2O) were increased when children played with toys (dolls and pillows) and in the cases of using manicure remover and hairspray [67]. Moreover, the concentration increased when new furniture was delivered and with the smell of fabric softener from laundry. These results are consistent with the increase in the concentration of TVOC due to various living factors in the house from the previous study. On the other hand, it decreased due to the open time of each window and door connected to the outside, and the use of kitchen hood and air purifier. In each house, the amount of change in CO2 concentration according to the gas stove usage time and ventilation time when there were no other living factors was examined.
The concentration of CO2 rises (R2 = 0.553, p < 0.01) as the gas stove usage time increases, and it is predicted that it will be exceeded over standard when used for more than 46 min (Figure 12). On the other hand, the decrease in the concentration of CO2 also increases as the ventilation time, when the windows and doors connected to the outside are opened, increases (R2 = 0.43, p < 0.05); the result that meets the criteria is predicted when ventilation is more than 190 min (Figure 13). Additionally, looking at the average concentration according to the number of occupants (R2 = 0.251, p < 0.05), it was found that the indoor CO2 concentration was higher than the standard value (1000 ppm) even when the number of occupants was 2 or more (Figure 14). The concentration of CO2 and CO changes depending on the gas stove usage time, number of occupants, and ventilation time, which is the same as the results of previous studies. Looking at the change in the CO concentration according to the gas stove usage time in each house when there were no other living factors, the CO concentration increased as the usage time increased (R2 = 0.45, p < 0.01) (Figure 15). Looking at the TVOC concentration according to the relative humidity in each house, the TVOC concentration was higher in the house with high relative humidity (R2 = 0.26, p < 0.05) (Figure 16). Looking at the formaldehyde (CH2O) concentration according to the relative humidity, the concentration of formaldehyde (CH2O) was also high in the house with high relative humidity (R2 = 0.373, p < 0.01) (Figure 17), which was the same as the results of previous studies.
4. Discussion
After the renovation, the levels of CO2, TVOC, and formaldehyde (CH2O) pollution in the residential units in apartments were found to be very serious. Since residents are not aware of it, it is suggested that more strict regulations are needed. The Dubai Municipality regulates the IAQ (Indoor Air Quality) with the stipulation of less than 0.08 ppm (parts per million) of formaldehyde (CH2O), less than 300 micrograms/m3 of TVOC (Total Volatile Organic Compound), and less than 150 micrograms/m3 of TSP (Total Suspended Particles) (less than 10 microns) in 8 h of continuous monitoring prior to occupancy. In relation to this provision, there is a recommended standard for pollutants, but there is no compulsory regulation for non-conformity [68]. However, according to this new provision, the construction industry is desperately trying to reduce pollutants. Therefore, it is suggested to expand the scope of this regulation to “newly built houses and renovated houses” [69]. According to the new Japanese Building Standards Act, all buildings are subject to follow the regulation regardless of new construction, extension, or renovation [70]. Since there are cases where renovated houses are included in the subject of Japanese Regulation, the subject of the regulations related to new apartment buildings in the current Dubai regulations should be expanded to include renovated apartment houses. Although there is no compulsion for home occupants, it will be able to induce interior fit-out companies to consider indoor air quality [71].
Comparatively speaking, Dubai residents spend more time indoors with all year long central air-conditioning due to the constant desert climate with hot summer, in which average maximum temperatures reach above 45 °C. This is the reason why exposure to indoor air pollutants is more problematic in UAE. In the future, there will be an analysis of infiltration rate for opening and walls with different material, along with a comparative analysis of indoor air pollutants among different residential types with different materials.
Since this paper aims to build the basic data for renovated apartment in Dubai, the renovation was classified with total amount and room types. However, the next research must be more focused on the actual renovated materials and the concentration of indoor air pollutants emanated from each material.
5. Conclusions
This study aims to improve the indoor air quality of residential buildings in Dubai, and the results of the study are summarized as follows.
The purpose of this study is to measure the indoor air quality of the residential units in an apartment after renovation, to evaluate the actual condition, and to analyze the influential factors. As an apartment that aged more than 10 years and had renovation within the past 3 months, field measurements, resident interviews, and observations were conducted for 20 residential units. The results are summarized as follows.
First, as for the contents of the renovation related to the indoor air of the recently renovated apartment unit, the replacement of finishing materials was the most common in all spaces. As for the finishing materials, there were many choices of general adhesives for ceilings and walls, and reinforced flooring for floors. In addition, there were many renovations of kitchen furniture and entrance cabinets, and replacement of storage cabinets, bathtubs, and sanitary equipment in the bathroom.
Second, for ventilation characteristics, the living room balcony window and living room window were opened 1–2 times a day for more than 30 min. The ventilation fan in the bathroom was frequently or always used when using the toilet, and the kitchen hood was used only for cooking food with a substantial amount of smoke and smell.
Third, the average CO2 for each house was 682.4–2308.2 ppm, and there were 15 houses exceeding the WHO IAQ standards (less than 920 ppm). TVOC (Total Volatile Organic Compounds) had an average concentration of 0.00–2.98 ppm per house, exceeding the standard in 10 houses. Formaldehyde (CH2O) had an average concentration of 0.00–1.01 ppm per house, exceeding the WHO IAQ standard (0.1 ppm) in 12 houses. In a house with such a serious level of concentration, the resident’s SBS (Sick Building Syndrome) response was “almost no feeling”, and although the indoor air quality was polluted, the residents were hardly aware of it.
Fourth, the results of analysis of factors affecting indoor air quality are as follows. As factors before the measurement date, the amount of renovation, ventilation volume, and elapsed days after renovation were significant. Living factors on the day of measurement include indoor background factors (relative humidity), ventilation time on the day of measurement, additional renovation activities (delivery of new furniture, replacing sheet to existing furniture, organizing luggage, installing curtains, repairing hardened floors), living behaviors (number of occupants, children running around, occupant activities, cooking food, opening an external window, and using manicure remover, spray, or fabric softener) were analyzed.
Therefore, from the perspective of the residents, as the level of renovation increases, the concentration of formaldehyde (CH2O) increases significantly, and therefore excessive renovation should be avoided. To reduce the concentration of indoor air pollutants, it is necessary to select finishing materials and furniture with low pollutant emission. When selecting general materials for cost reduction, more ventilation is required before and after moving in. In addition, since there is an increase in the concentration of pollutants due to additional renovation, it is desirable to complete detailed actions such as purchasing furniture and attaching sheet paper before moving in to avoid additional renovation after moving in. Indoor air pollution such as CO2, CO, and TSP occurs due to the living activities of residents. From the perspective of the renovation company, it is expected that the concentration of indoor air pollutants will be reduced when eco-friendly materials are used, so designers and contractors should select furniture and finishing materials based on accurate information (grade). It is recommended to install a natural ventilation system that can increase the ventilation rate. In addition, the contractor actively always conducts ventilation during the renovation work and opens the doors of built-in wardrobes and kitchen furniture so that indoor air pollutants can be reduced before moving in.
Author Contributions
All authors contributed significantly to this study. C.J. and J.A. identified and secured the example buildings used in the study. The data acquisition system and installations of sensors were designed and installed by C.J. and J.A. J.A. was responsible for data collection. Data analysis was performed by C.J. The manuscript was compiled by C.J. and reviewed by J.A. All authors have read and agreed to the published version of the manuscript.
Funding
This research received no external funding.
Institutional Review Board Statement
The study was conducted according to the guidelines of Ajman University Research Ethics Committee.
Informed Consent Statement
Informed consent was obtained from all subjects involved in the study.
Data Availability Statement
New data were created or analyzed in this study. Data will be shared upon request and consideration of the authors.
Acknowledgments
The authors would like to express their gratitude to Ajman University for the generous support to publish this paper.
Conflicts of Interest
The authors declare no conflict of interest.
References
- Araki, A.; Ketema, R.M.; Bamai, Y.A.; Kishi, R. Aldehydes, Volatile Organic Compounds (VOCs), and Health. In Indoor Environmental Quality and Health Risk toward Healthier Environment for All; Springer: Singapore, 2020; pp. 129–158. [Google Scholar]
- Sarkhosh, M.; Najafpoor, A.A.; Alidadi, H.; Shamsara, J.; Amiri, H.; Andrea, T.; Kariminejad, F. Indoor Air Quality associations with sick building syndrome: An application of decision tree technology. Build. Environ. 2021, 188, 107446. [Google Scholar] [CrossRef]
- Maddalena, R.; Mendell, M.J.; Eliseeva, K.; Chan, W.R.; Sullivan, D.P.; Russell, M.; Fisk, W.J. Effects of ventilation rate per person and per floor area on perceived air quality, sick building syndrome symptoms, and decision-making. Indoor Air 2015, 25, 362–370. [Google Scholar] [CrossRef]
- Terrill, T.J.; Rasmussen, B.P. An evaluation of HVAC energy usage and occupant comfort in religious facilities. Energy Build. 2016, 128, 224–235. [Google Scholar] [CrossRef]
- Garcia, S.; Linares, P. Energy and IAQ friendly variable ventilation rates, according with the proposed indoor air quality regulations included in the Spanish building code. In Proceedings of the 36th AIVC Conference Effective Ventilation in High Performance Buildings, Madrid, Spain, 23–24 September 2015; p. 11. Available online: https://www.aivc.org/sites/default/files/65_0.pdf (accessed on 10 May 2021).
- Brelih, N. Ventilation rates and IAQ in national regulations. REHVA Eur. HVAC J. 2012, 1, 24–28. [Google Scholar]
- Walker, I.; Less, B. Reassessing Occupancy-Based Ventilation and IAQ in Homes. Proc. Indoor Air 2018. Available online: https://svach.lbl.gov/wp-content/uploads/sites/20/2019/03/IA2018_Extended_Abstract_OccupncyVentilation.pdf (accessed on 10 May 2021).
- Moon, H.J.; Ryu, S.H.; Kim, J.T. The effect of moisture transportation on energy efficiency and IAQ in residential buildings. Energy Build. 2014, 75, 439–446. [Google Scholar] [CrossRef]
- Turner, W.J.; Logue, J.M.; Wray, C.P. A combined energy and IAQ assessment of the potential value of commissioning residential mechanical ventilation systems. Build. Environ. 2013, 60, 194–201. [Google Scholar] [CrossRef]
- Rakhshan, K.; Friess, W.A. Effectiveness and viability of residential building energy retrofits in Dubai. J. Build. Eng. 2017, 13, 116–126. [Google Scholar] [CrossRef]
- Amoatey, P.; Omidvarborna, H.; Baawain, M.S.; Al-Mamun, A. Indoor air pollution and exposure assessment of the gulf cooperation council countries: A critical review. Environ. Int. 2018, 121, 491–506. [Google Scholar] [CrossRef] [PubMed]
- Taleb, H. Effect of Adding Vegetation and Applying a Plants Buffer on Urban Community in Dubai. Spaces Flows Int. J. Urban Extra Urban Stud. 2016, 7, 37–49. [Google Scholar] [CrossRef]
- Li, Y.; Gibson, J.M.; Jat, P.; Puggioni, G.; Hasan, M.; West, J.J.; Vizuete, W.; Serre, M. Burden of disease attributed to anthropogenic air pollution in the United Arab Emirates: Estimates based on observed air quality data. Sci. Total Environ. 2010, 408, 5784–5793. [Google Scholar] [CrossRef] [PubMed]
- Dubai Municipality to Assess Quality of Indoor Air in Public Buildings. 2013. Available online: https://www.khaleejtimes.com/nation/general/dubai-municipality-to-assess-quality-of-indoor-air-in-public-buildings (accessed on 10 May 2021).
- Khansaheb, A. Let’s Not Forget Indoor Air Quality as Well. 2020. Available online: https://gulfnews.com/business/analysis/lets-not-forget-indoor-air-quality-as-well-1.1589873286956#:~:text=The%20Dubai%20Municipality%20standard%20for,of%20continuous%20monitoring%20pre-occupancy (accessed on 12 May 2021).
- Green Building Regulations & Specifications. 2021. Available online: https://www.dewa.gov.ae/~/media/Files/Consultants%20and%20Contractors/Green%20Building/Greenbuilding_Eng.ashx (accessed on 10 May 2021).
- Bani Mfarrej, M.F.; Qafisheh, N.A.; Bahloul, M.M. Investigation of Indoor Air Quality inside Houses From UAE. Air Soil Water Res. 2020, 13, 1178622120928912. [Google Scholar] [CrossRef]
- Nazzal, S.B. Indoor Air Quality (IAQ) in Labor Housing in Dubai and Its Impact on Accupants’ Health. Ph.D. Thesis, The British University in Dubai, Dubai, United Arab Emirates, 2015. [Google Scholar]
- Mannan, M.; Al-Ghamdi, S.G. Indoor Air Quality in Buildings: A Comprehensive Review on the Factors Influencing Air Pollution in Residential and Commercial Structure. Int. J. Environ. Res. Public Health 2021, 18, 3276. [Google Scholar] [CrossRef]
- Sun, Y.; Hou, J.; Cheng, R.; Sheng, Y.; Zhang, X.; Sundell, J. Indoor air quality, ventilation, and their associations with sick building syndrome in Chinese homes. Energy Build. 2019, 197, 112–119. [Google Scholar] [CrossRef]
- Fadeyi, M.O.; Alkhaja, K.; Sulayem, M.B.; Abu-Hijleh, B. Evaluation of indoor environmental quality conditions in elementary schools׳ classrooms in the United Arab Emirates. Front. Archit. Res. 2014, 3, 166–177. [Google Scholar] [CrossRef] [Green Version]
- Behzadi, N.; Fadeyi, M.O. A preliminary study of indoor air quality conditions in Dubai public elementary schools. Archit. Eng. Des. Manag. 2012, 8, 192–213. [Google Scholar] [CrossRef]
- Wei, W.; Ramalho, O.; Mandin, C. Indoor air quality requirements in green building certifications. Build. Environ. 2015, 92, 10–19. [Google Scholar] [CrossRef]
- Steinemann, A.; Wargocki, P.; Rismanchi, B. Ten questions concerning green buildings and indoor air quality. Build. Environ. 2017, 112, 351–358. [Google Scholar] [CrossRef] [Green Version]
- Silva, M.F.; Maas, S.; de Souza, H.A.; Gomes, A.P. Post-occupancy evaluation of residential buildings in Luxembourg with centralized and decentralized ventilation systems, focusing on indoor air quality (IAQ). Assessment by questionnaires and physical measurements. Energy Build. 2017, 148, 119–127. [Google Scholar] [CrossRef]
- Lim, S.; Lee, K.; Seo, S.; Jang, S. Impact of regulation on indoor volatile organic compounds in new unoccupied apartment in Korea. Atmos. Environ. 2011, 45, 1994–2000. [Google Scholar] [CrossRef]
- Jung, C.; Awad, J. The Improvement of Indoor Air Quality in Residential Buildings in Dubai, UAE. Buildings 2021, 11, 250. [Google Scholar] [CrossRef]
- Yeatts, K.B.; El-Sadig, M.; Leith, D.; Kalsbeek, W.; Al-Maskari, F.; Couper, D.; Funk, W.E.; Zoubeidi, T.; Chan, R.L.; Trent, C.B.; et al. Indoor air pollutants and health in the United Arab Emirates. Environ. Health Perspect. 2012, 120, 687–694. [Google Scholar] [CrossRef]
- Practical Home Renovations Property—Gulf News. 2017. Available online: https://gulfnews.com/business/property/practical-home-renovations-1.2056942 (accessed on 16 May 2021).
- The National Renovation New Name of UAE Property Game. 2015. Available online: https://www.thenationalnews.com/business/renovation-new-name-of-uae-property-game-1.128731 (accessed on 20 May 2021).
- Wagdi, D.; Tarabieh, K.; Abou Zeid, M.N. Indoor air quality index for preoccupancy assessment. Air Qual. Atmos. Health 2018, 11, 445–458. [Google Scholar] [CrossRef]
- The Greens District, Emirates Living, Dubai. 2021. Available online: https://propsearch.ae/dubai/the-greens (accessed on 14 May 2021).
- Bayut. Area Guide: The Greens District. 2021. Available online: https://www.bayut.com/area-guides/the-greens/ (accessed on 22 May 2021).
- The Greens Still is One of Dubai’s Most Preferred Communities. 2021. Available online: https://gulfnews.com/business/property/the-greens-still-is-one-of-dubais-most-preferred-communities-1.1595937597519 (accessed on 12 May 2021).
- The Greens & Views: Urban Living Amidst Lush, Leisurely Surroundings. 2021. Available online: https://www.thegreensandviews.ae/ (accessed on 18 May 2021).
- The Greens and Views: About This Area. 2021. Available online: https://www.hausandhaus.com/living-in-dubai/area-guides/the-greens-and-views (accessed on 22 May 2021).
- Dubai Landlords Upgrade Old Homes to Stay Relevant. 2018. Available online: https://www.khaleejtimes.com/business/real-estate/dubai-landlords-upgrade-old-homes-to-stay-relevant (accessed on 24 May 2021).
- Why I’ll Truly Miss Dubai Neighbourhood the Greens When I Move House. 2020. Available online: https://www.thenationalnews.com/lifestyle/why-i-ll-truly-miss-dubai-neighbourhood-the-greens-when-i-move-house-1.994719 (accessed on 24 May 2021).
- Property Management: It’s Time to Renovate Your Home. 2021. Available online: https://www.bhomes.com/blog/post/time-to-renovate-your-home/ (accessed on 24 May 2021).
- Ghaffarianhoseini, A.; AlWaer, H.; Omrany, H.; Ghaffarianhoseini, A.; Alalouch, C.; Clements-Croome, D.; Tookey, J. Sick building syndrome: Are we doing enough? Archit. Sci. Rev. 2018, 61, 99–121. [Google Scholar] [CrossRef] [Green Version]
- Jansz, J. Introduction to Sick Building Syndrome. In Sick Building Syndrome; Springer: Berlin/Heidelberg, Germany, 2011; pp. 1–24. [Google Scholar]
- Takigawa, T.; Wang, B.L.; Saijo, Y.; Morimoto, K.; Nakayama, K.; Tanaka, M.; Shibata, E.; Yoshimura, T.; Chikara, H.; Ogino, K.; et al. Relationship between indoor chemical concentrations and subjective symptoms associated with sick building syndrome in newly built houses in Japan. Int. Arch. Occup. Environ. Health 2010, 83, 225–235. [Google Scholar] [CrossRef] [PubMed]
- Tran, V.V.; Park, D.; Lee, Y.C. Indoor air pollution, related human diseases, and recent trends in the control and improvement of indoor air quality. Int. J. Environ. Res. Public Health 2020, 17, 2927. [Google Scholar] [CrossRef] [PubMed] [Green Version]
- Zuo, C.; Luo, L.; Liu, W. Effects of increased humidity on physiological responses, thermal comfort, perceived air quality, and Sick Building Syndrome symptoms at elevated indoor temperatures for subjects in a hot-humid climate. Indoor Air 2021, 31, 524–540. [Google Scholar] [CrossRef] [PubMed]
- Mentese, S.; Mirici, N.A.; Elbir, T.; Palaz, E.; Mumcuoğlu, D.T.; Cotuker, O.; Bakar, C.; Oymak, S.; Otkun, M.T. A long-term multi-parametric monitoring study: Indoor air quality (IAQ) and the sources of the pollutants, prevalence of sick building syndrome (SBS) symptoms, and respiratory health indicators. Atmos. Pollut. Res. 2020, 11, 2270–2281. [Google Scholar] [CrossRef]
- Shang, Y.; Li, B.; Baldwin, A.N.; Ding, Y.; Yu, W.; Cheng, L. Investigation of indoor air quality in shopping malls during summer in Western China using subjective survey and field measurement. Build. Environ. 2016, 108, 1–11. [Google Scholar] [CrossRef]
- Tham, K.W. Indoor air quality and its effects on humans—A review of challenges and developments in the last 30 years. Energy Build. 2016, 130, 637–650. [Google Scholar] [CrossRef]
- Woolley, T. Building Materials, Health and Indoor Air Quality: No Breathing Space? Taylor & Francis: Abingdon, UK, 2016; pp. 44–52. [Google Scholar]
- Al-Hemoud, A.; Al-Awadi, L.; Al-Khayat, A.; Behbehani, W. Streamlining IAQ guidelines and investigating the effect of door opening/closing on concentrations of VOCs, formaldehyde, and NO2 in office buildings. Build. Environ. 2018, 137, 127–137. [Google Scholar] [CrossRef]
- Abdul-Wahab, S.A.; En, S.C.F.; Elkamel, A.; Ahmadi, L.; Yetilmezsoy, K. A review of standards and guidelines set by international bodies for the parameters of indoor air quality. Atmos. Pollut. Res. 2015, 6, 751–767. [Google Scholar] [CrossRef]
- Yu, C.W.; Kim, J.T. Building environmental assessment schemes for rating of IAQ in sustainable buildings. Indoor Built Environ. 2011, 20, 5–15. [Google Scholar] [CrossRef]
- Korsavi, S.S.; Montazami, A.; Mumovic, D. Perceived indoor air quality in naturally ventilated primary schools in the UK: Impact of environmental variables and thermal sensation. Indoor Air 2021, 31, 480–501. [Google Scholar] [CrossRef] [PubMed]
- Persily, A. Challenges in developing ventilation and indoor air quality standards: The story of ASHRAE Standard 62. Build. Environ. 2015, 91, 61–69. [Google Scholar] [CrossRef] [PubMed]
- Földváry, V.; Bekö, G.; Langer, S.; Arrhenius, K.; Petráš, D. Effect of energy renovation on indoor air quality in multifamily residential buildings in Slovakia. Build. Environ. 2017, 122, 363–372. [Google Scholar] [CrossRef] [Green Version]
- Dimdina, I.; Lešinskis, A.; Krumiņš, E.; Krumiņš, V.; Šnidere, L.; Zagorskis, V. Indoor air quality and energy efficiency in multi-apartment buildings before and after renovation: A case study of two buildings in Riga. Civ. Eng. 2011, 11, 236–241. [Google Scholar]
- Hoppe, K.A.; Metwali, N.; Perry, S.S.; Hart, T.; Kostle, P.A.; Thorne, P.S. Assessment of airborne exposures and health in flooded homes undergoing renovation. Indoor Air 2012, 22, 446–456. [Google Scholar] [CrossRef] [Green Version]
- Lee, S.; Kwon, G.; Joo, J.; Kim, J.T.; Kim, S. A finish material management system for indoor air quality of apartment buildings (FinIAQ). Energy Build. 2012, 46, 68–79. [Google Scholar] [CrossRef]
- Jeong, B.; Jeong, J.W.; Park, J.S. Occupant behavior regarding the manual control of windows in residential buildings. Energy Build. 2016, 127, 206–216. [Google Scholar] [CrossRef]
- Zhang, Y.; Barrett, P. Factors influencing the occupants’ window opening behaviour in a naturally ventilated office building. Build. Environ. 2012, 50, 125–134. [Google Scholar] [CrossRef]
- Colinart, T.; Bendouma, M.; Glouannec, P. Building renovation with prefabricated ventilated façade element: A case study. Energy Build. 2019, 186, 221–229. [Google Scholar] [CrossRef]
- Ala-Kotila, P.; Vainio, T.; Laamanen, J. The influence of building renovations on indoor comfort—A field test in an apartment building. Energies 2020, 13, 4958. [Google Scholar] [CrossRef]
- Huang, L.L.; Ikeda, K.; Chiang, C.M.; Kagi, N.; Hojo, S.; Yanagi, U. Field survey on the relation between IAQ and occupants’ health in 40 houses in southern Taiwan. J. Asian Archit. Build. Eng. 2011, 10, 249–256. [Google Scholar] [CrossRef] [Green Version]
- Thomas, N.M.; Calderón, L.; Senick, J.; Sorensen-Allacci, M.; Plotnik, D.; Guo, M.; Mainelis, G. Investigation of indoor air quality determinants in a field study using three different data streams. Build. Environ. 2019, 154, 281–295. [Google Scholar] [CrossRef]
- Lee, H.; Lee, Y.J.; Park, S.Y.; Kim, Y.W.; Lee, Y. The improvement of ventilation behaviours in kitchens of residential buildings. Indoor Built Environ. 2012, 21, 48–61. [Google Scholar] [CrossRef]
- Branco, P.T.B.S.; Alvim-Ferraz, M.C.M.; Martins, F.G.; Sousa, S.I.V. Children’s exposure to indoor air in urban nurseries-part I: CO2 and comfort assessment. Environ. Res. 2015, 140, 1–9. [Google Scholar] [CrossRef] [PubMed] [Green Version]
- Xu, Y.; Raja, S.; Ferro, A.R.; Jaques, P.A.; Hopke, P.K.; Gressani, C.; Wetzel, L.E. Effectiveness of heating, ventilation and air conditioning system with HEPA filter unit on indoor air quality and asthmatic children’s health. Build. Environ. 2010, 45, 330–337. [Google Scholar] [CrossRef]
- Broderick, Á.; Byrne, M.; Armstrong, S.; Sheahan, J.; Coggins, A.M. A pre and post evaluation of indoor air quality, ventilation, and thermal comfort in retrofitted co-operative social housing. Build. Environ. 2017, 122, 126–133. [Google Scholar] [CrossRef]
- Jung, C.; Awad, J. Improving the IAQ for Learning Efficiency with Indoor Plants in University Classrooms in Ajman, United Arab Emirates. Buildings 2021, 11, 289. [Google Scholar] [CrossRef]
- Wells, E.M.; Berges, M.; Metcalf, M.; Kinsella, A.; Foreman, K.; Dearborn, D.G.; Greenberg, S. Indoor air quality and occupant comfort in homes with deep versus conventional energy efficiency renovations. Build. Environ. 2015, 93, 331–338. [Google Scholar] [CrossRef] [Green Version]
- Tsai, W.T. A comparative study on the statutory and technical regulations for controlling indoor volatile organic compounds in Taiwan and Japan. Atmosphere 2018, 9, 195. [Google Scholar] [CrossRef] [Green Version]
- Shi, Q.; Zuo, J.; Huang, R.; Huang, J.; Pullen, S. Identifying the critical factors for green construction–an empirical study in China. Habitat Int. 2013, 40, 1–8. [Google Scholar] [CrossRef]
Figure 1.
The Location of The Greens in Dubai, United Arab Emirates.

Figure 2.
The Greens Project in Dubai, United Arab Emirates.

Figure 3.
CO2 concentrations in 20 housing units at The Greens, Dubai.

Figure 4.
CO concentrations in 20 housing units at The Greens, Dubai.

Figure 5.
TSP concentrations in 20 housing units at The Greens, Dubai.

Figure 6.
TVOC concentrations in 20 housing units at The Greens, Dubai.

Figure 7.
Formaldehyde (CH2O) concentrations in 20 housing units at The Greens, Dubai.

Figure 8.
TVOC concentration and days after renovation.

Figure 9.
TVOC concentration and daily ventilation.

Figure 10.
Formaldehyde (CH2O) concentration and renovation amount.

Figure 11.
Formaldehyde (CH2O) concentration and daily ventilation.

Figure 12.
CO2 concentration by gas stove usage time.

Figure 13.
CO2 concentration by ventilation time.

Figure 14.
CO2 concentration by number of residents.

Figure 15.
CO concentration by gas stove usage time.

Figure 16.
TVOC concentration by relative humidity.

Figure 17.
Formaldehyde (CH2O) concentration by relative humidity.


Table 1.
The effects of hazardous substances on the human body.
| Hazardous Substances | Sources | The Effects on Human Body | |
|---|---|---|---|
| Formaldehyde (CH2O) | - Plywood, Particle board - Urea/Melamine/Phenolic Synthetic Resin | - May cause cancer - Minor irritation to the eyes - Possible sore throat | |
| Volatile Organic Compounds (VOCs) | Benzene (C6H6) | - Dye, Organic pigment, Plasticizer - Chemical Intermediates for Synthetic Rubber, Nitrobenzene, Phenol and Synthetic Compounds | - May cause cancer - Dizziness during acute exposure, Vomiting, headache, drowsiness, - Effects on the central nerve system |
| Toluene (C7H8) | - Solvent Thinner for Adhesive Paint, - Construction Adhesive | - Eye or airway irritation when exposed to high concentrations - Fatigue, vomiting - Effects on the central nerve system | |
| Ethylbenzene (C8H10) | - Building Materials and Furniture using Adhesives | - Irritation to the throat or eyes - Prolonged skin contact may cause dermatitis | |
| Xylene (C8H10) | - Interior Fit-out Adhesive - Building Materials and Furniture using Adhesives | - Central nerve system depressant action - Inducing fatigue, headache, insomnia, excitement, etc. | |
| Styrene (C8H8) | - Adhesive Raw Material - Synthetic Resin Paint - Insulation and Carpet | - Affects the lungs and central nerve system - Causing drowsiness or dizziness | |
| Dichlorobenzene (C6H4Cl2) | - Deodorant, Insecticide, Pesticide - Organic Synthetic Products - Dyes | - No evidence of carcinogenic potency | |
Table 2.
Hazardous substances source and pollutants.
| Source | Pollutants | |
|---|---|---|
| MEP | Heating Equipment | Carbon Dioxide (CO2), Carbon Monoxide (CO) Nitrogen Dioxide (NO2), Total Suspended Particles (TSP) |
| Air Purifier, Copier | Ozone (O3), Total Suspended Particles (TSP) | |
| Humidifier | Bacteria, Fungi, Water Vapor | |
| Air-Conditioner | Bacteria, Fungi, Legionella | |
| Building Material | Wood, Plywood | Formaldehyde (CH2O) |
| Paints | Formaldehyde (CH2O) Volatile Organic Compounds (VOCs) | |
| Carpet, Curtain | Mite, Fungi, Total Suspended Particles (TSP) | |
| Concrete, Gypsum Board | Radon | |
| Misc. | Soil | Radon, Legionella, Water Vapor |
Table 3.
Global standards for indoor air quality.
| Hazardous Substances | United States | Europe (WHO) | Japan | UAE (Dubai) |
|---|---|---|---|---|
| Formaldehyde (CH2O) | 0.1 ppm (ASHRAE) | 100 µg/m3 (30 min) | 100 µg/m3 (JSHS) | 0.08 ppm (Municipality) |
| Carbon Dioxide (CO2) | 1000 ppm (ASHRAE) | 920 ppm (24 h) | 1000 ppm (JBSA/JSHS) | N/A |
| Carbon Monoxide (CO) | 25 ppm (EPA) (8 h) | 10 ppm (8 h) | 10 ppm (JBSA/JSHS) | N/A |
| Nitrogen Dioxide (NO2) | 0.053 ppm (NAAQS) | 40 µg/m3 (1 year) | N/A | N/A |
| Ozone (O3) | N/A | 120 µg/m3 (8 h) | N/A | N/A |
| Radon | 4.0 pCi/L (EPA) | 2.7 pCi/L | N/A | N/A |
| Total Suspended Particles (TSP) | 25 µg/m3 (24 h) | 100–120 µg/m3 (8 h) | 0.1 mg/m3 (JSHS) | 150 µg/m3 (Municipality) |
| Volatile Organic Compounds (VOCs) | N/A | 0.2–0.6 mg/m3 (FISIAQ) | 0.5 mg/m3 (JSHS) | 300 µg/m3 (Municipality) |
Table 4.
Overview of field survey.
| Field Survey | ||
|---|---|---|
| On-Site Measurement | Resident Interview & Observational Survey | |
| Target Building | The Greens in Dubai (20 1 bedroom and 2 bedroom units where residents did renovation in last 6 month) | |
| Contents | - Room Temperature & Relative Humidity - Carbon Monoxide (CO) - Carbon Dioxide (CO2) - Formaldehyde (CH2O) - Volatile Organic Components (VOCs) - Total Suspended Particles (TSP) | - Interview: Resident Characteristics - Residential Unit Characteristics - Renovation Range - Ventilation Status - SBS Symptoms - Observation of Renovated Parts (Video) |
| Methods | - Measured without Affecting the Life of the resident - Observe/Record Behavioral Patterns | - Interview - Observation (Video) |
Table 5.
Measuring IAQ factors and methods.
| Measuring Factors | Measuring Devices | Measuring Time | Measuring Location | |
|---|---|---|---|---|
| Background Factors | Indoor Temperature | Digital Thermo-Hygrometer (TR-72U) | 10:00 a.m.–18:00 p.m. (Autosave every 5 min for 8 h) | 1.5 m from the floor in the center of the living room |
| Relative Humidity | ||||
| IAQ Factors | Formaldehyde (CH2O) | PPM Formaldemeter TM-400 | 10:00 a.m.–18:00 p.m. (Measured every 20 min) | |
| Total Volatile Organic Components (TVOC) | IAQ Monitor (IAQRAE PGM-5210) | 10:00 a.m.–18:00 p.m. (Autosave every 1 min for 8 h) | ||
| Carbon Monoxide (CO) Carbon Dioxide (CO2) | IAQ Monitor (Kanomax 2212) | 10:00 a.m.–18:00 p.m. (Autosave every 5 min for 8 h) | ||
| Total Suspended Particles (TSP) | Digital Aerosol Monitor (Kanomax 3411) | 10:00 a.m.–18:00 p.m. (Measured every 20 min) | ||
Table 6.
Overview of the surveyed housing units in The Greens, Dubai.
| Housing Units | Type | A/C Type | Ventilation | Orientation | Floor | Days after Renovation | Renovation Range |
|---|---|---|---|---|---|---|---|
| Al Sidir 201 | Studio | Central A/C | - Central A/C - Kitchen exhaust hood - Bathroom exhaust fan | NE | 2/5 | 36 | Partial Renovation |
| Al Sidir 302 | Studio | SW | 3/5 | 55 | |||
| Al Ghaf 104 | Studio | NE | 1/5 | 46 | |||
| Al Ghaf 203 | Studio | SE | 2/5 | 34 | |||
| Al Jaz 211 | 1 Bedroom | SW | 2/5 | 29 | |||
| Al Ghaf 402 | Studio | NE | 4/5 | 4 | |||
| Al Arta 608 | 2 Bedroom | NW | 6/9 | 10 | Full Renovation | ||
| Al Arta 806 | 2 Bedroom | NW | 8/9 | 19 | |||
| Al Jaz 302 | 1 Bedroom | NE | 3/5 | 8 | Partial Renovation | ||
| Al Sidir 404 | Studio | SE | 4/5 | 13 | |||
| Al Alka 708 | 2 Bedroom | NW | 7/9 | 0 | Full Renovation | ||
| Al Samar 204 | 1 Bedroom | NE | 2/5 | 63 | |||
| Al Alka 603 | 2 Bedroom | NW | 6/9 | 22 | |||
| Al Samar 104 | 1 Bedroom | NE | 1/5 | 45 | |||
| Al Samar 214 | 1 Bedroom | NE | 2/5 | 33 | |||
| Al Samar 308 | 1 Bedroom | SW | 3/5 | 45 | |||
| Al Thayal 103 | 1 Bedroom | SW | 1/5 | 36 | Partial Renovation | ||
| Al Thayal 204 | 1 Bedroom | NE | 2/5 | 11 | |||
| Al Gozlan 310 | 2 Bedroom | NW | 3/9 | 22 | Full Renovation | ||
| Al Jaz 404 | 1 Bedroom | NE | 4/5 | 18 |
Table 7.
Sick Building Syndrome (SBS) symptoms immediately after renovation.
| SBS Symptoms N: 20 | Suffer a Lot | Suffer | Slightly Suffer | Almost Never Suffer | Never Suffer | Mean | |||||
|---|---|---|---|---|---|---|---|---|---|---|---|
| # | % | # | % | # | % | # | % | # | % | ||
| Headache | 0 | 0.0 | 1 | 5.0 | 2 | 10.0 | 5 | 25.0 | 12 | 60.0 | 4.4 |
| Itchy Eyes | 1 | 5.0 | 3 | 15.0 | 6 | 30.0 | 3 | 15.0 | 7 | 35.0 | 3.6 |
| Sore Throat | 2 | 10.0 | 1 | 5.0 | 6 | 30.0 | 4 | 20.0 | 7 | 35.0 | 3.7 |
| Frequent Cough | 0 | 0.0 | 0 | 0.0 | 3 | 15.0 | 4 | 20.0 | 13 | 65.0 | 4.5 |
| Stuffy Nose | 1 | 5.0 | 4 | 20.0 | 1 | 5.0 | 5 | 25.0 | 9 | 45.0 | 3.9 |
| Itchy Skin | 0 | 0.0 | 0 | 0.0 | 7 | 35.0 | 4 | 20.0 | 9 | 45.0 | 4.1 |
| Nausea | 0 | 0.0 | 2 | 10.0 | 1 | 5.0 | 5 | 25.0 | 12 | 60.0 | 4.4 |
| Lethargy | 0 | 0.0 | 1 | 5.0 | 2 | 10.0 | 4 | 20.0 | 13 | 65.0 | 4.5 |
| New House Smell | 8 | 40.0 | 4 | 20.0 | 3 | 15.0 | 2 | 10.0 | 3 | 15.0 | 2.4 |
| Miscellaneous | - Al Alka 708: Bathroom smells particularly bad - Al Samar 204: Headache and nausea for 2–3 days immediately after renovation Children suffered slight atopic symptoms - Al Alka 708: New house smell for approximately 2 weeks | ||||||||||
Table 8.
Field survey results and indoor air pollutants in 20 housing units at The Greens, Dubai.
| Housing Units | Back Data | Indoor Air Pollutants | SBS Symptoms | Renovation | Number of Family Members @Measuring Day | ||||||||
|---|---|---|---|---|---|---|---|---|---|---|---|---|---|
| RT (°C) | RH (%) | CO2 (ppm) | CO (ppm) | TSP (µg/m3) | TVOC (ppm) | CH2O (ppm) | Area (m2) | Renovation Range (%) | Days Passed after Completion | Daily Ventilation Amount (Frequency/Week) | |||
| l Sidir 201 | 22.3 | 31.7 | 1062.6 | 1.3 | 26.4 | 0.01 | 0.03 | 4.8 | 79.3 | 26 | 36 | 14 | 2–3 |
| Al Sidir 302 | 21.7 | 41.8 | 1326.0 | 2.8 | 32.8 | 0.01 | 0.08 | 4.8 | 79.3 | 38 | 55 | 14 | 2–3 |
| Al Ghaf 104 | 24.7 | 51.2 | 2245.9 | 2.1 | 15.7 | 0.09 | 0.29 | 5.0 | 75.8 | 28 | 46 | 7 | 6–8 |
| Al Ghaf 203 | 24.2 | 29.6 | 1232.5 | 1.2 | 27.1 | 0.00 | 0.00 | 3.0 | 75.8 | 15 | 33 | 7 | 4–6 |
| Al Jaz 211 | 22.3 | 21.2 | 890.1 | 0.3 | 2.8 | 0.00 | 0.00 | 4.8 | 105.4 | 15 | 29 | 7 | 1–8 |
| Al Ghaf 402 | 21.3 | 58.6 | 1275.7 | 2.0 | 56.8 | 0.98 | 0.40 | 3.9 | 79.2 | 31 | 4 | 14 | 3–5 |
| Al Arta 608 | 23.3 | 24.4 | 682.4 | 1.8 | 48.8 | 0.20 | 0.24 | 4.0 | 138.6 | 62 | 10 | 7 | 3–8 |
| Al Arta 806 | 25.4 | 19.5 | 815.4 | 1.9 | 23.7 | 0.01 | 0.07 | 3.7 | 141.8 | 51 | 19 | 14 | 2–6 |
| Al Jaz 302 | 24.3 | 32.1 | 1271.3 | 0.6 | 4.8 | 0.93 | 0.13 | 4.7 | 99.4 | 43 | 8 | 7 | 2–6 |
| Al Sidir 404 | 22.8 | 23.2 | 940.3 | 0.3 | 6.3 | 0.09 | 0.02 | 4.2 | 75.8 | 34 | 13 | 14 | 2–6 |
| Al Alka 708 | 27.3 | 35.1 | 1148.2 | 3.0 | 21.2 | 0.98 | 0.38 | 4.2 | 122.2 | 53 | 0 | 2 | 3–5 |
| Al Samar 204 | 25.1 | 41.3 | 1923.7 | 1.7 | 1.6 | 0.04 | 0.28 | 3.6 | 105.7 | 56 | 63 | 4 | 5–6 |
| Al Alka 603 | 23.5 | 43.6 | 1210.5 | 6.2 | 48.1 | 1.92 | 1.01 | 3.4 | 141.8 | 65 | 12 | 2 | 1–4 |
| Al Samar 104 | 25.2 | 38.7 | 1366.9 | 1.4 | 13.2 | 0.00 | 0.12 | 2.1 | 105.6 | 45 | 45 | 14 | 2–5 |
| Al Samar 214 | 23.1 | 40.4 | 1134.2 | 1.1 | 12.8 | 0.75 | 0.26 | 2.9 | 105.6 | 58 | 23 | 14 | 3–4 |
| Al Samar 308 | 25.4 | 22.3 | 1013.0 | 2.5 | 19.2 | 0.12 | 0.06 | 3.8 | 105.6 | 52 | 35 | 7 | 3–5 |
| Al Thayal 103 | 22.8 | 26.1 | 820.4 | 0.6 | 0.9 | 0.12 | 0.08 | 3.6 | 112.2 | 44 | 36 | 7 | 1–2 |
| Al Thayal 204 | 24.3 | 57.4 | 2308.2 | 4.1 | 4.9 | 2.98 | 0.64 | 4.4 | 99.2 | 42 | 10 | 2 | 3–7 |
| Al Gozlan 310 | 24.9 | 39.2 | 890.3 | 1.3 | 74.7 | 0.21 | 0.18 | 3.7 | 138.6 | 48 | 20 | 14 | 2–5 |
| Al Jaz 404 | 23.4 | 54.4 | 1261.5 | 3.4 | 49.6 | 0.21 | 0.31 | 4.0 | 105.6 | 51 | 17 | 7 | 3–6 |
| Average | 23.8 | 36.5 | 1241.1 | 2.1 | 24.6 | 0.51 | 0.21 | 3.9 | 104.6 | 43 | 25.7 | 8.9 | N/A |
Publisher’s Note: MDPI stays neutral with regard to jurisdictional claims in published maps and institutional affiliations. |
© 2021 by the authors. Licensee MDPI, Basel, Switzerland. This article is an open access article distributed under the terms and conditions of the Creative Commons Attribution (CC BY) license (https://creativecommons.org/licenses/by/4.0/).
Share and Cite
MDPI and ACS Style
Awad, J.; Jung, C. Evaluating the Indoor Air Quality after Renovation at the Greens in Dubai, United Arab Emirates. Buildings 2021, 11, 353. https://0-doi-org.brum.beds.ac.uk/10.3390/buildings11080353
AMA Style
Awad J, Jung C. Evaluating the Indoor Air Quality after Renovation at the Greens in Dubai, United Arab Emirates. Buildings. 2021; 11(8):353. https://0-doi-org.brum.beds.ac.uk/10.3390/buildings11080353
Chicago/Turabian StyleAwad, Jihad, and Chuloh Jung. 2021. "Evaluating the Indoor Air Quality after Renovation at the Greens in Dubai, United Arab Emirates" Buildings 11, no. 8: 353. https://0-doi-org.brum.beds.ac.uk/10.3390/buildings11080353
Note that from the first issue of 2016, this journal uses article numbers instead of page numbers. See further details here.