1. Introduction
Carbon dioxide emissions are severely threatening the existence and survival of both the earth and humankind. At present, the world is attempting to reduce carbon dioxide emissions. For example, China is currently striving to peak its carbon dioxide emissions by 2030 and achieve carbon neutrality by 2060. Moreover, it should be noted that China is a developing country, and infrastructure construction is underway. During the construction process, cement is the most commonly used building material. The carbon dioxide produced by cement production accounts for 8% of the total global carbon dioxide emission each year [
1]. If there were to be a cementitious material that could replace cement, carbon dioxide emissions could be greatly reduced. Additionally, steel is also a widely used material in construction projects. In the production process of steel, a large amount of waste is unavoidably produced. This is referred to as the granulated blast furnace slag. The wastes in question are often stacked in open air, in turn causing environmental pollution. Presently, only a small amount of slag is being used to produce cement admixture after grinding. It accounts for a total of around 20–30% [
2].
Alkali-activated slag is a cementitious material formed by adding an alkali activator to slag, which appeared in 1940 [
3]. The emergence of alkali-activated slag is almost fully capable of solving both the problems of pollution caused by cement production and waste slag utilization. In comparison to cement, alkali-activated slag has better early strength [
4,
5], chemical corrosion resistance [
6,
7], biological erosion resistance [
8,
9], and freeze–thaw resistance [
10,
11]. Alkali-activated slag has many advantages, but some properties have not been clearly studied, which affects its application, such as creep.
Creep refers to the phenomenon where the deformation of a specimen continuously increases under long-term load. Creep is capable of affecting the long-term performance of members, by increasing the deflection of beams and causing pre-stress loss. In comparison to cement concrete, alkali-activated concrete has greater creep [
12]. Zhou observed that under the same parameters, the creep of AAS concrete is about twice that of OPC concrete. However, thus far, no explanation for how to further reduce the creep has been provided [
13]. Adding fiber into concrete is a satisfactory method for reducing concrete creep. Fibers are added to concrete to improve tensile strength [
14,
15] and ductility [
16,
17]. Moreover, they are also able to reduce the creep of concrete [
18,
19]. The inhibiting effects of fiber on creep depends on fiber length, fiber volume ratio [
20], and stress–strength ratio [
21]. It should be noted that as a common fiber of concrete, PP fiber has the characteristics of easy processing and low price. Haddad and Smadi [
22] compared the inhibition effect of steel fiber and PP fiber on concrete creep. They indicated that PP fibers tend to have a better inhibition effect on concrete creep with respect to little volume rate and low cost.
It takes a long time to test the creep of concrete, from 200 days to 1000 days. Due to the fact that it is unrealistic to test the performance of concrete every time, it is necessary to predict the creep model of concrete. However, the existing concrete model does not take the fiber content into consideration. In other words, with respect to AAS concrete with fiber, the model needs to be improved in order to be able to predict the creep of PP FRAAS concrete.
With respect to the fiber volume ratio of 0.6%, this paper studies the creep properties of PP FRAAS concrete with three different lengths (6 mm, 12 mm, and 18 mm) of PP fiber at the stress–strength ratio of 0.15–0.6. Furthermore, the effects of stress–strength ratio and fiber length on the creep properties of polypropylene fiber-reinforced alkali slag concrete are also analyzed in this paper. Finally, it should be noted that according to the test results, a prediction method of PP FRAAS concrete creep is proposed.
2. Experimental Procedure
2.1. Materials and Mixture
PP FRAAS consists of three parts: cementitious material, aggregate, and fiber. Firstly, it should be made clear that the cementitious material portion is alkali-activated slag and is thus composed of slag and activator. The slag considered in this article is locally produced in Harbin. Furthermore, the activators commonly used to excite slag are sodium silicate, sodium hydroxide, and sodium carbonate. The slag excited by sodium silicate (Na
2O•nSiO
2) has the highest strength [
4]. Moreover, in cases where sodium silicate solution is used as activator, there are three parameters in need of consideration: water–cement ratio (mass ratio of activator solvent to slag), modulus (n in Na
2O•nSiO
2), and alkali dosage (mass ratio of activator solute to slag). Sodium silicate is considered a strong base and a weak acid salt. Its alkalinity increases with the decrease in the n variable. It should be noted that when sodium silicate is used as activator, there is an optimal modulus n, usually 1–1.5 [
23]. In the present study, the activator modulus is taken to be the intermediate value of 1.2. Furthermore, due to the fact that the modulus of raw material water glass (sodium silicate solution) is fixed during production (modulus was too large for AAS), it is necessary to mix sodium hydroxide with water glass in order to reduce the modulus of raw material to the optimal modulus. In reference to the activator dosage, an optimal range also exists, usually 7–20% [
24]. In the present experiment, the activator took the median of the optimal interval, which is 15%. In addition, the water–cement ratio was determined to be 0.5 through the entirety of the test. PP FRAAS concrete has neither bleeding nor sufficient working performance under this water–cement ratio. The mortar ratio (mass ratio of slag to fine aggregate) and sand ratio (mass ratio of fine aggregate to aggregate) were determined through tests, which are 0.5% and 33%, respectively.
After the introduction of the required raw materials, the specific characteristics of raw materials were introduced. The slag is produced by Harbin Xinsanfa Building Materials Co., Ltd., and its quality is S95. The determination results of the chemical composition of slag are provided in
Table 1. Water glass used in this experiment is produced by the Hebei Julide chemical plant, with the moisture content and modulus rated at 56% and 2.4, respectively. Furthermore, sodium hydroxide is made by the Tianjin Continental Chemical Plant. It is in the form of flake particles, with a purity level of more than 96%. In addition, the water used in this study is local tap water in the city of Harbin. The stones and sand used also come from Harbin. It is relevant to note that the particle size of coarse aggregate is 5–10 mm, while the maximum particle size of sand is 2.5 mm, and its fineness is 2.5, meaning it belongs to medium coarse sand. After calculation, the mix of raw materials for making AAS concrete is illustrated in
Table 2. Moreover, the PP fiber is produced by the Shanghai Qichen chemical plant, and the specific parameters of fiber may be found in
Table 3. For additional clarity, pictures of the PP fibers with different lengths are provided in
Figure 1. The fiber–volume ratio (fiber accounts for the volume of concrete) adopts a more appropriate 0.6%. Under the aforementioned fiber–volume ratio, the fiber length adopts 6 mm, 12 mm, and 18 mm, respectively. The names of different mix proportions and corresponding fibers are illustrated in
Table 4.
Concrete mixing was divided into three stages: dry mixing of slag and aggregate, mixing with activator, and mixing with fiber. Each aforementioned stage of the mixing test lasted for 1 min, 30 s, and 2 min, respectively. After mixing, the freshly mixed concrete was poured into 100 mm × 100 mm × 300 mm and 100 mm × 100 mm × 400 mm molds and vibrated for 30 s. After vibration, the top of the test piece was covered with plastic film to prevent moisture loss. The specimen was removed after 3 days, and after demolding, it was placed in a constant temperature and humidity laboratory for further curing for a period of 28 days. The temperature and humidity of the laboratory were controlled at 20 ± 2 °C and 60 ± 3%, respectively.
2.2. Test Process
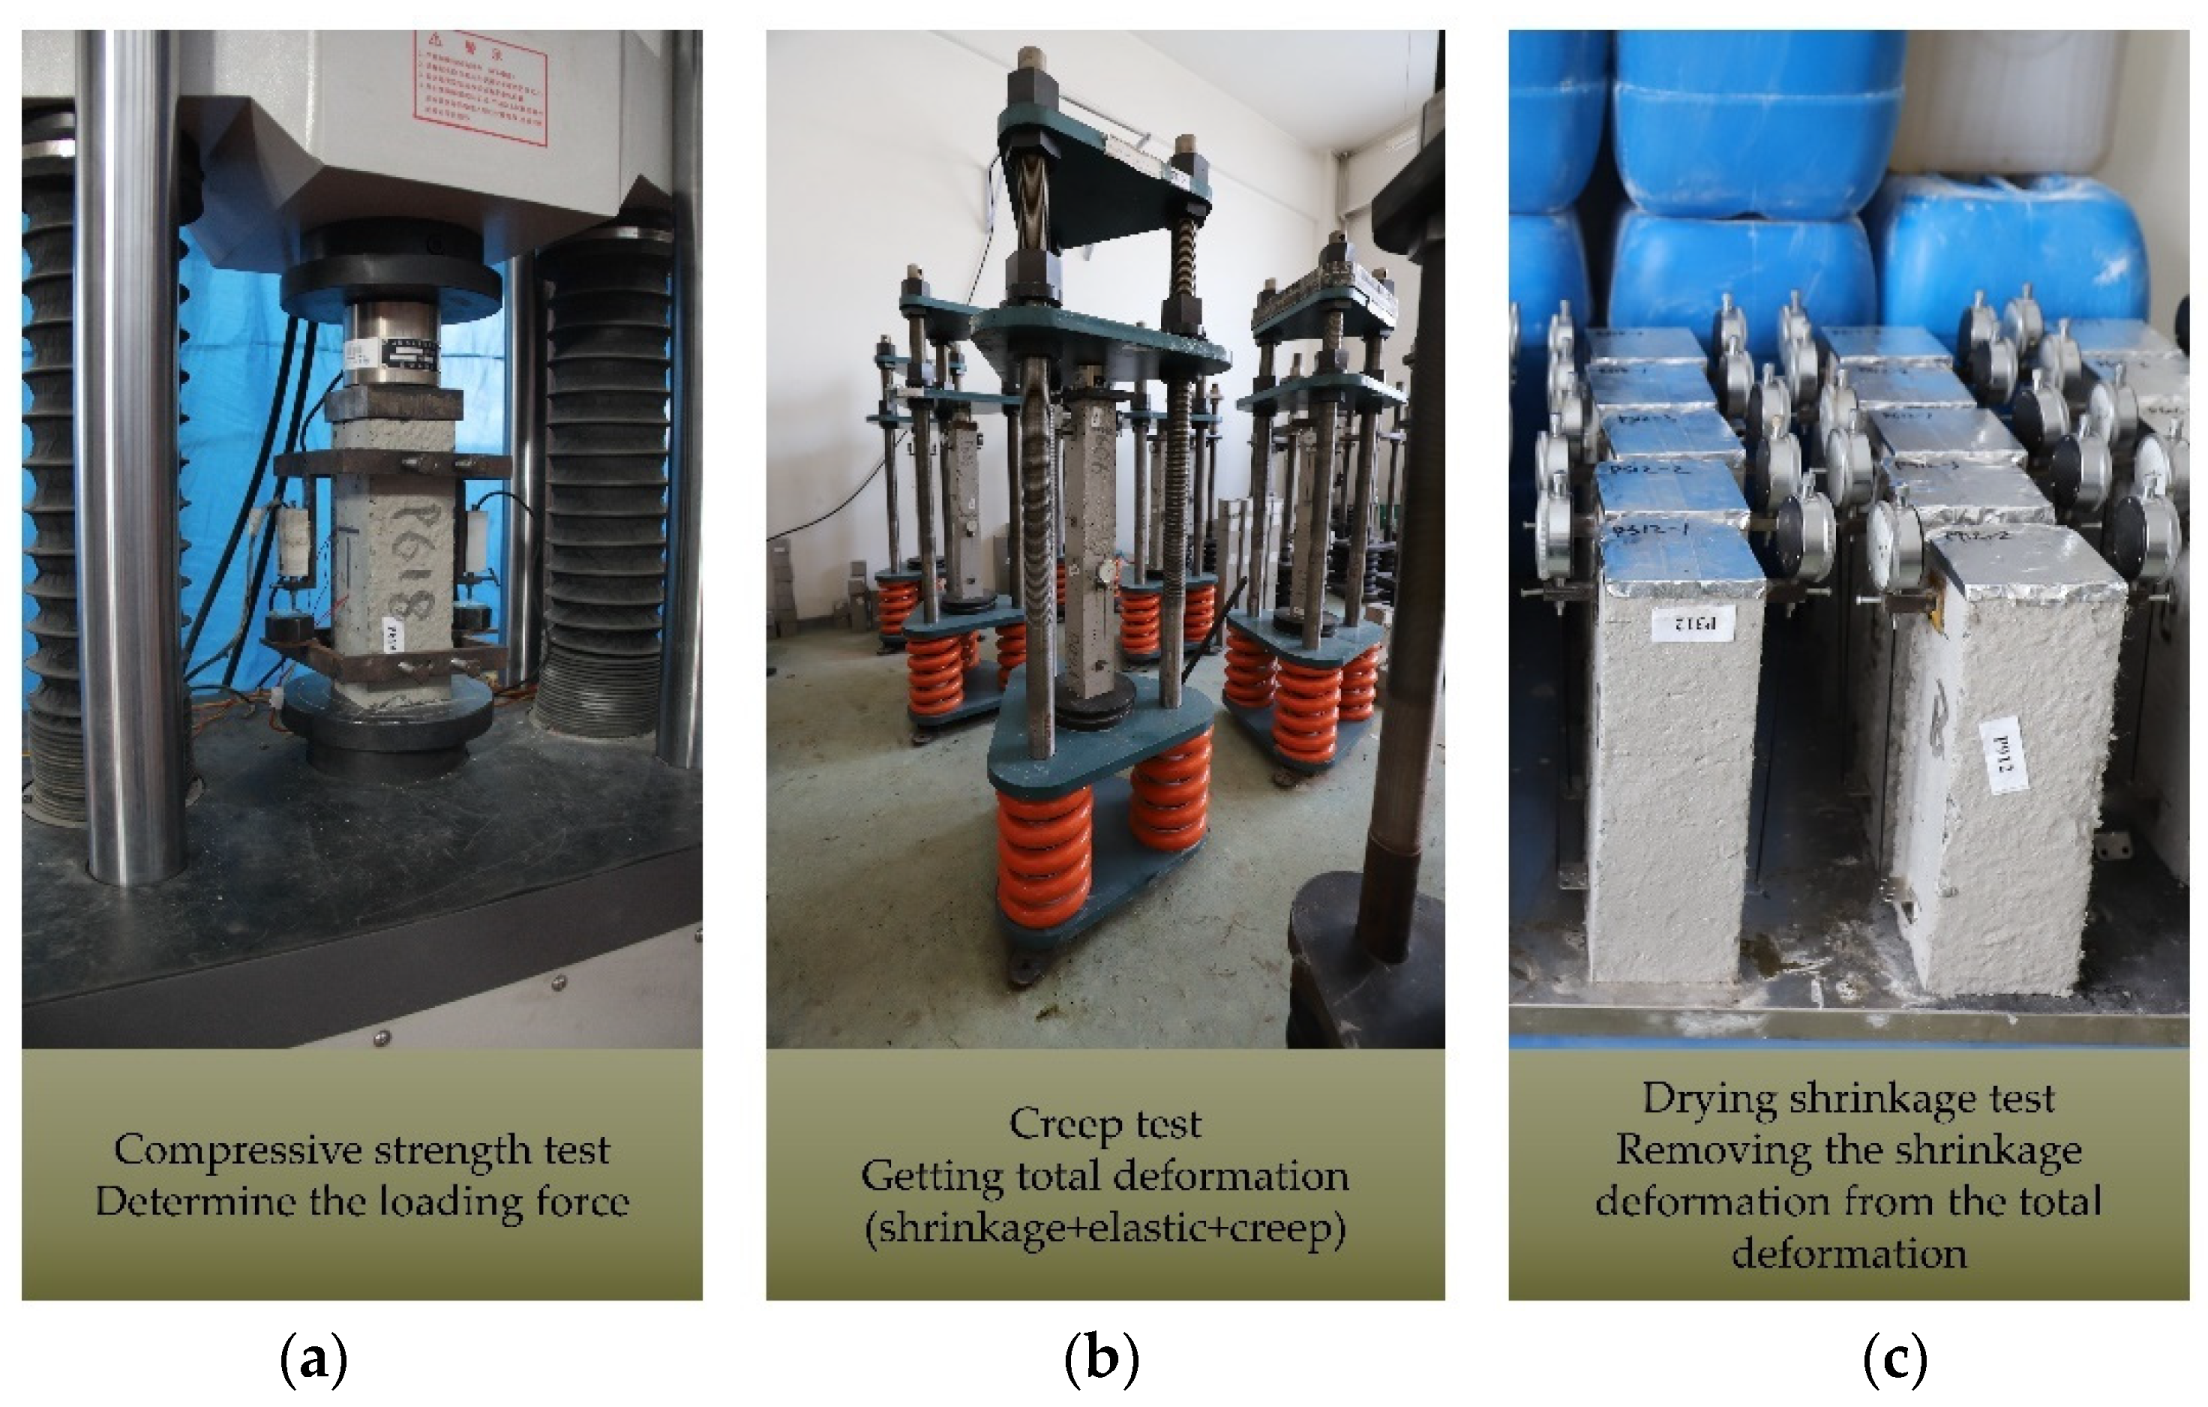
In order to study creep under different stress–strength ratios, the first factor in need of determining is the strength of the concrete prism. The size of a prism strength test piece is 100 mm × 100 mm × 300 mm. The test specification for compressive strength is GB/T 50081-2002 [
25], while the test device is illustrated in
Figure 2a. The test results of compressive strength have been published [
26]. After measuring the compressive strength, the loading stress during the creep test may be determined according to the target stress water product. This test involves 4 stress–strength ratios, corresponding to each mix proportion, which are 0.15, 0.3, 0.45, and 0.6, respectively. With regard to cement concrete, the stress–strength ratio includes a linear creep section and nonlinear allowable creep section (the stress–strength ratio at the dividing point is 0.4–0.5).
The creep test is based on the following test specifications: GB/T 50082-2009 [
27]. The size of the creep specimen is 100 mm × 100 mm × 400 mm. Moreover, the equipment used for creep is depicted in
Figure 2b. The name and corresponding working conditions of each specimen are provided in
Table 5. The test results of 0 and P612 have been published [
28].
Due to the fact that the deformation measured by the creep instrument includes creep deformation and shrinkage deformation, the former may be obtained solely by removing the shrinkage deformation. Although the size of the specimen used in the shrinkage test differs from the creep specimen, it is 100 mm × 100 mm × 300 mm. However, by pasting aluminum foil tape on the end surface of the shrinkage specimen, the moisture loss of the creep specimen is simulated well (moisture is emitted from around the cross-section). The shrinkage test is illustrated in
Figure 2c.
3. Test Results
3.1. Stress-Dependent Strain
The deformation value obtained by the creep instrument represents the total deformation. In addition, the stress-dependent strain is obtained after removing the shrinkage deformation. The stress-dependent strain consists of two parts: the first is the instantaneous deformation at the time of loading, while the other is the creep deformation at the time of load holding. As can be observed in
Figure 3, under each mix proportion, the stress-dependent strain increases with time. However, the growth rate decreases gradually, while the creep tends to be stable. These results indicate that the creep of the specimen below the 0.6 stress–strength ratio is a convergent creep [
29]. Simultaneously, under the same mix proportion and the same time, stress and deformation increase with the increase in the stress–strength ratio.
By comparing the stress and deformation under different mix proportions, it has been shown that when the fiber length is 6 mm, the inhibition effect of PP fiber on creep is negative, and that the creep is greater than that of plain AAS concrete. By observing the length of other fibers, it was noted that the addition of fibers significantly reduces the creep at the stress–strength ratio of 0.3–0.6. According to Zhang’s theory, the inhibition effect of fiber on creep, under the same fiber volume ratio, becomes stronger with the increase in fiber length. However, once the diameter length ratio of fiber exceeds 50, the inhibition effect of the diameter length ratio on fiber creep is no longer different [
21]. According to the aforementioned theory, as well as
Table 3, when the diameter of the PP fiber is multiplied by 50, the critical point of fiber length is 1.25 mm. The value of 6 mm far exceeds 1.25 mm, but it still does not provide enough constraints. This shows that PP fiber needs a longer bonding length with concrete in order to display the inhibition effect on creep. Theoretical research provides a clear law, but it is not applicable to all fibers. Some fibers (such as PP fiber in this test) still need to verify whether the theory is applicable through practical experiments.
The addition of fiber reduces the creep but also reduces the compressive strength. In order to simply reduce creep, adding fiber is a feasible method. If both compressive strength and creep need to be considered, the ratio of creep to loading stress can be referred to.
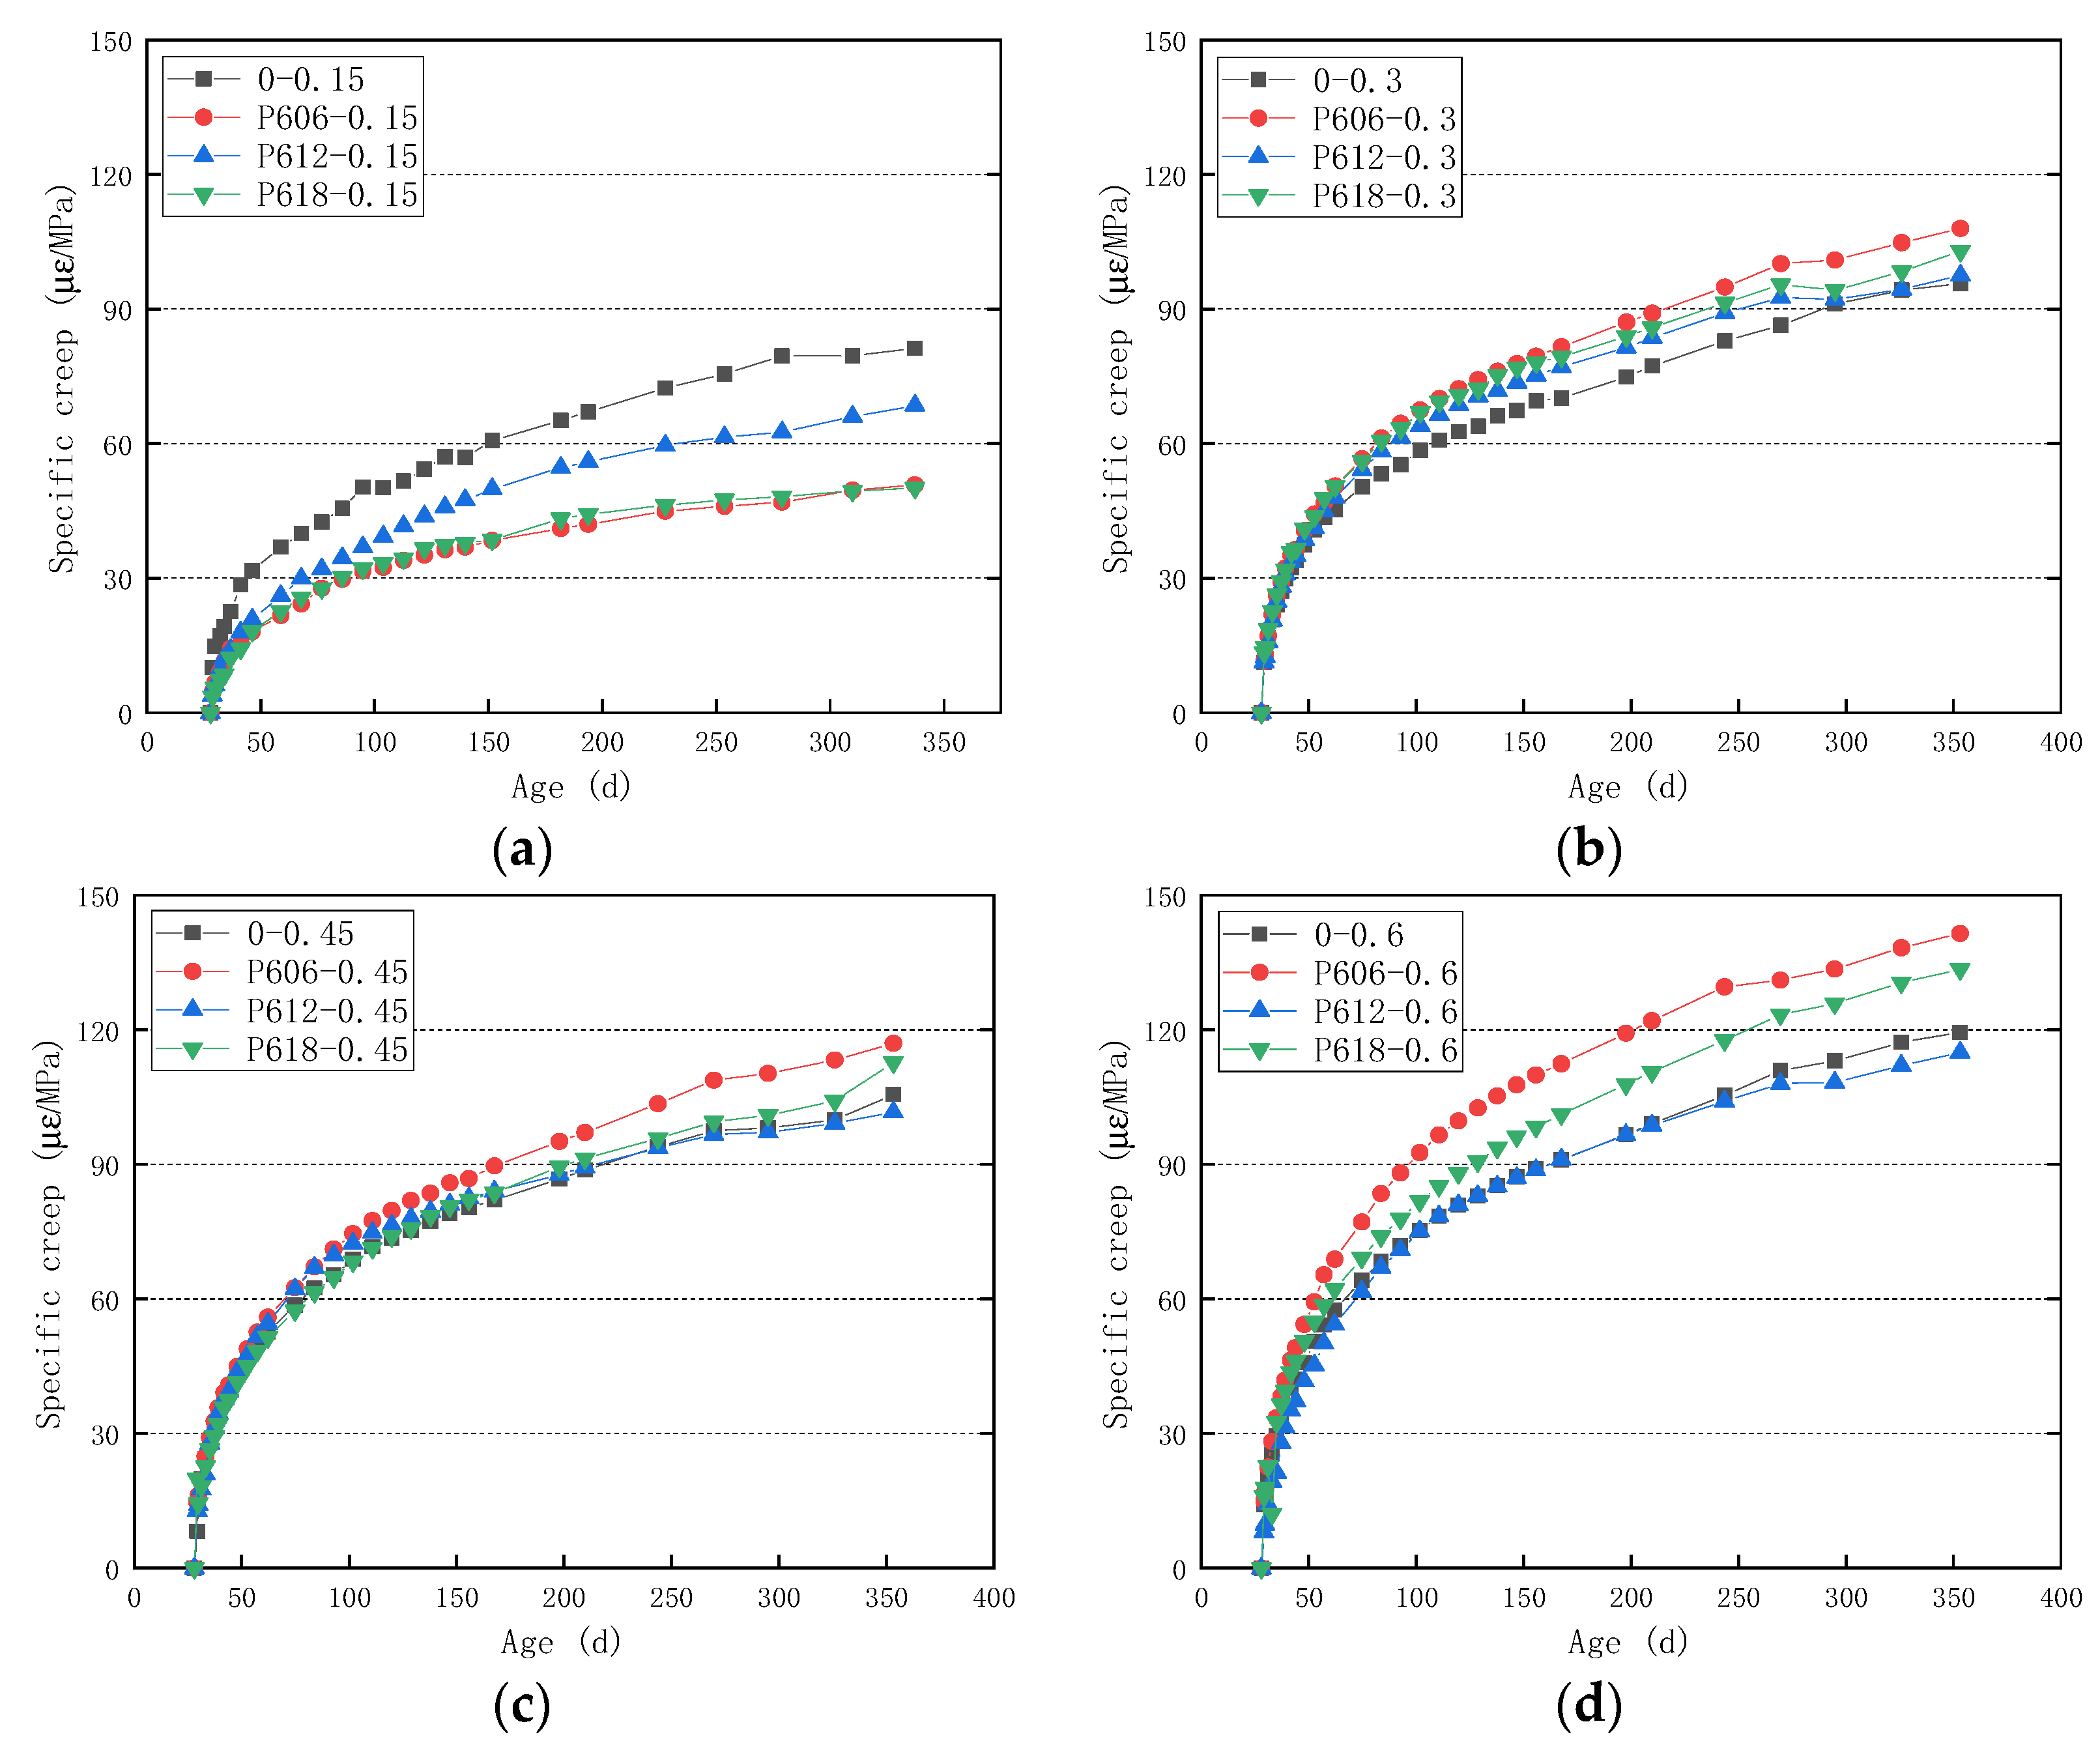
3.2. Specific Creep
The ratio of creep to loading stress is termed specific creep. Creep is capable of removing the influence of the stress–strength ratio to a certain extent. For cement concrete, when the stress–strength ratio is less than 0.4, the creep deformation of concrete will have a linear relationship with the stress [
30]. This means that the specific creep curve at the stress–strength ratio below 0.4 will coincide. However, from
Figure 4, it can be observed that under the same fiber length, even when the stress–strength ratio is lower than 0.4, the specific creep curves of different stress–strength ratios do not coincide. This shows that there is no linear creep in PP FRAAS under different fiber lengths.
Specific creep values for the same mix proportion at different stress–strength ratios are provided in
Figure 4. As can be observed in
Figure 4, under each mix proportion, the specific creep increases with time. However, the growth rate decreases gradually. It may be observed from
Figure 4a that the spacing between specific creep curves of AAS concrete without fiber under different stress–strength ratios is uniform. The interval between the specific creep curves in
Figure 4b–d becomes uneven. This indicates that the creep inhibition effect of fiber is different under different stress–strength ratios. When the fiber length is 6–18 mm, the specific creep curve at the 0.15 stress–strength ratio is far away from the 0.3 and 0.45 stress–strength ratios, and the value is small. This demonstrates that fiber plays an important role in inhibiting creep at the level of 0.15. By observing the three creep curves of P606-0.6, P612-0.6, and P618-0.6, it can be noted that the specific creep curves of P606-0.6 and P618-0.6 are far away from the specific creep curves under the stress–strength ratio of 0.45, and the values are large. However, P612-0.6 is close to P612-0.45. There are two reasons for this phenomenon. Firstly, under a high stress–strength ratio, 6 mm provides insufficient anchoring force for PP fiber, which can no longer restrict creep. Secondly, under the condition of fiber length of 18 mm, too-long fiber will cause more cavities [
31] and reduce strength [
26,
32]. These cavities will crack at a high stress–strength ratio [
28], which will counteract the inhibition of fiber on creep. In addition, at a high stress–strength ratio, the mechanism of fiber-inhibiting creep is to inhibit the development of microcracks [
33]. Therefore, for PP fiber under the same fiber volume ratio, too-long (18 mm) or too-short (6 mm) fiber will not have a better inhibition effect on the creep of concrete under a high stress–strength ratio.
In order to demonstrate the working state of different fiber lengths more intuitively under a certain stress–strength ratio,
Figure 5 illustrates specific creep values for different stress–strength ratios at mix proportions. Specific creep values for the 0.15 stress–strength ratio at different mix proportions were between 50 and 60 με/MPa. Specific creep values for the 0.3 stress–strength ratio at different mix proportions were between 90 and 110 με/MPa. Specific creep values for the 0.45 stress–strength ratio at different mix proportions were between 100 and 120 με/MPa. Specific creep values for the 0.6 stress–strength ratio at different mix proportions were between 110 and 140 με/MPa. From
Figure 5a, it may be seen that the addition of fiber greatly reduces the creep at the stress–strength ratio of 0.15. Taking into consideration that the engineering design is conservative, and the actual working stress will not be very high, the addition of fiber can indeed reduce creep. Furthermore, from both
Figure 5b,c, we can conclude that when the stress–strength ratio increases to 0.3 and 0.45, the addition of fiber has little inhibitory effect on creep and even has side effects. The worst inhibition effect may be noted with the P606 mix proportion. The fiber pull-out mechanism is an important reason affecting the creep of fiber-reinforced concrete [
34]. It is once more confirmed that the creep inhibition effect of PP fiber is insufficient when the fiber is particularly short. As shown in
Figure 5d, P612 still has a certain inhibitory effect on creep at the stress–strength ratio of 0.6, while neither P606 nor P618 have an inhibitory effect on creep at this stress–strength ratio but have side effects.
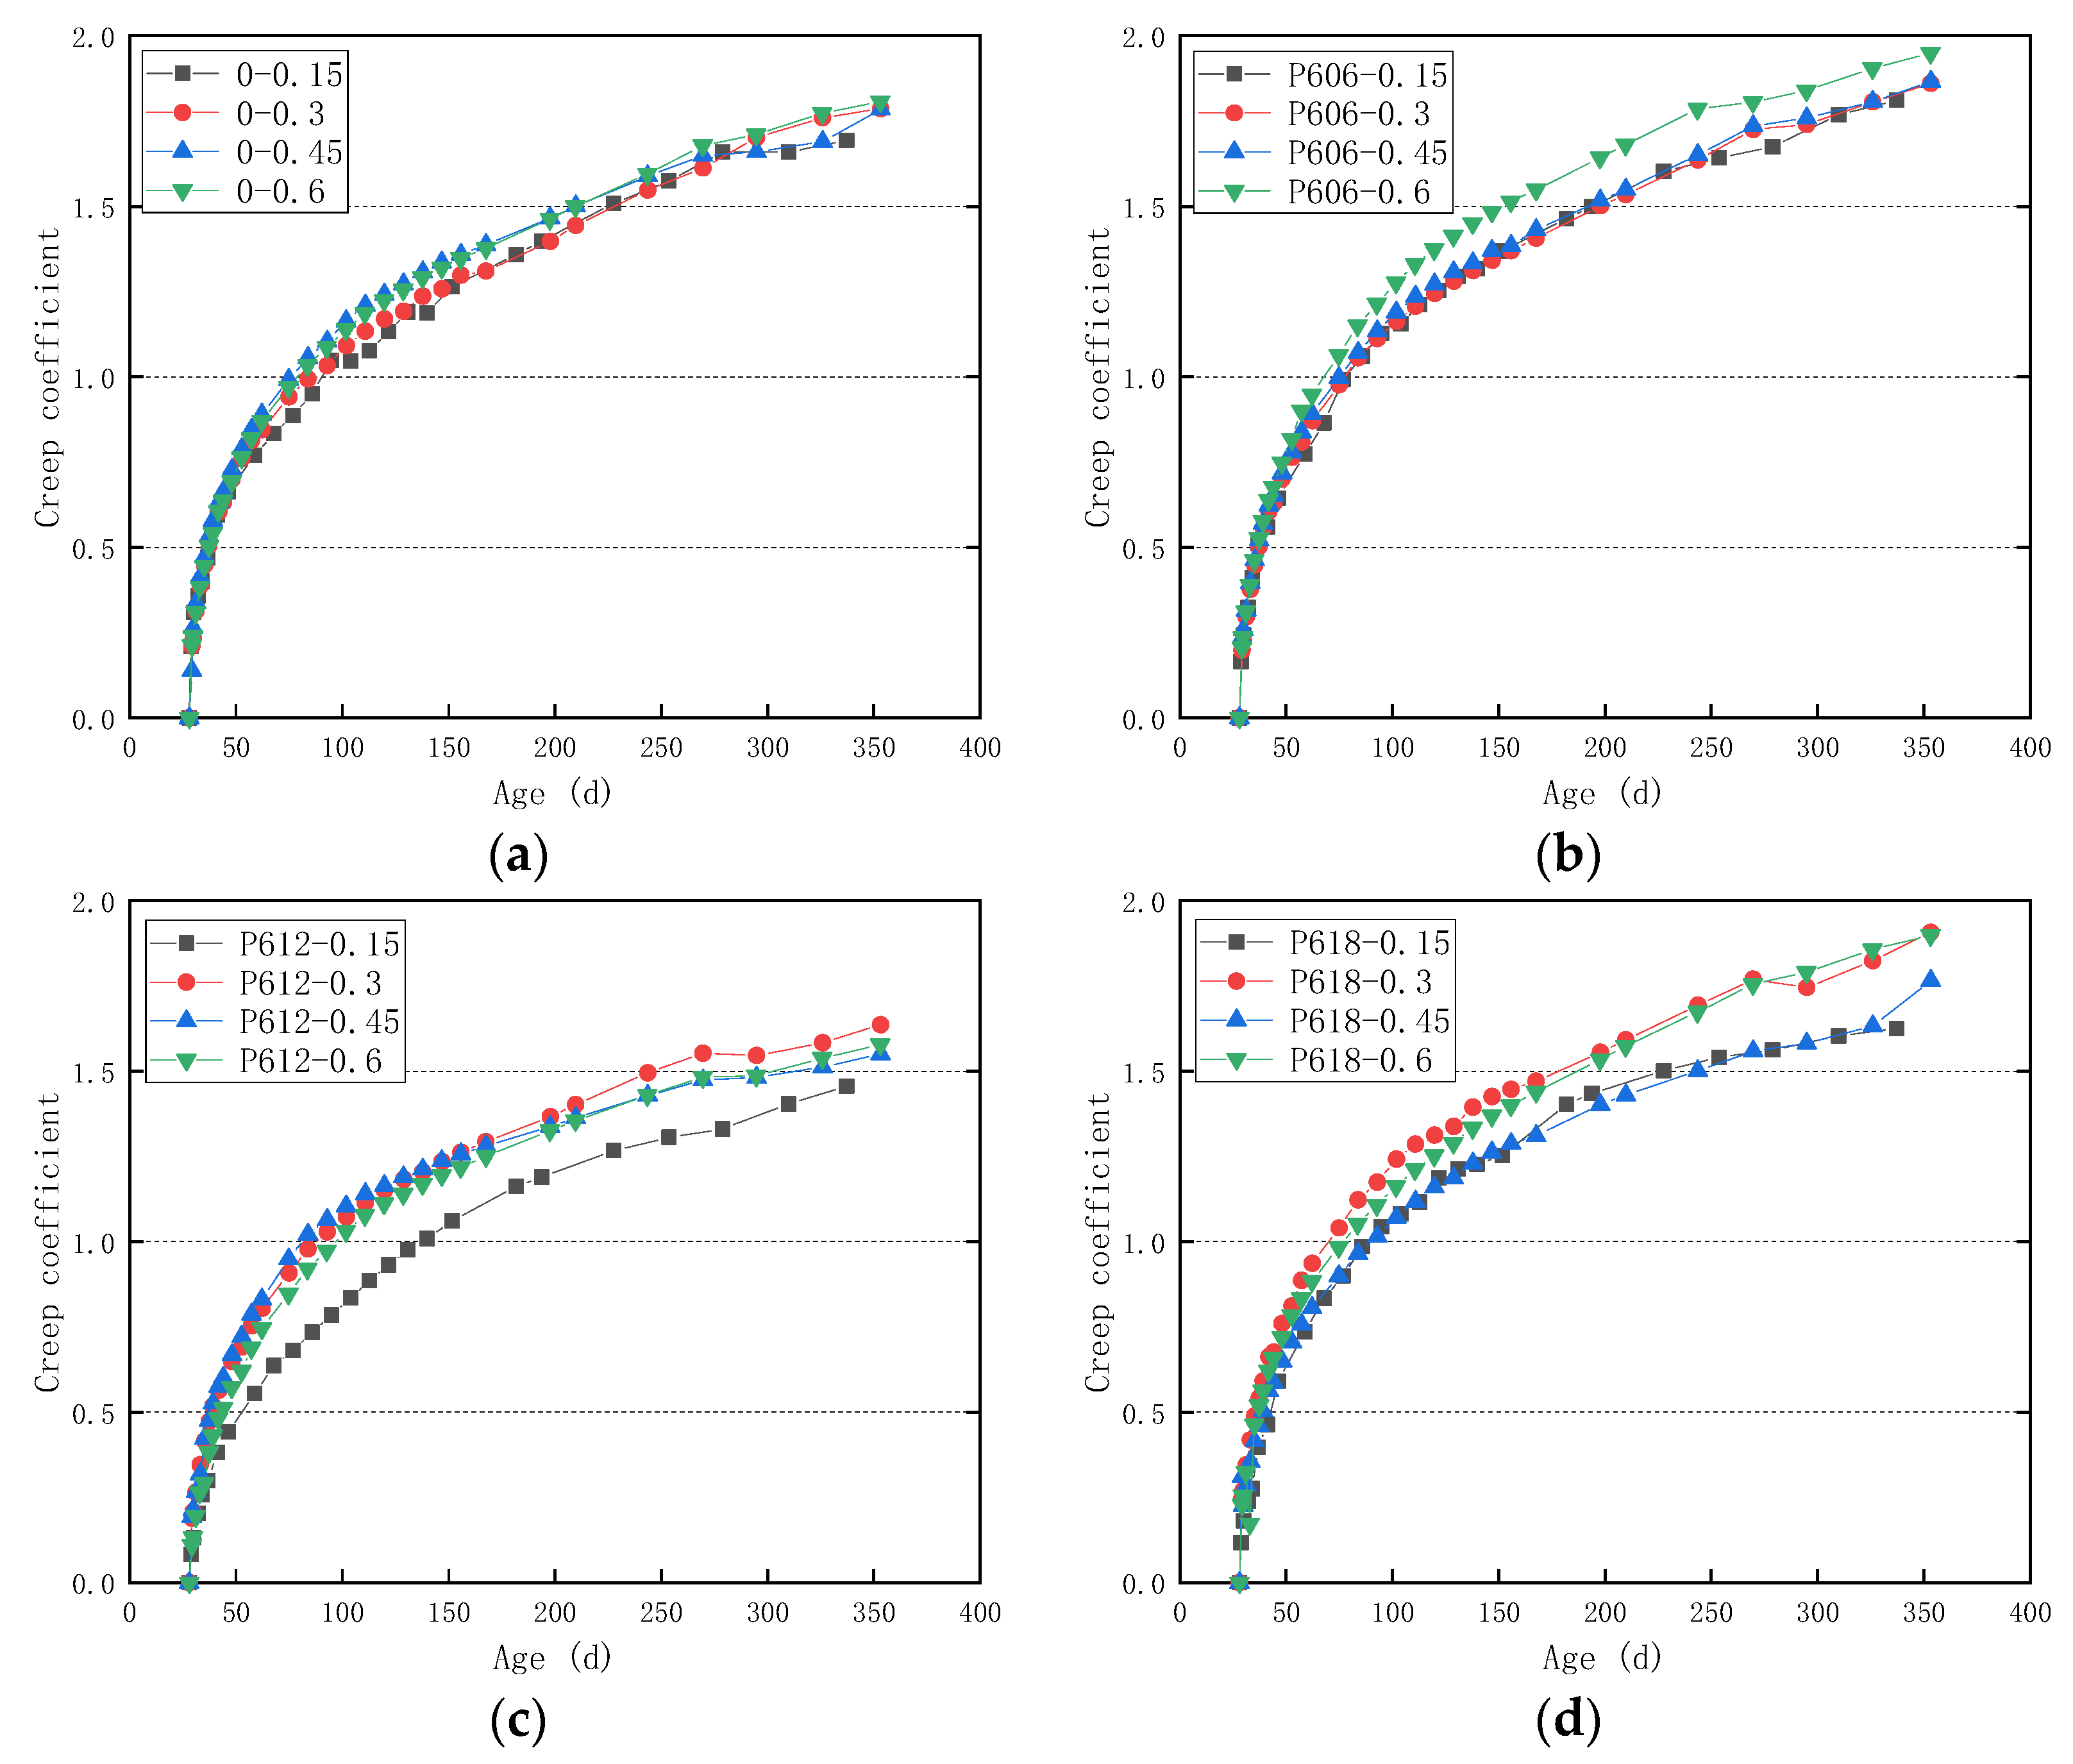
3.3. Creep Coefficient
Creep coefficient is defined as the ratio of creep deformation compared to instantaneous deformation. When compared to specific creep, which excludes the influence of stress, the creep coefficient further excludes the influence of elastic modulus and becomes a dimensionless number. Creep coefficients for the same mix proportions at different stress–strength ratios are illustrated in
Figure 6. It may be observed that there is little difference in creep coefficients at different stress–strength ratios under the same mix proportion. The creep coefficient increases continuously with age, and the growth rate slows down gradually. At 360 d, the creep coefficients of the same mix proportion at different stress–strength ratios are basically concentrated in the range of 1.5–1.9. This is different from OPC concrete, as the stress–strength ratio of OPC concrete is greater than 0.4, the creep coefficient of OPC concrete will increase [
30].
Through comparison of the creep coefficients of different mix proportions, the gap is not very large. This means that under the same fiber volume ratio, PP fibers with different lengths have little effect on the creep coefficient of PP FRAAS concrete. This is convenient to the prediction of creep. Creep belongs to a long-term test, and it is unrealistic to determine the creep magnitude every time. Therefore, it is important to utilize the creep prediction model. The existing four mature models are the GL2000 [
35], CEB-FIP 2010 [
30], ACI 209R-92 [
36], and B3 [
37] models. Although their respective parameters are different, the first three models choose to calculate the creep coefficient first. The creep prediction of FRAAS concrete with different fiber lengths with a unified creep coefficient will become very convenient.
4. Method for Predicting Creep of FRAAS Concrete
It should firstly be noted that the mean value of the creep coefficient of four mix proportions under different stress–strength ratios was calculated. Since the fiber content was not considered in the four models, only the parameters of AAS concrete were input into the model for creep prediction. The mean value and prediction curve of each mix proportion are illustrated in
Figure 7. From
Figure 7, it may be observed that the ACI 209R-92 model has sufficient accuracy in the early stage. However, the predicted value in the later stage is small. Furthermore, similarly to the ACI model, the CEB-FIP 2010 model has satisfactory precision in the early stage and slightly poorer precision in the later stage. Nevertheless, its precision is considered acceptable. The prediction value of the GL2000 model is large, and the growth rate is high in the early stage. However, the models were to be more accurate for the final value of 360 days. Lastly, the B3 model has been shown to be completely inaccurate. The reason for its inaccuracy is the fact that the B3 model calculates the same parameters as the specific creep while calculating the creep coefficient by multiplying the elastic modulus [
13]. Therefore, the calculated elastic modulus is inconsistent with the multiplied actual elastic modulus, resulting in an inaccurate creep coefficient.
In order to further illustrate the model prediction accuracy, the CEB-FIP 2010 and GL2000 model with satisfactory prediction effects were selected. In addition, as demonstrated in
Table 6, the R
2 values of model predictions were calculated. As can be observed from
Table 6, the CEB-FIP 2010 model has high accuracy with respect to each mix proportion. Conversely, the GL2000 model has been shown to have poor prediction accuracy.
Moreover, in an attempt to demonstrate the effect of model prediction more intuitively, the ratio of model prediction value to test value is illustrated in
Figure 8. From
Figure 8, it may be observed that the predicted value of the CEB-FIP 2010 model is close to the experimental value, and the prediction effect is better. In addition, the prediction accuracy of the GL2000 model is general (the predicted value is slightly larger). However, a larger predicted value may mean that it is more conservative and suitable for design. Lastly, it was noted that the GL2000 model was better than the CEB-FIP 2010 model in predicting the final value of creep. Therefore, the R
2 value cannot be used solely in the quality evaluation of a model.
The prediction of creep coefficient is solved in the previous paragraph, followed by the prediction of specific creep and stress-dependent strain. As has been previously mentioned, the specific creep and creep coefficients are transformed into each other through the elastic modulus. At present, ordinary concrete is very mature, and its elastic modulus can be calculated directly by inputting parameters into the model. Nevertheless, due to the fact that AAS concrete is presently not mature, no unified formula for elastic modulus may be proposed. With respect to the elastic modulus in this study, the secant modulus of PP FRAAS concrete under different stresses was calculated by using the stress and measured deformation loaded on the creep specimen. These calculations are illustrated in
Figure 9. From
Figure 9, it may be noted that the secant modulus of PP FRAAS concrete gradually decreases with the increase in the stress–strength ratio, which is approximately linear. When the stress–strength ratio increased from 0.15 to 0.6, the secant modulus of PP concrete decreased from about 2 to about 1.4. The slope between the secant modulus and stress–strength ratio under the same mix proportion is about −1.3. Thus, when calculating the specific creep, the unified elastic modulus cannot be applied; rather, the secant modulus needs to be used.
The secant modulus of each mix proportion under different stress–strength ratios is each mix. Moreover, the predicted specific creep is obtained by combining the creep coefficient calculated by both the CEB-FIP 2010 and GL2000 models. This is shown in
Figure 10a. In addition, after the specific creep has been obtained, the stress and deformation may be calculated by multiplying the actual loading stress and actual instantaneous deformation, as illustrated by
Figure 10b. As can be seen from
Figure 10b, this prediction method has high accuracy. Through the aforementioned process, the creep of PP FRAAS concrete with different fiber lengths can be predicted more accurately under different stress–strength ratios.
5. Conclusions
This paper aimed to demonstrate the effects of different fiber lengths and stress–strength ratios on the creep properties of PP FRAAS concrete with a fiber volume ratio of 0.6%. The experiments conducted for this article yielded several important results.
Firstly, when the fiber volume ratio is 0.6%, PP FRAAS concrete with a fiber length of 6–18 mm is convergent creep below the 0.6 stress–strength ratio. However, different from cement concrete, there is no evident linear creep.
Secondly, different lengths of PP fiber can significantly inhibit the creep of PP FRAAS concrete when the stress–strength ratio is 0.15. Moreover, when the stress–strength ratio increases, the shorter fiber (6 mm) will lose its anchoring force, and the holes caused by the longer fiber (18 mm) will crack, which will in turn lead to the deterioration of the inhibition effect on concrete creep.
Thirdly, under the same length of fiber, the creep coefficient difference of PP FRAAS concrete under different stress–strength ratios is not large, and the creep coefficient difference between different fiber lengths is essentially the same.
Fourthly, both the CEB-FIP 2010 and GL2000 models are effective in predicting creep. In reference to the CEB-FIP 2010 model, it shows high accuracy, although the final value prediction is relatively small. Furthermore, while the early prediction value of the GL2000 model is large and conservative, the final value prediction appears to be more accurate.
Finally, the creep coefficient of the prediction model and the measured secant modulus of PP FRAAS concrete with different fiber lengths under different stress–strength ratios can solve the problem of creep prediction.
Author Contributions
Investigation, X.Z.; resources, X.Z.; data curation, X.Z.; writing—original draft preparation, X.Z.; writing—review and editing, Y.Y.; supervision, W.Z.; project administration, W.Z.; funding acquisition, W.Z. All authors have read and agreed to the published version of the manuscript.
Funding
This research was funded by Heilongjiang Touyan Innovation Team Program, grant number 2019-49.
Data Availability Statement
Not applicable.
Conflicts of Interest
The authors declare no conflict of interest.
References
- Andrew, R.M. Global CO2 emissions from cement production. Earth Syst. Sci. Data 2018, 10, 195–217. [Google Scholar] [CrossRef] [Green Version]
- Jiao, Z.; Wang, Y.; Zheng, W.; Huang, W. Effect of dosage of sodium carbonate on the strength and drying shrinkage of sodium hydroxide based alkali-activated slag paste. Constr. Build. Mater. 2018, 179, 11–24. [Google Scholar] [CrossRef]
- Purdon, A.O. The action of alkalis on blast-furnace. Slag 1940. Purdon, A. O., The action of alkalis on blast-furnace slag. J. Soc. Chem. Ind. 1940, 59, 191–202. [Google Scholar]
- Fernández-Jiménez, A.; Palomo, J.G.; Puertas, F. Alkali-activated slag mortars: Mechanical strength behaviour. Cem. Concr. Res. 1999, 29, 1313–1321. [Google Scholar] [CrossRef]
- Gebregziabiher, B.S.; Thomas, R.J.; Peethamparan, S. Temperature and activator effect on early-age reaction kinetics of alkali-activated slag binders. Constr. Build. Mater. 2016, 113, 783–793. [Google Scholar] [CrossRef] [Green Version]
- Bakharev, T.; Sanjayan, J.G.; Cheng, Y.B. Sulfate attack on alkali-activated slag concrete. Cem. Concr. Res. 2002, 32, 211–216. [Google Scholar] [CrossRef]
- Thomas, R.J.; Ariyachandra, E.; Lezama, D.; Peethamparan, S. Comparison of chloride permeability methods for Alkali-Activated concrete. Constr. Build. Mater. 2018, 165, 104–111. [Google Scholar] [CrossRef]
- Estokova, A.; Smolakova, M.; Luptakova, A. Calcium Extraction from Blast-Furnace-Slag-Based Mortars in Sulphate Bacterial Medium. Buildings 2018, 8, 9. [Google Scholar] [CrossRef] [Green Version]
- Strigáč, J.; Števulová, N.; Mikušinec, J.; Varečka, L.; Hudecová, D. Antimicrobial Efficiency of Metallurgical Slags for Application in Building Materials and Products. Buildings 2018, 8, 33. [Google Scholar] [CrossRef] [Green Version]
- Cai, L.; Wang, H.; Fu, Y. Freeze–thaw resistance of alkali–slag concrete based on response surface methodology. Constr. Build. Mater. 2013, 49, 70–76. [Google Scholar] [CrossRef]
- Fu, Y.; Cai, L.; Wu, Y. Freeze–thaw cycle test and damage mechanics models of alkali-activated slag concrete. Constr. Build. Mater. 2011, 25, 3144–3148. [Google Scholar] [CrossRef]
- Collins, F.G.; Sanjayan, J.G. Workability and mechanical properties of alkali activated slag concrete. Cem. Concr. Res. 1999, 29, 455–458. [Google Scholar] [CrossRef]
- Zhou, X.; Wang, Y.; Zheng, W.; Chen, P.; Zeng, Y. Effect of Stress–Strength Ratio on Creep Property of Sodium Silicate–Based Alkali-Activated Slag Concrete. Appl. Sci. 2019, 9, 3643. [Google Scholar] [CrossRef] [Green Version]
- Adhikary, S.K.; Rudzionis, Z.; Balakrishnan, A.; Jayakumar, V. Investigation on the Mechanical Properties and Post-Cracking Behavior of Polyolefin Fiber Reinforced Concrete. Fibers 2019, 7, 8. [Google Scholar] [CrossRef] [Green Version]
- Adhikary, S.K.; Rudzionis, Z. Behavior of Concrete under the Addition of High Volume of Polyolefin Macro Fiber and Fly Ash. Fibers 2018, 6, 38. [Google Scholar] [CrossRef] [Green Version]
- Rashad, A.M. Effect of steel fibers on geopolymer properties–The best synopsis for civil engineer. Constr. Build. Mater. 2020, 246, 118534. [Google Scholar] [CrossRef]
- El-Hassan, H.; Hussein, A.; Medljy, J.; El-Maaddawy, T. Performance of Steel Fiber-Reinforced Alkali-Activated Slag-Fly Ash Blended Concrete Incorporating Recycled Concrete Aggregates and Dune Sand. Buildings 2021, 11, 327. [Google Scholar] [CrossRef]
- Pujadas, P.; Blanco, A.; Cavalaro, S.; Fuente, A.; Aguado, A. The need to consider flexural post-cracking creep behavior of macro-synthetic fiber reinforced concrete. Constr. Build. Mater. 2017, 149, 790–800. [Google Scholar] [CrossRef]
- Pujadas, P.; Blanco, A.; Cavalaro, S.; Fuente, A.; Aguado, A. Flexural post-cracking creep behaviour of macro-synthetic and steel fiber reinforced concrete. In Creep Behaviour in Cracked Sections of Fibre Reinforced Concrete; Springer: Dordrecht, The Netherlands, 2017. [Google Scholar]
- Chern, J.-C.; Young, C.-H. Compressive creep and shrinkage of steel fibre reinforced concrete. Int. J. Cem. Compos. Lightweight Concr. 1989, 11, 205–214. [Google Scholar] [CrossRef]
- Zhang, J. Modeling of the influence of fibers on creep of fiber reinforced cementitious composite. Compos. Sci. Technol. 2003, 63, 1877–1884. [Google Scholar] [CrossRef]
- Haddad, R.H.; Smadi, M.M. Role of fibers in controlling unrestrained expansion and arresting cracking in Portland cement concrete undergoing alkali–silica reaction. Cem. Concr. Res. 2004, 34, 103–108. [Google Scholar] [CrossRef]
- Wang, S.D.; Scrivener, K.L.; Pratt, P.L. Factors affecting the strength of alkali-activated slag. Cem. Concr. Res. 1994, 24, 1033–1043. [Google Scholar] [CrossRef]
- Aydın, S.; Baradan, B. Effect of activator type and content on properties of alkali-activated slag mortars. Compos. Part B Eng. 2014, 57, 166–172. [Google Scholar] [CrossRef]
- GB/T 50081-2002; Standard for Test Method of Mechanical Properties on Ordinary Concrete. Ministry of Construction of the People’s Republic of China: Beijing, China, 2002.
- Zhou, X.; Zeng, Y.; Chen, P.; Jiao, Z.; Zheng, W. Mechanical properties of basalt and polypropylene fibre-reinforced alkali-activated slag concrete. Constr. Build. Mater. 2020, 269, 121284. [Google Scholar] [CrossRef]
- GB/T 50082-2009; Standard for Test Methods of Long-Term Performance and Durability of Ordinary Concrete. The State Bureau of Quality and Technical Supervision: Beijing, China, 2009.
- Zhou, X.Y.; Chen, P.; Jiao, Z.Z.; Zeng, Y.S.; Zheng, W.Z. Effect of fibre dosage and stress-strength ratio on creep of polypropylene fibre-reinforced alkali-activated slag concrete. Constr. Build. Mater. 2021, 269, 121284. [Google Scholar] [CrossRef]
- Pang, C.; Zheng, W.; Ying, W.; Wei, C. Analysis and Modelling of Shrinkage and Creep of Reactive Powder Concrete. Appl. Sci. 2018, 8, 732. [Google Scholar]
- Betonbau, International Federation for Structural Concrete. Fib Model Code for Concrete Structures 2010; Ernst & Sohn: Lausanne, Switzerland, 2013. [Google Scholar]
- Juhász, K.P.; Kis, V. The effect of the length of macro synthetic fibres on their performance in concrete. IOP Conf. Ser. Mater. Sci. Eng. 2017, 246, 012027. [Google Scholar] [CrossRef] [Green Version]
- Wang, X.C.; Zhang, J.P.; Liu, H.T. Experimental research on mechanical behavior of carbon fiber reinforced concrete under different length of carbon fiber. In Biotechnology, Chemical and Materials Engineering Ii, Pts 1 and 2; Sung, W.P., Zhang, C.Z., Chen, R., Eds.; Trans Tech Publications Ltd.: Bach SZ, Switzerland, 2013; Volume 641–642, p. 398. [Google Scholar]
- Andreikiv, O.E.; Dolins’ka, I.Y.; Raiter, O.K. Evaluation of the Durability of the Fiber-Reinforced Concrete Beam Under Long-Term Pure Bending and Local Creep. Strength Mater. 2021, 53, 227–233. [Google Scholar] [CrossRef]
- Lima, V.N.; Cardoso, D.C.T.; Silva, F.d.A. Creep Mechanisms in Precracked Polypropylene and Steel Fiber–Reinforced Concrete. J. Mater. Civ. Eng. 2021, 33, 04021187. [Google Scholar] [CrossRef]
- Gardner, N.J.; Lockman, M.J. Design Provisions for Drying Shrinkage and Creep of Normal Strength Concrete. Mater. J. 2001, 98, 159–167. [Google Scholar]
- ACI Committee 209, ACI PRC-209.2-08. Guide For Modeling And Calculating Shrinkage And Creep In Hardened Concrete; American Concrete Institute: Indianapolis, MI, USA, 2008. [Google Scholar]
- Bazant, Z.P.; Baweja, S. Creep and shrinkage prediction model for analysis and design of concrete structures—model B 3. Mater. Struct. 1995, 28, 357–365. [Google Scholar]
| Publisher’s Note: MDPI stays neutral with regard to jurisdictional claims in published maps and institutional affiliations. |
© 2022 by the authors. Licensee MDPI, Basel, Switzerland. This article is an open access article distributed under the terms and conditions of the Creative Commons Attribution (CC BY) license (https://creativecommons.org/licenses/by/4.0/).


