Article

Effect of Architectural Building Design Parameters on Thermal Comfort and Energy Consumption in Higher Education Buildings

by
Salah Alghamdi
1,
Waiching Tang
1,*,
Sittimont Kanjanabootra
1 and
Dariusz Alterman
2
1
School of Architecture and Built Environment, The University of Newcastle, University Drive, Callaghan, NSW 2308, Australia
2
School of Science, Technology and Engineering, The University of the Sunshine Coast, 90 Sippy Downs Drive, Sippy Downs, QLD 4556, Australia
*
Author to whom correspondence should be addressed.
Submission received: 10 February 2022 / Revised: 25 February 2022 / Accepted: 1 March 2022 / Published: 9 March 2022
(This article belongs to the Special Issue Renewable Energy in Buildings)

Abstract

:
It has been challenging for designers to identify the appropriate design parameters that would reduce building energy consumption while achieving thermal comfort for building occupants. This study aims to determine the most important architectural building design parameters (ABDPs) that can increase thermal comfort and reduce energy use in educational buildings. The effect of 15 ABDPs in an Australian educational lecture theatre and their variabilities on energy consumption and students’ thermal comfort for each parameter were analysed using Monte Carlo (MC) techniques. Two thousand simulations for every input parameter were performed based on the selected distribution using the Latin hypercube sampling (LHS) technique. Sensitivity analyses (SA) and uncertainty analyses (UA) were used to assess the most important ABDPs in terms of thermal discomfort hours and energy consumption. The study found that the ABDPs, such as cooling set-point temperatures and roof construction, significantly reduce the operative temperature by up to 14.2% and 20.0%, respectively. Consequently, these reductions could significantly shorten the thermal discomfort hours, thereby reducing energy consumption by 43.7% and 41.0%, respectively. The findings of this study enable building designers to identify which ABDPs have a substantial impact on thermal comfort and energy consumption.

1. Introduction

Energy use for heating, cooling and ventilation in buildings accounts for more than one-third of global energy consumption and around 40% of total CO2 emissions [1]. The energy consumption per square metre for buildings needs to be reduced by around 30% by 2030 (compared to 2015) in order for the global climate ambitions set forth in the Paris Agreement to be achieved [2]. According to previous studies [3,4,5], improvement in building performance has a key role to play in reducing energy consumption. It is important that buildings are designed to provide high performance in various scenarios, including a wide variability of thermal occupant behaviour [6]. Building performance can be expressed by different performance indexes, such as energy consumption, occupant satisfaction and indoor environmental quality (IEQ) [7,8]. Providing a comfortable and healthy indoor environment is one of the core functions of building energy systems [9,10]. Improving building performance can not only achieve high energy efficiency but can also improve the level of occupant thermal satisfaction.
The performance of a building can be fundamentally influenced by the outdoor environment [11]. The effects of weather conditions on design decisions have been reported in the study by Attia, Hamdy [12]. General building performance, including energy consumption and thermal comfort, is impacted by architectural and technical solutions. The thermo-physical properties of a building envelope, such as thermal conductivity and heat capacity, are vital for indoor thermal comfort and energy consumption performance [13]. Architectural building design parameters (ABDPs) can be specified by designers and may include restrictions on the indoor air quality, rate of ventilation, material properties, building shapes, building orientation, etc. [14]. In the architectural building design parameters (ABDPs) approach, it is difficult to enhance these properties through the schematic design stage due to fluctuations in the outdoor environment, which would result in high indoor temperatures, sometimes exceeding the upper limit of 26 °C according to ASHRAE Standard 55 [15]. Identifying which parameters are most significant for energy consumption and thermal comfort is vital for improving building performance in the design process based on the climatic conditions [16].
Different countries’ building sectors have different policies for reducing energy consumption and negative environmental impacts based on the variety of climate zones and building types [17]. With regard to climate change, buildings must be resilient, adaptable, flexible and sustainable in order to increase the level of thermal comfort for occupants and reduce energy consumption [18,19]. In recent years, many studies have argued that the high levels of thermal dissatisfaction felt by students in educational buildings and student thermal comfort are not being precisely reflected in the requirements of the related thermal comfort standards [20,21]. The absence of any standard or reference document relevant to the design of suitable classrooms contributes to the current situation [22]. Some studies have suggested that the opportunity to control an indoor environment affects the occupants’ thermal perceptions, making them more receptive to the educational environment in terms of thermal comfort [23,24]. Some studies related to thermal comfort have also looked at age and gender [25,26], indoor air quality [27], ventilation strategy [28,29], clothing adjustment effect [30], changes to activity level [31], set-point temperatures and sun shading system [32,33], envelope design [11,34] and academic performance [35]. Although these studies have highlighted the factors contributing to thermal comfort in buildings, the energy consumption aspect has not been taken into consideration. Other studies have focused on the simulation results of the passive house concept in Mediterranean country climates [36] and building envelope parameters managed by building automation control systems [37] in relation to thermal comfort and energy performance. With the high impact of global warming on buildings, there are insufficient studies on the effects of ABDPs on thermal comfort and energy consumption in educational buildings [38,39].
Across Australia, around 9500 schools and many tertiary institutions have been built to meet the minimum building code requirements of the Building Code of Australia (BCA). Educational facilities are not necessarily designed to provide comfortable, productive or healthy work environments for students and teachers [40]. The New South Wales (NSW) Department of Education currently has in excess of 2200 schools across the state [41]. Because of the large number of educational buildings around Australia, the educational building sector is the second-highest energy consumer after public buildings (including galleries, museums, libraries and law courts) [42]. In addition, around 50% of the energy consumed by heating, ventilation and air conditioning (HVAC) systems occurs on university campuses in Australia [42]. On average, students spend around 25% of their time at school [43]. However, the thermal comfort of students is usually low because they have limited options for adaption of the indoor thermal environment as their classroom activities are usually restricted [44]. As educational buildings have specific functional characteristics compared to other buildings [21], more attention and focus should be placed on the energy consumption and thermal comfort in these buildings.
Based on the above-mentioned problem statement, the main research question to be answered by this paper is: what are the most important ABDPs that can increase thermal comfort and reduce energy use in higher education buildings in New South Wales (climate zone 5), Australia? Identifying the effect of ABDPs on both energy consumption and thermal comfort in the design stage is an important step to reduce the heating/cooling energy loads and increase the level of students’ thermal comfort in educational buildings.
In the current study, building energy simulation (BES) is used to explore the effect of some ABDPs on energy consumption and thermal comfort. BES is the virtual simulation of a building using a computer-based mathematical model created on the basis of fundamental physical principles and energy balance equations [45]. BES tools such as EnergyPlus, Designbuilder, eQuest and TRNSYS can provide designers with numerical data to compare and evaluate different integrated design options to satisfy the design targets [46,47]. Yıldız and Arsan [16] simulated the effect of nine building parameters—the building shape, window-to-external-wall area, envelope colour, set-point temperature, thermo-physical properties of building materials, thermal insulation, natural ventilation, air infiltration and zone height—on heating and cooling energy loads for apartment buildings in hot–humid climates in Turkey by using EnergyPlus. Mirrahimi, Mohamed [11] reviewed the results of other studies that focus on the effect of building envelope parameters, such as climatic conditions, form, width, length and height, external walls, roofs, glazing area and natural ventilation, as well as external shading devices, on the thermal comfort and energy saving for high-rise buildings in the hot–humid climate of Malaysia. Buratti, Moretti [48] present an evaluation of window type and building orientation in terms of occupant thermal satisfaction indexes (such as predicted mean vote (PMV) and predicted percentage of dissatisfied (PPD)) and energy consumption in non-residential buildings in Perugia by using the TRNSYS and EnergyPlus.
Based on the literature review, 15 ABDPs, including window to wall ratio, cooling set-point temperature, heating set-point temperature, building rotation, external wall construction, roof construction, glazing type, local shading type, occupancy density, mechanical ventilation rate per area, thermal mass, roof window openings, building location, infiltration and crack level (airtightness), were identified and their effects on occupant thermal comfort and energy consumption were studied using the BES tools. These parameters were chosen because they have been studied in different applications separately with different climate zones, building types, building occupancy types and outputs (thermal comfort and/or energy consumption) [11,33,49,50,51,52]. The present study was, therefore, designed to present a more comprehensive assessment of ABDPs to identify the parameters of most concern and to show their realistic effects in NSW. For this reason, these parameters have been analysed in one study with the assumption that they influence energy consumption and thermal comfort [51,53].

2. Research Methods

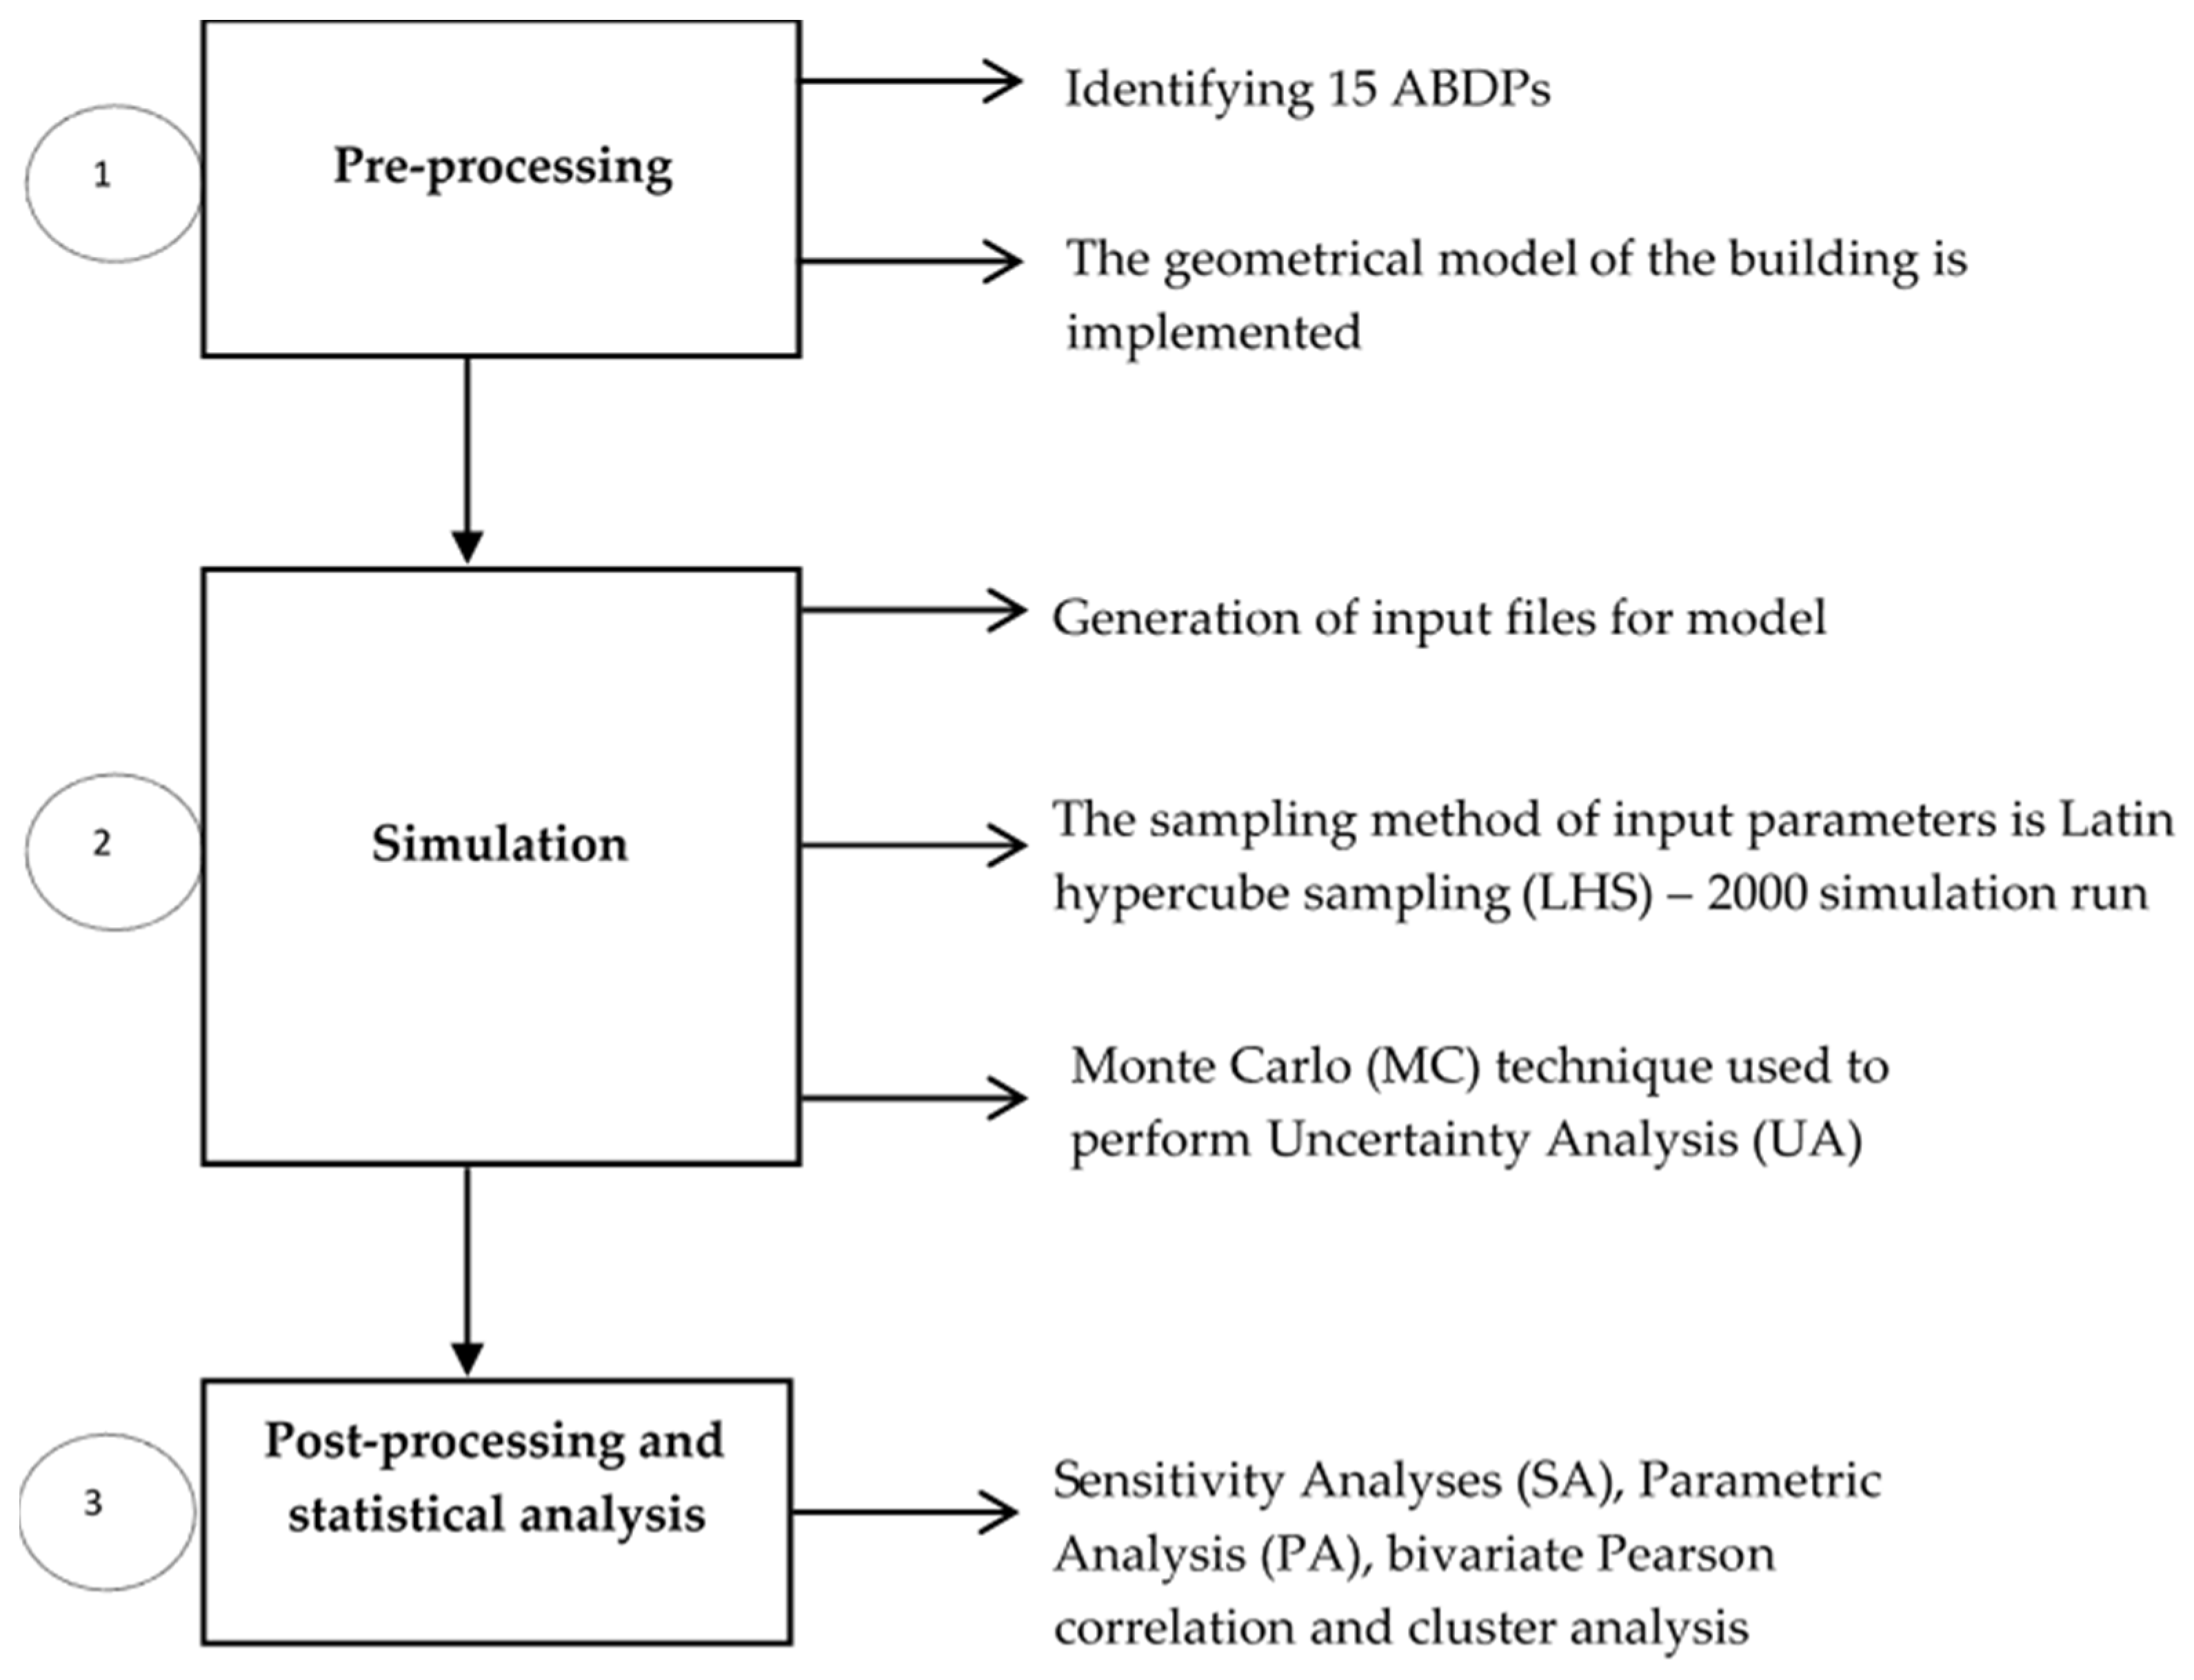
2.1. Simulation Process Using Monte Carlo (MC) Technique

Monte Carlo (MC) techniques are often applied when implementing uncertainty analyses (UA) and sensitivity analyses (SA) [54,55,56]. The use of UA and SA in this study aims to support the design process by showing the effect of different parameters on the design outcome in terms of uncertainty (normal distribution and range) and sensitivity (order of the most influential parameters). The effective combination of UA and SA in BES is a vital part of many ongoing research activities in building design [45,57,58,59,60,61,62,63,64,65]. This study applied the MC technique in BES to find all possible values of ABDP functions in the correct statistical combinations. The use of DesignBuilder is very common nowadays for designing any proposed or existing buildings to evaluate the energy consumption and thermal comfort through different design options [66,67,68]. In this study, DesignBuilder with a user-friendly interface was used.
The type of data collected plays a critical role in determining the best statistical method to apply [69]. Many studies have investigated how different design strategies can be integrated into the design process for different aspects of building performance using parametric analysis (PA) [70,71,72]. PA can be very useful as part of the design process to understand how building performance is affected by variations in building configuration and operation [73]. Cluster analysis is a class of methods used to categorise variables into relative groups called clusters [74]. Cluster analyses have been widely used in numerous research activities, including pattern recognition, data analysis and image processing [75]. To cluster different variables, a technique named k-means clustering was applied, which is based on central point selection and the calculation of Euclidean distance [75]. This technique is applied to deal efficiently with large datasets, is efficient at dealing with both continuous and categorical variables and has advantages that assist in determining optimal cluster numbers [76]. Figure 1 illustrates the process for this study.
The research methodology, as shown in Figure 1, was divided into three sequential steps. First, we conducted pre-processing, considering input parameters of 15 ABDPs, which were selected from the literature review [11,16,33,49,50,51,56]. Then, the DesignBuilder simulation, which contains all the necessary information for the simulation, e.g., the construction materials properties, services systems, weather data, etc., was used. In the following step, two thousand simulation runs were applied using the Latin hypercube sampling (LHS) method. The sample size decides the computational cost of the analysis, as it is equal to the required number of simulation runs [57]. Consider an iterative MC technique with no upper limit on the number of iterations to be performed [58]. As the iterations proceed, the damage estimates accumulate into a sample of increasing size. As more iterations occur, the sample approaches the population. A greater number of simulation runs reduces the discrepancy between the simulation model results and the actual system performance [59]. Building energy consumption (cooling/heating load) and students’ thermal discomfort hours were considered as simulation outputs. Subsequently, the output from the 2000 simulation runs was compared to the sampled input parameters to identify the influence of each input on the output. The output analysis of the UA and SA was conducted with DesignBuilder.
The next stage, as shown in Figure 1, was the post-processing and statistical analysis step, including SA, PA, bivariate Pearson correlation and cluster analysis. PA allows us to see how output performance, like energy consumption and thermal comfort, varies as the key elements of the building design parameters vary. In this study, PA was applied to investigate the effect of the most significant ABDPs (input parameters), which were based on SA, the indoor thermal environment, building energy consumption, students’ thermal comfort (output parameters) and if the effect is linear or non-linear. The bivariate Pearson correlation method has been applied in this study to find if there is a relationship between building energy consumption and students’ thermal comfort. The bivariate Pearson’s correlation provides a sample correlation coefficient, r, which calculates the strength and direction of linear relationships between two continuous variables [77]. For the Pearson r correlation, both variables (building energy consumption and students’ thermal comfort) should be normally distributed [73]. Finding a relationship between the two outputs helps us understand their mechanism and assists designers to select appropriate ABDPs. Some data are similar to each other; hence, we need to organise them into clusters, with similar observations within each cluster. The cluster analysis was used to classify the ABDPs into different groups based on their effect on both building energy consumption and students’ thermal comfort. Clusters of ABDPs were identified among 2000 scenarios using the k-means clustering algorithm. Bivariate Pearson correlation and cluster analysis were completed using the statistical package IBM SPSS Statistics (Version 24.0).

2.2. Prototype Description of the Application of BES Model to Building Design Example and Climate

A single-storey education building at the University of Newcastle, Australia, was selected as a reference building and the base case model for the simulation process. The building was considered a generic example of a structure in climate zone 5 under the Australian Building Codes Board (ABCB) classification and exists in a warm climate, with architectural features representative of educational buildings and typical building materials and construction types for walls, floors and windows. The building has a square shape (10.5 m long × 10.5 m wide × 3.5 m height), with a total volume of about 386 m3, see Figure 2.
The basic geographic and climatic conditions of Newcastle, Australia, are as follows:
  • −32.80 latitude and 151.83 longitude.
  • Altitude of 33 m above sea level.
  • Mean annual minimum and maximum temperatures of 14.3 °C and 21.8 °C.
  • Annual mean global radiation of 4.8 kWh/m2.
DesignBuilder (version 6.0.1.019) was used to simulate different ABDPs. An EnergyPlus Weather (EPW) file, including the climatic conditions of Newcastle and Sydney, was used for the weather data in the indoor thermal calculations. In this study, EnergyPlus software was used as the simulation engine. A reference model was created to represent the educational spaces for mechanical ventilation (MV) mode and realistic engineering practices at the University of Newcastle. It has also helped to simplify the assumptions that will be made during the simulation process, as shown below in Figure 3. Hence, a comprehensive energy simulation was applied to analyse the performance of the different ABDPs of educational spaces in a hot summer and cold winter environment to achieve an optimal level of thermal comfort as well as energy consumption.

2.3. Determination of Input and Output Variables

One of the main aspects controlling the indoor thermal environment in buildings is heat gain or loss through ABDPs, such as walls, windows and floors [78]. In turn, this indoor thermal environment determines the amount of energy needed for heating and cooling to maintain optimal thermal comfort levels. As aforesaid, 15 ABDPs identified from the literature review were selected as inputs, as shown in Table 1 and Table 2.
Previous studies refer to thermal discomfort hours to represent the evaluation of thermal comfort [79,80,81]. The thermal discomfort hours output was based on whether the humidity ratio and the operative temperature were within the region of the ASHRAE 55 Standard [82]. In this study, the energy consumption (cooling/heating load) and students’ thermal discomfort hours were assigned as output variables because they are significant and common indicators of the energy performance and level of student thermal satisfaction in educational buildings [83,84].

2.4. Sampling and Assignment of Probability Density Functions

Two thousand samples for every input parameter were applied based on the selected distribution by using the Latin hypercube sampling (LHS) technique to give an appropriate accuracy in the SA and UA [85]. In this method, a sample size of 10 times the number of parameters will give a reliable estimate of the population mean. LHS was used because it is a highly efficient sampling method and is commonly used [16]. Table 1 and Table 2 summarise the overall statistical analysis and distribution profiles of the actual input values used for normal and discrete distribution characteristics, respectively, in the simulation runs.
Table 1. Statistical output and distribution profiles for normal distribution characteristics of input parameters.
#Input Parameter
(Probability Distribution: Normal)
Input Units Summary Statistics
MinMaxMeanMedianQ1 * (25%)Q3 * (75%)SD *
1Window to wall ratio [11,16,51,56]%5754040334710
2Cooling set-point temperature [16,51]°C1928252524262
3Heating set-point temperature [16,51]°C1723202019211
4Building orientation [11,56]Angle (°θ )0 (N) *31515713545225103
5Occupancy density [86]people/m20.10.50.30.30.30.30.05
6Mech. Vent. rate per area [87]l/s/m22855461
7Thermal mass [16,51]-−11−0.0010−110.8
8Roof window opens ratio [88,89]%31710109112
9Infiltration [16,86]Ac/h0.42110.910.2
* Key: Q1, first quartile; Q3, third quartile; SD, standard deviation.
A quartile is a form of quantile in statistics that splits the number of data points into four quarters of roughly equal size in order to measure the variability of the data around the median [90]. The first quartile (Q1) is defined as the number in the midway of the dataset’s minimum and median values, with 25% of the data falling below this point [91]. The third quartile (Q3) is the midpoint between the dataset’s median and maximum value, with 75% of the data falling below this point [91,92]. Meanwhile, the standard deviation (SD) is a statistic that calculates the square root of the variance and represents the dispersion of a dataset relative to its mean [93]. Q1, Q2 and SD values are shown in Table 1.
Table 2. Statistical output and distribution profiles for discrete distribution characteristics of input parameters.
#Input Parameter
(Probability Distribution: Discrete)
Input Details
10External wall construction [11,16,56,88,91]Description Frequency
I.
Brickwork single leaf construction light plaster
U-value = 1.949 *371
R-value = 0.513 *
II.
Brick air l/w concrete block & l/w plaster
U-value = 0.950370
R-value = 1.053
III.
Brick mineral insulation thermolite block & l/w plaster
U-value = 0.403367
R-value = 2.482
IV.
Brick/block wall (insulated to 1985 regs)
U-value = 0.351372
R-value = 2.846
V.
Uninsulated lightweight wall (metal clad)
U-value = 2.767366
R-value = 0.361
11Roof construction [11,56,88,91]
I.
Flat roof—25 mm stone chippings on 19 mm asphalt on 40 mm screed
U-value = 3.439311
R-value = 0.291
II.
Flat roof—19 mm asphalt on 13 mm fibreboard
U-value = 2.605301
R-value = 0.384
III.
Flat roof—19 mm asphalt on 13 mm screed on 50 mm wood wool slab
U-value = 1.431308
R-value = 0.699
IV.
Flat roof—6 mm lightweight metallic cladding
U-value = 6.223308
R-value = 0.161
V.
Flat roof U-value = 0.25 W/m2K
U-value = 0.252310
R-value = 3.972
VI.
Green roof construction
U-value = 0.239308
R-value = 4.192
12Glazing type [11,16,56,88]
I.
Sgl Bronze 3 mm
U-value = 6.257362
SHGC = 0.713
II.
Sgl Ref-C-H Clr 6 mm
U-value = 5.302378
SHGC = 0.320
III.
Dbl LoE (e3 = 0.1) Clr 3 mm/13 mm Air
U-value = 2.708365
SHGC = 0.697
IV.
Dbl Bronze 3 mm/6 mm Air
U-value = 3.226373
SHGC = 0.619
V.
Dbl Clr 6 mm/13 mm Air
U-value = 1.798368
SHGC = 0.643
13Local shading type [11,86]0.5 m projection Louvre230
1.0 m projection Louvre235
1.5 m projection Louvre234
No shading222
0.5 m Overhang235
1.0 m Overhang231
1.5 m Overhang231
2.0 m Overhang228
14Location template [94,95]Newcastle923
Sydney923
15Crack template (airtightness) [96,97,98]Excellent364
Good373
Medium373
Poor366
Very poor372
* Units, U-value = W/m2K; R-value = m2K/W.
Assignment of a probability density function to each ABDP is found to be important for building energy performance. Estimates of the limits in the variation of ABDPs aim to determine the most appropriate value of the parameter within limits and to choose the most suitable probability density function. The range values of ABDPs are determined based on the possibilities in architectural practice identified through the literature review [16]. Distribution characteristics for each ABDP are based on the previous studies and/or practical application. The goal of the interval width used is to represent a wide range of intervals for the usage distribution and to increase the accuracy of the model during the analysis process [99]. The probability density function of some ABDPs is given as a normal distribution defined by its mean value and standard deviation (SD) [100], while for other ABDPs, a uniform distribution is defined by discrete values.

3. Results and Discussion

This study was based on two objective functions, energy consumption and thermal comfort, calculated using the ASHRAE Heat Balance equations for energy load calculations (kWh) and the ASHRAE Standard 55 Heat Balance model for thermal discomfort (hours). The SA, AU and PA for this study were performed using DesignBuilder.

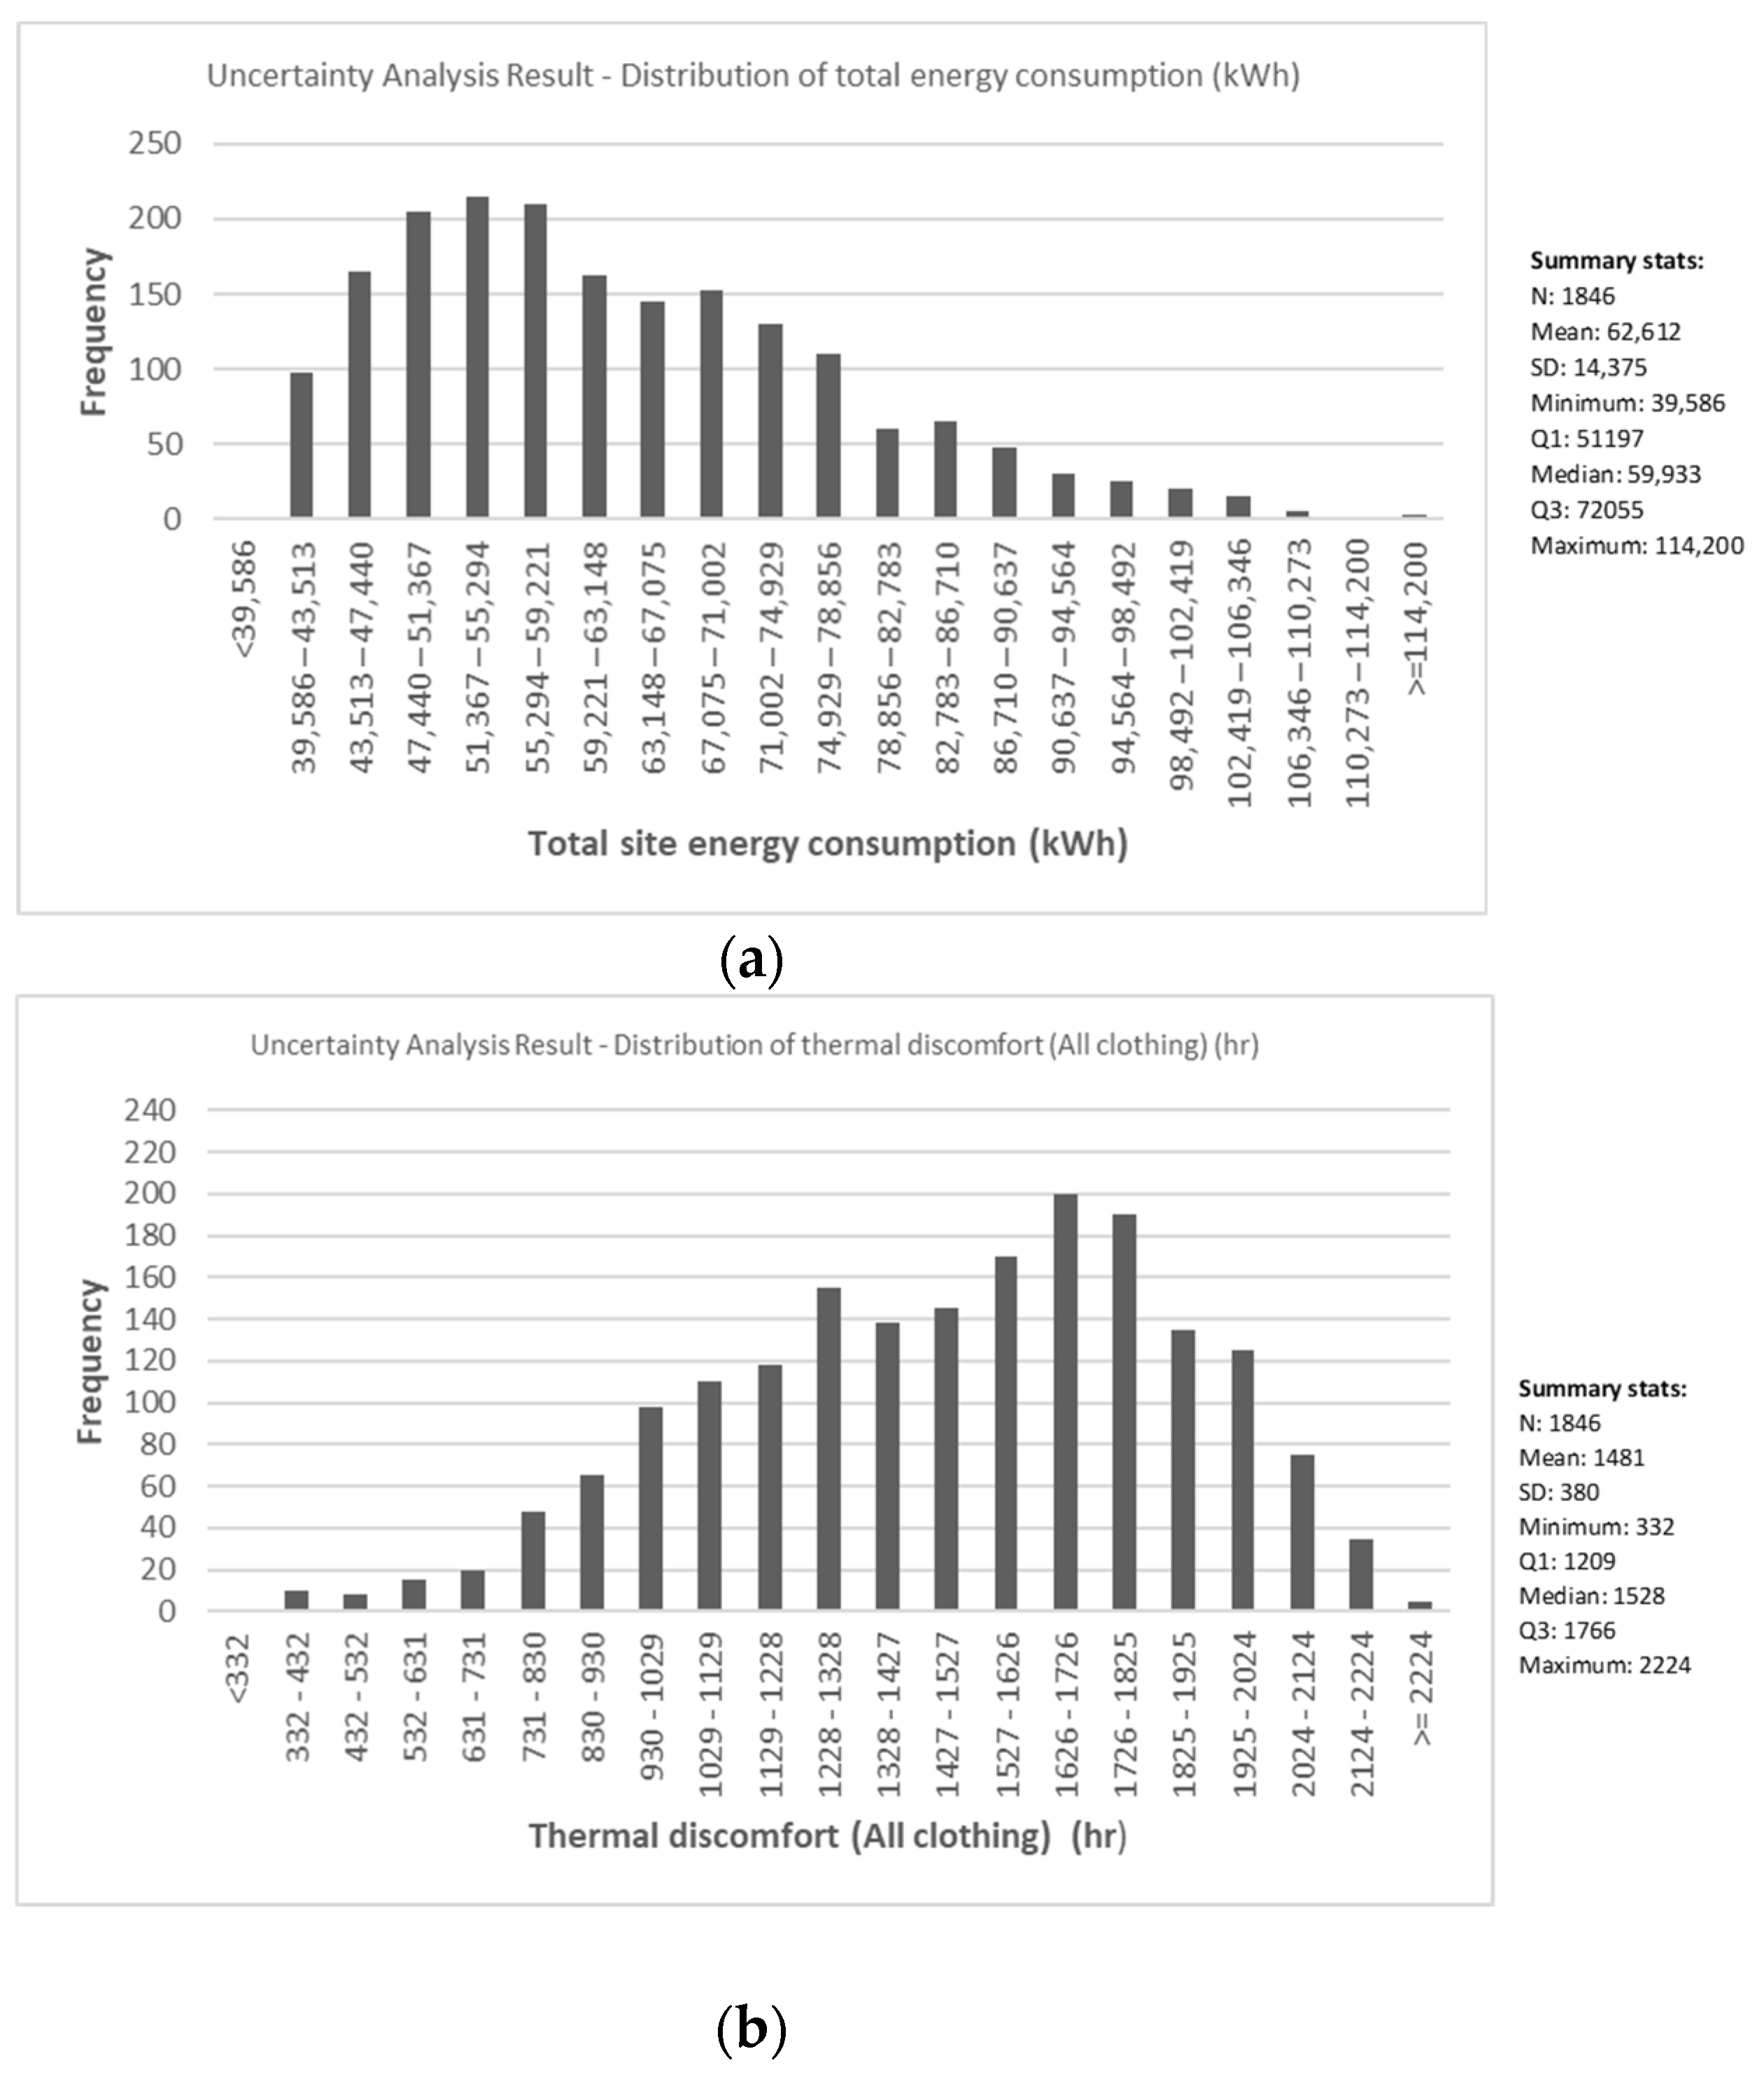
3.1. Uncertainty Analysis (UA)

Figure 4 presents the uncertainty analysis (UA) results of thermal discomfort hours and energy consumption for all the outputs. These figures show the range of possible annual heating and cooling energy loads and thermal discomfort hours, together with the frequency of each interval. Figure 4a shows that the range of energy consumption of around 220 scenarios among 2000 simulation runs for 15 ABDPs was between 51,367 kWh and 55,294 kWh. In Figure 4b, the range of thermal discomfort hours of around 100 scenarios among 2000 simulation runs of 15 ABDPs was between 1626 h and 1726 h. Uncertainties in thermal discomfort hours and energy consumption can be described as design variations in ABDPs that occur during the early design stage. This wide variation in the energy consumption and thermal discomfort hours range can be caused by a lack of knowledge on the part of the designer [101]. The consideration of design uncertainties could therefore develop and enable design decision support, particularly if supported by SA and PA to identify the effect of each architectural building design parameter and the amount of improvement on a UA graph.

3.2. Sensitivity Analysis (SA)

A regression method was used for this sensitivity analysis [102]. Regression analysis is a statistical method that approximates the relationships among input variables [103]. It helps to explain how the output value changes when any one of the input parameters is varied. Table 3 presents the sensitivity of each parameter based on the standardised regression coefficient (SRC). This value shows the relative sensitivity of the input parameters to the output value. Its absolute value ranks the input variables in order of sensitivity and shows whether the relationship to the output is direct or inverse. The SRC outputs the sensitivity of each input variable, thereby determining the most and least important parameters [104]. A positive SRC means that as the value of the building parameter increases, the value of the corresponding output simultaneously increases. A negative SRC indicates that changes in the inputs and outputs tend to go in opposite directions, while other regression outputs, like ‘p-value’, help to determine the level of confidence and reliability of the results.
The p-value reveals if the input variable has a statistically significant effect on the output. Some input variables have a p-value of more than 0.05, suggesting that there is a low level of confidence in their regression result values [105], such as location template and thermal mass. Table 3 ranks the ABDPs on their performance assessment based on p-values from high to low importance for their impact on student thermal discomfort and building energy consumption. In Table 3, numbers in bold italics show a highly statistically significant effect for p-values much less than 0.05.

3.2.1. Influential Factors on Energy Consumption for Each Output

Based on the output of SA in Table 3, energy consumption was most strongly influenced by the cooling set-point temperature; however, there was an inverse relationship, as shown in Figure 5a. Increasing the cooling set-point temperature led to a decrease in total site energy consumption. Total site energy consumption was also strongly influenced by flat roof construction and heating set-point temperature. Energy consumption was also moderately influenced by external wall construction, infiltration (ac/h), window to wall ratio and occupancy density. Crack template (building airtightness), roof window opens, thermal mass, building rotation, mechanical ventilation rate per area (l/s/m2), location template, local shading type and glazing type did not have a notable influence on total site energy consumption, and therefore, these inputs were ignored in further analysis of total site energy consumption for this model.

3.2.2. Influential Factors on Thermal Comfort for each Output

Based on the output of SA in Table 3, thermal discomfort was most strongly influenced by cooling set-point temperature. The input and output were directly related. According to Figure 5b, it can be seen that increasing the cooling set-point temperature led to an increase in thermal discomfort level. Thermal discomfort was also strongly influenced by flat roof construction and heating set-point temperature. Thermal discomfort was also moderately influenced by occupancy density, glazing type, mechanical ventilation rate per area (l/s/m2) and infiltration (ac/h). Crack template (building airtightness), external wall construction, building rotation, window to wall ratio, local shading type, thermal mass, location template and roof window did not have a notable influence on thermal comfort level and therefore, these inputs were ignored in further analysis of thermal comfort for this model.

3.3. The Effect of ABDPs on Indoor Thermal Environment

A parametric analysis (PA) has been used to examine the effect of a specific range for each ABDP, as shown in Table 1 and Table 2. The rate of change (ROC) is the percentage of variable change through a specific period [106]. ROC expresses the rate of difference between the minimum and maximum value and can be defined as a ratio between a change in one parameter compared to a corresponding change in another. This study presents the PA of the most important ABDPs—those that have a significant impact, based on SA, on both building energy consumption and student thermal comfort. It shows the annual ROC of those ABDPs on the indoor thermal environment, energy consumption and students’ thermal discomfort hours.

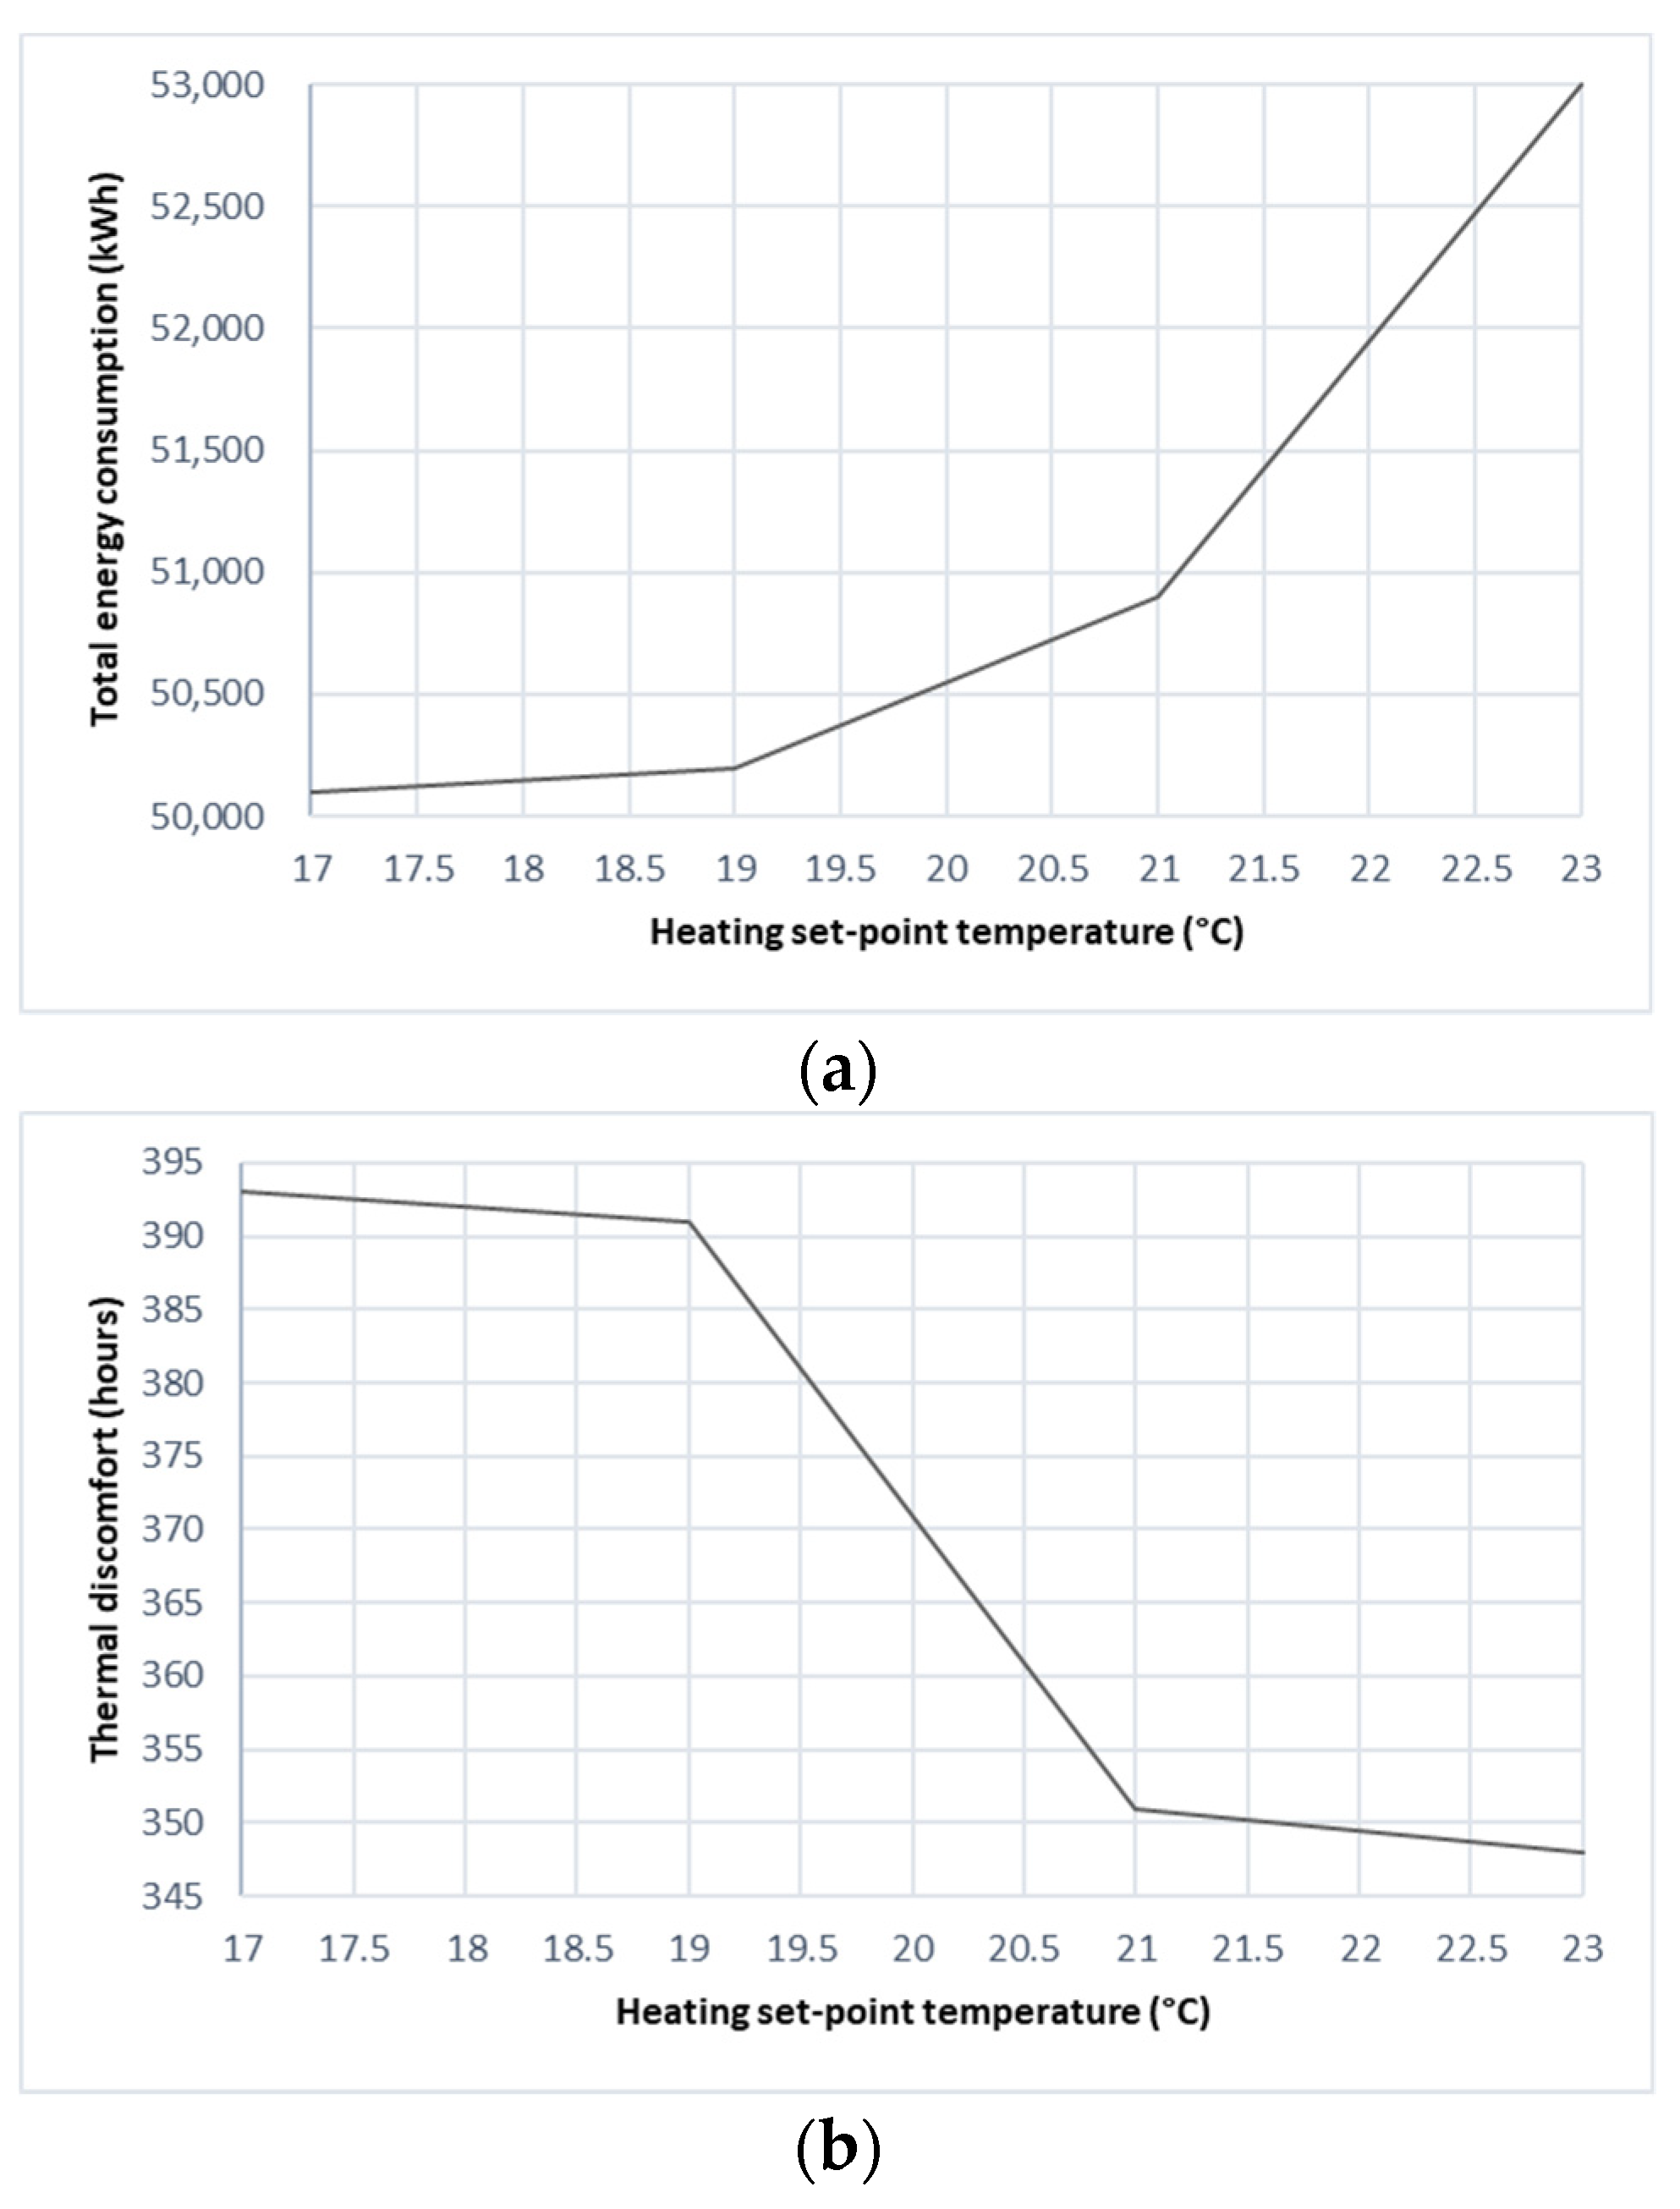
3.3.1. Effect of Cooling and Heating Set-Point Temperatures

The results of this study show the impact of cooling and heating set-point temperatures on building performance and students’ thermal satisfaction (p = 0.0000). Based on PA results, increases in cooling set-point temperature had a positive influence on students’ thermal discomfort (SRC = 0.5705) and a negative influence on building energy consumption (SRC = −0.6926), as shown in Figure 5. In contrast, increases in heating set-point temperature had a positive influence on building energy consumption (SRC = 0.1852) and a negative influence on students’ thermal discomfort (SRC = −0.3389), as shown in Figure 6. The results show the matching of the effects of those parameters on energy savings and thermal comfort compared with previous studies [107,108,109].
Based on PA, the cooling set-point temperature reduced the operative temperature by 14.2% when increasing the cooling set-point temperature from 22 °C to 28 °C. This decrease in the operative temperature could significantly reduce the thermal discomfort hours by 6.0 times, thereby reducing energy consumption by 43.7%. This further validates the findings of [107,108], which indicate that set-point temperatures have a direct effect on the indoor thermal environment and the energy consumption of a building (27% total HVAC energy savings were achieved [108]). The reason for the difference in the percentage of energy savings was because the thermostat set-point range in this study was wider than in previous studies.

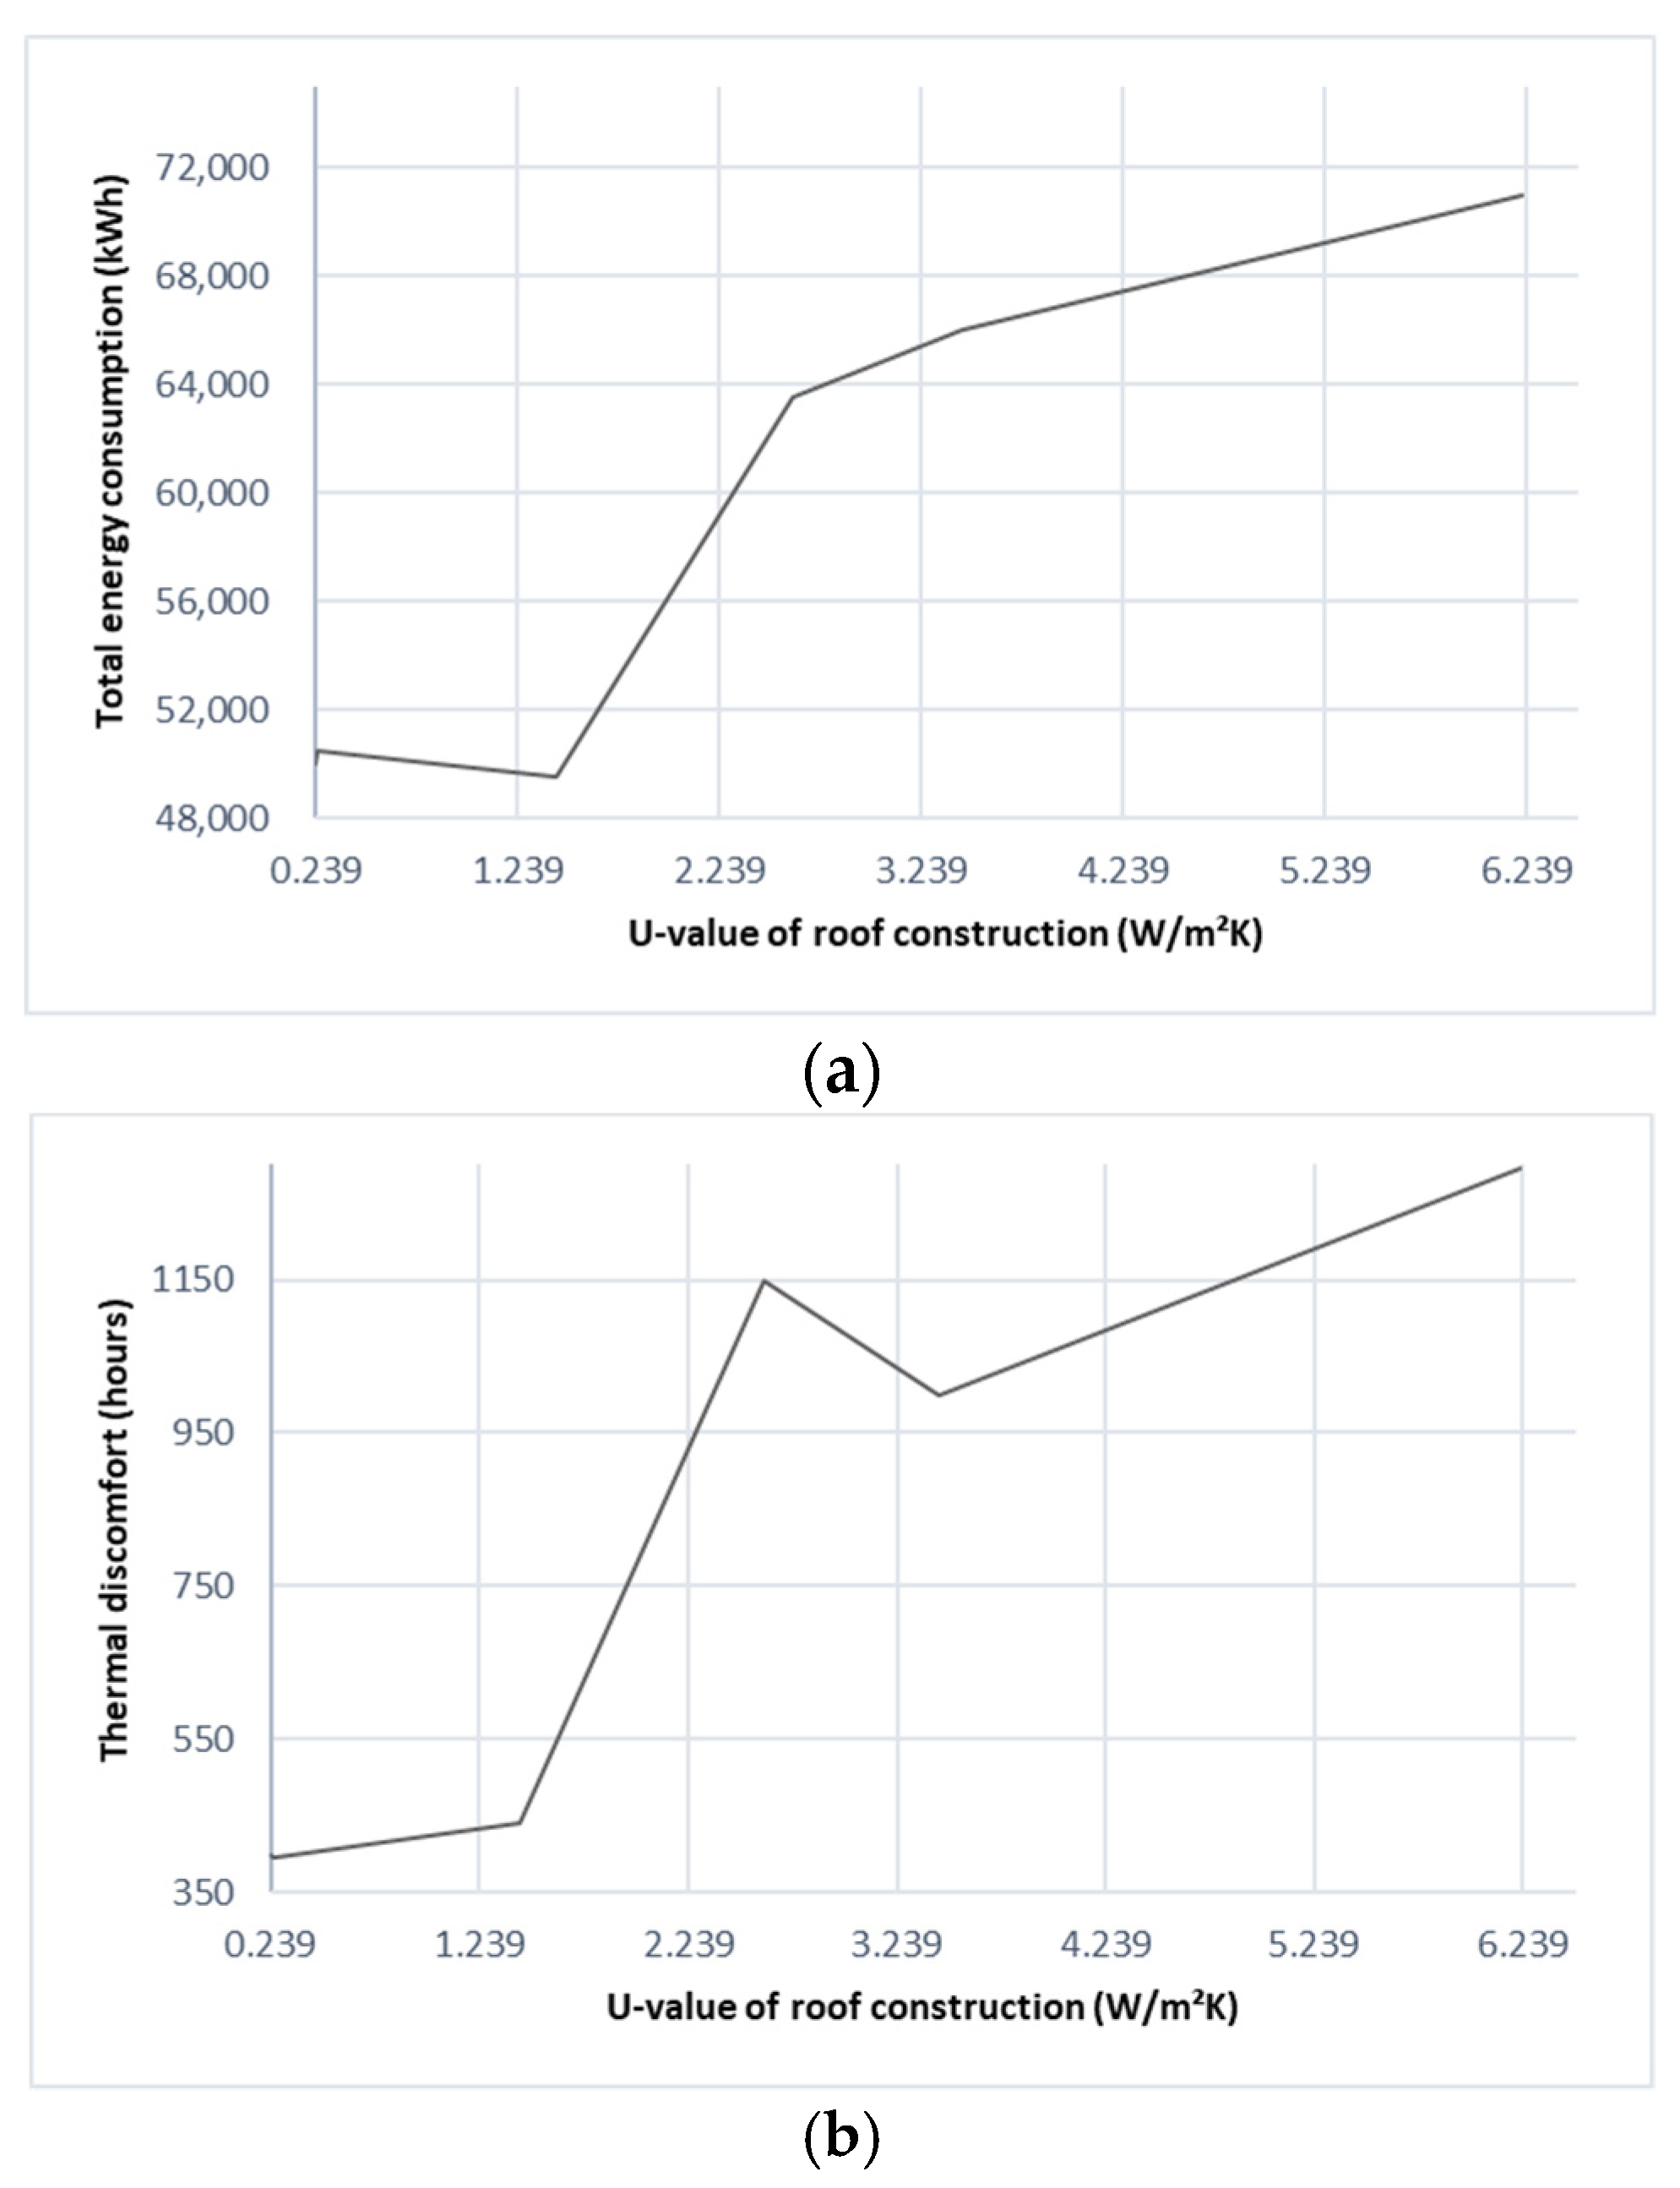
3.3.2. Effect of Roof and Wall Construction and Thermal Mass

The results showed the impact of roof construction on building performance and students’ thermal satisfaction (p = 0.0000). The roof construction in this study was considered an important parameter based on SA, mainly due to two reasons. Firstly, roofs determine the indoor thermal conditions of buildings, thus influencing the conditions for occupants and energy consumption because the roof directly faces solar radiation [11]. In countries with a high incidence of solar radiation, roof construction is even more important. Secondly, in buildings with large roof areas, roofs account for large amounts of heat gain/loss [109]. The U-value of the external wall construction parameter had a positive influence on both students’ thermal discomfort (SRC = 0.0259) and building energy consumption (SRC = 0.0553), as shown in Figure 7. Furthermore, Figure 8 shows the effect of the U-value of roof construction on students’ thermal discomfort and building energy consumption. Based on PA, roof construction reduced the operative temperature 20.0% by decreasing the U-value of 6.223 W/m2K to 0.239 W/m2K. This decrease in the operative temperature could significantly reduce the thermal discomfort hours 3.25 times, thereby reducing energy consumption by 41.0%. The results of [110] show that roof construction types are the key parameter in decreasing or increasing the risk of thermal discomfort hours in tropical climates. Compared to different construction methods and materials, they provided up to 15 times better indoor thermal conditions by decreasing the number of thermal discomfort hours based on the indoor operative temperature.
In contrast, thermal mass had a negative influence on both students’ thermal discomfort (SRC = −0.0061) and building energy consumption (SRC = −0.0157). The effect of the U-value of external wall construction on building energy consumption (p = 0.0001) was more than on students’ thermal discomfort (p = 0.0749), while the effect of thermal mass on building energy consumption (p = 0.2478) was more than on students’ thermal discomfort (p = 0.6743) based on the SA in this study. The U-value = 0.403 W/m2K of the wall construction obtained the minimum value of energy consumption, while the U-value = 0.544 W/m2K of the wall construction obtained the minimum value of thermal discomfort hours based on simulation output (the range of U-value was between 2.767 W/m2K and 0.403 W/m2K). The U-value = 0.239 W/m2K of the roof construction obtained the minimum value of both energy consumption and thermal discomfort hours based on simulation output (the range of U-value was between 6.223 W/m2K and 0.239 W/m2K).
The effect of thermal mass in this study agreed with previous studies [111,112], which indicate that high thermal mass construction materials are more effective in hot climates, while in cold climates, the disadvantages of high thermal mass are greater than the advantages, and high thermal mass can cause an increase in energy consumption. The thermal mass parameter includes thermal mass in building elements such as walls and floors, which can store thermal energy. In addition, the effect of the U-value for walls and roofs in this study matches the findings of [113,114,115], which indicate that the reduction of the U-value leads to a significant reduction in energy consumption.

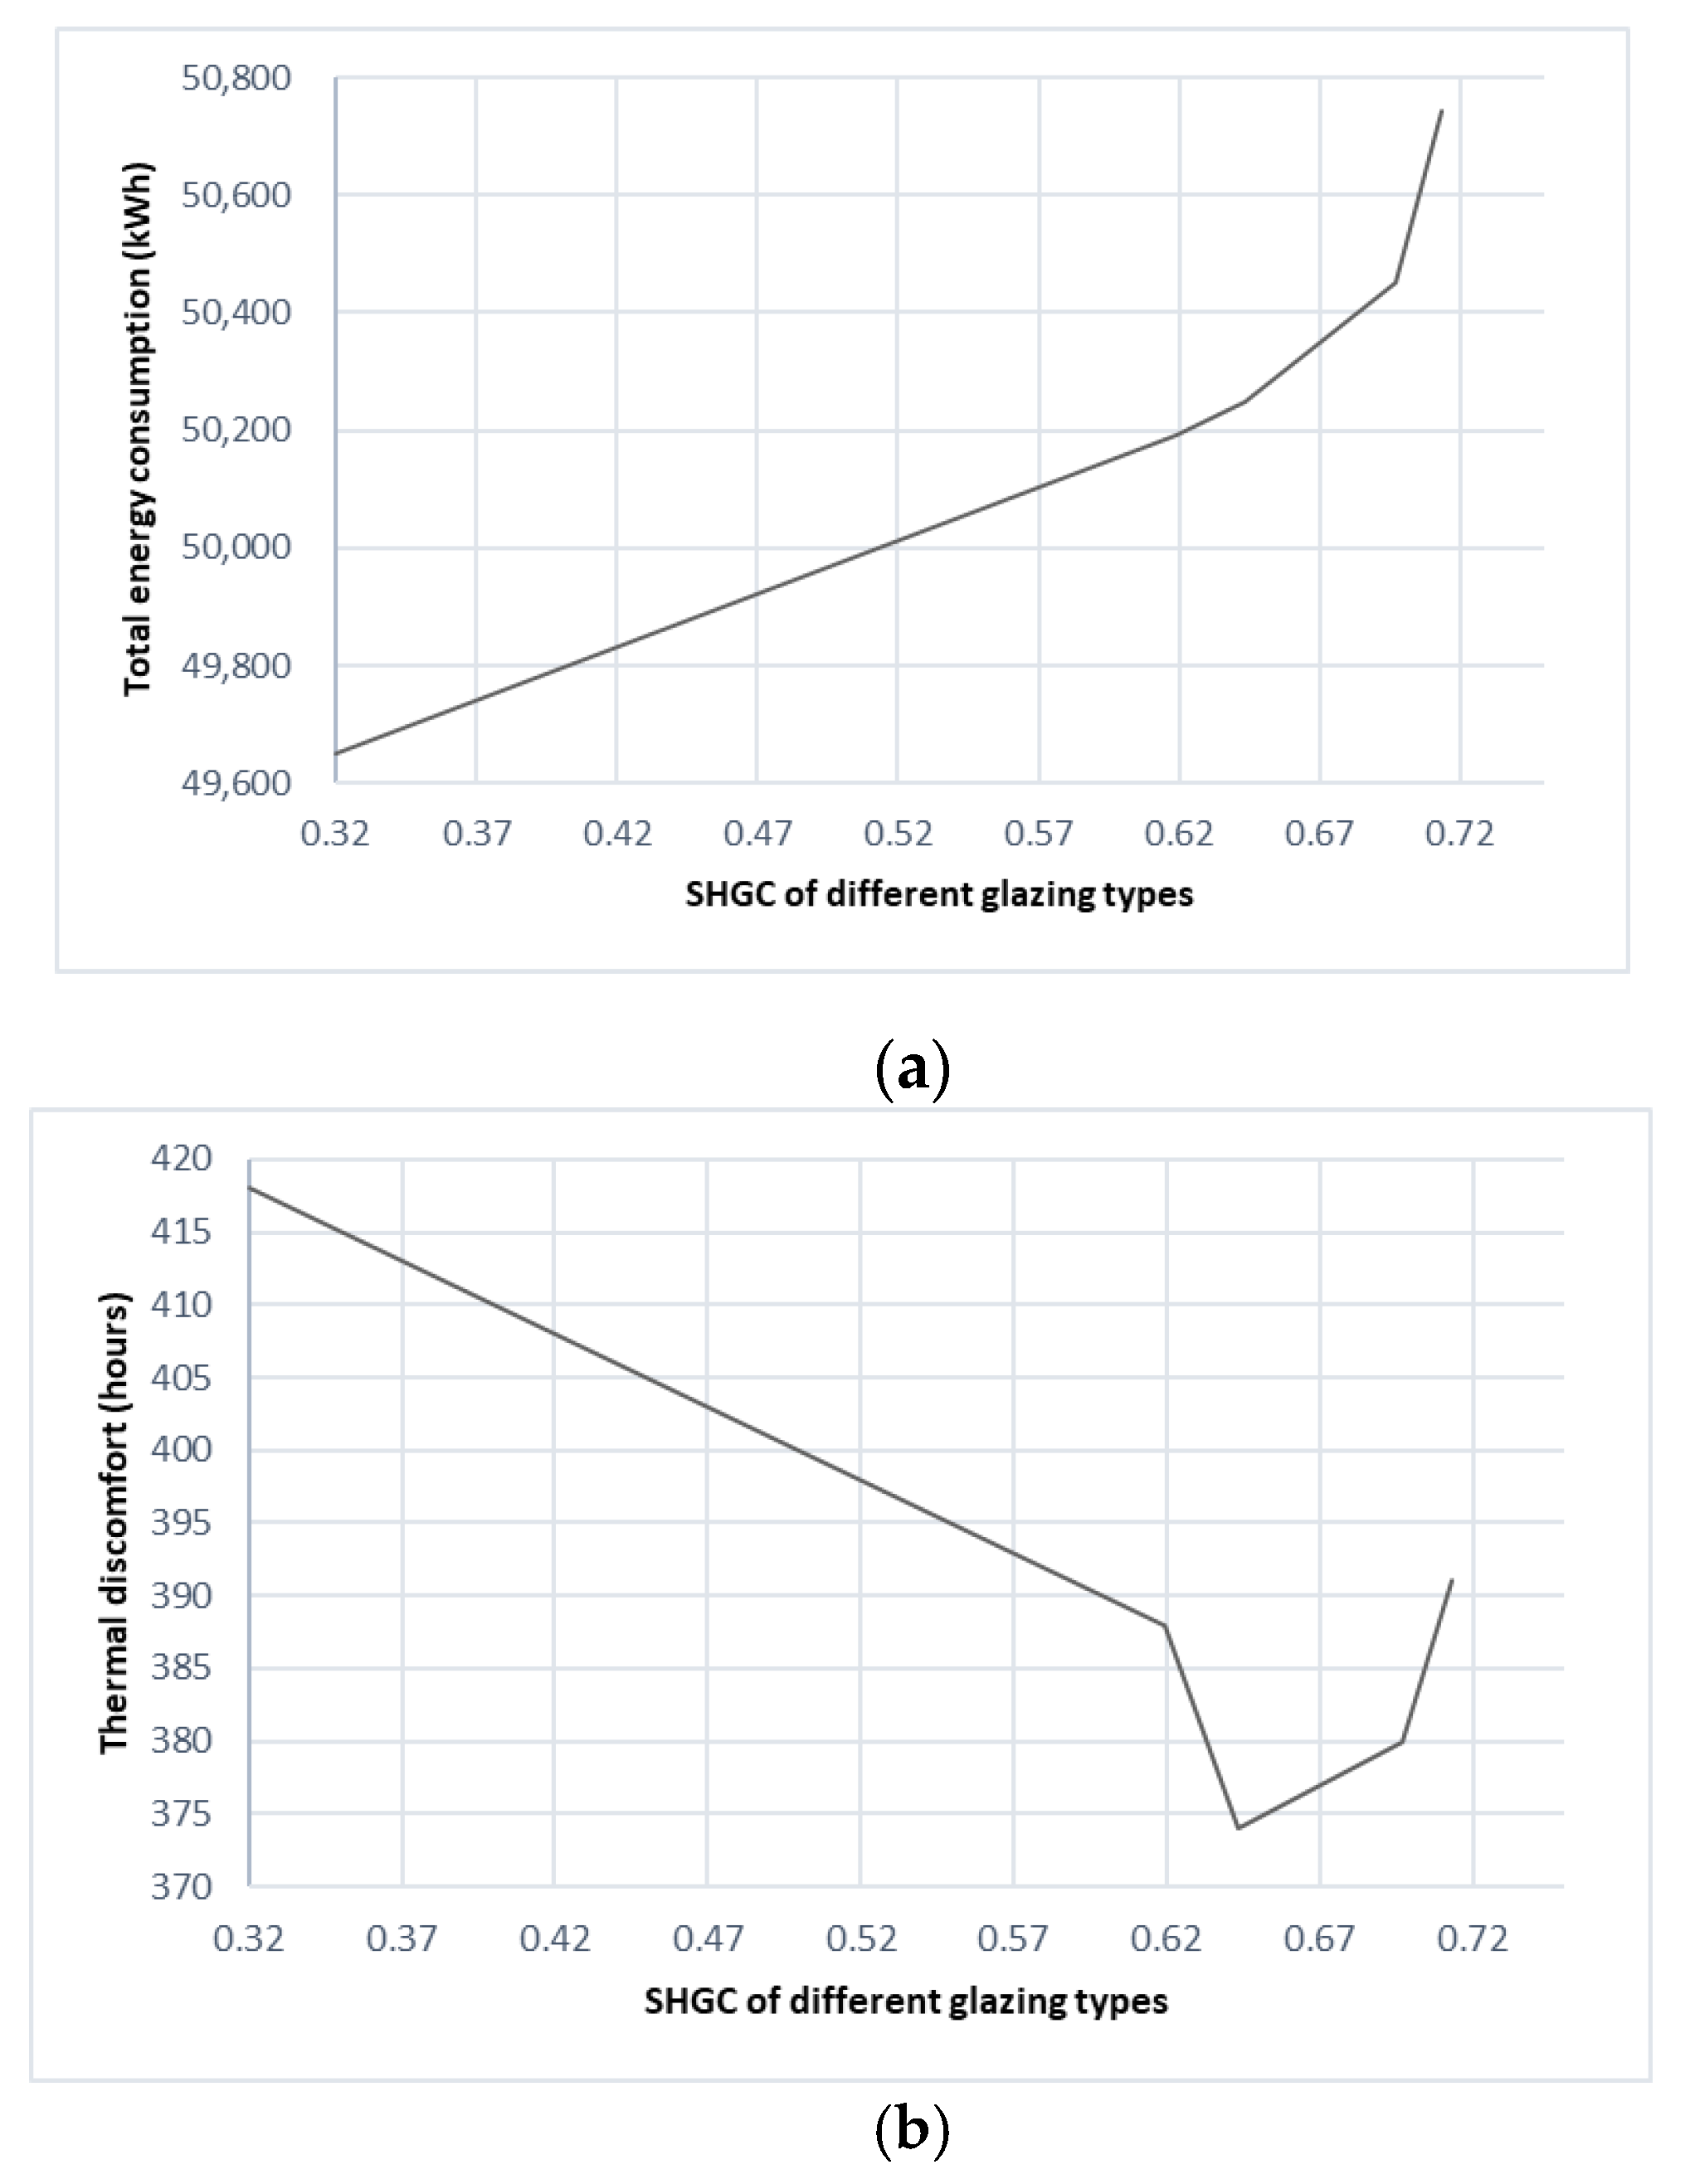
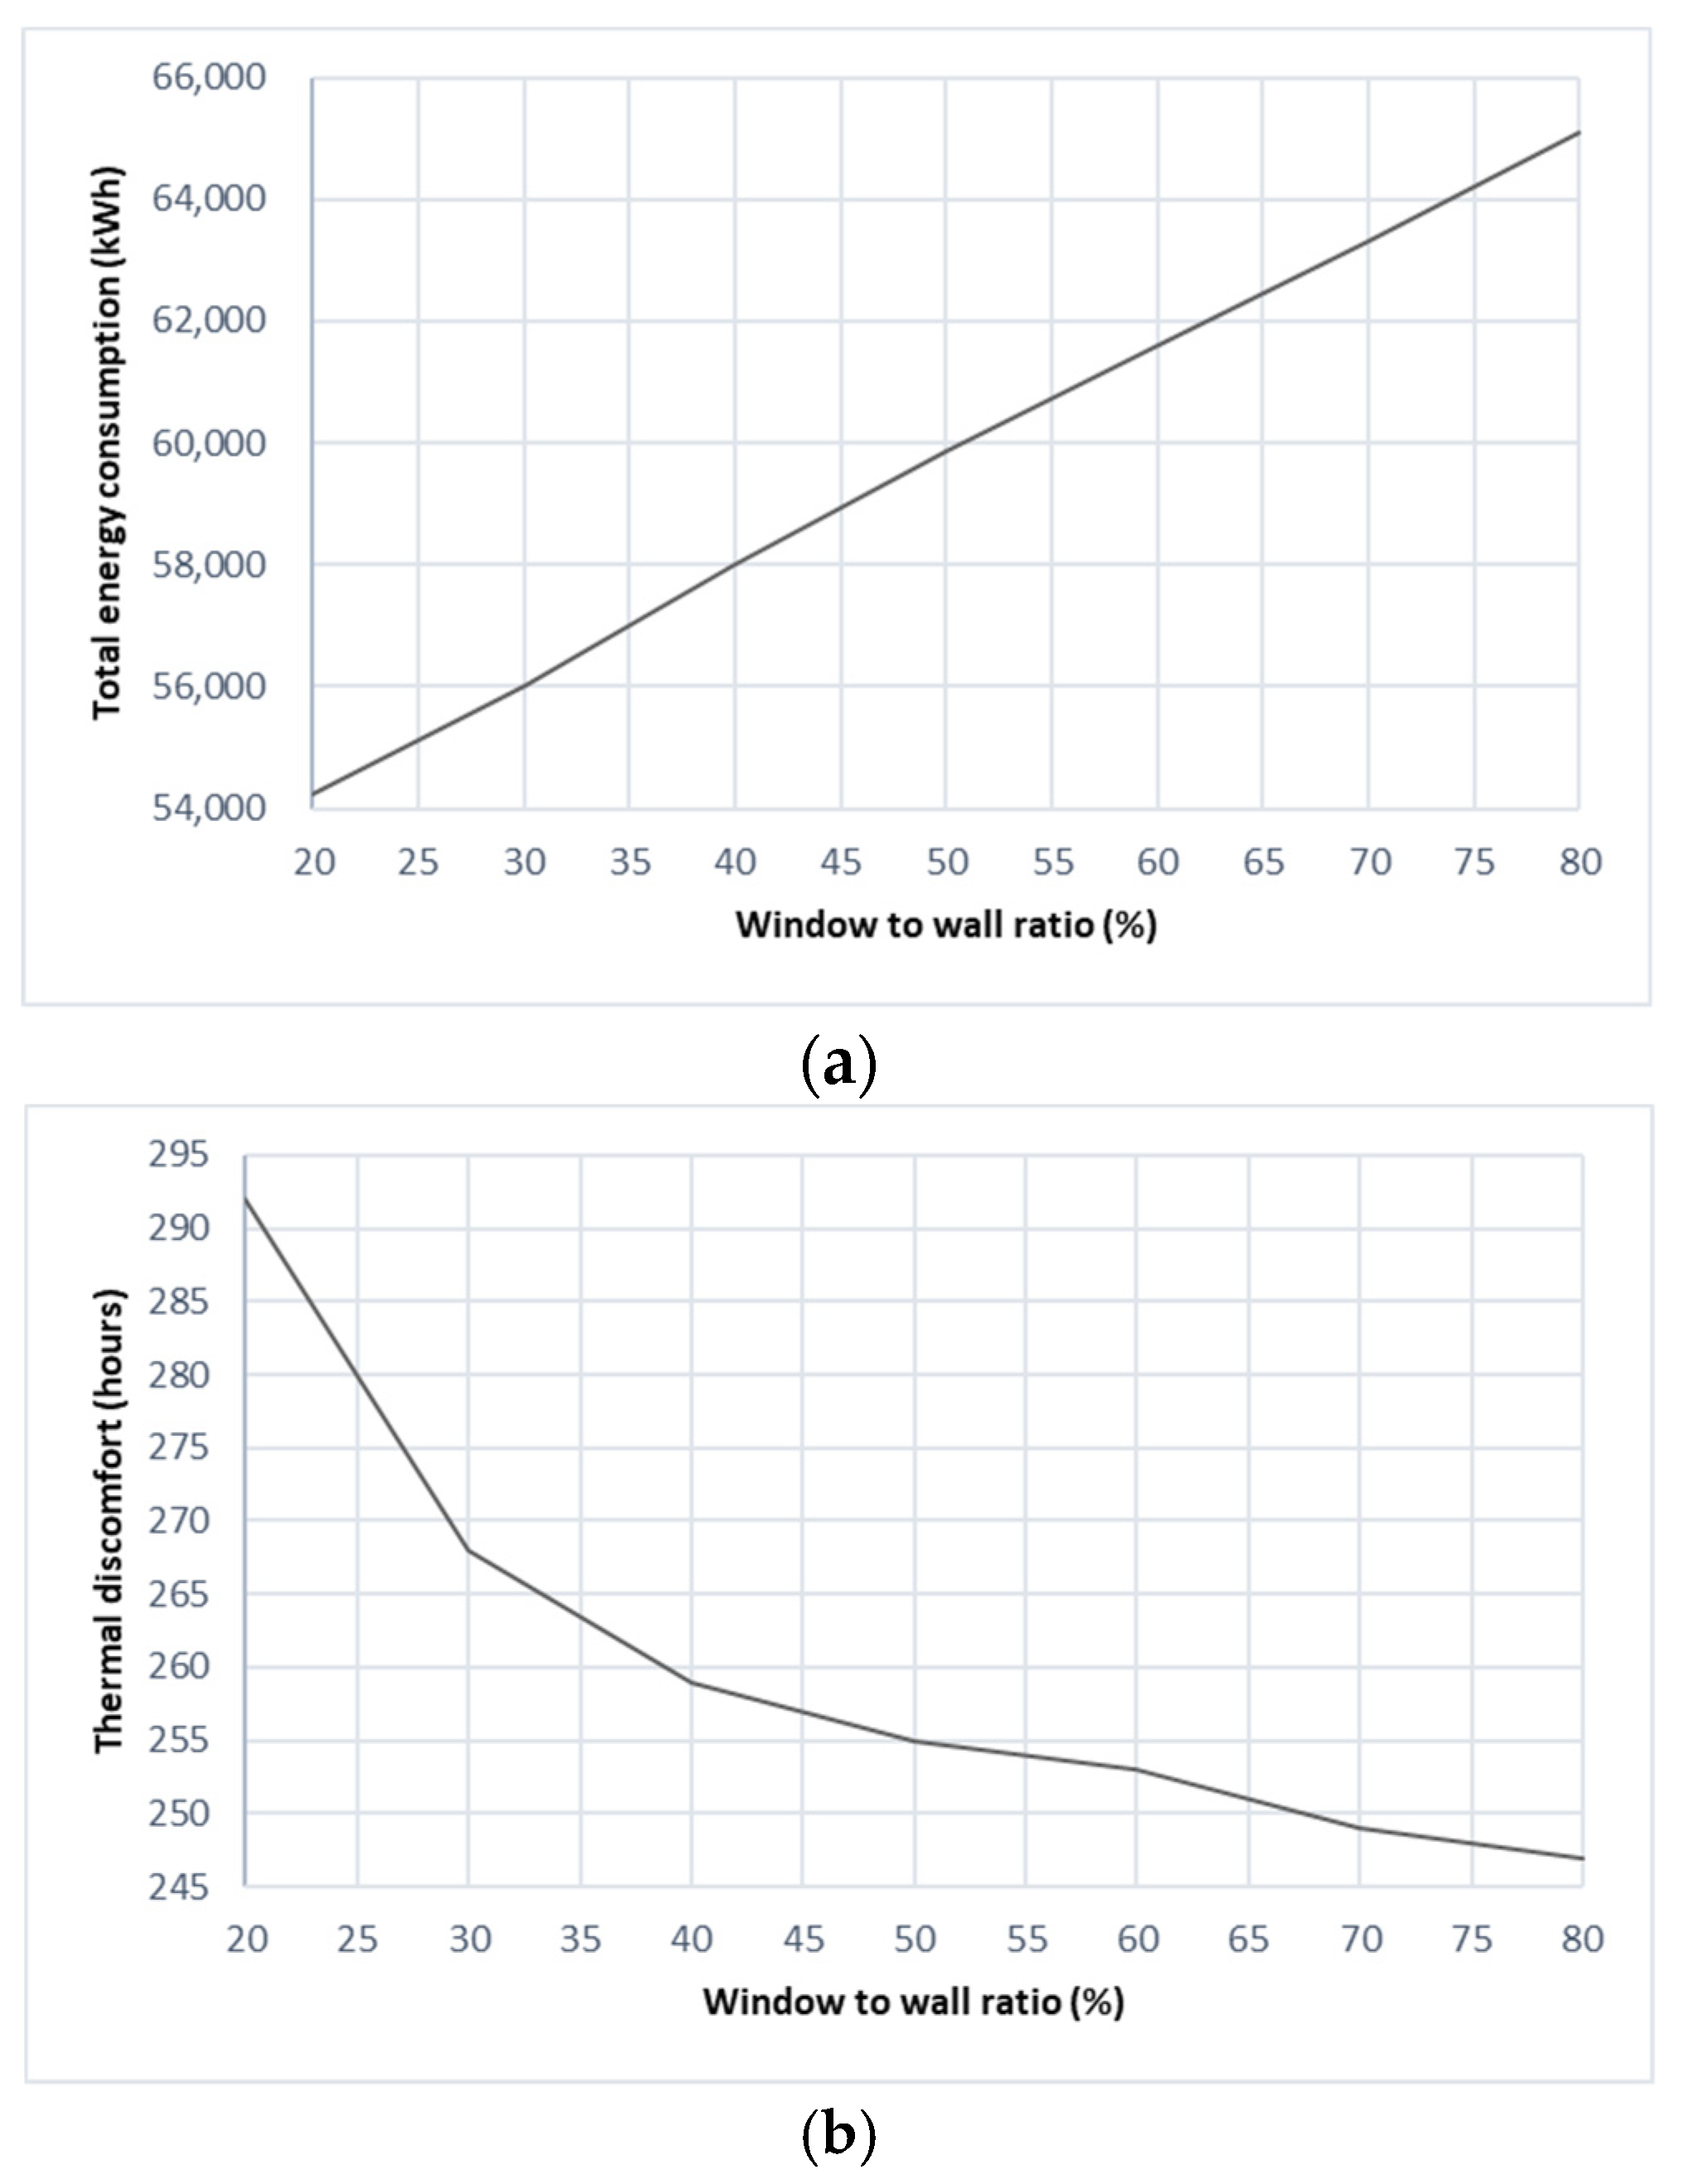
3.3.3. Effect of Glazing, Window to Wall Ratio and Shading Devices

In this study, the effect of glazing type on students’ thermal discomfort hours (p = 0.0049) was more than for energy consumption (p = 0.8302) based on SA. Increases in the solar heat gain coefficient (SHGC) led to increases in building energy consumption and decreases in thermal discomfort hours, as shown in Figure 9.
To minimise unwanted thermal radiation entering the building, we need to address the SHGC of windows. The reason behind the effect of SHGC is because, such as Lyons, Arasteh [116] study shows that direct solar load has a major effect on windows, which affects thermal comfort. The effect of SHGC in this study matches other studies [11,112], which indicate that a window’s impact on thermal comfort is dependent on the window’s properties. In addition, windows are one of the main parameters influencing indoor thermal environment and energy consumption [117]. In contrast, Singh and Garg [118], in a simulation study, observed that the annual energy savings by a window are dependent not only on the window properties, such as the thermal conductivity (U-value) and the SHGC, but also on other building parameters, such as orientation, climatic conditions and insulation level. This explains the low importance of the glazing type as an influence on energy consumption in this study.
Based on the result of SA in this study, the window to wall ratio had a negative influence on students’ thermal discomfort (SRC = −0.0162) and a positive influence on building energy consumption (SRC = 0.0519), as shown in Figure 10.
The window to wall ratio of 20 gave the best energy consumption (lowest value), while the window to wall ratio of 80 gave the minimum discomfort hours. The results of the effect of window to wall ratio on energy consumption matched the previous study [119]. When the window to wall ratio increased, the energy consumption increased. On the other hand, the effect of window to wall ratio in this study was different for thermal comfort only (the annual thermal comfort hours increased when window to wall ratio decreased) [120], and both energy consumption and thermal comfort [121], because of the difference in the amount of incident solar radiation in NSW compared to other climate zones. The window to wall ratio controls the amount of incident solar radiation entering the building [120]. For the same reason, we found from the results based on SA in this study that there was a negative influence of roof window opens ratio on building energy consumption (SRC = −0.0214) and students’ thermal discomfort (SRC = −0.0027).
Based on the result of PA, there was an inverse relationship between the length of shading devices and building energy consumption. In contrast, the shading devices parameter had the reverse effect on building energy consumption and students’ thermal discomfort hours. For example, a building without shading devices consumed more energy (less thermal discomfort hours) than one with 1 to 2 m overhang/louvre devices, as shown in Figure 11.
Shading devices reduce direct rays from the sun but permit natural daylight to access the building. The effect of shading devices on energy consumption and thermal comfort in this study agrees with other studies [122,123], which indicates that shading devices significantly contribute towards developing indoor thermal environments, avoiding overheating, and decreasing cooling loads.

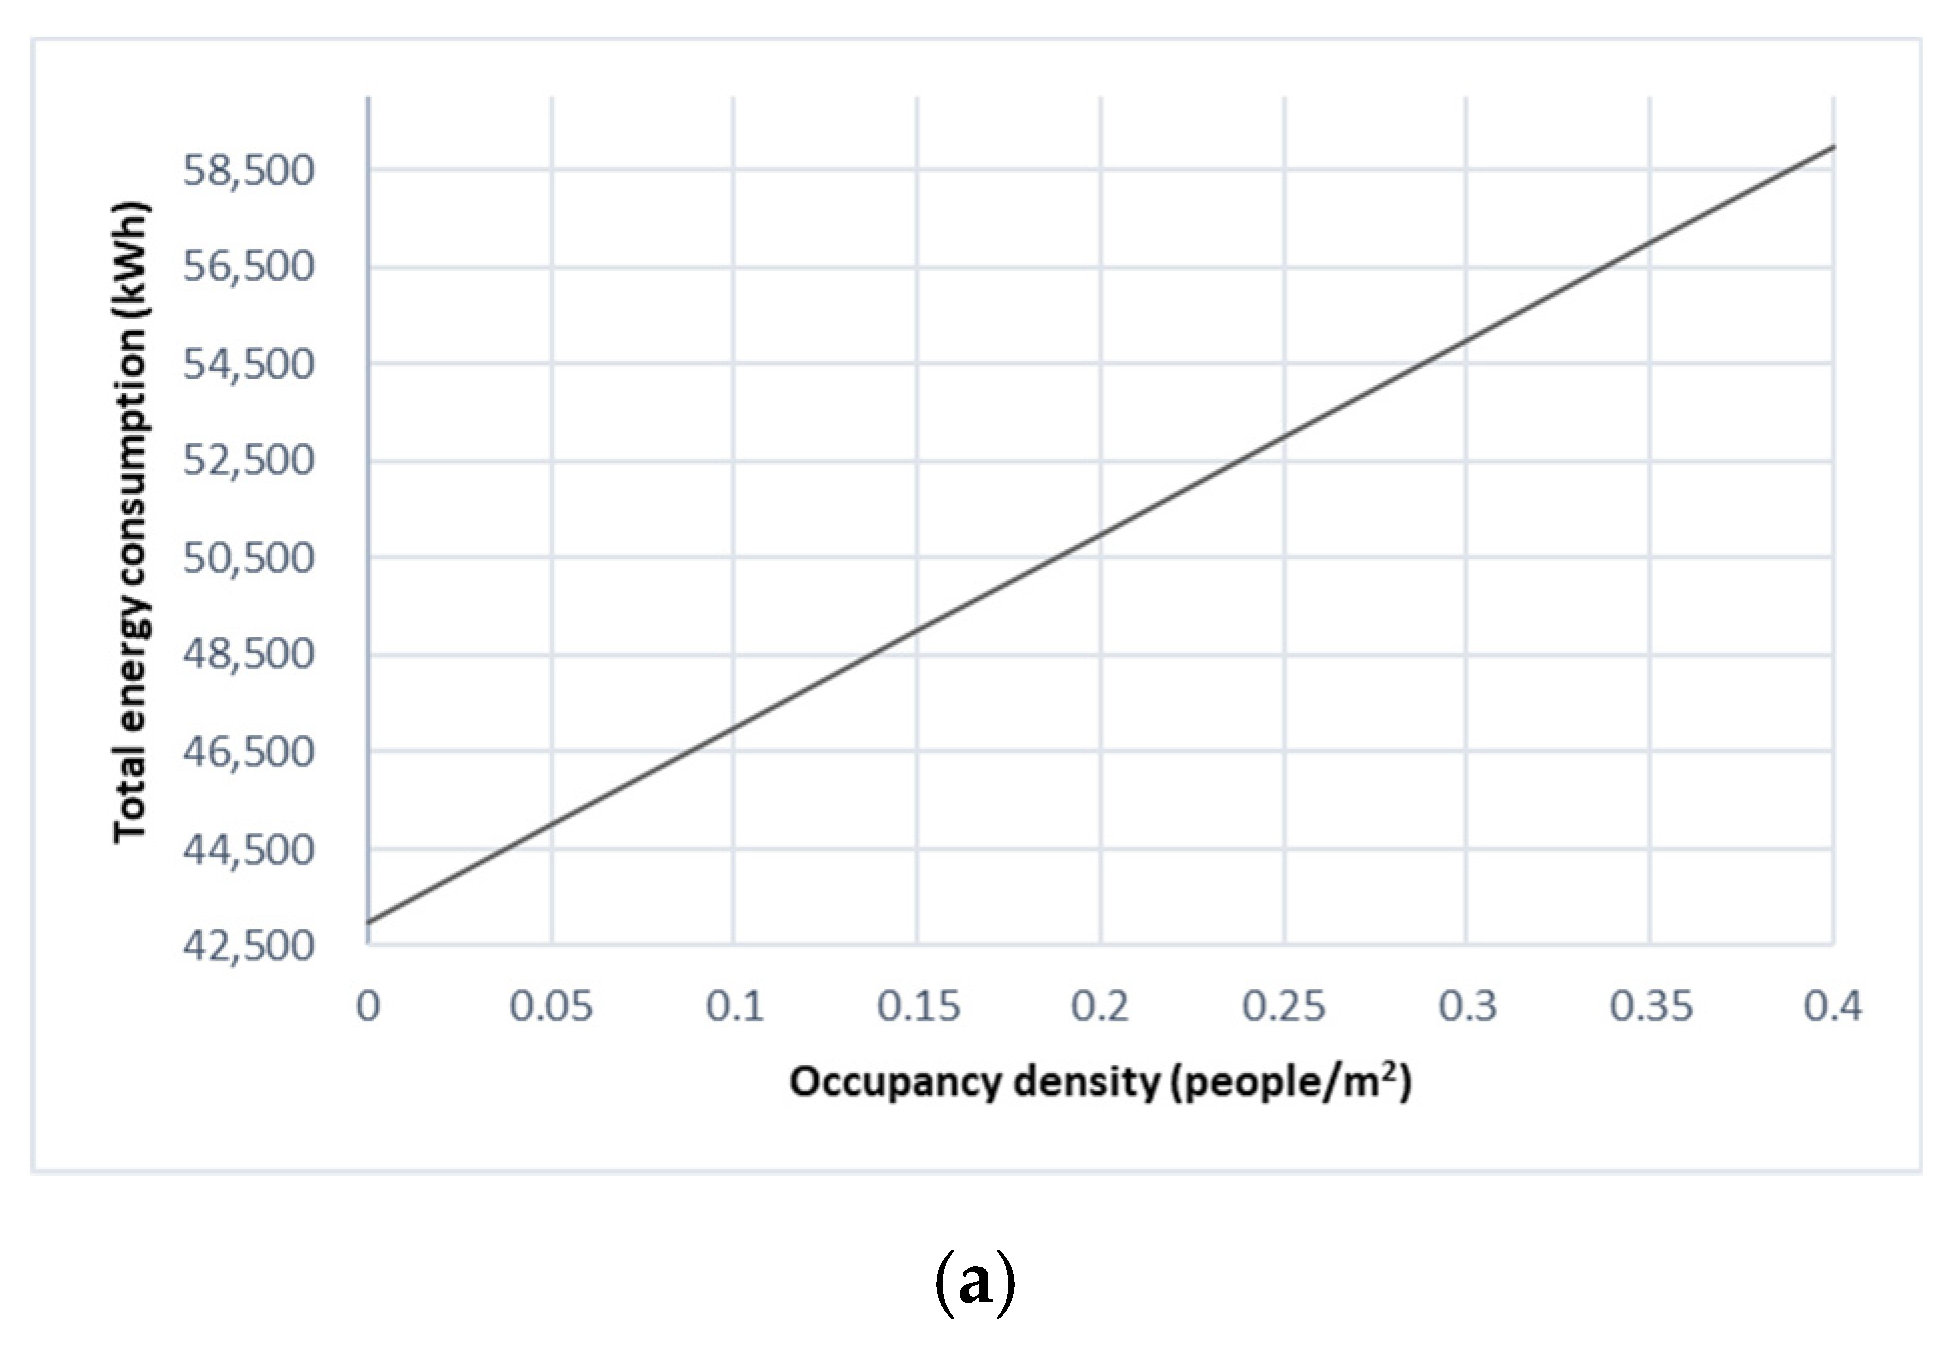
3.3.4. Effect of Occupancy Density

The effect of the occupancy density on thermal discomfort hours and building energy consumption is shown in Figure 12. However, students’ thermal discomfort and building energy consumption were affected by occupancy density with the same amount of significance (p = 0.0006).
Previous studies [124,125] explain the reason behind the adverse effect on thermal comfort in the event of an increase in the number of occupants and the direct effect on the increase in energy consumption. Mjörnell, Johansson [124] showed that extended occupancy density results in an increased moisture supply, depending on the number of people staying in the building. When the airflow in the architectural space with excessive occupancy density is increased, the moisture supply will no longer exceed the critical levels for moisture damage. However, there will be an increased energy consumption for heating of the air due to increased air movement [125].

3.3.5. Effect of Infiltration Rate and Mechanical Ventilation Rate per Area

In this study, the infiltration rate parameter had a positive influence on students’ thermal discomfort (SRC = 0.0319) and energy consumption (SRC = 0.0525), as shown in Figure 13.
The effect of infiltration on building energy consumption (p = 0.0001) was greater than students’ thermal discomfort (p = 0.0282). Furthermore, the results of this study show that the better the building crack levels (from very poor to excellent), the lower the energy consumption (SRC = −0.0214) and student thermal discomfort (SRC = −0.0272). The effect of crack template (airtightness) on students’ thermal discomfort (p = 0.0612) was more than building energy consumption (p = 0.1165). Therefore, the results in this study regarding the effect of infiltration on both students’ thermal comfort and building energy consumption matched those of previous studies [112,126,127]. The difference in air pressure across the building envelope was one of the main reasons for infiltration. This is caused by indoor and outdoor air temperature differences (stack effect), operation of a mechanical ventilation system and wind movement [126,127]. Infiltration affects the heating/cooling load, indoor air temperature and indoor air moisture levels in buildings [109]. The rate of infiltration is affected by outdoor environmental variables, building site, building age and construction materials. Air tends to infiltrate through low-level leaks when the architectural space is heating, and exfiltrate from leaks high in the building envelope [128]. Closing air leakage cracks can reduce the building energy consumption by reducing the infiltration rate [129].
In this study, and based on SA, the mechanical ventilation rate per area parameter had a positive influence on students’ thermal discomfort (SRC = 0.0345) and building energy consumption (SRC = 0.0099), as shown in Figure 14. The effect of mechanical ventilation rate per area on students’ thermal discomfort (p = 0.0178) was more than for building energy consumption (p = 0.4695).
PA shows that the higher the ventilation rate, the lower the air temperature and operative temperature as well. Therefore, this decrease in indoor temperature could be one of the causes of thermal discomfort. The mechanical ventilation rate per area of six gave the best energy consumption (lowest value), while the mechanical ventilation rate per area of zero gave the minimum thermal discomfort hours. The results showed a matching of the effect of mechanical ventilation rate with previous studies [130,131]. On the other hand, another study by Allab, Kindinis [132] indicates that poor air ventilation rates lead to thermal discomfort problems and extreme energy consumption. Thermal comfort regulations related to indoor air quality (IAQ) conditions are not yet theoretically obvious. For this reason, different minimum ventilation rates for the same types of buildings in different countries have been adopted [133]. This explains the reverse relationship between mechanical ventilation rate and students’ thermal comfort based on the SA in this study.

3.3.6. Effect of Building Orientation

The effect of building orientation on both students’ thermal discomfort (SRC = 0.0176) and building energy consumption (SRC = 0.0129) is shown in Figure 15.
The effect of building orientation on students’ thermal discomfort (p = 0.2270) was more than for building energy consumption (p = 0.3436). According to Figure 15 the best orientation with the lowest thermal discomfort hours (379 h) was (θ = 85°, θ = 265°), and the best orientation with the lowest energy consumption (50,430 kWh) was (θ = 175°), which were obtained based on PA. Previous studies [124,134,135] align with the result of this study regarding the effect of building orientation on both students’ thermal comfort and building energy consumption. The building’s orientation needs to be directed to the prevailing wind, and the presence or absence of natural ventilation has a significant impact [120,134]. Building orientation is an early stage design option with low cost to improve building users’ thermal comfort and decrease building energy consumption [135].
Despite the influence of those ABDPs on both students’ thermal comfort and building energy consumption, their effect depends on the ranking of their performance, from the most to the least influential parameters, as described previously in Table 3.

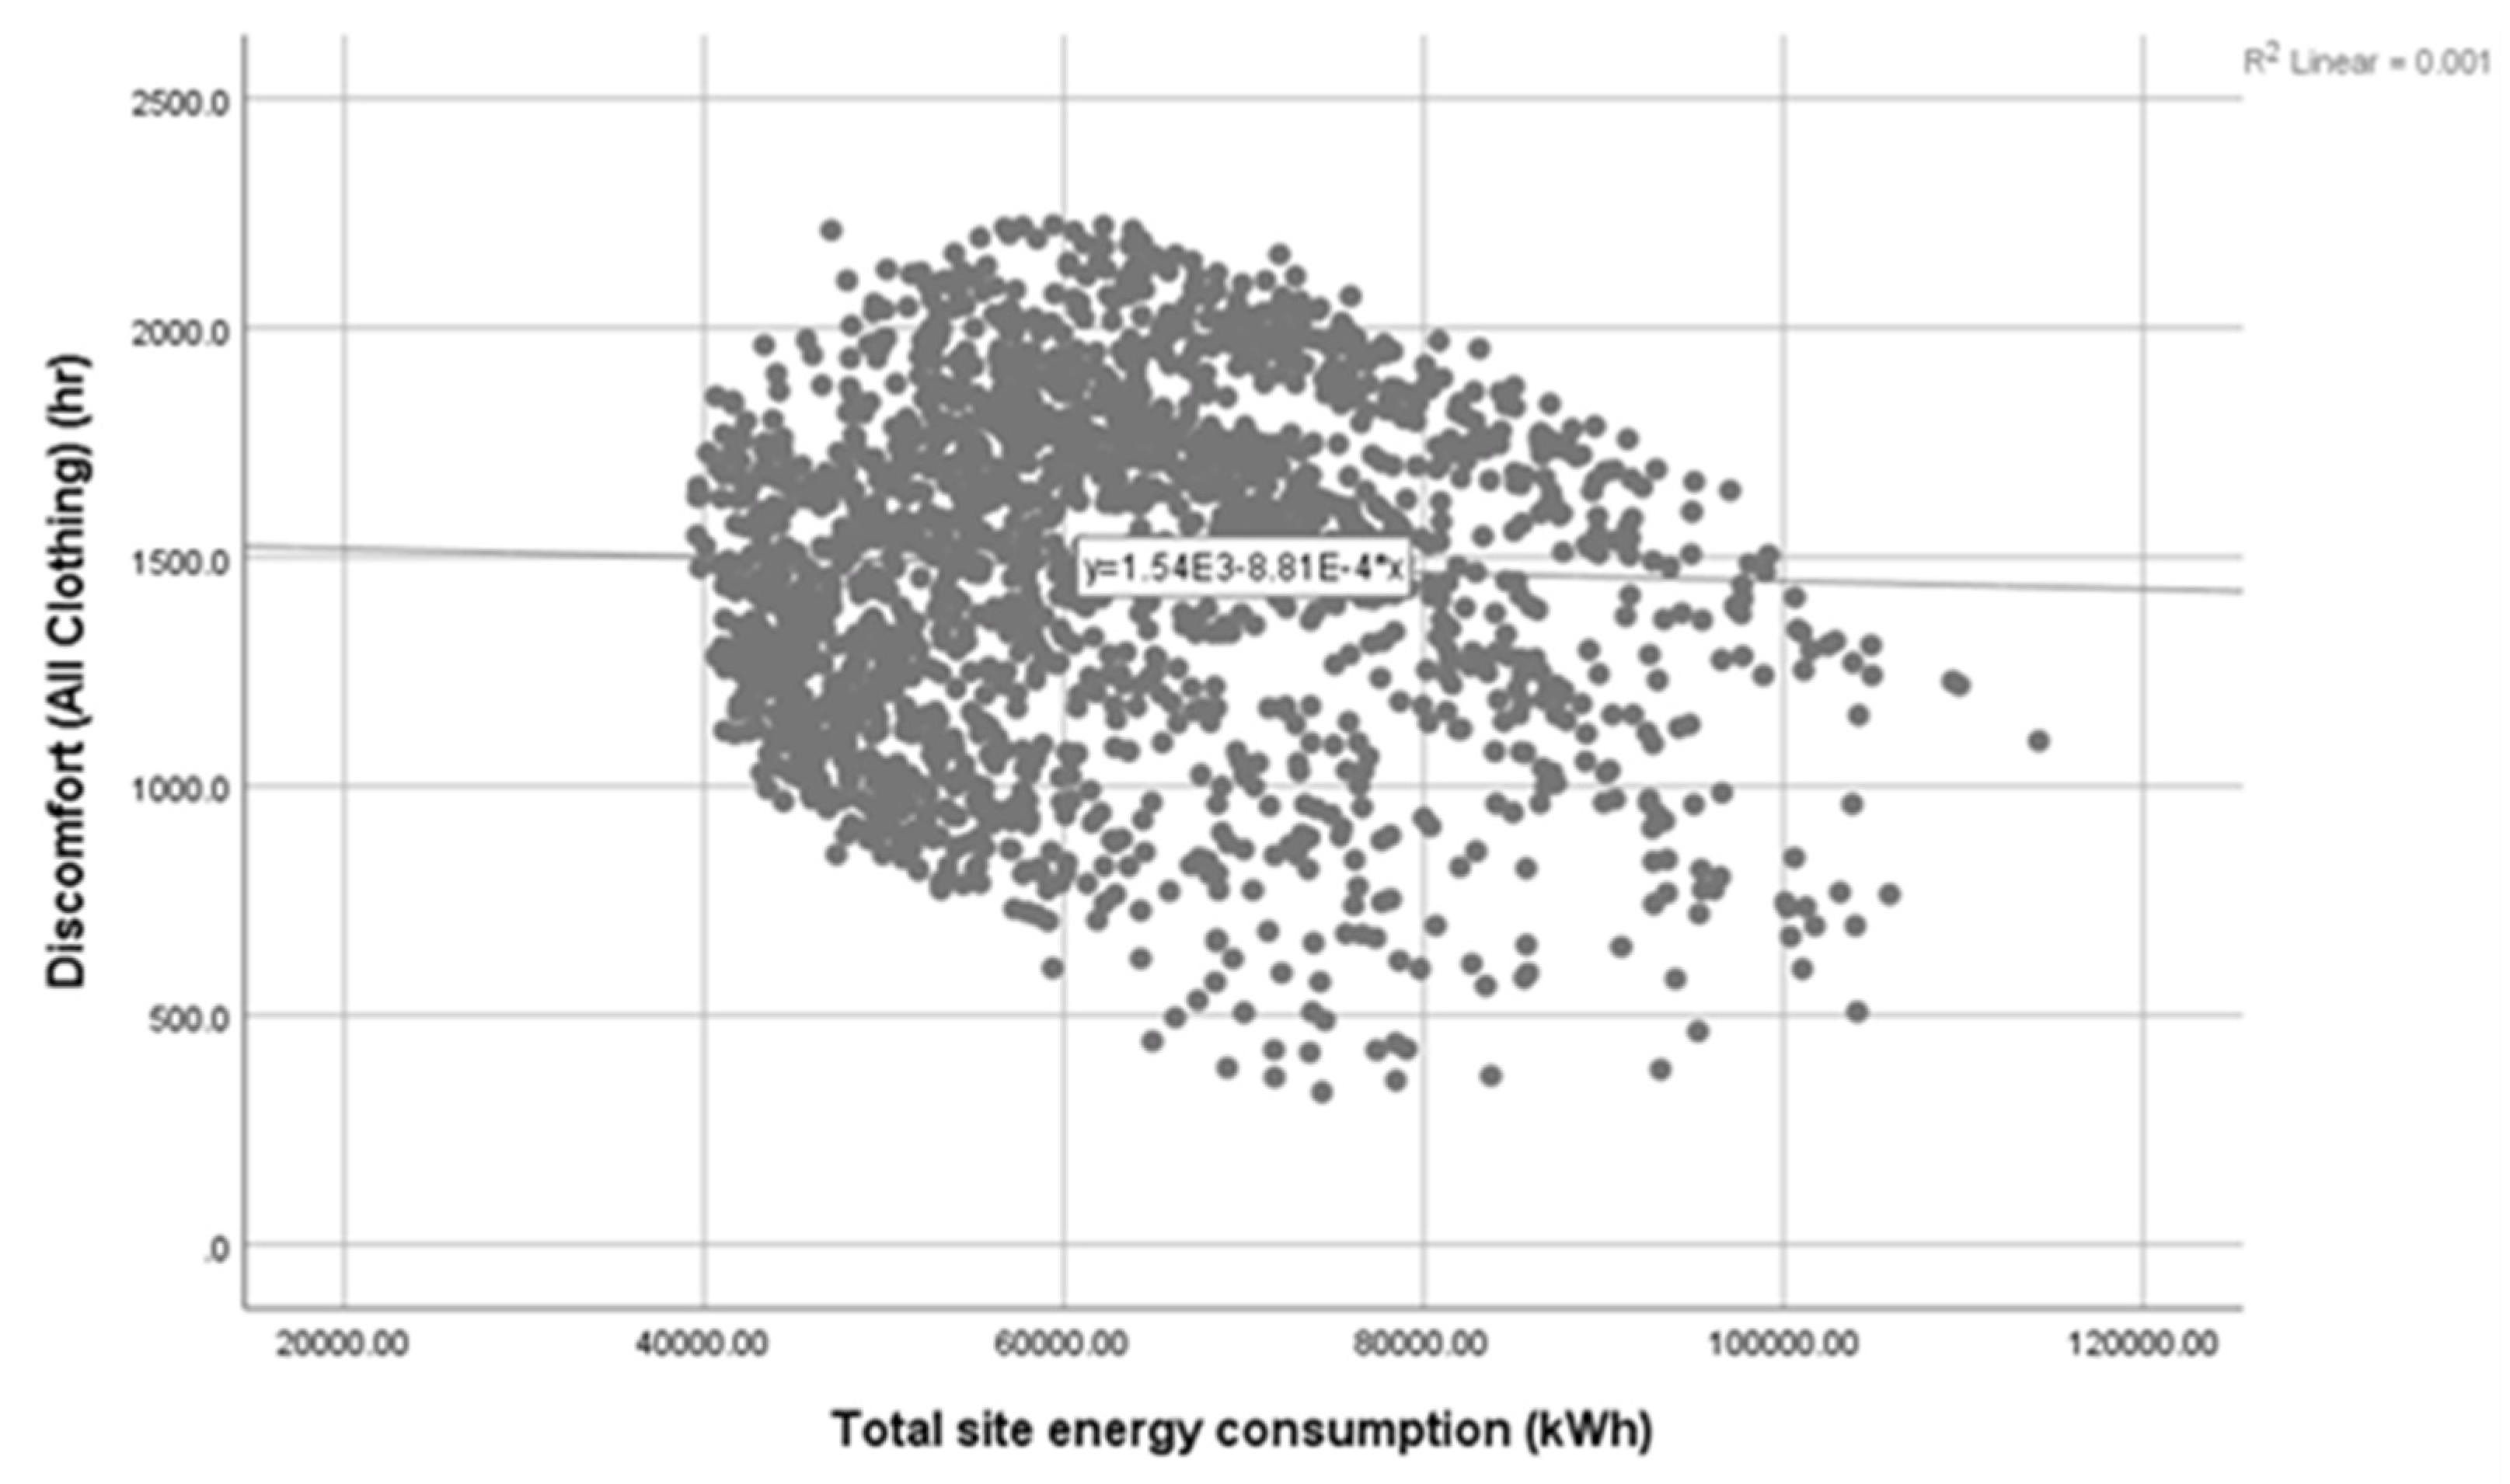
3.4. Relationship between Students’ Thermal Discomfort Hours and Building Energy Consumption

The same sample of ABDPs was also used in the bivariate regression analysis to find the empirical relationship between students’ thermal comfort and building energy consumption. Pearson correlation was used in this study because the interval ratio of students’ thermal comfort and building energy consumption data had normal distributions, as shown below in Figure 16.
In this study, which is based on a Pearson correlation output using SPSS software, there was a very weak negative relationship (non-significant relationship) between the students’ thermal discomfort hours and the building cooling/heating load, r = −0.033, n = 1845, p = 0.153, p > 0.05 (alpha value). Increases in building energy consumption were correlated with decreases in students’ discomfort hours. A scatterplot of students’ thermal discomfort hours and the total building energy consumption is shown below in Figure 17. The summary of the Pearson correlation output is shown in Table 4.
A scatterplot shows that the data is scattered. For this reason, cluster analysis can be a useful data-mining method for any dataset that needs to categorise discrete groups of parameters. The most common use of cluster analysis is classification. ABDPs are separated into groups so that each parameter is more similar to other parameters in its group than to parameters outside the group. In this study, the current iteration was 23, with 4 cluster groups. The summary of the final size and number of cases in each cluster is shown in Figure 18.
The extent of the impact of the ABDPs led to the data being divided into four groups based on the parameters’ effects on building energy consumption and thermal comfort. The four clustering groups express the characteristics of the ABDPs that led them to affect the level of students’ thermal discomfort hours and energy consumption, as shown in Figure 19. The effect of ABDPs on both students’ thermal discomfort hours and energy consumption has been discussed through the SA. Each dot in the graph contains input data for the 15 ABDPs. After analysing each dot, we found a match for the effect of parameters that had a low p-value in the SA. The first and fourth groups described high thermal discomfort hours, while high energy consumption characterised the first group and low energy consumption characterised the fourth group. The second and the third groups described low thermal discomfort hours, while high energy consumption was seen in the second group and low energy consumption in the third group.

4. Conclusions

In the present study, a comprehensive assessment of ABDPs on thermal comfort and energy consumption was conducted using Monte Carlo techniques in order to identify the parameters of most concern and show their realistic effects in educational buildings in NSW, Australia. Based on the results and analysis, the following conclusions can be drawn:
(1)
The simulation results showed a significant potential to optimise the ABDPs to achieve energy saving and thermal comfort in educational buildings in NSW, Australia.
(2)
Based on the parametric and sensitivity analyses, there is a very weak relationship between the students’ thermal discomfort hours and the building cooling/heating load. However, the cooling and heating set-point temperatures, as well as roof construction, had a significant impact on the sensitivity of the ABDPs for both building energy consumption and student thermal comfort (p = 0.0000).
(3)
Increasing the cooling set-point temperature from 22 °C to 28 °C and using a U-value of 0.239 W/m2K in roof construction can reduce the operative temperatures by 14.2% and 20.0%, respectively. These reductions could significantly lower the thermal discomfort hours by 6.0 and 3.25 times, respectively.
(4)
The findings of this study are particularly useful for architectural design teams because they enable designers to decide easily which of the sensitive ABDPs are more important than the others based on the simulation outcomes. Moreover, architectural design teams can save time by not focusing on ABDPs that have small effects on thermal comfort and energy consumption.
(5)
However, there remains a number of important challenges and areas for additional study. For example, there is a need for more studies regarding indoor thermal performance and students’ thermal comfort, as well as students’ academic performance. More work is required to design performance criteria to quantitatively evaluate the ABDPs with UA and SA capabilities.

Author Contributions

Conceptualisation, S.A., W.T., S.K. and D.A.; methodology, S.A., W.T., S.K. and D.A.; software, S.A. and D.A.; validation, S.A., W.T., S.K. and D.A.; formal analysis, S.A.; investigation, S.A.; resources, S.A., W.T., S.K. and D.A.; data curation, S.A.; writing—original draft preparation, S.A. and W.T.; writing—review and editing, S.A., W.T., S.K. and D.A.; visualisation, S.A. and W.T.; supervision, W.T.; project administration, S.A. All authors have read and agreed to the published version of the manuscript.

Funding

This research received no external funding.

Institutional Review Board Statement

Not applicable.

Informed Consent Statement

Not applicable.

Data Availability Statement

Not applicable.

Acknowledgments

The first author gratefully acknowledges the Saudi Arabian Cultural Mission (SACM) in Australia and the scholarship sponsored by Imam Abdulrahman Bin Faisal University (IAU) for financially supporting this research.

Conflicts of Interest

The authors declare no conflict of interest.

Acronyms

ABCBAustralian Building Codes Board
ABDPsArchitectural Building Design Parameters
BCABuilding Code of Australia
BESBuilding Energy Simulation
EPWEnergyPlus Weather file
HVACHeating, Ventilation and Air Conditioning
IAQIndoor Air Quality
IEQIndoor Environmental Quality
LHSLatin Hypercube Sampling
MCMonte Carlo
MVMechanical Ventilation
NSWNew South Wales
PAParametric Analysis
PMVPredicted Mean Vote
PPDPredicted Percentage Dissatisfaction
ROCRate Of Change
SASensitivity Analyses
SDStandard Deviation
SHGCSolar Heat Gain Coefficient
SRCStandardised Regression Coefficient
UAUncertainty Analysis

References

  1. Pérez-Lombard, L.; Ortiz, J.; Coronel, J.F.; Maestre, I.R. A review of HVAC systems requirements in building energy regulations. Energy Build. 2011, 43, 255–268. [Google Scholar] [CrossRef]
  2. UN Environment. Global Status Report. 2017. Available online: https://www.worldgbc.org/sites/default/files/UNEP%20188_GABC_en%20%28web%29.pdf (accessed on 10 February 2019).
  3. Ascione, F.; Bianco, N.; Böttcher, O.; Kaltenbrunner, R.; Vanoli, G.P. Net zero-energy buildings in Germany: Design, model calibration and lessons learned from a case-study in Berlin. Energy Build. 2016, 133, 688–710. [Google Scholar] [CrossRef]
  4. Li, J.; Yu, Z.J.; Haghighat, F.; Zhang, G. Development and improvement of occupant behavior models towards realistic building performance simulation: A review. Sustain. Cities Soc. 2019, 50, 101685. [Google Scholar] [CrossRef]
  5. Al-Homoud, M.S. A Systematic Approach for the Thermal Design Optimization of Building Envelopes. J. Build. Phys. 2005, 29, 95–119. [Google Scholar] [CrossRef]
  6. Calì, D.; Osterhage, T.; Streblow, R.; Müller, D. Energy performance gap in refurbished German dwellings: Lesson learned from a field test. Energy Build. 2016, 127, 1146–1158. [Google Scholar] [CrossRef]
  7. De Wit, M.S. Uncertainty in Predictions of Thermal Comfort in Buildings; Institutional Repository: Delft, The Netherlands, 2002. [Google Scholar]
  8. Rabani, M.; Madessa, H.B.; Nord, N. Achieving zero-energy building performance with thermal and visual comfort enhancement through optimization of fenestration, envelope, shading device, and energy supply system. Sustain. Energy Technol. Assess. 2021, 44, 101020. [Google Scholar] [CrossRef]
  9. Energy, U.D.O. An assessment of energy technologies and research opportunities. In Quadrennial Technology Review; United States Department of Energy: Washington, DC, USA, 2015. [Google Scholar]
  10. Šujanová, P.; Rychtáriková, M.; Mayor, T.S.; Hyder, A. A Healthy, Energy-Efficient and Comfortable Indoor Environment, a Review. Energies 2019, 12, 1414. [Google Scholar] [CrossRef] [Green Version]
  11. Mirrahimi, S.; Mohamed, M.F.; Haw, L.C.; Ibrahim, N.L.N.; Yusoff, W.F.M.; Aflaki, A. The effect of building envelope on the thermal comfort and energy saving for high-rise buildings in hot–humid climate. Renew. Sustain. Energy Rev. 2016, 53, 1508–1519. [Google Scholar] [CrossRef]
  12. Attia, S.; Hamdy, M.; O’Brien, W.; Carlucci, S. Assessing gaps and needs for integrating building performance optimization tools in net zero energy buildings design. Energy Build. 2013, 60, 110–124. [Google Scholar] [CrossRef] [Green Version]
  13. Manioğlu, G.; Yılmaz, Z. Energy efficient design strategies in the hot dry area of Turkey. Build. Environ. 2008, 43, 1301–1309. [Google Scholar] [CrossRef]
  14. Rafiq, M.Y.; Mathews, J.D.; Bullock, G.N. Conceptual Building Design—Evolutionary Approach. J. Comput. Civ. Eng. 2003, 17, 150–158. [Google Scholar] [CrossRef] [Green Version]
  15. Al-Tamimi, N.; Fadzil, S.F.S.; Harun, W.M.W. The Effects of Orientation, Ventilation, and Varied WWR on the Thermal Performance of Residential Rooms in the Tropics. J. Sustain. Dev. 2011, 4, 142–149. [Google Scholar] [CrossRef]
  16. Yıldız, Y.; Arsan, Z.D. Identification of the building parameters that influence heating and cooling energy loads for apartment buildings in hot-humid climates. Energy 2011, 36, 4287–4296. [Google Scholar] [CrossRef] [Green Version]
  17. Cellura, M.; Guarino, F.; Longo, S.; Mistretta, M. Energy life-cycle approach in Net zero energy buildings balance: Operation and embodied energy of an Italian case study. Energy Build. 2014, 72, 371–381. [Google Scholar] [CrossRef]
  18. Tabor, J.; Chatterjee, K.; Ghosh, T.K. Smart Textile-Based Personal Thermal Comfort Systems: Current Status and Potential Solutions. Adv. Mater. Technol. 2020, 5, 1901155. [Google Scholar] [CrossRef]
  19. Kosanović, S.; Fikfak, A.; Folić, B. Sustainability and resilience—(In)consistencies in two design realms. In Sustainable and Resilient Building Design: Approaches, Methods and Tools; TU Delft Open: Delft, The Netherlands, 2018; pp. 67–82. [Google Scholar]
  20. Mishra, A.; Derks, M.; Kooi, L.; Loomans, M.; Kort, H. Analysing thermal comfort perception of students through the class hour, during heating season, in a university classroom. Build. Environ. 2017, 125, 464–474. [Google Scholar] [CrossRef]
  21. Allab, Y.; Pellegrino, M.; Guo, X.; Nefzaoui, E.; Kindinis, A. Energy and comfort assessment in educational building: Case study in a French university campus. Energy Build. 2017, 143, 202–219. [Google Scholar] [CrossRef]
  22. Singh, M.; Ooka, R.; Rijal, H. Thermal comfort in Classrooms: A critical review. In Proceedings of the 10th Windsor Conference—Rethinking Comfort, Windsor, UK, 12–15 April 2018. [Google Scholar]
  23. Humphreys, M.A.; Nicol, J.F.; Raja, I.A. Field Studies of Indoor Thermal Comfort and the Progress of the Adaptive Approach. Adv. Build. Energy Res. 2007, 1, 55–88. [Google Scholar] [CrossRef]
  24. Kwok, A.G.; Chun, C. Thermal comfort in Japanese schools. Sol. Energy 2003, 74, 245–252. [Google Scholar] [CrossRef]
  25. Indraganti, M.; Rao, K.D. Effect of age, gender, economic group and tenure on thermal comfort: A field study in residential buildings in hot and dry climate with seasonal variations. Energy Build. 2010, 42, 273–281. [Google Scholar] [CrossRef]
  26. Karjalainen, S. Thermal comfort and gender: A literature review. Indoor Air 2011, 22, 96–109. [Google Scholar] [CrossRef] [PubMed]
  27. Pereira, L.D.; Raimondo, D.; Corgnati, S.P.; da Silva, M.C.G. Assessment of indoor air quality and thermal comfort in Portuguese secondary classrooms: Methodology and results. Build. Environ. 2014, 81, 69–80. [Google Scholar] [CrossRef]
  28. Baranova, D.; Sovetnikov, D.; Semashkina, D.; Borodinecs, A. Correlation of energy efficiency and thermal comfort depending on the ventilation strategy. Procedia Eng. 2017, 205, 503–510. [Google Scholar] [CrossRef]
  29. Zhang, G.; Zheng, C.; Yang, W.; Zhang, Q.; Moschandreas, D.J. Thermal Comfort Investigation of Naturally Ventilated Classrooms in a Subtropical Region. Indoor Built Environ. 2007, 16, 148–158. [Google Scholar] [CrossRef]
  30. Baker, N.; Standeven, M. Thermal comfort for free-running buildings. Energy Build. 1996, 23, 175–182. [Google Scholar] [CrossRef]
  31. Goto, T.; Toftum, J.; de Dear, R.; Fanger, P.O. Thermal sensation and thermophysiological responses to metabolic step-changes. Int. J. Biometeorol. 2006, 50, 323–332. [Google Scholar] [CrossRef]
  32. Tushar, W.; Wang, T.; Lan, L.; Xu, Y.; Withanage, C.; Yuen, C.; Wood, K.L. Policy design for controlling set-point temperature of ACs in shared spaces of buildings. Energy Build. 2017, 134, 105–114. [Google Scholar] [CrossRef] [Green Version]
  33. Wang, Y.; Kuckelkorn, J.M.; Zhao, F.-Y.; Liu, D.; Kirschbaum, A.; Zhang, J.-L. Evaluation on classroom thermal comfort and energy performance of passive school building by optimizing HVAC control systems. Build. Environ. 2015, 89, 86–106. [Google Scholar] [CrossRef]
  34. Bojic, M.; Patou Parvedy, A.; Boyer, H. Optimization of thermal comfort in building through envelope design. arXiv 2013, arXiv:1302.5941. [Google Scholar]
  35. Hoque, S.; Weil, B. The relationship between comfort perceptions and academic performance in university classroom buildings. J. Green Build. 2016, 11, 108–117. [Google Scholar] [CrossRef]
  36. Figueiredo, A.; Figueira, J.; Vicente, R.; Maio, R. Thermal comfort and energy performance: Sensitivity analysis to apply the Passive House concept to the Portuguese climate. Build. Environ. 2016, 103, 276–288. [Google Scholar] [CrossRef]
  37. Fantozzi, F.; Hamdi, H.; Rocca, M.; Vegnuti, S. Use of Automated Control Systems and Advanced Energy Simulations in the Design of Climate Responsive Educational Building for Mediterranean Area. Sustainability 2019, 11, 1660. [Google Scholar] [CrossRef] [Green Version]
  38. El Khattabi, E.M.; Mharzi, M.; Raefat, S.; Meghari, Z. On the Application of a New Thermal Diagnostic Model: The Passive Elements Equivalent in Term of Ventilation Inside a Room; IOP Publishing: Bristol, UK, 2018; Volume 353, p. 012003. [Google Scholar]
  39. Ashtiani, A.; Mirzaei, P.A.; Haghighat, F. Indoor thermal condition in urban heat island: Comparison of the artificial neural network and regression methods prediction. Energy Build. 2014, 76, 597–604. [Google Scholar] [CrossRef]
  40. Green Building Council of Australia. The future of Australian education–Sustainable places for learning. Aust. J. Environ. Educ. 2013, 29, 18–32. [Google Scholar]
  41. Department of Education, N.G. The Educational Facilities Standards & Guidelines (EFSG). Available online: https://efsg.det.nsw.edu.au/ (accessed on 4 July 2020).
  42. Council of Australian Governments [COAG]. Baseline Energy Consumption and Greenhouse Gas. In Emissions in Commercial Buildings in Australia; Department of Climate Change and Energy Efficiency: Dublin, Ireland, 2012. [Google Scholar]
  43. Ghita, S.A.; Catalina, T. Energy efficiency versus indoor environmental quality in different Romanian countryside schools. Energy Build. 2015, 92, 140–154. [Google Scholar] [CrossRef]
  44. Zaki, S.A.; Damiati, S.A.; Rijal, H.B.; Hagishima, A.; Razak, A.A. Adaptive thermal comfort in university classrooms in Malaysia and Japan. Build. Environ. 2017, 122, 294–306. [Google Scholar] [CrossRef]
  45. Velten, K. Mathematical modeling and simulation introduction for scientists and engineers. In Mathematical Modeling and Simulation for Scientists and Engineers; Wiley-VCH: Weinheim, Germany, 2009. [Google Scholar]
  46. Heiselberg, P.; Brohus, H.; Hesselholt, A.; Rasmussen, H.; Seinre, E.; Thomas, S. Application of sensitivity analysis in design of sustainable buildings. Renew. Energy 2009, 34, 2030–2036. [Google Scholar] [CrossRef] [Green Version]
  47. Moffiet, T.; Alterman, D.; Hands, S.; Colyvas, K.; Page, A.; Moghtaderi, B. A statistical study on the combined effects of wall thermal mass and thermal resistance on internal air temperatures. J. Build. Phys. 2015, 38, 419–443. [Google Scholar] [CrossRef]
  48. Buratti, C.; Moretti, E.; Belloni, E.; Cotana, F. Unsteady simulation of energy performance and thermal comfort in non-residential buildings. Build. Environ. 2013, 59, 482–491. [Google Scholar] [CrossRef]
  49. Stavrakakis, G.; Zervas, P.; Sarimveis, H.; Markatos, N. Development of a computational tool to quantify architectural-design effects on thermal comfort in naturally ventilated rural houses. Build. Environ. 2010, 45, 65–80. [Google Scholar] [CrossRef]
  50. Zhang, A.; Bokel, R.; Dobbelsteen, A.V.D.; Sun, Y.; Huang, Q.; Zhang, Q. The Effect of Geometry Parameters on Energy and Thermal Performance of School Buildings in Cold Climates of China. Sustainability 2017, 9, 1708. [Google Scholar] [CrossRef] [Green Version]
  51. Magnier, L.; Haghighat, F. Multiobjective optimization of building design using TRNSYS simulations, genetic algorithm, and Artificial Neural Network. Build. Environ. 2010, 45, 739–746. [Google Scholar] [CrossRef]
  52. Alghamdi, S.; Tang, P.; Kanjanabootra, S.; Alterman, D. Architectural Building Design Parameters in Australian Educational Buildings: A Review. Int. J. Adv. Mech. Civ. Eng. IJAMCE 2019, 2019, 65–72. [Google Scholar]
  53. Evins, R. A review of computational optimisation methods applied to sustainable building design. Renew. Sustain. Energy Rev. 2013, 22, 230–245. [Google Scholar] [CrossRef]
  54. Chong, A.; Xu, W.; Lam, K. Uncertainty Analysis In Building Energy Simulation. A Practical Approach. In Proceedings of the 4th International IBPSA Conference, Hyderabad, India, 7–9 December 2015. [Google Scholar]
  55. Pang, Z.; O’Neill, Z. Uncertainty quantification and sensitivity analysis of the domestic hot water usage in hotels. Appl. Energy 2018, 232, 424–442. [Google Scholar] [CrossRef]
  56. Yu, W.; Li, B.; Jia, H.; Zhang, M.; Wang, D. Application of multi-objective genetic algorithm to optimize energy efficiency and thermal comfort in building design. Energy Build. 2015, 88, 135–143. [Google Scholar] [CrossRef]
  57. Wilde, P.D. Building Performance Analysis; Wiley: New York, NY, USA, 2018. [Google Scholar]
  58. Garg, V. Building Energy Simulation: A Workbook Using DesignBuilder; Mathur, J., Tetali, S., Bhatia, A., Eds.; CRC Press: Boca Raton, FL, USA; Taylor & Francis Group: Boca Raton, FL, USA, 2017. [Google Scholar]
  59. Kaplan, M.; Caner, P. Guidelines for Energy Simulation of Commercial Buildings: Final; Kaplan Engineering: Portland, OR, USA, 1992. [Google Scholar]
  60. Leal, S. Case study of a simplified building energy modeling for performance simulation. Build. Simul. 2013, 2013, 333–339. [Google Scholar]
  61. Wang, S.; Xu, X. Simplified building model for transient thermal performance estimation using GA-based parameter identification. Int. J. Therm. Sci. 2006, 45, 419–432. [Google Scholar] [CrossRef]
  62. Macdonald, I.A. Quantifying the Effects of Uncertainty in Building Simulation; University of Strathclyde Glasgow: Glasgow, UK, 2002. [Google Scholar]
  63. Hopfe, C. The Impact of Future Climate Scenarios on Decision Making in Building Performance Simulation-A Case Study; University of Paris: Paris, France, 2009; p. 18. [Google Scholar]
  64. Breesch, H.; Janssens, A. Performance evaluation of passive cooling in office buildings based on uncertainty and sensitivity analysis. Sol. Energy 2010, 84, 1453–1467. [Google Scholar] [CrossRef]
  65. Loutzenhiser, P.; Manz, H.; Felsmann, C.; Strachan, P.; Frank, T.; Maxwell, G. Empirical validation of models to compute solar irradiance on inclined surfaces for building energy simulation. Sol. Energy 2007, 81, 254–267. [Google Scholar] [CrossRef] [Green Version]
  66. Barbhuiya, S.; Barbhuiya, S. Thermal comfort and energy consumption in a UK educational building. Build. Environ. 2013, 68, 1–11. [Google Scholar] [CrossRef]
  67. Issa, M.A.A. Building Performance Simulation for Architects, Comparing Three Leading Simulation Tools; The University of Texas: San Antonio, TX, USA, 2018. [Google Scholar]
  68. Solmaz, A.S. A critical review on building performance simulation tools. Alam Cipta 2019, 12, 7–21. [Google Scholar]
  69. Galbraith, S.; Daniel, J.; Vissel, B. A Study of Clustered Data and Approaches to Its Analysis. J. Neurosci. 2010, 30, 10601–10608. [Google Scholar] [CrossRef]
  70. Shiel, P.; Tarantino, S.; Fischer, M. Parametric analysis of design stage building energy performance simulation models. Energy Build. 2018, 172, 78–93. [Google Scholar] [CrossRef]
  71. Naboni, E. Comparison of Conventional, Parametric and Evolutionary Optimization Approaches for the Architectural Design of Nearly Zero Energy Buildings. In Proceedings of the 13th Conference of International Building Performance Simulation Association, Chambéry, France, 26–28 August 2013; pp. 26–28. [Google Scholar]
  72. Ulukavak Harputlugil, G.; Hensen, J.; Wilde, P. Simulation as a Tool to Develop Guidelines for the Design of School Schemes for Four Climatic Regions of Turkiye; Tsinghua University: Beijing, China, 2007. [Google Scholar]
  73. Chen, P.Y. Correlation parametric and nonparametric measures. In Quantitative Applications in the Social Sciences; Popovich, P.M., Ed.; SAGE: Thousands Oaks, CA, USA, 2002. [Google Scholar]
  74. Hennig, C. Handbook of Cluster Analysis, 1st ed.; Meila, M., Murtagh, F., Rocci, R., Eds.; CRC Press: Boca Raton, FL, USA, 2015. [Google Scholar]
  75. Bansal, A.; Sharma, M.; Goel, S. Improved K-mean Clustering Algorithm for Prediction Analysis using Classification Technique in Data Mining. Int. J. Comput. Appl. 2017, 157, 35–40. [Google Scholar] [CrossRef]
  76. Conry, M.C. The Clustering of Health Behaviours in Ireland and Their Relationship with Mental Health, Self-Rated Health and Quality of Life; BMC Public Health: Berlin, Germany, 2011; Volume 11, p. 692. [Google Scholar]
  77. Gravetter, F.J.; Forzano, L.A.B. Research Methods for the Behavioral Sciences; Cengage Learning: Boston, MA, USA, 2011. [Google Scholar]
  78. Aye, L.; Charters, W.W.S.; Fandino, A.M.; Robinson, J.R.W. Thermal performance of sustainable energy features. Solar 2005, 2005, 1–10. [Google Scholar]
  79. Balbis-Morejón, M.; Rey-Hernández, J.; Amaris-Castilla, C.; Velasco-Gómez, E.; José-Alonso, J.S.; Rey-Martínez, F. Experimental Study and Analysis of Thermal Comfort in a University Campus Building in Tropical Climate. Sustainability 2020, 12, 8886. [Google Scholar] [CrossRef]
  80. Pellegrino, M.; Simonetti, M.; Chiesa, G. Reducing thermal discomfort and energy consumption of Indian residential buildings: Model validation by in-field measurements and simulation of low-cost interventions. Energy Build. 2016, 113, 145–158. [Google Scholar] [CrossRef]
  81. Kisilewicz, T. On the Role of External Walls in the Reduction of Energy Demand and the Mitigation of Human Thermal Discomfort. Sustainability 2019, 11, 1061. [Google Scholar] [CrossRef] [Green Version]
  82. DesignBuilder Software. Comfort Analysis. Available online: https://designbuilder.co.uk//helpv2/Content/Comfort_Analysis.htm (accessed on 2 February 2021).
  83. Santamaria, B.M.; Gonzalo, F.A.; Aguirregabiria, B.; Ramos, J.H. Evaluation of Thermal Comfort and Energy Consumption of Water Flow Glazing as a Radiant Heating and Cooling System: A Case Study of an Office Space. Sustainability 2020, 12, 7596. [Google Scholar] [CrossRef]
  84. Caetano, D.S.; Kalz, D.E.; Lomardo, L.L.; Rosa, L.P. Evaluation of thermal comfort and occupant satisfaction in office buildings in hot and humid climate regions by means of field surveys. Energy Procedia 2017, 115, 183–194. [Google Scholar] [CrossRef]
  85. Manache, G.; Melching, C. Sensitivity of latin hypercube sampling to sample size and distributional assumptions. In Proceedings of the 32nd Congress of the International Association of Hydraulic Engineering and Research, Venice, Italy, 1–6 July 2007. [Google Scholar]
  86. Budaiwi, I.; Abdou, A. HVAC system operational strategies for reduced energy consumption in buildings with intermittent occupancy: The case of mosques. Energy Convers. Manag. 2013, 73, 37–50. [Google Scholar] [CrossRef]
  87. Daghigh, R. Assessing the thermal comfort and ventilation in Malaysia and the surrounding regions. Renew. Sustain. Energy Rev. 2015, 48, 681–691. [Google Scholar] [CrossRef]
  88. Wang, X.; Kendrick, C.; Ogden, R.; Walliman, N.; Baiche, B. A case study on energy consumption and overheating for a UK industrial building with rooflights. Appl. Energy 2013, 104, 337–344. [Google Scholar] [CrossRef]
  89. Lapisa, R.; Karudin, A.; Martias, M.; Krismadinata, K.; Ambiyar, A.; Romani, Z.; Salagnac, P. Effect of skylight–roof ratio on warehouse building energy balance and thermal–visual comfort in hot-humid climate area. Asian J. Civ. Eng. 2020, 21, 915–923. [Google Scholar] [CrossRef]
  90. Gray, J.B.; Cook, R.D.; Weisberg, S. Applied Regression Including Computing and Graphics. Technometrics 2000, 42, 426. [Google Scholar] [CrossRef]
  91. Mishra, P.; Pandey, C.M.; Singh, U.; Gupta, A.; Sahu, C.; Keshri, A. Descriptive statistics and normality tests for sta-tistical data. Ann. Card. Anaesth. 2019, 22, 67–72. [Google Scholar] [CrossRef]
  92. Vetter, T.R. Descriptive statistics: Reporting the answers to the 5 basic questions of who, what, why, when, where, and a sixth, so what? Anesth. Analg. 2017, 125, 1797–1802. [Google Scholar] [CrossRef]
  93. Kaliyadan, F.; Kulkarni, V. Types of Variables, Descriptive Statistics, and Sample Size. Indian Dermatol. Online J. 2019, 10, 82–86. [Google Scholar] [CrossRef]
  94. Hirashima, S.D.S.; Katzschner, A.; Ferreira, D.G.; De Assis, E.S.; Katzschner, L. Thermal comfort comparison and evaluation in different climates. Urban Clim. 2018, 23, 219–230. [Google Scholar] [CrossRef]
  95. Eskin, N.; Türkmen, H. Analysis of annual heating and cooling energy requirements for office buildings in different climates in Turkey. Energy Build. 2008, 40, 763–773. [Google Scholar] [CrossRef]
  96. Fernández-Agüera, J.; Domínguez-Amarillo, S.; Sendra, J.J.; Suárez, R. An approach to modelling envelope airtightness in multi-family social housing in Mediterranean Europe based on the situation in Spain. Energy Build. 2016, 128, 236–253. [Google Scholar] [CrossRef]
  97. Fernández-Agüera, J.; Domínguez-Amarillo, S.; Alonso, C.; Martín-Consuegra, F. Thermal comfort and indoor air quality in low-income housing in Spain: The influence of airtightness and occupant behaviour. Energy Build. 2019, 199, 102–114. [Google Scholar] [CrossRef]
  98. Rodrigues, L.; Tubelo, R.; Pasos, A.V.; Gonçalves, J.C.S.; Wood, C.; Gillott, M. Quantifying airtightness in Brazilian residential buildings with focus on its contribution to thermal comfort. Build. Res. Inf. 2020, 49, 639–660. [Google Scholar] [CrossRef]
  99. Boslaugh, S. Statistics in a Nutshell, 2nd ed.; O’Reilly: Beijing, China, 2012. [Google Scholar]
  100. Schmider, E.; Ziegler, M.; Danay, E.; Beyer, L.; Bühner, M. Is It Really Robust? Methodology 2010, 6, 147–151. [Google Scholar] [CrossRef]
  101. Hopfe, C.J.; Hensen, J.L.M. Uncertainty analysis in building performance simulation for design support. Energy Build. 2011, 43, 2798–2805. [Google Scholar] [CrossRef] [Green Version]
  102. Pianosi, F.; Beven, K.; Freer, J.; Hall, J.W.; Rougier, J.; Stephenson, D.B.; Wagener, T. Sensitivity analysis of environmental models: A systematic review with practical workflow. Environ. Model. Softw. 2016, 79, 214–232. [Google Scholar] [CrossRef]
  103. Gray, J. Applied Regression Analysis, Linear Models, and Related Methods; Sage Publications, Inc.: Thousands Oaks, CA, USA, 2012; Volume 40. [Google Scholar]
  104. Tan, J.; Cui, Y.; Luo, Y. Assessment of uncertainty and sensitivity analyses for ORYZA model under different ranges of parameter variation. Eur. J. Agron. 2017, 91, 54–62. [Google Scholar] [CrossRef]
  105. Gupta, S.K. The relevance of confidence interval and P-value in inferential statistics. Indian J. Pharmacol. 2012, 44, 143–144. [Google Scholar] [CrossRef] [Green Version]
  106. Chen, J. Advanced Technical Analysis Concepts-Rate of Change (ROC). Available online: https://www.investopedia.com/terms/r/rateofchange.asp (accessed on 20 May 2020).
  107. Kazanci, O.; Toftum, J.; Olesen, B.W. Effect of set-point variation on thermal comfort and energy use in a plus-energy dwelling. In Proceedings of the 9th Windsor Conference: Making Comfort Relevant, Windsor, UK, 7–10 April 2016. [Google Scholar]
  108. Hoyt, T.; Arens, E.; Zhang, H. Extending air temperature setpoints: Simulated energy savings and design considerations for new and retrofit buildings. Build. Environ. 2015, 88, 89–96. [Google Scholar] [CrossRef] [Green Version]
  109. Sadineni, S.B.; Madala, S.; Boehm, R.F. Passive building energy savings: A review of building envelope components. Renew. Sustain. Energy Rev. 2011, 15, 3617–3631. [Google Scholar] [CrossRef]
  110. Hashemi, A.; Cruickshank, H.; Cheshmehzangi, A. Improving thermal comfort in low-income tropical housing: The case of Uganda. In Proceedings of the ZEMCH 2015 International Conference, Bari & Lecce, Italy, 21–25 September 2015. [Google Scholar]
  111. Reilly, A.; Kinnane, O. The impact of thermal mass on building energy consumption. Appl. Energy 2017, 198, 108–121. [Google Scholar] [CrossRef] [Green Version]
  112. Balaras, C. The role of thermal mass on the cooling load of buildings. An overview of computational methods. Energy Build. 1996, 24, 1–10. [Google Scholar] [CrossRef]
  113. Bikas, D.; Chastas, P. The Effect of the U Value in the Energy Performance of Residential Buildings in Greece. J. Sustain. Arch. Civ. Eng. 2014, 6, 58–65. [Google Scholar] [CrossRef]
  114. Kumar, A.; Suman, B. Experimental evaluation of insulation materials for walls and roofs and their impact on indoor thermal comfort under composite climate. Build. Environ. 2013, 59, 635–643. [Google Scholar] [CrossRef]
  115. Christian, J.E.; Kosny, J. Thermal performance and wall ratings. ASHRAE J. 1996, 38, 3. [Google Scholar]
  116. Lyons, P.R.; Arasteh, D.; Huizenga, C. Window performance for human thermal comfort. Trans. Am. Soc. Heat. Refrig. Air Cond. Eng. 2000, 106, 594–604. [Google Scholar]
  117. Ralegaonkar, R.; Gupta, R. Review of intelligent building construction: A passive solar architecture approach. Renew. Sustain. Energy Rev. 2010, 14, 2238–2242. [Google Scholar] [CrossRef]
  118. Singh, M.; Garg, S. Energy rating of different glazings for Indian climates. Energy 2009, 34, 1986–1992. [Google Scholar] [CrossRef]
  119. Liping, W.; Hien, W.N. The impacts of ventilation strategies and facade on indoor thermal environment for naturally ventilated residential buildings in Singapore. Build. Environ. 2007, 42, 4006–4015. [Google Scholar] [CrossRef]
  120. Al-Tamimi, N.A.M. Impact of Building Envelope Modifications on the Thermal Performance of Glazed High-Rise Residential Buildings in the Tropics; University Science Malaysia: Penang, Malaysia, 2011. [Google Scholar]
  121. Pathirana, S.; Rodrigo, A.; Halwatura, R. Effect of building shape, orientation, window to wall ratios and zones on energy efficiency and thermal comfort of naturally ventilated houses in tropical climate. Int. J. Energy Environ. Eng. 2019, 10, 107–120. [Google Scholar] [CrossRef]
  122. Gugliermetti, F.; Bisegna, F. Daylighting with external shading devices: Design and simulation algorithms. Build. Environ. 2006, 41, 136–149. [Google Scholar] [CrossRef]
  123. Al-Tamimi, N.A.; Fadzil, S.F.S. The Potential of Shading Devices for Temperature Reduction in High.-Rise Residential Buildings in the Tropics. Proc. Eng. 2011, 21, 273–282. [Google Scholar] [CrossRef] [Green Version]
  124. Mjörnell, K.; Johansson, D.; Bagge, H. The Effect of High Occupancy Density on IAQ, Moisture Conditions and Energy Use in Apartments. Energies 2019, 12, 4454. [Google Scholar] [CrossRef] [Green Version]
  125. Elsharkawy, H.; Zahiri, S. The significance of occupancy profiles in determining post retrofit indoor thermal comfort, overheating risk and building energy performance. Build. Environ. 2020, 172, 106676. [Google Scholar] [CrossRef]
  126. Sfakianaki, A.; Pavlou, K.; Santamouris, M.; Livada, I.; Assimakopoulos, M.-N.; Mantas, P.; Christakopoulos, A. Air tightness measurements of residential houses in Athens, Greece. Build. Environ. 2008, 43, 398–405. [Google Scholar] [CrossRef]
  127. Faria, L.C.D.; Romero, M.D.A.; Porras-Amores, C.; Pirró, L.F.D.S.; Saez, P.V. Prediction of the Impact of Air Speed Produced by a Mechanical Fan and Operative Temperature on the Thermal Sensation. Buildings 2022, 12, 101. [Google Scholar] [CrossRef]
  128. Younes, C.; Shdid, C.A.; Bitsuamlak, G. Air infiltration through building envelopes: A review. J. Build. Phys. 2011, 35, 267–302. [Google Scholar] [CrossRef]
  129. Kent, R. Chapter 7-Buildings and Offices. In Energy Management in Plastics Processing, 3rd ed.; Kent, R., Ed.; Elsevier: Amsterdam, The Netherlands, 2018; pp. 345–370. [Google Scholar]
  130. Franco, A.; Schito, E. Definition of Optimal Ventilation Rates for Balancing Comfort and Energy Use in Indoor Spaces Using CO2 Concentration Data. Building 2020, 10, 135. [Google Scholar] [CrossRef]
  131. Maddalena, R.; Mendell, M.J.; Eliseeva, K.; Chan, W.; Sullivan, D.P.; Russell, M.; Satish, U.; Fisk, W.J. Effects of ventilation rate per person and per floor area on perceived air quality, sick building syndrome symptoms, and decision-making. Indoor Air 2015, 25, 362–370. [Google Scholar] [CrossRef] [PubMed]
  132. Allab, Y.; Kindinis, A.; Causone, F.; Tatti, A.; Simonet, S.; Bayeul-Lainé, A. Ventilation Rates and Thermal Comfort Assessment in a Naturally Ventilated Classroom; Aalborg University: Aalborg, Denmark, 2016. [Google Scholar]
  133. Wouters, P.; Barles, P.; Blomsterberg, Å.; Bulsing, P.; De Gids, W.; Delmotte, C.; Faÿsse, J.C.; Filleux, C.; Hardegger, P.; Leal, V.; et al. Towards Improved Performances of Mechanical Ventilation Systems. Tip-Vent Project, EC Joule. Research Funded by The European Commission in the framework of Non Nuclear Enery Programme, Joule IV. 2001. Available online: https://www.researchgate.net/publication/313573886_Towards_improved_performances_of_mechanical_ventilation_systems (accessed on 10 February 2019).
  134. Ahsanullah, S.I.; Van Zandt, S. The impact of zoning regulations on thermal comfort in non-conditioned housing in hot, humid climates: Findings from Dhaka, Bangladesh. Neth. J. Hous. Built Environ. 2014, 29, 677–697. [Google Scholar] [CrossRef]
  135. Albatayneh, A.; Alterman, D.; Page, A.; Moghtaderi, B. The Significance of the Orientation on the Overall buildings Thermal Performance-Case Study in Australia. Energy Procedia 2018, 152, 372–377. [Google Scholar] [CrossRef]
Figure 1. Illustration of the methodology for processing the MC technique and statistical analysis by using the BES tool and SPSS software.
Buildings 12 00329 g001
Figure 2. Classroom (a) ground floor plan of selected educational building (1:35 scale) (b) interior settings.
Buildings 12 00329 g002
Figure 3. Base case geometric model in DesignBuilder simulation (1:20 scale).
Buildings 12 00329 g003
Figure 4. UA results (a) distribution of total energy consumption. (b) Distribution of total thermal discomfort hours.
Buildings 12 00329 g004
Figure 5. The effect of cooling set-point temperature on (a) energy consumption. (b) Students thermal discomfort hours.
Buildings 12 00329 g005aBuildings 12 00329 g005b
Figure 6. The effect of heating set-point temperature on (a) energy consumption. (b) Students thermal discomfort hours.
Buildings 12 00329 g006
Figure 7. The effect of U-Value of external wall construction on (a) energy consumption. (b) Students’ thermal discomfort hours.
Buildings 12 00329 g007aBuildings 12 00329 g007b
Figure 8. The effect of U-value of roof construction on (a) energy consumption and (b) students’ thermal discomfort hours.
Buildings 12 00329 g008
Figure 9. The effect of glazing type on (a) energy consumption and (b) students’ thermal discomfort hours.
Buildings 12 00329 g009
Figure 10. The effect of window to wall ratio on (a) energy consumption and (b) students’ thermal discomfort hours.
Buildings 12 00329 g010
Figure 11. The effect of shading types on (a) energy consumption (b) students’ thermal discomfort hours. Legend. 1: 0.5 projection Louvre, 2: 1.0 projection Louvre, 3: 1.5 projection Louvre, 4: No shading, 5: 0.5 m Overhang, 6: 1.0 m Overhang, 7: 1.5 m Overhang, 8: 2.0 m Overhang.
Buildings 12 00329 g011
Figure 12. The effect of occupancy density on (a) energy consumption and (b) students’ thermal discomfort hours.
Buildings 12 00329 g012aBuildings 12 00329 g012b
Figure 13. The effect of infiltration rate on (a) energy consumption and (b) students’ thermal discomfort hours.
Buildings 12 00329 g013
Figure 14. The effect of mechanical ventilation rate per area on (a) energy consumption and (b) students’ thermal discomfort hours.
Buildings 12 00329 g014
Figure 15. The effect of building orientation on (a) energy consumption and (b) students’ thermal discomfort hours.
Buildings 12 00329 g015
Figure 16. Normal distribution of (a) students’ discomfort hours and (b) building energy consumption.
Buildings 12 00329 g016
Figure 17. Correlation results.
Buildings 12 00329 g017
Figure 18. Cluster specification for each group.
Buildings 12 00329 g018
Figure 19. Clustering groups analysis.
Buildings 12 00329 g019
Table 3. The relative importance of the different variables based on regression analysis.
The Extent of the ImpactABDPsOutput 1
Thermal Discomfort Hours
ABDPsOutput 2 Energy
Consumption
SRCp-ValueSRCp-Value
Buildings 12 00329 i001Cooling set-point temperature (°C)0.57050.0000 *Cooling set-point temperature (°C)−0.69260.0000 *
Flat roof construction−0.43170.0000 *Flat roof construction−0.40860.0000 *
Heating set-point temperature (°C)−0.33890.0000 *Heating set-point temperature (°C)0.18520.0000 *
Occupancy density (people/m2)−0.05010.0006 *External wall construction0.05530.0001 *
Glazing type−0.04090.0049 *
Mech. vent rate per area (l/s/m2)0.03450.0178 *Infiltration (ac/h)0.05250.0001 *
Infiltration (ac/h)0.03190.0282 *Window to wall ratio (%)0.05190.0001 *
Occupancy density (people/m2)0.04720.0006 *
Crack template (airtightness)−0.02720.0612Crack template (airtightness)−0.02140.1165
External wall construction0.02590.0749Roof window opens ratio (%)−0.02140.1166
Building orientation (°)0.01760.2270Thermal mass−0.01570.2478
Window to wall
ratio (%)
−0.01620.2646Building rotation (°)0.01290.3436
Local shading type−0.00870.5496Mech. vent rate per area (l/s-m2)0.00990.4695
Thermal mass−0.00610.6743Location template−0.00970.4744
Location template−0.00280.8472Local shading type−0.00850.5306
Roof window opens (%)−0.00270.8531Glazing type0.00290.8302
Note: * p-value less than 0.05 has highly statistically significant effect.
Table 4. Summary output of Pearson analysis.
Correlations
Discomfort (All Clothing) (h)Total Site Energy Consumption (kWh)
Discomfort (All Clothing) (h)Pearson Correlation1−0.033
Sig. (2-tailed)-0.153
N18451845
Total site energy consumption (kWh)Pearson Correlation−0.0331
Sig. (2-tailed)0.153-
N18451845
Publisher’s Note: MDPI stays neutral with regard to jurisdictional claims in published maps and institutional affiliations.

