
Thermal Characteristics of Fireproof Plaster Compositions in Exposure to Various Regimes of Fire


1
Peter the Great St. Petersburg Polytechnic University, 195251 St. Petersburg, Russia
2
PROZASK, 107564 Moscow, Russia
3
Research Center of Hazardous Fire Factors, 188691 St. Petersburg, Russia
*
Author to whom correspondence should be addressed.
Buildings 2022, 12(5), 630; https://0-doi-org.brum.beds.ac.uk/10.3390/buildings12050630
Submission received: 18 March 2022
/
Revised: 2 May 2022
/
Accepted: 5 May 2022
/
Published: 9 May 2022
(This article belongs to the Special Issue Fire Risk in the Built Environment: Design, Simulation and Innovative Safety Measures)
Abstract
:The problems of the fire safety of oil and gas facilities are particularly relevant due to the increasing complexity of technological processes and production. Experimental studies of steel structures with three different types of plasters are presented to determine the time taken to reach the critical temperature and loss of bearing capacity (R) of the sample, as a result of reaching a rate of deformation growth of more than 10 mm/min and the appearance of the ultimate vertical deformation. The simulation of the heating of steel structures showed a good correlation with the results of the experiment. The consumption of the plaster composition for the steel column was predicted, which allowed a 38% reduction in the consumption of fireproofing. It was found that to obtain the required fire resistance limit, it is necessary to consider the fire regime and apply plaster compositions with a thickness of 30–35 mm, depending on their thermal characteristics. The dependence of thermal conductivity and temperature on density is obtained, showing that the use of plaster compositions with a density of 200 to 600 kg/m3 is optimal to ensure a higher fire resistance limit. It is shown that the values of thermal conductivity of plaster compositions at 1000 °C are higher by 8–10% if the structure is exposed to a hydrocarbon fire regime. It is shown that the values of the heat capacity of plaster compositions at 1000 °C are higher by 10–15% if the structure is exposed to a standard fire regime.
1. Introduction
The accelerated pace and increase in production processes, as well as urbanization in modern conditions, are inseparably connected with the use of energy-intensive technologies and hazardous substances that increase the potential threat to human health and life, the environment and the material base of production [1,2]. The number of technological accidents and disasters, among which the leading position is occupied by fires, is constantly growing, so today most developed countries, including Russia, are moving to a security strategy based on the principles of the prediction and prevention of technological accidents [3,4,5].
Oil and gas facilities are characterized by the presence and handling in large quantities of explosive and flammable materials and substances, technological equipment and pipelines, the lack of a sufficient number of fire breaks and significant horizontal and vertical dimensions, which increase the probability of fire in emergency situations [6,7,8]. It is quite common for oil and gas facilities to be located near settlements, or near urban areas. Accidents with fires and explosions on offshore oil and gas platforms can lead to catastrophic consequences, the elimination of which may require the involvement of forces and resources at the level of one or even several states [9,10].
Fire tests do not provide clear information about the thermal properties of materials in a fire, since the temperature values during the fire exposure are mostly recorded. The development and improvement of methods for assessing the fire risk for substances used in oil and gas facilities allows more accurate prediction of the consequences of fires and explosions, and the provision of the necessary protective measures [11,12]. Software packages have the ability to solve thermal engineering problems, including the provision of the required fire resistance limit, calculated under “parametric,” standard and hydrocarbon fire regimes, under the action of the design load and calculation of the necessary and sufficient amount of fire protection [13]. The main temperature-dependent properties required for thermal modeling are thermal conductivity, specific heat capacity and density. The numerical simulation requires the introduction of correct input data on material properties and boundary conditions to obtain realistic results of structure heating. For example, in [14], it is recommended for the second kind of boundary conditions to take the convective heat transfer coefficient for the standard temperature regime, 25 W/m2·K, and for the hydrocarbon regime, 50 W/m2·K.
The steel structures of oil and gas facilities in an accident accompanied by fire and explosion are subjected to high temperature and overpressure according to the hydrocarbon regime, at which, in the first minutes of the fire, the temperature reaches 1000 °C and above [15]. The steel structure strength becomes drastically lower within the range of 400–600 °C, while in the case of an applied load, the unprotected structure almost immediately loses its stability. For this reason, structures that can withstand higher temperatures and blast shock-waves, i.e., those protected with fireproofing, must be used at hazardous facilities.
Methods of fire protection are selected not only taking into account the required fire resistance limit of the steel structure, type of load, but also taking into account the temperature and humidity conditions of operation and production of fire protection works. Based on the analysis of scientific and technical literature [16,17,18,19], there are three ways of protecting steel structures against fire: the application of intumescent coatings, plaster compositions or the use of structural fire protection. Figure 1 shows a scheme of the means and methods of the fire protection of steel structures [20].
Structural fire protection is often used in harsh climates. For example, in [20], tests of steel structures with structural fire protection on the example of super-thin basalt fibers in the Arctic region were demonstrated; the evaluation of various means of fire protection was carried out, the results of which showed that the most effective coatings for harsh Arctic conditions are materials containing super-thin basalt fibers. In [21], studies on structural fire protection used to increase the fire resistance limit of building structures used in oil and gas facilities are presented. Intumescent coatings based on epoxy binders, which have resistance to chemical and climatic influences, and, when the temperature rises, swell up, forming a foamcoke that protects the structure. Intumescent coatings, considered a form of passive fire protection for steel structures, have proven their durability and reliability under hydrocarbon fire regimes in marine conditions over many years. In [22], it is shown that intumescent coatings are one of the effective means of passive fire protection of steel structures in conditions of increased risk to the objects of the oil and gas facilities and offshore platforms. In [23], a hydrocarbon fire test of a steel panel is given to evaluate the charring strength of intumescent coatings based on silicone and epoxy resin.
The third method of fire protection of metal structures is the use of plaster compositions with a thickness of 25–60 mm, recommended for use in dry areas (with relative humidity less than 65%), applied on a steel mesh and used to increase the fire resistance limit of metal structures up to 2 h or more (Figure 2). This study considers the building structures used inside the oil and gas facilities, to ensure the required fire resistance limit for which plaster compositions are used.
Fireproof plaster compositions are made on the basis of silicate liquid glass, building plaster, aluminous cement, on Portland cements. Expanded or unexpanded vermiculite, perlite, diatomite, crackle, volcanic pumice, volcanic tuff, etc., are used as an aggregate. Fibrous fillers are also used, such as kaolin wool and other mineral fibers and asbestos [24,25].
In [26], tests of high-density clay and lime plaster compositions applied to wooden structures are demonstrated to determine their thermal properties under standard temperature regime. Experimental studies are confirmed by numerical simulations. The results demonstrate the low fire retardant effectiveness of clay and lime plaster. The study [27] aims to provide an overview of the fire tests conducted, accompanied by studies of the thermal properties of clay and lime plaster as a fire retardant material for wood. In [28], the dependence of the thermal conductivity of powder plaster on the temperature of the heating cylinder is considered, which demonstrates a decrease in thermal conductivity between 50 °C and 110 °C and a further increase in its values. In [29], experimental studies of the properties of perlite plaster, gypsum fireproof boards and intumescent coatings for steel elements exposed to natural fire with a heating rate and subsequent cooling of 10 K/min and 20 K/min are presented; the specific heat capacity and thermal conductivity of the selected fireproof materials are investigated. In [30], the thermal characteristics of gypsum plaster using polystyrene as an aggregate were studied; it was shown that the thermal conductivity of plaster compositions is decreased by reducing the density. In [31], steel I-sections with a plaster fireproofing coating were tested under a hydrocarbon fire regime with a fire protection efficiency of 120 min; temperature dependencies throughout the fire test were obtained without determining the thermal characteristics of the plaster. In [32], a comparative analysis of various types of fireproof plaster is conducted on the following parameters: chemical composition, fire resistance, strength, density and layer thickness, and the prospects for the development of gypsum fireproof compositions are predicted. Thus, the thermal characteristics of the plasters obtained as a result of studies to determine the possibility of their use as a fire-retardant material differ not only in values over the duration of the fire exposure, but also in the dynamics of growth. Nevertheless, thermal characteristics are necessary to predict the behavior of structures under exposure to various fire regimes.
The purpose of this article is to simulate experimental data for determining the fire resistance limits of load-bearing steel structures, coated with plaster fireproofing compositions, under the exposure to standard and hydrocarbon fire regimes to obtain the calculated thermal characteristics of plaster coatings, to predict the fire resistance limits of steel structures and deformations under the combined action of constant static and thermal loads.
2. Materials and Methods
In this paper, experimental studies of three types of plaster compositions, each of which is a mixture of Portland cement, vermiculite and other binders with target additives and fillers: “Ignis-Lite“ (PROZASK LTD), “Monocot“ (Krilak LTD) and “Cafco Fendolite MII” (Isolatek International) were conducted. These plaster compositions are often used as fire protection on the steel structures of oil and gas facilities.
Tests of experimental samples (“Ignis-Lite“—samples No. 1.1 and No. 1.2 and “Monocot“—sample No. 2.1) to determine the time taken to reach a critical state in the process of four-sided fire exposure were carried out under the conditions of a furnace chamber of the standard temperature regime according to ISO 834 [33], characterized by dependence (1):
where T means the temperature inside the furnace in °C, corresponding to the relevant time t; T0 is the temperature in °C inside the furnace prior to the start of heat impact; t is the time in minutes from the start of the test.
Tests of experimental samples (“Ignis-Lite”—sample No. 1.3, “Monocot”—sample No. 2.2 and “Cafco Fendolite MII”—samples No. 3.1 and No. 3.2) to determine the time taken to reach a critical state in the process of four-sided fire exposure were carried out under the conditions of a furnace chamber of the hydrocarbon temperature regime according to EN 1363–2: 1999 [34], characterized by dependence (2):
The furnace chamber temperature was measured by means of thermoelectric transducers with a switching head uniformly distributed along the height of the sample in five places, and on the test samples the temperature was measured by three-cable thermoelectric chromel–alumel thermocouples, installed in the middle of the height of the test sample.
For samples No. 1.1–No. 1.3 an No. 3.1–No. 3.2, which are load-bearing vertical structures, the limiting condition in the fire resistance test was the loss of bearing capacity (R) due to the collapse of the structure or the appearance of limit deformations [35]. Tests for samples with coatings No. 2.1 and No. 2.2 were conducted until the limit state, characterized by reaching the critical temperature of the steel of the sample, equal to 500 °C (average temperature of three thermocouples). The preparation of samples for tests, conditions of fire tests, determination of limiting states of structures and evaluation of the results of the experiments are regulated in [33]. The tests were carried out in the testing laboratory of FGBU VNIIPO EMERCOM of Russia (Balashikha, Moscow, Russia).
The vertical deformation of the test samples during both loading and testing was measured with a deflectometer.
Numerical simulations are used to evaluate the methodology, predict the behavior of building structures, obtain temperature distributions, stress and strain fields [36,37,38,39]. Generally, the numerical model will first be validated with experimental data and then analyzed to better understand the performance of the structure under both mechanical and fire conditions. The software package (SP) ELCUT [40] was used to simulate the thermophysical processes of the steel structures under consideration, in which the possibility of the numerical simulation of fire resistance of structures has been repeatedly confirmed by the authors of scientific papers. For example, in [37] the temperature fields during fire exposure of modern windows and facade glazing elements are considered; it is shown that ELCUT makes it possible to predict the behavior of building structures at elevated temperatures and to show the temperature distributions and stress fields. In [38], a simulation of heating of offshore stationary platform structures in SP ELCUT is given, which showed good correlation with the experimental data; the consumption of mineral slabs for the bulkhead structure is predicted and the parameters of thermal conductivity and the heat capacity of the applied fire protection in the temperature range from 0 to 1000 °C are specified. In [39], the results of large-scale fire tests of lightweight thin-walled steel structures for fire protection efficiency in the SP ELCUT are presented. As a result, temperature–time curves of metal structures in the standard fire regime were obtained, which showed a good correlation between the simulation and the experimental data.
2.1. Experiments on Steel Structures
Experimental studies of steel structures with three different types of plasters are given. Experimental samples with coatings No. 1.1–No. 1.3 were identical structures with different thicknesses of the applied plaster coating, tested under the impact of standard and hydrocarbon fire regimes. Two identical experiments were conducted to confirm the results obtained under the conditions of a standard fire regime in the furnace fire chamber for samples with coatings No. 1.1 and No. 1.2. Experimental samples with coatings No. 2.1 and No. 2.2 were identical structures with different thicknesses of the applied plaster coating, tested under the impact of standard and hydrocarbon fire regimes, respectively. Experimental samples with coatings No. 3.1 and No. 3.2 were identical structures with different thicknesses of the applied plaster coating, tested under the impact of hydrocarbon fire regime. Two identical experiments were conducted to confirm the results obtained under the condition of creating a hydrocarbon fire regime in the furnace fire chamber for samples with coatings No. 3.1 and No. 3.2. The main parameters of samples with plaster compositions are shown in Table 1.
According to [43], test samples with coatings No. 1.1, No. 1.2 and No. 1.3 were equipped with support plates with a thickness of 40 mm and tested under a constant static load equal to 195.22 kN (19.9 tf), as specified by the customer, under the condition of vertical compression with hinged support on one side and rigid fixing on the other side of the column. The test load on the samples was set 30 min before the test and was kept constant during the whole time of the experiment.
According to the customer’s requirements, tests for samples with coatings No. 3.1 and 3.2 were carried out under constant static load equal to 294 kN (30 tf) under the condition of vertical compression with hinged support on one side and rigid fixing on the other side of the column. The test load on the samples was set 60 min before the test and was kept constant during the whole time of the experiment.
2.2. Simulation in SP ELCUT
As a simulation tool, the program SP ELCUT is used, which allows the heat sources to be set in blocks, edges or individual vertexes of the model by the finite element method.
In the simulation of heating, the thermal conductivity equation is used in the flat case (3) [44]:
where is the temperature in °C; is the time in seconds; means the components of the thermal conductivity tensor in W/(m·K); is the specific power of heat source, determined by the Fourier’s law, in W/m3; is the specific heat capacity in J/(kg·K); and is the density in kg/m3.
A number of boundary conditions, such as temperature, heat flow, convection and radiation, are set at the outer and inner boundaries of the computational domain. The value of is given as a linear function of coordinates. The heat flow is described by the following relations (4) and (5) [40]:
where is the normal component of the density vector of heat flow, where “+” and “−” mean “left of the border” and “right of the border,” respectively, in W/m2; is the power surface of the source for the inner border and for the outer, the known value of heat flow through the border in W/m2.
Convective heat transfer is determined according to (6) [14]:
where is the convective heat transfer coefficient in W/m2·K; is the ambient temperature in K.
The radiation condition is set at the outer border of the model; the radiation heat transfer is determined according to (7) [40]:
where is the Stefan–Boltzmann constant in W/(m2·K4); is the surface absorption coefficient; and is the temperature of an absorbing medium in K.
Initial steel characteristics: steel grade C245 [45]; density 7800 kg/m3; thermal conductivity and heat capacity are variable depending on temperature (values are taken from the program reference book).
The boundary conditions are presented in Table 2.
The characteristics of the plaster compositions for steel columns used under standard and hydrocarbon temperature regimes are presented in Table 3. It is assumed that the density value is taken according to the manufacturer’s information and does not change during heating.
3. Results and Discussion
3.1. Results of Experiments on Steel Structures
The fire resistance limit of the sample with coating No. 1.1 was reached at the 195th minute of fire exposure, due to the loss of its load-bearing capacity (R), as a result of reaching a rate of deformation growth of more than 10 mm/min and the appearance of the limit vertical deformation (more than 27 mm), which was 80.5 mm at the end of the fire exposure. According to the customer’s requirements, the testing of the sample with coating No. 1.2 was stopped at the 183rd minute of fire exposure, and the limit state for the load-bearing capacity of the structure (R) was not reached by the sample. At the end of the test, the vertical deformation of the sample with coating No. 1.2 was 7.9 mm. The average temperature of the thermocouples installed on the surface of the steel columns was 720 °C (for sample with coating No. 1.1) and 680 °C (for sample with coating No. 1.2). No external changes in the condition of the fire retardant coatings were recorded (Figure 3). According to the test results, it was found that the fire resistance limit of the 40H-beam steel I-beam section columns with a height of 2700 mm and with coatings No. 1.1 and No. 1.2, with an average thickness of the dry coating layer of 32 mm tested under the constant static load equal to 195.22 kN (19.9 tf), subject to creation of standard temperature conditions in the fire chamber, is at least 183 min, which corresponds to the classification R 180.
According to the customer’s requirements, the testing of the sample with coating No. 1.3 was stopped at the 123rd minute of fire exposure, and the limit state for the load-bearing capacity of the structure (R) was not reached by the sample. At the end of the test, the vertical deformation of the sample with coating No. 1.3 was 13.2 mm. The average temperature of the thermocouples installed on the surface of the steel columns was 474 °C. No external changes in the condition of the flame retardant coating were recorded. According to the test results, it was found that fire resistance limit of the 40H-beam steel I-beam section column with a height of 2700 mm and with coating No. 1.3, with an average thickness of the dry coating layer of 32 mm tested under the constant static load equal to 195.22 kN (19.9 tf), subject to creation of hydrocarbon temperature conditions in the fire chamber, is at least 123 min, which corresponds to the classification R 120.
The fire resistance limit of the sample with coating No. 2.1 was reached at the 121st minute of fire exposure, as it reached a critical temperature of 500 °C. During the test, no visible changes in the external condition of the flame retardant coating were recorded. According to the test results, it was found that fire resistance limit of the 50B2 steel I-beam section column with a height of 1700 mm and with coating No. 2.1, with an average thickness of the dry coating layer of 33 mm tested under standard temperature conditions is at least 123 min, which corresponds to the classification R 120.
The sample with coating No. 2.2 was not recorded reaching the critical temperature of 500 °C; the test was completed according to the customer’s requirements. During the test, no visible changes in the external condition of the flame retardant coating were recorded. At the end of the test, the average temperature of the thermocouples installed on the surface of the steel columns was 215 °C. According to the test results, it was found that fire resistance limit of the 50B2 steel I-beam section column with a height of 1700 mm and with coating No. 2.2, with an average thickness of the dry coating layer of 47 mm tested under hydrocarbon temperature conditions is at least 125 min, which corresponds to the classification R 120.
The fire resistance limit of the sample with coating No. 3.1 was reached at the 124th minute of fire exposure, due to the loss of its load-bearing capacity (R), as a result of reaching a rate of deformation growth of more than 10 mm/min and the appearance of the limit vertical deformation (more than 30 mm), which was 45 mm at the end of the fire exposure. The fire resistance limit of the sample with coating No. 3.2 was reached at the 126th minute of fire exposure, due to the loss of its load-bearing capacity (R), as a result of reaching the rate of deformation growth of more than 10 mm/min and the appearance of the limit vertical deformation (more than 30 mm), which was 38 mm at the end of the fire exposure. At the time the test samples reached the limit state for loss of load-bearing capacity (R), the average temperature on the thermocouples installed on the surface of the steel columns was 710 °C (for the sample with coating No. 3.1) and 707 °C (for the sample with coating No. 3.2). According to the test results, it was found that fire resistance limit of the 30K1 steel I-beam section column with a height of 3000 mm and with coatings No. 3.1 and No. 3.2, with an average thickness of the dry coating layer of 30 mm tested under the constant static load equal to 294 kN (30 tf), subject to the hydrocarbon temperature conditions in the fire chamber, is at least 124 and 126 min, which corresponds to the classification R 120.
Figure 4 shows the time–temperature and deformation curves of steel columns with plaster compositions under standard and hydrocarbon regimes during the fire test. The graph shows the averaged values of thermocouple values, located in the middle of the height of the test samples. According to the results of the experimental study of samples, it is clear that in the period from 25 to 50 min there is a brightly defined area of evaporation [46].
3.2. Results of Simulation in SP ELCUT
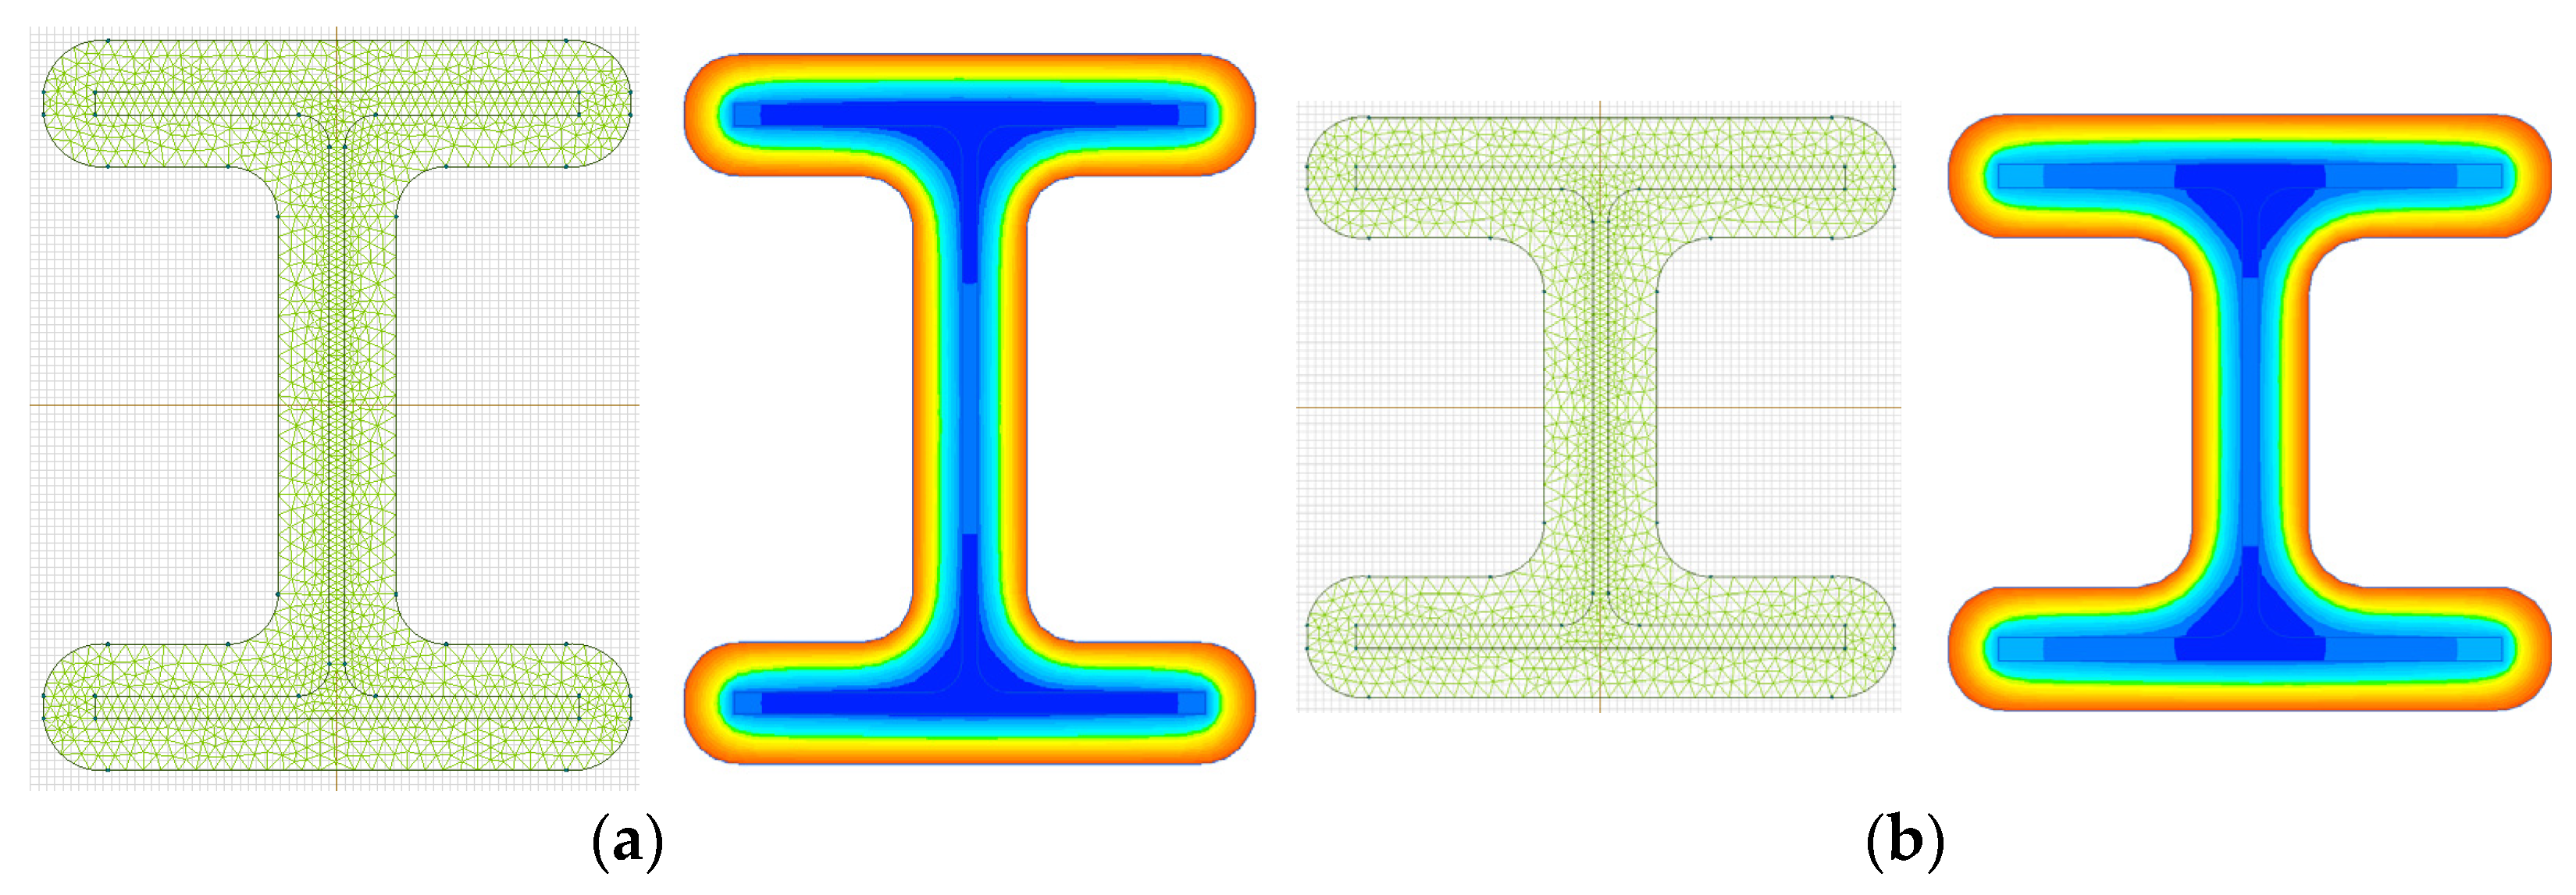
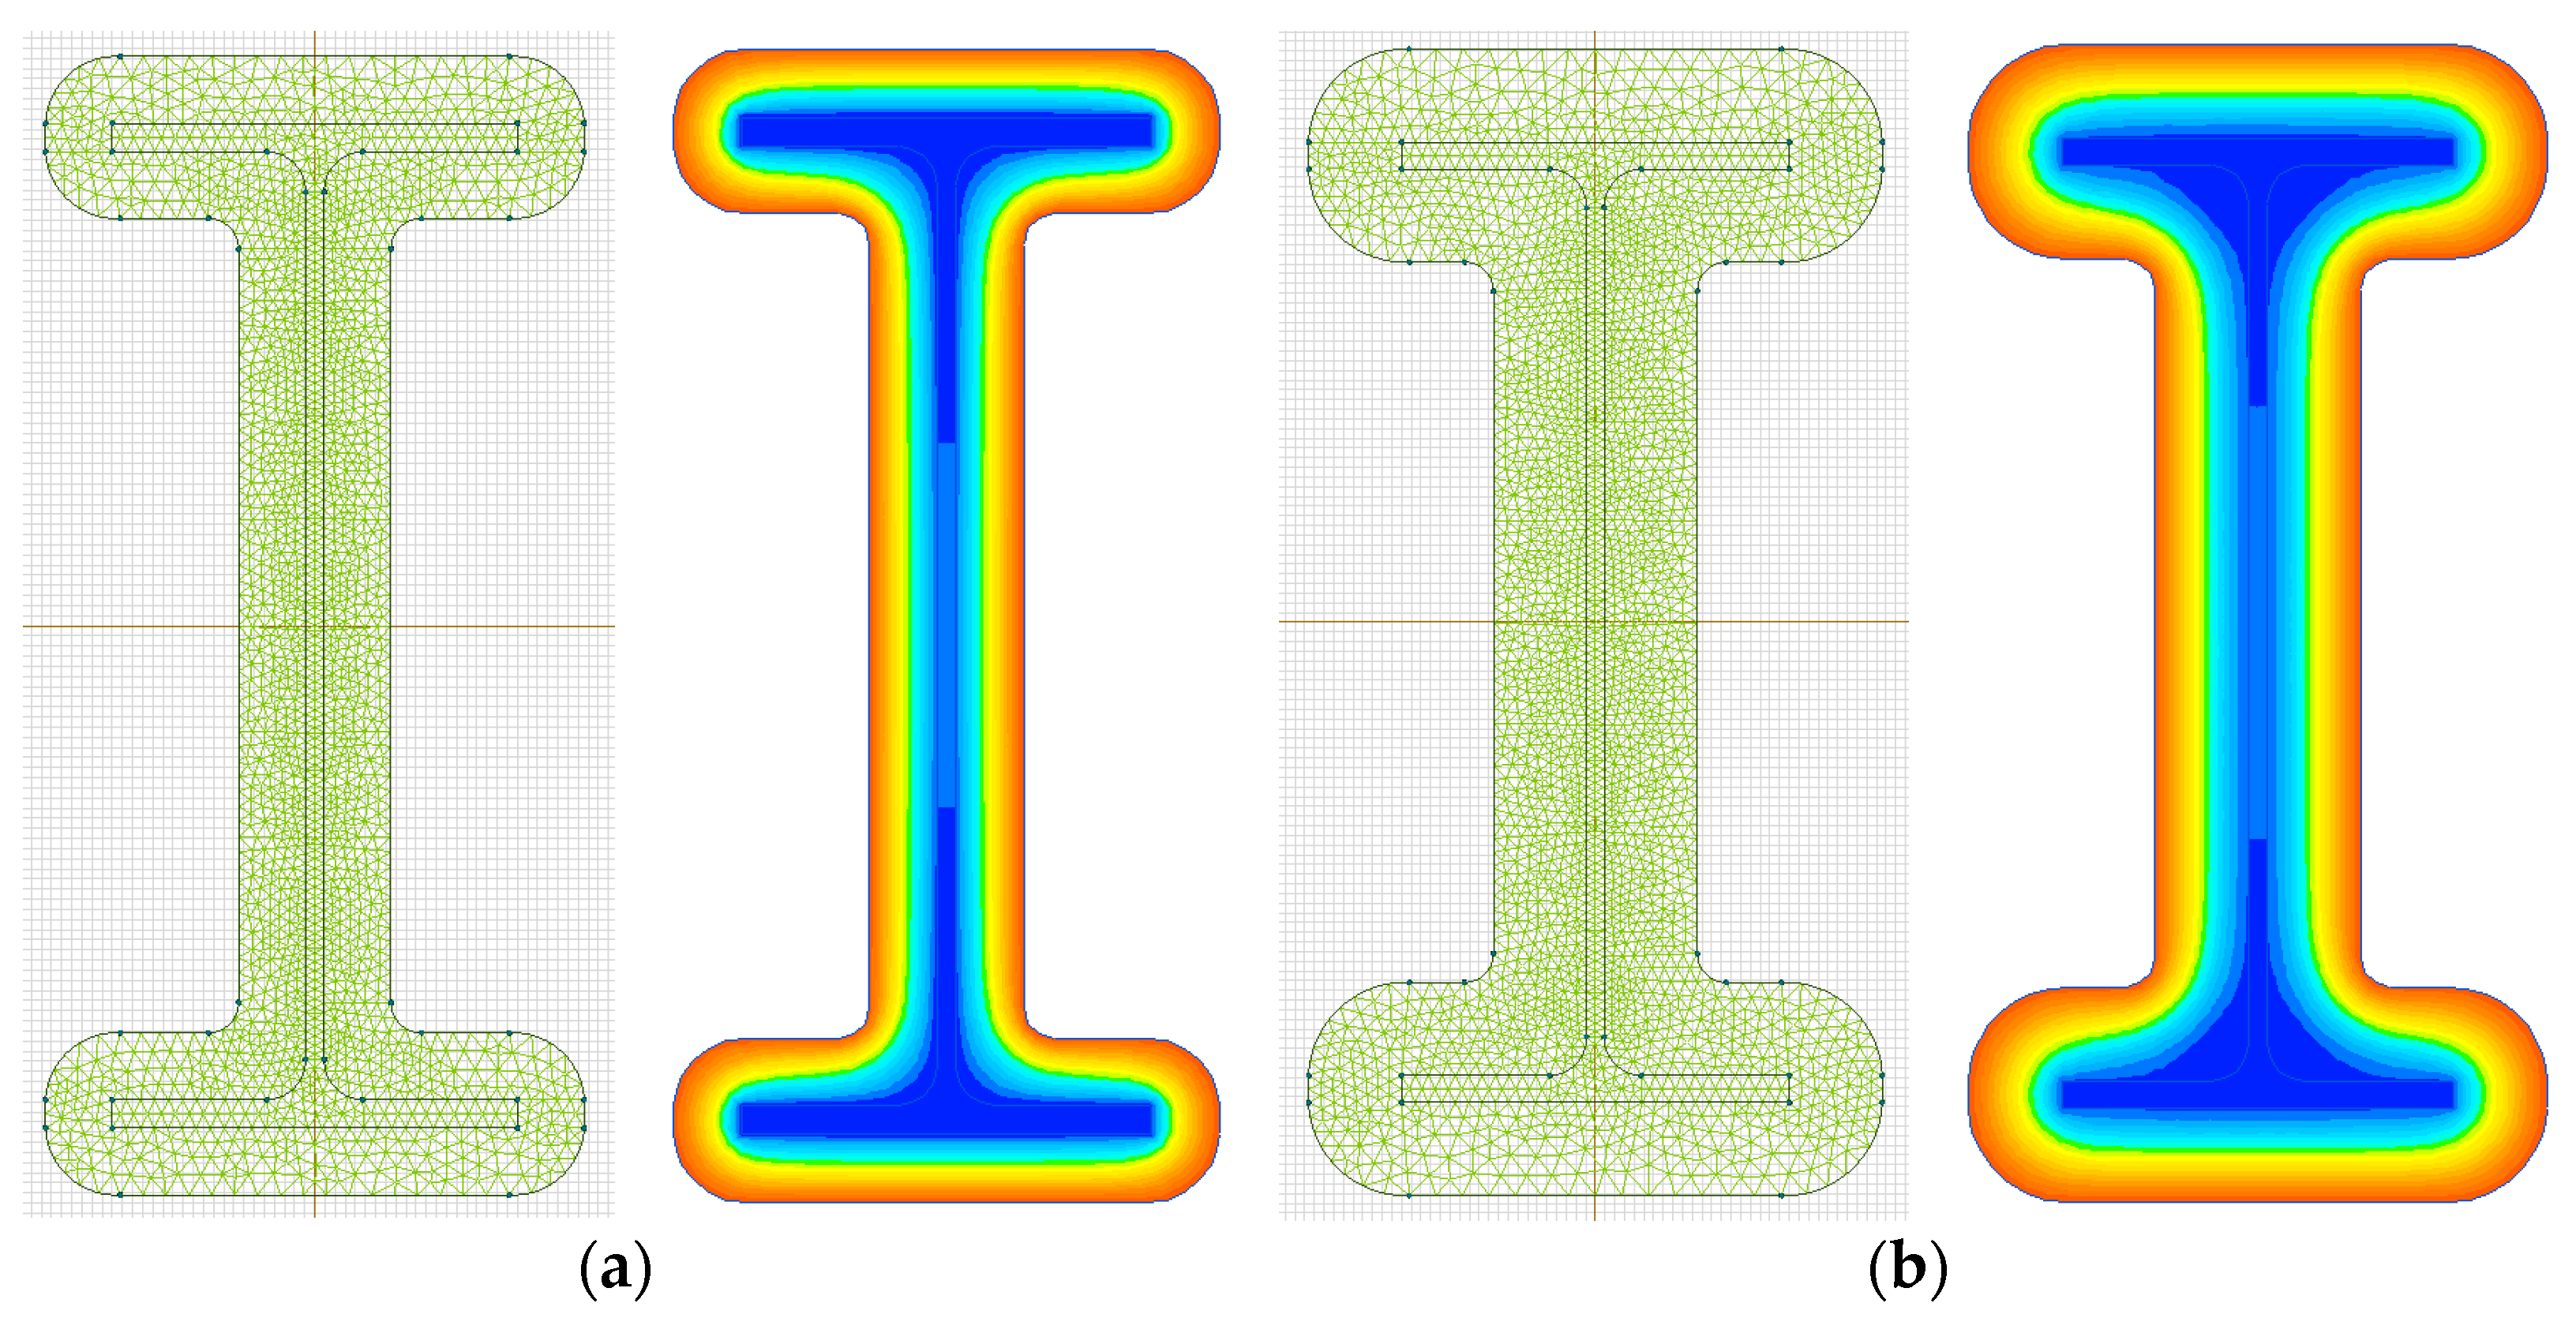
As a result of the simulation, visualizations of the heating of steel I-beam columns from a top-down viewpoint were obtained (Figure 5, Figure 6, Figure 7 and Figure 8).
According to the simulation results, the temperature–time dependencies at the location of the thermocouple point in the middle of the surface of the test samples under the standard (Figure 9) and hydrocarbon (Figure 10) fire regimes were obtained. The graph shows the averaged values of thermocouple values, located in the middle of the height of the test samples.
As seen in Figure 9, the graph for sample with coating No. 2.1, which has a comparable thickness of coating (33 mm) to samples with coatings No. 1.1 and No. 1.2 (32 mm), but which has a lower density value (220 kg/m3) and a lower heat capacity value (350 J/K·kg), increases with a higher rate until reaching the limit state at the 121st minute, characterized by reaching the critical temperature of 500 °C. The graph for the sample with coatings No. 1.1 and No. 1.2, which have a higher density value (300 kg/m3) and a higher heat capacity value (420 J/K·kg), shows a smoother temperature rise until the end of fire exposure at 195 min (for the sample with coating No. 1.1) and at 183 min (for the sample with coating No. 1.2).
As seen in Figure 10, the graph for sample with coating No. 3.1 and 3.2, which have a higher density (775 kg/m3) and higher values of thermal conductivity (at 20 °C, 0.190 W/m·K), grows with a higher rate before reaching the limit state, characterized by the appearance of the limit vertical deformation (more than 30 mm). The graph for the sample with coating No. 2.2, which has a lower density (220 kg/m3), but has the largest thickness of the fire retardant composition (47 mm) and the lowest value of thermal conductivity (at 20 °C, 0.060 W/m·K), after 55 min of heating demonstrates a smooth increase in temperature, without reaching the limit state (500 °C). The graph for sample with coating No. 1.3, which has average values of coating thickness (32 mm), density (300 kg/m3) and thermal conductivity (at 20 °C, 0.086 W/m·K), beginning at 70 min, shows average values of temperatures.
The dependence on time of deformations under the combined action of constant static and thermal loads was obtained in SP ELCUT using the connection of the tasks of unsteady heat transfer and mechanical stresses and strains (Figure 11).
As seen in Figure 11, the sample with coating No. 3.1 was the first to achieve loss of bearing capacity under the combined action of thermal and mechanical loads due to the application of a larger constant static load equal to 294 kN (30 tf). According to the experiment, the test of the sample with coating No. 1.3 was stopped at the 123rd minute of fire exposure, and the limiting condition of the load-bearing capacity of the structure (R) was not reached by the test sample, and the vertical deformation was 13.2 mm. A time taken to reach the limit state as a reaction of the deformation growth rate of more than 10 mm/minute and the appearance of the limit vertical deformation (36 mm) at 145 min was predicted for the sample as a result of simulation. The achievement of the limit state for bearing capacity of the sample with coating No. 1.3, subjected to a hydrocarbon fire regime, was achieved faster in comparison to sample with coating No. 1.1, subjected to the standard fire regime.
During consideration of the samples with coatings No. 1.1–No. 1.3, No. 3.1 and No. 3.2 in the top view in SP ELCUT, visualization of the changed shape of the steel I-beam samples under the action of constant static and thermal loads is shown (Figure 12).
To determine the value of the ultimate vertical deformation at the end of the fire exposure, a section model of steel I-beams with coatings No. 1.1–No. 1.3, No. 3.1 and No. 3.2 was built in SP ELCUT (Figure 13). Deformation values for the height of steel I-beams are shown on the right side of the sample.
According to the experiment, the test of sample with coating No. 1.3 was stopped at the 123rd minute of fire exposure, the limiting condition of the load-bearing capacity of the structure (R) was not reached by the test sample, and the vertical deformation was 13.2 mm. For sample with coating No. 1.3, which had been taken to the limit state (up to 145 min) by simulation, the limiting value of deformation was 36 mm.
3.3. Optimization of Plaster Thickness
The calculated values of temperatures and deformations for the structures considered, obtained from the results of simulation in SP ELCUT, perfectly correlate with the experimentally obtained values of temperatures and deformations in any period of time. Using the example of the sample with the coating No. 2.2, which did not reach the limit state according to the results of the experiment, an evaluation of the thickness of the plaster composition used and simulation of variants of the consumption of fireproof plaster under the hydrocarbon regime of fire was carried out. The graph shows the averaged values of the thermocouple, located in the middle of the height of the test samples. The fire resistance limit of the steel column with coating No. 2.2, having a plaster thickness of 47 mm, corresponds to the R 120 classification. Figure 14 shows the different thickness of the plaster composition obtained from the simulation (from 47 mm to 25 mm). With a fireproofing layer of a thickness of 29 mm, the temperature at 120 min reaches 491 °C, which indicates the optimal thickness at which the required fire protection efficiency in the hydrocarbon fire regime is provided.
3.4. Determination of the Optimal Density of the Plaster Composition
Depending on the nature of the binder and fillers, plasters have different physical and thermophysical characteristics: density, thermal conductivity and heat capacity. When the amount of Portland cement in the dry mixture is more than 35% of the total volume, density in the dry state is over 1000 kg/m3 and the thermal conductivity under normal conditions (20 °C) is, 0.371 W/m·K. On the other hand, an amount of perlite of more than 80% of the total volume provides plaster with a density of 400 kg/m3 and a thermal conductivity of 0.139 W/m·K [47]. Thus, the assumed content for the plaster compositions considered in this study with a density of 220 kg/m3, 300 kg/m3 and 775 kg/m3 contains an approximate binder–filler ratio of 8–92%, 11–89% and 27–73%, respectively.
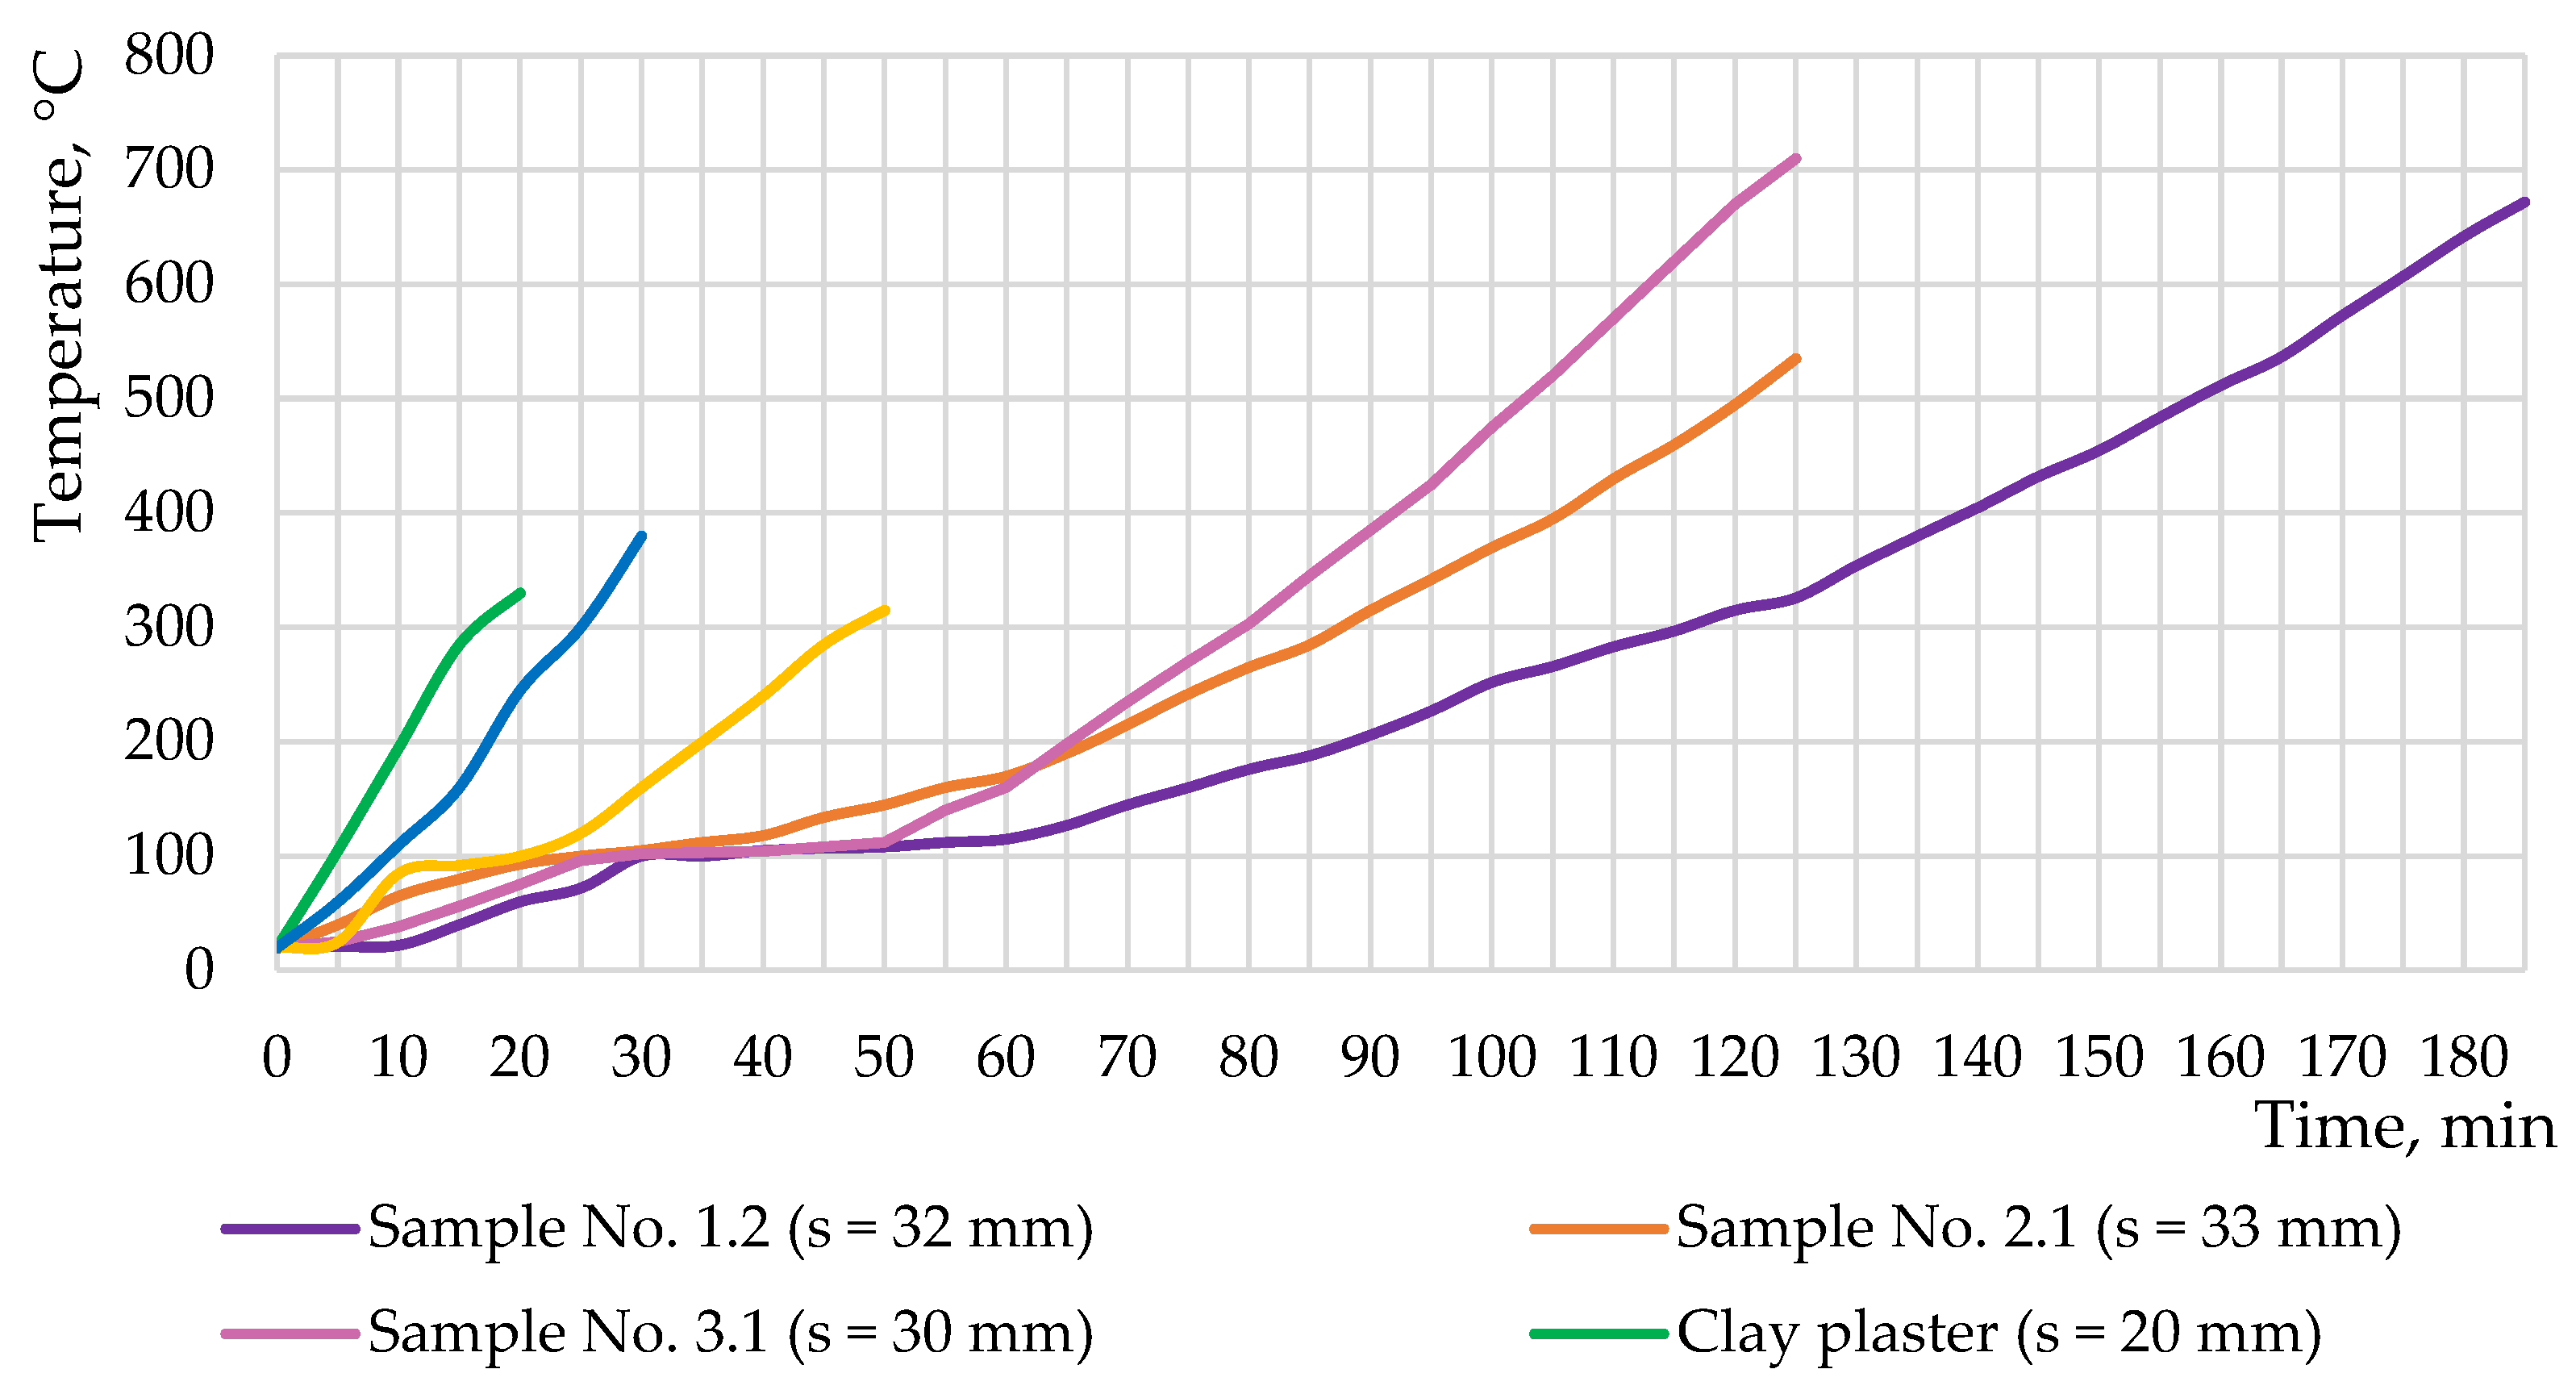
It is known that the fire retardant properties of plaster compositions are affected by the density and coefficients of heat capacity and thermal conductivity, depending on the temperature and the nature of the binder and filler of the plaster [46]. To determine the density at which the greatest fire resistance is provided, the temperature curves of clay and lime plaster compositions obtained by fire testing under the standard temperature regime were analyzed [26] (Figure 15).
As seen in Figure 15, the graphs for the samples with clay and lime plasters with high density (1610–1800 kg/m3) grow at a higher rate, demonstrating low fire resistance limits compared to the samples with coatings studied in this work, and a lower density (220 to 775 kg/m3). Thus, the sample with coating No. 3.1 (775 kg/m3) shows a sharper temperature rise from the 60th minute; the sample with coating No. 2.1 (220 kg/m3) shows a sharper temperature rise from the 70th minute; the sample with coating No. 1.2 (300 kg/m3) shows a smoother temperature rise due to the balanced binder/filler ratio.
3.5. Determination of the Dependence of the Coefficient of Heat Capacity on Temperature
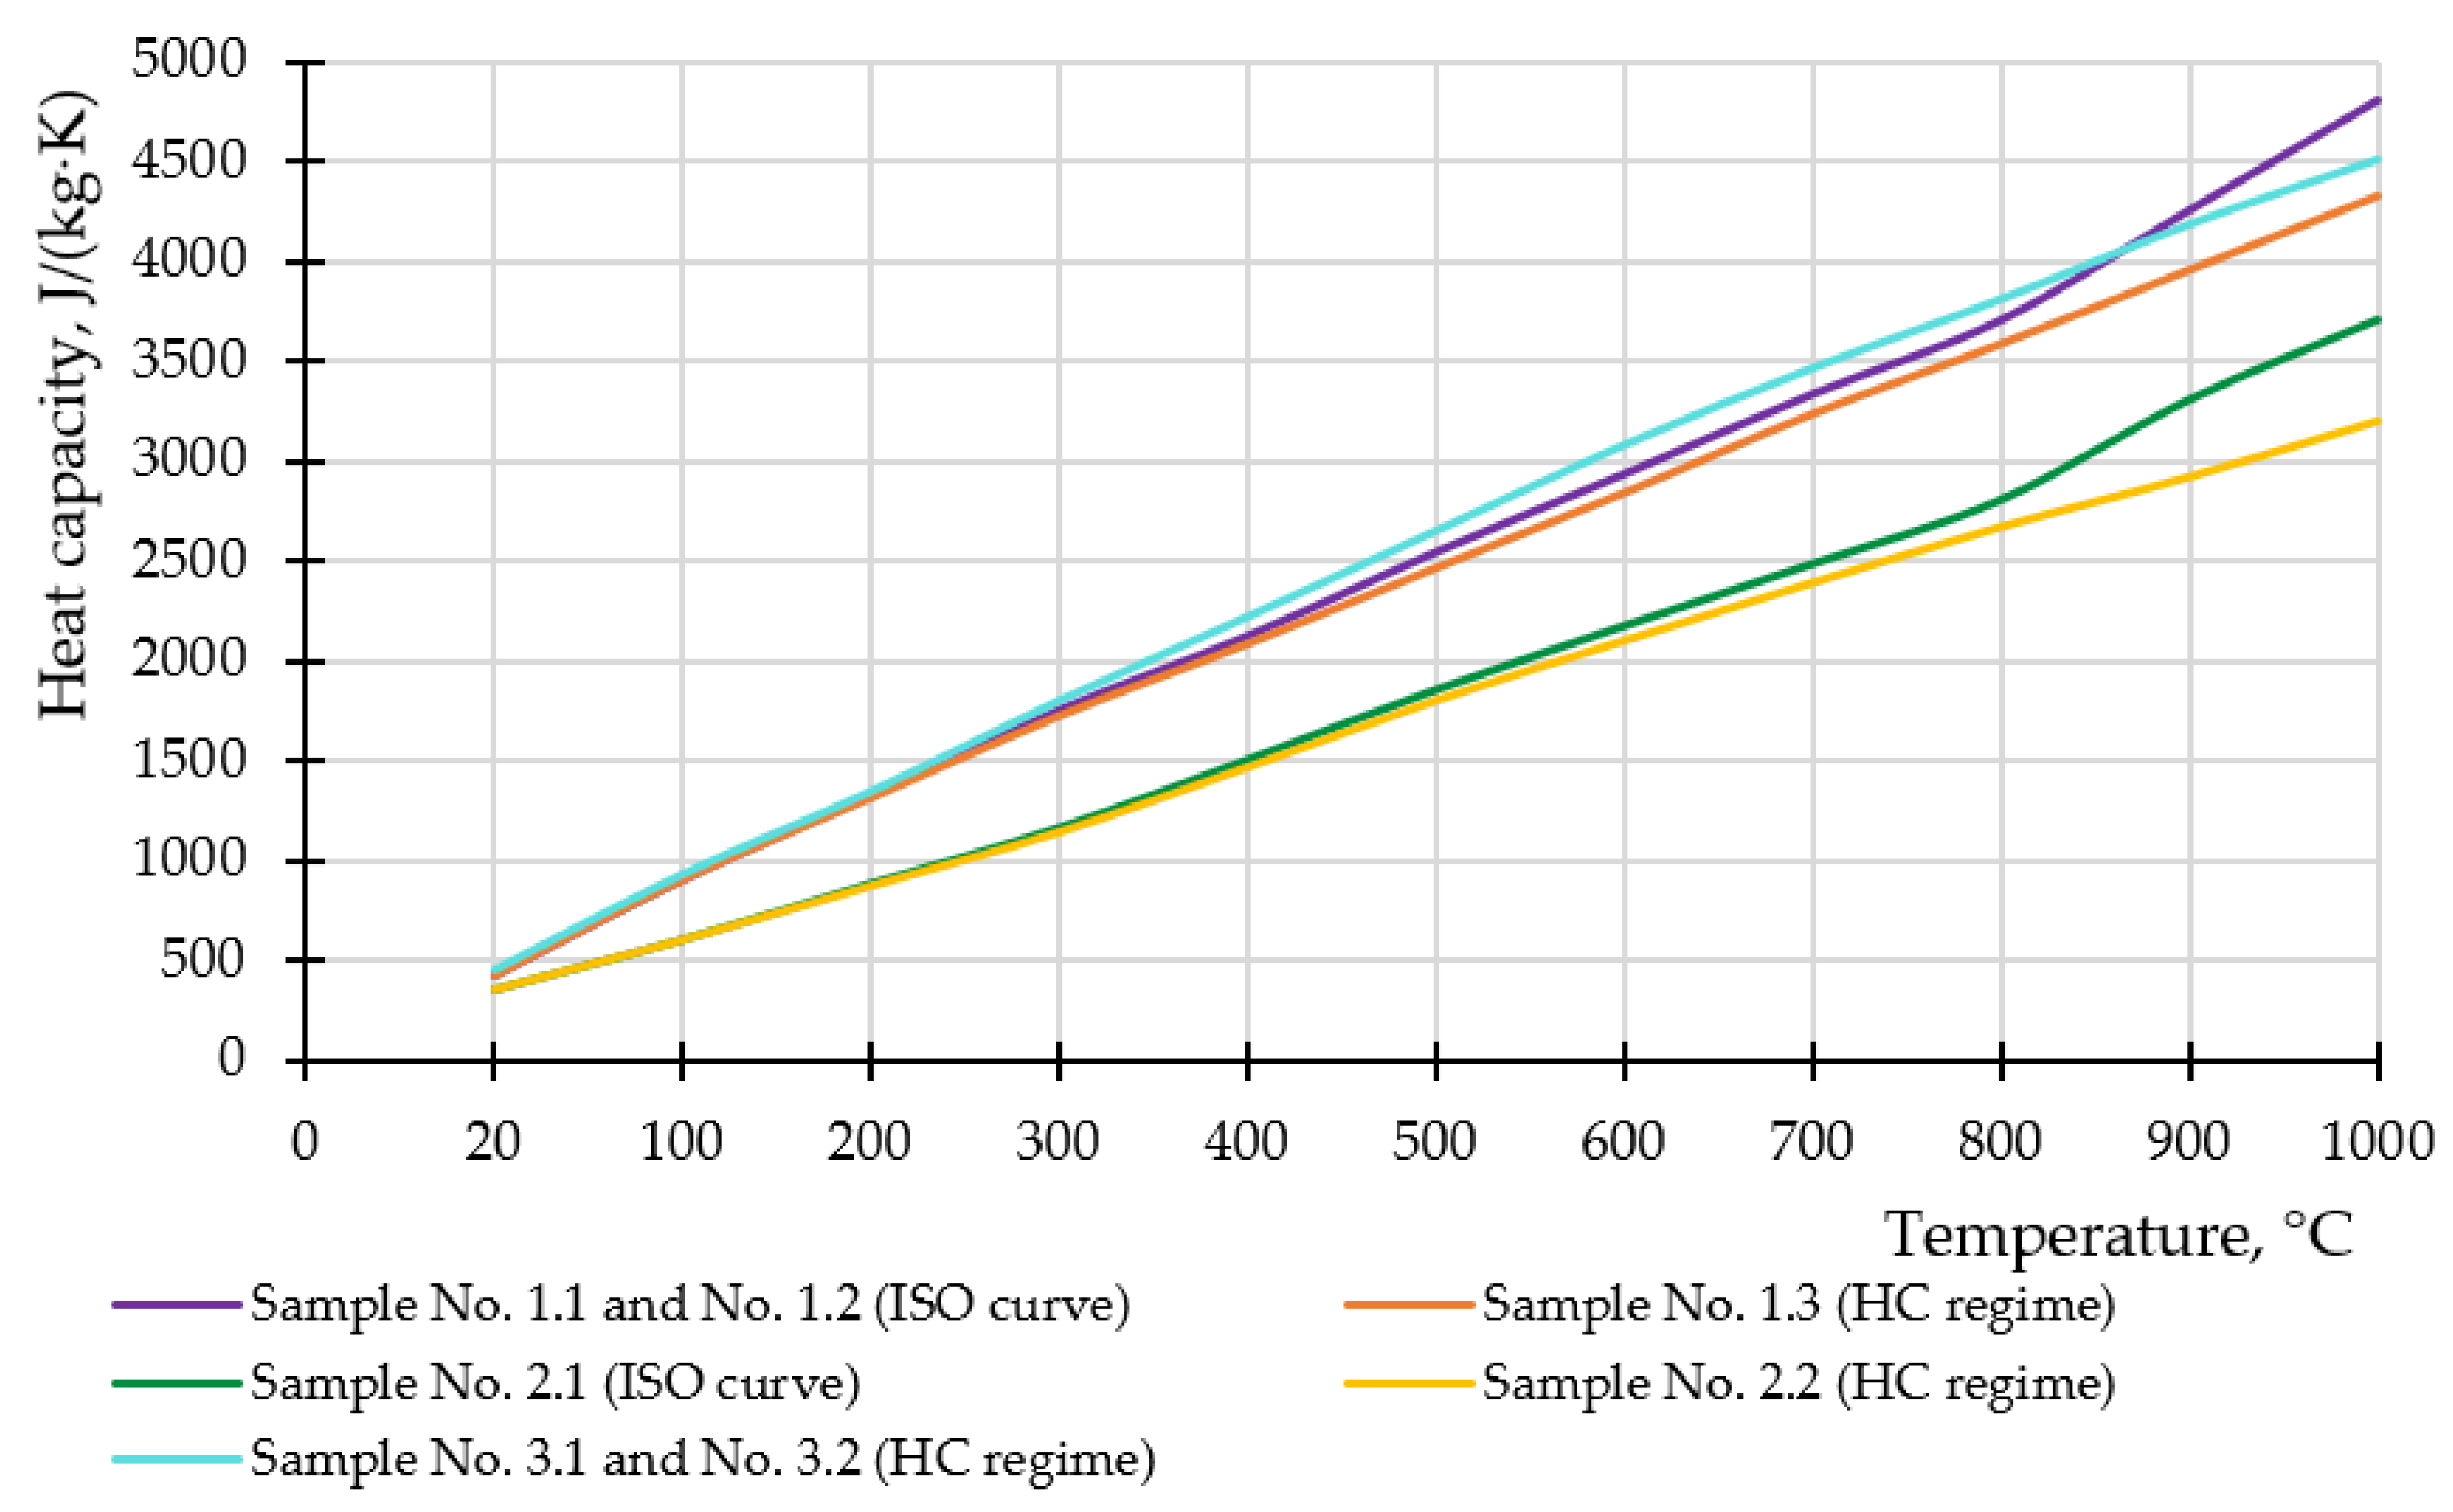
In [29], experimental studies of the properties of perlite plaster under heating and subsequent cooling at a rate of 10 K/min and 20 K/min show that the specific heat capacity has a rapid increase when heated to a pronounced peak characterized by the dehydration of mineral binders and a subsequent decrease in the values of heat capacity. It is shown that at lower heating rates pronounced peaks are observed earlier. According to the results of the simulation of the specific heat capacity for samples with plaster compositions, no peaks were found when exposed to the hydrocarbon fire regime, characterized by a rapid heating rate; throughout the fire exposure there is a steady increase, while for samples with plaster compositions under the exposure to the standard fire regime, characterized by a slower heating rate, there is a sharp increase in the specific heat capacity at 800 °C, indicating the proximate arrival of the peak, followed by a sharp decrease in the heat capacity coefficients (Figure 16).
3.6. Determination of the Dependence of the Coefficient of Thermal Conductivity on Temperature
In [29], experimental studies of the properties of perlite plaster show that the change in thermal conductivity depends on the heating rate. Figure 17 shows the values of the thermal conductivity coefficients of plaster compositions and powder plaster [28], confirming the dynamics of the obtained values of thermal conductivity in this study.
The calculated values of thermophysical characteristics obtained from the simulation correlate with the data in Table 3. As seen in Figure 17, when the structure is exposed to the hydrocarbon temperature regime, the increase in thermal conductivity values at 1000 °C is 8–10% higher than when the structure is exposed to the standard temperature regime. The dynamics of change in thermal conductivity can be divided into two stages: from 20 °C to 100 °C there is a slight decrease, demonstrating the evaporation of water from the plaster composition; above 100 °C, a smooth linear growth is observed.
3.7. Analysis of Thermal Conductivity and Temperature Dependence on Density
In [30], it was shown that the thermal conductivity of plaster compositions is decreased by reducing the density. To assess the effectiveness of plaster compositions with a thickness of 30 mm, an analysis of the dependence of thermal conductivity and temperature on density at 100 °C and 1000 °C at the 20th and 120th minutes of fire exposure was carried out by simulation (Figure 18). As a result of the simulation, it is clear that for density values between 200 and 600 kg/m3 there is a decrease in temperature at the minimum and maximum heating temperatures, while at densities greater than 600 kg/m3 the temperature begins to increase smoothly, which confirms the faster growth of the graphs for clay and lime plasters and the sample with coating No. 3.1 having density values greater than 600 kg/m3. The sample with coating No. 1.2, which has a density of 300 kg/m3, has a smoother temperature rise throughout the fire exposure compared to the sample with coating No. 2.1, which has a density of 220 kg/m3, because these values are in the range of 200 to 600 kg/m3. Figure 18 shows by dotted orange lines the temperature values at the 20th and 120th minutes of fire exposure under the standard and hydrocarbon fire regimes and the thermal conductivity coefficients at 100 °C and 1000 °C, depending on the plaster density of the examined coatings (at 100 °C the plaster thermal conductivity under the exposure to different fire regimes is the same); values obtained by the graphical method correlate with the experimental and calculated values of temperatures and thermal conductivity coefficients. Thus, by calculating the critical surface temperature on the steel sample, an optimal plaster density value and its corresponding thermal conductivity can be determined. For example, at a critical temperature of 700 °C under the hydrocarbon fire regime, the density value is 785 kg/m3 and thermal conductivity at 100 °C, 0.185 W/m·K; at 1000 °C, 0.258 W/m·K (in Figure 18 this is shown by the red dashed lines). The yellow dashed lines in Figure 18 show the values of temperatures and thermal conductivities of the investigated plaster compositions with densities of 220 kg/m3, 300 kg/m3 and 775 kg/m3. Figure 17 shows a linear increase in thermal conductivity values when heated from 100 to 1000 °C, so intermediate thermal conductivity values can be determined by interpolation.
The best characteristics among plaster compositions with comparable thicknesses are the plaster “Ignis-Lite” with an approximate binder–filler ratio of 11–89%, applied on samples with coatings No. 1.1–No. 1.3, as it has the highest density from the range of 200 to 600 kg/m3, which effects a smoother temperature rise throughout the fire exposure.
4. Conclusions
Higher requirements are set for the fire protection of steel structures in oil and gas facilities, in contrast to the structures of non-production objects. Based on experimental data, a simulation of the fire resistance of load-bearing steel structures coated with plaster fireproofing compositions under exposure to standard and hydrocarbon fire regimes was carried out. By the example of samples with coatings No. 1.1 and No. 1.2, subjected to standard temperature regime, and the sample with coating No. 1.3, subjected to hydrocarbon temperature regime, it was established that to obtain the required fire resistance limit it is necessary to take into account the operating conditions of building structures with the presence of combustible load at the site.
Simulations have shown that a plaster composition with a thickness of 47 mm for a steel column with coating No. 2.2 is not optimal in relation to fire protection overruns. Evaluation of the thickness of the plaster composition showed that the coating No. 2.2 with a thickness of 29 mm allows a reduction in the consumption of fire protection by 38%, providing the required fire resistance. It is established that to obtain the required fire resistance limits of steel structures, it is optimal to apply plaster compositions with a thickness of 30–35 mm and a density of 200 to 600 kg/m3, depending on their thermal characteristics and fire regime.
The primary role in the heating process of building structures is played by the values of thermal conductivity and density of the fireproofing composition. The dependence of thermal conductivity and temperature on density at 100 °C and 1000 °C shows that the use of plaster compositions with a density of 200 to 600 kg/m3 is optimal in terms of reducing the temperature at the minimum and maximum temperatures of heating and providing a higher limit of fire resistance. The possibility of determining graphically the optimal density of the plaster composition and its corresponding thermal conductivity by calculating the critical surface temperature on a steel sample is shown. It was found that the values of thermal conductivity at 1000 °C are 8–10% higher when the structure is exposed to hydrocarbon fire regime. It was found that the specific heat capacity for samples with plaster compositions during exposure to the standard temperature regime is 10–15% higher at 1000 °C, while reaching a peak earlier, followed by a decrease in its values.
Author Contributions
Conceptualization, M.G.; software, D.S.; methodology, S.A.; formal analysis, A.D. All authors have read and agreed to the published version of the manuscript.
Funding
The research is partially funded by the Ministry of Science and Higher Education of the Russian Federation under the strategic academic leadership program “Priority 2030” (Agreement 075-15-2021-1333 dated 30 September 2021).
Institutional Review Board Statement
Not applicable.
Informed Consent Statement
Not applicable.
Data Availability Statement
Testing laboratory of the FGBU VNIIPO EMERCOM of Russia.
Conflicts of Interest
The authors declare no conflict of interest.
References
- Mojarad, A.A.S.; Atashbari, V.; Tantau, A. Challenges for Sustainable Development Strategies in Oil and Gas Industries. Proc. Int. Conf. Bus. Excell. 2018, 12, 626–638. [Google Scholar] [CrossRef] [Green Version]
- Fang, H.; Lo, S.M.; Zhang, Y.; Shen, Y. Development of a Machine-Learning Approach for Identifying the Stages of Fire Development in Residential Room Fires. Fire Saf. J. 2021, 126, 103469. [Google Scholar] [CrossRef]
- Gorlenko, N.V.; Murzin, M.A. Comparative Analysis of Fire Risks in Coal and Oil and Gas Industries. IOP Conf. Ser. Mater. Sci. Eng. 2019, 687, 066009. [Google Scholar] [CrossRef]
- Cao, Y.; Liu, A.; Chen, M.; Jiang, Y.; Wang, S.; Bai, Y. Safety Analysis of an Offshore Platform for Leakage and Deflagration Accidents from Adjacent Oil and Gas Storage and Transportation Units. Ships. Offshore. Struct. 2020, 16, 815–826. [Google Scholar] [CrossRef]
- Xie, Q.; Wang, P.; Li, S.; Wang, J.; Lo, S.; Wang, W. An Uncertainty Analysis Method for Passenger Travel Time under Ship Fires: A Coupling Technique of Nested Sampling and Polynomial Chaos Expansion Method. Ocean. Eng. 2020, 195, 106604. [Google Scholar] [CrossRef]
- Kalach, A.V.; Cherepakhin, A.M.; Sushko, E.A.; Kalach, E.V.; Sysoeva, T.P. The Dangerous Fire Factors Formation the on an Oil and Gas Complex Objects When Using the Combustible Environment on the Tetrachlormethane Basis. IOP Conf. Ser. Earth. Environ. Sci. 2020, 459, 042046. [Google Scholar] [CrossRef]
- Alam, M.Z.; Sakib, M.N.; Islam, M.; Jalal Uddin, M. Various Risks and Safety Analysis to Reduce Fire in Oil Refinery Plant. IOP Conf. Ser. Mater. Sci. Eng. 2021, 1078, 012028. [Google Scholar] [CrossRef]
- Sivi, V.; Ashwin, P.; Bibin, G.; Fahad, A.M.A.; Sreekul, W. Design and Fabrication of Fire Fighting Robotic Arm for Petrochemical Industries. Int. Journ. Industr. Eng. 2018, 5, 14–17. [Google Scholar] [CrossRef] [Green Version]
- Abdoul Nasser, A.H.; Ndalila, P.D.; Mawugbe, E.A.; Emmanuel Kouame, M.; Paterne, M.A.; Li, Y. Mitigation of Risks Associated with Gas Pipeline Failure by Using Quantitative Risk Management Approach; a Descriptive Study on Gas Industry. J. Mar. Sci. Eng. 2021, 9, 1098. [Google Scholar] [CrossRef]
- Log, T.; Pedersen, W.B. A Common Risk Classification Concept for Safety Related Gas Leaks and Fugitive Emissions? Energies 2019, 12, 4063. [Google Scholar] [CrossRef] [Green Version]
- Tong, S.J.; Wu, Z.Z.; Wang, R.J.; Wu, H. Fire Risk Study of Long-Distance Oil and Gas Pipeline Based on QRA. Procedia. Eng. 2016, 135, 369–375. [Google Scholar] [CrossRef] [Green Version]
- Ivanov, A.V.; Dali, F.A.; Ivakhnyuk, G.K.; Skripnick, I.L.; Simonova, M.A.; Shikhalev, D.V. Nanostructures Management Technology to Reduce the Fire Risk in the Oil and Gas Industry: Performance, Features and Implementation. J. Appl. Eng. Sci. 2021, 19, 84–91. [Google Scholar] [CrossRef]
- Chandrasekaran, S.; Nagavinothini, R. Behavior of Stiffened Deck Plates under Hydrocarbon Fire. Mar. Syst. Ocean. Technol. 2020, 15, 95–109. [Google Scholar] [CrossRef]
- EN 1991-1-2: Eurocode 1: Actions on Structures-Part 1–2: General Actions-Actions on Structures Exposed to Fire. Available online: https://www.phd.eng.br/wp-content/uploads/2015/12/en.1991.1.2.2002.pdf (accessed on 25 October 2021).
- Imran, M.; Liew, M.S.; Nasif, M.S.; Gracia, E.M.; Danyaro, K.U.; Niazi, M.U. Thermal and Mechanical Response of Partially Protected Steel I-Beam under Fire. MATEC Web Conf. 2018, 203, 06009. [Google Scholar] [CrossRef]
- Elbasuney, S.; Maraden, A. Novel Thermoset Nanocomposite Intumescent Coating Based on Hydroxyapatite Nanoplates for Fireproofing of Steel Structures. J. Inorg. Organomet. Polym. Mater. 2020, 30, 820–830. [Google Scholar] [CrossRef]
- Mahmud, H.M.I.; Mandal, A.; Nag, S.; Moinuddin, K.A.M. Performance of Fire Protective Coatings on Structural Steel Member Exposed to High Temperature. J. Struct. Fire Eng. 2021, 12, 193–211. [Google Scholar] [CrossRef]
- Jiang, S.; Wu, H. An Experimental Investigation on the Fire Resistance of the Integrated Envelope-Fire Protection Material for Steel Buildings. Prog. Steel. Build. Struct. 2021, 23, 77–84. [Google Scholar] [CrossRef]
- Zybina, O.; Gravit, M. Intumescent Coatings for Fire Protection of Building Structures and Materials; Springer Series on Polymer and Composite Materials; Springer International Publishing: Berlin/Heidelberg, Germany, 2020. [Google Scholar] [CrossRef]
- Gravit, M.; Shabunina, D. Structural Fire Protection of Steel Structures in Arctic Conditions. Buildings 2021, 11, 499. [Google Scholar] [CrossRef]
- Gravit, M.; Simonenko, Y.; Yablonskii, L. 3D-Flexible Intumescent Fire Protection Mesh for Building Structures. E3S Web Conf. 2019, 91, 02004. [Google Scholar] [CrossRef]
- Zeng, Y.; Weinell, C.E.; Dam-Johansen, K.; Ring, L.; Kiil, S. Exposure of Hydrocarbon Intumescent Coatings to the UL1709 Heating Curve and Furnace Rheology: Effects of Zinc Borate on Char Properties. Prog. Org. Coatings. 2019, 135, 321–330. [Google Scholar] [CrossRef]
- Naik, A.D.; Duquesne, S.; Bourbigot, S. Hydrocarbon Time-Temperature Curve under Airjet Perturbation: An in situ Method to Probe Char Stability and Integrity in Reactive Fire Protection Coatings. J. Fire Sci. 2016, 34, 385–397. [Google Scholar] [CrossRef]
- Santos, T.; Gomes, M.I.; Silva, A.S.; Ferraz, E.; Faria, P. Comparison of Mineralogical, Mechanical and Hygroscopic Characteristic of Earthen, Gypsum and Cement-Based Plasters. Constr. Build. Mater. 2020, 254, 119222. [Google Scholar] [CrossRef]
- Rashad, A.M. Possibility of Using Metakaolin as Thermal Insulation Material. Int. J. Thermophys. 2017, 38, 126. [Google Scholar] [CrossRef]
- Johanna, L.; Judith, K.; Alar, J.; Birgit, M.; Siim, P. Material Properties of Clay and Lime Plaster for Structural Fire Design. Fire Mater. 2019, 45, 355–365. [Google Scholar] [CrossRef]
- Liblik, J.; Küppers, J.; Maaten, B.; Just, A. Fire Protection Provided by Clay and Lime Plasters. Wood Mater. Sci. Eng. 2020, 16, 290–298. [Google Scholar] [CrossRef]
- Ben Mansour, M.; Soukaina, C.A.; Benhamou, B.; Ben Jabrallah, S. Thermal Characterization of a Tunisian Gypsum Plaster as Construction Material. Energy Procedia 2013, 42, 680–688. [Google Scholar] [CrossRef] [Green Version]
- Zehfuß, J.; Sander, L.; Schaumann, P.; Weisheim, W. Thermal Material Properties of Fire Protection Materials for Natural Fire Scenarios. Bautechnik 2018, 95, 535–546. [Google Scholar] [CrossRef]
- Bicer, A.; Kar, F. Thermal and Mechanical Properties of Gypsum Plaster Mixed with Expanded Polystyrene and Tragacanth. Therm. Sci. Eng. Prog. 2017, 1, 59–65. [Google Scholar] [CrossRef]
- Gravit, M.V.; Golub, E.V.; Antonov, S.P. Fire Protective Dry Plaster Composition for Structures in Hydrocarbon Fire. Mag. Civ. Eng. 2018, 79, 86–94. [Google Scholar] [CrossRef]
- Gravit, M.; Mikhailov, E.; Svintsov, S.; Kolobzarov, A.; Popovych, I. Fire and Explosion Protection of High-Rise Buildings by Means of Plaster Compositions. Solid State Phenom. 2016, 871, 138–145. [Google Scholar] [CrossRef]
- ISO 834-75; Elements of Building Constructions. Fire-Resistance Test Methods. General Requirements. Ministry of Architecture, Construction and Housing and Communal Services of the Russian Federation: Moscow, Russia, 1996. Available online: https://docs.cntd.ru/document/9055248 (accessed on 2 November 2021).
- EN 1363-2:1999; Fire Resistance Tests—Part 2: Alternative and Additional Procedures. Slovenian Institute for Standardization: Ljubljana, Slovenia, 1999. Available online: https://nd.gostinfo.ru/document/6239985.aspx (accessed on 22 November 2021).
- GOST 30247.1-94; Elements of Building Constructions. Fire-Resistance Test Methods. Loadbearing and Separating Constructions. Russian Government: Moscow, Russia, 1996. Available online: https://docs.cntd.ru/document/9055247 (accessed on 20 November 2021).
- Piloto, P.A.G.; Balsa, C.; Santos, L.M.C.; Kimura, É.F.A. Effect of the Load Level on the Resistance of Composite Slabs with Steel Decking under Fire Conditions. J. Fire Sci. 2020, 38, 212–231. [Google Scholar] [CrossRef]
- Gravit, M.; Klimin, N.; Karimova, A.; Fedotova, E.; Dmitriev, I. Fire Resistance Evaluation of Tempered Glass in Software ELCUT. Smart Innov. Syst. Technol. 2021, 220, 523–537. [Google Scholar] [CrossRef]
- Gravit, M.; Shabunina, D. Numerical and Experimental Analysis of Fire Resistance for Steel Structures of Ships and Offshore Platforms. Fire 2022, 5, 9. [Google Scholar] [CrossRef]
- Gravit, M.; Lavrinenko, M.; Lazarev, Y.; Rozov, A.; Pavlenko, A. Modeling of Cold-Formed Thin-Walled Steel Profile with the MBOR Fire Protection. Adv. Intell. Syst. Comput. 2021, 1259, 577–592. [Google Scholar] [CrossRef]
- ELCUT. Modeling of Two-Dimensional Fields by the Finite Element Method. Available online: https://elcut.ru/free_doc_r.htm (accessed on 6 January 2022).
- GOST 57837-2017; Hot-Rolled Steel I-Beams with Parallel Edges of Flanges. Specifications. Russian Government: Moscow, Russia, 2018. Available online: https://docs.cntd.ru/document/1200157342 (accessed on 24 January 2022).
- Eurocode 3: Design of Steel Structures—Part 1–2: General Rules Structural Fire Design. Available online: https://www.phd.eng.br/wp-content/uploads/2015/12/en.1993.1.2.2005.pdf (accessed on 21 January 2022).
- GOST 53295-2009; Fire Retardant Compositions for Steel Constructions. General requirement. Method for Determining Fire Retardant Efficiency. Russian Government: Moscow, Russia, 2010. Available online: https://docs.cntd.ru/document/1200071913 (accessed on 21 January 2022).
- Markus, E.S.; Snegirev, A.Y.; Kuznetsov, E.A. Numerical Simulation of a Fire Using Fire Dynamics; St. Petersburg Polytech-Press: St. Petersburg, Russia, 2021; p. 175. [Google Scholar]
- GOST 27772-2015; Rolled Products for Structural Steel Constructions. General Specifications. Russian Government: Moscow, Russia, 2016. Available online: https://docs.cntd.ru/document/1200133727 (accessed on 4 February 2022).
- Barthelemy, B.; Kruppa, J. Fire Resistance of Building Structures; Stroyizdat: Moscow, Russia, 1985; p. 216. [Google Scholar]
- Henry, M.; Therrien, T. Essential Natural Plasters: A Guide to Materials, Recipes, and Use; New Society Publishers: New Westminster, CB, Canada, 2018; p. 224. [Google Scholar]
Figure 1.
Means and methods of fire protection of steel structures.

Figure 2.
Steel structures with the fireproofing plaster compositions.

Figure 3.
Test sample with coating No. 1.1 (a) and with coating No. 1.2 (b) after fire test.

Figure 4.
Temperature and deformation curves of samples during fire tests.

Figure 5.
Scheme of samples with coatings No. 1.1–No. 1.3 and visualization of heating of sample No. 1.1 (a); scheme of samples with coatings No. 3.1 and No. 3.2 and visualization of their heating (b).
Figure 5.
Scheme of samples with coatings No. 1.1–No. 1.3 and visualization of heating of sample No. 1.1 (a); scheme of samples with coatings No. 3.1 and No. 3.2 and visualization of their heating (b).

Figure 6.
Scheme of sample with coating No. 2.1 and visualization of its heating (a); scheme of sample with coating No. 2.2 and visualization of its heating (b).
Figure 6.
Scheme of sample with coating No. 2.1 and visualization of its heating (a); scheme of sample with coating No. 2.2 and visualization of its heating (b).

Figure 7.
Temperature scale in standard fire regime, °C.

Figure 8.
Temperature scale in hydrocarbon fire regime, °C.

Figure 9.
Experimental and calculated temperature curves of samples during fire exposure under standard fire regime.
Figure 9.
Experimental and calculated temperature curves of samples during fire exposure under standard fire regime.

Figure 10.
Experimental and calculated temperature curves of samples during fire exposure under hydrocarbon fire regime.
Figure 10.
Experimental and calculated temperature curves of samples during fire exposure under hydrocarbon fire regime.

Figure 11.
Experimental and calculated deformation curves of samples under the combined action of constant static and thermal loads.
Figure 11.
Experimental and calculated deformation curves of samples under the combined action of constant static and thermal loads.

Figure 12.
Visualization of changed shape and displacement vectors under combined mechanical and thermal loads for samples No. 1.1 (a), No. 1.2 (b), No. 1.3 (c) and No. 3.1 and No. 3.2 (d).
Figure 12.
Visualization of changed shape and displacement vectors under combined mechanical and thermal loads for samples No. 1.1 (a), No. 1.2 (b), No. 1.3 (c) and No. 3.1 and No. 3.2 (d).

Figure 13.
Scheme of samples with coatings No. 1.1–No. 1.3 (a) and No. 3.1 and No. 3.2 (b) in section by height and visualization of changed shape and displacement vectors under combined action of mechanical and thermal loads for samples No. 1.1 (c), No. 1.2 (d), No. 1.3 (e), No. 1.3 when reaching the limit state (f) and No. 3.1 and No. 3.2 (g).

Figure 14.
Variations of flame retardant application for sample with coating No. 2.2.

Figure 15.
Experimental temperature curves of samples covered with plaster compositions.

Figure 16.
Calculated coefficients of heat capacity of plaster compositions as a function of temperature.
Figure 16.
Calculated coefficients of heat capacity of plaster compositions as a function of temperature.

Figure 17.
Calculated thermal conductivity coefficients of plaster compositions as a function of temperature.
Figure 17.
Calculated thermal conductivity coefficients of plaster compositions as a function of temperature.

Figure 18.
Calculated values of temperature and thermal conductivity depending on the density of plaster compositions.
Figure 18.
Calculated values of temperature and thermal conductivity depending on the density of plaster compositions.


Table 1.
The main parameters of samples with plaster compositions.
| Sample | Cross Section [41] | Height, mm | Section Ratio, mm−1 [42] | Thickness, mm | Fire Regime |
|---|---|---|---|---|---|
| Sample No. 1.1 | 40H-beam | 2700 | 134 | 32 | Standard |
| Sample No. 1.2 | 40H-beam | 2700 | 134 | 32 | Standard |
| Sample No. 1.3 | 40H-beam | 2700 | 134 | 32 | Hydrocarbon |
| Sample No. 2.1 | 50B2 | 1700 | 172 | 33 | Standard |
| Sample No. 2.2 | 50B2 | 1700 | 172 | 47 | Hydrocarbon |
| Sample No. 3.1 | 30K1 | 3000 | 159 | 30 | Hydrocarbon |
| Sample No. 3.2 | 30K1 | 3000 | 159 | 30 | Hydrocarbon |
Table 2.
Boundary conditions set in the SP ELCUT.
| Name of the Value | Value | Information Source |
|---|---|---|
| Convection heat transfer coefficient at standard temperature regime, W/(m2·K) | 25 | [14] |
| Convection heat transfer coefficient at hydrocarbon temperature regime, W/(m2·K) | 50 | [14] |
| Surface absorption coefficient | 0.5 | [44] |
| Initial ambient temperature, °C | 20 | - |
| Time step for calculating the temperature gradient of the structure, seconds | 60 | - |
Table 3.
The main characteristics of plaster compositions.
| Plaster Coating | ρ, kg/m3 | λ, W/(m·K) | Cp, J/(kg·K) | Thickness, mm | ||||
|---|---|---|---|---|---|---|---|---|
| 20 °C | 100 °C | 300 °C | 20 °C | 100 °C | 300 °C | |||
| Sample No. 1.1 | 300 | 0.086 | 0.077 | 0.089 | 420 | 900 | 1750 | 32 |
| Sample No. 1.2 | 300 | 0.086 | 0.077 | 0.089 | 420 | 900 | 1750 | 32 |
| Sample No. 1.3 | 300 | 0.086 | 0.078 | 0.091 | 420 | 900 | 1720 | 32 |
| Sample No. 2.1 | 220 | 0.060 | 0.053 | 0.068 | 350 | 600 | 1160 | 33 |
| Sample No. 2.2 | 220 | 0.060 | 0.054 | 0.072 | 350 | 600 | 1140 | 47 |
| Sample No. 3.1 | 775 | 0.190 | 0.182 | 0.191 | 450 | 930 | 1800 | 30 |
| Sample No. 3.2 | 775 | 0.190 | 0.182 | 0.191 | 450 | 930 | 1800 | 30 |
Publisher’s Note: MDPI stays neutral with regard to jurisdictional claims in published maps and institutional affiliations. |
© 2022 by the authors. Licensee MDPI, Basel, Switzerland. This article is an open access article distributed under the terms and conditions of the Creative Commons Attribution (CC BY) license (https://creativecommons.org/licenses/by/4.0/).
Share and Cite
MDPI and ACS Style
Gravit, M.; Shabunina, D.; Antonov, S.; Danilov, A. Thermal Characteristics of Fireproof Plaster Compositions in Exposure to Various Regimes of Fire. Buildings 2022, 12, 630. https://0-doi-org.brum.beds.ac.uk/10.3390/buildings12050630
AMA Style
Gravit M, Shabunina D, Antonov S, Danilov A. Thermal Characteristics of Fireproof Plaster Compositions in Exposure to Various Regimes of Fire. Buildings. 2022; 12(5):630. https://0-doi-org.brum.beds.ac.uk/10.3390/buildings12050630
Chicago/Turabian StyleGravit, Marina, Daria Shabunina, Sergey Antonov, and Andrey Danilov. 2022. "Thermal Characteristics of Fireproof Plaster Compositions in Exposure to Various Regimes of Fire" Buildings 12, no. 5: 630. https://0-doi-org.brum.beds.ac.uk/10.3390/buildings12050630
Note that from the first issue of 2016, this journal uses article numbers instead of page numbers. See further details here.