
The Effect of Building Electricity Consumption on Residents’ Subjective Well-Being: Evidence from China


1
Department of Finance and Statistics, School of Business, Anhui University of Technology, Ma’anshan 243032, China
2
School of Business, Monash University, Melbourne, VIC 3161, Australia
3
School of Economics, Nanjing University of Posts and Telecommunications, Nanjing 210023, China
4
Department of Real Estate and Construction Management Stockholm, KTH Royal Institute of Technology, 10044 Stockholm, Sweden
*
Author to whom correspondence should be addressed.
Buildings 2022, 12(6), 710; https://0-doi-org.brum.beds.ac.uk/10.3390/buildings12060710
Submission received: 20 April 2022
/
Revised: 21 May 2022
/
Accepted: 23 May 2022
/
Published: 25 May 2022
(This article belongs to the Special Issue Housing as a Nexus of Unaffordability, Illegality and Livability)
Abstract
:Residential electricity consumption has an important impact on China’s construction of a low-carbon society. However, at present, little of the literature analyzes the influencing factors of residents’ overall well-being from the perspective of micro investigation. Based on the micro mixed cross section data of the Chinese General Social Survey (CGSS), this paper empirically studies the impact of residential electricity consumption on residents’ subjective well-being. In addition, in the heterogeneity analysis, we found that an increase in residential electricity consumption will improve the overall well-being of females and people with low levels of education, but it has no significant effect on males and people with high levels of education. Moreover, the increase in residential electricity consumption has improved the life satisfaction of young people and middle-aged people. Meanwhile, the increase in residential electricity consumption has a significant, positive impact on both low-income and high-income households. Further analysis shows that no nonlinear relationship exists between the increase in residents’ power consumption and the improvement in life satisfaction. This paper enriches the research on residential energy and provides policy implications for the current Chinese government to save energy, reduce emissions, and improve residents’ quality of life.
1. Introduction and Literature Review
Residents are an important subject in energy consumption, and the energy used for living conditions is an important material basis for improving people’s standard of living [1]. Electric energy is the most efficient energy from the perspective of economy and sustainable development [2]. The use of electric energy can not only promote the economic growth of a country and region but also improve the standard of living and support social development of the population [3]. First, electricity is the basis for the operation of modern society. When electricity is generated, food and drugs can be stored in the refrigerator for an extended amount of time, improving the health of the people [4]. Second, light allows people to study longer, and an increasing number of people use network information and communication technology to improve their knowledge and abilities [5]. Third, the existence of electricity allows for the use of all kinds of household appliances widely used, which is more convenient for people to warm, cool, and entertain and improves quality of life [6]. Moreover, using electricity reduces labor intensity and saves time. More importantly, electricity provides women with opportunities for freelancing and other potential career development [7]. Finally, electricity can reduce the use of traditional energy such as coal, reduce air pollution, and improve environmental quality [8]. When renewable energy (such as wind and solar energy) is used to replace traditional energy for power generation, it can effectively reduce carbon emissions and mitigate climate change [9]. Therefore, electricity consumption has become an important indicator for measuring overall satisfaction among people [10]. With the rapid development of China’s urbanization, vast changes have taken place at the power consumption level and in urban and rural households. Domestic power consumption has become an important measure of living standards and conditions among families. Meeting the diversification and refinement of residents’ demand for electricity to better daily life and improve residents’ well-being are the key issues of concern for the Chinese government and academia.
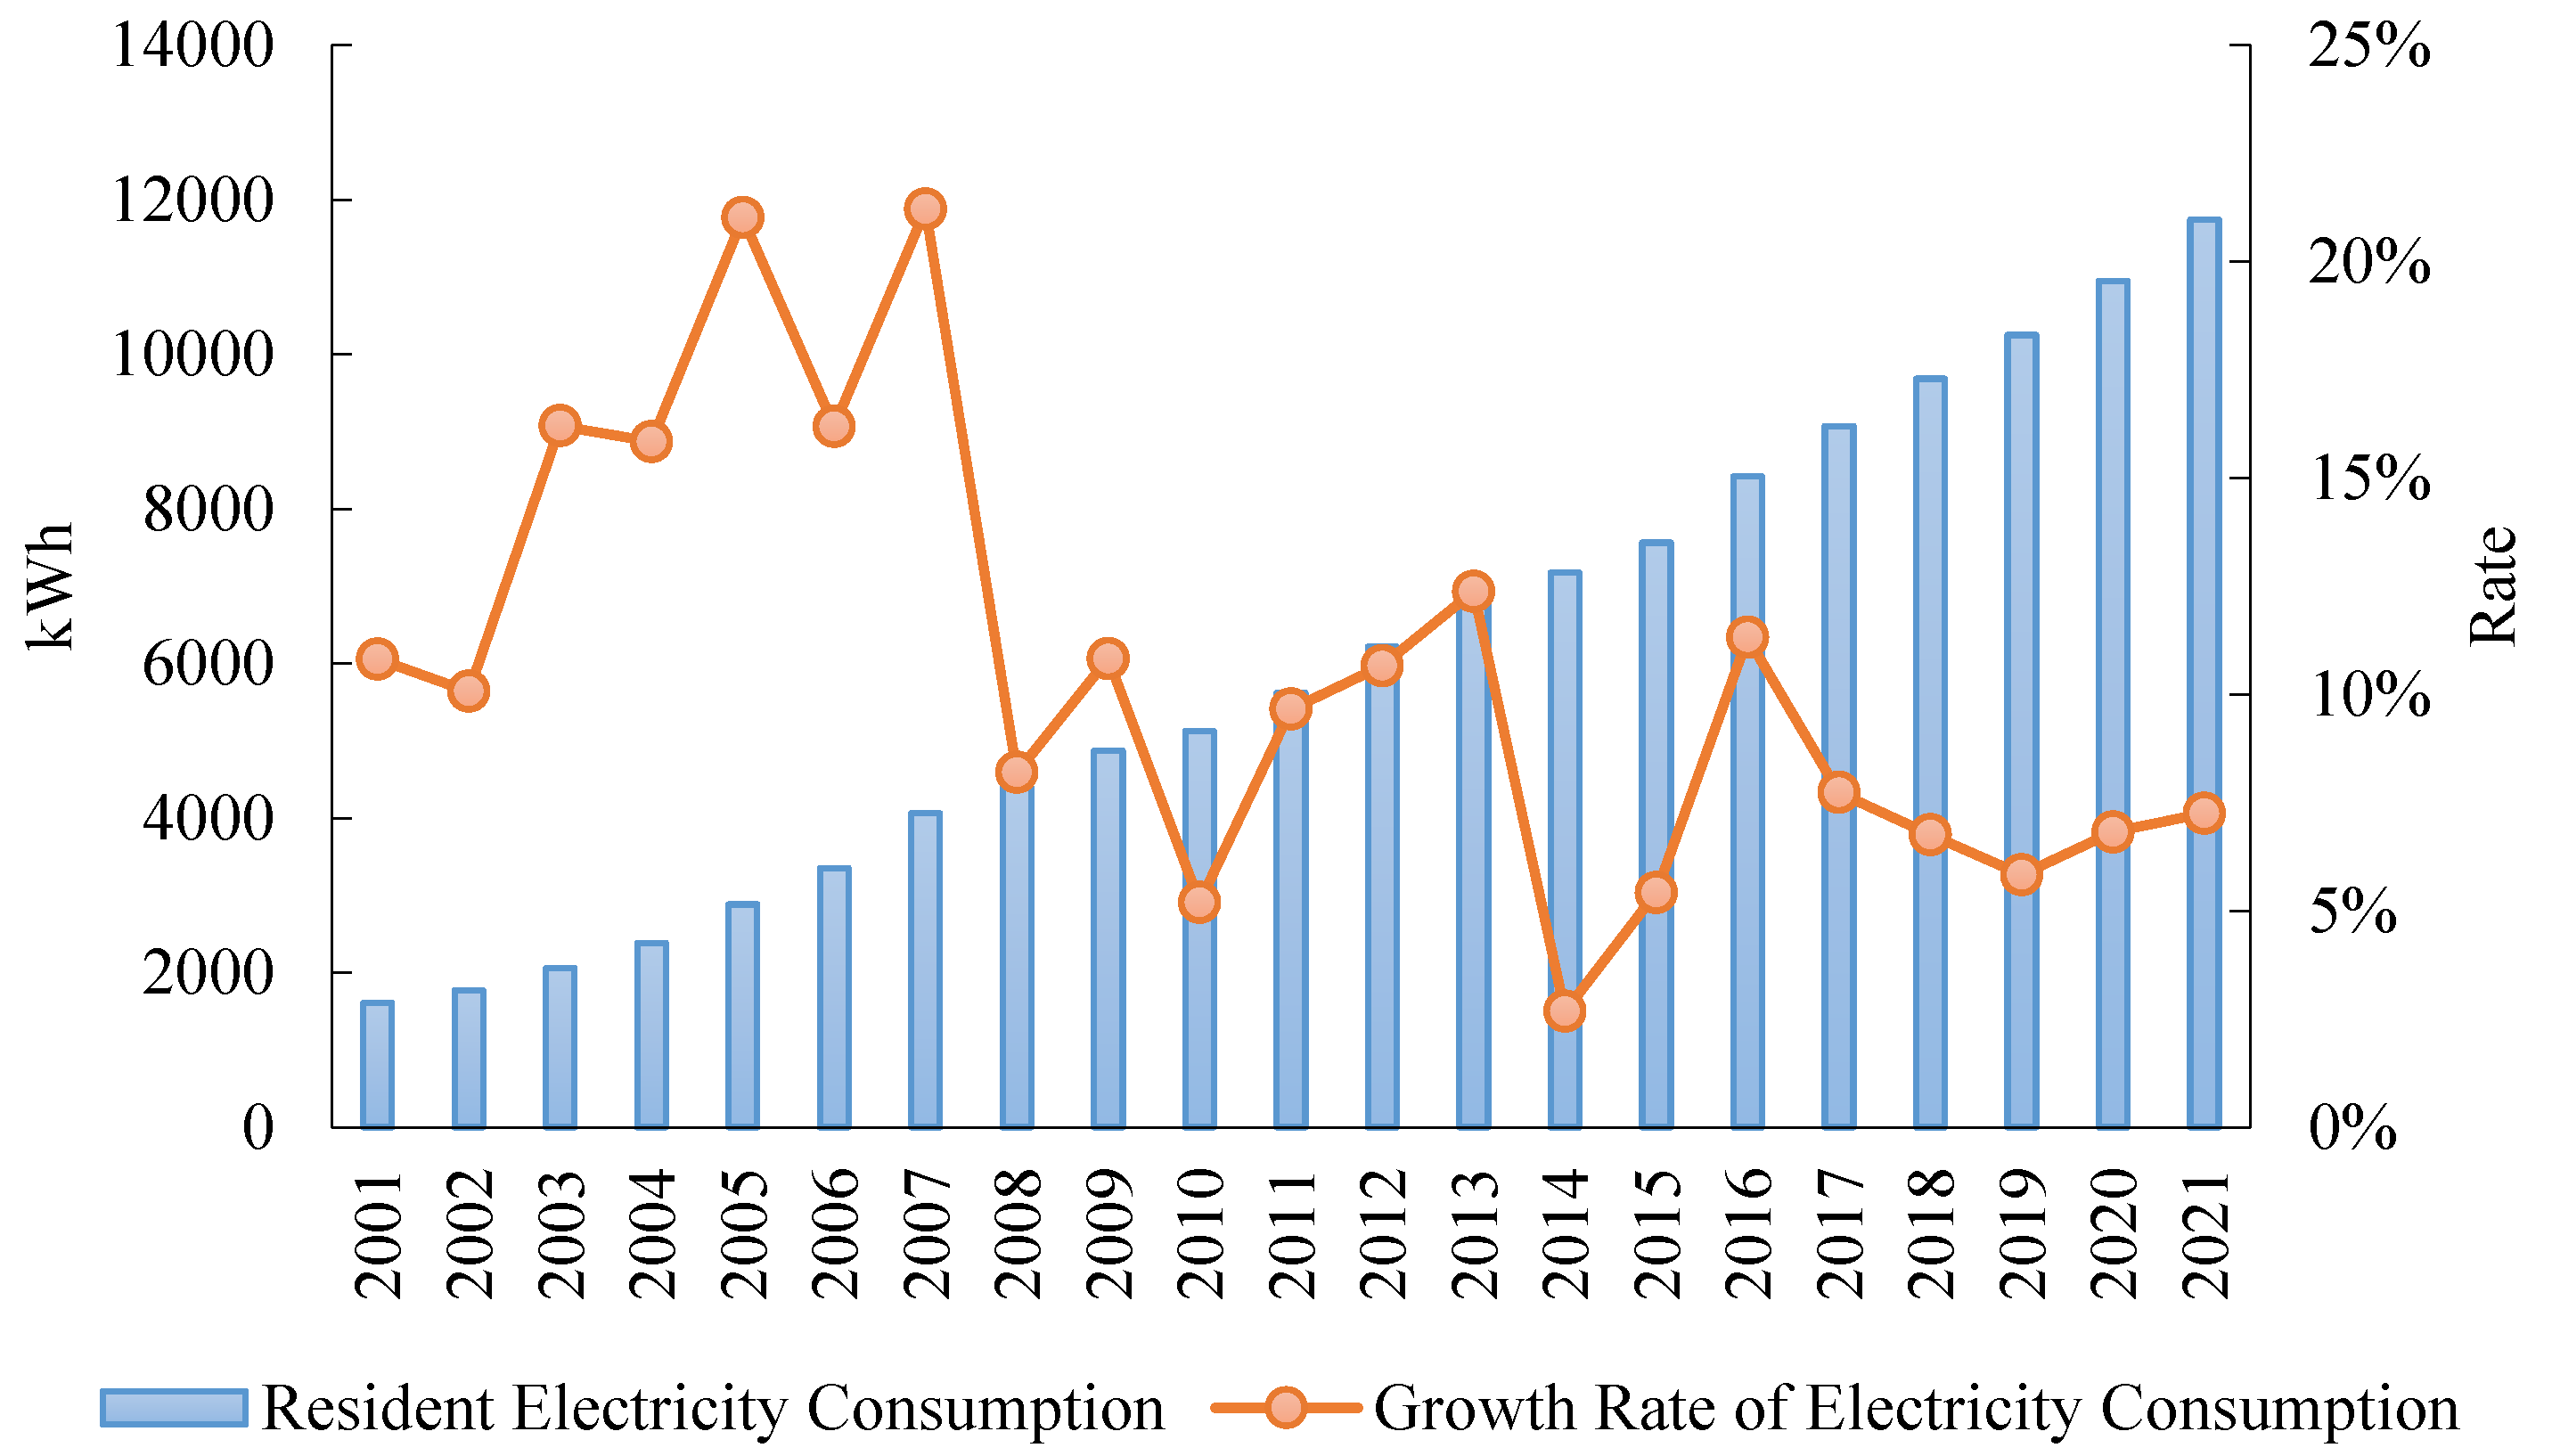
In recent years—with the rapid development of China’s economy and the continuous improvement of residents’ living standards—to promote social equity, the Chinese government through administrative means provides all households with low-cost electricity, which has led to a significant growth rate in residents’ electricity consumption. In 2021, the total direct electricity consumption by Chinese households was 1174.3 billion kWh, an increase of 6.76 percent from 2020. China is in the stage of accelerated urbanization development. Chinese people are gradually modernizing their lifestyle with increasing electrification, as electricity consumption is positively related to economic development [11]. In the future, the electricity consumption of Chinese residents will need to be increased [12], which further highlights the importance of electricity consumption in daily life and overall energy consumption. In addition, China has pledged to be carbon neutral by 2060 and will begin reducing carbon dioxide emissions in the coming decades. Improving energy efficiency is an important measure to reduce energy consumption and carbon dioxide emissions [13]. The Chinese government actively improves energy efficiency through a series of measures, including technological innovation, the establishment of relevant laws, and government target planning, and expects to reduce the total electricity consumption [14]. However, the electricity consumption of Chinese residents has not been effectively controlled, which is reflected of the slow decline in the growth rate of electricity consumption. As shown in Figure 1, since 2001, the growth rate of China’s household electricity consumption has fluctuated from approximately 5% to 20%. In 2014, the growth rate of electricity consumption dropped to the lowest point. After 2015, the growth rate of electricity consumption rebounded and remained at approximately 5%. This phenomenon shows that the improvement of energy efficiency often cannot fully achieve the expected energy-saving effect. Therefore, there is great potential for residents to save electricity [15], and it is necessary to promote household electricity saving behaviors [16].
At present, the academic community generally believes that residents’ electricity saving behavior is of great significance to reduce the total energy consumption and improve the atmospheric environment [17]. Research on residential electricity consumption has been carried out since 1970. Looking at the literature, the main factors affecting residential electricity consumption include two aspects: one aspect is the economic factor. Electricity and energy costs have a crucial impact on residents’ energy-saving behavior [18]. At the same time, residents’ electricity demands depend on the level of income and electricity prices [19]. Linden et al. believe that income is the most important factor affecting residents’ energy-saving behavior. Middle-income people have higher energy-saving intentions and are more willing to purchase energy-saving products that have slightly higher prices; however, these residents have a lower tendency to save energy in life [20]. A South Korean study found that higher electricity pricing has less of an impact on household electricity spending [21]. Since electricity is a necessity of life, changes in its price have a limited impact on residents, the consumption elasticity is low [22], and most residents are not sensitive to changes in electricity prices [23]. However, some scholars hold the opposite opinion. Ye et al. found that the tiered pricing policy of electricity can reduce residential electricity consumption by approximately 1.4%−3.0% [24]. Zhang et al. found that an approximately 40% increase in the marginal price of electricity would lead to a 35% decrease in residential electricity consumption [25]. Another aspect is the household characteristics of residents. Household lifestyle is significantly correlated with residential electricity usage [26], and the rapid reduction in household size stimulates the growth of electricity demand [27]. Tonooka et al. studied the energy consumption of Xi’an, China and found that the average power consumption of households with a larger number of residents is lower than that of households with fewer [28]. Kwakwa’s study of Egypt found significant differences in electricity consumption between rural and urban households [29]. Meanwhile, differences in age also lead to differences in electricity consumption. Sun and Feng found that the elderly in Chinese households not only have good electricity-saving habits themselves, but also have a positive impact on the electricity-saving awareness and behavior of younger groups in the family [30].
Generally, based on the benefits of power consumption, this consumption is considered a way to improve living conditions and bring potential health, educational, social, and economic benefits to people [31]. Based on the theory of social psychology and the research of other scholars, power consumption can improve residents’ happiness in two aspects [32]. On the one hand, electricity consumption will increase the comfort and convenience of residents and directly increase people’s sense of satisfaction and happiness; on the other hand, the installation and use of household appliances have resulted in a strong “demonstration effect” and neighborhood pride to residents [33], which also directly improves residents’ happiness. Although the impact of material consumption on people’s well-being is nonlinear [34], the marginal effect of electricity consumption is often positive, especially for residents in economically underdeveloped areas [35]. Since electricity consumption is a means to meet all important needs, we can say that it is considered an important source of human happiness and a means to promote human well-being [36]. For example, we need electricity to make the air conditioner work to adapt to temperature changes. We need electricity to make the refrigerator work and store food. Research by Ghali and El-Sakka found that electricity consumption per capita is highly correlated with economic development and other indicators of modern lifestyles, and it is worth noting that the more energy consumed in the form of electricity, the better the lives of residents [37]. Some scholars have found through the electricity consumption of 120 countries that countries with a higher per capita electricity consumption have a higher GDP and human development index [38]. Meanwhile, in Brazil, rural electrification has become an important factor in reducing energy poverty [39]. In addition, electricity consumption is critical to improving the well-being of people in less developed countries, especially in populous China [40]. The increase in electricity consumption will increase the utilization rate of household appliances [41], improve the quality of life of residents, and enhance the happiness of residents [42].
Based on the above literature, we summarize the shortcomings of existing research: The current research mainly focuses on the analysis of the influencing factors of residential electricity consumption, and little research has been conducted on the impact of residential electricity consumption on residents’ well-being. This paper attempts to approach this with true conditions in China using the data from the Chinese General Social Surveys of 2015 and 2018, using ordered probit regression and marginal effects to explore the impact of residential electricity consumption on residents’ happiness. The marginal contributions of this research are listed as follows: First, this paper deeply explores the impact of residential electricity consumption on residents’ subjective well-being and strengthens the understanding of building an energy-saving society while broadening the boundaries of residential energy-related research. Second, heterogenous characteristics, such as gender, education, age, and household income etc., are incorporated into the analysis framework of this paper to explore the differential impact of electricity consumption on the subjective well-being of different cohorts. In addition, the impacts of China’s energy conservation and emission reduction are also investigated, which contribute to provide a solid basis for improving the well-being of Chinese residents.
2. Data and Model Setting
2.1. Data Source and Sample Selection
In this paper, the data were from the Chinese General Social Survey (CGSS), which was initiated by The China Survey and Data Center of Renmin University of China in 2003. It carries out a cross-sectional survey of more than 10,000 Chinese mainland provinces, municipalities, and autonomous regions. This survey comprehensively collects data from society, community, family, and individual levels to summarize the trends of social change. Due to different question settings, this paper used the cross-sectional data of 2015 and 2018, excluding the missing values and outliers to guarantee data integrity. After pretreatment, a total of 5103 valid samples were reserved. According to the research of the later demand, we combined these data into mixed cross-sectional data, which enlarged the data capacity and representativeness, and investigated the variation trend of explanatory variables in each period through the fixed effect of the year to obtain more precise estimators and more effective test statistics.
2.2. Research Design and Variable Processing
The explained variable of this study was . We used the question in the Chinese General Social Survey (CGSS) data, “In general, do you think your life is happiness?” to measure Chinese residents’ happiness. takes values from 1 to 5, where 1 indicates “Extreme unhappy”, 2 means “Relatively unhappy”, 3 indicates “Feel general”, 4 indicates “Relatively happy”, and 5 means “Extreme happy”.
The explanatory variable of this paper was electricity consumption (). The data index came from the problem in CGSS data: “Average monthly electricity consumption”. We converted the average monthly electricity consumption into annual electricity consumption and took its natural logarithm as the explanatory variable.
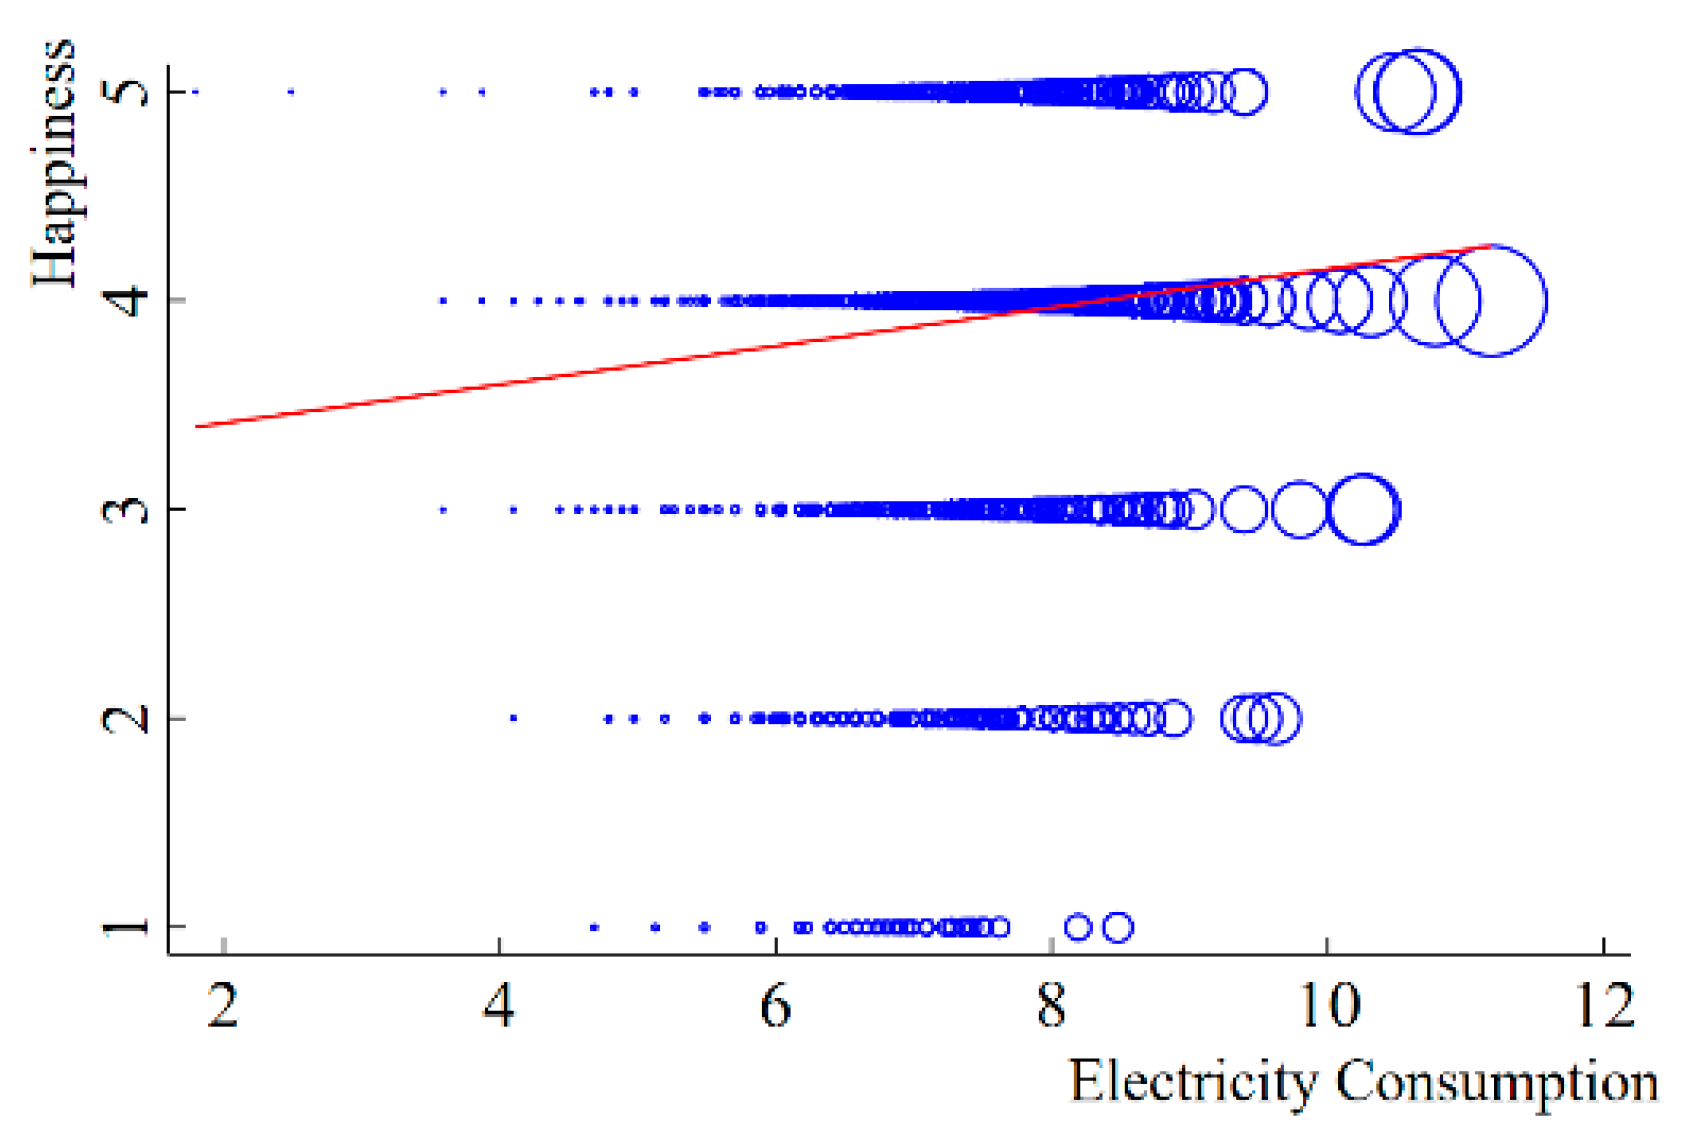
In this paper, the control variables are divided into three levels: The first is individual characteristic variables, including age, gender, education level, marriage status, political affiliation, residence account, and nationality; the second is individual working variables, including labor contract, type of working unit, and job position; the third is family characteristic variables, including house, residential area, car ownership, family size, annual household income, and annual household expenditure. Figure 2 shows the nuclear density diagram of the normal distribution of residential power consumption, which clearly reflects that most of the monthly electricity consumption of Chinese residents is concentrated in the range of 50 kWh to 250 kWh. Figure 3 shows the bubble fitting diagram of Chinese residents’ electricity consumption and happiness. This figure reflects that the higher the electricity consumption of Chinese residents, the higher their life satisfaction.
The explained variable in this study is ordered data, and OLS estimation is not applicable to this kind of data. Therefore, this paper uses the ordered probit model to estimate the explained variables. This model is an extended probit model that addresses the situations where the explained variables are sorted data. The model settings in this paper are as follows:
In Formula (1), is the explained variable, i.e., , which represents the happiness degree of residents; is the explained variable, on behalf of the residents of the annual electricity consumption; is a series of controlling variables of individual and family characteristics; denotes region fixed effect; year denotes fixed effect; α and are regression coefficients; and ε is the random error term. Table 1 reports the naming results of each variable and specifies the assignment method of the variable. F(•) is a nonlinear function. The specific form is:
In Formula (2), is the invisible continuous variable behind y, which is called the latent variable, in accordance with Formula (3):
is the tangent point, and all parameters are to be estimated.
2.3. Subsection
Table 2 lists the basic statistics of all variables in the measurement model. Happiness has a mean value of 3.8901, which indicates that residents usually feel generally and relatively happy, which explains why people’s happiness is above the medium level and hold an optimistic attitude towards life. The mean value of the variable “Gender” is 0.4744, indicating that more than half of the respondents in the data are female. Meanwhile, the variable “Residence account” of the mean value of 0.4348 shows that approximately 3/5 of respondents for the rural registered permanent residence, and approximately 2/5 of residents for urban registered permanent residence. In addition, the data showed that residents mostly had junior high school education degrees, which reflects the fact that China’s nine years of compulsory education is better. It is worth mentioning that the mean value of the variable “Labor contract” is 0.8489, which indicates that China’s Labor market is relatively regular, and more than 80% of residents have signed Labor contracts. What is more noteworthy is that the mean value of the variable “homeownership” is 0.9267, indicating that 92.67% of Chinese residents own their own houses, basically meeting the target of “housing” proposed by the Chinese government. The mean value of the variable “Annual household income” is slightly greater than that of the variable “Annual household expenditure”, which reflects that the income of Chinese residents exceeds expenditure, and their life is relatively prosperous.
3. Analysis of Empirical Results
3.1. Benchmark Regression
Table 3 reports the regression results of the influence of electricity consumption on Chinese residents’ happiness. To test the stability of the empirical results, we adopted the method of gradually putting control variables into the regression. Column (1) controls only explanatory variables, region fixed effects, and year fixed effects, and the results show that more electricity consumption can significantly increase the happiness of residents. Column (2) adds individual characteristic variables, and the explanatory variables are significant at the 1% statistical level. Column (3) adds individual work variables, and the regression results show that electricity consumption has a positive impact on the happiness of residents and is significant at the 1% statistical level. Column (4) incorporates all control variables into the model, and the result is significant at the 1% statistical level, which is consistent with the operating results of the first three models. In general, the influence direction and significance level of explanatory variables did not change significantly between columns, indicating that the model estimation is robust, further indicating that the increase in electricity consumption will significantly improve the happiness of Chinese residents. The increasing trend of electricity consumption is regarded as the effective way to improve the living conditions of residents, especially with the popularization of smart appliances in China, which not only improves the convenience and comfort of living, but also strengthens the “peer effect” of intelligent household appliances and neighborhood pride, further enhancing residents’ well-being directly.
In addition, individual and family characteristics are also demonstrated to have great impacts on residents’ subjective well-being. From the perspective of individual characteristics, residents’ subjective well-being presents an inverted U-shaped characteristic with the increase of individual age. Meanwhile, the happiness levels of males are relatively lower than those of females. Additionally, the higher levels of education are, the happier lives will be. Lastly, residents with homeownerships, cars, or relatively higher income levels show happier living statuses.
3.2. Robustness Checks
To examine the reliability of the regression results, this paper uses two methods to check the robustness. First, we replaced the explained variable. According to experience, if a person’s social status is higher, his life satisfaction will be higher. Therefore, this paper chooses to replace happiness with social status as the explanatory variable. The data indicators come from the CGSS questionnaire question, “How do you think your current social status”, and the value is based on the specific figures filled in by the respondents. At the same time, all the same control variables, provincial fixed effects, and year fixed effects are introduced to perform an ordered probit regression on the model. The regression results are shown in Column (1) of Table 4. The results show that the greater electricity consumption of residents, the higher their social status. Second, we used the method of replacing the regression model to check the robustness. As shown in Columns (2) and (3) of Table 4, wed use the ordered logit model and the Tobit model for regression, and the empirical steps are consistent with the ordered probit model. Through comparison, we found that whether it is the ordered logit model or the Tobit model, the regression results are all significant at the 1% level. The empirical results all supported the conclusion drawn by the ordered probit model, which further indicates that the more electricity consumed, the stronger the happiness of Chinese residents.
3.3. Placebo Test
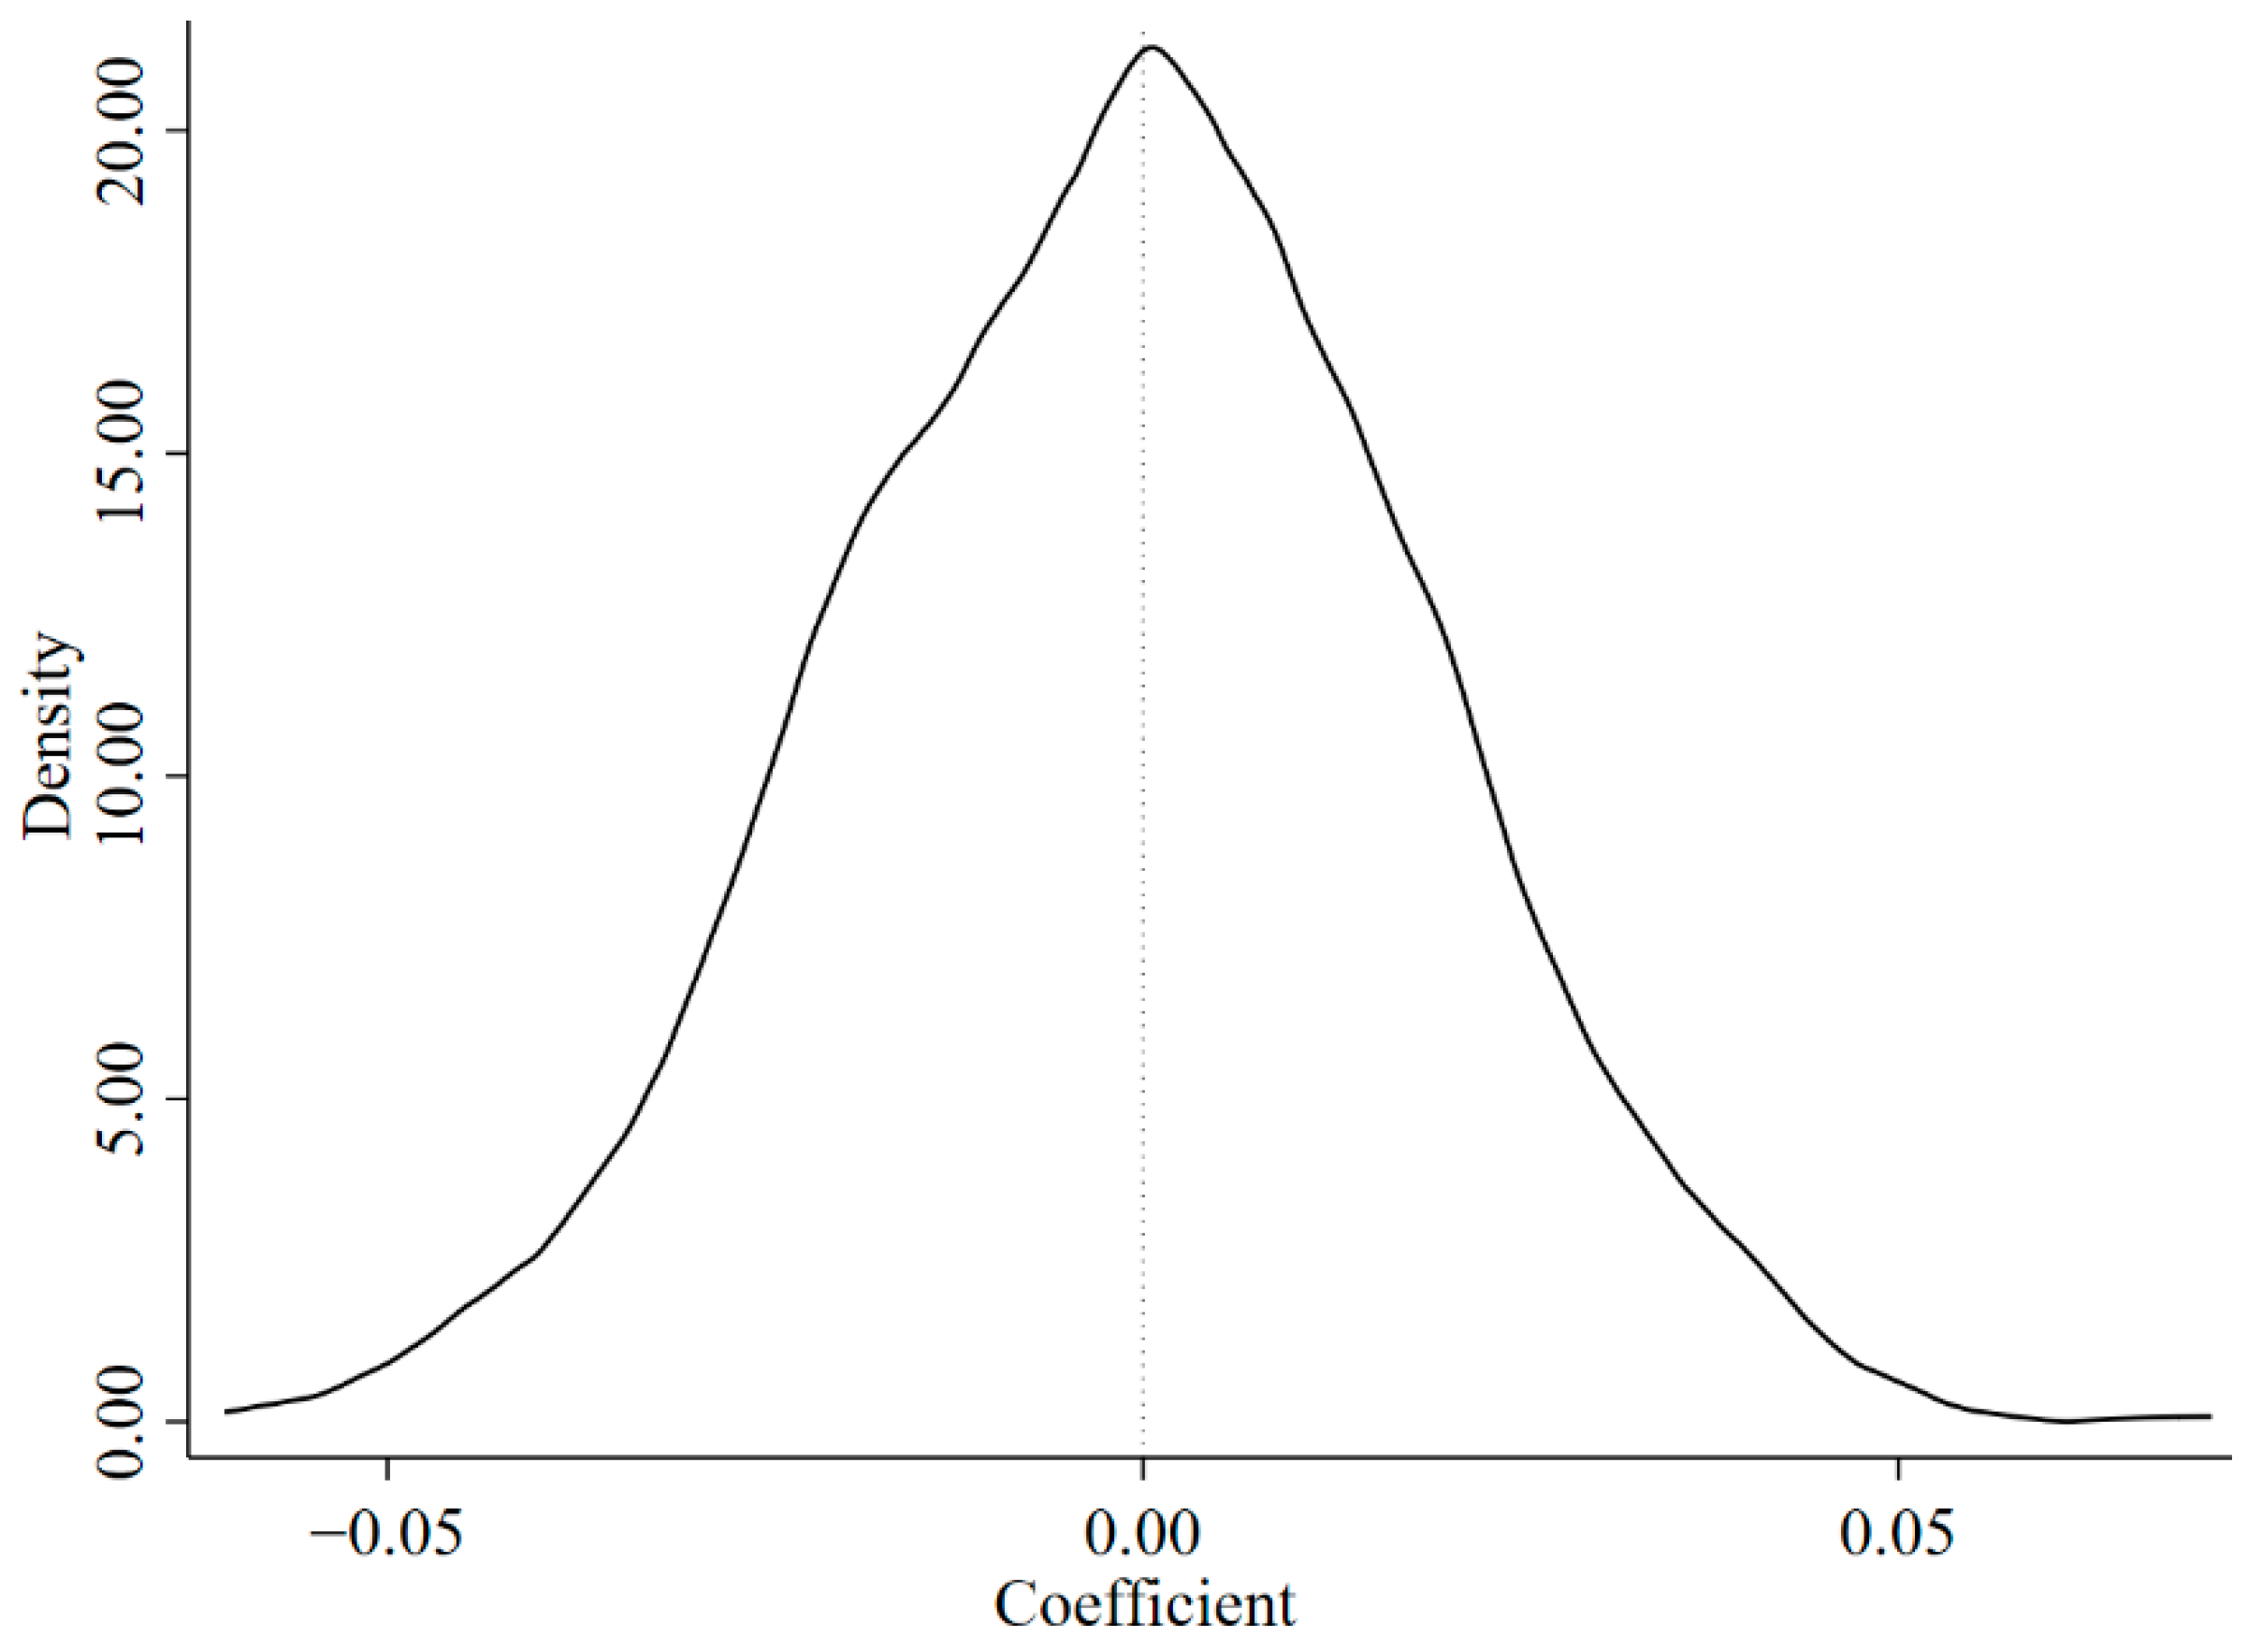
Due to the different economic development of China’s provinces, different regions have different characteristics. Although we added the provincial dummy variable to the regression equation to control the fixed characteristics at the interprovincial level and the year dummy variable to control the effect of the year fixed effect on the residents’ “happiness–electricity consumption”, these characteristics have different effects on age and educational background, nature of work, work units, and other groups that may have distinct impacts. To further verify that the regression results are not caused by sample error, this paper used the placebo test method to prove that the difference in residents’ happiness is caused by the amount of electricity consumption. First, we put the explanatory variable “electricity consumption” of residents into regression Equation (1) in random order for repeated regression to generate an estimated coefficient , and then we repeated this process a thousand times and finally generated 1000 . Figure 4 shows the distribution of , which is close to a standard normal distribution with a mean close to 0, indicating that the estimating equation passes the placebo test.
3.4. Marginal Utility
Since the meaning of the parameters of the ordered probit model is not intuitive, the results in Table 3 can only give limited information in terms of the significance and parameter sign. Thus, we used continuous marginal effects to calculate the marginal utility of the explanatory variable over . The involved in the two-stage regression is the fitted value of the latent variable obtained from the one-stage regression; therefore, is essentially a continuous variable. Thus, we can obtain the marginal effect of the probability of electricity consumption on the probability of residents’ happiness. As Formula (4) shows, the meaning of the continuous marginal effect is as follows: when the probability of changes value, how the probability of the explained variable changes each value is determined using the following equation:
Table 5 presents the calculation results of the marginal effect. When all variables are at the mean value, the probability of electricity consumption increases every , and the probability of happiness value “Extremely unhappy” decreases by 0.00168. The probability of happiness value “Relatively unhappy” decreases by 0.00609, and the probability of happiness value “Acceptable” decreases 0.00842. The probability of the happiness value “Relatively happy” increases 0.00125, and the probability of the happiness value “Extremely happy” increases 0.01502.
From the values shown in Table 5, it can be seen that for a resident whose other conditions are at an average level, the increase in electricity consumption reduces the probability of the resident choosing “Extremely unhappy”, “Relatively unhappy”, and “Acceptable”. Additionally, increased electricity usage increases the probability of residents choosing “Relatively happy” and greatly increases the probability of giving “Extremely happy”.
4. Heterogeneity Analysis
4.1. By Gender and Educational Degree
The theory of planned behavior points out that gender and education are important factors that affect the final behavior intention and behavior of individuals. Traditional Chinese culture follows the “men earn money to support their families outside, and women take care of their families at home” approach. Compared with men, women pay more attention to electricity consumption [43]. Furthermore, groups with higher education levels have higher levels of environmental cognition and are more aware of environmental responsibility, which may reduce energy consumption. Accordingly, this section further discusses whether there are gender and educational differences in the impact of electricity consumption on residents’ happiness.
Columns (1) and (2) of Table 6 show that electricity consumption has a significant, positive impact on females’ satisfaction towards life but has no significant effect on males’. We believe that there are two reasons: on the one hand, in China, males participate in less household labor than females, and they are not sensitive to the amount of household energy consumption, which lead to males’ insufficient awareness of energy conservation and greater randomness in electricity consumption; on the other hand, females are more willing to pay attention to how to save household energy. Not only is there a higher awareness of energy saving, but they are also willing to spend more time managing household energy consumption [44]. In addition, the popularization of household appliances such as washing machines and dishwashers have liberated females from housework time, allowing them to devote more time to leisure and entertainment. Therefore, the increased electricity consumption has improved females’ life satisfaction.
We refer to the people with education levels in junior college or undergraduate degrees or who have attained a master’s degree or doctor’s degree as the high-education group and people with other levels of education as the low-education group. The results in Columns (3) and (4) of Table 6 reflect that the higher the electricity consumption of the low-educated group, the higher their satisfaction towards life, but this trend is not significant for the high-educated group. As a rule, people with high levels of education generate a higher income, and their quality of life is greater than those with low levels of education. Electricity consumption does not significantly improve their quality of life. For people with low education, the increase in electricity consumption represents an increase in their household appliances, which can improve their leisure and entertainment conditions, reduce family labor time, and improve their life satisfaction.
4.2. By Age
The diversification of the population age structure will affect residents’ electricity consumption. Under the trend of the age of population, a difference in age structure will lead to a difference in residents’ electricity consumption. Table 7 shows the effect of electricity consumption on happiness for different age groups.
The results in Columns (1) and (2) show that a higher electricity consumption in the youth group (aged 18 to 35) and the middle-aged group (aged 35 to 60) correlated with a higher satisfaction towards life, with an increase of 10% for both groups. The results in Column (3) show that the amount of electricity consumed by the elderly over 60 years old is not significantly related to their well-being. On the one hand, most of the young and middle-aged groups have marriages and occupations, and they need to use more electronic products and household appliances. Independent cooking, washing, and other electricity consumption will lead to higher electricity consumption. In addition, electronic products such as computers and tablets are difficult to share when they are used [45], which will also lead to an increase in electricity consumption. However, the use of these household appliances improves the quality of life of young and middle-aged people, resulting in increased life satisfaction. On the other hand, the elderly group has more complex electricity consumption patterns compared with the young and middle-aged groups, such as longer times at home and aged products that consume high amounts of energy. However, the quality of life has not been greatly improved, and life satisfaction cannot be improved.
4.3. By Annual Household Income
There are differences in the energy demand of different income groups, which lead to distinct influences of the electricity consumption of different income groups on their well-being [46]. Table 8 shows the regression results of the happiness of residents of different income groups. According to the total income of the sample, the top 1/3 of the total income groups are listed as high-income groups, the last 1/3 of the total income groups are listed as low-income groups, and others are listed as middle-income groups. The regression results show that the coefficients of electricity consumption on the happiness of high- and low-income groups are positive and statistically significant within 1% and 5%, respectively, while the coefficients of electricity consumption on middle-income residents are not significant. This shows that the increase in electricity consumption significantly promotes the happiness of residents of high- and low-income groups. In contrast, the increase in electricity consumption does not promote the happiness of middle-income groups.
We believe that different income levels limit residents’ electricity consumption. CGSS data show that the ownership of computers, televisions, air conditioners, dryers, and other household appliances in low-income groups is lower than that of middle- and high-income groups. Therefore, even if the low-income group consumes a large amount of electricity, the small number of household electrical appliances limits the growth of their electricity consumption. However, it is worth noting that for low-income groups, owning household appliances will improve their quality of life and increase their satisfaction. With the development of the economy, the per capita income of Chinese residents continues to increase. After entering the middle-income range, residents eliminate the income restriction, the ownership of household appliances increases, and their electricity demand is greatly satisfied. Their satisfaction does not increase with the increase in electricity consumption. High-income groups have more household appliances and lower price sensitivity [47]. Household electricity costs are relatively low in China, and daily electricity consumption does not reduce their quality of life. Conversely, the utility of household appliances increases satisfaction among high-income groups.
4.4. By Living Space
According to data from the Ministry of Housing and Urban-Rural Development of China, in 2019, the per capita housing construction area of urban residents in China reached 39.8 square meters, and the per capita housing construction area of rural residents reached 48.9 square meters. The per capita housing area increased by nearly five times compared with 1979. Table 9 shows the differences in the happiness of residents with different living areas. Sorted by the size of the living area in the sample data, the 1/3 group with the largest living area is listed as large, the 1/3 group with the smallest living area is listed as small, and the others are listed as medium. The regression results show that the electricity consumption of the large group has a significant, positive correlation with their happiness, while the electricity consumption of the small and medium groups has no significant relationship with their happiness. This reflects that the expansion of the per capita living area will stimulate the growth of household electricity consumption, which means that it will further increase the pressure on energy conservation and emission reduction in future life.
5. Further Analysis: Is There a Nonlinear Effect?
The above analysis shows that residential electricity consumption has a significant, positive impact on residents’ happiness. However, the more electricity residents consume, the more money they spend on electricity, which may inhibit the happiness of residents. Therefore, this section explores whether there is an inverted U-shaped relationship between residential electricity consumption and residents’ happiness; that is, after residents’ residential electricity consumption reaches a certain extreme value, residents’ happiness will decrease with the increase in electricity consumption. Moreover, this section also studies whether there is an inverted U-shaped relationship between the influence of residential electricity consumption on the well-being of households with different incomes.
The regression results are shown in Table 10. Both the residential electricity consumption and the quadratic term of residential electricity consumption are not significant, indicating that there is a nonlinear relationship between residential electricity consumption and residents’ well-being and no inverted U-shaped relationship. This shows that residents have not yet felt the negative impact of excessive electricity consumption, and the increase in residential electricity consumption is constantly improving the quality of life of residents. The regression results of households with different annual incomes are shown in Table 11, and the quadratic terms of residential electricity consumption and residential electricity consumption are also not significant. This reflects that the increase in residential electricity consumption will increase the life satisfaction of Chinese residents regardless of their income level. At the same time, it also confirmed that Chinese residents’ awareness of electricity saving needs to be strengthened, and it is necessary to cultivate good electricity consumption habits in residents.
6. Conclusions and Policy Implications
6.1. Conclusions
At present, the total amount of residential electricity consumption continues to grow, and its proportion in China’s total energy consumption remains stable, which will gradually increase with China’s economic development, the rise of per capita income, and urbanization construction. How to reduce residential electricity consumption while improving residents’ quality of life plays a key role in controlling air pollution and reducing low-carbon emissions. This paper uses data from the Chinese General Social Survey in 2015 and 2018 to study the impact of residential electricity consumption on residents’ satisfaction towards life. The results of the study found that the more electricity consumed in a house, the higher the life satisfaction of residents. In addition, in the heterogeneity analysis, we found that the increase in residential electricity consumption will improve the satisfaction of females and people with low levels of education, but it has no significant effect on males and people with high levels of education. Moreover, the increase in residential electricity consumption has improved the satisfaction of young people and middle-aged people. Meanwhile, the increase in residential electricity consumption has a significant, positive impact on both low- and high-income households. Further analysis shows that there is no nonlinear relationship between the increase in residential electricity consumption and the improvement in satisfaction, and the same is true for the life satisfaction of families with different incomes. This paper conducted a series of tests on the empirical results, including the placebo test, and estimated that the results were robust.
6.2. Policy Implications
The conclusions of this paper have certain policy implications for reducing China’s residential energy consumption and improving residents’ quality of life: First, the Chinese government should widen the price difference between the current tiered electricity prices and improve the electricity saving awareness of residents with different incomes. Due to the increase in income and cheap electricity prices, the use of residents who are cognizant of electricity saving has been continuously decreasing. In the face of electricity price changes, the higher the electricity consumption is, the higher the electricity price increases, and the more effective it can be to change the electricity saving tendency of high-income residents. Therefore, the government can implement a more differentiated tiered electricity price to change the propensity of high-income people to use electricity while protecting the economic interests of low-income groups. Second, on the premise of ensuring the quality of life of low- and middle-income families and the consumption of daily electricity, the government can promote energy-saving and emission-reducing household appliances and green buildings. Furthermore, when restricting residential electricity consumption, the method of “decoupling” can be adopted; that is, the use of energy-saving bricks in building construction and the energy-saving renovation of houses can reduce the inefficient use of residential energy. Third, it is necessary to enhance residents’ awareness of electricity savings. Strengthening the publicity and education of residents’ awareness of energy conservation can improve residents’ willingness to save energy, effectively promote residents’ participation in energy-saving behaviors, promote green living, and improve residents’ satisfaction towards life.
Author Contributions
Conceptualization, Y.W. (Yidong Wu) and Y.W. (Yanbo Wu); methodology, Y.Z. and Y.W. (Yanbo Wu); software, Y.W. (Yanbo Wu); validation, Y.Z. and Z.S.; formal analysis, Z.S. and X.W.; investigation, Y.W. (Yanbo Wu); resources, Z.S. and Y.Z.; data curation, X.W. and Y.W. (Yanbo Wu); writing—original draft preparation, Y.W. (Yanbo Wu); writing—review and editing, Y.W. (Yidong Wu) and Y.Z.; visualization, Y.W. (Yidong Wu) and X.W.; supervision, X.W.; project administration, X.W. and Y.W. (Yidong Wu); funding acquisition, X.W. and Y.W. (Yidong Wu). All authors have read and agreed to the published version of the manuscript.
Funding
National Natural Science Foundation of China (71974003; 71874001); 2021 Anhui Province Universities Leading Backbone Talent Project “Urban Economy and Regional Development from the Perspective of Big Data”; Peking University-Lincoln Institute Center for Urban Development and Land Policy (PLC) Doctoral Dissertation Scholarship Project (DS10-20201001-WYD).
Data Availability Statement
The data presented in this study are available on request from the corresponding author.
Acknowledgments
The authors thank anonymous reviewers and editors for their insightful comments and suggestions.
Conflicts of Interest
The authors declare no conflict of interest.
References
- Brounen, D.; Kok, N.; Quigley, J.M. Energy literacy, awareness, and conservation behavior of residential households. Energy Econ. 2013, 38, 42–50. [Google Scholar] [CrossRef]
- Apergis, N.; Payne, J.E. A dynamic panel study of economic development and the electricity consumption-growth nexus. Energy Econ. 2011, 33, 770–781. [Google Scholar] [CrossRef]
- Niu, S.W.; Jia, Y.Q.; Wang, W.D.; He, R.F.; Hu, L.L.; Liu, Y. Electricity consumption and human development level: A comparative analysis based on panel data for 50 countries. Int. J. Electr. Power Energy Syst. 2013, 53, 338–347. [Google Scholar] [CrossRef]
- Bhide, A.S.; Monroy, C.R. Energy poverty: A special focus on energy poverty in India and renewable energy technologies. Renew. Sustain. Energy Rev. 2011, 15, 1057–1066. [Google Scholar] [CrossRef]
- Kanagawa, M.; Nakata, T. Analysis of the energy access improvement and its socio-economic impacts in rural areas of developing countries. Ecol. Econ. 2007, 62, 319–329. [Google Scholar] [CrossRef]
- Niu, S.; Zhang, X.; Zhao, C.; Ding, Y.; Niu, Y.; Christensen, T.H. Household energy use and emission reduction effects of energy conversion in Lanzhou city, China. Renew. Energy 2010, 36, 1431–1436. [Google Scholar] [CrossRef]
- Kaygusuz, K. Energy services and energy poverty for sustainable rural development. Renew. Sustain. Energy Rev. 2011, 15, 936–947. [Google Scholar] [CrossRef]
- Sugiyama, M. Climate change mitigation and electrification. Energy Policy 2012, 44, 464–468. [Google Scholar] [CrossRef]
- Wang, X.; Huang, H.; Hong, J.; Ni, D.; He, R. A spatiotemporal investigation of energy-driven factors in China: A region-based structural decomposition analysis. Energy 2020, 207, 118249. [Google Scholar] [CrossRef]
- Almeida, D.; Fonseca, A.; Barbara, S.P.; Nicolai, F. Characterization of the household electricity consumption in the EU, potential energy savings and specific policy recommendations. Energy Build. 2011, 43, 1884–1894. [Google Scholar] [CrossRef]
- Guang, F.; Wen, L.; Basil, S. Energy efficiency improvements and industry transition: An analysis of China’s electricity consumption. Energy. 2022, 244, 122625. [Google Scholar] [CrossRef]
- Yuan, J.; Zhao, C.; Yu, S.; Hu, Z. Electricity consumption and economic growth in China: Cointegration and co-feature analysis. Energy Econ. 2007, 29, 1179–1191. [Google Scholar] [CrossRef]
- Ray, G. The rebound effect, gender and social justice: A case study in Germany. Energy Policy 2015, 86, 759–769. [Google Scholar]
- Zeng, M.; Yang, Y.; Wang, L.; Sun, J. The power industry reform in China 2015: Policies, evaluations and solutions. Renew. Sustain. Energy Rev. 2016, 57, 94–110. [Google Scholar] [CrossRef]
- Ouyang, J.; Kazunori, H. Energy-saving potential by improving occupants’ behavior in urban residential sector in Hangzhou City, China. Energy Build. 2009, 41, 711–720. [Google Scholar] [CrossRef]
- Wang, B.; Yuan, Z.; Liu, X.; Sun, Y.; Zhang, B.; Wang, Z. Electricity price and habits: Which would affect household electricity consumption? Energy Build. 2021, 240, 110888. [Google Scholar] [CrossRef]
- Gram-Hanssen, K.; Kofod, C.; Petersen, K.N. Different everyday lives: Different patterns of electricity use. In Proceedings of the 2004 American Council for an Energy Efficient Economy, Pacific Grove, CA, USA, 22–27 August 2004; Volume 7, pp. 1–13. [Google Scholar]
- Huang, H.; Hong, J.; Wang, X.; Chang-Richards, A.; Zhang, J.; Qiao, B. A spatiotemporal analysis of the driving forces behind the energy interactions of the Chinese economy: Evidence from static and dynamic perspectives. Energy 2021, 239, 122104. [Google Scholar] [CrossRef]
- Kristina, E.K.; Patrik, S. The devil is in the details: Household electricity saving behavior and the role of information. Energy Policy 2010, 38, 1578–1587. [Google Scholar]
- Chapman, D.; Mount, T.; Tyrrell, T. Electricity Demand Growth and the Energy Crisis: An analysis of electricity demand growth projections suggests overestimates in the long run. Science 1972, 178, 703–708. [Google Scholar] [CrossRef]
- Lindén, A.L.; Carlsson, K.A.; Björn, E. Efficient and inefficient aspects of residential energy behaviour: What are the policy instruments for change? Energy Policy 2006, 34, 1918–1927. [Google Scholar] [CrossRef]
- Kim, H. Estimating demand response in an extreme block pricing environment: Evidence from Korea’s electricity pricing system, 2005–2014. Energy Policy 2019, 132, 1076–1086. [Google Scholar] [CrossRef]
- Zsuzsanna, C. Price and income elasticities of residential and industrial electricity demand in the European Union. Energy Policy 2020, 137, 111079. [Google Scholar]
- Cheung, L.T.O.; Chow, A.S.Y.; Lincoln, F.; Yu, K.; Chou, K. The effect of self-determined motivation on household energy consumption behaviour in a metropolitan area in southern China. Energy Effic. 2016, 10, 549–561. [Google Scholar] [CrossRef]
- Ye, B.; Ge, F.; Rong, X.; Li, L. The influence of nonlinear pricing policy on residential electricity demand—A case study of Anhui residents. Energy Strat. Rev. 2016, 13–14, 115–124. [Google Scholar] [CrossRef]
- Zhang, Z.; Cai, W.; Feng, X. How do urban households in China respond to increasing block pricing in electricity? Evidence from a fuzzy regression discontinuity approach. Energy Policy 2017, 105, 161–172. [Google Scholar] [CrossRef]
- Simon, R. Demographics, energy and our homes. Energy Policy 2008, 36, 4630–4632. [Google Scholar]
- Tonooka, Y.; Liu, J.; Kondou, Y.; Ning, Y.; Fukasawa, O. A survey on energy consumption in rural households in the fringes of Xian city. Energy Build. 2006, 38, 1335–1342. [Google Scholar] [CrossRef]
- Kwakwa, P.A. Electricity consumption in Egypt: A long-run analysis of its determinants. OPEC Energy Rev. 2017, 41, 3–22. [Google Scholar] [CrossRef]
- Sun, Y.; Feng, L. Influence of psychological, family and contextual factors on residential energy use behaviour: An empirical study of China. Energy Procedia 2011, 5, 910–915. [Google Scholar]
- Zahnd, A.; Kimber, H.M. Benefits from a renewable energy village electrification system. Renew. Energy 2007, 34, 362–368. [Google Scholar] [CrossRef] [Green Version]
- Xu, Z.L.; Ge, R. The Impact of Energy Consumption Revolution on Farmers’ Happiness: An Empirical Analysis from China. Front. Public Health 2022, 10, 778002. [Google Scholar] [CrossRef] [PubMed]
- Zimmermann, S. The Pursuit of Subjective Well-Being through Specific Consumption Choice. Electron. J. 2014. [Google Scholar] [CrossRef]
- Easterlin, R.A. Does Economic Growth Improve the Human Lot? Some Empirical Evidence. In Nations and Households in Economic Growth; Academic Press: Cambridge, MA, USA, 1974; pp. 89–125. [Google Scholar] [CrossRef]
- Du, K.R.; Yu, Y.; Wei, C. Climatic impact on China’s residential electricity consumption: Does the income level matter? China Econ. Rev. 2020, 63, 101520. [Google Scholar] [CrossRef]
- Neila, B.A. The Relationship between Energy Consumption, Economic Growth and Happiness. J. Econ. Dev. 2019, 44, 41–57. [Google Scholar]
- Ghali, K.H.; El-Sakka, M.I. Energy use and output growth in Canada: A multivariate cointegration analysis. Energy Econ. 2004, 26, 225–238. [Google Scholar] [CrossRef]
- Kanagawa, M.; Nakata, T. Assessment of access to electricity and the socio-economic impacts in rural areas of developing countries. Energy Policy 2008, 36, 2016–2029. [Google Scholar] [CrossRef]
- Pereira, M.G.; Freitas, M.A.; Silva, N.F. Rural electrification and energy poverty: Empirical evidences from Brazil. Renew. Sustain. Energy Rev. 2010, 14, 1229–1240. [Google Scholar] [CrossRef]
- Mazur, A. Does increasing energy or electricity consumption improve quality of life in industrial nations? Energy Policy 2011, 39, 2568–2572. [Google Scholar] [CrossRef]
- Chapagain, K.; Kittipiyakul, S.; Kulthanavit, P. Short-Term Electricity Demand Forecasting: Impact Analysis of Temperature for Thailand. Energies. 2020, 13, 2498. [Google Scholar] [CrossRef]
- Mazur, A.; Rosa, E.A. Energy and life-style. Science 1974, 186, 607–610. [Google Scholar] [CrossRef]
- Brough, A.R.; Wilkie, J.E.B.; Ma, J.; Isaac, M.S.; Gal, D. Is Eco-Friendly Unmanly? The Green-Feminine Stereotype and Its Effect on Sustainable Consumption. J. Consum. Res. 2016, 43, 567–582. [Google Scholar] [CrossRef] [Green Version]
- Ariva, S.P.; Norsiah, A.A.; Chin, S.H. Is mom energy efficient? A study of gender, household energy consumption and family decision making in Indonesia. Energy Res. Soc. Sci. 2015, 6, 78–86. [Google Scholar]
- Hidenori, N. Effects of social participation and the emergence of voluntary social interactions on household power-saving practices in post-disaster Kanagawa, Japan. Energy Policy 2013, 54, 397–403. [Google Scholar]
- Saeed, M.; Kamil, A. Rebound effect of efficiency improvement in passenger cars on gasoline consumption in Canada. Ecol. Econ. 2017, 131, 330–341. [Google Scholar]
- Kenneth, S.; Kurt, V.D. Fuel Efficiency and Motor Vehicle Travel: The Declining Rebound Effect. Energy J. 2007, 28, 25–51. [Google Scholar]
Figure 1.
2001–2021 China resident electricity consumption and growth rate. Data source: China National Bureau of Statistics.
Figure 1.
2001–2021 China resident electricity consumption and growth rate. Data source: China National Bureau of Statistics.

Figure 2.
Kernel distribution of electricity consumption.

Figure 3.
Happiness and electricity consumption.

Figure 4.
Placebo test.


Table 1.
Variable definition.
| Variable | Variable Assignment Description | |
|---|---|---|
| Explained variable | Extremely happy = 5, Relatively happy = 4, Acceptable = 3, Relatively unhappy = 2, Extremely unhappy = 1 | |
| Explanatory variable | ) | Natural logarithm of annual electricity consumption |
| Individual characteristic variables | Age | Age ≤ 20 = 1, 20 < Age ≤ 30 = 2, 30 < Age ≤ 40 = 3, 40 < Age ≤ 50 = 4, 50 < Age ≤ 60 = 5, 60 < Age ≤ 70 = 6, 70 < Age ≤ 80 = 7, 80 < Age ≤ 90 = 8, Age > 90 = 9 |
| Gender | Male = 1, Female = 0 | |
| Education degree | Unschooled = 0, Elementary school = 6, Middle school = 9, High school = 12, Junior college = 15, Undergraduate = 16, Master’s or doctoral = 19 | |
| Marriage | Married = 1, Unmarried = 0 | |
| Political affiliation | Party member of CPC = 1, Other = 0 | |
| Residence account | City account = 1, Rural account = 0 | |
| Nation | Han nationality = 1, Other = 0 | |
| Individual working variables | Labor contract | Signing labor contract = 1, No labor contract signed = 0 |
| Kind of working unit | State-owned firms = 1, Non-state firms = 0 | |
| Job position | Employers = 1, Employees = 0 | |
| Family characteristic variable | Homeownership | Housing owner = 1, Otherwise = 0 |
| Residential area | Natural logarithm of residential area | |
| Car ownership | Own a car = 1, Without owning = 0 | |
| Family size | The specific figures filled in by the respondents in the questionnaire shall prevail | |
| Annual household income | Less than 10,000 = 1, 10,000 to 20,000 = 2, 20,000 to 30,000 = 3, 30,000 to 40,000 = 4, 40,000 to 50,000 = 5, 50,000 to 60,000 = 6, 60,000 to 70,000 = 7, 70,000 to 80,000 = 8, 80,000 to 90,000 = 9, More than 90,000 = 10 | |
| Annual household expenditure | Less than 5000 = 1, 5000 to 10,000 = 2, 10,000 to 15,000 = 3, 15,000 to 20,000 = 4, 20,000 to 30,000 = 5, 30,000 to 40,000 = 6, 40,000 to 50,000 = 7, 50,000 to 60,000 = 8, 60,000 to 70,000 = 9, More than 70,000 = 10 | |
Table 2.
Variable descriptive statistics.
| Variable | Mean | Std. Dev | Min | Max | Observations |
|---|---|---|---|---|---|
| Happiness | 3.8901 | 0.8110 | 1 | 5 | 5103 |
| Electricity consumption | 7.1727 | 0.8257 | 1.7918 | 11.1844 | 5103 |
| Age | 4.5409 | 1.6281 | 1 | 9 | 5103 |
| Gender | 0.4744 | 0.4994 | 0 | 1 | 5103 |
| Education degree | 8.6004 | 4.7202 | 0 | 19 | 5103 |
| Marriage | 0.7999 | 0.4001 | 0 | 1 | 5103 |
| Political affiliation | 0.1027 | 0.3036 | 0 | 1 | 5103 |
| Residence account | 0.4348 | 0.4958 | 0 | 1 | 5103 |
| Nation | 0.9320 | 0.2518 | 0 | 1 | 5103 |
| Labor contract | 0.8489 | 0.3582 | 0 | 1 | 5103 |
| Kind of working unit | 0.0749 | 0.2632 | 0 | 1 | 5103 |
| Job position | 0.3259 | 0.4688 | 0 | 1 | 5103 |
| Homeownership | 0.9267 | 0.2606 | 0 | 1 | 5103 |
| Residential area | 4.5495 | 0.6341 | 1.6094 | 7.6009 | 5103 |
| Car ownership | 0.2212 | 0.4151 | 0 | 1 | 5103 |
| Family size | 2.8560 | 1.3727 | 1 | 14 | 5103 |
| Annual household income | 5.1732 | 3.2778 | 1 | 10 | 5103 |
| Annual household expenditure | 5.0221 | 2.7151 | 1 | 10 | 5103 |
Table 3.
Benchmark regression.
| Variables | Explained Variable: Happiness | |||
|---|---|---|---|---|
| (1) | (2) | (3) | (4) | |
| Electricity consumption | 0.123 *** (0.020) | 0.115 *** (0.019) | 0.114 *** (0.019) | 0.059 *** (0.019) |
| Age | 0.220 *** (0.040) | 0.228 *** (0.039) | 0.236 *** (0.040) | |
| Square of age | −0.439 *** (0.092) | −0.445 *** (0.092) | −0.420 *** (0.096) | |
| Gender | −0.092 *** (0.031) | −0.098 *** (0.030) | −0.091 *** (0.031) | |
| Education degree | 0.009 ** (0.004) | 0.009 ** (0.004) | 0.002 (0.004) | |
| Marriage | 0.147 *** (0.056) | 0.145 ** (0.056) | 0.085 (0.059) | |
| Political affiliation | 0.178 *** (0.038) | 0.179 *** (0.039) | 0.129 *** (0.042) | |
| Residence account | 0.028 (0.034) | 0.022 (0.035) | −0.015 (0.039) | |
| Nation | 0.077 (0.068) | 0.077 (0.068) | 0.098 (0.068) | |
| Labor contract | 0.047 (0.046) | 0.035 (0.045) | ||
| Kind of working unit | −0.038 (0.078) | −0.049 (0.079) | ||
| Job position | 0.080 (0.056) | 0.027 (0.056) | ||
| Homeownership | 0.188 ** (0.091) | |||
| Residential area | 0.064 * (0.035) | |||
| Car ownership | 0.176 *** (0.059) | |||
| Family size | 0.022 (0.014) | |||
| Annual household income | 0.041 *** (0.007) | |||
| Annual household expenditure | 0.005 (0.009) | |||
| Year fixed effects | Yes | Yes | Yes | Yes |
| Regional fixed effect | Yes | Yes | Yes | Yes |
| /cut1 | −1.653 *** (0.178) | −3.803 *** (0.579) | −3.769 *** (0.593) | −3.248 *** (0.623) |
| /cut2 | −0.812 *** (0.155) | −2.954 *** (0.574) | −2.919 *** (0.589) | −2.388 *** (0.614) |
| /cut3 | −0.157 (0.157) | −2.292 *** (0.564) | −2.257 *** (0.580) | −1.713 *** (0.605) |
| /cut4 | 1.604 *** (0.161) | −0.516 (0.568) | −0.481 (0.585) | 0.089 (0.610) |
| Observations | 5103 | 5103 | 5103 | 5103 |
Notes: Standard errors in parentheses; *** p < 0.01, ** p < 0.05, * p < 0.1.
Table 4.
Robustness check.
| Variables | Explanatory Variable: Social Stratum | Explanatory Variable: Happiness | |
|---|---|---|---|
| (1) | (2) | (3) | |
| Ordered Probit | Ordered Logit | Tobit | |
| Electricity consumption | 0.065 ** (0.026) | 0.105 *** (0.037) | 0.042 *** (0.013) |
| Individual characteristic variables | Yes | Yes | Yes |
| Individual working variables | Yes | Yes | Yes |
| Family characteristic variable | Yes | Yes | Yes |
| Year fixed effects | Yes | Yes | Yes |
| Regional fixed effect | Yes | Yes | Yes |
| Observations | 5103 | 5103 | 5103 |
Notes: Standard errors in parentheses; *** p < 0.01, ** p < 0.05.
Table 5.
Marginal utility.
| Variables | Explanatory Variable: Electricity Consumption | ||||
|---|---|---|---|---|---|
| Happiness | dy/dx | Standard Error | Z Statistics | p Value | Significance |
| 1 | −0.00168 | 0.00065 | −2.62 | 0.010 | ** |
| 2 | −0.00609 | 0.00226 | −2.72 | 0.007 | *** |
| 3 | −0.00842 | 0.00308 | −2.74 | 0.007 | *** |
| 4 | 0.00125 | 0.00061 | 2.05 | 0.042 | ** |
| 5 | 0.01502 | 0.00548 | 2.74 | 0.007 | *** |
Notes: Standard errors in parentheses; *** p < 0.01, ** p < 0.05.
Table 6.
Heterogeneity analysis from the perspectives of gender and education level.
| Variables | Explanatory Variable: Happiness | |||
|---|---|---|---|---|
| (1) | (2) | (3) | (4) | |
| Gender | Educational Degree | |||
| Male | Female | Lower Education | Higher Education | |
| Electricity consumption | 0.045 (0.032) | 0.075 ** (0.030) | 0.053 ** (0.023) | 0.080 (0.066) |
| Individual characteristic variables | Yes | Yes | Yes | Yes |
| Individual working variables | Yes | Yes | Yes | Yes |
| Family characteristic variable | Yes | Yes | Yes | Yes |
| Year fixed effects | Yes | Yes | Yes | Yes |
| Regional fixed effect | Yes | Yes | Yes | Yes |
| Observations | 2421 | 2682 | 4310 | 793 |
Notes: Standard errors in parentheses; ** p < 0.05.
Table 7.
Heterogeneity analysis from the perspectives of age.
| Variables | Explanatory Variable: Happiness | ||
|---|---|---|---|
| (1) | (2) | (3) | |
| 18–35 | 35–60 | More than 60 | |
| Electricity consumption | 0.092 * (0.053) | 0.072 ** (0.031) | 0.047 (0.040) |
| Individual characteristic variables | Yes | Yes | Yes |
| Individual working variables | Yes | Yes | Yes |
| Family characteristic variable | Yes | Yes | Yes |
| Year fixed effects | Yes | Yes | Yes |
| Regional fixed effect | Yes | Yes | Yes |
| Observations | 979 | 2573 | 1551 |
Notes: Standard errors in parentheses; ** p < 0.05, * p < 0.1.
Table 8.
Heterogeneity analysis from the perspectives of annual household income.
| Variables | Explanatory Variable: Happiness | ||
|---|---|---|---|
| (1) | (2) | (3) | |
| Low-Income | Middle-Income | High-Income | |
| Electricity consumption | 0.085 ** (0.038) | −0.013 (0.038) | 0.109 *** (0.040) |
| Individual characteristic variables | Yes | Yes | Yes |
| Individual working variables | Yes | Yes | Yes |
| Family characteristic variable | Yes | Yes | Yes |
| Year fixed effects | Yes | Yes | Yes |
| Regional fixed effect | Yes | Yes | Yes |
| Observations | 1638 | 1740 | 1725 |
Notes: Standard errors in parentheses; *** p < 0.01, ** p < 0.05.
Table 9.
Heterogeneity analysis from the perspectives of living space.
| Variables | Explanatory Variable: Happiness | ||
|---|---|---|---|
| (1) | (2) | (3) | |
| Small | Medium | Large | |
| Electricity consumption | 0.035 (0.039) | 0.061 (0.039) | 0.090 ** (0.037) |
| Individual characteristic variables | Yes | Yes | Yes |
| Individual working variables | Yes | Yes | Yes |
| Family characteristic variable | Yes | Yes | Yes |
| Year fixed effects | Yes | Yes | Yes |
| Regional fixed effect | Yes | Yes | Yes |
| Observations | 1565 | 1787 | 1751 |
Notes: Standard errors in parentheses; ** p < 0.05.
Table 10.
Further analysis: test of nonlinear effect.
| Variables | Explained Variable: Happiness | |||
|---|---|---|---|---|
| (1) | (2) | (3) | (4) | |
| Electricity consumption | −0.168 (0.244) | −0.193 (0.239) | −0.184 (0.237) | −0.085 (0.238) |
| Square of electricity consumption | 0.021 (0.017) | 0.022 (0.017) | 0.021 (0.017) | 0.010 (0.017) |
| Individual characteristic variables | No | Yes | Yes | Yes |
| Individual working variables | No | No | Yes | Yes |
| Family characteristic variable | No | No | No | Yes |
| Year fixed effects | Yes | Yes | Yes | Yes |
| Regional fixed effect | Yes | Yes | Yes | Yes |
| Observations | 5103 | 5103 | 5103 | 5103 |
Notes: Standard errors in parentheses.
Table 11.
Further analysis: tests of nonlinear effects among various annual household income subgroups.
Table 11.
Further analysis: tests of nonlinear effects among various annual household income subgroups.
| Variables | Explanatory Variable: Happiness | ||
|---|---|---|---|
| (1) | (2) | (3) | |
| Low-Income | Middle-Income | High-Income | |
| Electricity consumption | −0.202 (0.325) | −0.129 (0.284) | 0.020 (0.367) |
| Square of electricity consumption | 0.021 (0.024) | 0.008 (0.021) | 0.006 (0.025) |
| Individual characteristic variables | Yes | Yes | Yes |
| Individual working variables | Yes | Yes | Yes |
| Family characteristic variable | Yes | Yes | Yes |
| Year fixed effects | Yes | Yes | Yes |
| Regional fixed effect | Yes | Yes | Yes |
| Observations | 1638 | 1740 | 1725 |
Notes: Standard errors in parentheses.
Publisher’s Note: MDPI stays neutral with regard to jurisdictional claims in published maps and institutional affiliations. |
© 2022 by the authors. Licensee MDPI, Basel, Switzerland. This article is an open access article distributed under the terms and conditions of the Creative Commons Attribution (CC BY) license (https://creativecommons.org/licenses/by/4.0/).
Share and Cite
MDPI and ACS Style
Wu, Y.; Wu, Y.; Zhang, Y.; Wang, X.; Song, Z. The Effect of Building Electricity Consumption on Residents’ Subjective Well-Being: Evidence from China. Buildings 2022, 12, 710. https://0-doi-org.brum.beds.ac.uk/10.3390/buildings12060710
AMA Style
Wu Y, Wu Y, Zhang Y, Wang X, Song Z. The Effect of Building Electricity Consumption on Residents’ Subjective Well-Being: Evidence from China. Buildings. 2022; 12(6):710. https://0-doi-org.brum.beds.ac.uk/10.3390/buildings12060710
Chicago/Turabian StyleWu, Yidong, Yanbo Wu, Yalin Zhang, Xianzhu Wang, and Zisheng Song. 2022. "The Effect of Building Electricity Consumption on Residents’ Subjective Well-Being: Evidence from China" Buildings 12, no. 6: 710. https://0-doi-org.brum.beds.ac.uk/10.3390/buildings12060710
Note that from the first issue of 2016, this journal uses article numbers instead of page numbers. See further details here.