
Experimental Investigation of Novel Angle Bracket Connection in Cold-Formed Steel Structures


Department of Structural Engineering and Technical Mechanics, Faculty of Civil Engineering, University of Rijeka, Radmile Matejčić 3, 51000 Rijeka, Croatia
*
Author to whom correspondence should be addressed.
Buildings 2022, 12(8), 1115; https://0-doi-org.brum.beds.ac.uk/10.3390/buildings12081115
Submission received: 4 July 2022
/
Revised: 21 July 2022
/
Accepted: 26 July 2022
/
Published: 28 July 2022
(This article belongs to the Special Issue Structural Performance of Cold-Formed Steel Structures)
Abstract
:In this study, an innovative fabricated angle bracket connection for joining cold-formed steel structures is presented and investigated. The innovation lies in the especially designed and manufactured angle bracket and in the method of connecting the angle bracket for the C-profile using clinch pressing. This novel angle bracket can be used to connect cold-formed steel elements such as beam trusses at the ends of the chords or for anchoring the column base. Five specimens were fabricated and experimentally tested under monotonic tensile loading until failure. A specific tool was developed to properly hold C-profiles. Three displacement measurement procedures were performed, and the appropriate method was used to analyse the test results. The main failure mechanism of the angle bracket connection determined by the tests was pull-through of the M12 bolt, whose resistance is compared with the calculated values according to the AISI S100-16 and EN 1993-1-3 standards. There was no bearing failure in the innovative connection between the C-profile and the angle bracket, which indicates an increase in the bearing capacity of the connection.
1. Introduction
Cold-formed steel (CFS) structures, over the past two decades, have attracted a lot of attention in the construction industry because of their suitability for modular construction and industrial production. Despite the many advantages of CFS, which include low self-weight, high product quality thanks to controlled production, economy of transport and assembly and short construction time, the issue of joining thin-walled profiles remains very important. Many authors have researched cold-formed steel structures and proposed different connection techniques for the joining of thin-walled profiles. Various solutions are applicable, including welding, riveting, joining with bolts and self-drilling screws, blind rivets, etc. [1,2]. Screw connections are the most widely used solution due to their fast installation and the possibility of a direct connection between thin-walled profiles. Bolted connections are not as widely used as screwed ones, but provide a more precise assembly. Other solutions include cold-pressed joints [3,4,5], joints with self-piercing rivets [6,7], and joints with various types of patented connectors [8,9]. Some companies manufacture a wide range of connectors for CFS constructions, primarily for screw connections [10,11]. The most common option for floor joists or truss beams is hanging connectors. For all of these types of joints, the weak components are the thin sheets on which screws or bolts are installed. Due to the shear or tensile load, the sheets fail by means of the fasteners’ bearing and tearing or pull-through and pull-out. As a consequence, the joints may have lower stiffness and ductility, which has negative effects on the global stiffness and ductility of the whole structure.
CFS truss beams are widely used in portal frames and lightweight floor joists. Single-channel or back-to-back channel sections are used as chord and web members, connected with bolts or screws, to transfer axial forces to other members through shear in the connector [8]. On the truss ends, where shear forces are greater, gusset plates are used to ensure force transfer to the ends of trusses without failure, as shown in Figure 1a.
In this study, a novel angle bracket for CFS bolted connection in a thin-walled structure is proposed. A novel angle bracket can be used to connect CFS beam trusses on the ends of the chords (Figure 1a) or for anchoring the CFS column base, as shown in Figure 1b. In practice, truss floor beams or joists are generally embedded in-between the walls to reduce the height of the building, but then they behave as freely supported beams. If the truss beams are designed as continuously supported beams, they stand with a bottom chord on top of the walls. The disadvantage of this design is that it demands a greater structure height. Furthermore, extra girders that transfer the load from the upper floor must be installed at the point of support of the truss on the wall, in the direction perpendicular to the direction of the truss. Another way of achieving continuity is to extend the truss through the wall, while the top chord stands on top of it. This approach requires complex design and assembly. Additionally, the upper chord carries all of the load from the truss to the wall, necessitating additional stiffening for the load transferring area.
Unlike the previously described designs, the solution given in this paper allows for the continuity of truss floor beams over multiple spans without interfering with the continuity of the walls in terms of height.
The innovative geometry (Figure 2) and connection method allowing connection to the thin-walled C-profile are essential features of the novel angle bracket. A novel angle bracket with eight protrusions is first positioned on the predrilled holes on the web of the C-profile, after which it is pressed under high pressure, forming a rigid connection. The C-profile is then, through an angle bracket, bolted to the adjacent structural element with a single M12 bolt (Figure 3).
The main objective of this research was to obtain the load-bearing capacity with the belonging deflection and failure mode of the angle bracket connection. In this context, an experimental investigation was necessary to understand the joint behaviour and to correctly assess the load transfer mechanisms. Moreover, the load–displacement curves may provide information that can be used in the design process of such types of joints. Laboratory testing of the novel angle bracket was performed for the tensile component of the CFS truss beam-to-column connection (Figure 3). A special tool for holding test specimens was developed to carry out the laboratory test. Based on the established failure modes of the angle bracket, the required design resistance checks for engineers in practical applications are defined. The resistance of the angle bracket was calculated using existing formulations defined in the AISI S100-16 [12] and EN 1993-1-3 [13] standards, and it was compared to laboratory test results.
2. Experimental Study
2.1. Specimen Description
The specimens in Figure 4a represent the tension chord of the CFS truss, which has a built-in angle bracket at one side of the element. The tension chord is formed of a thin-walled C-profile, while the specimens have a total length of 405 mm and a nominal thickness of 1.15 mm (Figure 4b). Eight ∅13 holes were previously prepared along the upper edge of the C-profile, opposite the angle bracket, for screwing the test specimen to the test tool. The nominal width of the cross-section should be 89 mm and the height 42 mm. However, when installing the angle bracket, the press widens the edges of the cross-section, so that the dimensions show some deviations. The measured dimensions of the test specimens are shown in Table 1.
Materials
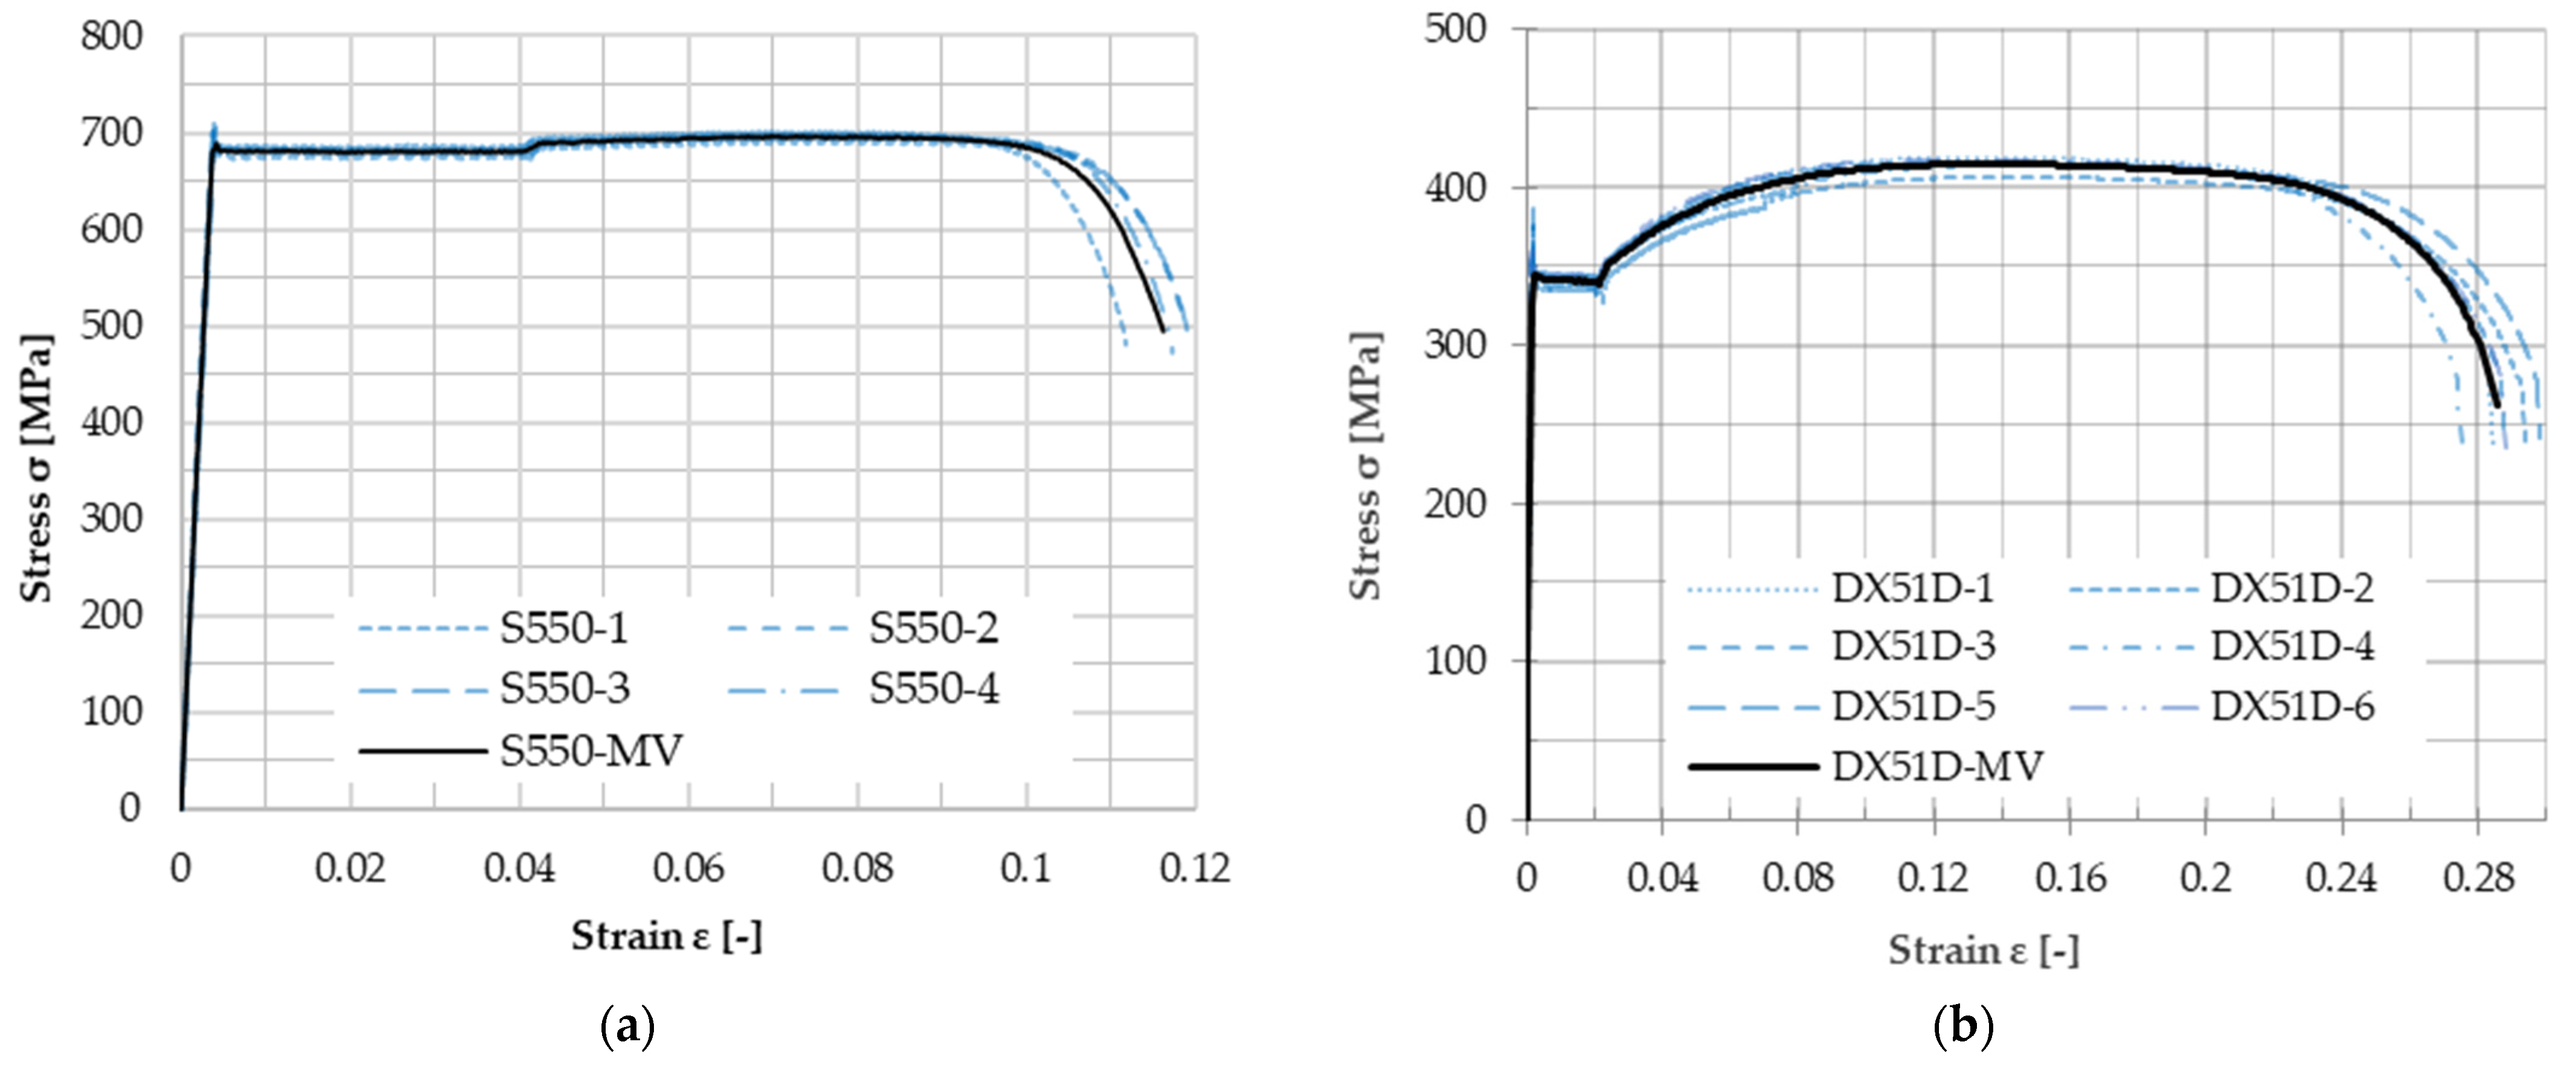
The C-profile is made of steel S550 GD, while the angle bracket is made of steel DX51D-Z275. Uniaxial tensile tests were performed at room temperature to verify the mechanical properties of the steel in accordance with method A of the EN ISO 6892-1:2019 standard for metallic materials [14]. A total of ten specimens were tested, four of which were S550 GD with a thickness of 1.15 mm and six of which were DX51D-Z275 steel with a thickness of 3 mm. The geometry and dimensions of the steel specimens are shown in Figure 5.
Stress-Strain curves for each material are shown in Figure 6. while the values of Young’s modulus , upper yield stresses and tensile strengths for every specimen are given in Table 2 and Table 3. Elongation was measured with external extensometers on a gauge length of 50 mm, strains at yield points, percentage total extension at maximum force, and at fracture for every specimen are shown in Table 2 and Table 3 with average values and standard deviation.
2.2. Test Tools
To ensure adequate grip of the test specimens in the test machine jaws without slipping between the tool and C-profile, a special tool was designed and manufactured. Additionally, numerical simulations of the test tool and specimen joint were performed using the finite element method to estimate the required prestressing force of the connecting bolts.
The test tool consists of three parts: an upper and lower tool for connecting to the hydraulic jaws, and a rigid block that is inserted into the specimen. To allow for adequate specimen loading, two joint systems with opposite rotating directions were built. Upper and lower joints are made up of two plates welded to a steel block and connected to another part of the joint or specimen by a pin or bolts. Two M16 × 35 bolts connect the upper joint to the steel rigid block. An M12 × 20 bolt connects the lower joint to the angle bracket’s shorter side. The geometry and dimensions of the test tools are shown in Figure 7. The steel rigid block is hinged to the upper tool with an M16 bolt of 10.9 steel grade, while the lower part of the rigid block, which has eight predrilled threaded holes, is connected to a C-profile with a total of eight M12 bolts of 10.9 steel grade. To ensure a rigid, non-slip joint between the steel rigid block and the test specimen, the M12 bolts are preloaded with a maximum force of 50 kN, corresponding to a tightening torque of 120 Nm. The required tightening torque was calculated according to EN 1993-1-8 [15] and confirmed using numerical simulations in ABAQUS.
Figure 8a shows a numerical model of the joint between the test tool and the specimen. A 1.15-mm-thick C-profile was modelled using quad-dominated S4R linear shell elements, while the steel rigid block was modelled using R3D4, linear rigid shell elements. M12 bolts were modelled as C3D8R linear solid elements with a major diameter of, 12 mm and were connected to a rigid block with tie constraints. The C profile material was defined using an elastoplastic material model, which is described by the stress–strain ratio obtained from the universal tensile test that was performed. Bolt steel grade 10.9 was modelled as a bilinear elastoplastic material with yield strengths of 900 and 1100 MPa at 5% plastic strain, respectively. To represent a threaded bolt load, the pretension force must be reduced by the ratio of gross area to stress area because the bolts are modelled with the major diameter without threads. A bolt-load of 37 kN was then used to achieve preload in bolts, which represents a force of 50.5 kN in the stress area of a threaded bolt. The penalty method was used in the tangential direction between the bolt head and C-profile surface-to-surface contact. The coefficient of friction was not measured; instead, the authors in [16] used a 0.19 coefficient of friction, while hard contact was used in the normal direction. Around the holes, between the bolt and the edge of the C-profile, node to surface contact was used. When sliding occurs, the friction force between the tool and the C profile is 75.78 kN. Figure 8b illustrates the Von Misses stresses on the C profile beneath the bolt heads at the specified force, which is equal to 681.38 MPa. The shown stresses are less than the material’s yield strength. As previously stated, the test tool was designed with an obtained friction force in mind so that it could be used for other tests with C-profiles as well.
2.3. Test Setup and Measuring Equipment
The laboratory tests were performed on the universal tension-compression test machine Zwick/Roell Z600. Test management and data registration were carried out using TestXpert II software. The specimens were tested using hydraulic jaws with a capacity of up to 500 kN. The test setup is shown in Figure 9 and Figure 10. The tension in the specimen is applied using the displacement control of the movable crosshead at a test speed of 2.5 mm/min. During the test, the axial force and displacements in the moving crosshead were recorded.
The displacement measurements on the specimens were carried out using two different techniques: a linear variable differential transformer (LVDT) and digital image correlation technology (DIC), and a non-contact 3D optical measurement system based on the measured displacement field. The LVDT measuring equipment was set in two positions, as shown in Figure 9. The LVDT 1—OMEGA LD320-25, with a measuring range of +/−25 mm—was set to measure the vertical displacement of the bolt head, while the LVDT 2—OMEGA LD320-5, with a measuring range of +/−5 mm—was used to measure the vertical displacement of the C-profile at a distance of 200 mm from the lower edge of the specimen. For the first three specimens (Ab-1 to Ab-3), displacement measurements were carried out with LVDT measuring devices, while for the fourth specimen (Ab-4), the DIC technique was used. For all of the specimens (Ab-1 to Ab-5), the displacement of the moving crosshead of the UTM was used. The DIC system consists of an optical measuring system ARAMIS 12M with two cameras with a focal length of 12 mm and a spotlight mounted between the cameras. The DIC system was calibrated using a standard procedure and a GOM/CP 20/MV 350 × 280 mm2 aluminium calibration plate. GOM Correlate software was used for recording and data extraction. A maximum number of 353 frames per experiment was set, and the recording speed of 0.625 fps was maintained throughout the experiment. The shooting angle was adjusted to capture the entire specimen and to maintain the recommended angle of 20° between the camera pair and the distance of 360 mm from the specimen. The surface of the specimen is marked with a facet size of 16 pixels (an area of 4.16 × 4.16 mm), with a centre point distance of 9 pixels. For better visibility with the DIC system, the specimen was painted with a matt white primer spray over a length of 200 mm to reduce reflections from the galvanised steel. After priming, a black spray was used for the pattern and dot markings were applied to the test tool and the edge of an angle bracket as shown in Figure 10.
3. Results
The test results are presented graphically with force–displacement curves and in tables with characteristic values. To determine an adequate measurement method, different types of displacement measurements were carried out and the results obtained using an adequate method were analysed.
3.1. Comparison of the Results Obtained by Different Measuring Techniques
The time–displacement curves and the force–displacement curves obtained by measurements with an LVDT and a universal testing machine (UTM) are shown in Figure 11a,b, while the measurements with the DIC system and the universal testing machine are shown in Figure 11c,d. The dashed lines represent the results of specimens (Ab-1–Ab-3) measured with the LVDT devices, while continuous lines represent the results of specimens (Ab-1-M–Ab-3-M). In Figure 11c,d, the letter A in Ab-4-A represents the results of ARAMIS 12M cameras, while M in Ab-4-M stands for the machine in the UTM. Due to the eccentricity of the specimen, there is a rotation of the sample at the beginning of the test. Although the LVDT only measures axial displacement, it is not able to evaluate the influence of rotation, which is why the results obtained are insufficient. Therefore, the component of the displacement caused by the rotation of the specimen must be subtracted from the measured displacement. When the rotation of the specimen is completed and there is only axial displacement, the LVDTs continue to measure correctly, which is visible in the diagrams in Figure 11a,b as horizontal displacement shifts from 0 to 2 mm. The displacements on the specimens from Ab-1 to Ab-3 measured by LVDT measuring devices have a scatter of ±33%, so the displacements on specimen Ab-4 were measured using the digital image correlation technique.
A comparison of the results obtained with the different types of measuring devices is shown in Table 4 and Table 5. The results obtained with UTM were compared with those obtained with LVDT devices for the first three samples and with DIC for the fourth sample. The axial displacements on the sample measured by the DIC technique give the most accurate results when the rotations are excluded from the total measured displacement. Furthermore, the difference between the displacements measured with the UTM and the DIC measurement technique was 8.49%, which is negligible for the scope of this study. Therefore, displacements measured with the universal machine were used for further analysis.
3.2. Behavior of Angle Bracket
The results of the tensile test for the test specimens are shown in Table 6. The maximum force of 38.8 kN was recorded on specimen Ab-5 at a displacement of 11.1 mm. The average maximum force of the five specimens was 38.2 kN at 10.8 mm. Elastic stiffness was calculated in a range from 6000 N to 15,000 N, which is about 15% to 40% of the maximum force. The mean value of the elastic stiffness was 7.7 kN/mm, and was applicable to a force of 17.5 kN at 2.3 mm displacement, where plasticization of the angle bracket began. The ductility of the angle bracket was manifested by a plastic deformation that is 3.7 times greater than the elastic one.
The deformation of the angle bracket connection was primarily characterised by the bending of the angle bracket, which caused plastic deformation of the web edge of the C-profile due to the rigid connection visible in Figure 10. In addition, the plastic deformation of the radius area between the web and the flange caused a narrowing of the profile at the edge, as shown in Table 7 as the difference between the dimensions measured before and after the test. The narrowing of the upper width, d1, calculated with the mean values from Table 1 and Table 7, was 2.18% of the original width, while the lower width of the C-profile, d2, was narrowed by 2.23%. All test specimens failed with the same failure mechanism, by pull-through of the M12 bolt. The bolt was pulled through at the connection with the angle bracket at a force between 37.4 and 38.8 kN and a displacement between 10.37 and 11.01. During bolt penetration of the angle bracket flange, the bolt hole widened at the top near the stiffening darts, as shown in Figure 12a,b.
Force–displacement curves for the Ab test specimens represent the described behaviour and are shown in Figure 13. The test was stopped when a force drop of 15% was recorded on the test device. This was done for safety reasons in order to prevent sudden fracture and damage of measuring equipment. The deviations in the results for maximum force were relatively small and were about 3.6% and 1.9% for displacement.
The DIC measuring technique was used to determine the relative displacements between the C profile and the angle bracket. The results were then post-processed in GOM, where two referent points were compared. Point 1 was allocated to the C profile, and Point 2 to the angle bracket. Figure 14a shows the displacement of points in time, while Figure 14b shows a relative displacement of 0.02 mm at a test time of 245 s. The relative displacements are negligible, confirming the rigidity of the connection between the C-profile and the angle bracket. In addition, due to the very rigid connection of the clinch-pressed connectors, the C-profile follows the deformation of the angle, which is also shown as a displacement field in Figure 14c. Analysing the field reveals that the lever arm, z, is formed between the edge of the web of the C-profile and the outermost row of connectors, which helps to limit the angle bracket’s rotation.
The tested specimens are shown in ascending order from the left in Figure 15. During the removal of the test tool, the M12 bolt was removed without damaging the specimens Ab-2, Ab-3 and Ab-4.
4. Pull-Through Resistance
The main failure mode of the angle bracket is the pull-through of the M12 bolt, as determined by testing. This type of failure is very common in thin-walled sheets. In this study, the nominal pull-through resistances were calculated according to the two standards AISI S100-16 [12] and EN 1993-1-3 [13]. The calculated resistance values were compared with the values obtained by testing.
4.1. Pull-Through Resistance According to EN 1993-1-3 and EN 1993-1-8
EN 1993-1-3 [13] provides a calculation for the design resistance of bolted connections. Pull-through resistance for bolts loaded in tension must be determined by testing for the given range of thickness, which varies from 0.75 mm to less than 3 mm. For thicknesses greater than or equal to 3 mm, the guidelines given in EN 1993-1-8 [15] should be applied. In EN 1993-1-8 [15], the pull-through (punching shear) design resistance of individual bolts is given by Equation (1).
where
Bp,Rd = 0,6 π dm tp fu/γM2,
- dm is the mean of the across points and across flats dimensions of the bolt head or the nut, whichever is smaller;
- tp is the thickness of the plate under the bolt or the nut;
- fu is the tensile strength of the material; and
- γM2 is the partial safety factor for joints.
Pull-through or punching shear design resistance is calculated using Equation (1) for bolt head diameter dm = 23.8 mm according to DIN 6921 [17], with nominal thickness of the angle bracket t = 3 mm, tensile strength of the steel DX51D-Z275 fu = 414 MPa, and partial safety factor γM2 = 1.25 [15]. Pull-through or punching shear design resistance is equal to 44,559.8 N. The nominal pull-through resistance must be calculated without the partial safety factor γM2 for comparison with an experimental test, and is equal to 55,699.7 N.
4.2. Pull-Through Resistance According to AISI S100-16
In section J., connections and joints, part 4.4.2, nominal pull-through (in the AISI norm referred to as pull-over) strength of the sheet per screw is given by Equation (2);
where
Pnov = 1.5 t1 d’w Fu1,
- d’w is the effective pull-over diameter determined in accordance with (a), (b), (c) as per AISI S100-16 J.4.4.2 [12];
- t1 is the thickness of the plate under the bolt or the nut; and
- Fu1 is the tensile strength of the plate material.
For the same values of thickness and strength of the steel plate and bolt head diameter mentioned in Section 4.1., a calculation per Equation (2) was performed. The result of the nominal pull-through resistance was 44,346.9 N.
4.3. Comparison of the Calculated and Experimental Results
Table 8 shows a comparison of the pull-through resistance obtained by testing with those calculated according to American and European standards. The comparison is presented in the form of a resistance ratio.
5. Discussion
Five specimens were tested, and all showed the same behaviour. After the initial rotation of the specimen, the bending of the angle bracket begins, and the forces are transferred to the C-profile through the clinch-pressed connectors. The connection between the C-profile and the angle bracket transmits the tensile force by shear in the connectors. The bending due to the eccentricity of the angle bracket forms a lever arm between the web edge of the C-profile and an outermost row of connectors. This manifests as compressive force at the web edge of the C-profile and tensile force in the outermost connectors. Plastic deformations occur at the described critical point of the angle bracket and the C-profile, leading to a decrease in the slope of the force–displacement curve. When the stresses under the bolt head at the flange of the angle bracket exceed the yield strength, the M12 bolt starts to pull through. The bolt head widens the hole at the top, resulting in a decrease in the test load. The same failure mechanism occurred in all specimens tested experimentally. The average pull-through resistance of the M12 bolt is 38.2 kN at a displacement of 10.8 mm. In Section 4.3, the pull-through resistance was calculated according to two standards for the design of cold-formed steel. When calculating the design resistance in EN 1993-1-8 [15], the partial safety factor was removed from Equation (1) to allow a better comparison of the nominal values. AISI S100-S16 [12] recommends the use of Equation (2) only for screws less than 6.35 mm in diameter, but includes the plate thickness of 3 mm. Both standards give higher nominal values for pull-through resistance than the experimental tests. The calculation of pull-through resistance of bolts according to the standards assumes that the bolt head uniformly transfers the loads to the plate, which is not fully realized in the case of the angle bracket. This assumption will be confirmed by simulations in future work. At a certain point, the bolt stops following the rotations of the flange of the angle bracket. Then, the upper stiffer part of the flange transfers most of the load. Accordingly, non-uniform stress distribution is formed under the bolt head, and the mechanism of pull-through failure starts at the upper end of the hole.
6. Conclusions
This paper presented an experimental study of a novel angle bracket connector for bolted joints in thin-walled structures, considering the main failure mechanism. In addition to the experimental results, the calculations have shown that there is a lack of information on bolted joints in the standards for cold-formed steel, which may lead to an overestimation of joint resistance, in this case, pull-through resistance. Based on the tests and calculations performed, the following conclusions can be drawn:
- The displacements measured with the universal testing machine are accurate enough for engineering applications and deviate by less than 10% from the more accurate displacements measured using the DIC method. The displacements obtained by the DIC method should be used for finite element modelling and model validation because the elastic stiffness values were 16% different from those obtained with the universal testing machine.
- The use of an innovative angle bracket for connecting to thin-walled C-profiles was demonstrated to be a viable alternative to screws. The connection of the C-profile and the angle bracket by clinch pressing showed a rigid connection without relative displacements. The eccentric effect of the load on the angle connector produces a combined effect of shear and tensile load, resulting in clamping rather than pure shear.
- The main failure mechanism of the angle bracket is the pull-through of the M12 bolt, which can lead to complete separation of the connection.
- Calculation of pull-through resistance using EN 1993-1-8 and AISI S100-16 is overestimated and does not provide an adequate assessment of resistance for angle bracket connectors. To determine the pull-through resistance specified in the standards, the existing expressions must be modified, which will be investigated in future work.
- Despite the fact that the thickness of the angle bracket of 3 mm does not fall within the range of thicknesses greater than or equal to 0.75 mm and less than 3 mm specified by the EN1993-1-3 standard, we proposed a design by testing the method specified in the mentioned standard.
- The higher ductility steel DX51D-Z275 of the angle bracket compensates for the lower ductility of the high-strength steel S550 of the CFS C-profile, and can increase the overall ductility of a structure.
Author Contributions
Conceptualization, L.L., P.K. and A.B.; Methodology, L.L., P.K. and A.B.; Software, L.L. and A.B.; Validation, L.L., P.K. and A.B.; Formal Analysis, L.L., P.K. and A.B.; Investigation, L.L.; Resources, L.L., P.K. and A.B.; Writing—Original Draft Preparation, L.L. and A.B.; Writing—Review and Editing, P.K.; Visualization, L.L. and A.B.; Project Administration, P.K. All authors have read and agreed to the published version of the manuscript.
Funding
This research was funded by industrial project “Prefabricated buildings of almost zero energy produced in an industrial way”, Grant no. KK.01.2.1.02.0046, financed from the European Fund for Regional Development and UNIRI INOVA project “Innovative connector for connecting structural elements made of thin-walled steel C-profiles” with the financial support of the University of Rijeka.
Institutional Review Board Statement
Not applicable.
Data Availability Statement
The data presented in this study are available on request from the corresponding author.
Acknowledgments
The authors would like to thank the company Tehnoplast profili d.o.o. and Palijan d.o.o. for their help in producing specimens and test tools.
Conflicts of Interest
The authors declare no conflict of interest.
References
- Komara, I.; Wahyuni, E.; Suprobo, P. A study on Cold-formed Steel Frame Connection: A review. J. Technol. Sci. 2017, 28, 83–89. [Google Scholar] [CrossRef] [Green Version]
- Lee, Y.H.; Tan, C.S.; Mohammad, S.; Tahir, M.M.; Shek, P.N. Review on Cold-Formed Steel Connections. Sci. World J. 2014, 2014, 11. [Google Scholar] [CrossRef] [PubMed]
- Bučmys, Z.; Šaučiuvenas, G. The Behavior of Cold Formed Steel Structure Connections. Eng. Struct. Technol. 2013, 5, 113–122. [Google Scholar]
- Pedreschi, R.; Sinha, B.P.; Davies, R. Advanced Connection Techniques for Cold-Formed Steel Structures. J. Struct. Eng. 1997, 12, 138–144. [Google Scholar] [CrossRef]
- Pedreschi, R.; Sinha, B. Predicting the Shear Strength of Mechanical Clinching. J. Mater. Civ. Eng. 2006, 18, 435–442. [Google Scholar]
- Fiorino, L.; Macillo, V.; Landolfo, R. Experimental characterization of quick mechanical connecting systems for cold-formed steel structures. Adv. Struct. Eng. 2016, 20, 1098–1110. [Google Scholar] [CrossRef]
- Weiming, Y.; Tingting, M.; Zhiqiang, X.; Cheng, Y. Experimental investigation of typical connection for fabricated cold-formed steel structures. Adv. Struct. Eng. 2018, 22, 141–155. [Google Scholar]
- Da Silva, L.S.; Silva, L.C.; Tankova, T.; Craveiro, H.D.; Simoes, R.; Costa, R.; D’Aniello, M.; Landolfo, R. Performance of modular hybrid cold-formed/tubular structural system. Structures 2021, 30, 1006–1019. [Google Scholar] [CrossRef]
- Mathison, C.; Roy, K.; Clifton, C.G.; Ahmadi, A.; Masood, R.; Lim, B.P.J. Novel pin jointed moment connection for cold-formed steel trusses. Steel Compos. Struct. 2019, 31, 453–467. [Google Scholar]
- Simpson Strong-Tie. Connectors for Cold-Formed Steel Construction, 2020, C-CF-2020. Available online: https://www.strongtie.com/coldformedsteelconnectors/landing (accessed on 20 May 2022).
- Framecad. Connection Solutions for Cold formed Steel Construction. 2013. Available online: https://www.framecad.com/media/1488/framecad-connector-solutions-technical-manual.pdf (accessed on 20 May 2022).
- AISI S100-16. North American Specification for the Design of Cold-Formed Steel Structural Members; American Iron and Steel Institute: Washington, DC, USA, 2016. [Google Scholar]
- EN 1993-1-3. Eurocode 3—Design of Steel structures—Part 1–3: General Rules—Supplementary Rules for Cold-Formed Members and Sheeting; European Committee for Standardization: Brussels, Belgium, 2012. [Google Scholar]
- ISO 6892-1:2019. Metallic Materials—Tensile Testing—Part 1: Method of Test at Room Temperature; The International Organization for Standardization: Geneva, Switzerland, 2019. [Google Scholar]
- EN 1993-1-8. Eurocode 3: Design of Steel Structures—Part 1–8: Design of Joints; European Committee for Standardization: Brussels, Belgium, 2009. [Google Scholar]
- Quan, G.; Ye, J.; Li, W. Computational modelling of Cold-formed steel lap joints with screw fasteners. Structures 2021, 33, 230–245. [Google Scholar] [CrossRef]
- DIN 6921. Hexagon Flange Bolts; International Organization for Standardization: Geneva, Switzerland, 1983. [Google Scholar]
Figure 1.
Novel angle bracket used for (a) connecting CFS beam trusses, and (b) column anchoring of CFS column base.
Figure 1.
Novel angle bracket used for (a) connecting CFS beam trusses, and (b) column anchoring of CFS column base.

Figure 2.
Geometry and dimensions of novel angle bracket [mm].

Figure 3.
Double-sided truss beam-to-column connection with a novel angle bracket in the tension component of the truss chord.
Figure 3.
Double-sided truss beam-to-column connection with a novel angle bracket in the tension component of the truss chord.

Figure 4.
The specimens (a) from the top and bottom sides, as well as (b) with measured location.

Figure 5.
Geometry and dimensions of steel specimens [mm].

Figure 6.
Stress–strain curves for (a) S550 GD steel and (b) DX51D-Z275 steel.

Figure 7.
The geometry and dimensions of the test tools [mm].

Figure 8.
FE model displayed as (a) C-profile and block insert connection and (b) Von Mises stresses at corresponding slippage force.
Figure 8.
FE model displayed as (a) C-profile and block insert connection and (b) Von Mises stresses at corresponding slippage force.

Figure 9.
Test setup with (a) positions of LVDT devices on test specimen (mm) at (b) back view and (c) front view.
Figure 9.
Test setup with (a) positions of LVDT devices on test specimen (mm) at (b) back view and (c) front view.

Figure 10.
Test setup with DIC measuring system.

Figure 11.
Comparison of the results for (a,b) between LVDT measurements and UTM and (c,d) between the DIC measuring technique and UTM.
Figure 11.
Comparison of the results for (a,b) between LVDT measurements and UTM and (c,d) between the DIC measuring technique and UTM.

Figure 12.
Typical failure mode (a) with bolt, and (b,c) without bolt.

Figure 13.
Force–displacement curves for the test specimens.

Figure 14.
Deflections of C-profile and connector (a) at 245 s in GOM with point one on the C profile and the point 2 on the connector with (b) both point displacements in time and (c) displacement field at the end of test.
Figure 14.
Deflections of C-profile and connector (a) at 245 s in GOM with point one on the C profile and the point 2 on the connector with (b) both point displacements in time and (c) displacement field at the end of test.

Figure 15.
Specimens after testing.


Table 1.
Dimensions of the specimens.
| Specimen | Width d1 [mm] | Width d2 [mm] | Height h1 [mm] | Height h2 [mm] | Length of Specimen L [mm] |
|---|---|---|---|---|---|
| Ab-1 | 92.1 | 94.1 | 43.1 | 43.5 | 405 |
| Ab-2 | 88.4 | 90.9 | 43.0 | 42.9 | 405 |
| Ab-3 | 88.6 | 93.6 | 43.7 | 43.5 | 405 |
| Ab-4 | 88.3 | 93.2 | 43.3 | 43.2 | 405 |
| Ab-5 | 87.7 | 89.8 | 43.3 | 42.3 | 405 |
| Ab (Average) | 89.0 | 92.3 | 43.3 | 43.0 | 405 |
Table 2.
Results of simple tensile test for S550 GD steel specimens.
| Specimen | E [MPa] | ReH [MPa] | Rm [MPa] | Ae [%] | Agt [%] | At [%] |
|---|---|---|---|---|---|---|
| S550-1 | 183,828 | 701.55 | 701.47 | 0.37 | 7.26 | 9.42 |
| S550-2 | 195,059 | 691.59 | 700.84 | 0.35 | 7.50 | 8.44 |
| S550-3 | 185,232 | 698.62 | 710.23 | 0.38 | 7.28 | 9.54 |
| S550-4 | 170,829 | 697.12 | 707.39 | 0.43 | 7.59 | 8.17 |
| S550 GD (Average) | 183,737 | 697.22 | 704.98 | 0.39 | 7.41 | 8.89 |
| Standard deviation | 5.42% | 0.60% | 0.65% | 3.92% | 2.20% | 7.75% |
Table 3.
Results of simple tensile test for DX51D-Z275 steel specimens.
| Specimen | E [MPa] | ReH [MPa] | Rm [MPa] | Ae [%] | Agt [%] | At [%] |
|---|---|---|---|---|---|---|
| DX51D-1 | 179,155 | 379.12 | 419.19 | 0.21 | 13.56 | 26.09 |
| DX51D-2 | 187,945 | 376.37 | 406.66 | 0.19 | 14.18 | 27.06 |
| DX51D-3 | 196,720 | 373.77 | 414.55 | 0.19 | 12.70 | 26.43 |
| DX51D-4 | 203,929 | 386.87 | 413.90 | 0.19 | 13.88 | 25.15 |
| DX51D-5 | 203,724 | 362.77 | 416.06 | 0.18 | 12.88 | 27.49 |
| DX51D-6 | 203,613 | 359.03 | 417.80 | 0.17 | 12.78 | 26.46 |
| DX51D (Average) | 194,295 | 375.78 | 414.07 | 0.19 | 13.33 | 26.44 |
| Standard deviation | 5.30% | 2.77% | 1.06% | 7.00% | 4.72% | 3.06% |
Table 4.
Comparison of the elastic stiffness and displacement at maximum force for LVDT and UTM.
| Measuring Technique | Elastic Stiffness [N/mm] | ||||
| Ab-1 | Ab-2 | Ab-3 | Mean Value | St.Dev | |
| LVDT | 9261.37 | 15,427.06 | 8720.22 | 11,136.22 | 3725.82 |
| UTM | 7566.09 | 7781.01 | 8172.65 | 7839.92 | 307.54 |
| Difference [%] | 22.4% | 98.3% | 6.7% | 42.0% | / |
| Measuring Technique | Displacement at Max. Force [mm] | ||||
| Ab-1 | Ab-2 | Ab-3 | As | St.Dev | |
| LVDT | 10.91 | 10.17 | 11.94 | 11.01 | 0.89 |
| UTM | 10.80 | 10.93 | 10.80 | 10.84 | 0.08 |
| Difference [%] | 1.1% | 6.9% | 10.6% | 1.5% | / |
Table 5.
Comparison of results from the universal test machine and GOM for the specimens Ab-4.
| Measuring Technique | Elastic Stiffness [N/mm] | Displacement at Max. Force [mm] |
|---|---|---|
| DIC | 9070.29 | 9.98 |
| UTM | 7572.25 | 10.90 |
| Difference | 16.52% | 8.49% |
Table 6.
Results of tensile test for Ab test specimens.
| Specimen | Max. Force Fmax [N] | Displacement at Fmax × [mm] | Elastic Stiffness K [N/mm] |
|---|---|---|---|
| Ab-1 | 37,396.1 | 10.80 | 7566.1 |
| Ab-2 | 38,342.4 | 10.93 | 7781.0 |
| Ab-3 | 38,073.2 | 10.80 | 8172.7 |
| Ab-4 | 38,444.7 | 10.37 | 7572.3 |
| Ab-5 | 38,804.9 | 11.01 | 7547.6 |
| Ab* | 38,212.3 | 10.8 | 7727.9 |
Table 7.
Dimensions of the widths of the C-profile after the test and the subtraction of the initial widths.
Table 7.
Dimensions of the widths of the C-profile after the test and the subtraction of the initial widths.
| Specimen | Width d1 [mm] | Width d2 [mm] | d1–d1 [mm] | d2–d2 [mm] |
|---|---|---|---|---|
| Ab-1 | 89.8 | 92.2 | 2.3 | 1.9 |
| Ab-2 | 86.5 | 87.9 | 1.9 | 3 |
| Ab-3 | 86.6 | 91.4 | 2 | 2.2 |
| Ab-4 | 86.1 | 91.7 | 2.2 | 1.5 |
| Ab-5 | 86.4 | 88.1 | 1.3 | 1.7 |
| Ab (Average) | 87.1 | 90.3 | 1.94 | 2.06 |
Table 8.
Comparison of the experimental and calculated results.
| Standard | Pull-through Resistance [N] | Resistance Ratio |
|---|---|---|
| Experiment | 38,212.3 | 1.00 |
| EN 1993-1-8 | 55,699.7 | 1.46 |
| AISI S100-16 | 44,346.9 | 1.16 |
Publisher’s Note: MDPI stays neutral with regard to jurisdictional claims in published maps and institutional affiliations. |
© 2022 by the authors. Licensee MDPI, Basel, Switzerland. This article is an open access article distributed under the terms and conditions of the Creative Commons Attribution (CC BY) license (https://creativecommons.org/licenses/by/4.0/).
Share and Cite
MDPI and ACS Style
Lukačević, L.; Krolo, P.; Bakran, A. Experimental Investigation of Novel Angle Bracket Connection in Cold-Formed Steel Structures. Buildings 2022, 12, 1115. https://0-doi-org.brum.beds.ac.uk/10.3390/buildings12081115
AMA Style
Lukačević L, Krolo P, Bakran A. Experimental Investigation of Novel Angle Bracket Connection in Cold-Formed Steel Structures. Buildings. 2022; 12(8):1115. https://0-doi-org.brum.beds.ac.uk/10.3390/buildings12081115
Chicago/Turabian StyleLukačević, Lazar, Paulina Krolo, and Antonio Bakran. 2022. "Experimental Investigation of Novel Angle Bracket Connection in Cold-Formed Steel Structures" Buildings 12, no. 8: 1115. https://0-doi-org.brum.beds.ac.uk/10.3390/buildings12081115
Note that from the first issue of 2016, this journal uses article numbers instead of page numbers. See further details here.