
Structural Health Monitoring of Fiber-Reinforced Concrete Prisms with Polyolefin Macro-Fibers Using a Piezoelectric Materials Network under Various Load-Induced Stress

 ,
,  and
and 
Abstract
:1. Introduction
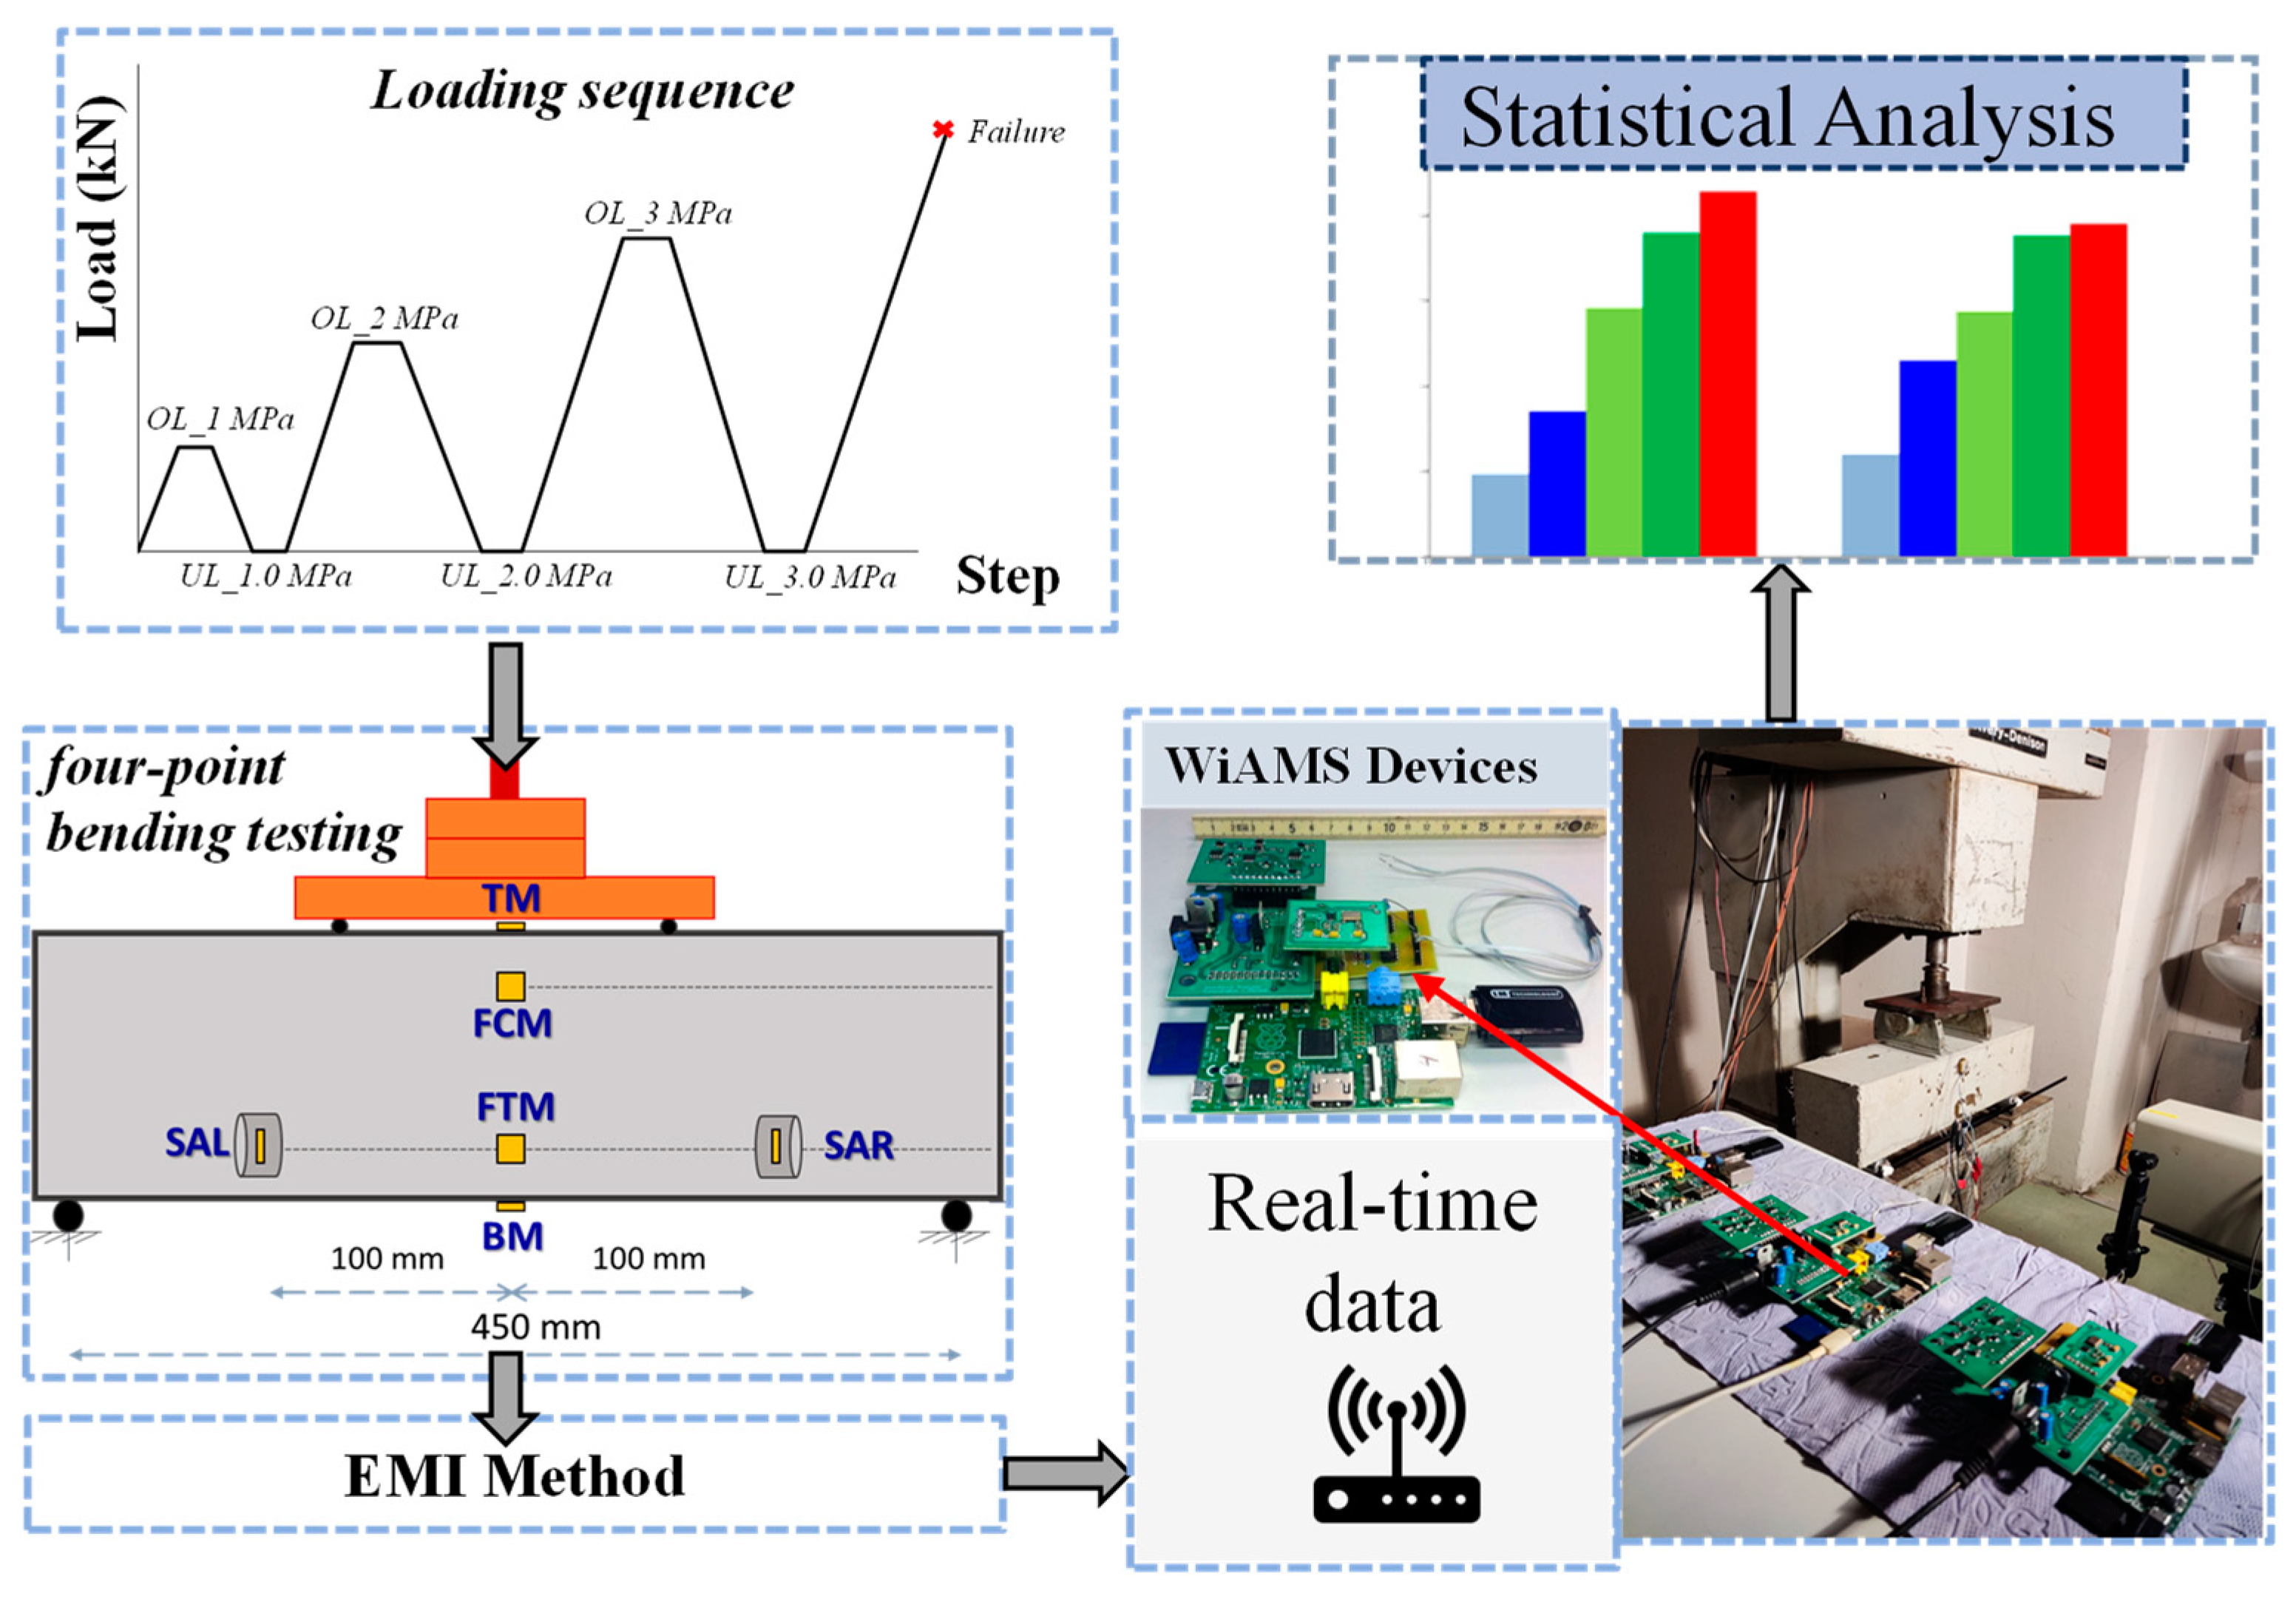
2. Experimental Program
2.1. Materials
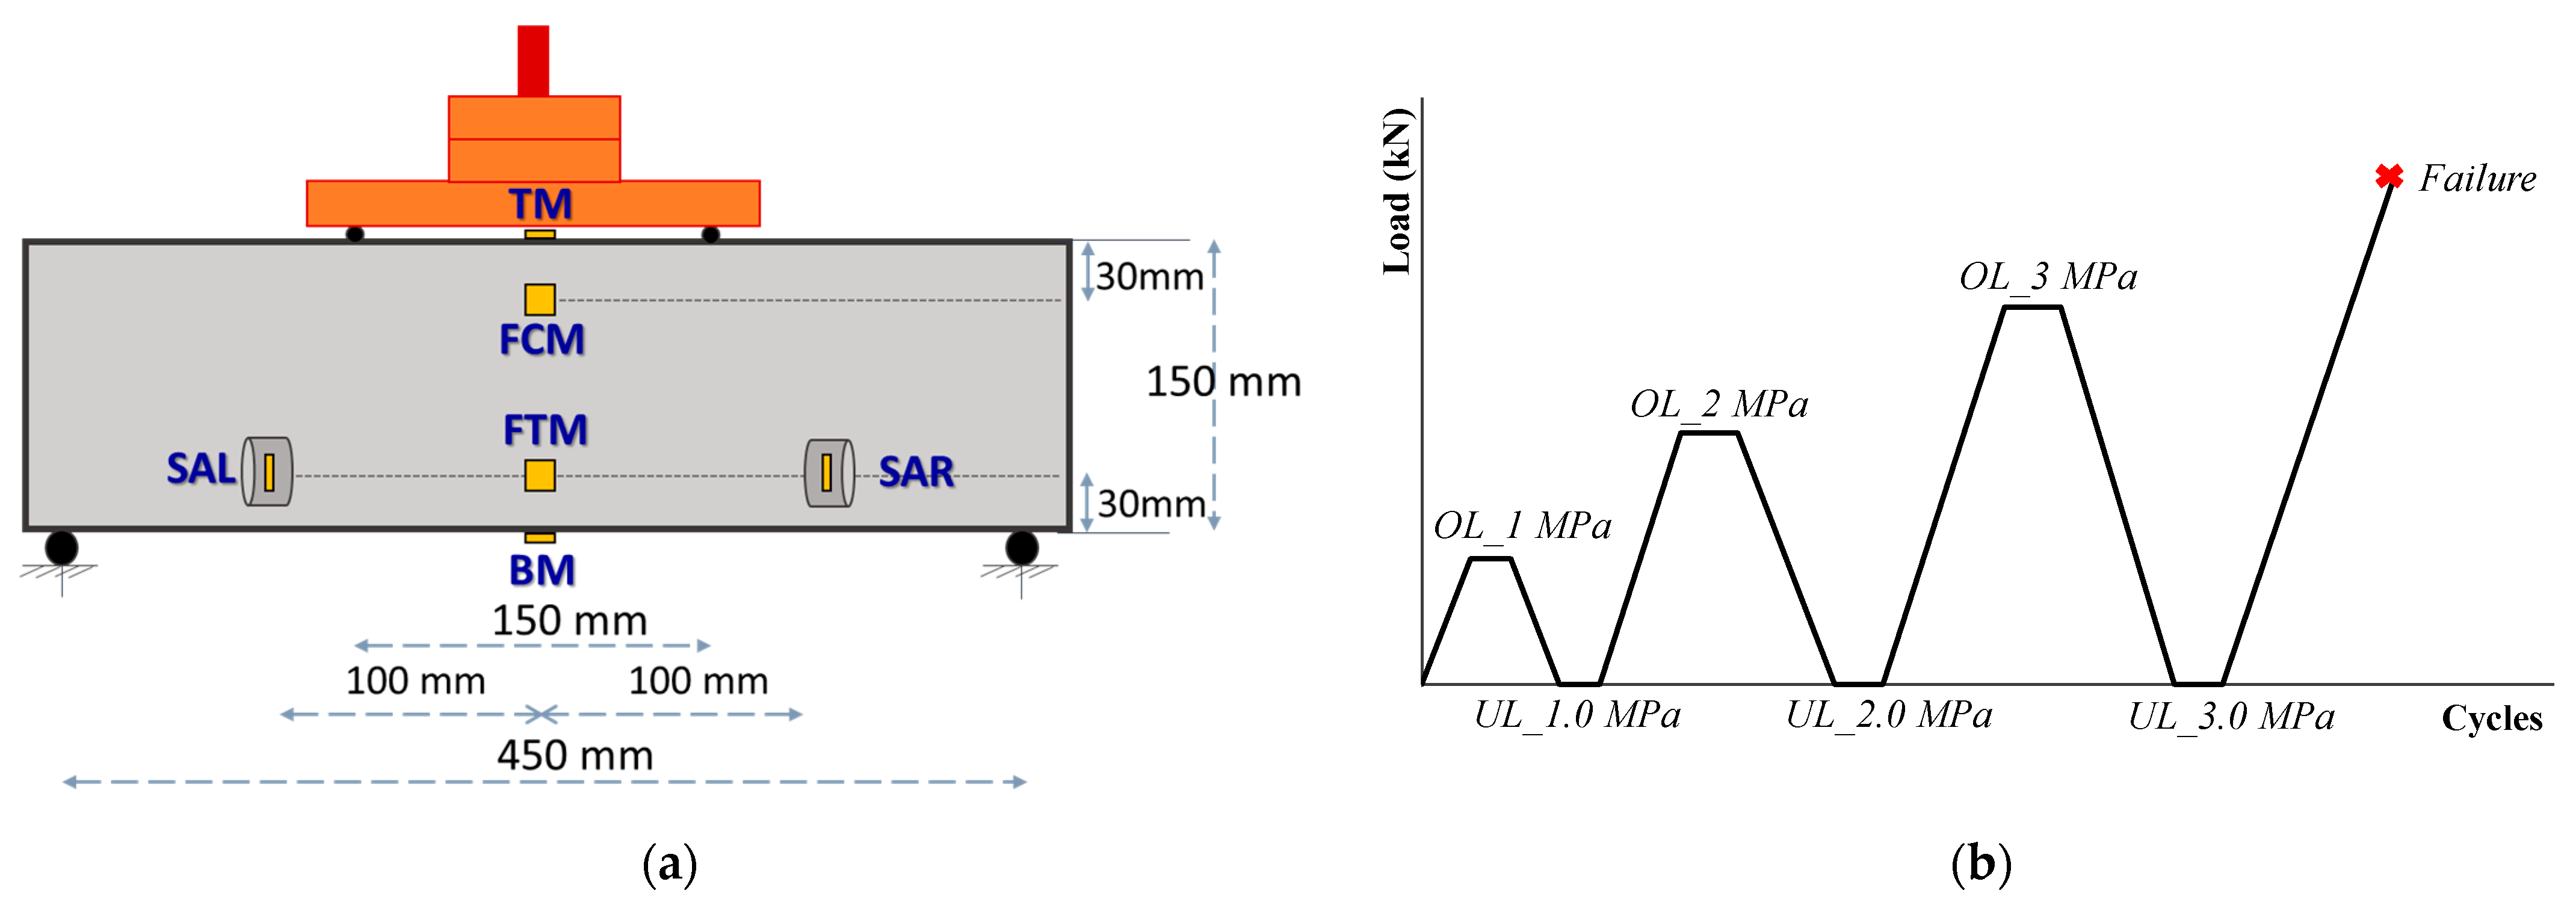
2.2. Tests Set ups and Specimens
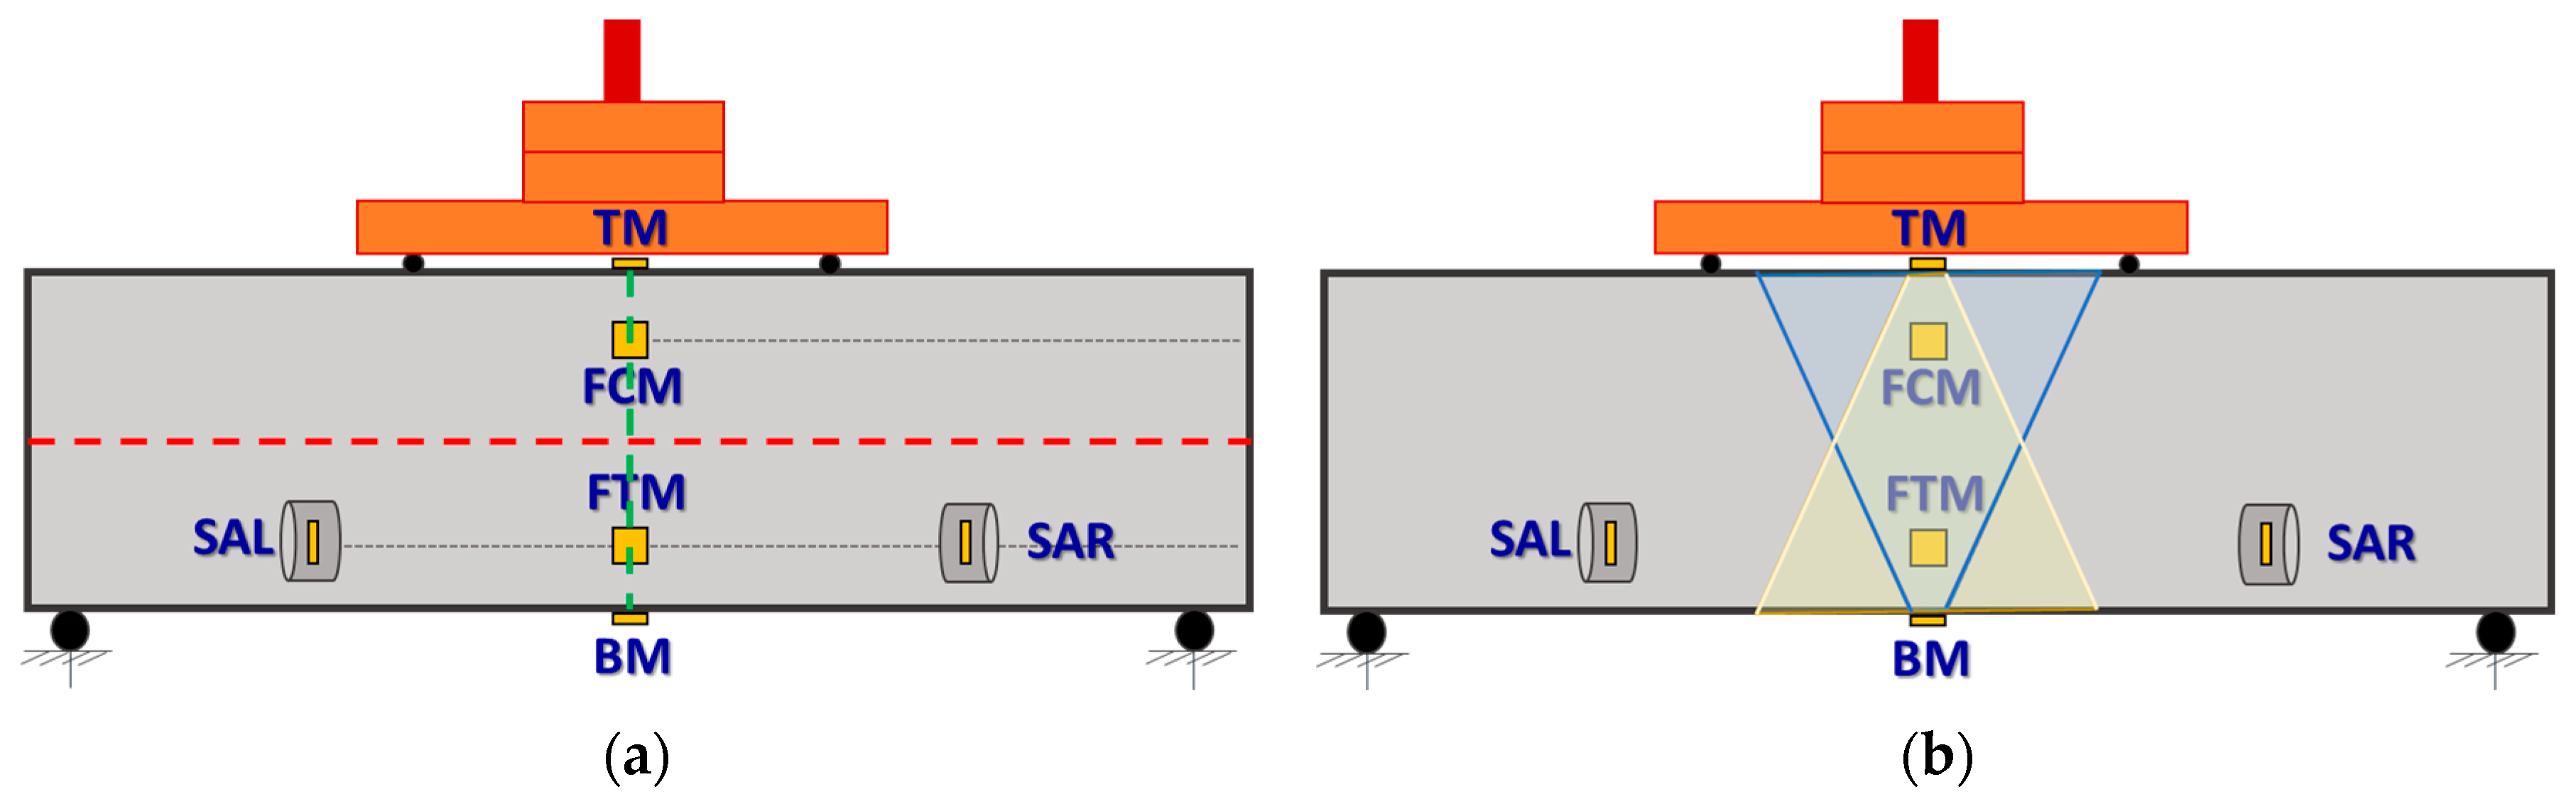
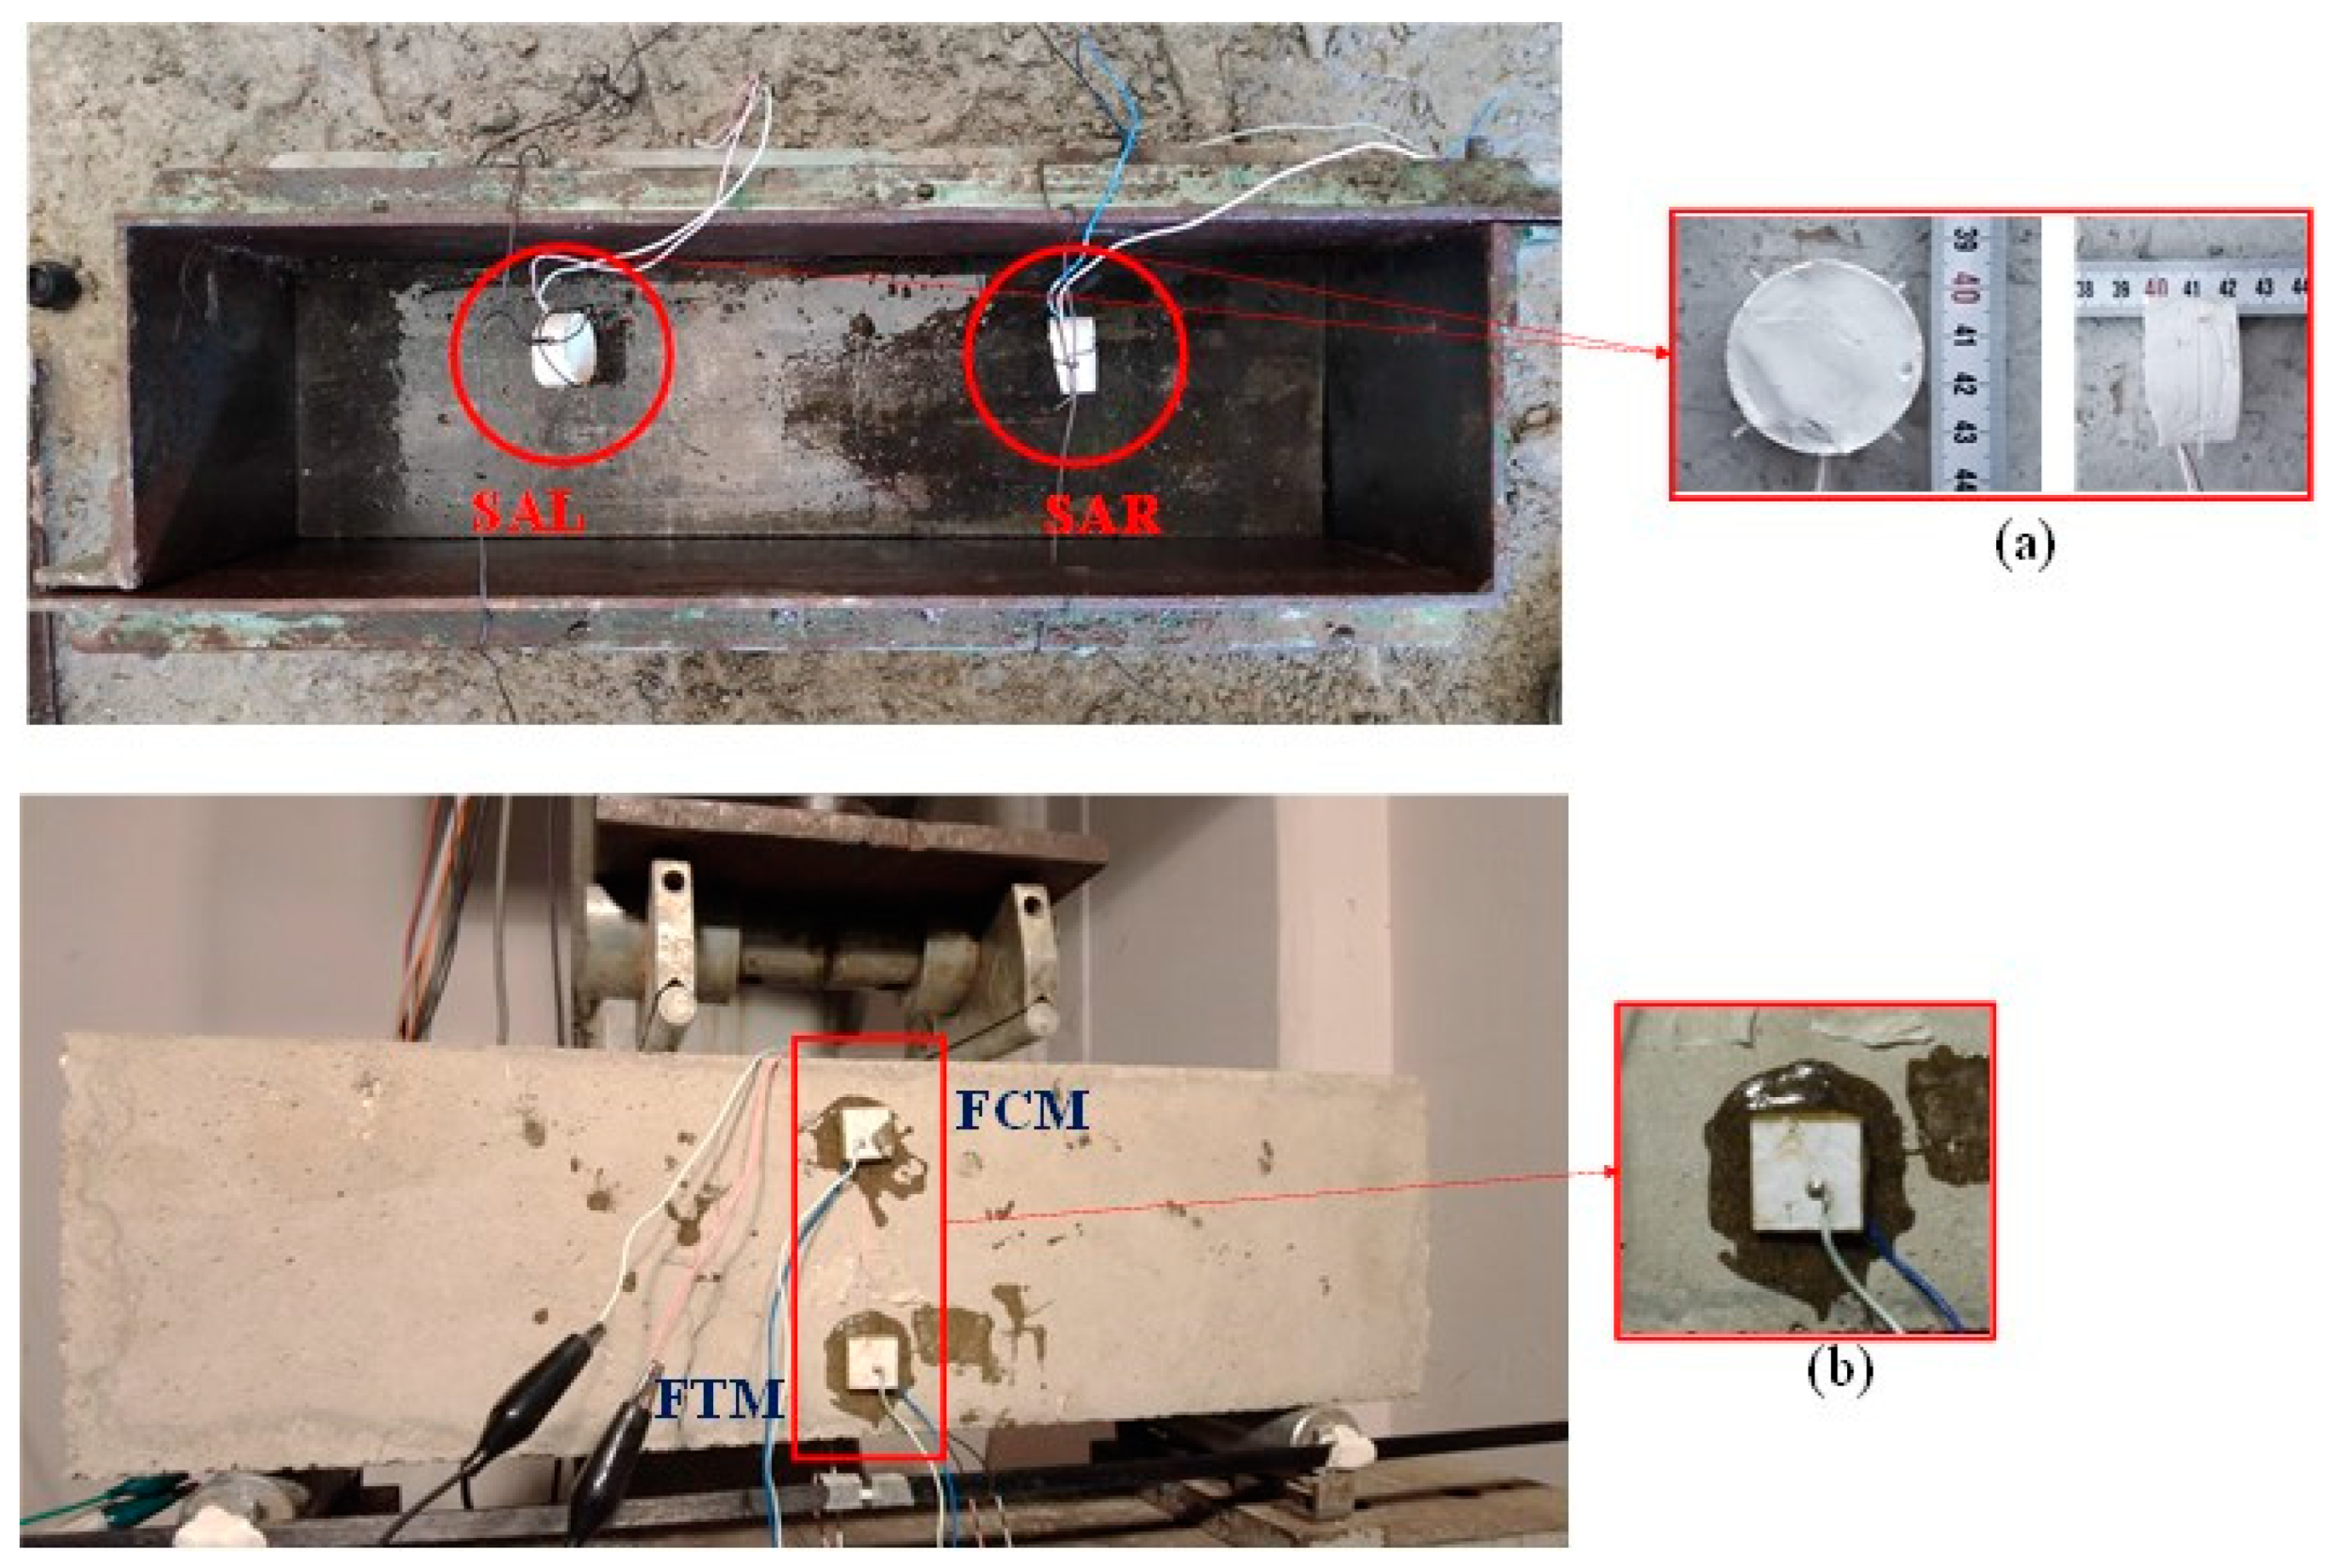
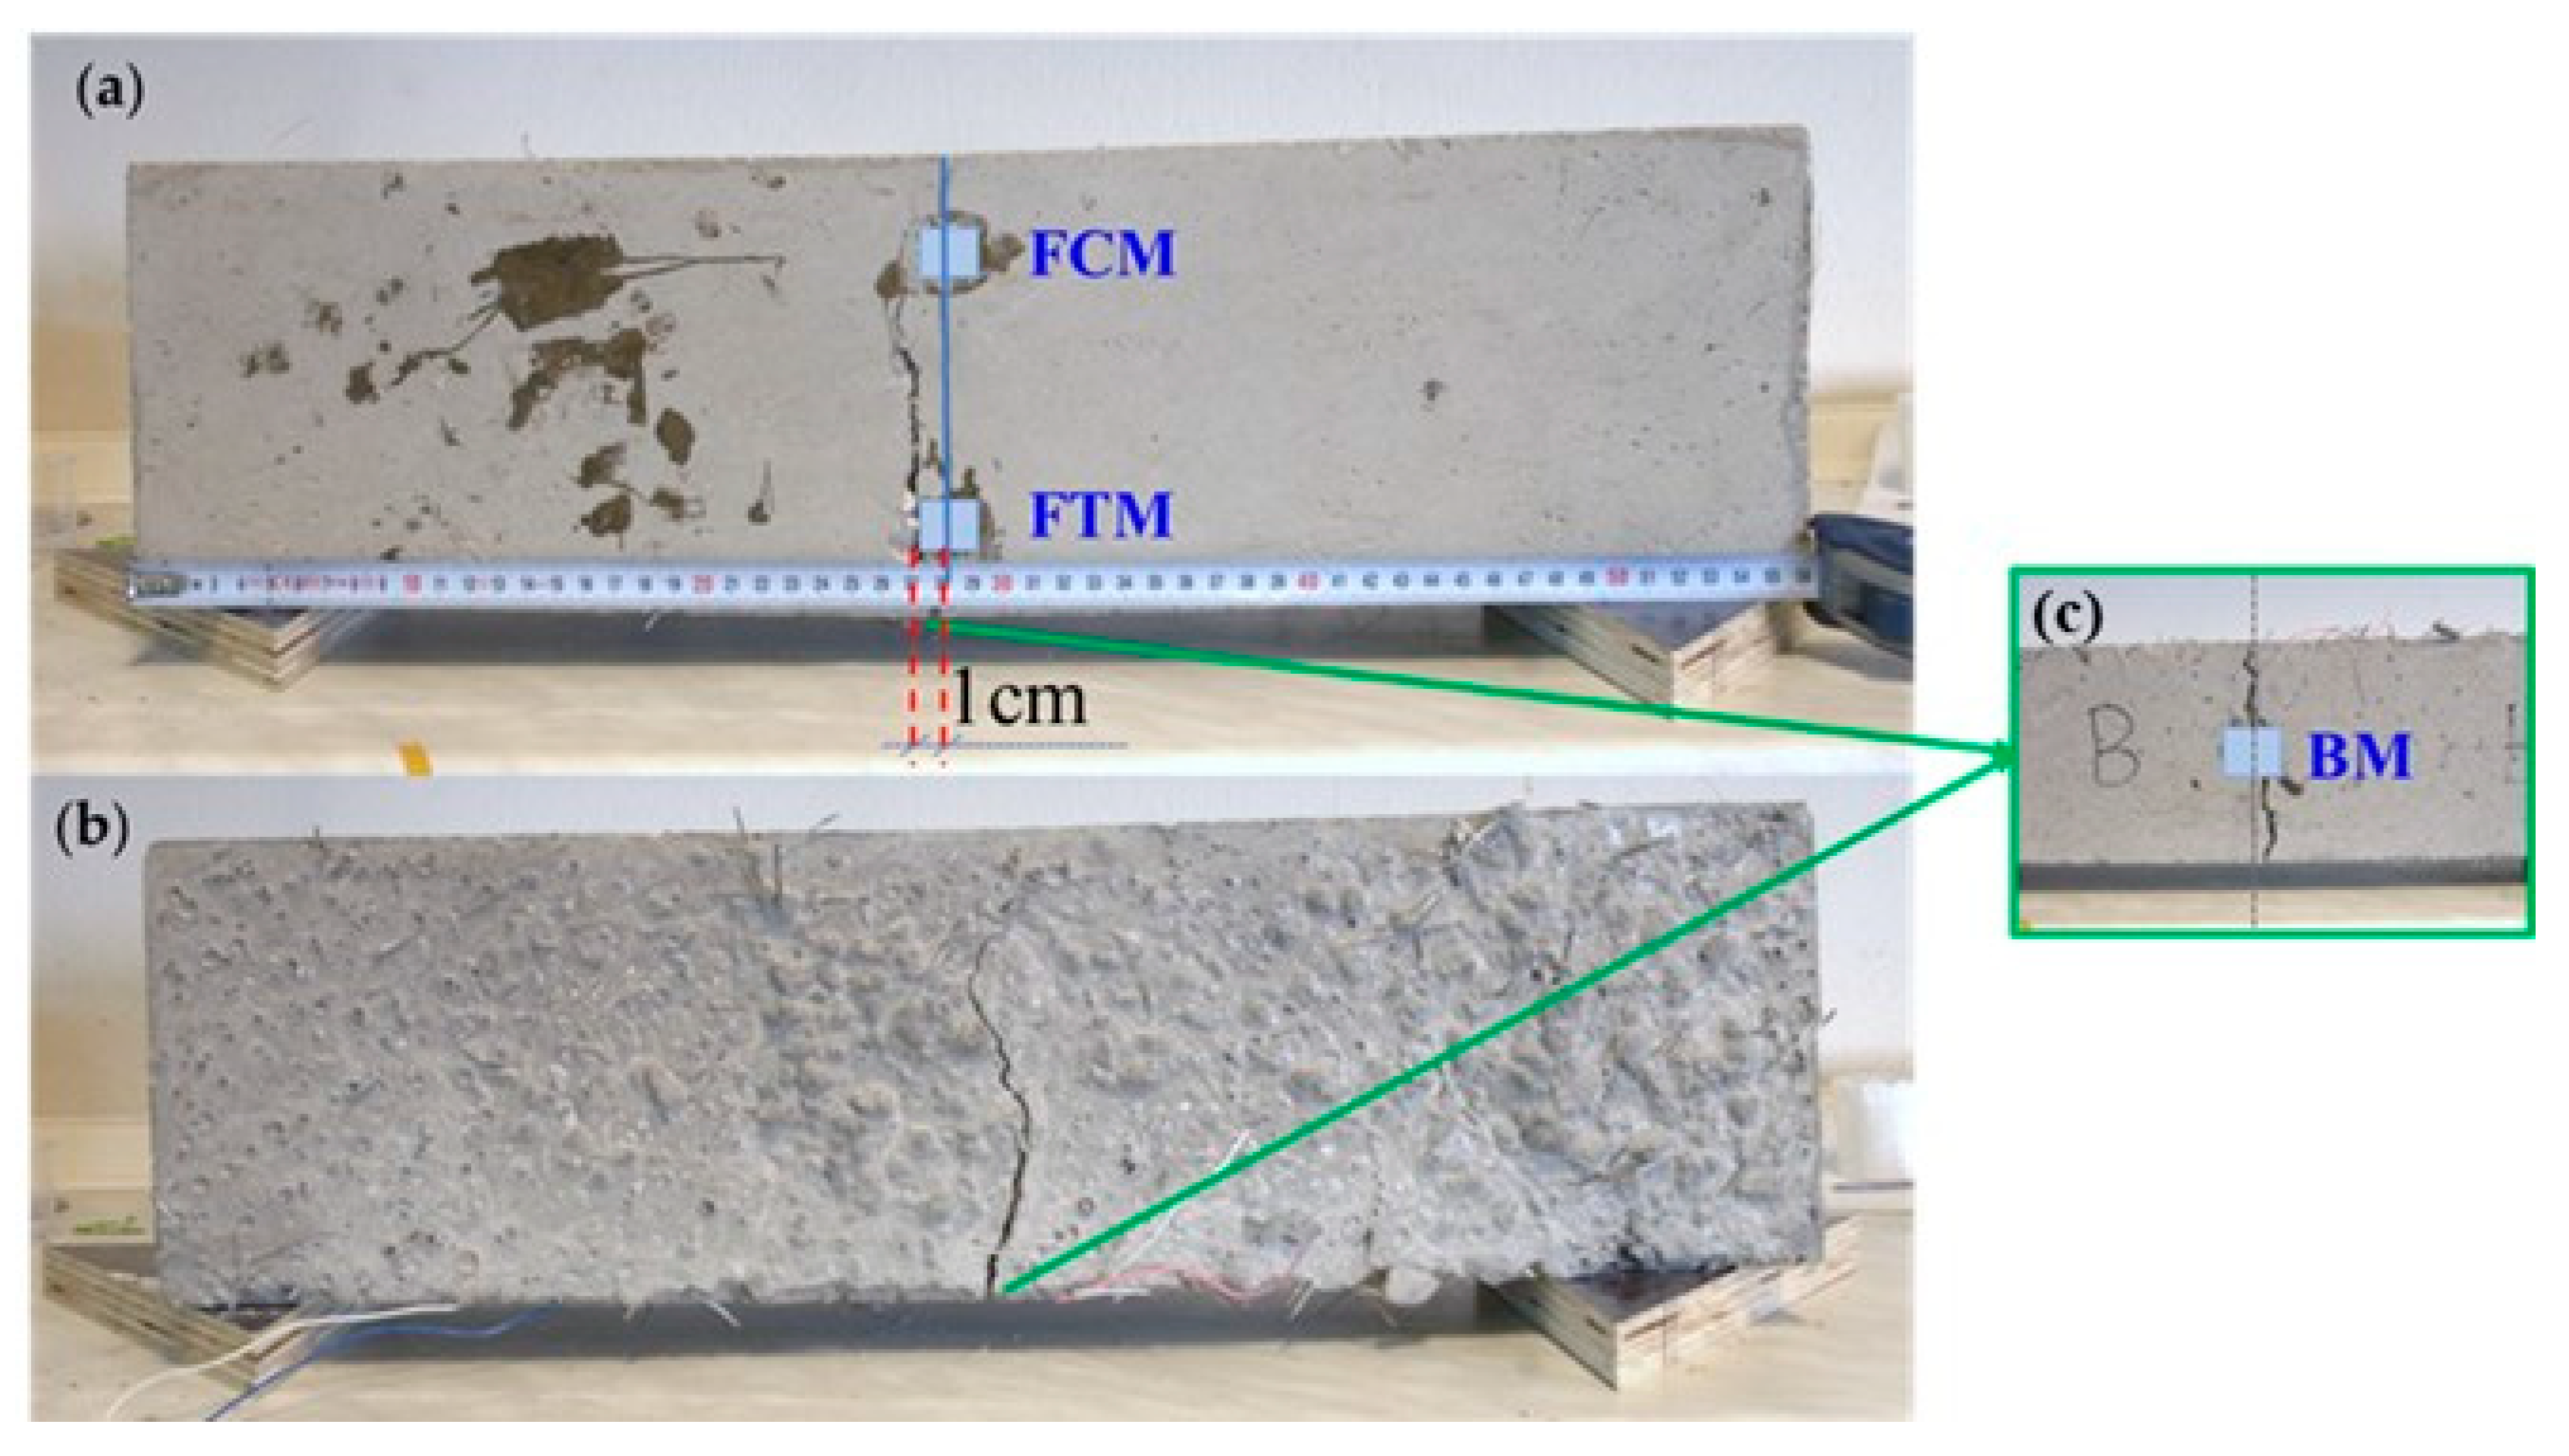
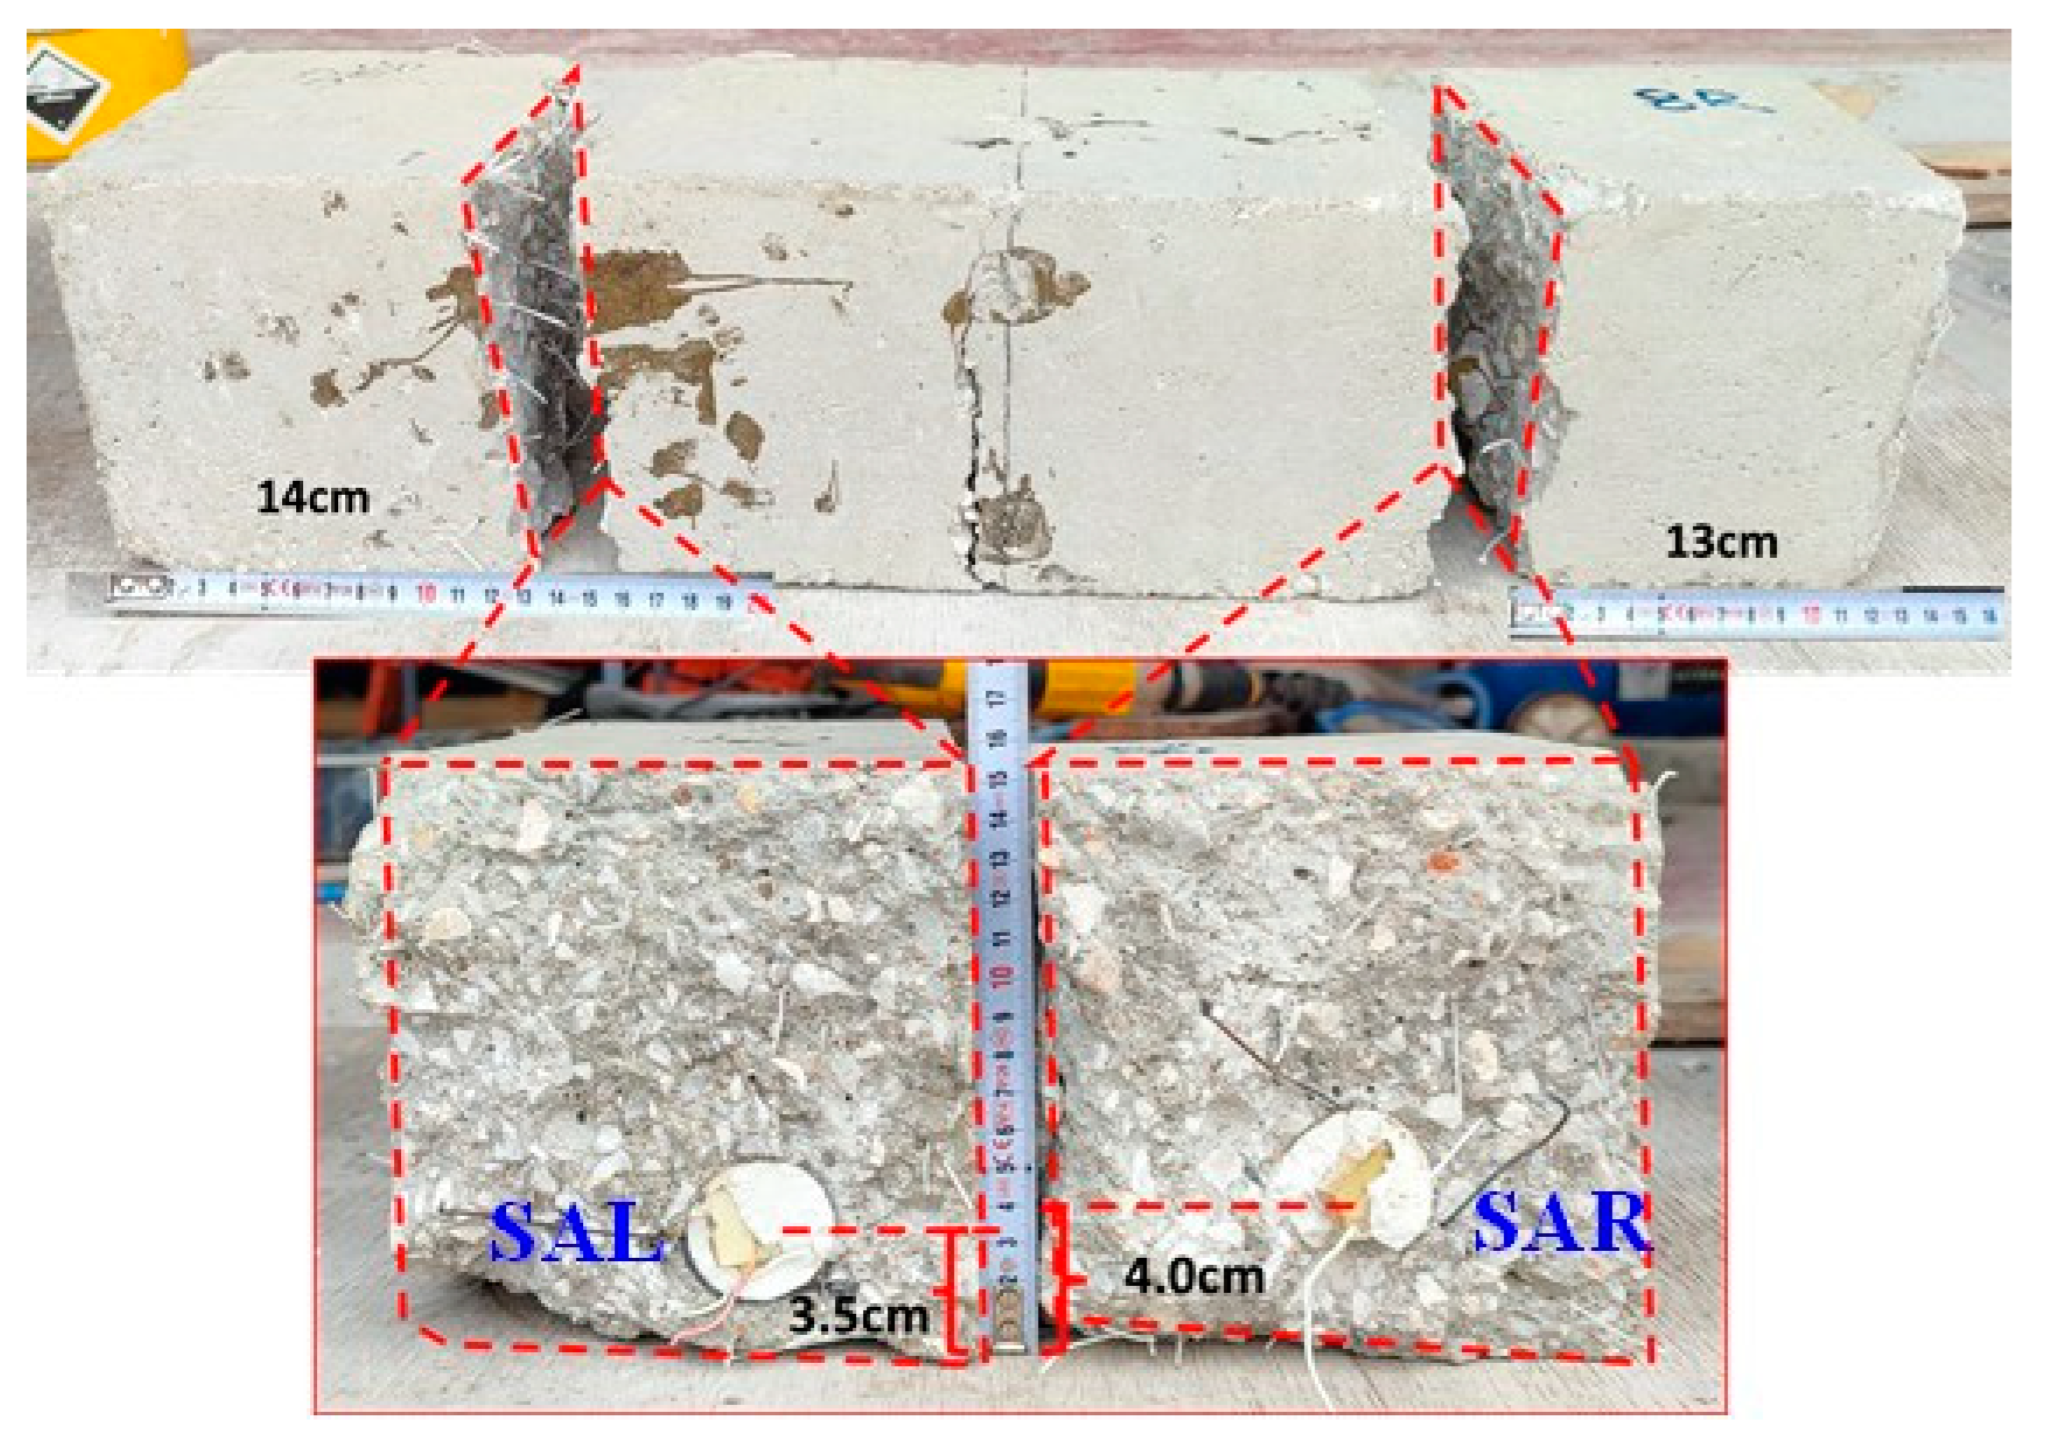
2.3. Configuration of PZT Transducers and Monitoring Range
2.4. EMI Methodology
3. Results and Analysis
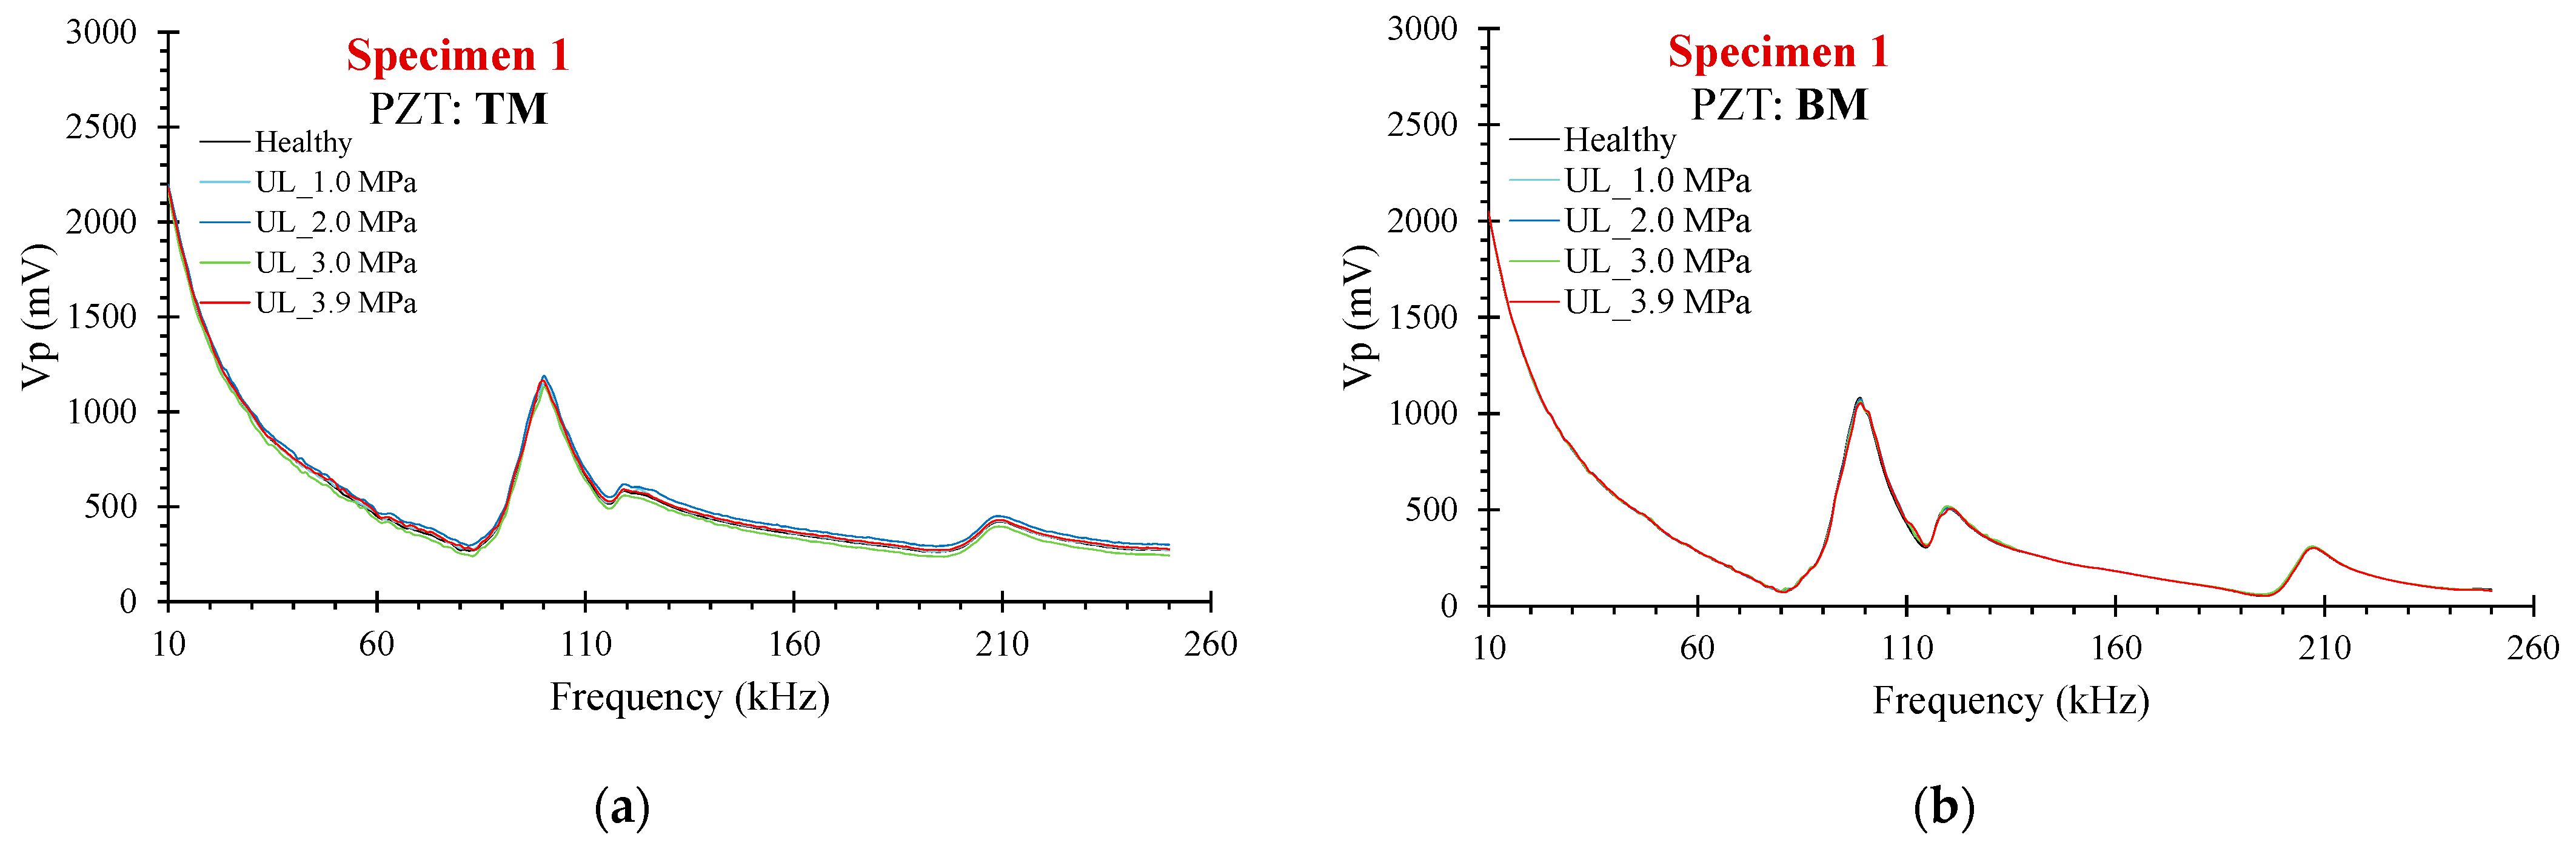
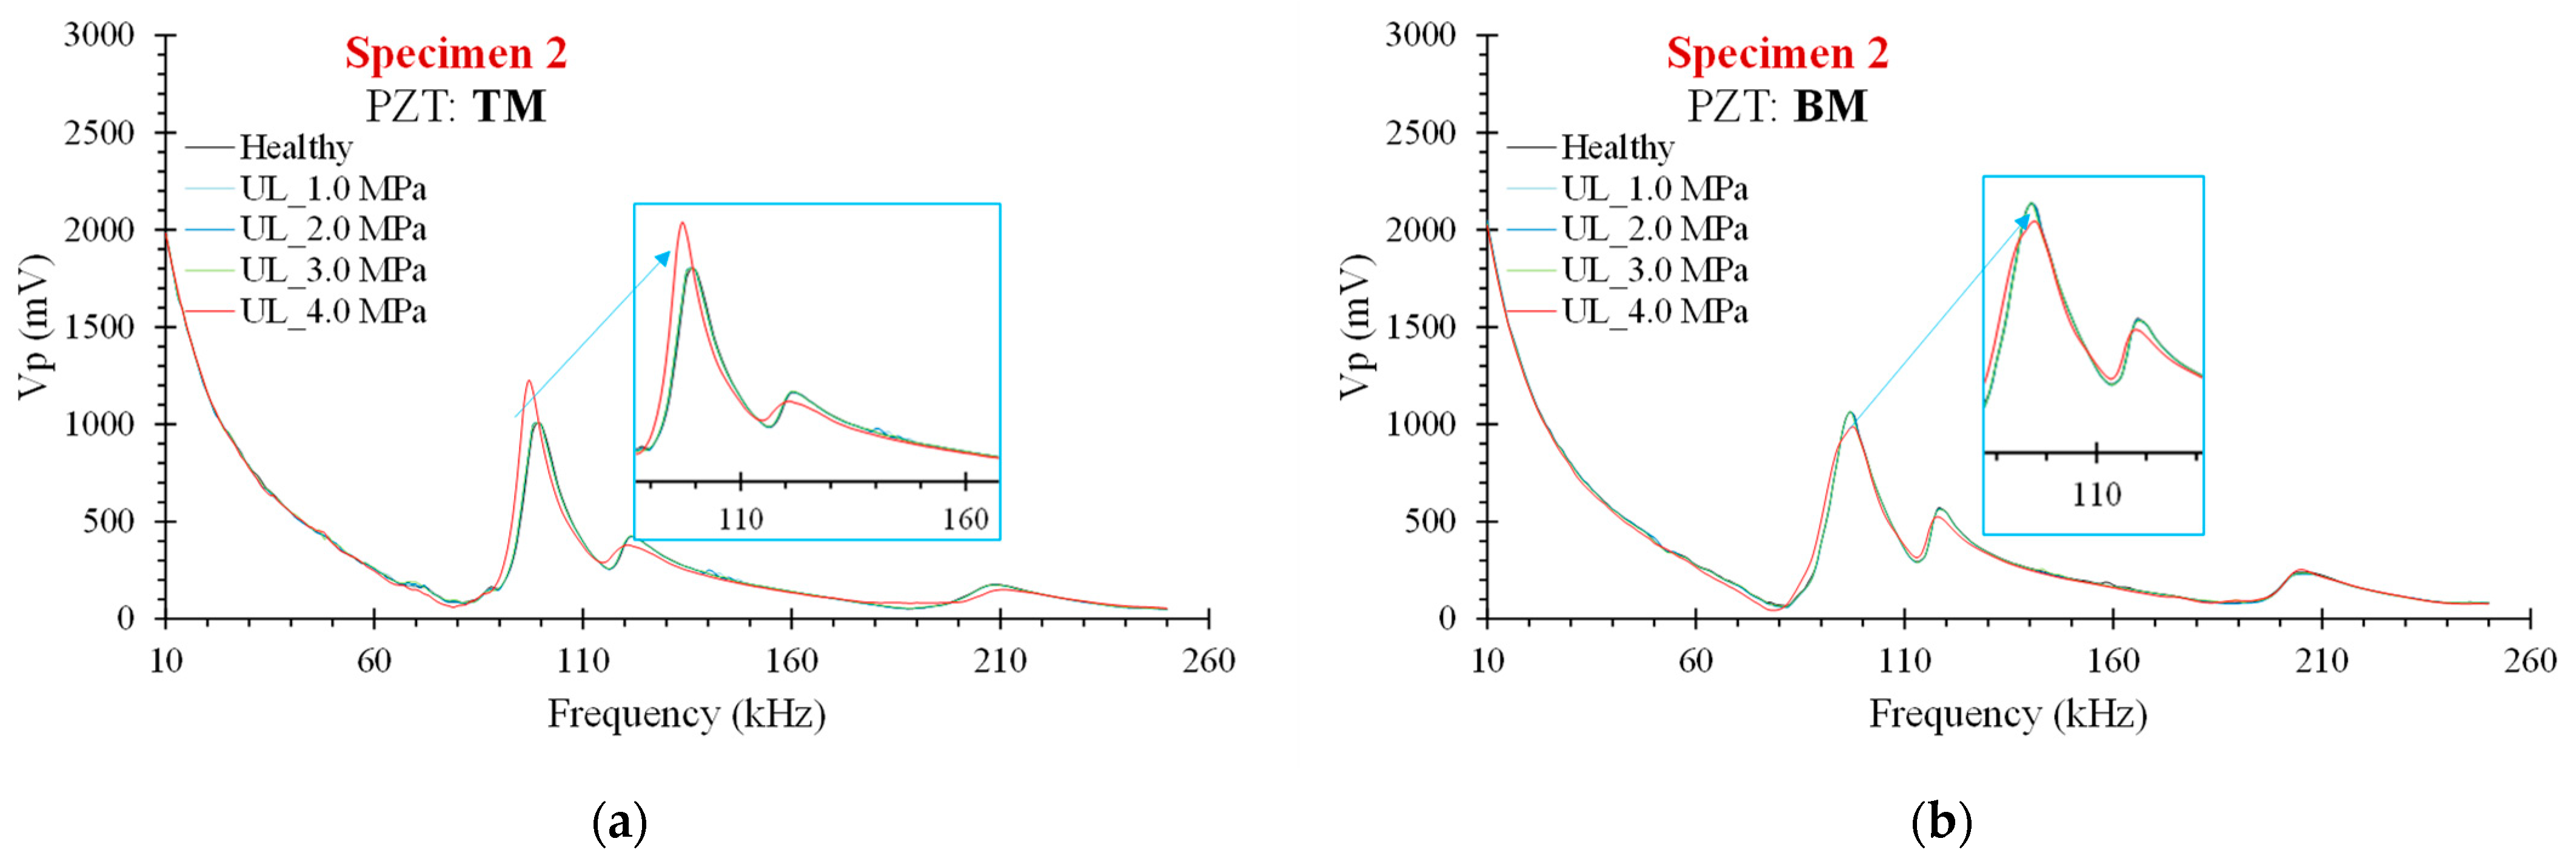
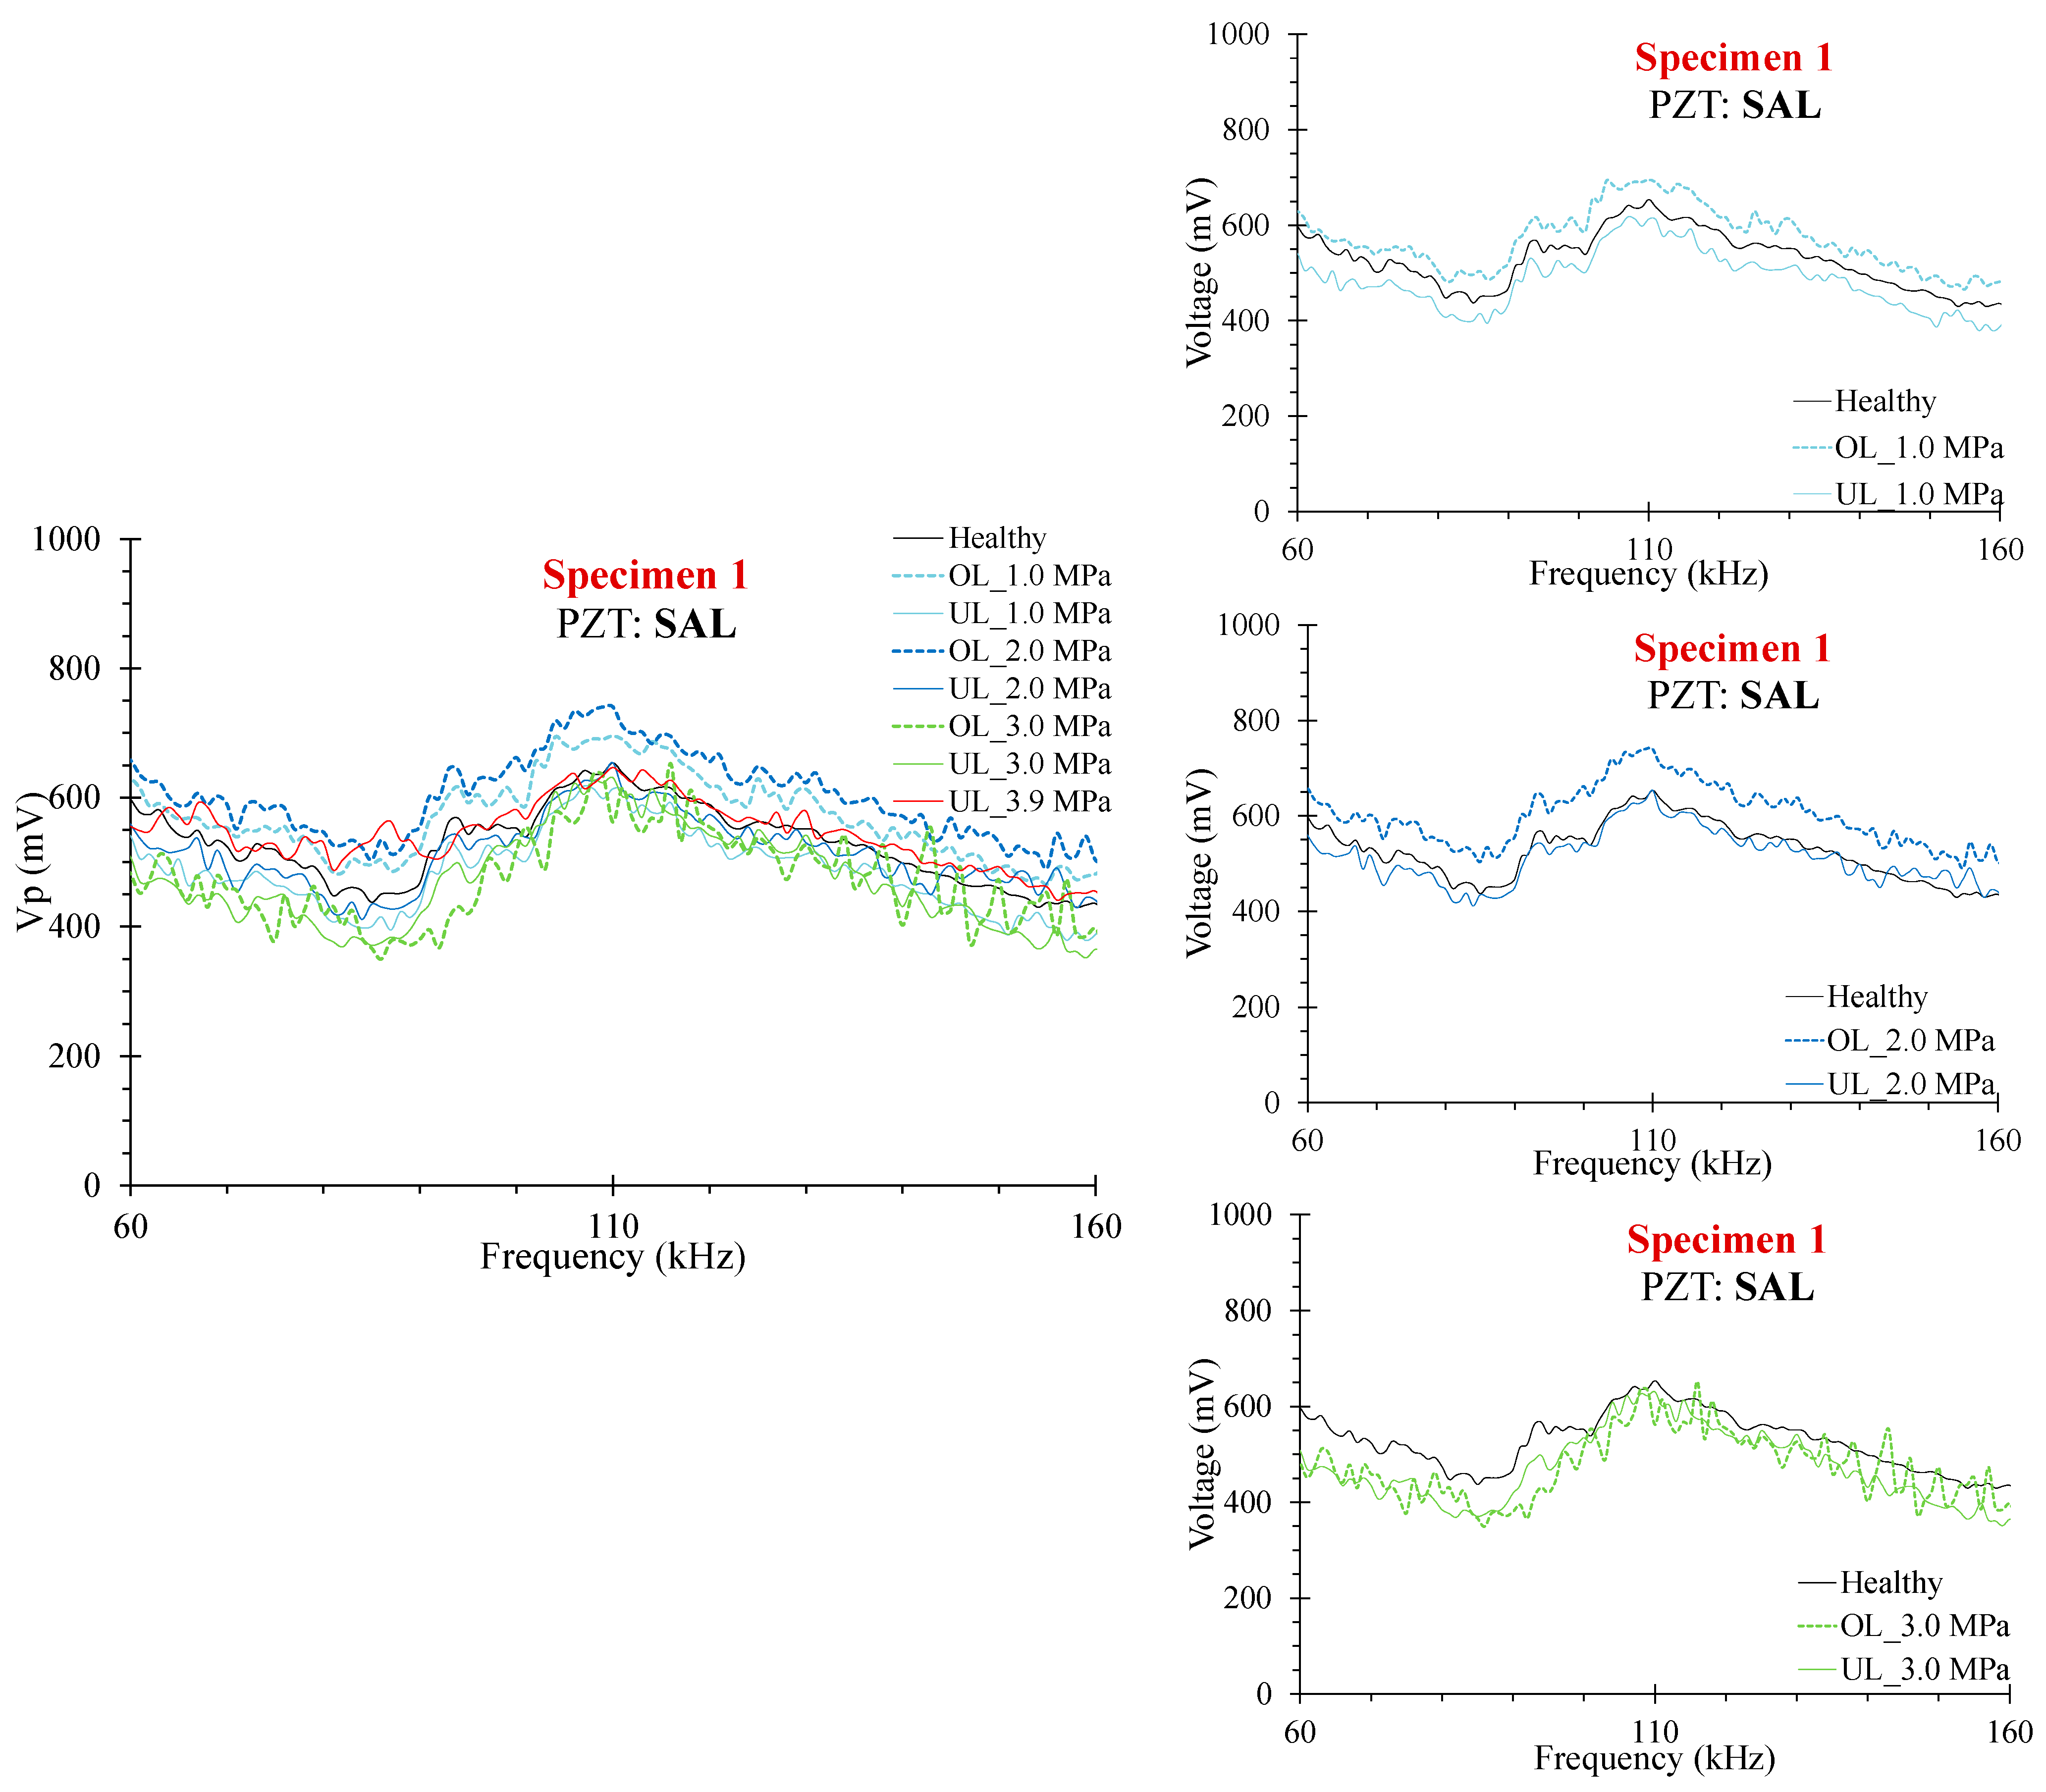
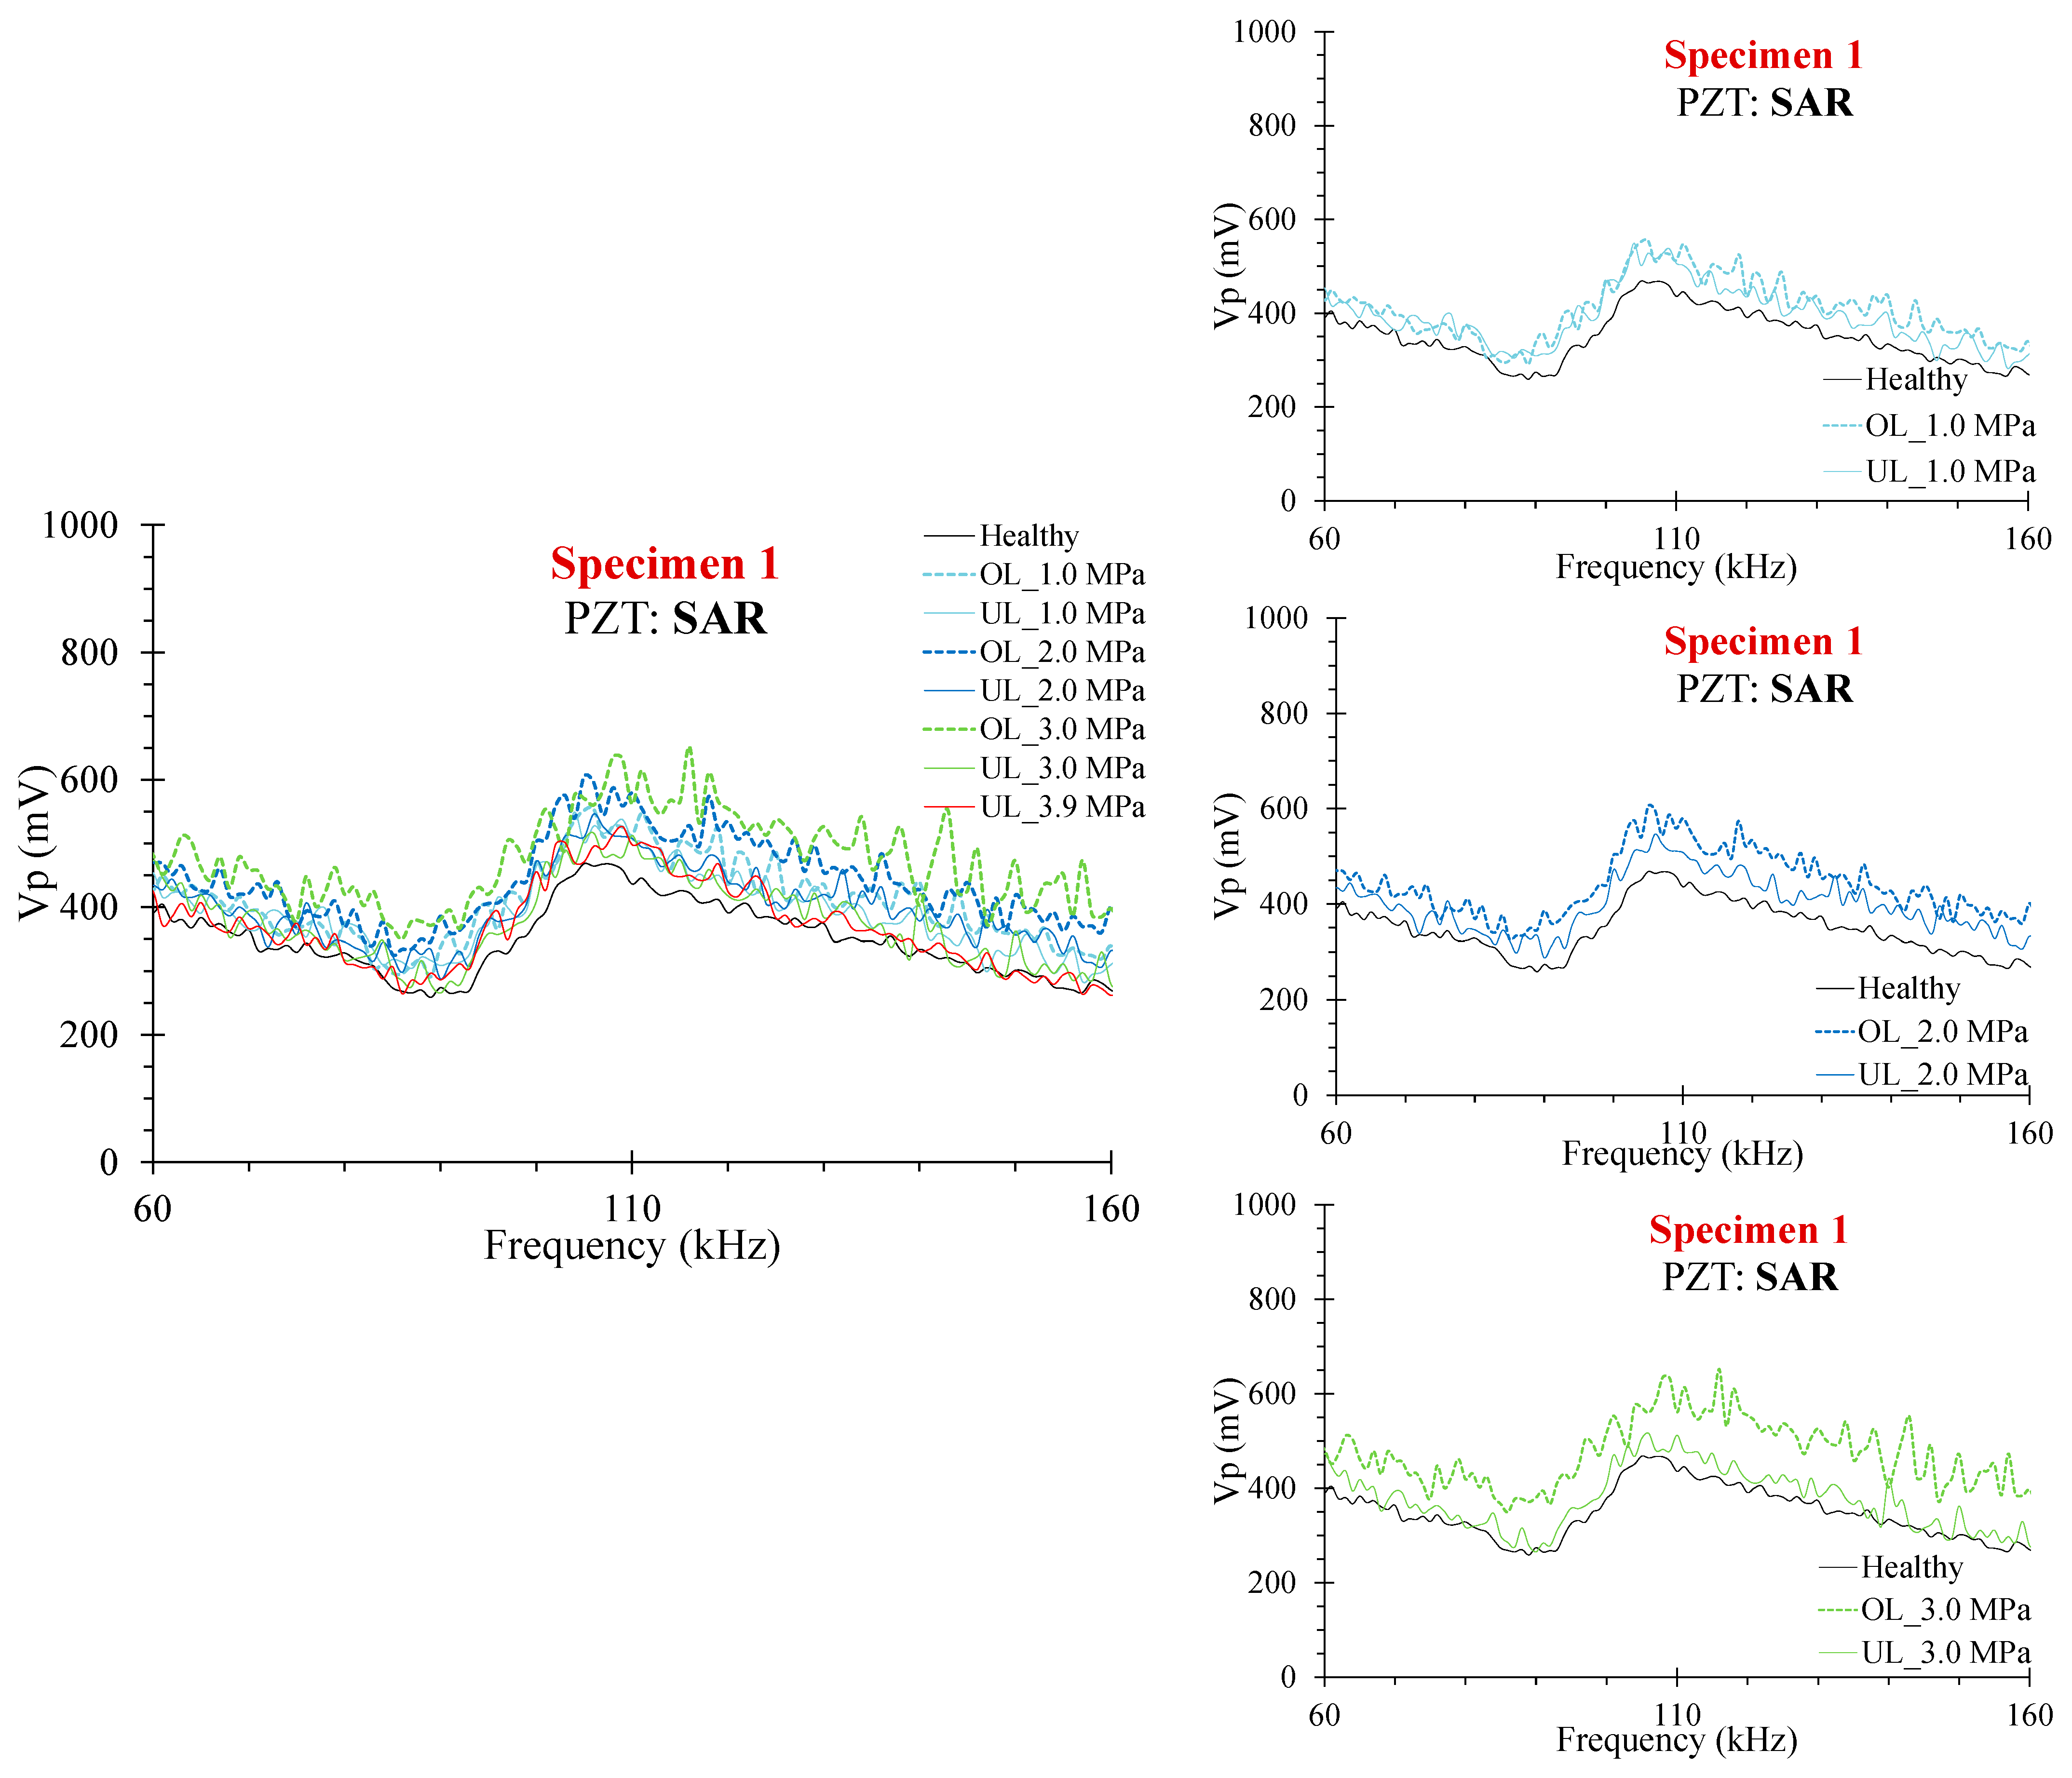
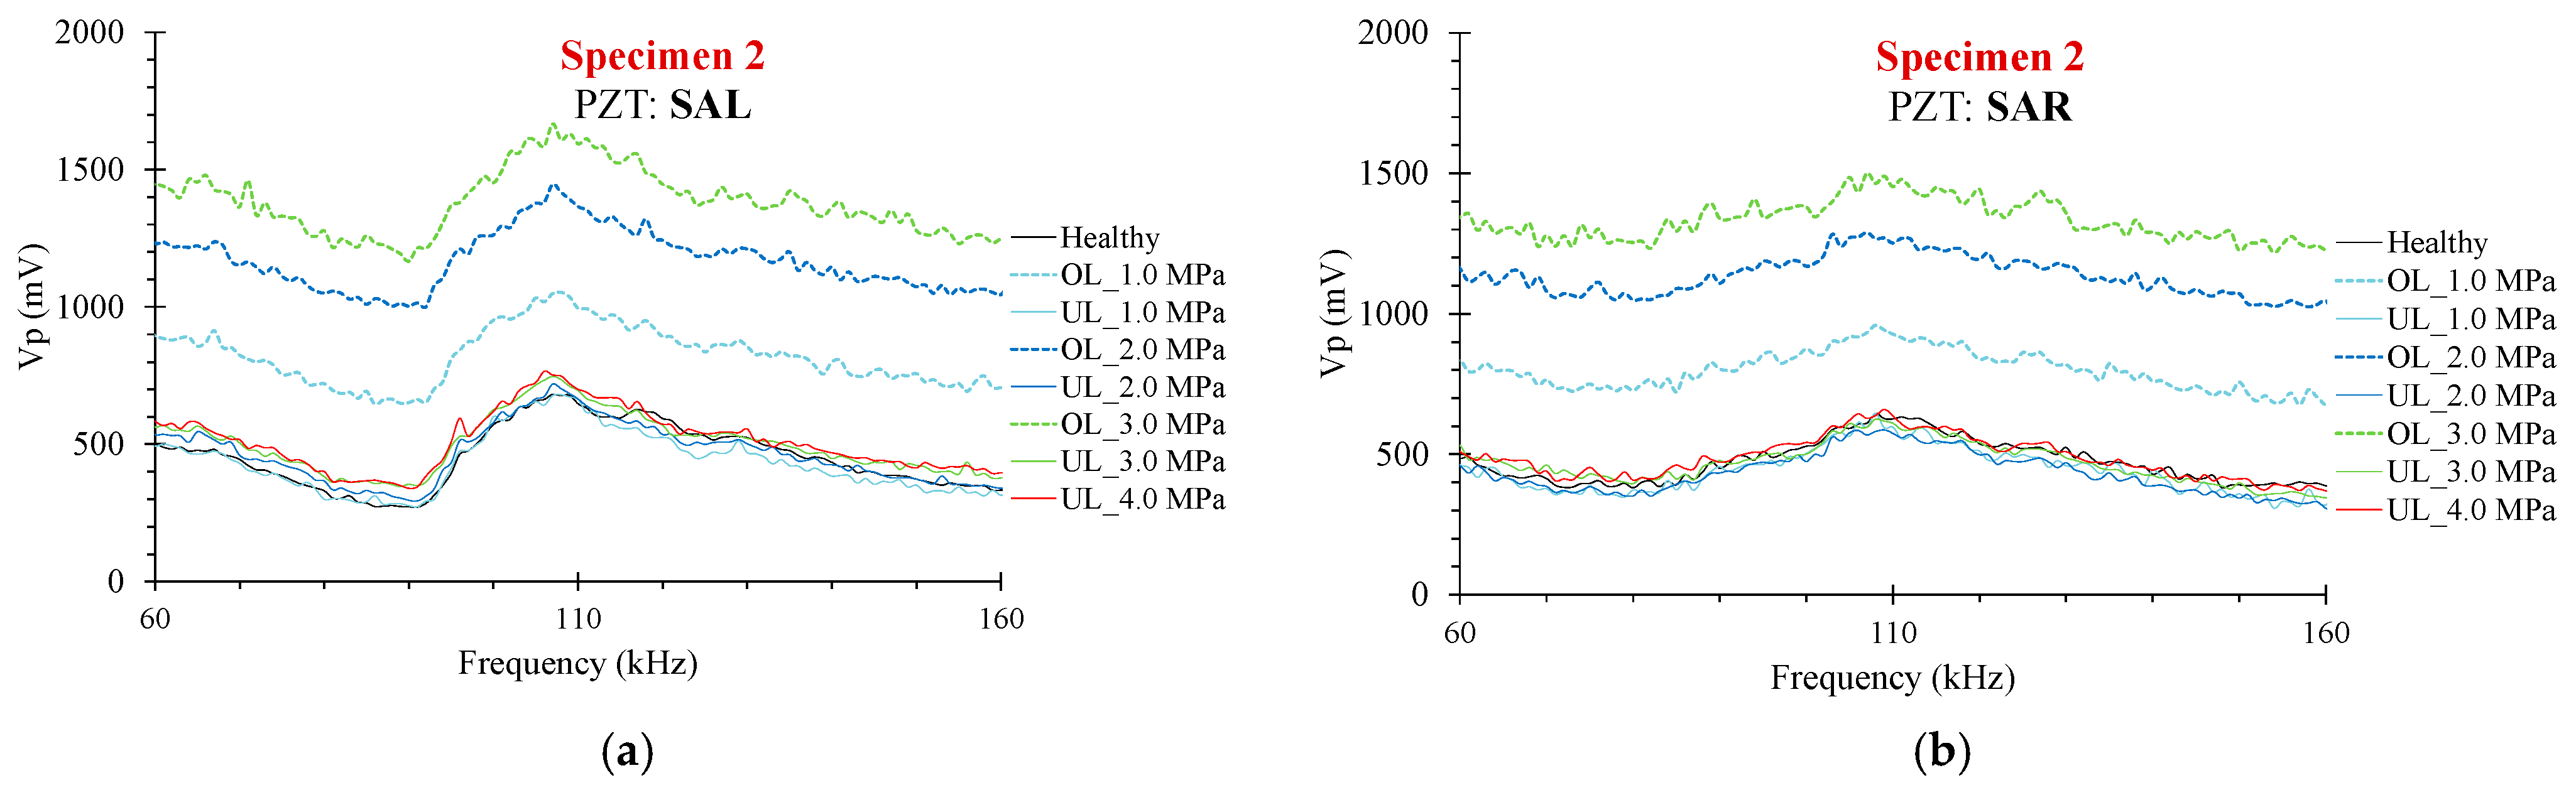
3.1. Voltage Analysis
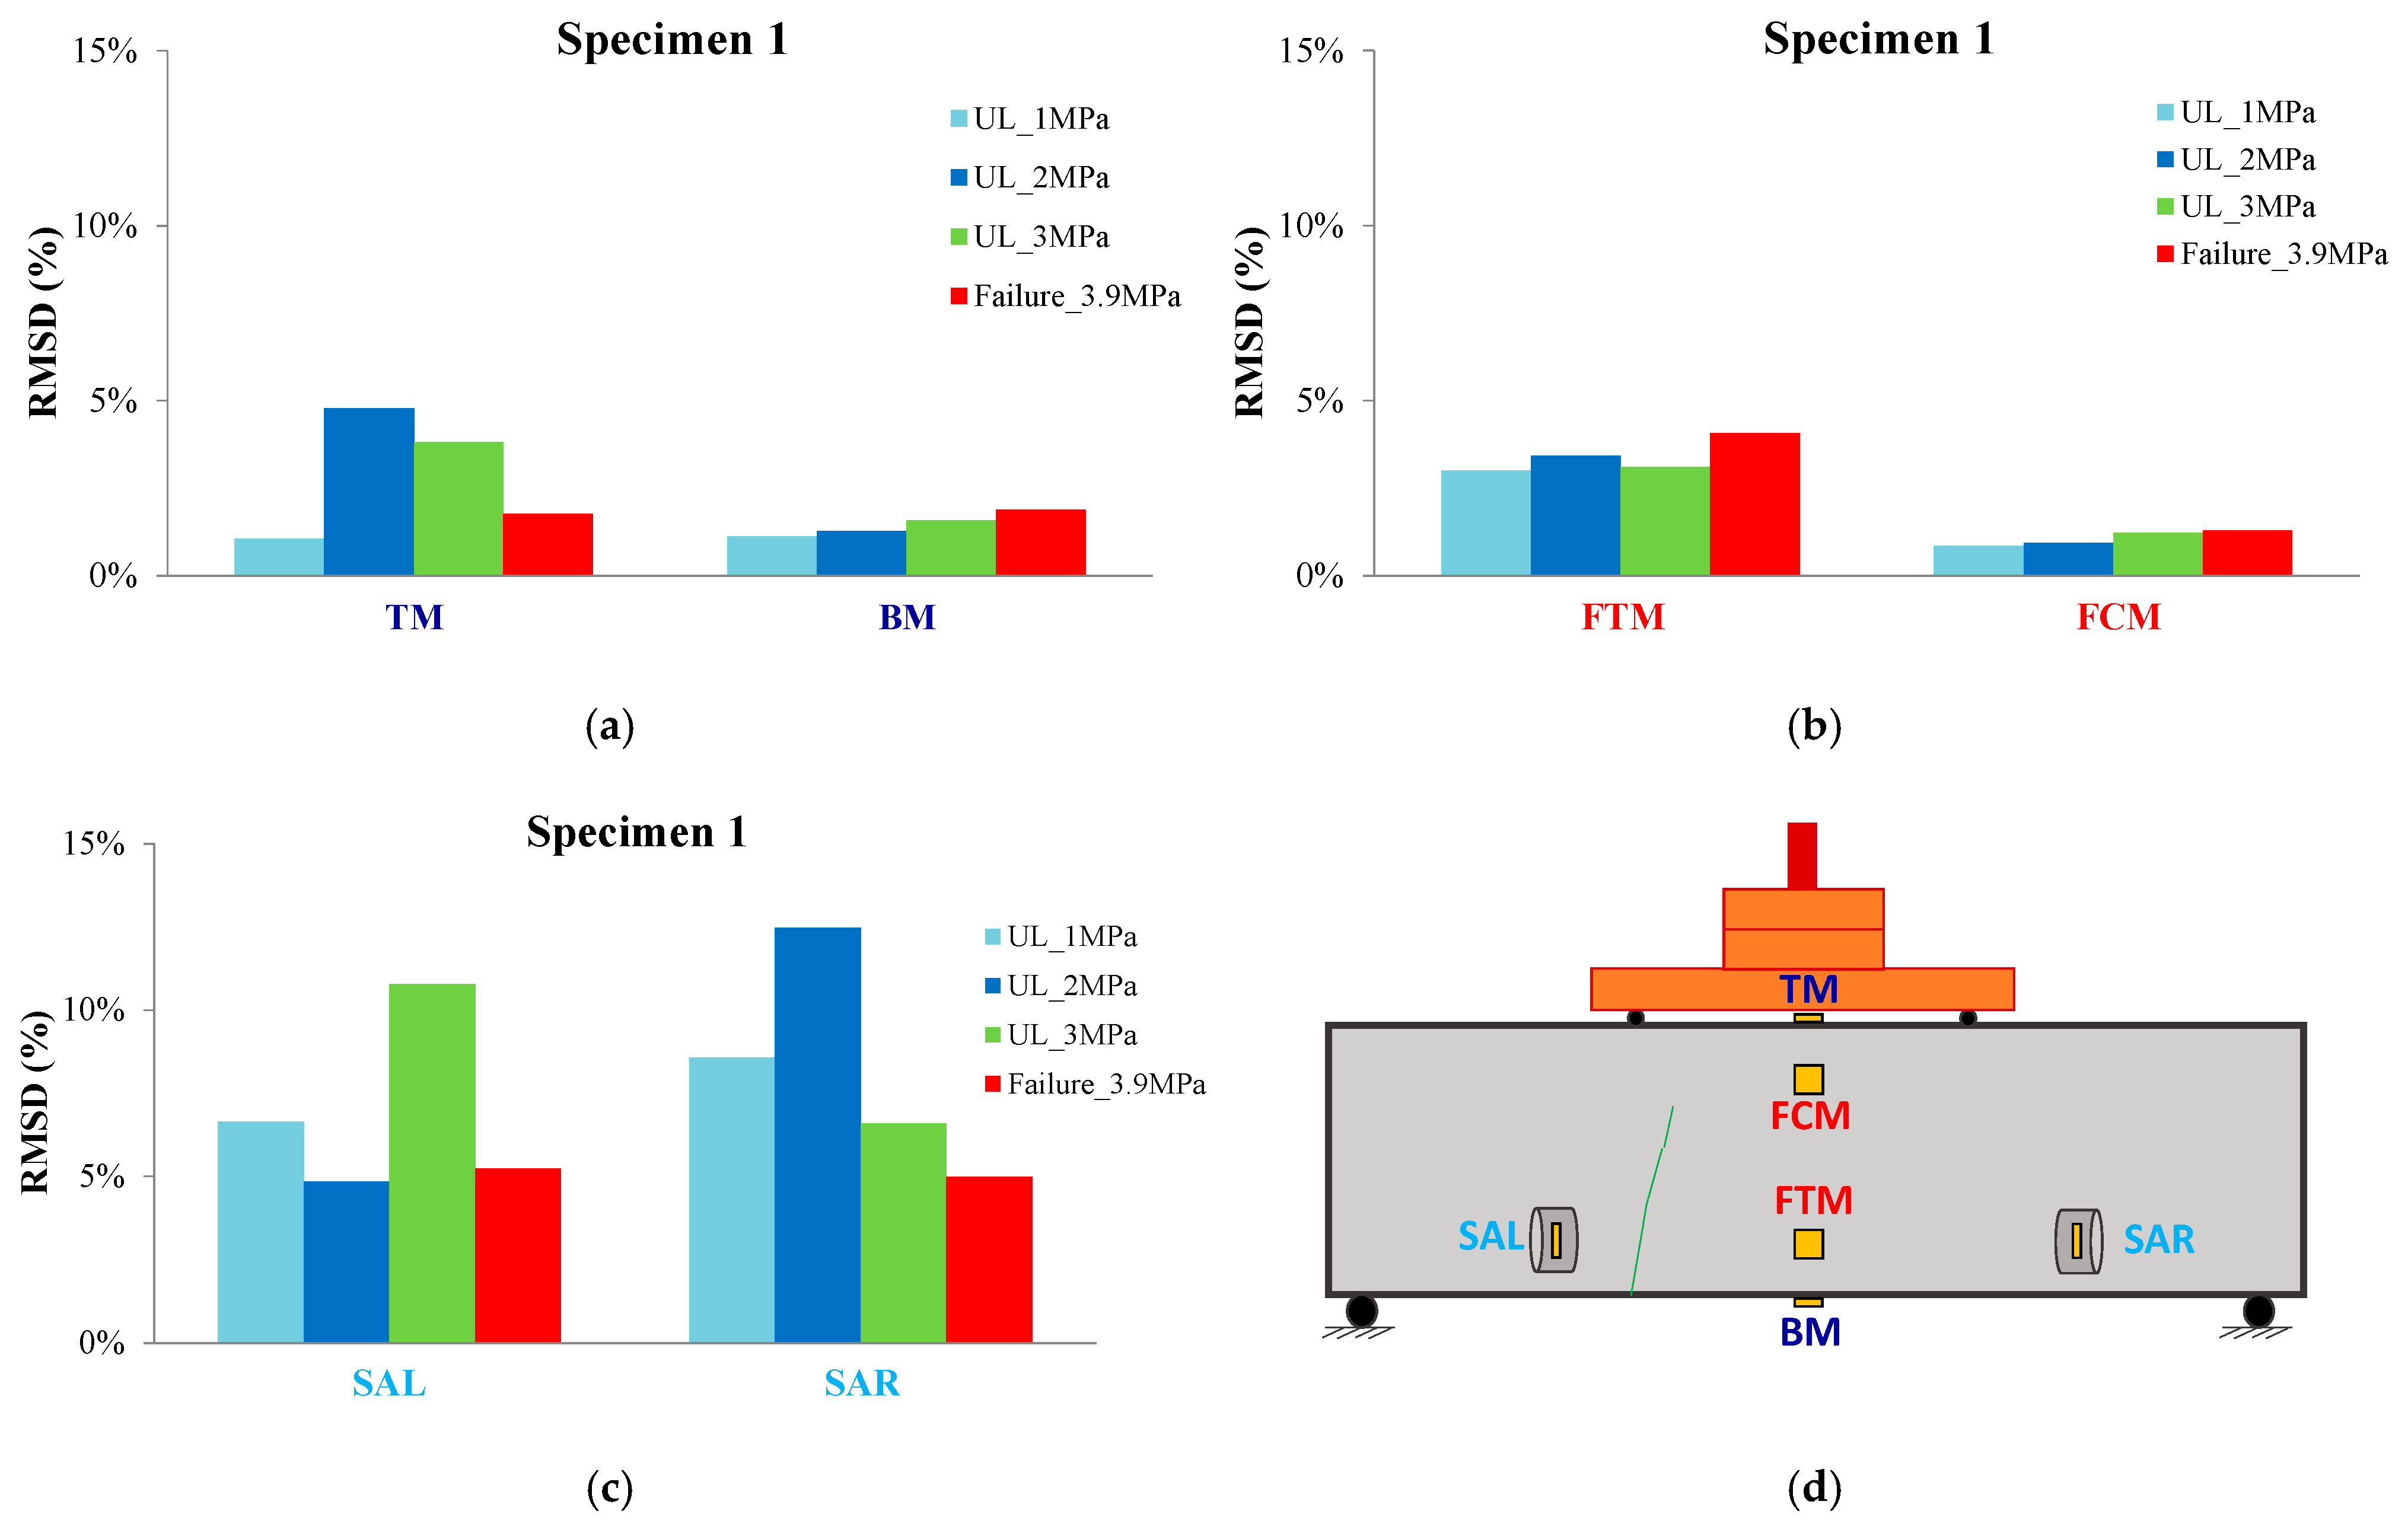
3.2. Indices Analysis
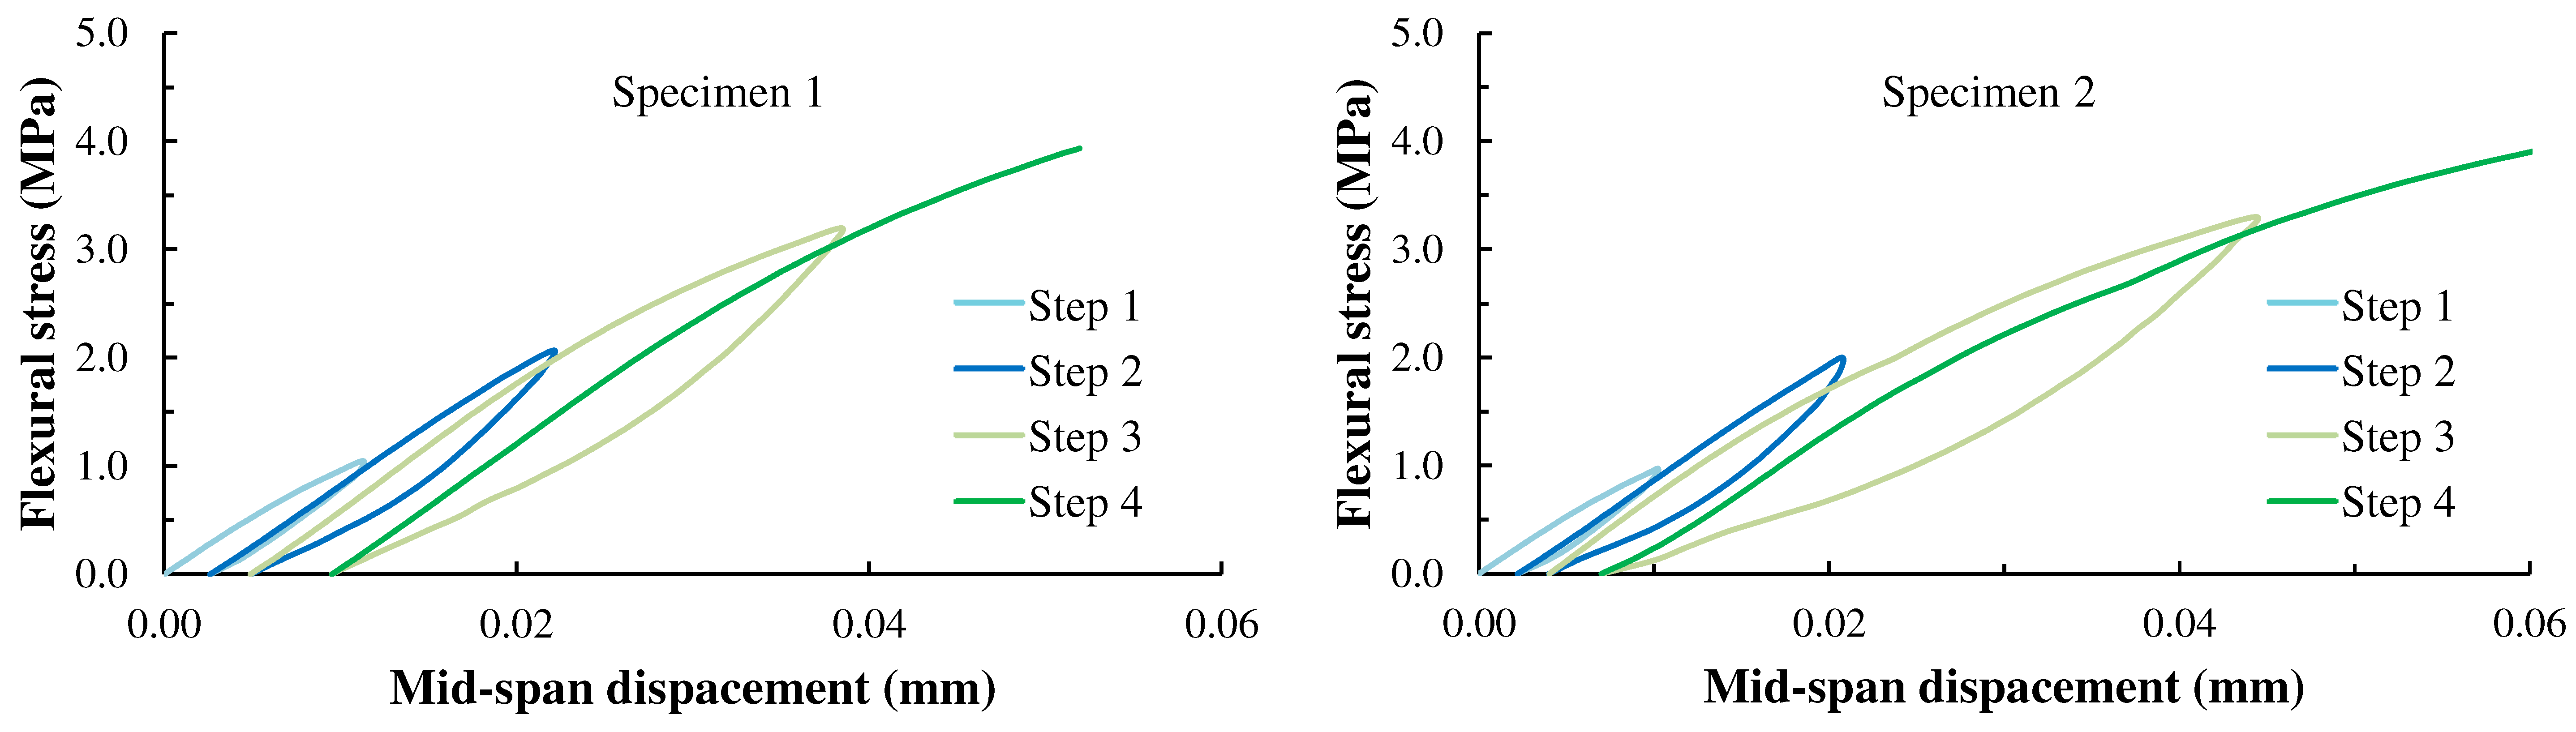
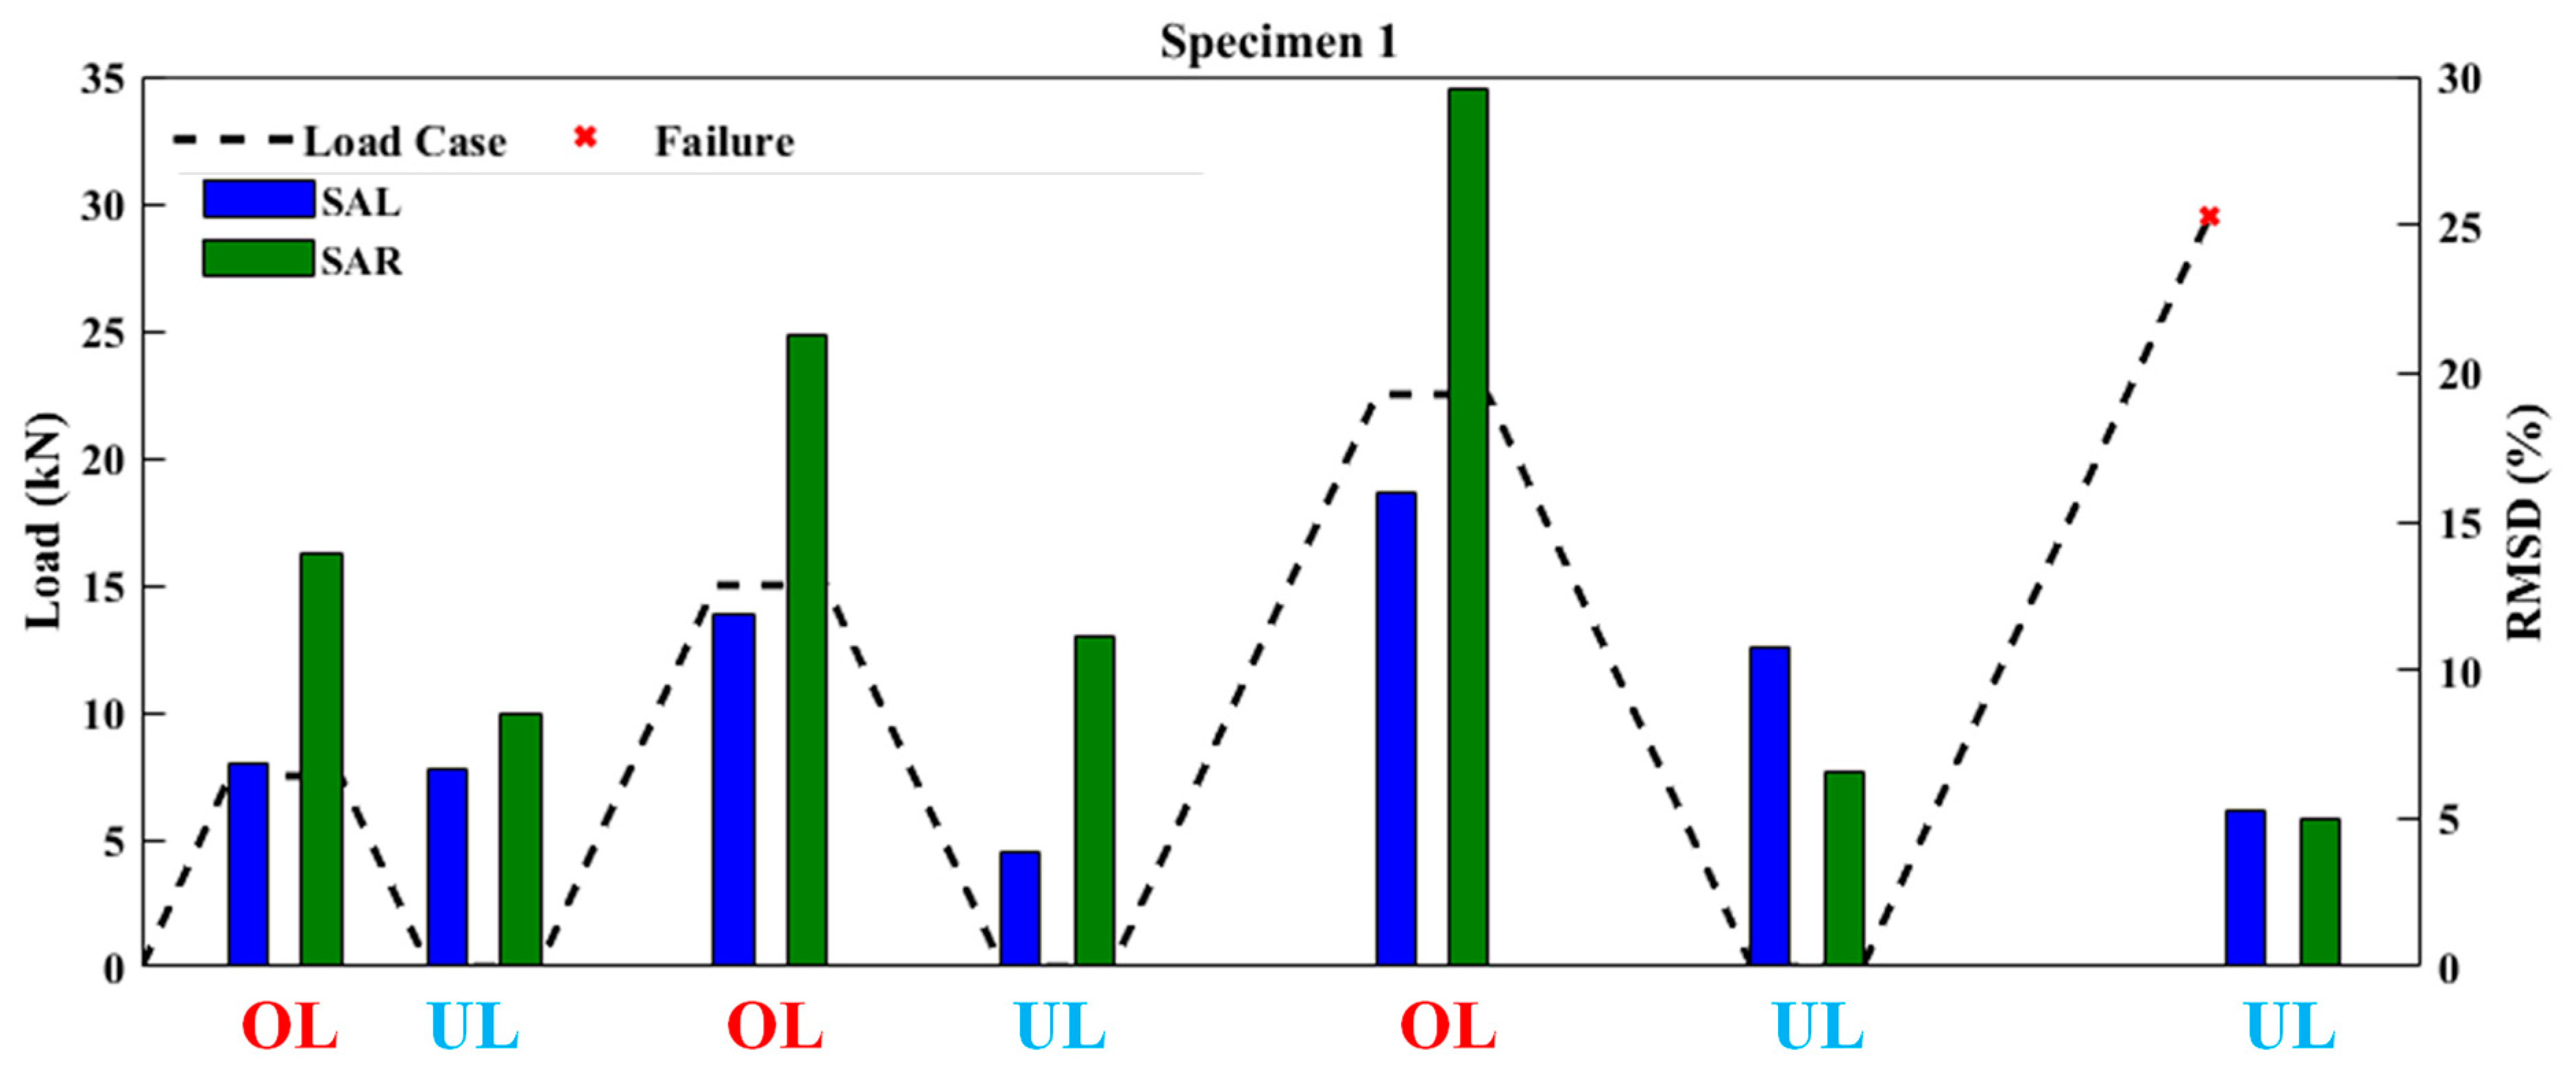
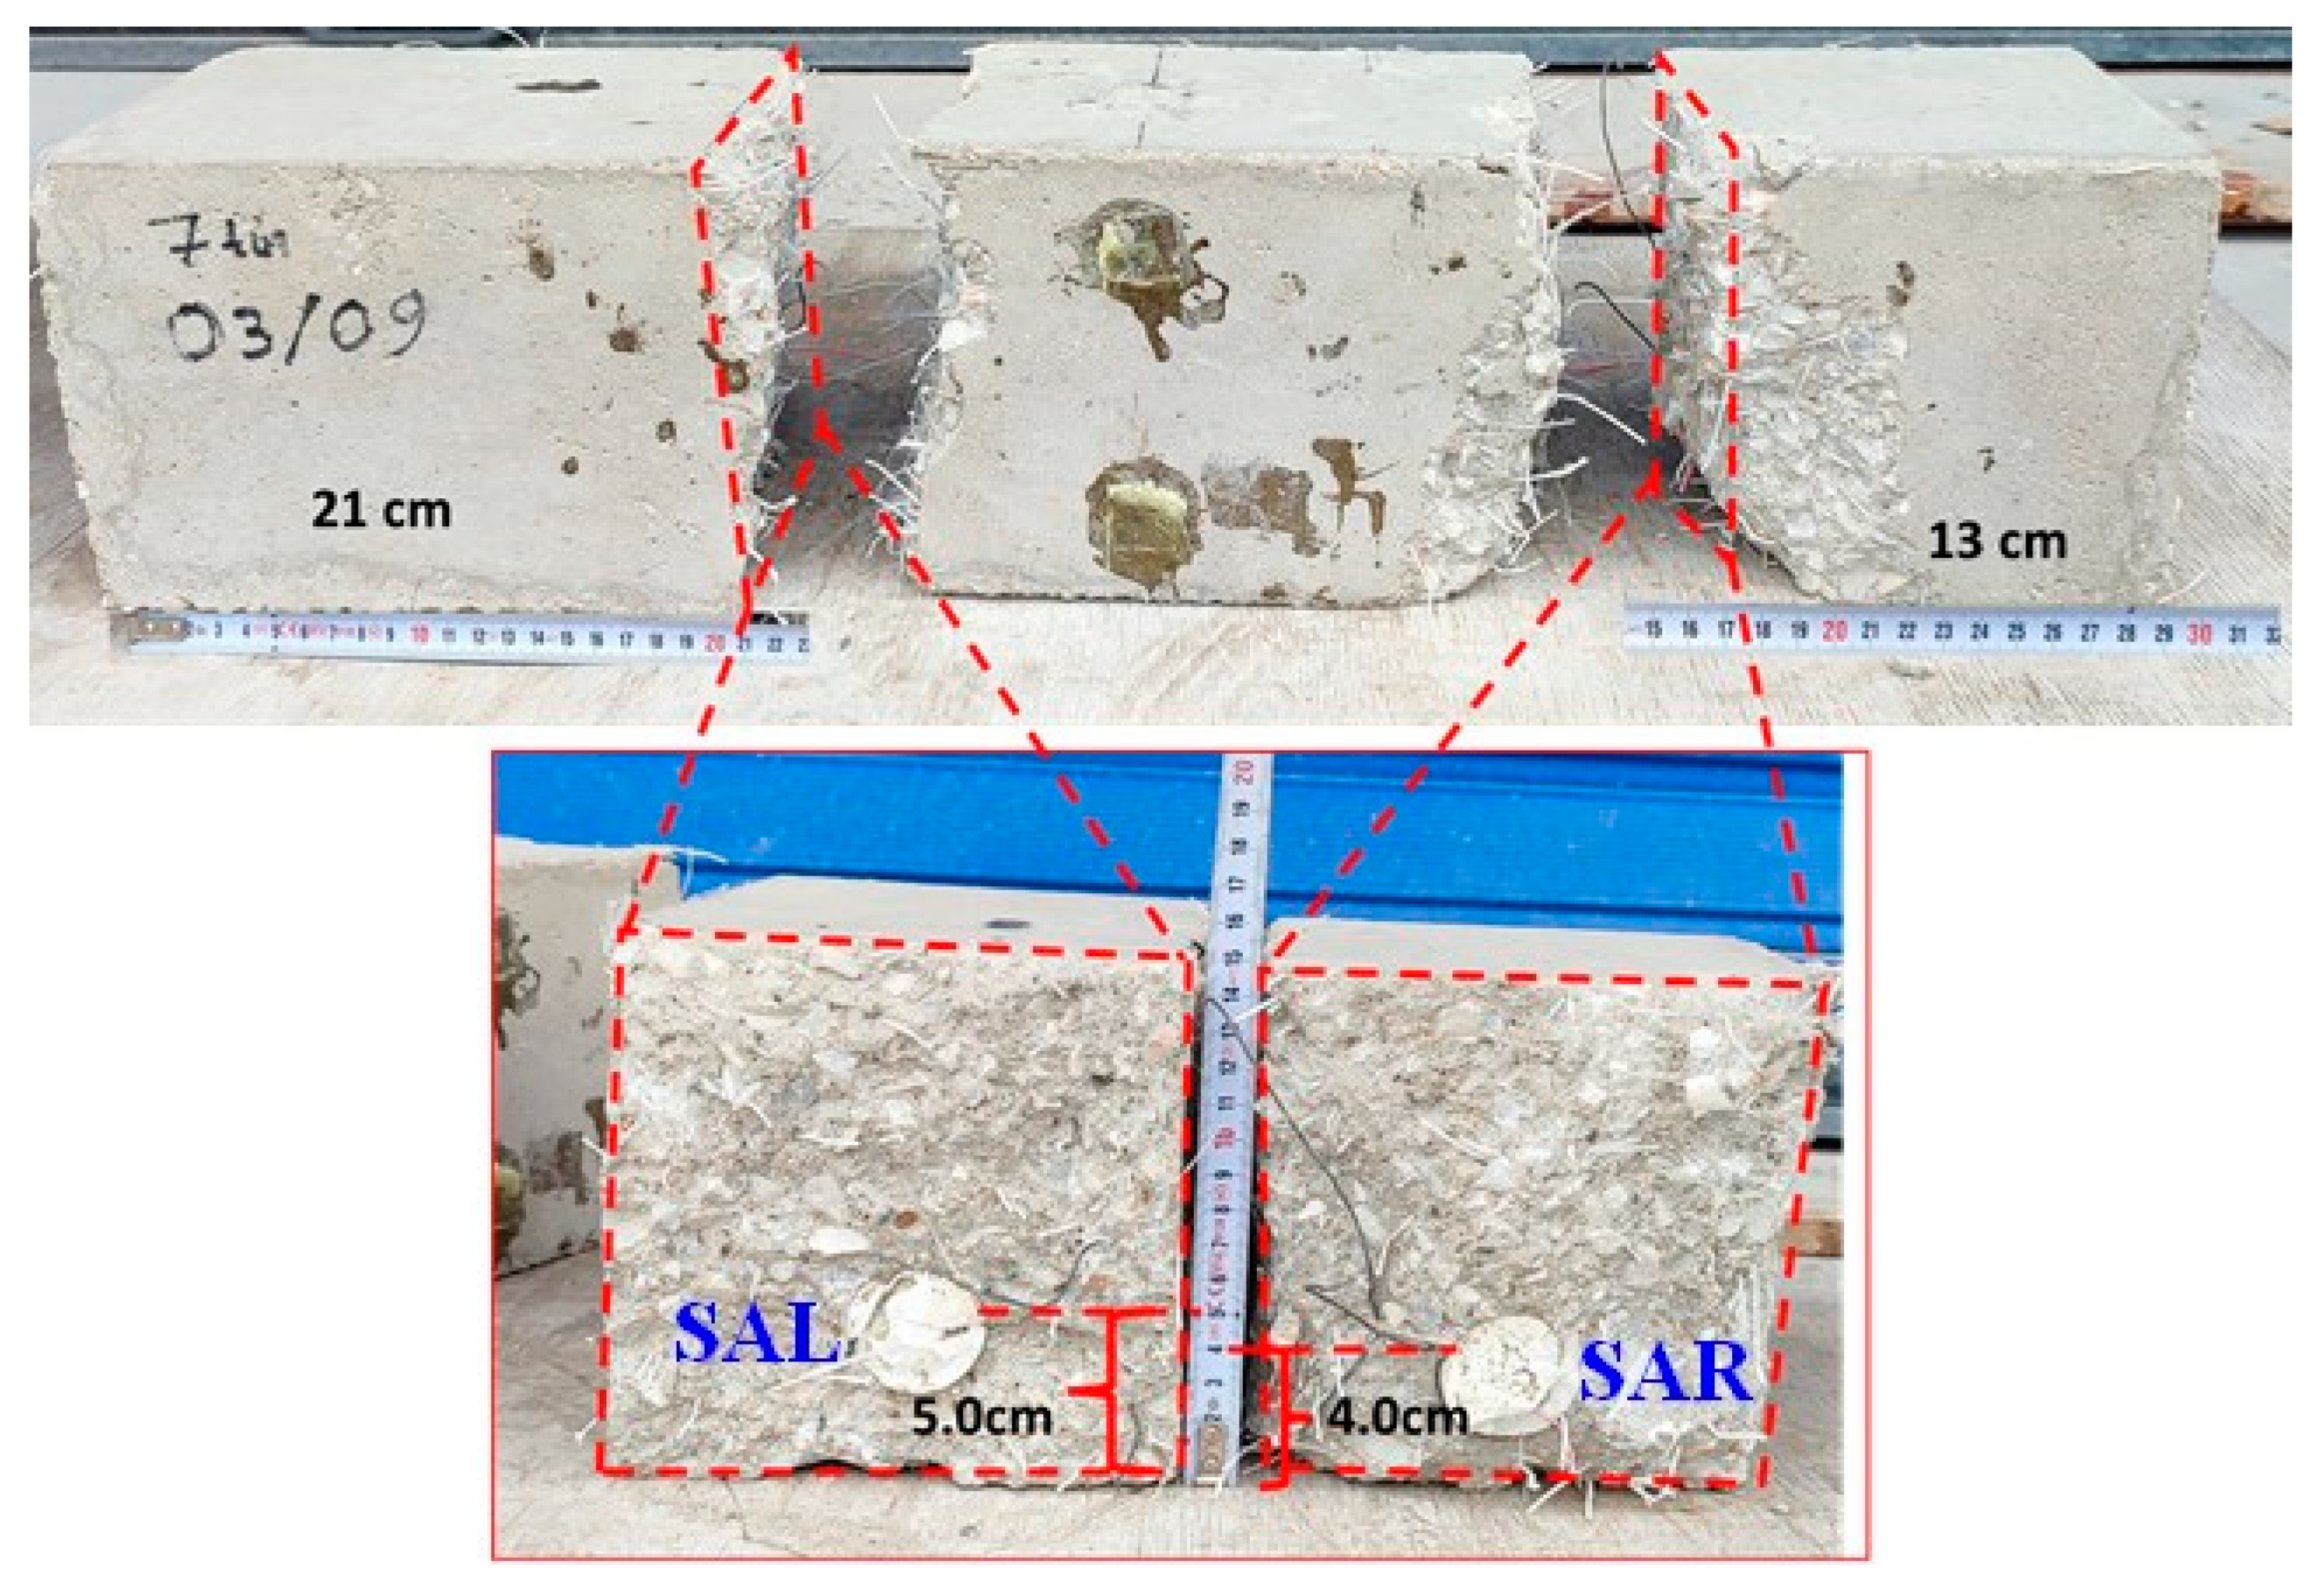
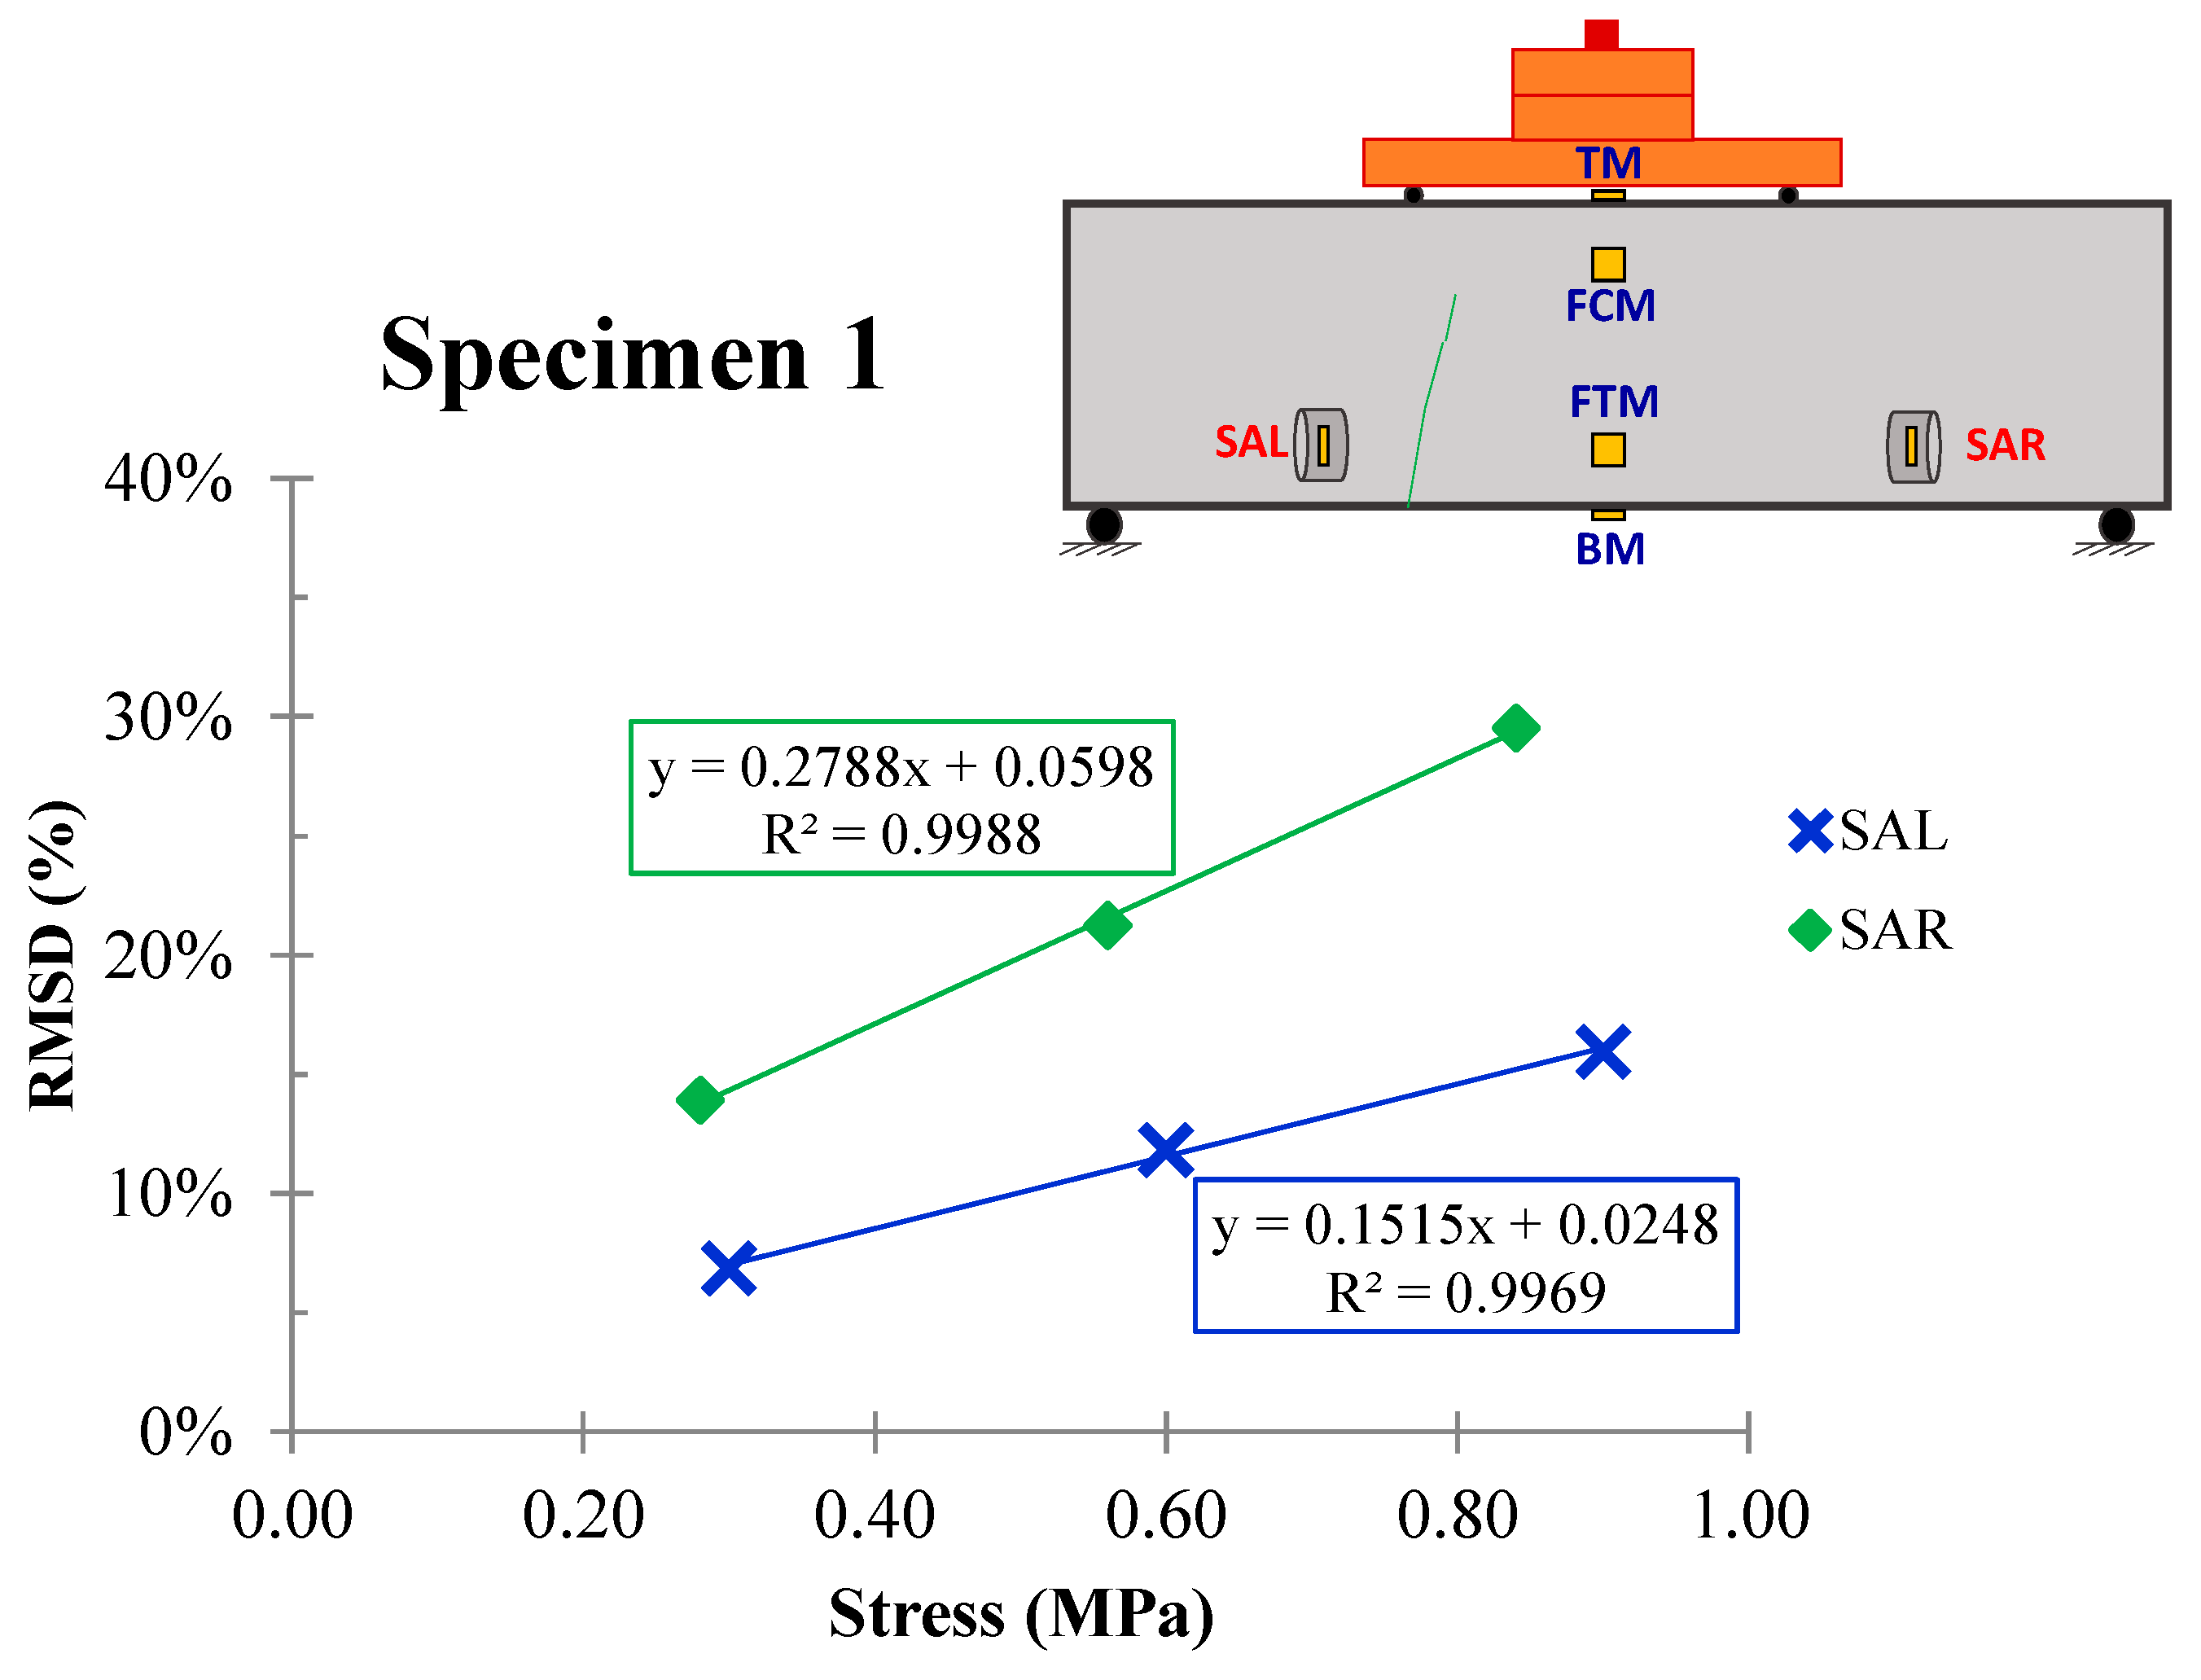
3.2.1. Specimen 1
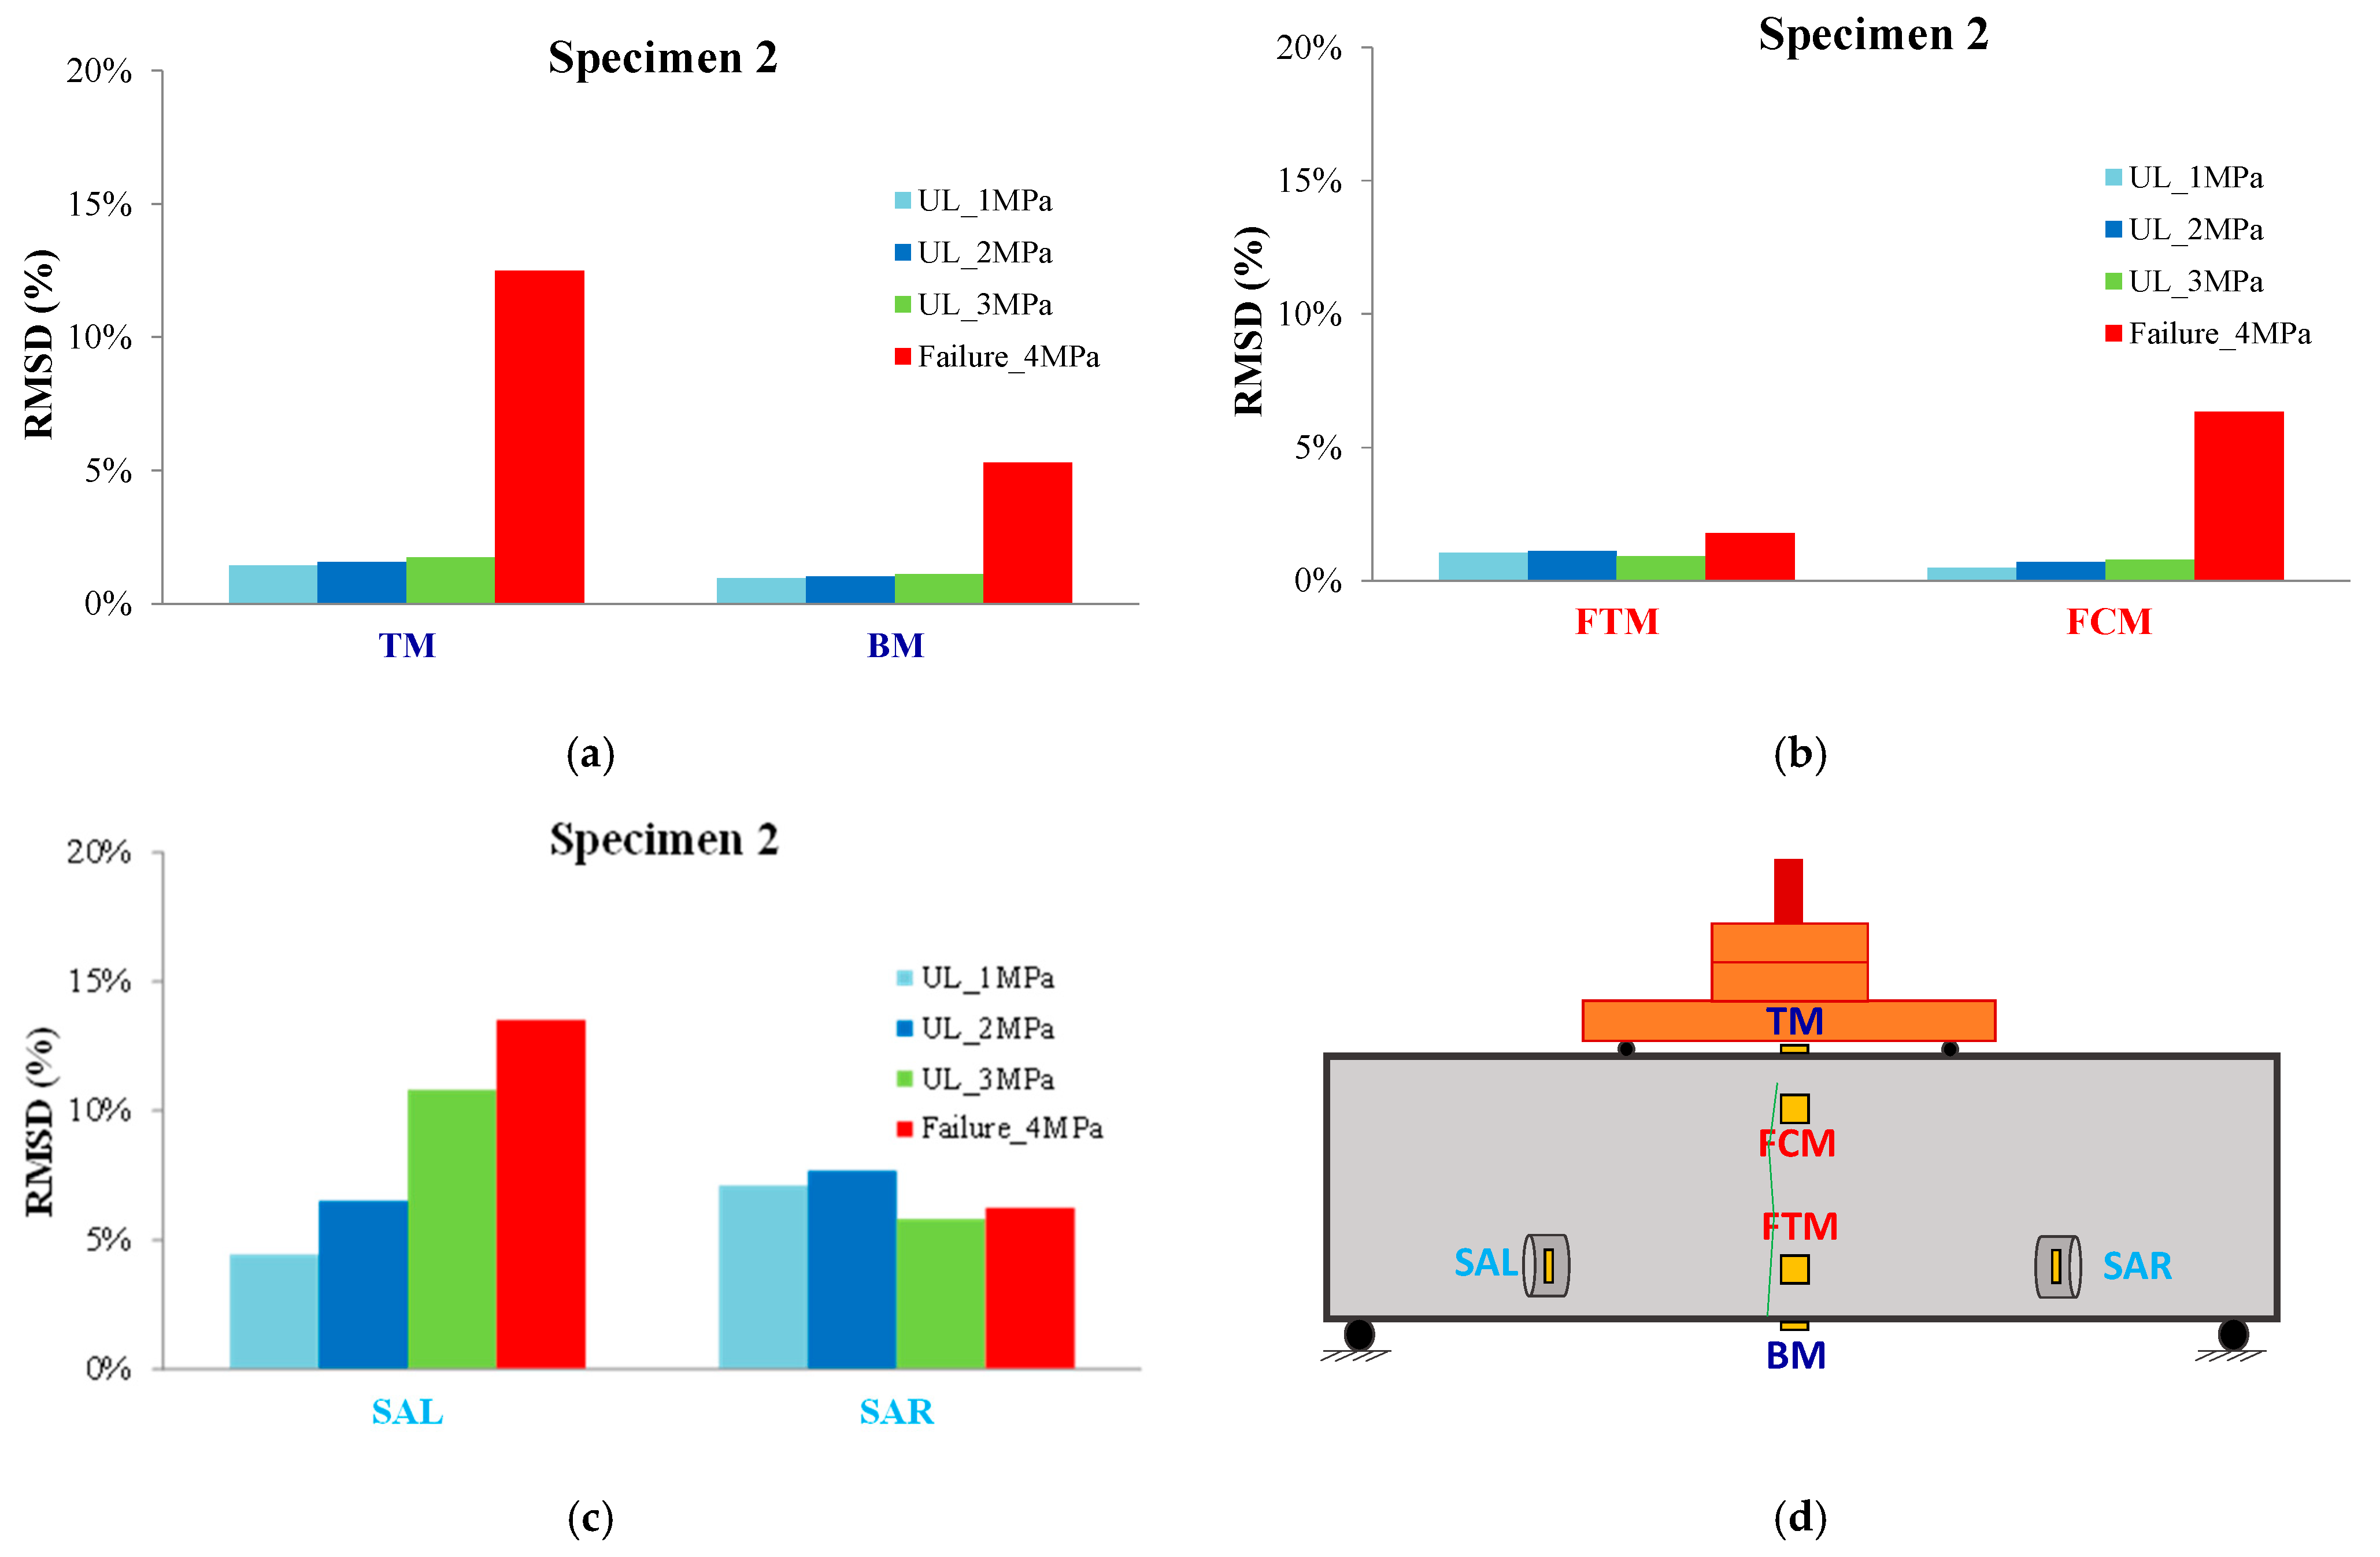
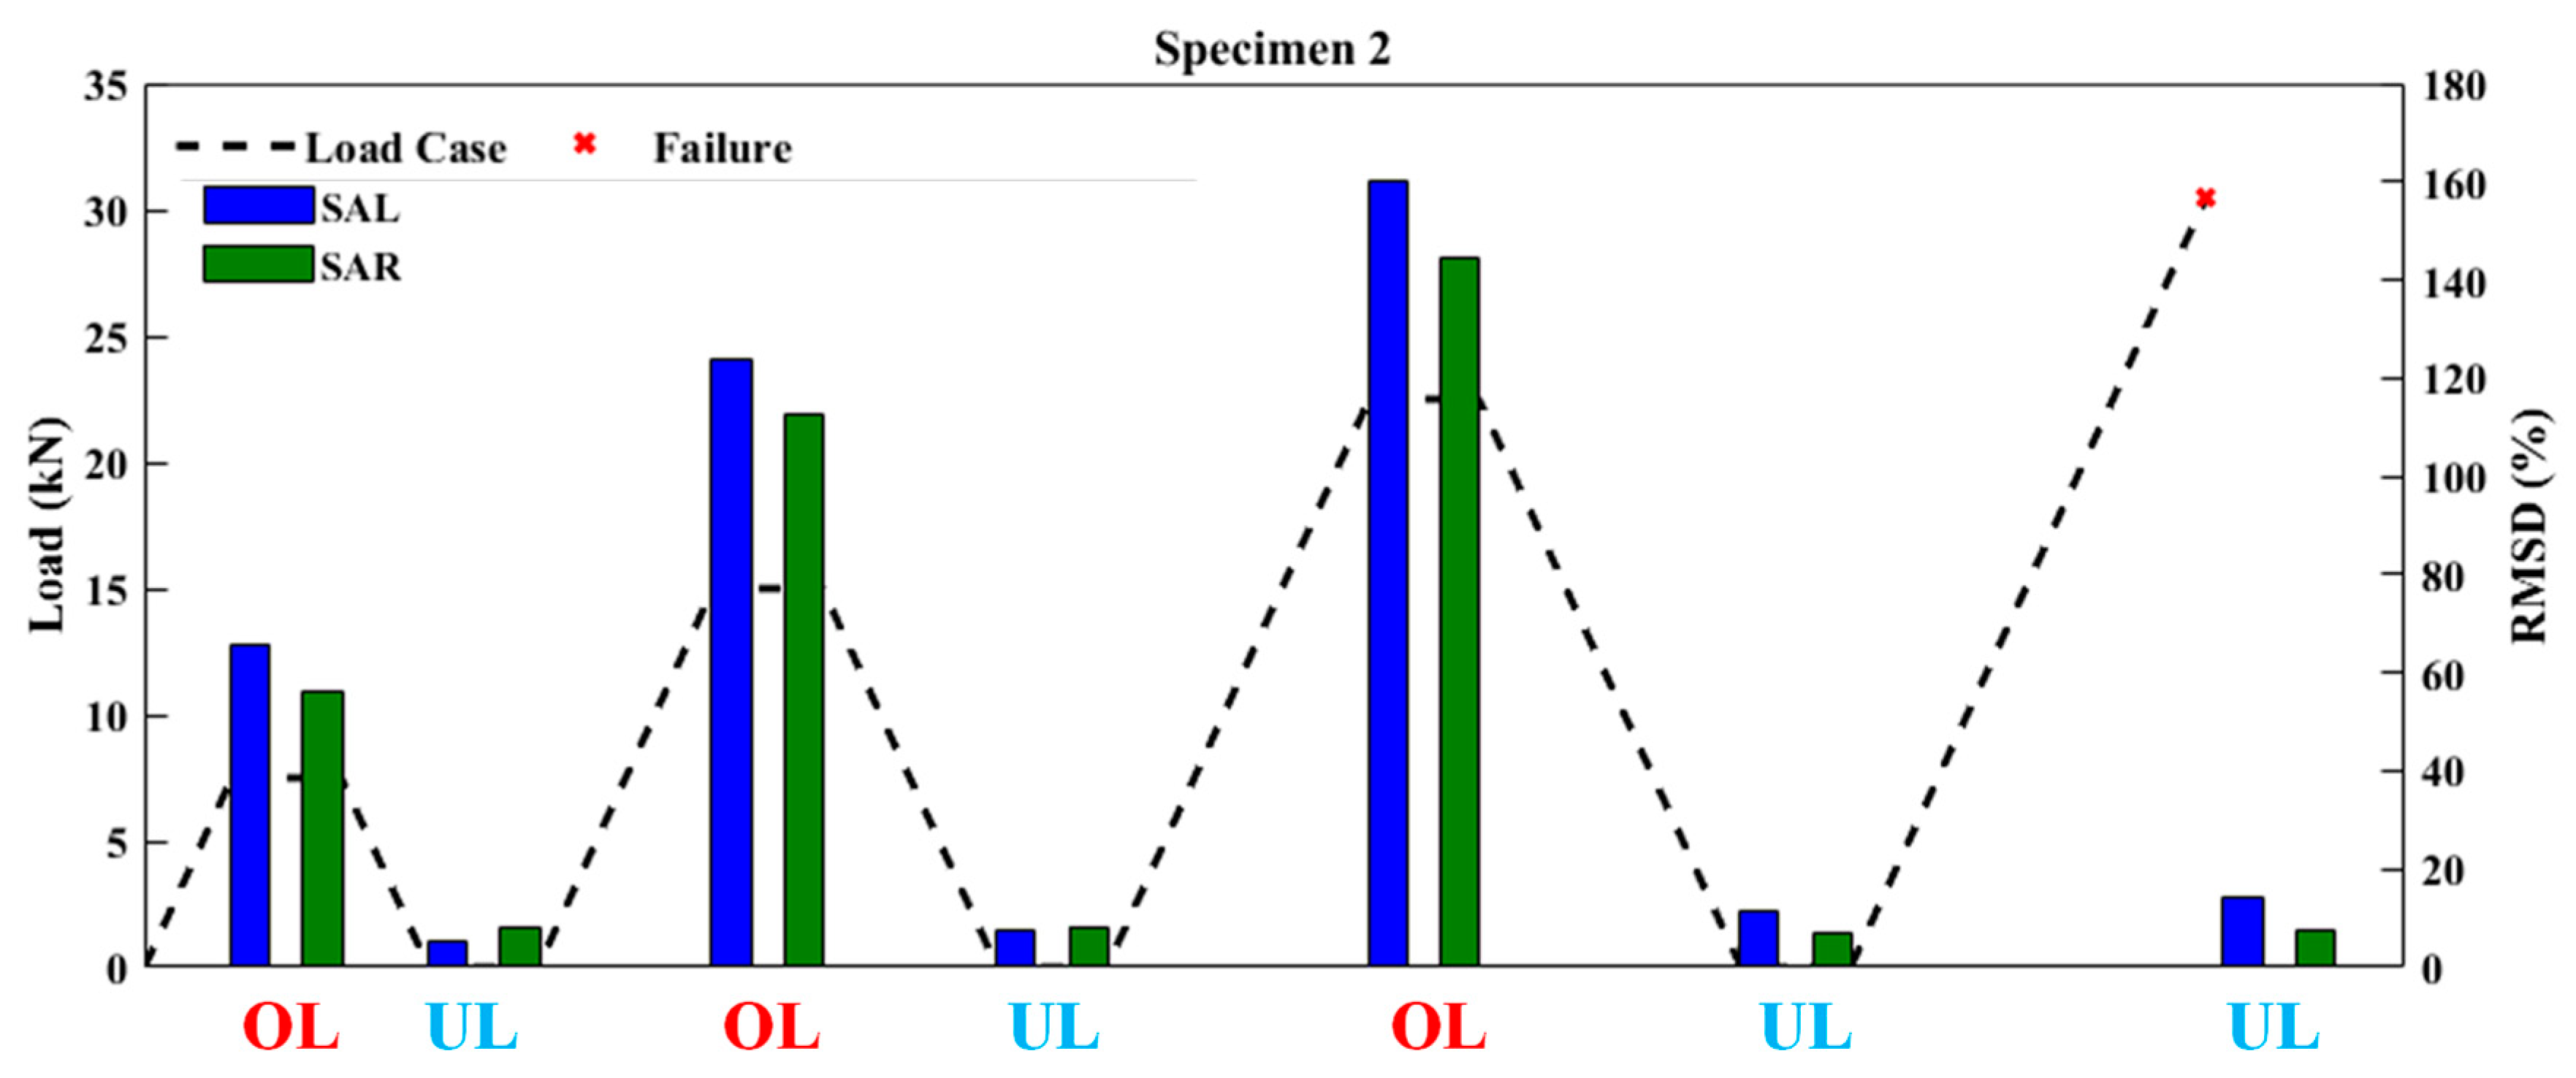
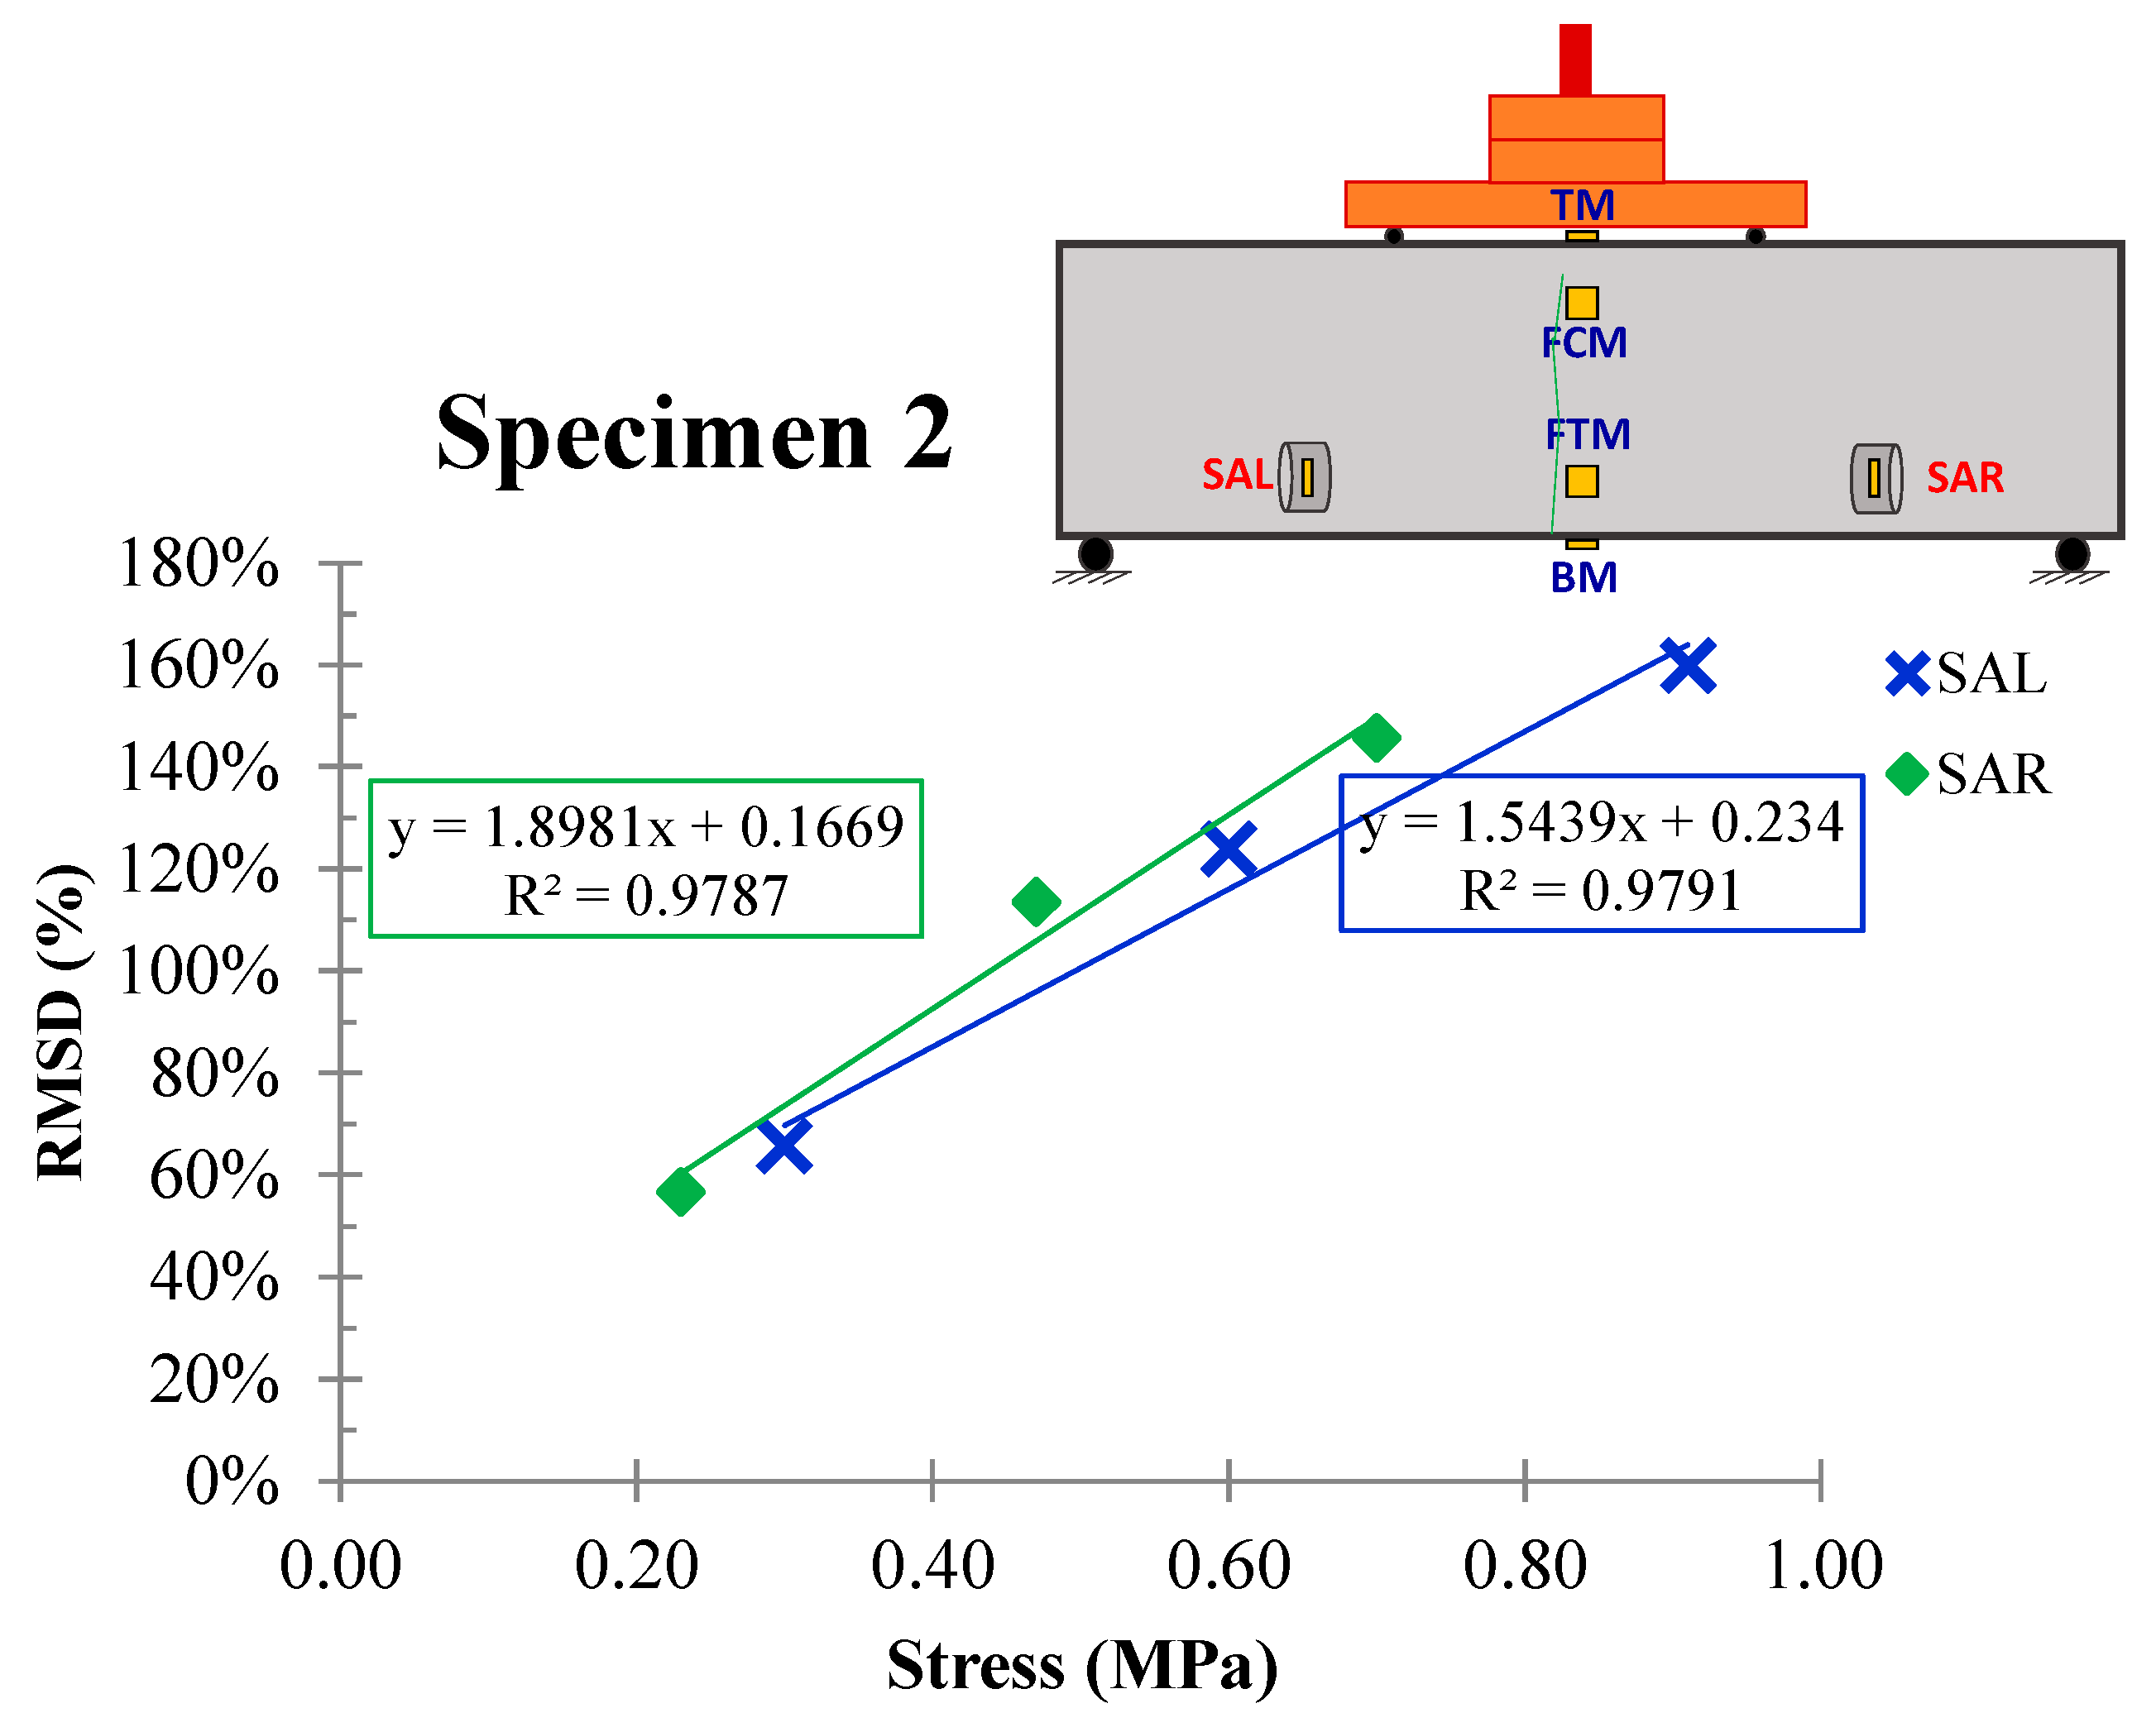
3.2.2. Specimen 2
4. Significance of the Experimental Work
- Twelve individual PZT transducers were mounted to the FRC specimens with various configurations.
- Four different bonding formations were implemented between the PZT patches and the host structural member.
- Six different types of multilateral positioning of the sensors regarding the x/y/z axis were examined.
- Six different monitoring applications were used to investigate the impact of the formed angle between the position of the PZT transducer and the fatal crack.
- Over 300 acquired voltage versus frequency responses and many additional ones for the preliminary checking of the curing conditions of the PZT sensors.
- Over 70,000 measurements of voltage data.
5. Conclusions
Author Contributions
Funding
Data Availability Statement
Conflicts of Interest
References
- Voutetaki, M.E.; Naoum, M.C.; Papadopoulos, N.A.; Chalioris, C.E. Cracking Diagnosis in Fiber-Reinforced Concrete with Synthetic Fibers Using Piezoelectric Transducers. Fibers 2022, 10, 5. [Google Scholar] [CrossRef]
- Martinelli, E.; Pepe, M.; Fraternali, F. Meso-Scale Formulation of a Cracked-Hinge Model for Hybrid Fiber-Reinforced Cement Composites. Fibers 2020, 8, 56. [Google Scholar] [CrossRef]
- Tsangouri, E.; Aggelis, D.G.; Matikas, T.E.; Mpalaskas, A.C. Acoustic Emission Activity for Characterizing Fracture of Marble under Bending. Appl. Sci. 2016, 6, 6. [Google Scholar] [CrossRef]
- Tsonos, A.G. Ultra-High-Performance Fiber Reinforced Concrete: An Innovative Solution for Strengthening Old R/C Structures and for Improving the FRP Strengthening Method; New Forest: London, UK, 2009; pp. 273–284. [Google Scholar]
- Kalogeropoulos, G.I.; Tsonos, A.-D.G.; Konstandinidis, D.; Tsetines, S. Pre-earthquake and post-earthquake retrofitting of poorly detailed exterior RC beam-to-column joints. Eng. Struct. 2016, 109, 1–15. [Google Scholar] [CrossRef]
- Shehab, H.; Eisa, A.; Wahba, A.M.; Sabol, P.; Katunský, D. Strengthening of Reinforced Concrete Columns Using Ultra-High Performance Fiber-Reinforced Concrete Jacket. Buildings 2023, 13, 2036. [Google Scholar] [CrossRef]
- Murad, Y.; Abdel-Jabar, H. Flexural Behavior of RC Beams Made with Electric PVC Wires and Steel Fibers. Pract. Period. Struct. Des. Constr. 2021, 26, 04021040. [Google Scholar] [CrossRef]
- Thomoglou, A.K.; Falara, M.G.; Gkountakou, F.I.; Elenas, A.; Chalioris, C.E. Smart Cementitious Sensors with Nano-, Micro-, and Hybrid-Modified Reinforcement: Mechanical and Electrical Properties. Sensors 2023, 23, 2405. [Google Scholar] [CrossRef]
- Metaxa, Z.S.; Tolkou, A.K.; Efstathiou, S.; Rahdar, A.; Favvas, E.P.; Mitropoulos, A.C.; Kyzas, G.Z. Nanomaterials in Cementitious Composites: An Update. Molecules 2021, 26, 1430. [Google Scholar] [CrossRef]
- Metaxa, Z.S.; Boutsioukou, S.; Amenta, M.; Favvas, E.P.; Kourkoulis, S.K.; Alexopoulos, N.D. Dispersion of Multi-Walled Carbon Nanotubes into White Cement Mortars: The Effect of Concentration and Surfactants. Nanomaterials 2022, 12, 1031. [Google Scholar] [CrossRef]
- Li, Y.-F.; Yang, K.-H.; Hsu, P.-Y.; Syu, J.-Y.; Wang, S.-J.; Kuo, W.-S.; Tsai, Y.-K. Comparing Mechanical Characterization of Carbon, Kevlar, and Hybrid-Fiber-Reinforced Concrete under Quasistatic and Dynamic Loadings. Buildings 2023, 13, 2044. [Google Scholar] [CrossRef]
- Brindha, U.; Maheswaran, J.; Chellapandian, M.; Arunachelam, N. Quantitative Assessment of Strengthening Strategies and Design Recommendations for the Repair of Corrosion-Damaged Reinforced Concrete Members. Buildings 2023, 13, 1080. [Google Scholar] [CrossRef]
- Koteš, P.; Vavruš, M.; Jošt, J.; Prokop, J. Strengthening of Concrete Column by Using the Wrapper Layer of Fibre Reinforced Concrete. Materials 2020, 13, 5432. [Google Scholar] [CrossRef] [PubMed]
- Bernard, E.S. Long-term Post-crack Performance of High-strength Fiber-reinforced Concrete for Structural Applications. Struct. Concr. 2023, 24, 1134–1151. [Google Scholar] [CrossRef]
- Murad, Y.; Abdel-Jabbar, H. Shear Behavior of RC Beams Prepared with Basalt and Polypropylene Fibers. Case Stud. Constr. Mater. 2022, 16, e00835. [Google Scholar] [CrossRef]
- Bernard, E.S. Correlations in Performance of Fiber-Reinforced Concrete Assessed Using EN 14651 and Modified ASTM C1609/C1609M-19 Beam Tests. Adv. Civ. Eng. Matls. 2022, 11, 20210127. [Google Scholar] [CrossRef]
- Tsonos, A.G. Seismic repair of exterior R/C beam-to-column joints using two-sided and three-sided jackets. Struct. Eng. Mech. 2002, 13, 17–34. [Google Scholar] [CrossRef]
- Golias, E.; Zapris, A.G.; Kytinou, V.K.; Kalogeropoulos, G.I.; Chalioris, C.E.; Karayannis, C.G. Effectiveness of the novel rehabilitation method of seismically damaged RC joints using C-FRP ropes and comparison with widely applied method using C-FRP sheets—Experimental investigation. Sustainability 2021, 13, 6454. [Google Scholar] [CrossRef]
- Le, B.-T.; Nguyen, T.-T.; Truong, T.-D.-N.; Nguyen, C.-T.; Phan, T.T.V.; Ho, D.-D.; Huynh, T.-C. Crack Detection in Bearing Plate of Prestressed Anchorage Using Electromechanical Impedance Technique: A Numerical Investigation. Buildings 2023, 13, 1008. [Google Scholar] [CrossRef]
- Yang, Y.; Divsholi, B.S. Sub-Frequency Interval Approach in Electromechanical Impedance Technique for Concrete Structure Health Monitoring. Sensors 2010, 10, 11644–11661. [Google Scholar] [CrossRef]
- Yang, Y.; Hu, Y.; Lu, Y. Sensitivity of PZT Impedance Sensors for Damage Detection of Concrete Structures. Sensors 2008, 8, 327–346. [Google Scholar] [CrossRef]
- Liu, Q.; Dai, G.; Wang, C.; Wu, X.; Ren, X. Interfacial Effect on Quantitative Concrete Stress Monitoring via Embedded PZT Sensors Based on EMI Technique. Buildings 2023, 13, 560. [Google Scholar] [CrossRef]
- Na, W.; Baek, J. A Review of the Piezoelectric Electromechanical Impedance Based Structural Health Monitoring Technique for Engineering Structures. Sensors 2018, 18, 1307. [Google Scholar] [CrossRef] [PubMed]
- Zhang, C.; Panda, G.P.; Yan, Q.; Zhang, W.; Vipulanandan, C.; Song, G. Monitoring Early-Age Hydration and Setting of Portland Cement Paste by Piezoelectric Transducers via Electromechanical Impedance Method. Constr. Build. Mater. 2020, 258, 120348. [Google Scholar] [CrossRef]
- Naoum, M.C.; Sapidis, G.M.; Papadopoulos, N.A.; Voutetaki, M.E. An Electromechanical Impedance-Based Application of Realtime Monitoring for the Load-Induced Flexural Stress and Damage in Fiber-Reinforced Concrete. Fibers 2023, 11, 34. [Google Scholar] [CrossRef]
- Narayanan, A.; Subramaniam, K.V.L. Sensing of Damage and Substrate Stress in Concrete Using Electromechanical Impedance Measurements of Bonded PZT Patches. Smart Mater. Struct. 2016, 25, 095011. [Google Scholar] [CrossRef]
- Adamczak-Bugno, A.; Lipiec, S.; Vavruš, M.; Koteš, P. Non-Destructive Methods and Numerical Analysis Used for Monitoring and Analysis of Fibre Concrete Deformations. Materials 2022, 15, 7268. [Google Scholar] [CrossRef]
- Abdallah, M.A.; Elakhras, A.A.; Reda, R.M.; Sallam, H.E.-D.M.; Moawad, M. Applicability of CMOD to Obtain the Actual Fracture Toughness of Rightly-Cracked Fibrous Concrete Beams. Buildings 2023, 13, 2010. [Google Scholar] [CrossRef]
- Yoo, D.-Y.; Banthia, N. Impact Resistance of Fiber-Reinforced Concrete—A Review. Cem. Concr. Compos. 2019, 104, 103389. [Google Scholar] [CrossRef]
- Vavruš, M.; Kralovanec, J. Study of Application of Fiber Reinforced Concrete in Anchorage Zone. Buildings 2023, 13, 524. [Google Scholar] [CrossRef]
- Bandara, S.; Wijesundara, K.; Rajeev, P. Ultra-High-Performance Fibre-Reinforced Concrete for Rehabilitation and Strengthening of Concrete Structures: A Suitability Assessment. Buildings 2023, 13, 614. [Google Scholar] [CrossRef]
- AL-Kharabsheh, B.N.; Arbili, M.M.; Majdi, A.; Alogla, S.M.; Hakamy, A.; Ahmad, J.; Deifalla, A.F. Basalt Fibers Reinforced Concrete: Strength and Failure Modes. Materials 2022, 15, 7350. [Google Scholar] [CrossRef]
- ASTM C192; Practice for Making and Curing Concrete Test Specimens in the Laboratory. ASTM: West Conshohocken, PA, USA, 2007.
- ASTM 78 ASTM C 78–94; Standard Test Method for Flexural Strength of Concrete (Using Simple Beam with Third-Point Loading). ASTM: West Conshohocken, PA, USA, 2002.
- Zhao, S.; Fan, S.; Yang, J.; Kitipornchai, S. A Spherical Smart Aggregate Sensor Based Electromechanical Impedance Method for Quantitative Damage Evaluation of Concrete. Struct. Health Monit. 2020, 19, 1560–1576. [Google Scholar] [CrossRef]
- Gao, W.; Li, H.; Ho, S. A Novel Embeddable Tubular Piezoceramics-Based Smart Aggregate for Damage Detection in Two-Dimensional Concrete Structures. Sensors 2019, 19, 1501. [Google Scholar] [CrossRef] [PubMed]
- Papadopoulos, N.A.; Naoum, M.C.; Sapidis, G.M.; Chalioris, C.E. Cracking and Fiber Debonding Identification of Concrete Deep Beams Reinforced with C-FRP Ropes against Shear Using a Real-Time Monitoring System. Polymers 2023, 15, 473. [Google Scholar] [CrossRef] [PubMed]
- Karayannis, C.G.; Golias, E.; Naoum, M.C.; Chalioris, C.E. Efficacy and Damage Diagnosis of Reinforced Concrete Columns and Joints Strengthened with FRP Ropes Using Piezoelectric Transducers. Sensors 2022, 22, 8294. [Google Scholar] [CrossRef]
- Providakis, C.; Tsistrakis, S.; Voutetaki, M.; Tsompanakis, J.; Stavroulaki, M.; Agadakos, J.; Kampianakis, E.; Pentes, G.; Liarakos, E. An Innovative Active Sensing Platform for Wireless Damage Monitoring of Concrete Structures. Curr. Smart Mater. 2016, 1, 49–62. [Google Scholar] [CrossRef]
- Wang, Z.; Chen, D.; Zheng, L.; Huo, L.; Song, G. Influence of Axial Load on Electromechanical Impedance (EMI) of Embedded Piezoceramic Transducers in Steel Fiber Concrete. Sensors 2018, 18, 1782. [Google Scholar] [CrossRef]
- Chalioris, C.E.; Kytinou, V.K.; Voutetaki, M.E.; Karayannis, C.G. Flexural Damage Diagnosis in Reinforced Concrete Beams Using a Wireless Admittance Monitoring System—Tests and Finite Element Analysis. Sensors 2021, 21, 679. [Google Scholar] [CrossRef]


| Mix Proportion (Cement/Water/Fine Aggregate/Coarse Aggregate) | Fiber’s Content (kg) Per 1 m3 Concrete | Density (kg m−3) | Compressive Strength (MPa) | Young’s Modulus (GPa) | Modulus of Rupture (MPa) | |
|---|---|---|---|---|---|---|
| Specimen 1 | 1/2/2.4/0.52 | 5 | 2350 | 38.5 | 31.6 | 3.9 |
| Specimen 2 | 1/2/2.4/0.52 | 6 | 2350 | 34.5 | 30.9 | 4.0 |
| Properties of Macro-Synthetic Fibers. (SikaFiber Force 50) |  | |
|---|---|---|
| Length (mm) | 50 | |
| Equivalent diameter (mm) | 0.715 | |
| Young’s modulus (GPa) | 6.0 | |
| Tensile strength (MPa) | 430 | |
| Code Name of the Load Level | Maximum Load of Cycle (MPa) | Ratio of the Maximum Flexural Strength | |
|---|---|---|---|
| Specimen 1 | UL_1.0MPa | 1.0 | 25.6% |
| UL_2.0MPa | 2.0 | 51.3% | |
| UL_3.0MPa | 3.0 | 76.9% | |
| Failure_3.9MPa | 3.9 | 100% | |
| Specimen 2 | UL_1.0MPa | 1.0 | 25% |
| UL_2.0MPa | 2.0 | 50% | |
| UL_3.0MPa | 3.0 | 75% | |
| Failure_4.0MPa | 4.0 | 100% |
Disclaimer/Publisher’s Note: The statements, opinions and data contained in all publications are solely those of the individual author(s) and contributor(s) and not of MDPI and/or the editor(s). MDPI and/or the editor(s) disclaim responsibility for any injury to people or property resulting from any ideas, methods, instructions or products referred to in the content. |
© 2023 by the authors. Licensee MDPI, Basel, Switzerland. This article is an open access article distributed under the terms and conditions of the Creative Commons Attribution (CC BY) license (https://creativecommons.org/licenses/by/4.0/).
Share and Cite
Naoum, M.C.; Papadopoulos, N.A.; Voutetaki, M.E.; Chalioris, C.E. Structural Health Monitoring of Fiber-Reinforced Concrete Prisms with Polyolefin Macro-Fibers Using a Piezoelectric Materials Network under Various Load-Induced Stress. Buildings 2023, 13, 2465. https://0-doi-org.brum.beds.ac.uk/10.3390/buildings13102465
Naoum MC, Papadopoulos NA, Voutetaki ME, Chalioris CE. Structural Health Monitoring of Fiber-Reinforced Concrete Prisms with Polyolefin Macro-Fibers Using a Piezoelectric Materials Network under Various Load-Induced Stress. Buildings. 2023; 13(10):2465. https://0-doi-org.brum.beds.ac.uk/10.3390/buildings13102465
Chicago/Turabian StyleNaoum, Maria C., Nikos A. Papadopoulos, Maristella E. Voutetaki, and Constantin E. Chalioris. 2023. "Structural Health Monitoring of Fiber-Reinforced Concrete Prisms with Polyolefin Macro-Fibers Using a Piezoelectric Materials Network under Various Load-Induced Stress" Buildings 13, no. 10: 2465. https://0-doi-org.brum.beds.ac.uk/10.3390/buildings13102465