
Multi-Analytical Investigations of the Medieval Turkish Bath from Golești Open Air Museum


1
National Institute of Research and Development for Optoelectronics INOE 2000, 077125 Măgurele, Romania
2
Goleşti Museum, 117717 Golesti, Romania
*
Author to whom correspondence should be addressed.
Buildings 2023, 13(2), 321; https://0-doi-org.brum.beds.ac.uk/10.3390/buildings13020321
Submission received: 2 December 2022
/
Revised: 17 January 2023
/
Accepted: 18 January 2023
/
Published: 21 January 2023
(This article belongs to the Special Issue Advanced Technologies in Architectural Heritage Protection)
Abstract
:The Golești Manor ensemble consists of architectural monuments dating back to the 17th, 18th, and 19th centuries, with ephemeral architecture roots from Phanariot times but also some pre- Brancovan influences. The Turkish steam bath is placed in the northeast of the enclosure, and it is thought to have been built by Stroe Leurdeanu. Although there are still original fragments of the old plaster that have been preserved, the Turkish bath has undergone several restorations through time, some of them poorly documented. Hyperspectral imaging (HSI) combined with LIBS were used in order to analyze the bricks and the mortars, evaluate their preservation state, map the original elements, and document and classify the interventions previously made. Based on the supervised classifications, several areas of interest were selected for LIBS elemental analysis, and multivariate data analysis was conducted in order to discriminate similar composition materials and to map the interventions and the original. By analyzing the variability of the spectral profiles, different algorithms were applied to the SWIR hyperspectral images in order to classify the main elements of the brickwork.
1. Introduction
The subject of the current study is a building made from clay bricks and mortars: the Turkish bath from the Golești Manor estate. Clay brick structures, with or without mortars, represent one of the oldest and sturdy techniques used since the Mesopotamian, Egyptian, and Roman times until medieval and modern times. Although technology advanced through the ages, bricks continued to have a simple manufacturing process based on clay, a raw material available in large quantities all over the Earth. There are a lot of brick masonries that lasted through centuries of thaw–freezing cycles, high temperatures, and anthropogenic factors that prove that it is an effective building material that provides both resistance to prevalent climatic conditions and insulation from cold and heat [1].
In the 17th century, the feudal ensemble of Golești (Argeș County) was built around two major constructions: the manor built in 1640 and the church erected six years later. For 200 years, the main buildings and annexes underwent major changes, but only a small part of them can be documented with the existing information [2].
In the northwest corner of the enclosure is located the only part of the building that was once the Turkish bath. The only documentary mention of the bathing custom at the Golești mansion was written by Paul of Aleppo and is dated 12 January 1657. Speaking about the house built by the great boyar Stroe Leurdeanu in 1640 on his rural estate, the Syrian deacon says: “His palace is big, with many baths” [3]. Built according to the Ottoman model, which in turn inherited the water culture from the Roman–Byzantine area, the hot baths (hammams) have been present in Romanian cultural spaces since the middle of the 16th century [4]. Constantin Cantacuzino, Stroe Leurdeanu’s political rival, and also a great and powerful boyar, had baths both in his house in Bucharest and in his aristocratic estate from Filipești (Prahova County), as Paul of Alep himself testifies: ‘an elegant bath whose marble is marvelous; the water that feeds it is brought by wheels with buckets placed on the river; these wheels also sprinkle the vegetable gardens and the beautiful orchards; they set many mills in motion’ [3]. The bath was not only hygienic, but a place of socializing and relaxation, where men and women spent hours of delight.
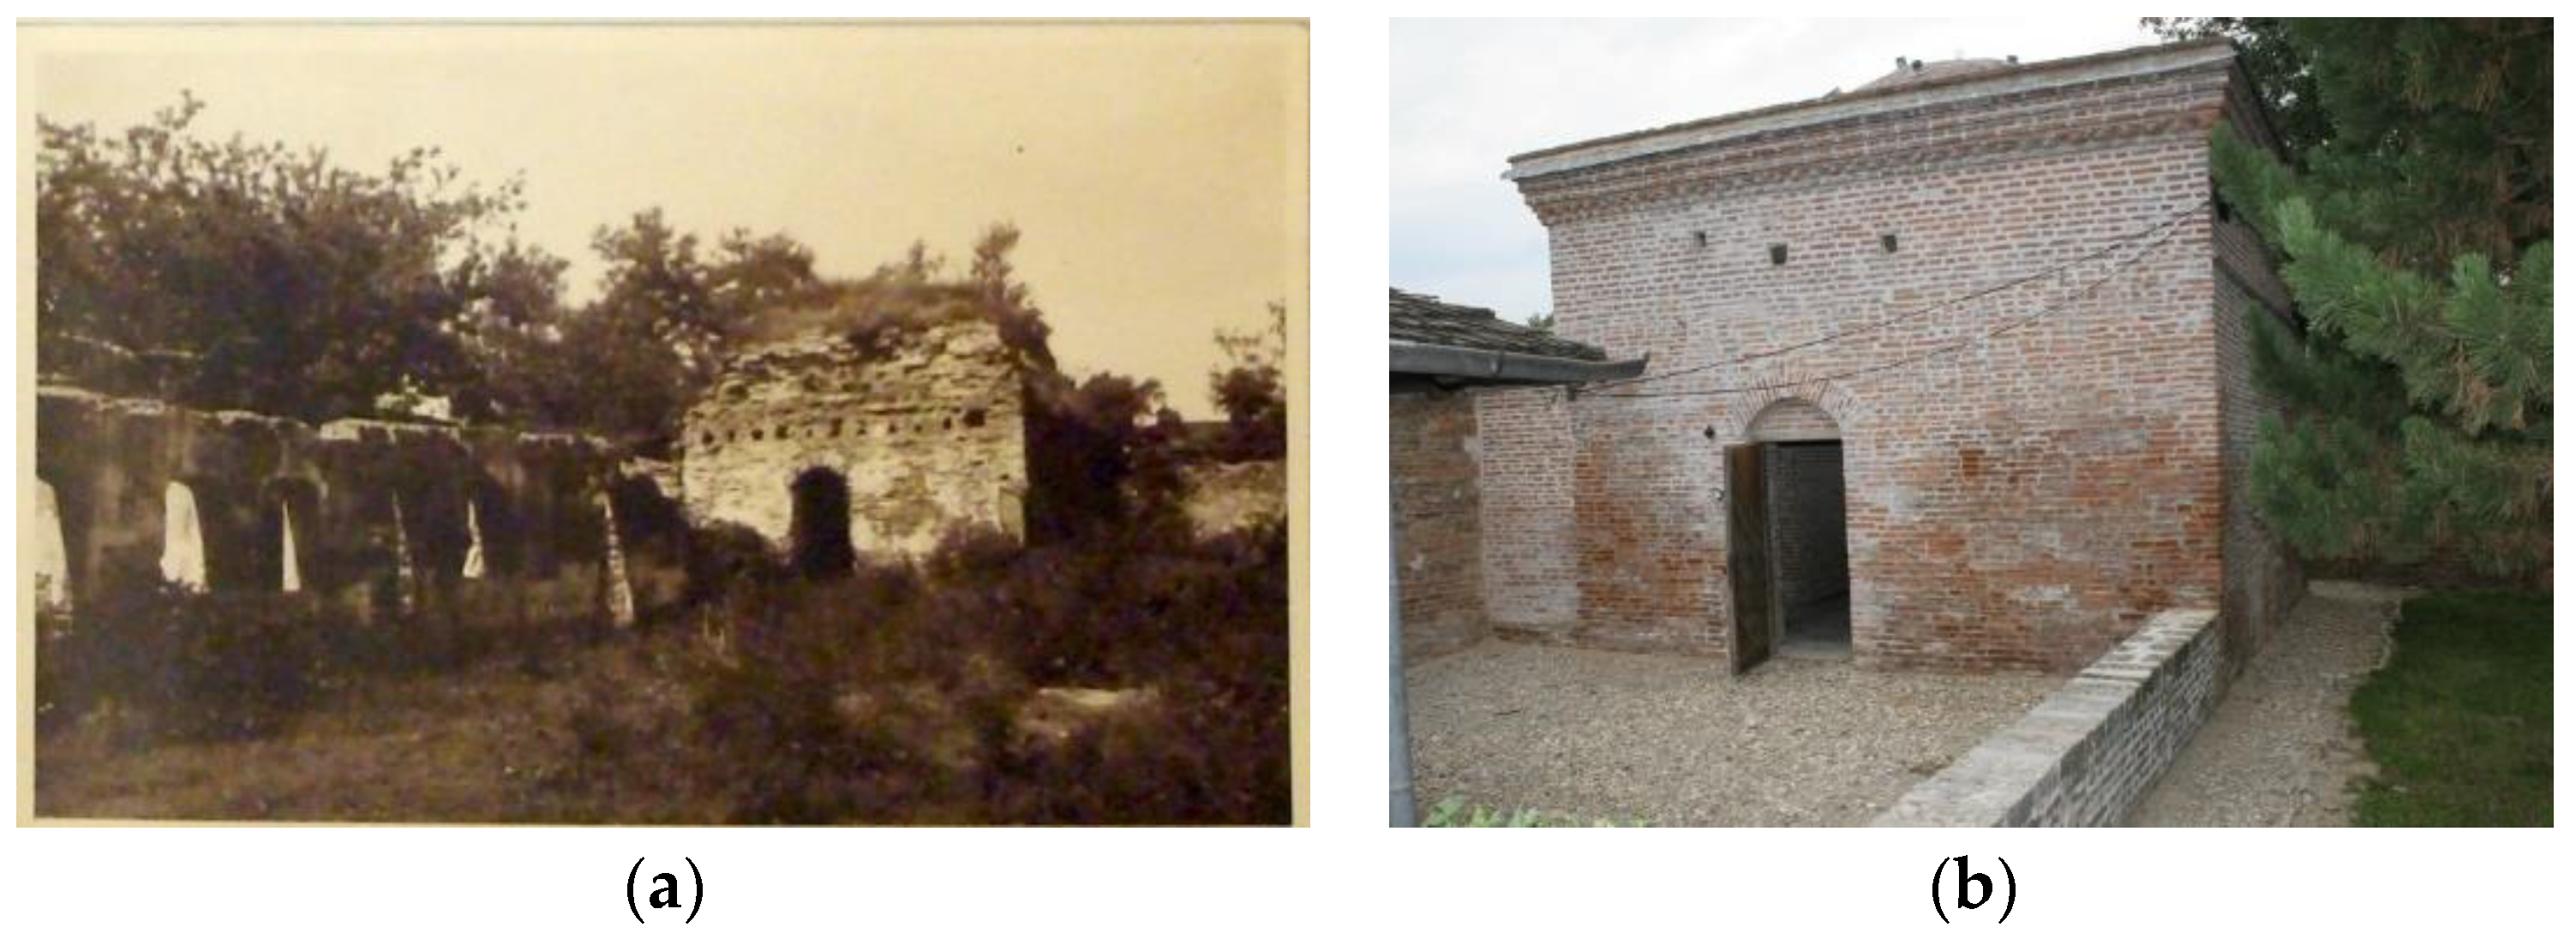
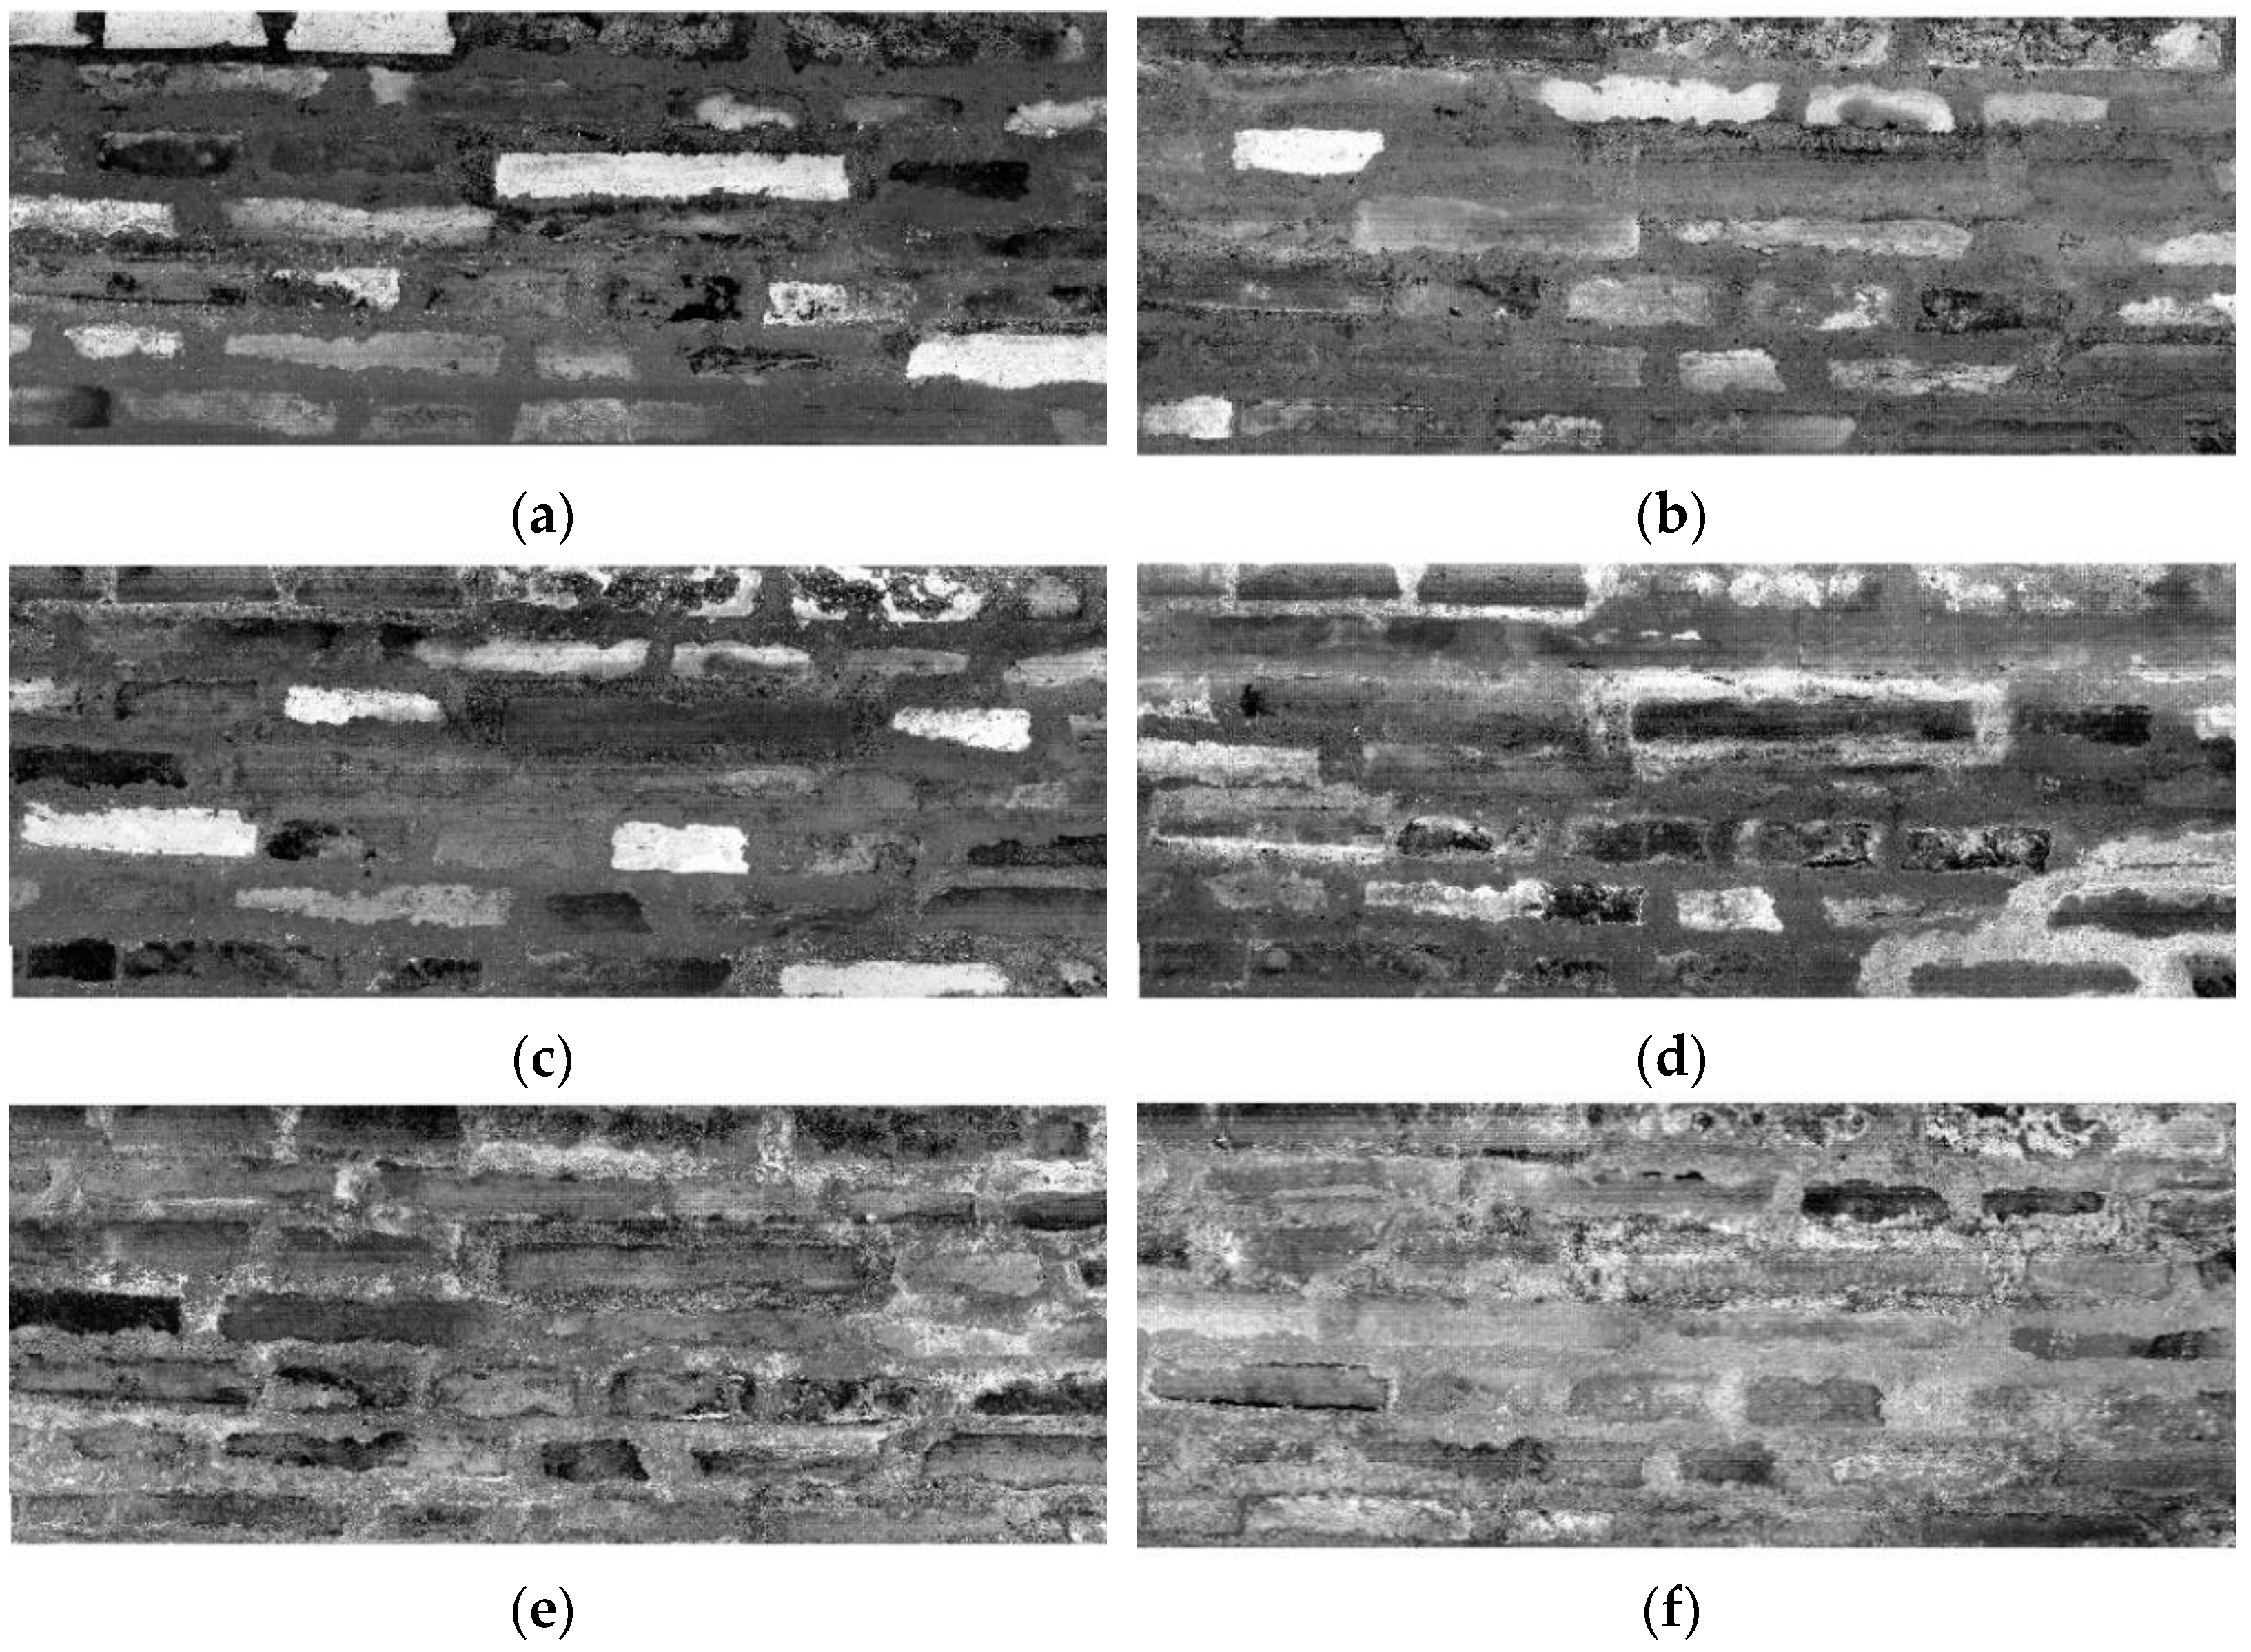
In the interwar period, the Golescu manor was almost in ruins; the outbuildings had collapsed, and the vaults of the Turkish bath were about to fall down, as can be seen in Figure 1a. During the 1942–1943 restoration, only one room was preserved from the Turkish bath: the warm space with a single dome and the adjacent furnace.
The casuistic under discussion is focused on the discrimination of the original materials, bricks, and mortars, considering that, during the restoration, new bricks were also incorporated in addition to the original remains. Another question was if the mortars used in the restoration also contain shards from the original bricks. In such a complicated situation where we need to discriminate between very similar objects, statistical and classification methods are the only solution [5,6]. Thus, hyperspectral analysis (HSI) and laser-induced breakdown spectroscopy (LIBS) were selected for their great classification and chemometric capabilities [7], and a charting of the original bricks and mortars was obtained [8].
2. Materials and Methods
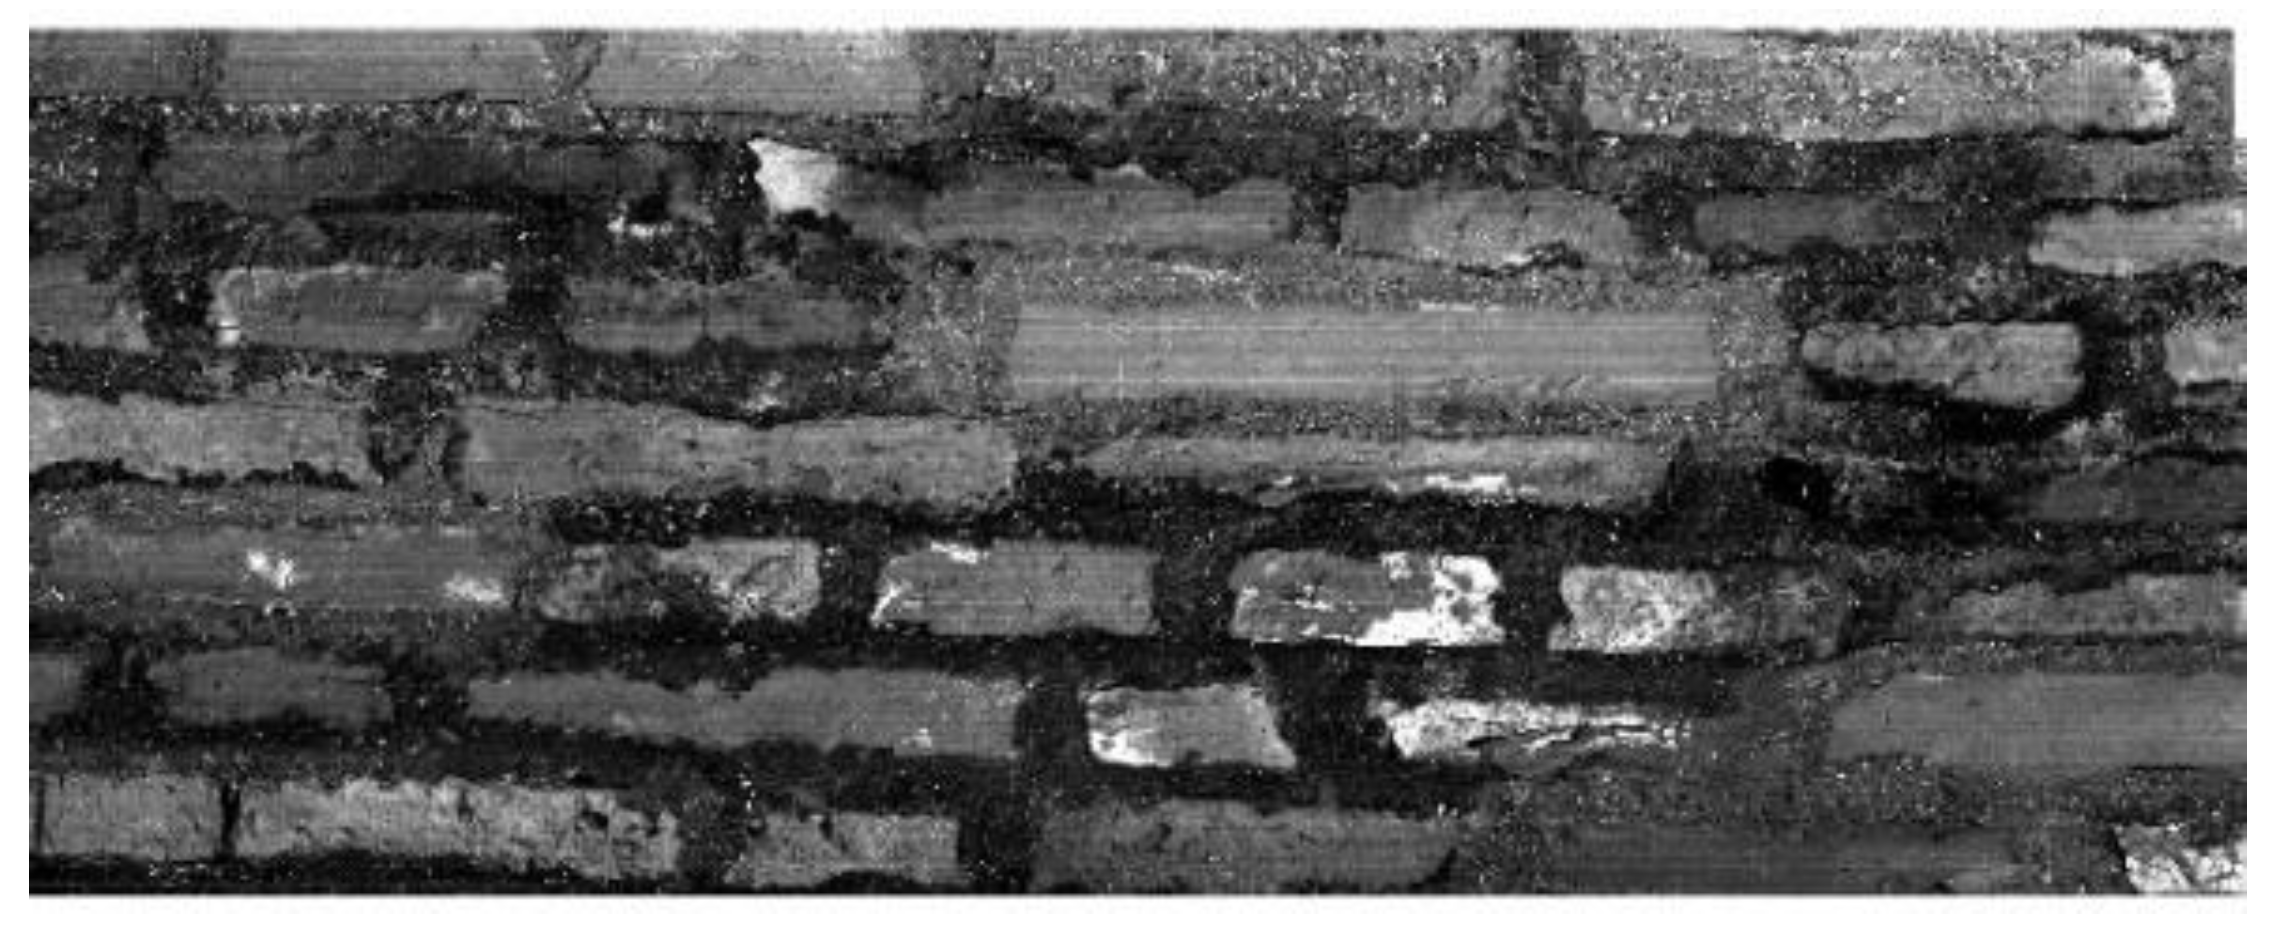
In the form in which it was restored, as can be seen in Figure 1b, the Turkish bath has the following characteristics: a rectangular shape with sides of 8 m/6.3 m and a 6.4 m height, thick walls of about 0.8 m built of bricks bonded with thick layers of mortar. The bath room itself is square in shape with a side of about 5.5 m. The ceiling, also made of bricks, is built in a semicylindrical vault pierced by openings for excess steam. The lime and sand plaster were mixed with crushed brick, giving the interior a reddish color. On the outside, it has a profiled cornice made of several successive layers of brick. The ornamentation features a saw tooth or wolf’s tooth motif [9]. In this paper, discussions will envisage an area from the most representative part of the historical building in terms of age value that is alleged to contain original bricks and mortars, as well as materials from later restoration interventions. In the middle of the investigated area, there is a brick that stands out due to its aspect and its length, which is known to be part of a restoration.
As the properties of medieval and modern bricks vary in terms of raw materials, production methodology, as well as mortars used, his combined with LIBS were used in order to analyze them, evaluate their preservation state, map the original elements, and document and classify the interventions previously made [10,11]. The main chemical constituents of clay are silicon (Si) and aluminum (Al), but also a number of minor and trace elements that will be used in multivariate data analysis in order to discriminate and map the original materials.
Hyperspectral imaging or imaging spectroscopy is a noninvasive, noncontact technique which combines digital imaging and spectroscopy [12]. HSI offers both imaging and spectral data, measuring the spatial information and the spectral parameters for each pixel simultaneously. The hyperspectral image is expressed as a hypercube I(x, y, λ), containing wavelength λ and spatial (x, y) dimensions. The results of the hyperspectral analysis can be used either as spectral data I(λ) for each individual pixel (x, y) or as an image I(x, y) for each wavelength λ [13]. Each pixel is attributed a unique spectral fingerprint, which can be used to characterize its chemical composition. As such, hyperspectral imaging can be used for the identification and quantification of chemical compositions and, at the same time, for mapping their distribution [14].
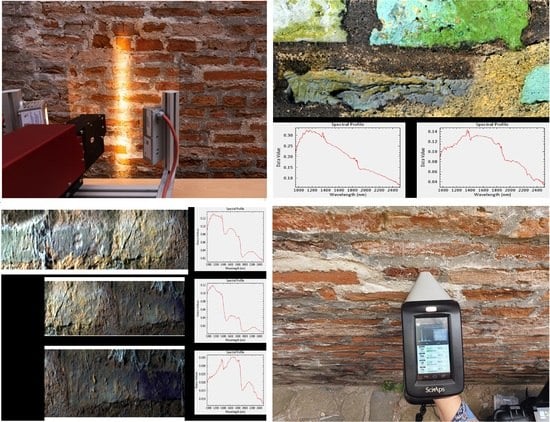
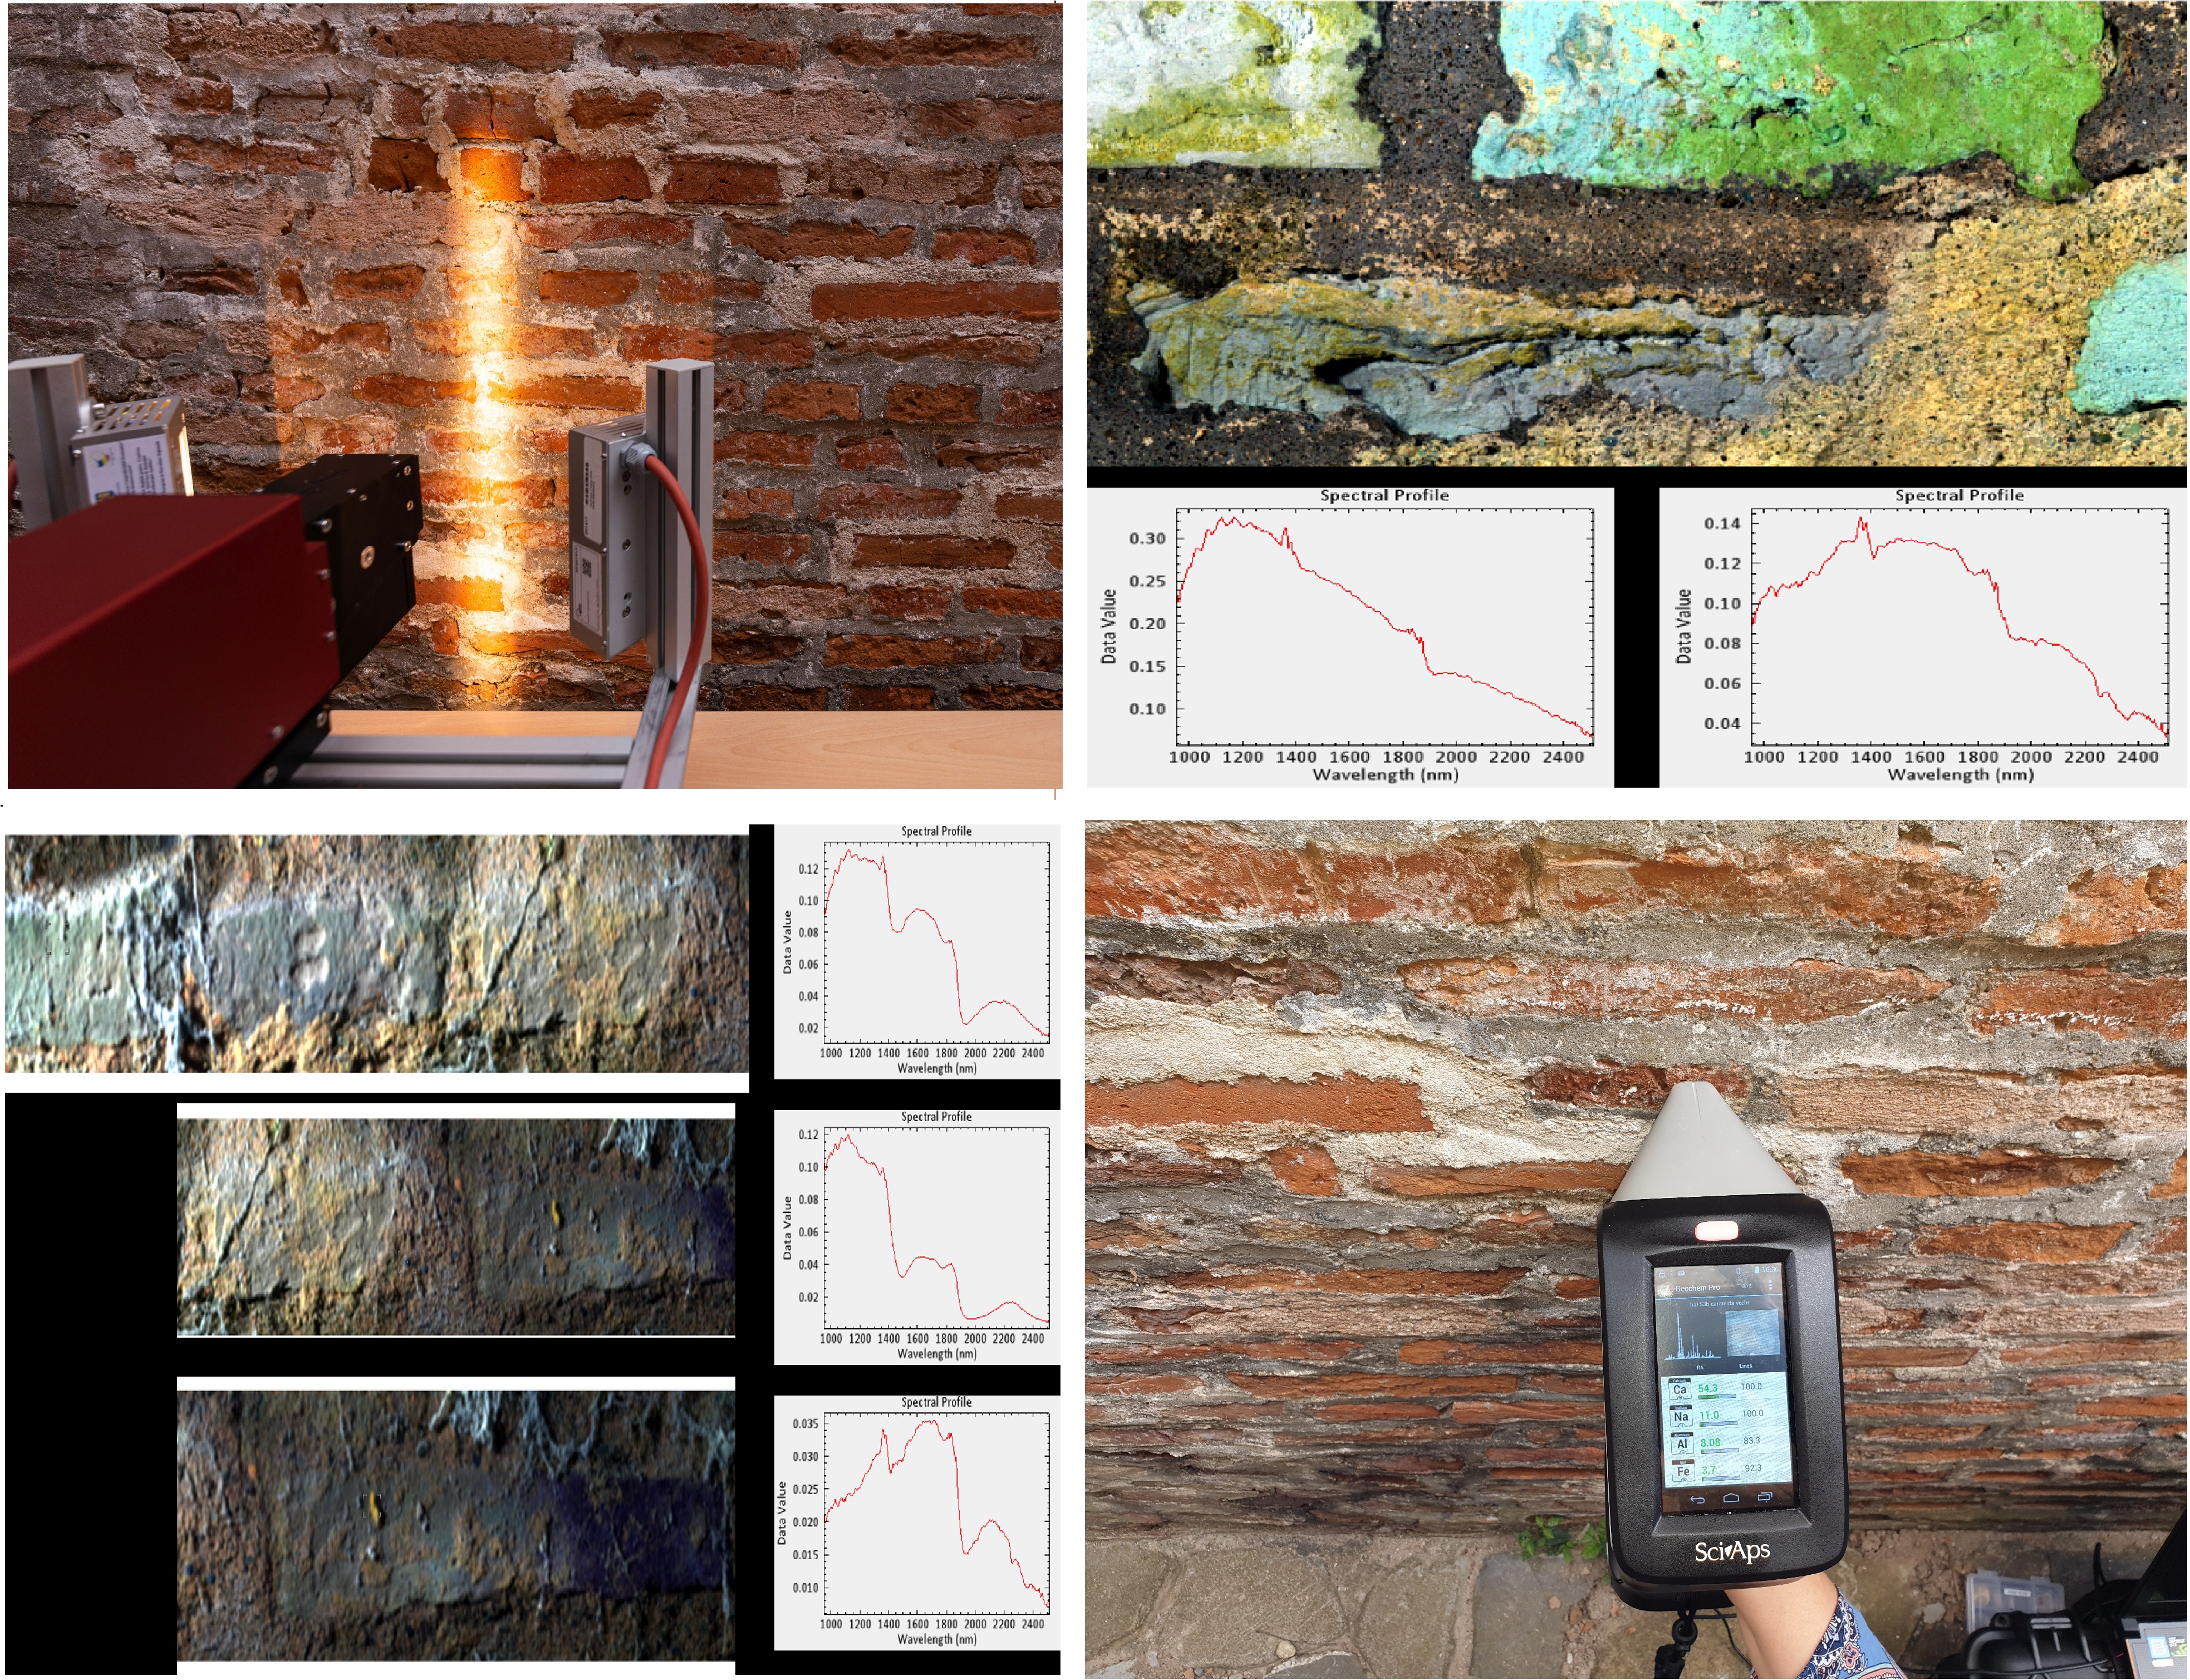
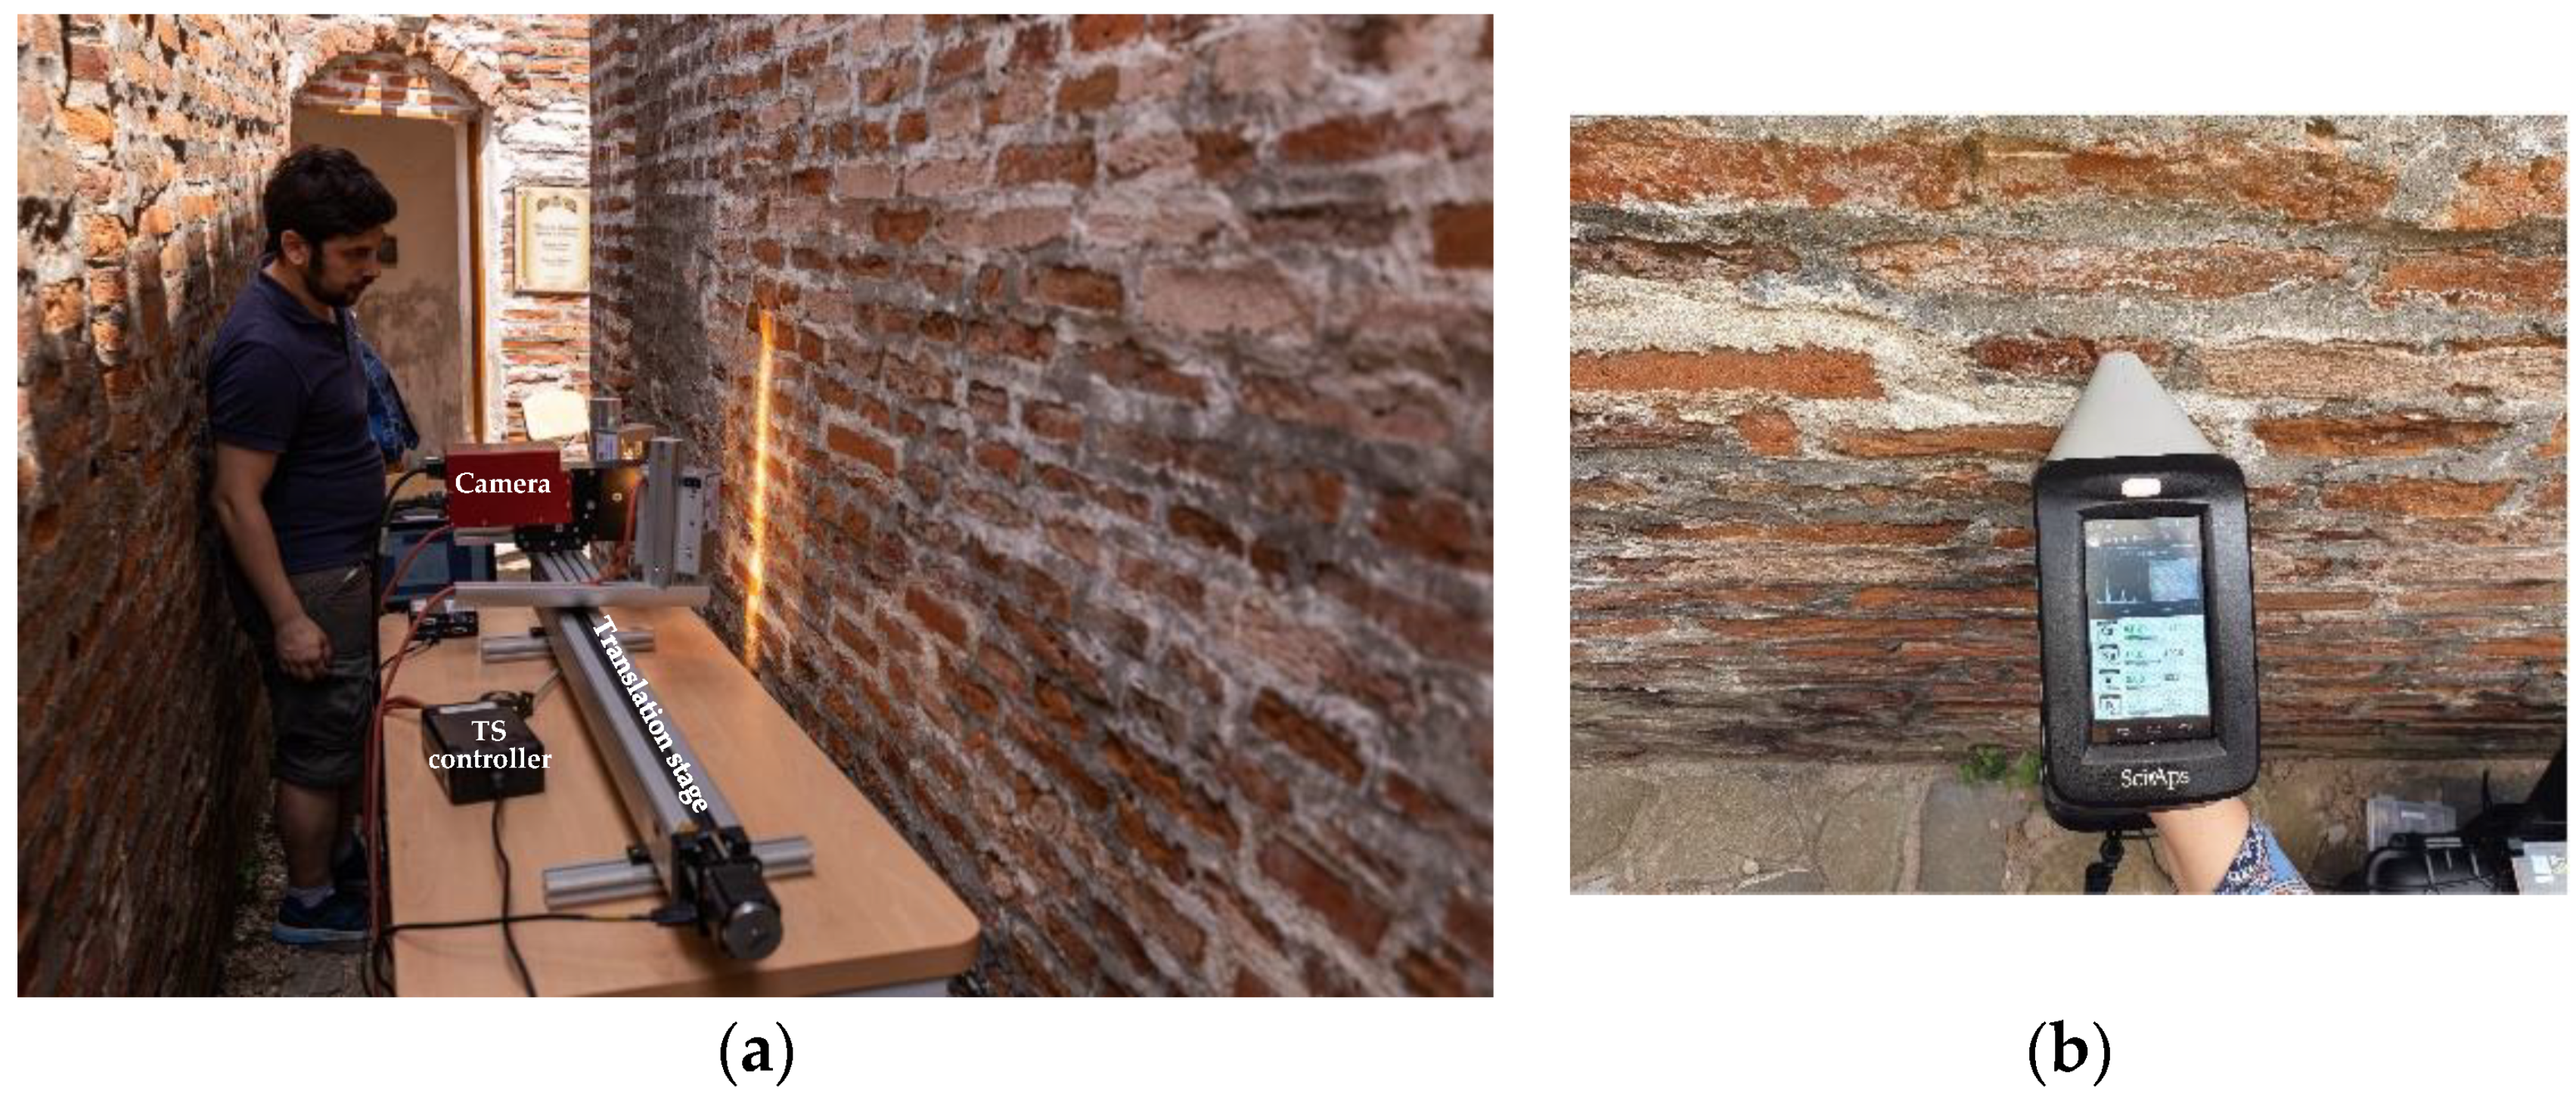
For each pixel in an image, a hyperspectral camera acquires the light intensity (radiance) for a large number of contiguous spectral bands; every pixel in the image thus includes a continuous spectrum (in radiance) and can be used in order to characterize the objects in the scene with great precision and detail. For the HSI analyses, a HySpex SWIR-384 hyperspectral camera from NEO equipped with a state-of-the-art Mercury–Cadmium–Telluride (MCT) detector was used, calibrated for the following lenses: 0.3 m, 3 m, 9 m, and for a field of view (FOV) of 16 degrees. The system covers parts of the NIR and SWIR spectra from 954 nm to 2550 nm and has 288 spectral channels. Taking into consideration the available working conditions on-site (very narrow access, see Figure 2a but also the need for the best available resolution, a 30 cm distance close-range lens was installed. It was highly important to record from close range in order to obtain greater details but also to avoid spectral mixing of the pixel signals (when pixels become larger in size with the increase in distance, the spectral profile can combine the specific signals of different types of materials).
Data was recorded using the push-broom technique (a long-track scanner meaning successive lines of 384 pixels, which represent the width of a recording) by scanning the vertical surface using a motorized translation stage.
During the investigation, diffuse illumination was provided by two custom-made lamps, which focused the illumination to a line overlapping with the camera FOV. The lens ensured a FOV (field of view) of 16 degrees, meaning an 84 mm width for each acquisition. For the recording of the interest area, 7 acquisitions were necessary. Processing was conducted using ENVI® L3Harris Geospatial. All data were converted from DN (digital number) to radiance units and were later radiometrically calibrated using QUAC (quick atmospheric correction).
LIBS is a microinvasive technique, and each triggered pulse generates a spectrum, advancing deeply in the layers, pulse by pulse, until it reaches the original material unaffected by adherent deposits, corrosion, chemical changes, etc. [15]. The main feature of the technique is the fact that each laser pulse delivers information about the chemical elements present in the ablated material, providing a sort of cross-sectional analysis until it reaches the core of the material [16,17]. Thus, the major advantage that the LIBS technique has over other methods of analysis currently used in the field of investigations (e.g., XRF, FTIR, XRD) is determined by the possibility to perform in situ stratigraphic analyses without sampling the object (without processing or even cleaning of surfaces) [18,19,20,21]. LIBS analyses were made using a handheld spectrometer from SciAps that works in an argon purge environment, see Figure 2b. The equipment has a Q-switched Nd:YAG emitting at 1064 nm with 5 mJ of energy and a 50 µm laser spot. Its spectrometers cover a spectral range from 190 nm to 950 nm. Due to the fact that the bricks are a heterogenous materials, the LIBS acquisitions were made using matrix features of the equipment for 3 × 3 to 6 × 6 spots and 20 to 100 series, depending on the area investigated (mortar, brick, adherent deposits).
In order to discriminate the original materials as well as historical and current interventions in the brickwork, the LIBS data were subjected to principal component analysis (PCA) conducted using Origin Lab. Afterwards, the hyperspectral and LIBS PCA results were correlated and, further on, processed in ENVI using spectral angle mapper (SAM) and linear spectral unmixing (LSU) algorithms in order to classify and trace the different areas of interest [22]. Both algorithms were applied complementary in order to validate the accuracy of the classifications and mapping [23,24]. SAM is a supervised spectral classification algorithm that uses the difference between angles in an n-dimensional space to classify pixels in an image [25]. It determines the similarity degree from spectral profiles by calculating the angle between the spectra while interpreting them as vectors in an n-dimensional space, where n equals the number of bands. Smaller angles indicate a higher degree of similarity to the reference spectrum, while larger angles designate a lower degree of similarity. Pixels with the smallest angle values are associated (grouped) to the same class of materials. Due to the fact that the SAM algorithm is part of the supervised classification, the manual selection of the endmembers represents a key feature for class assignment [26]. ENVI enables two types of threshold value selections: (1) a single value for all classes and (2) a customized value for every type of class. The value of 0.100 radians is the default value of the menu, and it means that a group of pixels is assigned to a class if the difference between them is not greater than 0.100 radians (in SAM, pixels are considered as vectors in an n-dimensional space). The spectral profile selected for each class is different enough in order to enable the classification (spectral variability) since several values were used, and no major variations in the results were observed.
LSU is a method able to generate abundance maps of pixels with specific spectral profiles based on the pixel purity characteristics [27]. This is made by identifying the endmembers in the scene and the fractional abundances that correspond to each pixel category. Moreover, LSU calculations allow for the classification of areas with mixed pixels based on their statistical values.
3. Results and Discussions
3.1. HSI Analysis
The different behavior of materials at various wavelengths can be observed as significant changes in the absorbance and reflectance of the NIR and SWIR radiation on the surface through the 954–2550 nm spectral domain [28].
Raw hyperspectral data were expressed in digital numbers (DN) and were made available via HySpex GROUND. Using HySpex RAD, the raw data were converted into radiance units. HySpex RAD is a standalone postprocessing software facilitating radiometric calibration of HySpex images. HySpex RAD enables both raw (_raw) and real-time-calibrated (_corr) images to be converted to at-sensor absolute radiance values (W/sr·nm·m2). The output files were stored in BSQ format and were converted to 32 bits, which do not need a scaling factor to convert the images to radiance. A second radiometric calibration of the radiance data was made using the QUACK module (quick atmospheric correction) of ENVI in order to minimize the influence of the air and light [29]. This atmospheric correction is based on the empirical finding that the average reflectance of diverse material spectra (excluding highly structured materials, such as vegetation, shallow water, and mud) is not dependent on each scene. The output after correction is expressed as apparent reflectance integer data, where pixel values range from 0 to 10,000 (representing 0 to 100% reflectance).
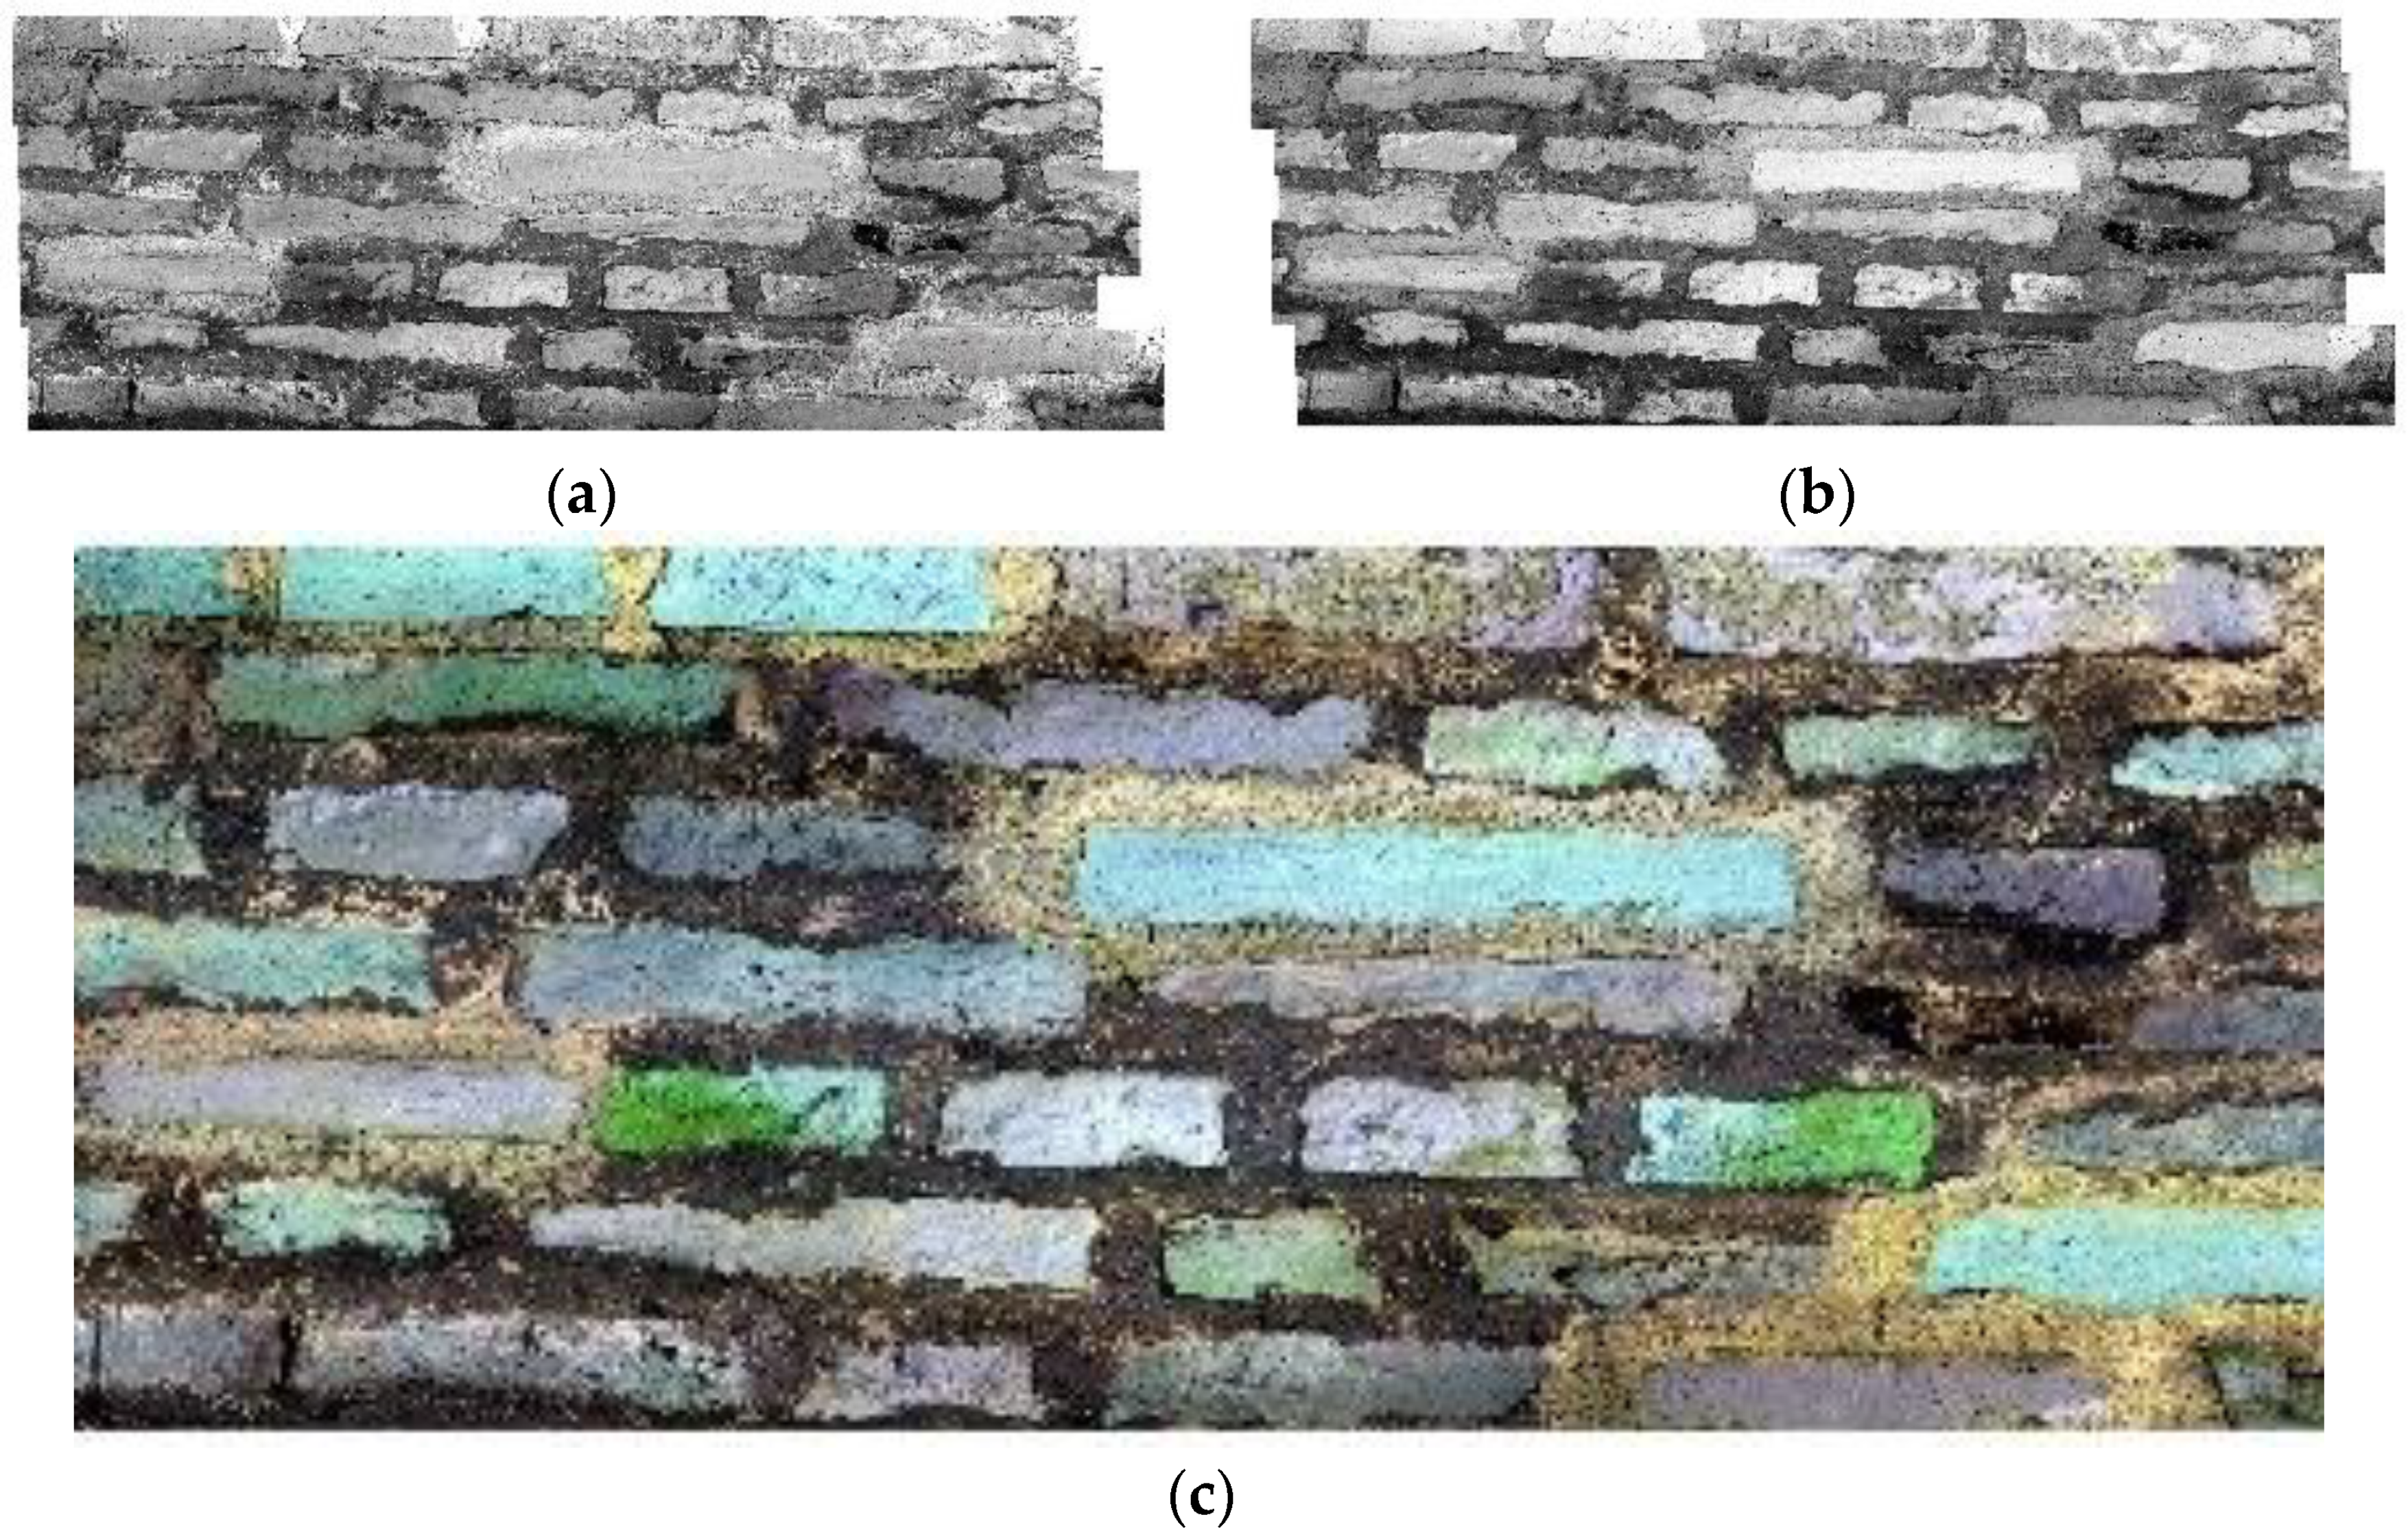
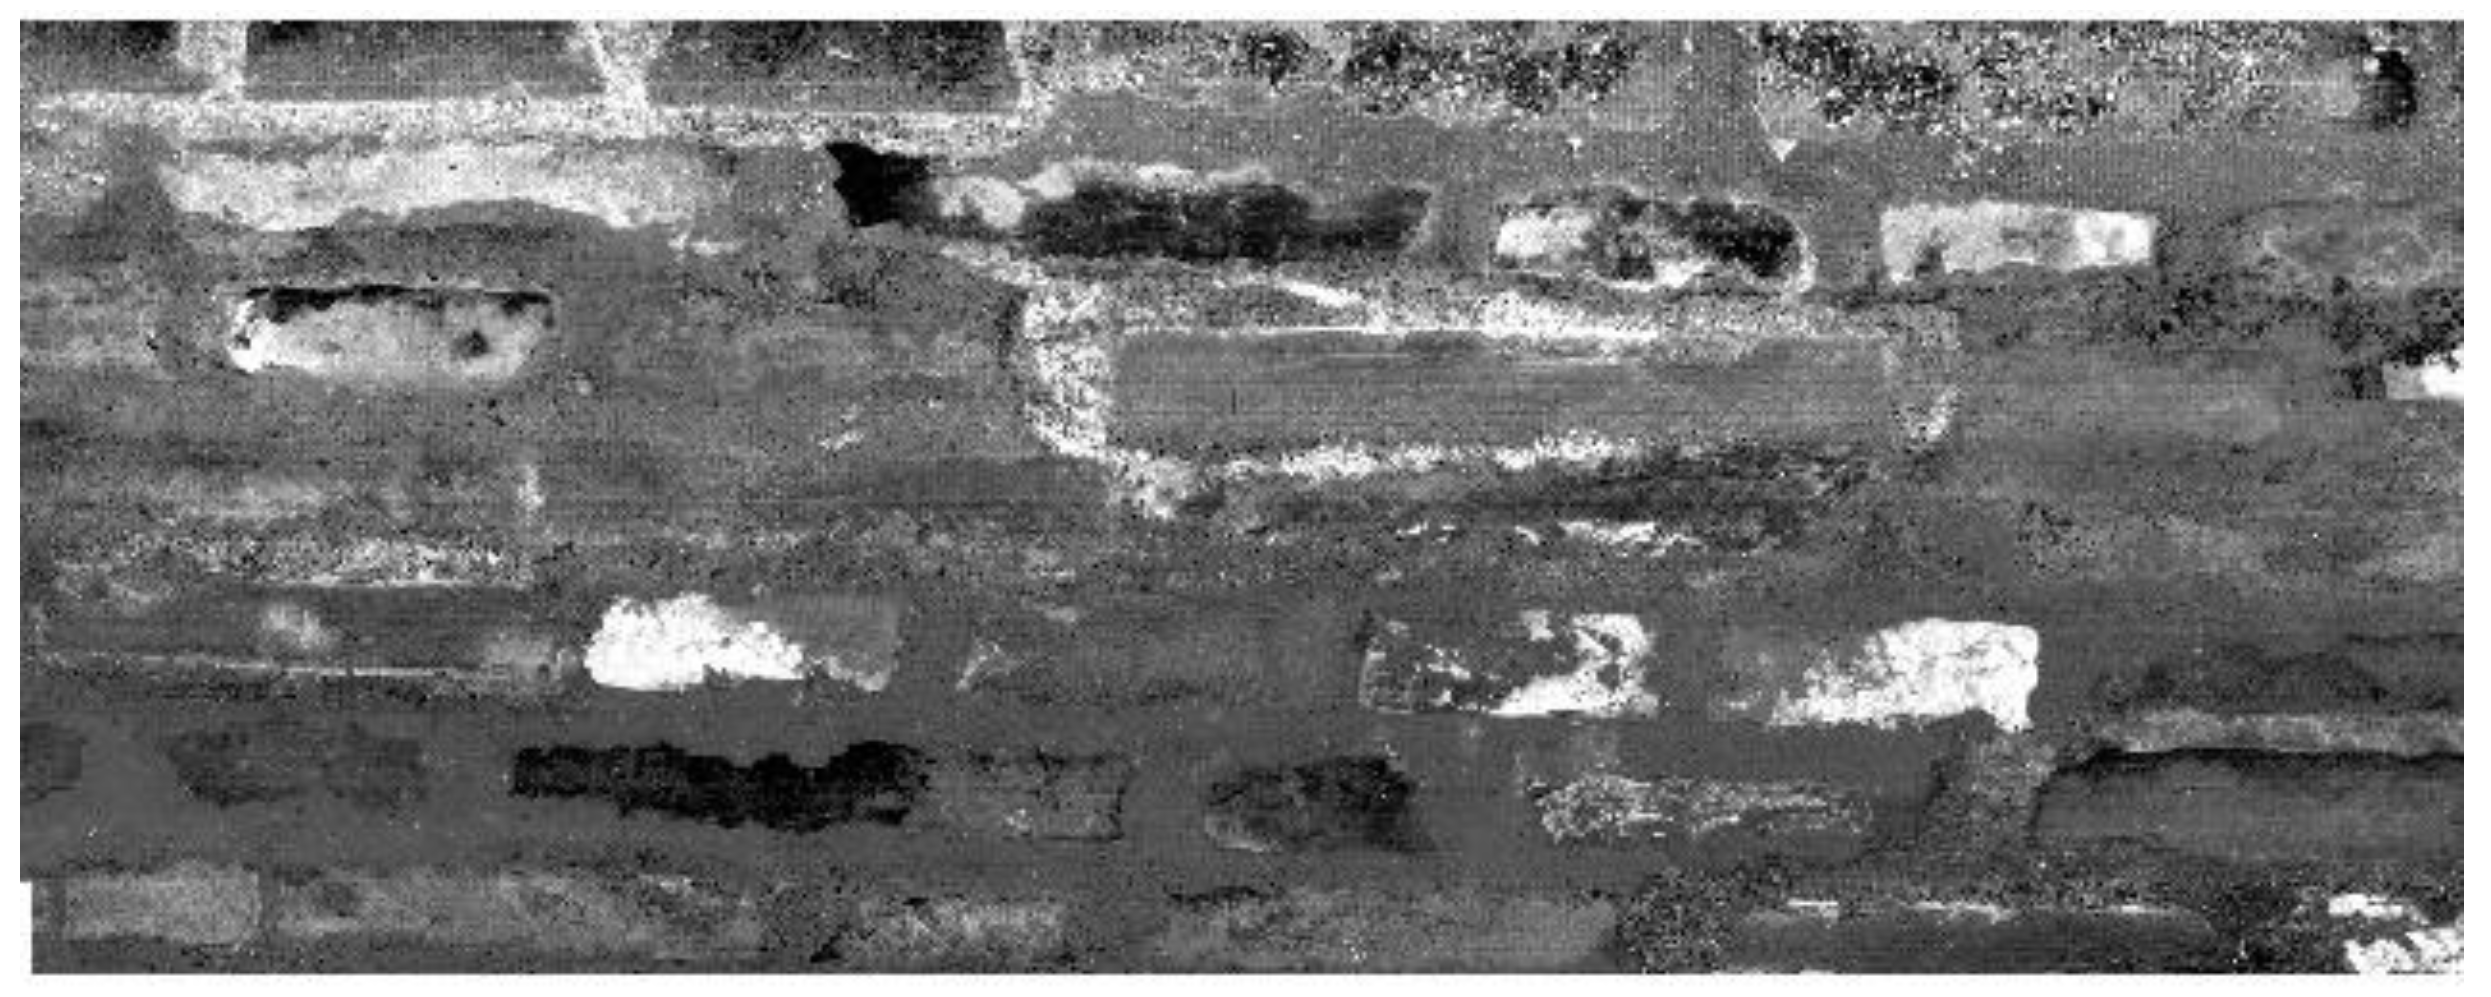
Figure 3a,b presents relevant images acquired for 954 and 2200 nm wavelengths, and absorption, reflectance, and transmittance differences can be observed. As the wavelength increases, some insight on the bricks prevails. Using the false colour infrared (FCIR) function, RGB channels were assigned to different combinations of wavelengths ranging from 954 to 2250 nm in order to track the similarities and differences in the material behaviour. Figure 3c presents the FCIR for the RGB channels attributed to 954, 1200, and 2000 nm in which one can observe three colours for bricks and mortars that are used further on for endmember selection.
3.2. LIBS
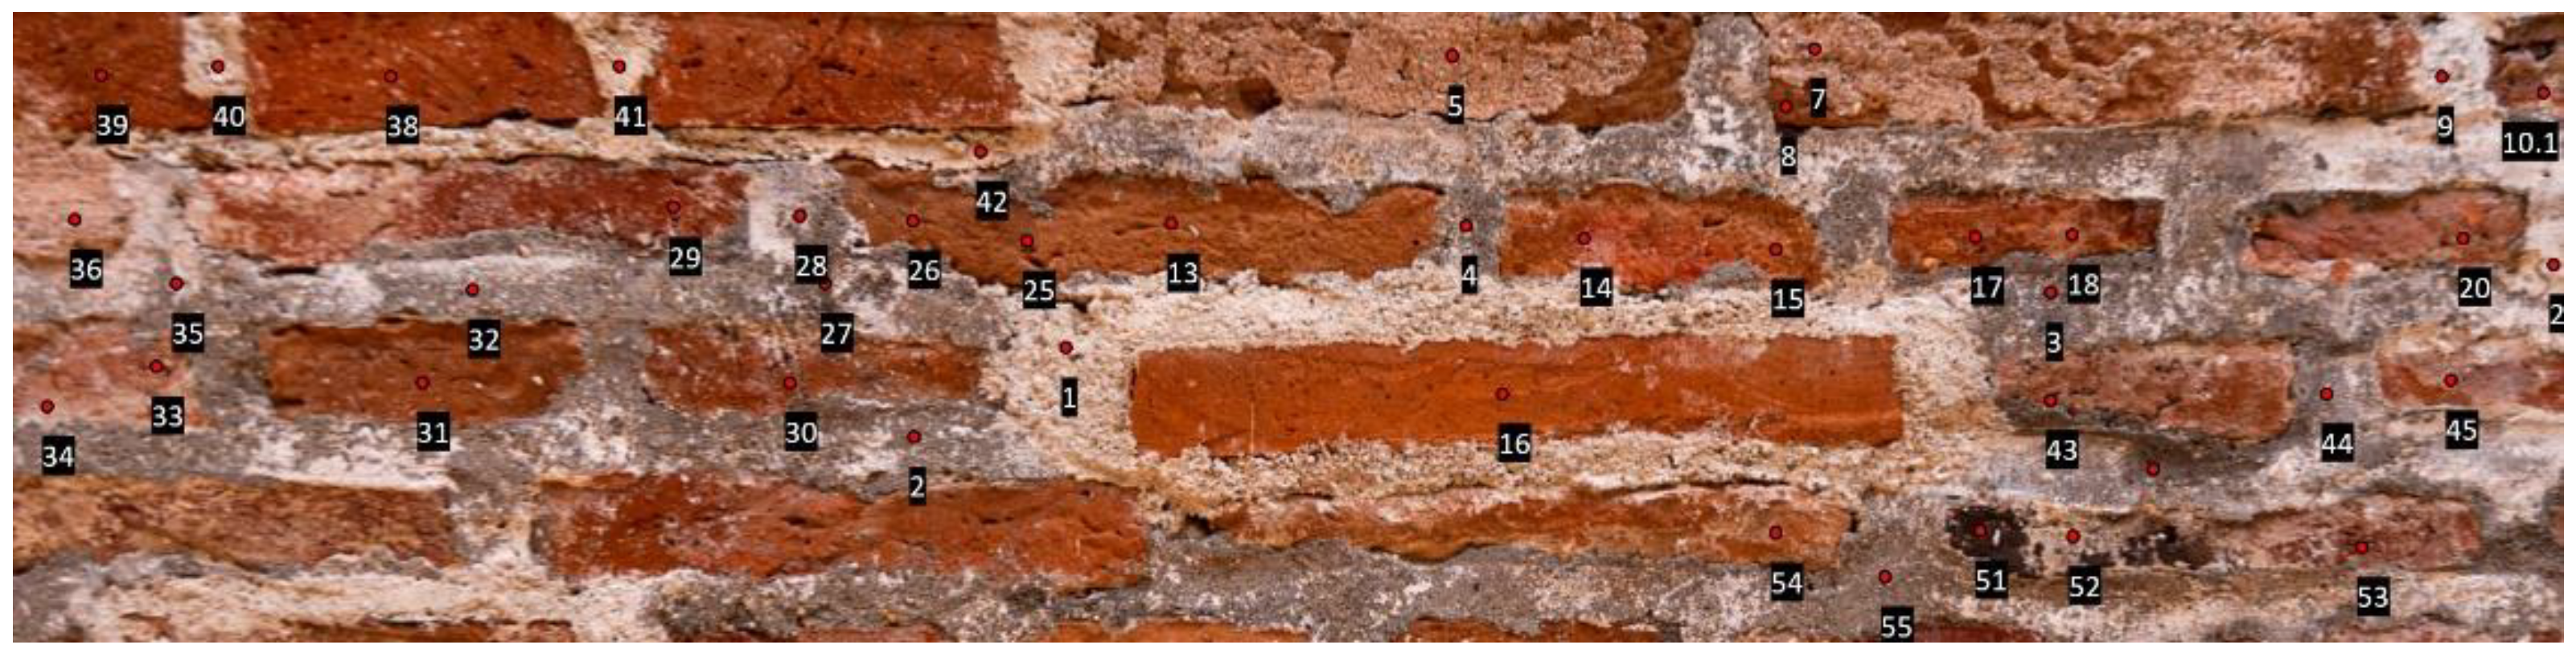
The areas for LIBS stratigraphy were selected based on the hyperspectral imaging results, and they are presented in Figure 4.
The main chemical elements identified using LIBS, presented in Table 1, can be traced to oxides commonly found in clay bricks as follows: silica (SiO2), alumina (Al2O3), iron (Fe2O3) or ferrous oxide (Fe3O4), potassium oxide (K2O), titanium dioxide (TiO2), sodium oxide (Na2O), calcium oxide (CaO), and magnesium oxide (MgO), as well as other elements such as barium (Ba), strontium (Sr), rubidium (Rb), and manganese (Mn) [1].
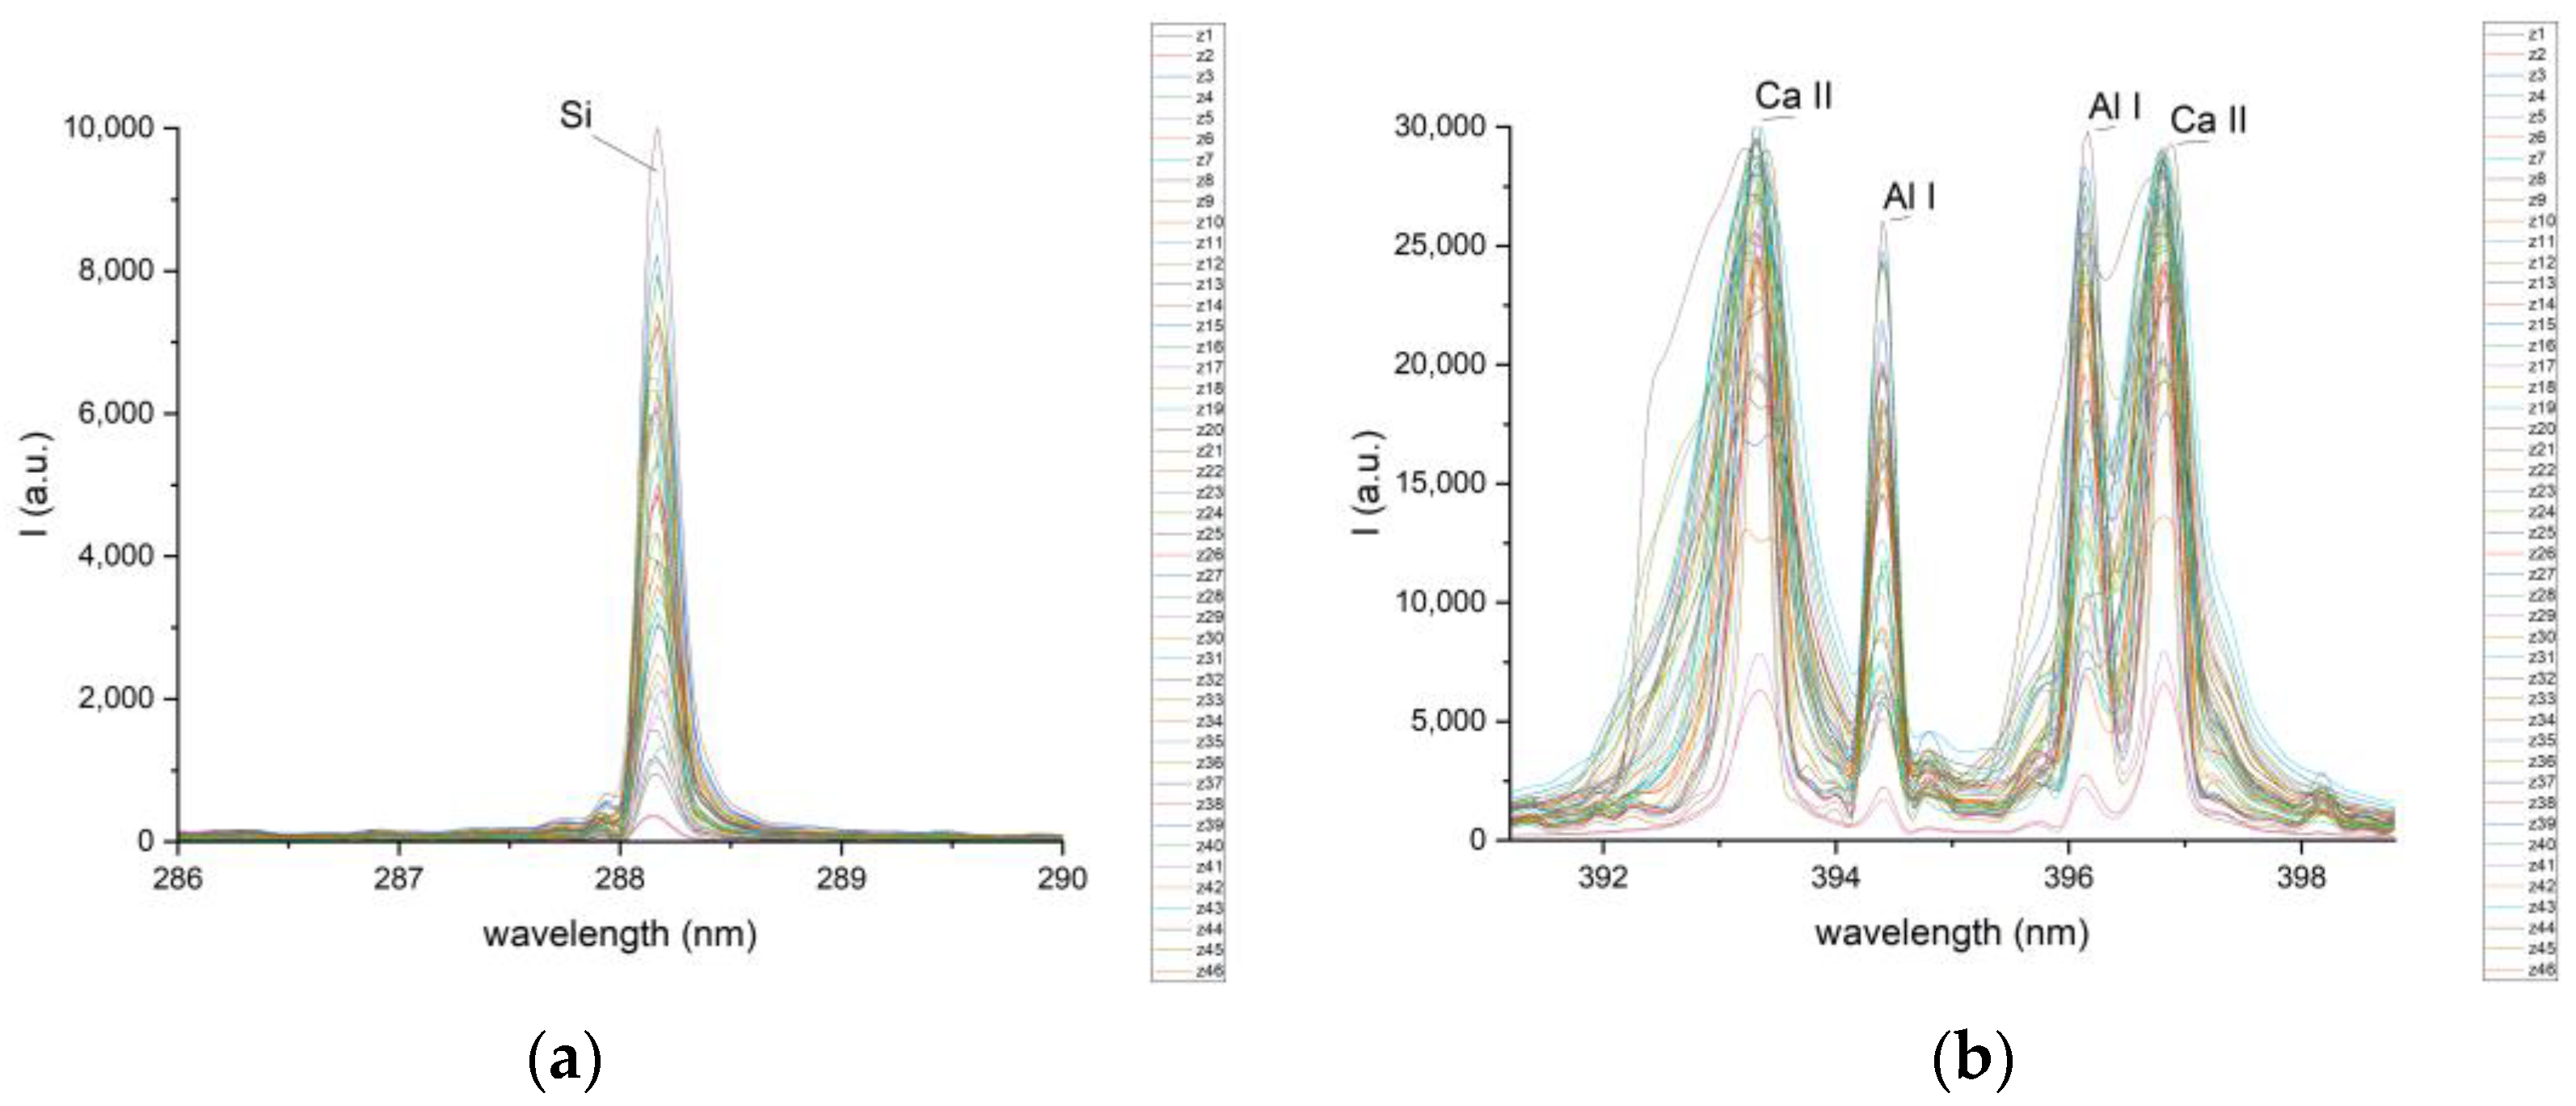
The spots where LIBS spectra were acquired were carefully selected using the magnifying camera of the system to focus on similar structure areas for the bricks and the mortars, respectively. Figure 5 presents the averaged signals obtained for the Si, Al, and Ca lines for the whole batch.
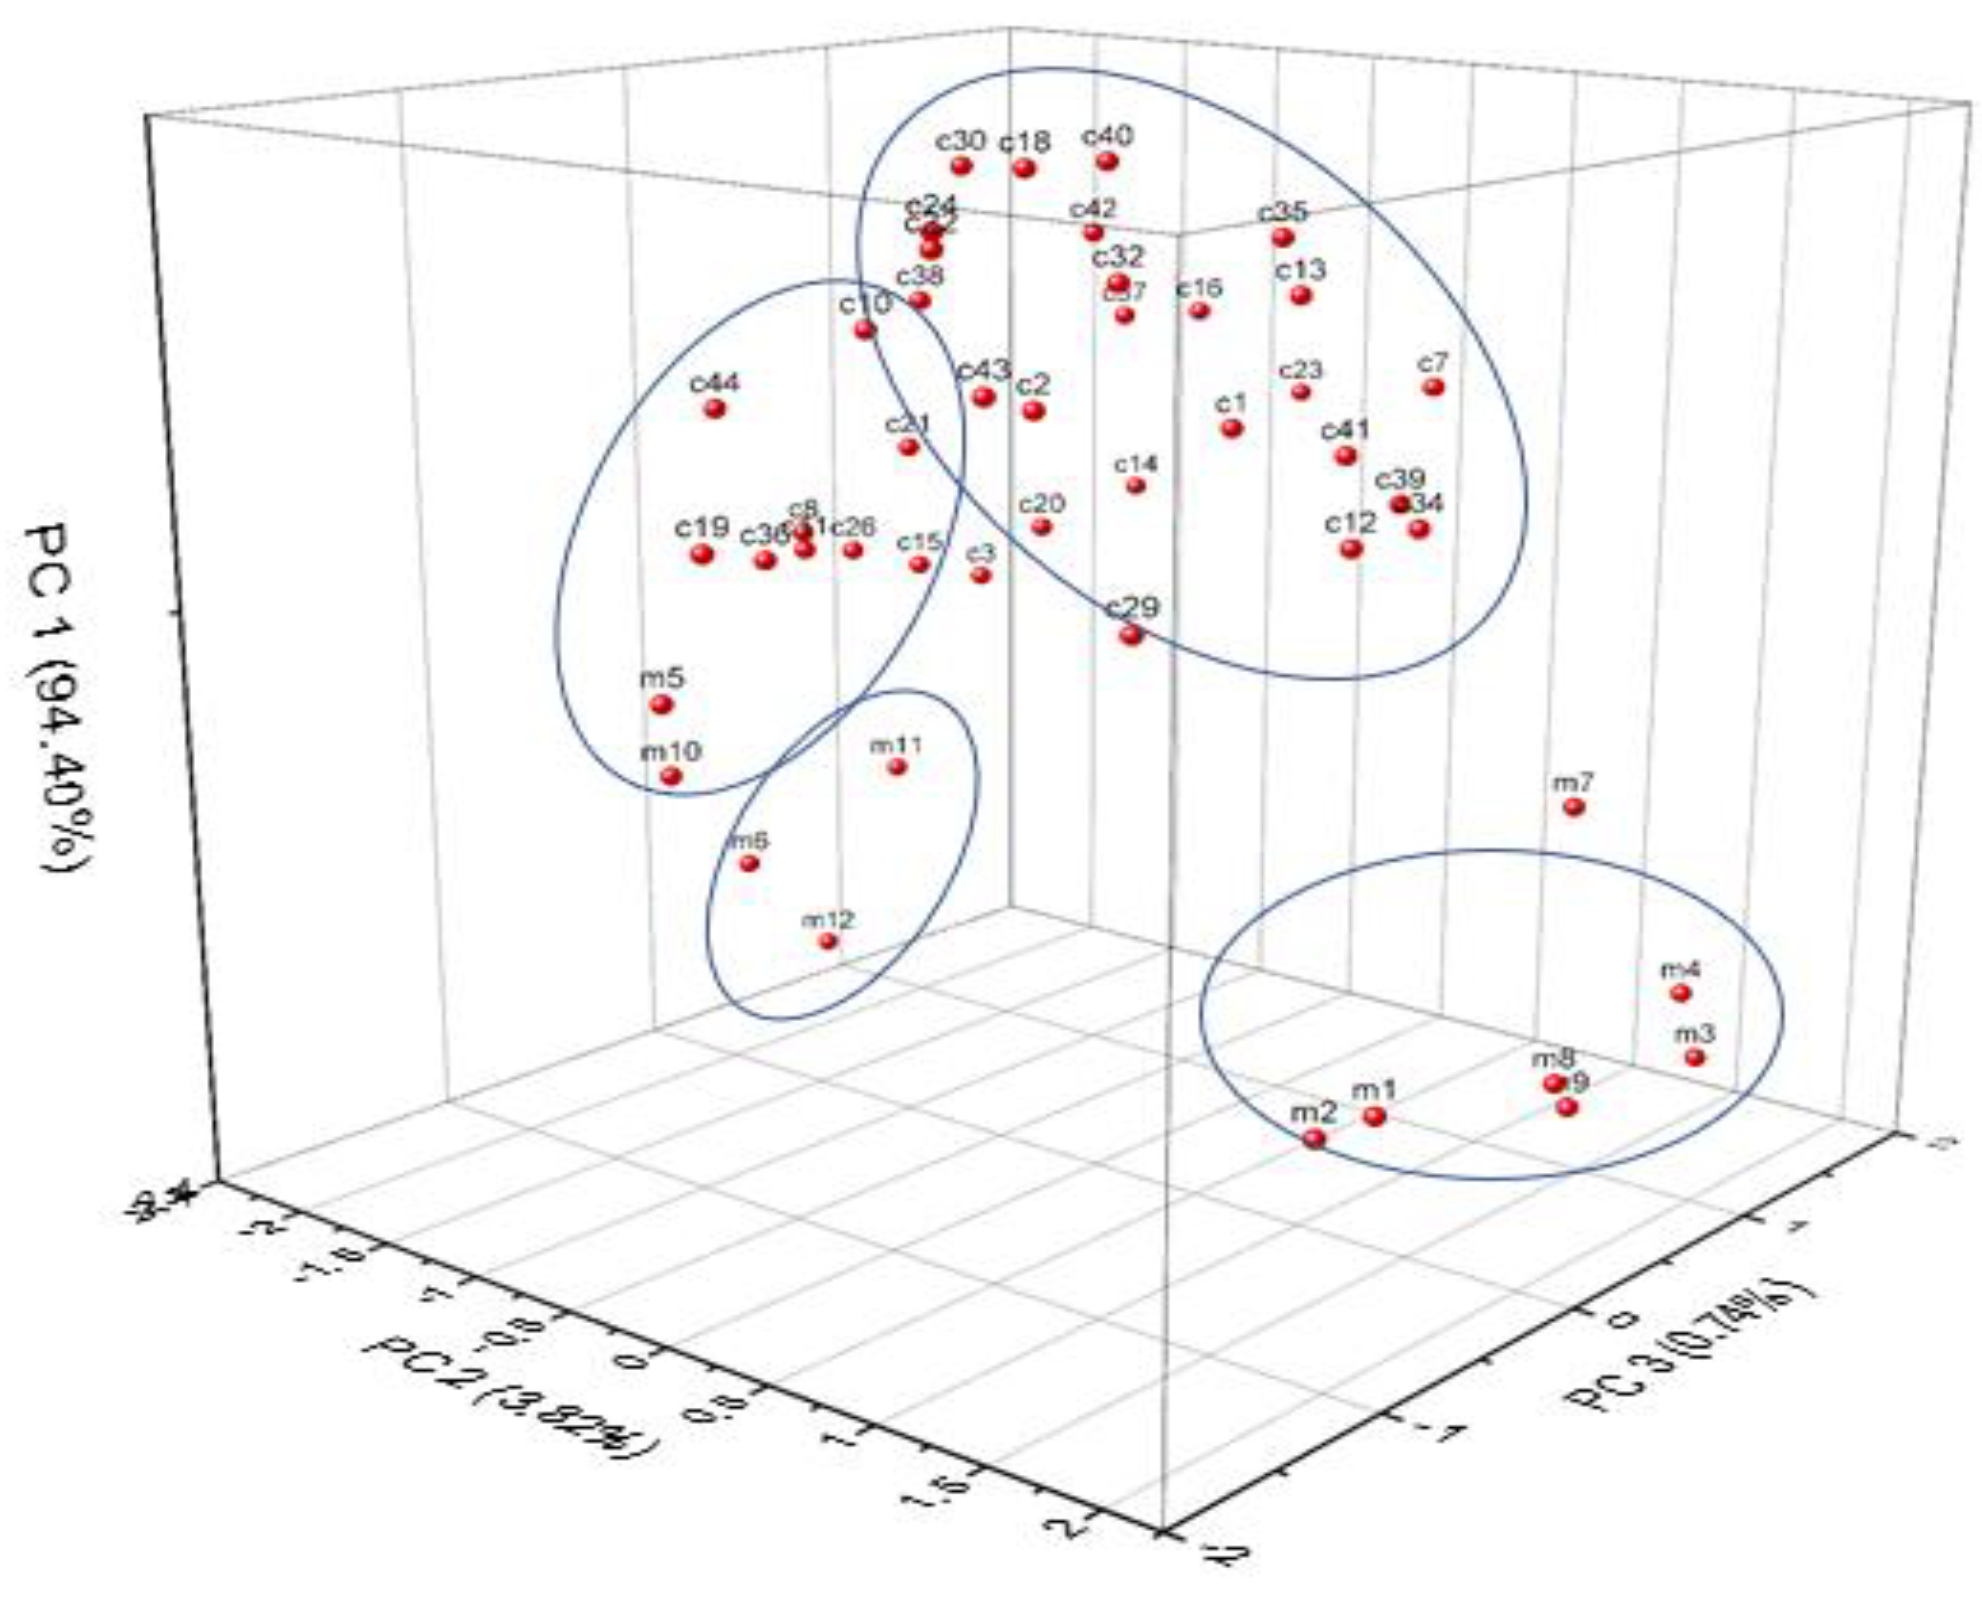
PCA was applied to the LIBS data to help classify and discriminate them. Taking into consideration previous studies related to the statistical analysis of bricks, all chemical elements were used in the analysis as they all may influence the discrimination and need to be considered [30,31]. As can be observed in Figure 6, the PCA helped distinguish mainly two types of bricks and mortars.
3.3. Classification
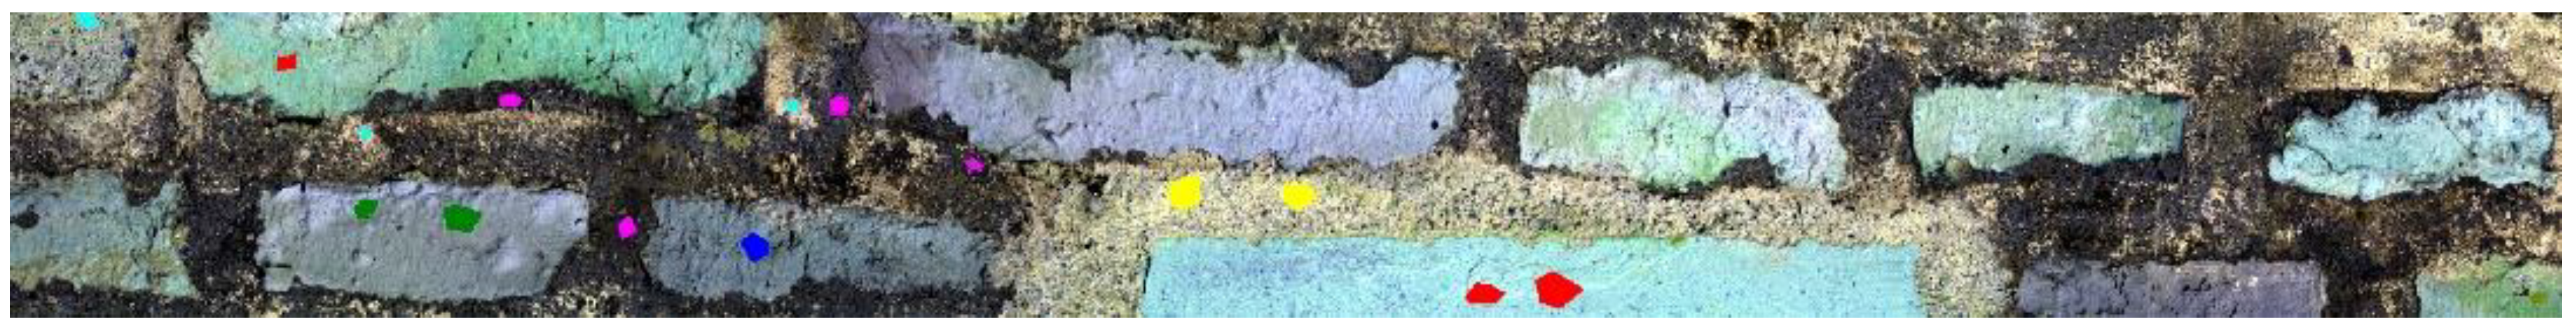
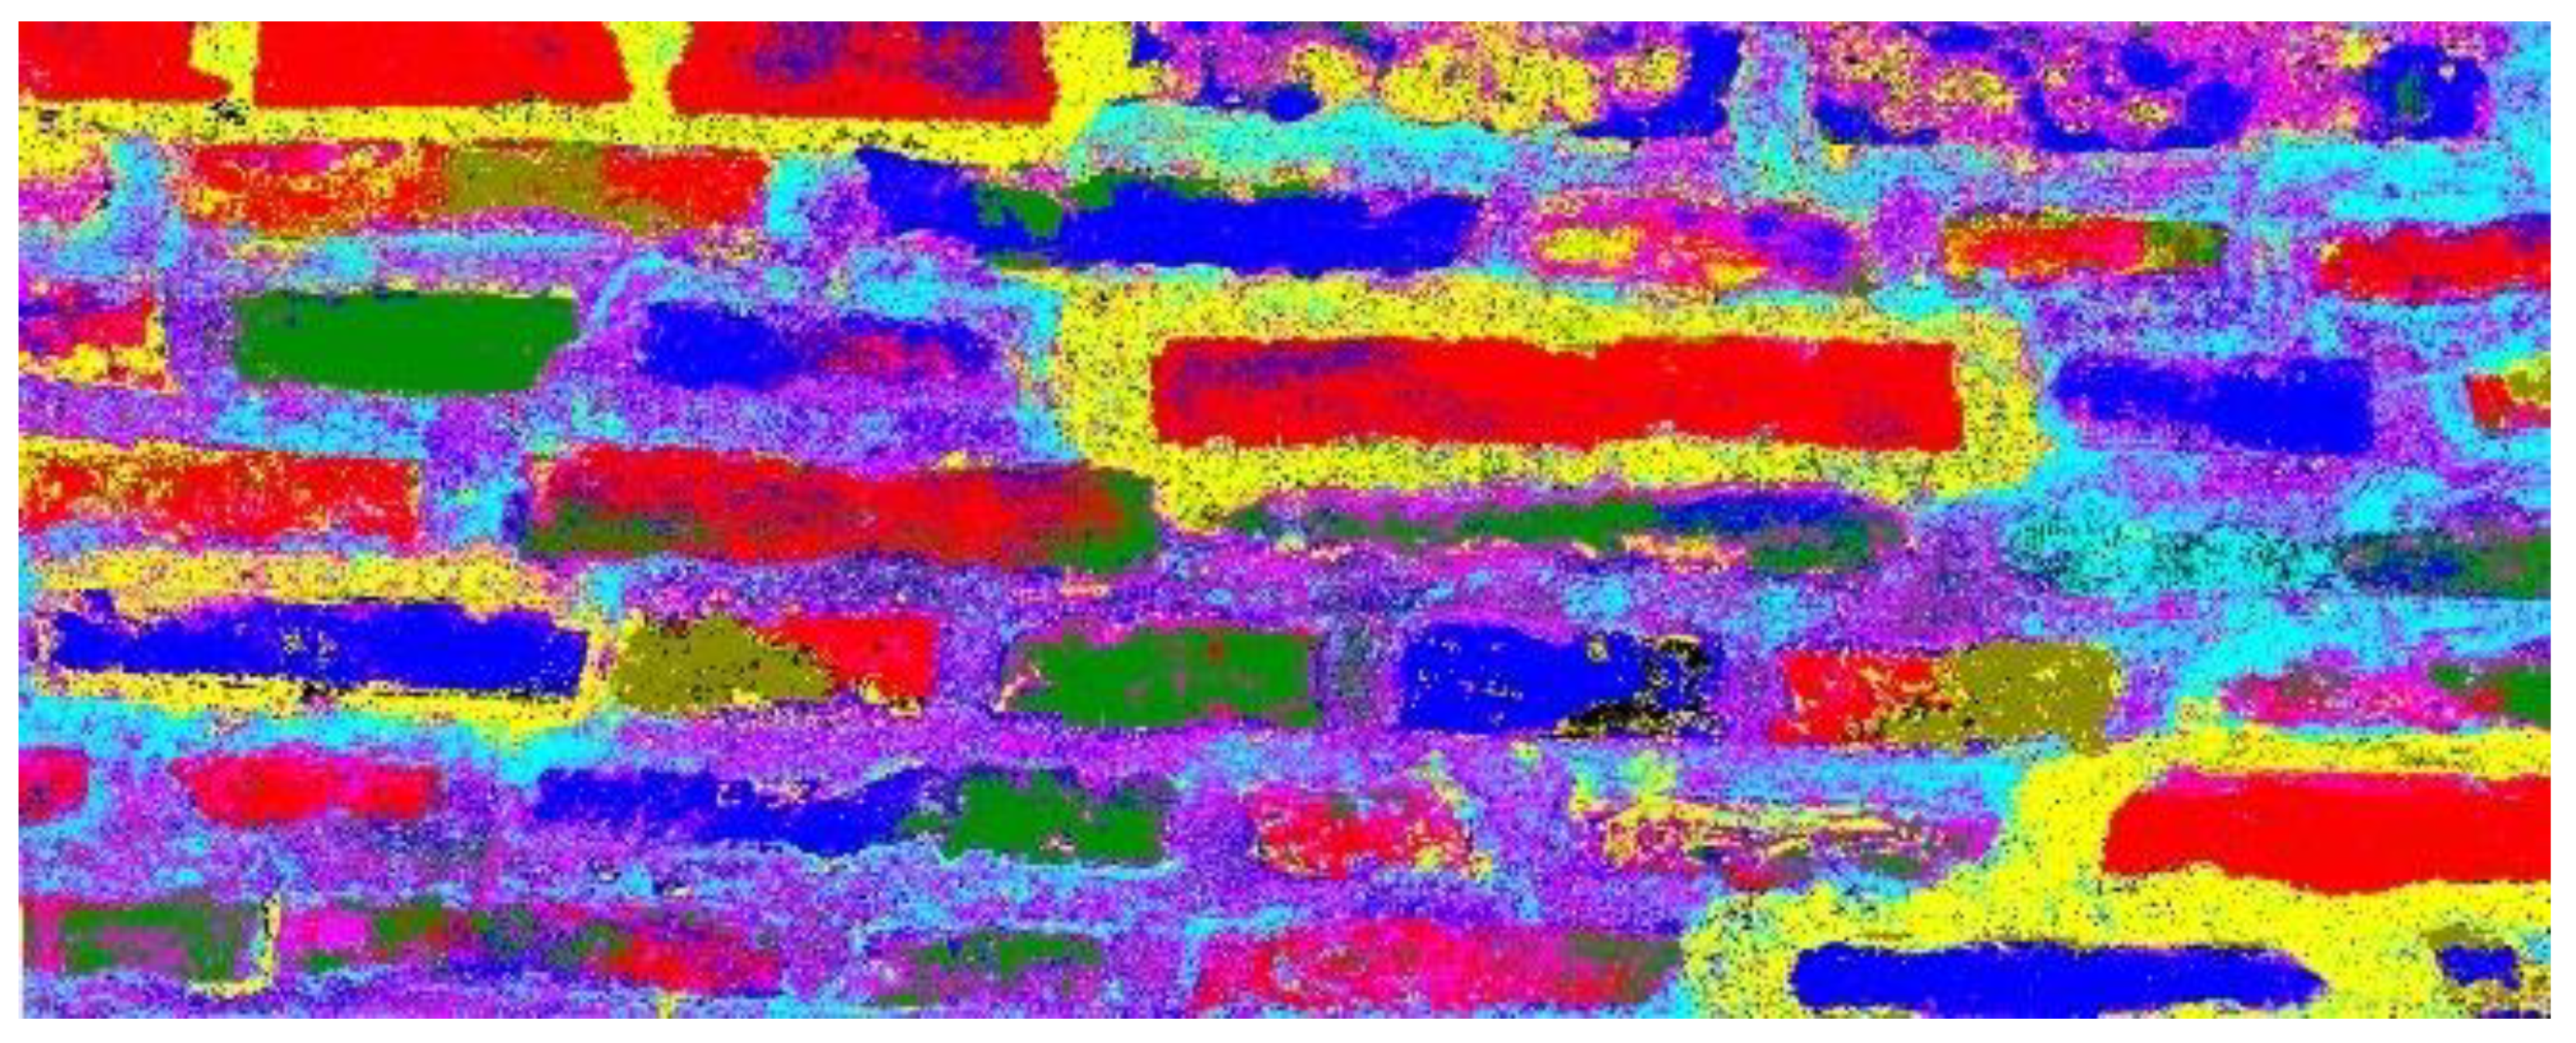
The selection of the endmembers was the most important step in generating the results of the supervised classification. Based on the preliminary imagistic analyses correlated with the PCA results, seven endmembers were extracted according to the characteristic spectral profiles of the materials: three types of bricks (#1, #2, and #3), three types of mortars (#1, #2, and #3), and one material that visually seemed impregnated in the surface. As presented in Figure 7, red markers were attributed to brick #1, green to brick #2, blue to brick #3, yellow to mortar #1, cyan to mortar #2, and magenta to mortar #3.
For LSU, we used a weighted unit-sum constraint, so the results were in the range from 0 to 1. For each endmember selected, the algorithm generated a specific greyscale image in which light tones designate higher probabilities (a better fitting), while darker tones relate to smaller probabilities (see Figure 8).
The LSU classification depicts the adherent deposit’s presence on more areas than were initially identified in the initial HSI analysis, as can be seen in Figure 9
The SAM classification was applied, and the threshold for each category of class was 0.100 radians. The number of unclassified pixels was insignificant, and the mapping of the generated classes has great accuracy.
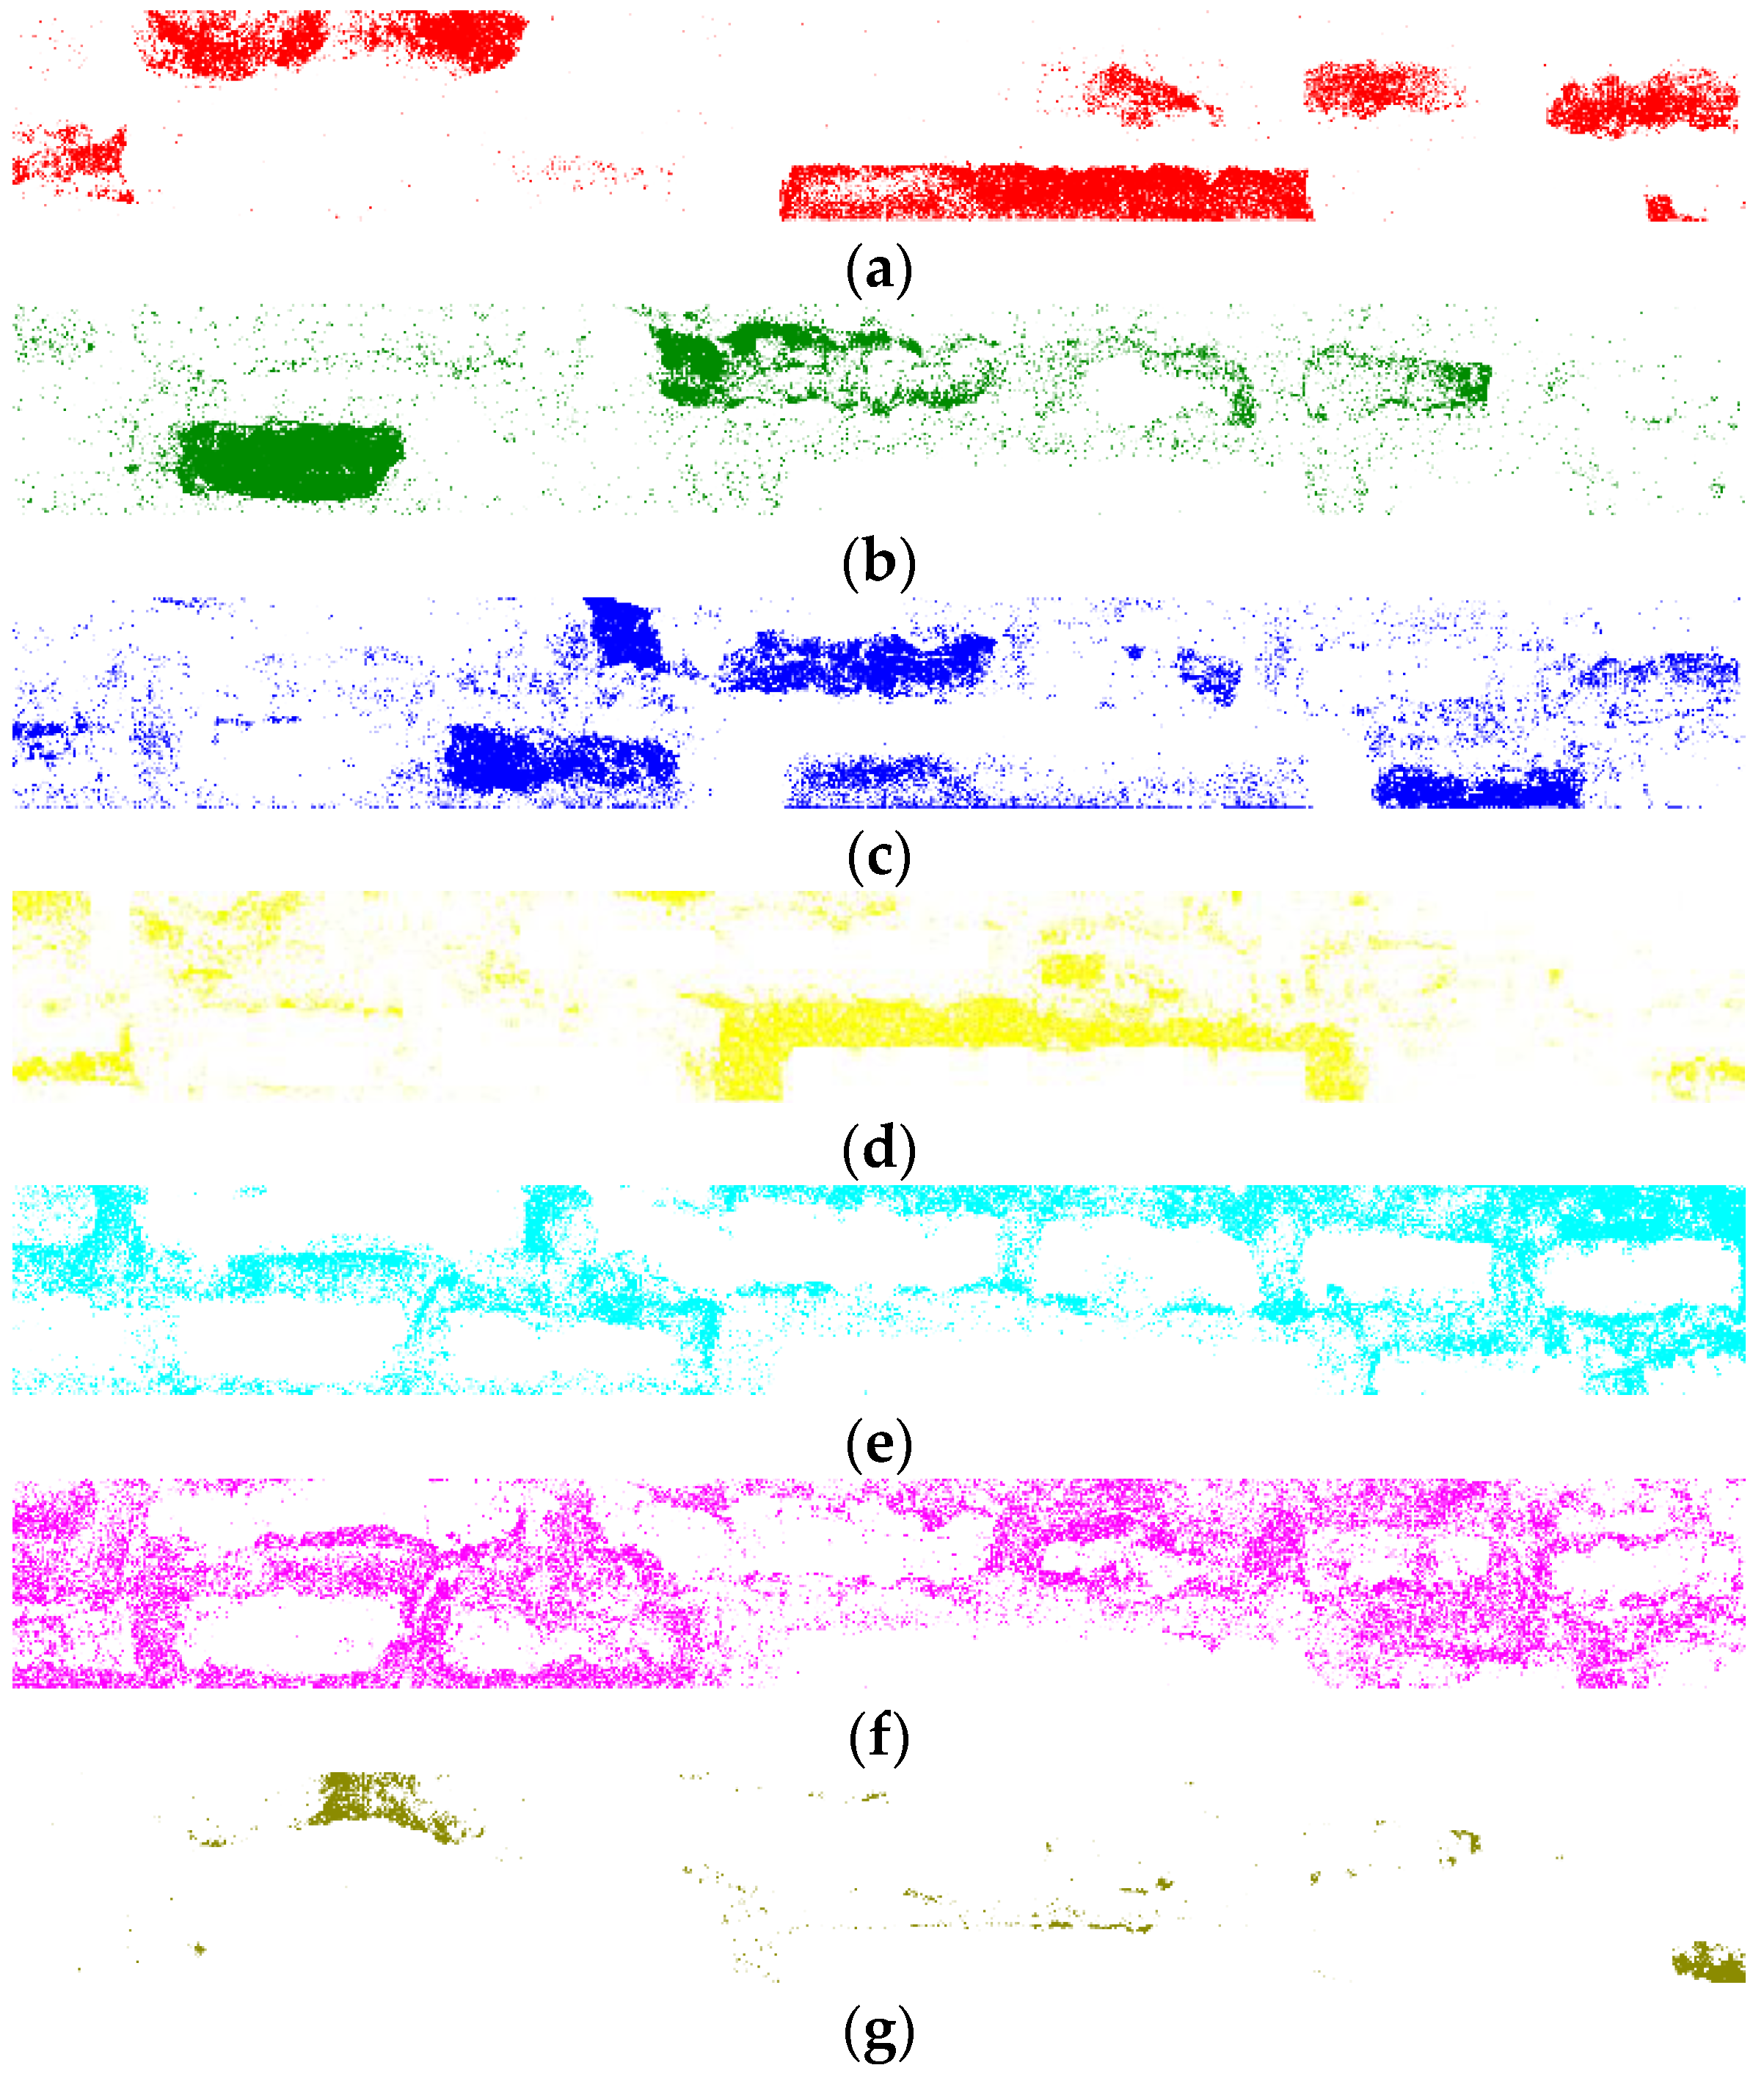
Figure 10 presents the results obtained for one of the seven acquisitions made in order to cover the interest area. It was very interesting to highlight the distribution of materials on the surface: the red hue is used for depicting the areas where brick #1 had a higher probability, the green hue for brick #2, the blue hue for brick #3, the yellow hue for mortar #1, the cyan hue for mortar #2, the magenta hue for mortar #3, and the kaki hue for the impregnated layer.
Figure 11 presents the final image obtained by overlapping all the SAM classifications (red, green, blue, yellow, cyan, magenta, and kaki) for the whole investigated area—all seven acquisitions stitched together in one image.
Using PCA, SAM, and LSU we can discriminate brick#1 from brick #2 and #3 and mortar #1 from mortar #2 and #3. Taking into consideration the fact that the long brick, known to be a recent material, is classified as brick #1, we can see the extent of the restoration. The LIBS PCA data can clearly differentiate brick #1 from the other two, but the LIBS-HSI corroboration was able to depict a slight difference between brick #2 and #3. The LIBS analyses did not identify Fe in the grey mortar areas attributed to mortar #1, and the data corresponding to it in the PCA was grouped apart from all of them; thus, we can assume that mortar #1 is a new material that does not contain brick shards. We can observe in Figure 11 that it was used for restoration on more areas in addition to the ones around the new inserted bricks. Mortar #2 and #3 contain brick shards and tend to group in the PCA. In Figure 11e,f, we can observe that they have a similar response; therefore, we can assume that they are the same material, and the difference is made by the thickness of the surface adherent deposit layer. It is interesting to see also the presence in traces of mortars on these bricks—traces that are not visible with the naked eye. In addition, the presence of some impregnated material is noted, a material with a more distinctive spectral profile than the rest, that will be the subject of further studies in order to see if it can be correlated with the early development of Algae or Lichens [32], and deep learning algorithms are considered to be applied [33].
The results of the LSU were similar to the SAM classification, meaning that the selection of the endmembers was accurate. However, the root mean square (RMS) fraction displayed some errors (proportionally insignificant), depicted in Figure 12, that correlated to the LIBS data, displaying a high content of C which can be associated to smoke scraps on the outer walls.
4. Conclusions
This paper discusses the results obtained by corroborating LIBS and HSI data acquired on an area of the Turkish bath from the Golești Museum, which was selected because it is representative in terms of age value, covering both original and restoration materials. The two complementary techniques were used in order to map the original elements and trace the undocumented interventions previously made on the Turkish bath. Using the FCIR mode, RGB channels were assigned to different combinations of wavelengths ranging from 954 to 2250 nm in order to track the similarities and differences in the material behaviour, and a total of seven areas were selected for endmembers’ attribution. LIBS stratigraphy was performed based on the HSI results. The main chemical elements identified using LIBS can be traced to oxides commonly found in clay bricks, and the PCA helped distinguish two main types of bricks and mortars. The LIBS PCA results were correlated and, further on, processed in ENVI using SAM and LSU, applied complementary, in order to validate the accuracy of the classification and mapping, as seven endmembers were extracted for three brick areas (#1, #2, and #3), three mortar areas (#1, #2, and #3), and one material considered to be impregnated in the surface. Using PCA, SAM, and LSU, a distribution map of the area was obtained where previous interventions were identified and mapped. The impregnated material detected will be the subject of further studies in order to see if it is a biological attack. Based on the results, deep learning algorithms are considered to be used for further applications on the building.
Author Contributions
Conceptualization, M.D.; historical input, C.C. and G.C.; methodology, M.D.; HIS acquisition and processing, L.C.R.; LIBS acquisition and processing, M.D.; writing—original draft preparation, M.D.; writing—review and editing, M.D., L.C.R., C.C. and G.C. All authors have read and agreed to the published version of the manuscript.
Funding
This research was funded by the Romanian Ministry of Research, Innovation and Digitalization, under Program 1—Development of the National Research-Development System, Subprogram 1.2—Institutional performance—Projects to finance the excellence in RDI, SUPECONEX grant nr. 18PFE/30.12.2021, under Core Program 18N/08.02.2019, project PN 19-18.01.02 and under PNCDI III, CNCS—UEFISCDI, project number PN-III-P4-PCE-2021-1605.
Data Availability Statement
The data that support the findings of this study are available upon request from the corresponding authors.
Conflicts of Interest
The authors declare no conflict of interest. The funders had no role in the design of this study; in the collection, analyses, or interpretation of data; in the writing of the manuscript; or in the decision to publish the results.
References
- Fernandes, F.M.; Lourenço, P.B.; Castro, F. Ancient Clay Bricks: Manufacture and Properties. In Materials, Technologies and Practice in Historic Heritage Structures; Springer: Berlin/Heidelberg, Germany, 2010. [Google Scholar] [CrossRef] [Green Version]
- Teodoru, R. Curți întărite târzii. Stud. Și Cercet. Istor. Artei 1963, X, 343. [Google Scholar]
- Din Alep, P. Jurnal de călătorie în Moldova și Valahia; Ioana Feodorov editions; Romanian Academy Publishing House and Istros Publishing House: Bucharest, Romania, 2014. [Google Scholar]
- Potra, G. Din Bucureștii de Altădată; Scientific and Encyclopedic Publishing House: Bucharest, Romania, 1981. [Google Scholar]
- Galbács, G. A critical review of recent progress in analytical laser-induced breakdown spectroscopy. Anal. Bioanal. Chem. 2015, 407, 7537–7562. [Google Scholar] [CrossRef] [PubMed]
- Carmona-Quiroga, P.M.; Martínez-Ramírez, S.; Sánchez-Cortés, S.; Oujja, M.; Castillejo, M.; Blanco-Varela, M.T. Effectiveness of antigraffiti treatments in connection with penetration depth determined by different techniques. J. Cult. Herit. 2010, 11, 297–303. [Google Scholar] [CrossRef]
- Palleschi, V. (Ed.) Chemometrics and Numerical Methods in LIBS. Wiley: Hoboken, NJ, USA, 2022. [Google Scholar]
- Zahiri, Z.; Laefer, D.F.; Kurz, T.; Buckley, S.; Gowen, A. A comparison of ground-based hyperspectral imaging and red-edge multispectral imaging for façade material classification. Autom. Constr. 2022, 136, 104164. [Google Scholar] [CrossRef]
- Popescu, M.; Iliescu, C. Golești; Meridiane Publishing House: Bucharest, Romania, 1966. [Google Scholar]
- Pagnotta, S.; Lezzerini, M.; Campanella, B.; Gallello, G.; Grifoni, E.; Legnaioli, S.; Lorenzetti, G.; Poggialini, F.; Raneri, S.; Safi, A.; et al. Fast quantitative elemental mapping of highly inhomogeneous materials by micro-Laser-Induced Breakdown Spectroscopy. Spectrochim. Acta Part B At. Spectrosc. 2018, 146, 9–15. [Google Scholar] [CrossRef] [Green Version]
- Živković, S.; Botto, A.; Campanella, B.; Lezzerini, M.; Momčilović, M.; Pagnotta, S.; Palleschi, V.; Poggialini, F.; Legnaioli, S. Laser-Induced Breakdown Spectroscopy elemental mapping of the construction material from the Smederevo Fortress (Republic of Serbia). Spectrochim. Acta Part B At. Spectrosc. 2021, 181, 106219. [Google Scholar] [CrossRef]
- Dontu, S.; Miclos, S.; Savastru, D.; Tautan, M. Combined spectral-domain optical coherence tomography and hyperspectral imaging applied for tissue analysis: Preliminary results. Appl. Surf. Sci. 2017, 417, 119–123. [Google Scholar] [CrossRef]
- Cheng, J.H.; Nicolai, B.; Sun, D.W. Hyperspectral imaging with multivariate analysis for technological parameters prediction and classification of muscle foods: A review. Meat Sci. 2017, 123, 182–191. [Google Scholar] [CrossRef]
- Ravikanth, L.; Jayas, D.S.; White, N.D.G.; Fields, P.G.; Sun, D.W. Extraction of Spectral Information from Hyperspectral Data and Application of Hyperspectral Imaging for Food and Agricultural Products. Food Bioprocess Technol. 2017, 10, 1–33. [Google Scholar] [CrossRef]
- Spizzichino, V.; Fantoni, R. Laser Induced Breakdown Spectroscopy in archeometry: A review of its application and future perspectives. Spectrochim. Acta Part B At. Spectrosc. 2014, 99, 201–209. [Google Scholar] [CrossRef]
- Gaudiuso, R.; Dell’Aglio, M.; de Pascale, O.; Senesi, G.S.; de Giacomo, A. Laser induced breakdown spectroscopy for elemental analysis in environmental, cultural heritage and space applications: A review of methods and results. Sensors 2010, 10, 7434–7468. [Google Scholar] [CrossRef] [PubMed] [Green Version]
- Hahn, D.W.; Omenetto, N. Laser-induced breakdown spectroscopy (LIBS), part II: Review of instrumental and methodological approaches to material analysis and applications to different fields. Appl. Spectrosc. 2012, 66, 347–419. [Google Scholar] [CrossRef]
- Botto, A.; Campanella, B.; Legnaioli, S.; Lezzerini, M.; Lorenzetti, G.; Pagnotta, S.; Poggialini, F.; Palleschi, V. Applications of laser-induced breakdown spectroscopy in cultural heritage and archaeology: A critical review. J. Anal. At. Spectrom. 2019, 34, 81–103. [Google Scholar] [CrossRef]
- Atanassova, V.; Ghervase, L.; Cortea, I.M.; Mihailov, V.; Tankova, V.; Nikolov, V. Multi-analytical approach for characterization of archaeological pottery excavated in the Early-Neolithic settlement of Chavdar, Bulgaria. Spectrosc. Lett. 2021, 54, 549–559. [Google Scholar] [CrossRef]
- Pacher, U.; Dinu, M.; Nagy, T.O.; Radvan, R.; Kautek, W. Multiple wavelength stratigraphy by laser-induced breakdown spectroscopy of Ni-Co alloy coatings on steel. Spectrochim. Acta Part B At. Spectrosc. 2018, 146, 36–40. [Google Scholar] [CrossRef]
- Ghervase, L.; Dinu, M.; Borș, C.; Angheluță, L.M.; Rădvan, R.; Cortea, I.M. Investigation on Metal Adornments From Ancient Eastern Europe. Front. Mater. 2020, 7, 600913. [Google Scholar] [CrossRef]
- Cortea, I.M.; Ratoiu, L.; Ghervase, L.; Țentea, O.; Dinu, M. Investigation of ancient wall painting fragments discovered in the roman baths from alburnus maior by complementary non-destructive techniques. Appl. Sci. 2021, 11, 10049. [Google Scholar] [CrossRef]
- Cucci, C.; Picollo, M.; Chiarantini, L.; Uda, G.; Fiori, L.; De Nigris, B.; Osanna, M. Remote-sensing hyperspectral imaging for applications in archaeological areas: Non-invasive investigations on wall paintings and on mural inscriptions in the Pompeii site. Microchem. J. 2020, 158, 105082. [Google Scholar] [CrossRef]
- Miliani, C.; Rosi, F.; Daveri, A.; Brunetti, B.G. Reflection infrared spectroscopy for the non-invasive in situ study of artists’ pigments. Appl. Phys. A Mater. Sci. Process. 2012, 106, 295–307. [Google Scholar] [CrossRef]
- Sánchez, J.; Quirós, E. Semiautomatic detection and classification of materials in historic buildings with low-cost photogrammetric equipment. J. Cult. Herit. 2017, 25, 21–30. [Google Scholar] [CrossRef]
- Canty, M.J. Image Analysis, Classification and Change Detection in Remote Sensing: With Algorithms for ENVI/IDL and Python, 3rd ed.; CRC Press: Boca Raton, FL, USA, 2014; ISBN 9781466570382. [Google Scholar]
- Bai, D.; Messinger, D.W.; Howell, D. A hyperspectral imaging spectral unmixing and classification approach to pigment mapping in the Gough & Selden Maps. J. Am. Inst. Conserv. 2019, 58, 69–89. [Google Scholar] [CrossRef]
- Allios, D.; Guermeur, N.; Cocoual, A.; Linderholm, J.; Sciuto, C.; Geladi, P.; Gobrecht, A.; Bendoula, R.; Moura, D.; Jay, S.; et al. Near Infrared Spectra and Hyperspectral Imaging of Medieval Fortress Walls in Carcassonne: A Comprehensive Interdisciplinary Field Study. NIR News 2016, 27, 16–20. [Google Scholar] [CrossRef]
- Bernstein, L.S. Quick atmospheric correction code: Algorithm description and recent upgrades. Opt. Eng. 2012, 51, 111719. [Google Scholar] [CrossRef]
- Capedri, S.; Venturelli, G. Provenance determination of trachyctic lavas, employed as blocks in the Romanesque cathedral of Modena (Northern Italy), using magnetic susceptibility, and petrographic and chemical parameters. J. Cult. Herit. 2005, 6, 7–19. [Google Scholar] [CrossRef]
- Gomoiu, R.I.; Cojoc, R.; Ruginescu, S.; Neagu, M.; Enache, G.; Maria, M.; Dumbrăvician, I.; Olteanu, R.; Rădvan, L.; Ratoiu, V.; et al. Brackish and Hypersaline Lakes as Potential Reservoir for Enzymes Involved in Decomposition of Organic Materials on Frescoes. Fermentation 2022, 8, 462. [Google Scholar] [CrossRef]
- Angheluta, L.; Striber, J.; Radvan, R.; Gomoiu, I.; Dragomir, V. Non-contact and non-invasive photonic device for qualitative fungal contamination control. Math. Comput. Biol. Chem. 2008, 4, 147–156. [Google Scholar]
- Angheluţă, L.M.; Chiroşca, A. Physical degradation detection on artwork surface polychromies using deep learning models. Rom. Rep. Phys. 2020, 72, 805. [Google Scholar]
Figure 1.
The outbuildings featuring the Turkish bath in 1942 (a) and at present time (b).

Figure 2.
HSI system (a) and LIBS (b) data acquisition on the NE side of the Turkish bath.

Figure 3.
HSI images for (a) 954 nm, (b) 2200 nm, and (c) FCIR.

Figure 4.
LIBS analysis spots.

Figure 5.
LIBS spectra for (a) Si line and (b) Ca and Al lines.

Figure 6.
PCA of the bricks (c) and mortars (m).

Figure 7.
ROI selection of endmembers on the FCIR image.

Figure 8.
LSU classification results for (a) brick #1, (b) brick #2, (c) brick #3, (d) mortar #1, (e) mortar #2, and (f) mortar #3.
Figure 8.
LSU classification results for (a) brick #1, (b) brick #2, (c) brick #3, (d) mortar #1, (e) mortar #2, and (f) mortar #3.

Figure 9.
LSU classification for the adherent deposit layer.

Figure 10.
SAM classification results for (a) brick #1, (b) brick #2, (c) brick #3, (d) mortar #1, (e) mortar #2, (f) mortar #3, and (g) impregnated.
Figure 10.
SAM classification results for (a) brick #1, (b) brick #2, (c) brick #3, (d) mortar #1, (e) mortar #2, (f) mortar #3, and (g) impregnated.

Figure 11.
Spectral angle mapper (SAM) classification.

Figure 12.
SAM error.


Table 1.
Chemical elements identified using LIBS.
| Type of Material | Main Chemical Elements Identified by LIBS Averaged Data |
|---|---|
| Bricks | Si, Al, Mg, Fe, K, Na, Ca, O, C, Ti |
| Reddish mortar areas | Ca, Si, Sr, Al, Na, Mg, K, C, Fe, O, Ti |
| Grey mortar areas | Ca, Si, Na, Al, K, C, Sr, O |
Disclaimer/Publisher’s Note: The statements, opinions and data contained in all publications are solely those of the individual author(s) and contributor(s) and not of MDPI and/or the editor(s). MDPI and/or the editor(s) disclaim responsibility for any injury to people or property resulting from any ideas, methods, instructions or products referred to in the content. |
© 2023 by the authors. Licensee MDPI, Basel, Switzerland. This article is an open access article distributed under the terms and conditions of the Creative Commons Attribution (CC BY) license (https://creativecommons.org/licenses/by/4.0/).
Share and Cite
MDPI and ACS Style
Dinu, M.; Ratoiu, L.C.; Călin, C.; Călin, G. Multi-Analytical Investigations of the Medieval Turkish Bath from Golești Open Air Museum. Buildings 2023, 13, 321. https://0-doi-org.brum.beds.ac.uk/10.3390/buildings13020321
AMA Style
Dinu M, Ratoiu LC, Călin C, Călin G. Multi-Analytical Investigations of the Medieval Turkish Bath from Golești Open Air Museum. Buildings. 2023; 13(2):321. https://0-doi-org.brum.beds.ac.uk/10.3390/buildings13020321
Chicago/Turabian StyleDinu, Monica, Lucian Cristian Ratoiu, Camelia Călin, and Gerard Călin. 2023. "Multi-Analytical Investigations of the Medieval Turkish Bath from Golești Open Air Museum" Buildings 13, no. 2: 321. https://0-doi-org.brum.beds.ac.uk/10.3390/buildings13020321
Note that from the first issue of 2016, this journal uses article numbers instead of page numbers. See further details here.