1. Introduction
Construction and demolition waste (C&DW) is generally directly backfilled or stacked in the open air, which brings a negative impact to the ecological environment and causes waste of resources [
1,
2,
3]. In China, the total discharge of C&DW has exceeded 5 billion tons and is still growing at a rate of 7% to 10% per year [
4]. Reuse of the C&DW by re-introduction into the concrete is a sustainable solution to reduce the volume of waste deposited into landfills as well as the production of new construction material [
5]. Li et al. [
4] studied the strength indexes and failure pattern of recycled aggregate concrete (RAC) with large-sized recycled coarse aggregates. It was found that the cube compressive strength of the RAC has almost the same cube compressive strength as natural aggregate concrete, and the difference in splitting the tensile strength between RAC and natural aggregate concrete is lower than 10%. Studies from Cantero et al. [
6] show that the use of cement containing C&DW additions and 50% recycled aggregate (RA) do not substantially compromise the mechanical performance of concrete. Mendoza et al. [
7] established an optimal design method for the inclusion of RAC in warm mix asphalt. In addition, the effects of waste glass, recycled coal bottom ash and marble aggregate on the mechanical properties of concrete have been studied in the literature [
8,
9,
10], respectively. The abovementioned studies suggest that RAC has good mechanical performance and can be used in engineering construction.
Pervious concrete (PC) is a porous medium with an internal interconnected pore structure and high permeability. It has been widely used in the construction of parking lots and low-load road pavements [
11,
12,
13,
14] to collect rainwater and alleviate water shortage in the city. By storing, infiltrating and purifying water, the ecological environment and the heat island effect of the city are adjusted and improved as well [
15]. Therefore, the cost of urban construction, utilization and maintenance is reduced [
16,
17]. Recycled aggregate pervious concrete (RAPC), which uses C&DW as coarse or fine aggregate, has been widely studied recently [
18,
19]. Strieder et al. [
20] studied the influence of the RA incorporation ratio on the mechanical properties of PC. The results showed that the total porosity increases with an increasing recycled aggregate incorporation ratio. Moreover, the compressive strength is reduced with an increase in the recycled aggregate incorporation ratio at the same water–cement ratio. Güneyisi et al. [
21] evaluated the effect of water-to-cement ratios (0.27, 0.32) and the level of recycled aggregate on the physical and mechanical properties of RAPC. The results of these studies showed that the recycled coarse aggregate would increase the connectivity and permeability of PC, which results in a decrease in the compressive strength of PC [
20,
21,
22,
23]. The Taguchi design method and the response surface method were used to design a mix ratio of PC pavement and RAPC in the literature [
24,
25], respectively. Liu et al. [
26] used X-ray micro-tomography and image-processing technology to evaluate the distribution of porosity and the meso-structure of cement paste of PC. Akand et al. [
27] investigated the influence of the distribution of microstructures on the strength and permeability of PC based on 2D image analysis.
Although lots of experiments and analysis have been conducted on RAPC, studies on the F–T durability of RAPC are insufficient, and a deterioration law of RAPC in salt solution is lacking, which limits its extensive applications in cold regions. Therefore, it is of great significance to improve the mechanical properties and durability of RAPC under NaCl solution.
In this study, the influence of the water–binder ratio, design porosity, silica fume and reinforcing agent on the mechanical properties and permeability of RAPC is investigated based on an orthogonal design method. An optimal mixture proportion of RAPC with better performance of permeability and durability is obtained. Then, F–T cycle tests are carried out to study the mass change, RDEM and residual compressive strength of the RAPC under different F–T media (such as water and a 3.5 wt% NaCl solution). The relationship between the porosity of the RAPC and F–T cycles is also studied by a CT scanning method. Moreover, frost damage models of RAPC are established based on the two-parameter Weibull probability and damage theory to describe the damage degree of the RAPC in different freezing and thawing media.
2. Materials and Methods
2.1. Material Properties
For the preparation of RAPC in this study, P.O 42.5 ordinary Portland cement was selected as the cementitious material, which is produced by Yatai cement Co., Ltd. (Changchun city, China).
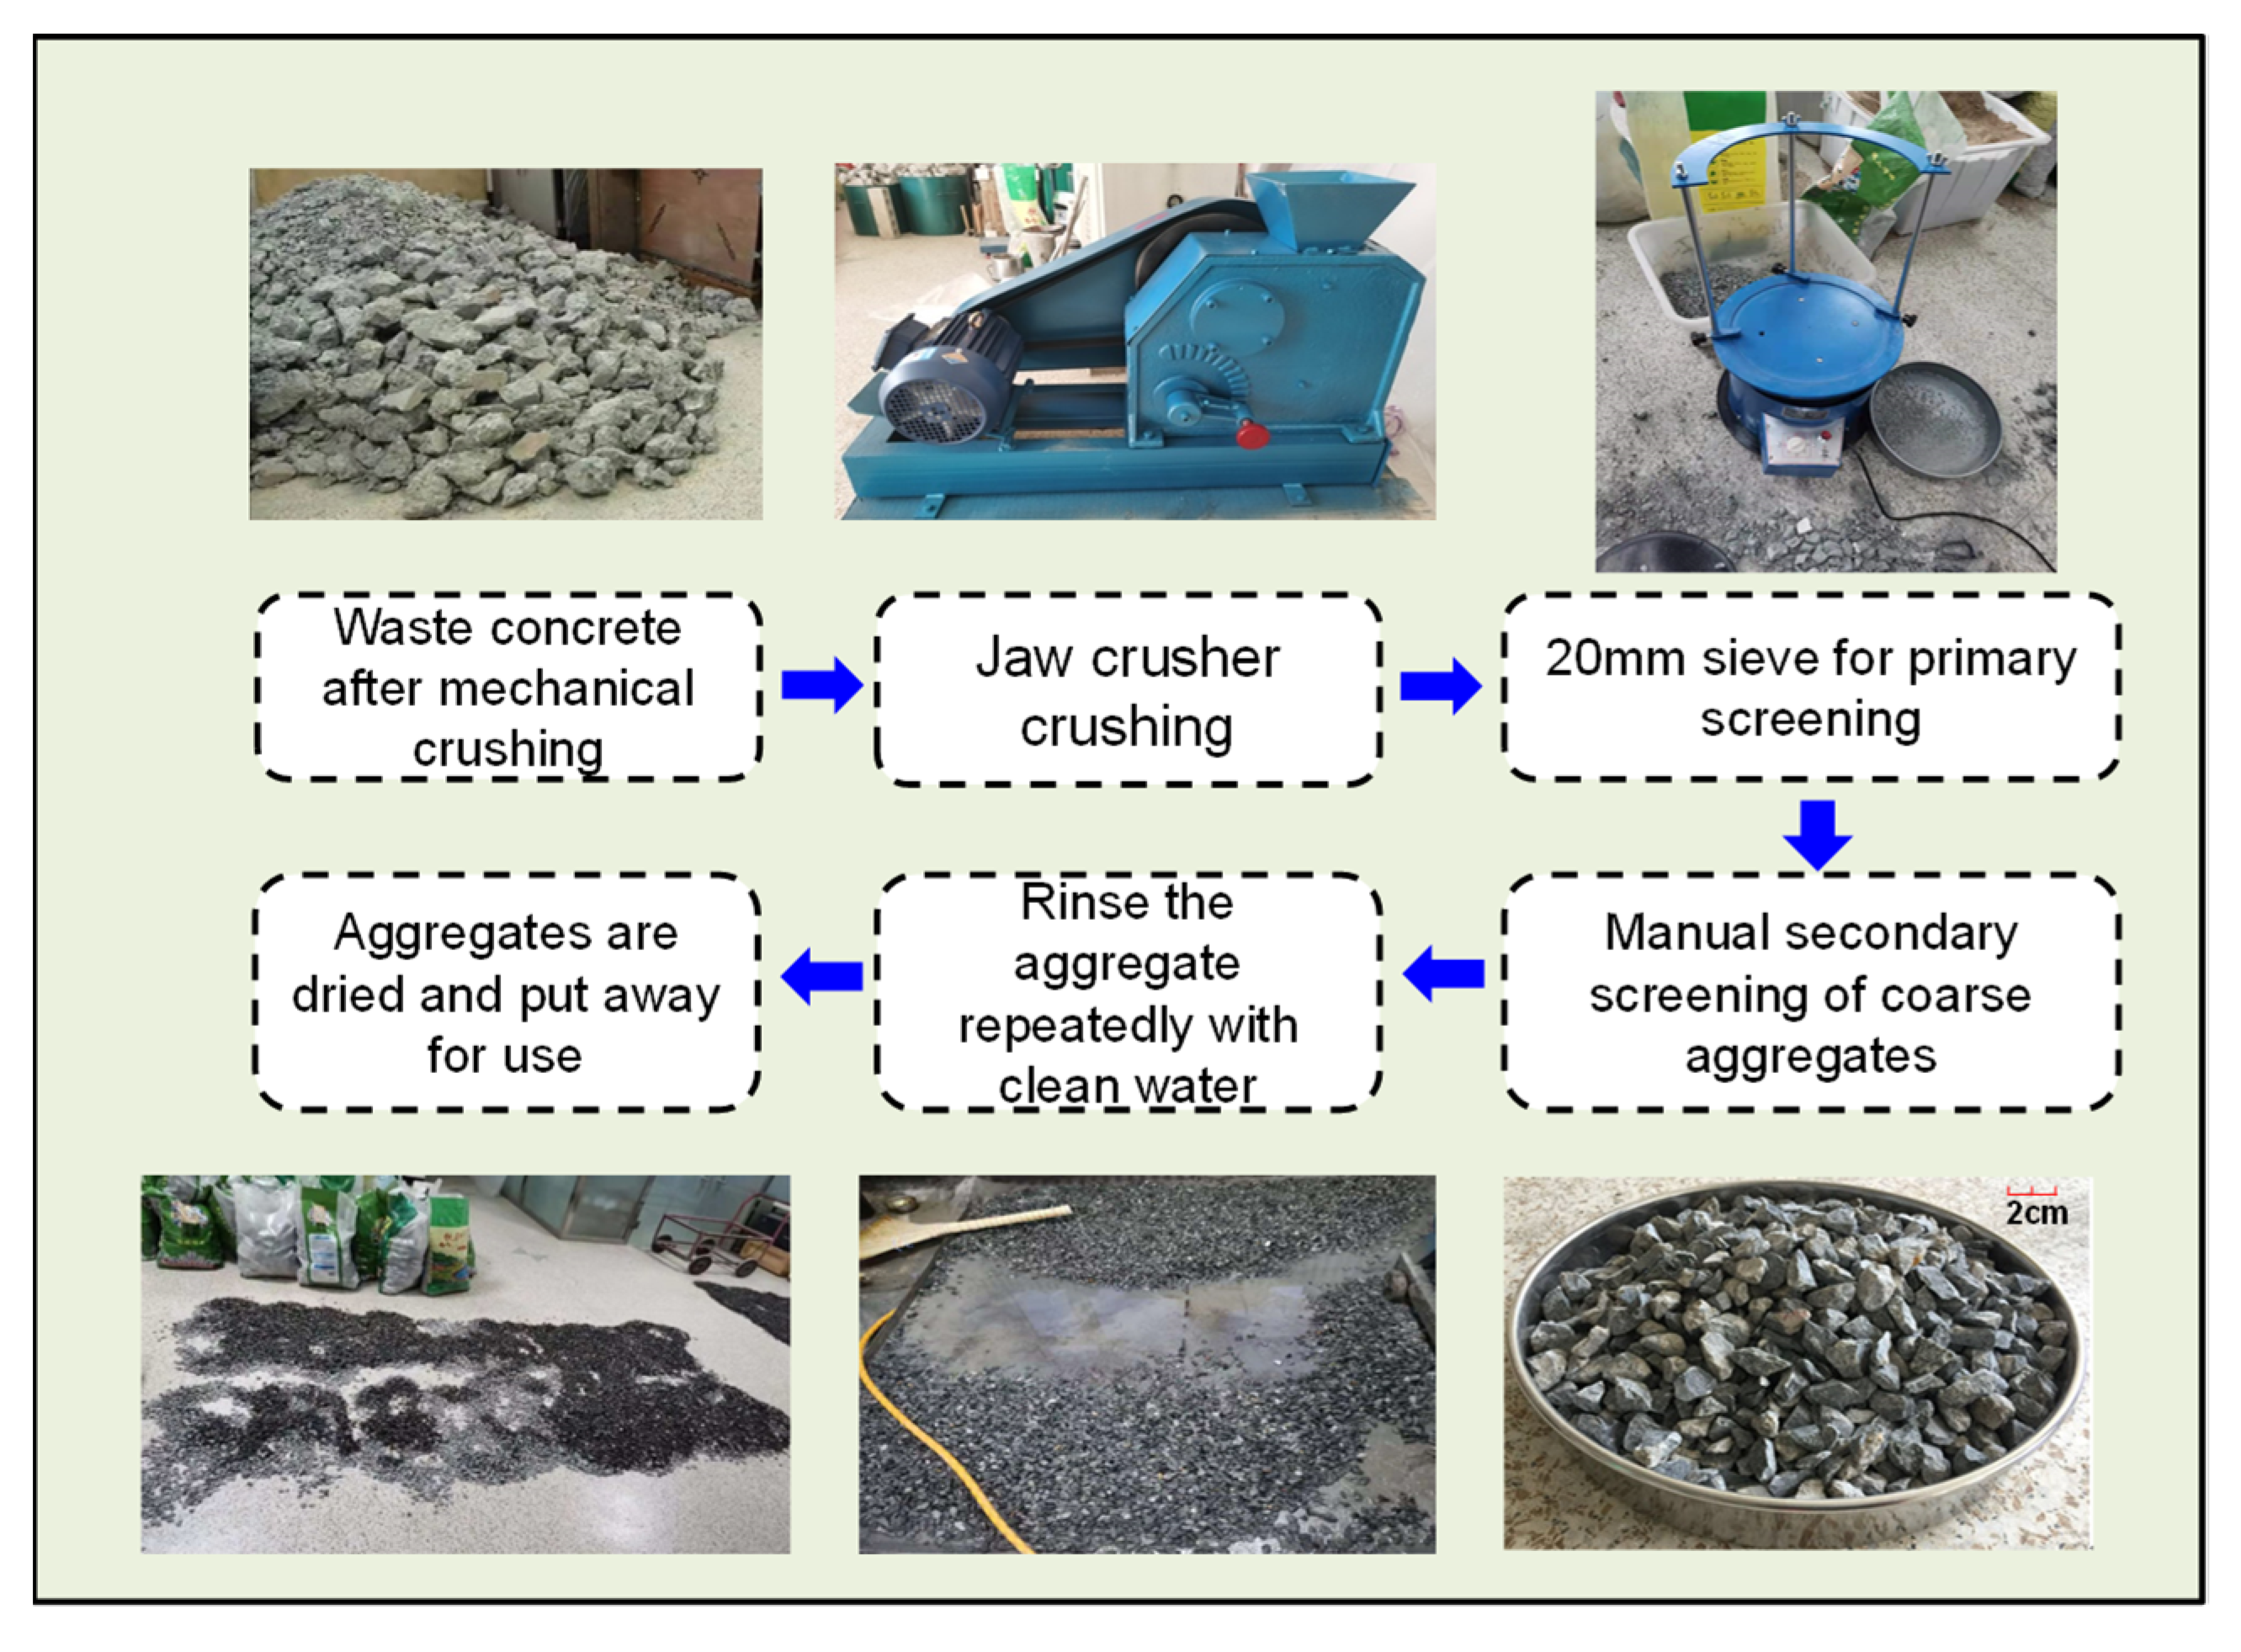
Table 1 provides information on the chemical composition and physical properties of cement. The 28d compressive strength and flexural strength of the cement were tested, and the values are 48.8 MPa and 8.5 MPa, respectively. Natural coarse aggregate (NCA) was continuously graded with crushed stone with a particle size of 5–20 mm. Recycled coarse aggregate (RCA) was obtained by the crushing and manual secondary screening of a laboratory-made C30 reinforced concrete beam. According to Chinese code [
28], the amount of RCA accounts for 30% of the total amount of coarse aggregate in this test. A flow chart of the preparation of RCA is shown in
Figure 1.
Table 2 summarizes the basic properties of the NCA and RCA. Standard sand was utilized, and the average fineness modulus was 2.66. In addition, the amount of sand was 8% of the total coarse aggregates. Particle size distribution curves of the coarse aggregate and fine aggregate are shown in
Figure 2, respectively.
It is pointed out in the literature [
29] that the mechanical properties and abrasion resistance of concrete can be improved by adding the appropriate amount of silica fume. To enhance the mechanical properties of RAPC, micro silica fume (SF) and enhancer agent (EA) were selected.
Table 3 and
Table 4 present the chemical composition and specific indicators of the SF and EA, respectively. In addition, the FDN water reducer agent was used, and its physical properties are shown in
Table 5.
2.2. Mixture Proportions
In general, the water–binder ratio and design porosity have a direct influence on the mechanical properties and durability of PC. Moreover, the effects of the addition of SF and EA on the mechanical properties and permeability of RAPC need further study. Based on the orthogonal design method, the influence of the water–binder ratio (A), design porosity (B), SF content (C) and EA content (D) on the permeability and mechanical properties of the RAPC were studied.
Table 6 shows the orthogonal experimental design table with four factors and three levels. The orthogonal test was arranged according to L
9(3
4), and the 9 groups of RAPC mixture proportions are shown in
Table 7.
2.3. Specimen Preparation
The RAPC specimens were prepared according to the Chinese specifications [
28], and they were manufactured using manual tamping and vibration molding.
Figure 3 shows the mixing process of the RAPC. First, the mixture is placed into the plastic mold three times. The mixture is inserted and pounded each time along the four sides. Subsequently, the mold is placed on the vibration table, and it vibrates for 15~20 s. After that, the specimens are covered with thin plastic films to prevent moisture from evaporating for 24 h. Finally, the specimens are stored in a standard curing room for a specified age (28 days).
2.4. Testing Methods
2.4.1. Compressive Strength
In this test, the cubic compressive strength was measured every 10 F–T cycles by an electro-hydraulic servo testing machine (WAW-2000kN). According to the Chinese specification GB/T 50081-2019 [
30], the loading speed was controlled within a range of 3~5 kN/s.
2.4.2. Continuous Void Porosity
Continuous void porosity (
Cvoid) tests were carried out according to Chinese standards [
29] and were calculated by Equation (1):
where
m1 is the weight of a RAPC cube in water, and
m2 is that after 24 h baking in an oven at 60 °C, g;
ρ is the density of water at room temperature, g/cm
3;
V represents the volume of the cube specimen, cm
3.
2.4.3. Permeability Coefficient
To measure the permeability coefficient, an apparatus was designed and made in the laboratory, which is shown in
Figure 4. The permeability coefficient was calculated according to Equation (2) based on Darcy’s law:
where
K represents the permeability coefficient, cm/s;
Q is the volume of overflowing water from the plexiglass tank in time
t, cm
3;
L is the length of the test specimen, cm;
A represents the cross-sectional area of the test specimen, cm
2;
H denotes the water head difference, cm; ∆
t is the relative test time, s.
Before the test, a 100 mm cubic specimen was placed inside the apparatus, and the outer ring of the upper surface of the test block was sealed with plasticine to ensure that water would not flow out of the side seam of the specimen. After the preliminary work was ready, the upper valve was opened, and the upper inlet flow was slowly adjusted. After the water flow between the overflow tank and the overflow port of the internal sleeve was stable, a measuring cup was used to connect water from the outlet of the overflow tank, and the amount of outflow water within a certain time was recorded. The average value of the measurement results was taken from three calculations.
2.4.4. F–T Test Method
A rapid F–T test was performed according to GB50082-2009 and ASTM C666-15 [
31,
32]. During the F–T tests, the minimum and maximum temperatures in the center of the concrete prism specimens were controlled within the range of (−18 ± 2) °C and (5 ± 2) °C, respectively. The process of each F–T cycle lasts 4 h.
Figure 5 shows a sketch of the rapid freezing–thawing cabinet and temperature change curves of the F–T cycles. After 24 days of standard curing, half of the specimens were immersed in water, and half were immersed in 3.5 wt% NaCl solution for 4 days at room temperature. After every 10 F–T cycles, all the specimens were removed from the SKDR-28S test cabinet, and the continuous void porosity, permeability coefficient, RDEM, CT scanning and compressive strength were measured. The values are the average of three specimens.
2.5. CT Scanning Images
To investigate the pore characteristics of the RAPC specimen after frost damage, a 128-layer lightspeed-VCT high-grade spiral CT machine was used, which is produced by the GE Company. The distance of the CT scans was 2.5 mm, obtaining 40 images along the height of the RAPC specimen.
Figure 6 shows the CT scanning process.
3. Results and Discussions
3.1. Results and Analysis of the Orthogonal Tests
The workability and mechanical properties of the RAPC are shown in
Table 8. It can be seen that the results are reasonable expect for groups 2, 3 and 6, the compressive strength of which was a little lower than 15 MPa.
In order to further discuss the influence of the various factors on the permeability and mechanical properties of the RAPC, the test results in
Table 8 were processed by range analysis. The first and second influence factors were obtained by comparing the range values of each factor. The range is the difference between the extreme values of each group. The higher the value of the extreme difference of the factor, the greater the influence of the factor on the results [
33]. The results of the range analysis are given in
Table 9.
- (1)
The design porosity (B) is the most sensitive factor for the continuous void rate of the RAPC. The measured continuous void rate increases significantly with the design porosity (B). The influence of the other three factors is relatively similar, and the levels of factor C and D have little effect on the continuous void porosity.
- (2)
The most influential factor on the permeability coefficient of the RAPC is the design porosity (B), followed by the water–binder ratio. The continuous void rate and the permeability coefficient are basically positively correlated. According to the test results of the permeability coefficient, the optimal mix proportion is A2B3C1D1.
- (3)
The 28d compressive strength of the RAPC basically tends to increase gradually with the increase in the water–binder ratio, SF and EA. When the water–binder ratio increases from 0.28 to 0.31, the compressive strength increases by 50.68%. When the amount of SF increases from 0% to 4%, the compressive strength increases by 20.31%. When the amount of EA increases from 0% to 8%, the compressive strength increases by 21.53%. The design porosity and compressive strength are basically negatively correlated, and the compressive strength gradually decreases with the increase in design porosity (B). According to the results of the range analysis, the optimal mix proportion is A3B1C2D3.
According to the test results, the optimal mix proportions are listed in
Table 10. Based on the optimal mixture proportions, six prism specimens of 100 mm × 100 mm × 400 mm were prepared for assessing F–T resistance, and 10 groups of cubic specimens of 100 mm × 100 mm × 100 mm were prepared for uniaxial compressive strength and CT scanning images. The compressive strength, porosity and the permeability coefficient of the specimens at 28 days were 28.6 MPa, 13.4% and 1.6mm/s, respectively.
3.2. Mass Loss Rate and RDEM after F–T Cycles
Figure 7a demonstrates the mass loss rate of the RAPC with different F–T cycles under water and in a 3.5 wt% NaCl solution. It is worth noting that the mass loss rate of the RAPC does not change significantly during the F–T process and is always negative. Until the end of 120 F–T cycles, the mass loss rate of the RAPC prism specimen in the sodium chloride solution was 0.245%. This is obviously different from the apparent failure characteristics of normal concrete after frost damage [
34].
Figure 7b illustrates the RDEM of the RAPC specimens under different F–T media. After frost damage, the RDEM of RAPC gradually decreases with the increase in F–T cycles under different media. It was noted that the RDEM of prism specimens dropped below 55% in sodium chloride solution after 70 cycles. Moreover, the RDEM of specimens in water decreased to less than 60% after 90 cycles. The results indicate that the damage degradation degree of the concrete specimens in the NaCl solution was generally greater than that in water under the same F–T cycles. In addition, the RDEM of the RAPC under different F–T media was fitted by polynomial function, which shows sufficient accuracy.
The RDEM was reduced with increasing F–T cycles, which indicates that the interior of the RAPC is gradually deteriorating. However, the mass loss rate of the prism specimen changed little during the F–T cycles, which shows that the mass loss rate is not suitable to access the durability of the RAPC. The mass loss rate and relative dynamic elastic modulus have obvious differences in evaluating the freeze–thaw durability of the RAPC. The former mainly characterizes the ability to maintain the integrity of the RAPC prismatic specimen under F–T cycles, which cannot reflect the deterioration inside the specimen. The latter can reflect the overall deterioration degree of the specimen intuitively.
3.3. Compressive Strength
The results for the variations in compressive strength after F–T tests are illustrated in
Figure 8. After frost damage, the compressive strength of RAPC decreases with an increase in F–T cycles under different media, and the compressive strength of the concrete specimens in sodium chloride solution was reduced more than that in water. At the beginning stage of the F–T cycle (0~20 cycles), the difference in compressive strength under different F–T media varies little. With an increase in F–T cycles (20~50 cycles), the loss rate of specimens in the NaCl solution increases gradually. After 50 F–T cycles, the compressive strength of RAPC specimens in the NaCl solution and water were 23.2 MPa and 24.7 MPa, respectively. Over 50~75 F–T cycles, the difference in the compressive strength in water and in the 3.5 wt% NaCl solution was larger. After 100 cycles, the compressive strength of the RAPC in the sodium chloride solution decreased about 1.69 times more than that in water, which indicates that the frost damage to the RAPC is more serious under a chloride environment.
Figure 9 shows the uniaxial compression failure mode of the RAPC cubic specimen after frost damage. From
Figure 9, it can be seen that multiple cracks appeared on the surface of the cubic specimen under axial loading.
There are two main reasons for the resulting decline in the compressive strength of the RAPC. One reason is the failure of bond-slip between the aggregate and the cement mortar of the RAPC. As there is a small amount of sand in the RAPC, the action of encapsulation of the cement mortar on the aggregate is relatively week, as is the interface transition zone (ITZ). From the existing literature, it is known that ITZ has a higher porosity and a lower elastic modulus and mechanical properties than mortar [
35,
36], and ITZ is crucial to the macroscopic properties of RAPC. Moreover, the particle size of the coarse aggregate is about 5~20mm, and the bonding points between aggregate and cement mortar are relatively fewer. Therefore, the interface of the aggregate and mortar will inevitably be damaged first under the action of an external load.
3.4. Continuous Void Rate, Permeability Coefficient
Figure 10 demonstrates the relationship between the continuous void rate and the permeability coefficient with F–T cycles in water. From this figure, it can be concluded that the continuous void rate and the permeability coefficient of the RAPC tended to increase with an increasing number of F–T cycles, indicating that pore structure deterioration inside the specimens gradually becomes larger after frost damage. This can be explained by the following reasons: under the combined action of periodic hydrostatic pressure and frost heave force, the bond surfaces between aggregate and cement paste will crack. Furthermore, the recycled coarse aggregate after mechanical crushing contains many micro cracks, its shape and angles are mostly non-uniform, and its surface adheres to a thin layer of old cement mortar, resulting in its higher water absorption. Therefore, the bond surface between the aggregate and cement paste will crack first. With an increasing number of F–T cycles, the cracks develop, connect, and finally form macro cracks. Accordingly, the continuous void rate and permeability coefficient increase.
3.5. CT Scanning Images and Pore Characteristic
The CT images can be used to visually reflect the pore deterioration of the specimen before and after frost damage using MIMICS software and image analysis. According to the difference in the physical density of the constituent materials, the threshold segmentation method was used to extract each phase material. Here, the threshold range of the aggregate is set at 2562~3071 Hu, and the threshold of cementitious slurry is set at 1905~2561 Hu. The 3D images of the RAPC reconstructed with MIMICS are shown in
Figure 11.
In order to better identify the 2D planar porosity distribution inside the pervious concrete specimen, the images obtained from the CT scans were processed using MATLAB software to form black-and-white binary images [
37] based on the Otsu threshold segmentation method, which is shown in
Figure 12. In this figure, the distribution of aggregates, cement mortars and pore structures can be seen more intuitively. The white area in the figure indicates the aggregate and cement paste of the RAPC, the black area indicates the pores between the aggregates, and the porosity can be obtained by statistically analyzing the area occupied by the black pores.
Figure 13 lists the porosity distribution of 40 two-dimension CT scanning section images of the RAPC cube specimen varying with F–T cycles. It is observed that the porosity of the specimen section increases gradually with an increasing number of F–T cycles under these two media. Additionally, the porosity growth trend of the concrete specimens in the NaCl solution is generally greater than that in water at the same cycles, which is consistent with the law obtained above.
In order to further analyze the change rule in pore size after different freezing and thawing cycles, Image-Pro Plus 6.0 software was used to analyze the CT scanning images of the RAPC after banalization.
Figure 14a–e depict a histogram of the aperture frequency and the fitted normal distribution curve of the pore size, respectively. It can be observed that the average pore size of the RAPC gradually increases with the increase in F–T cycles, the peak value gradually moves to the right, and the corresponding normal distribution curve gradually becomes flat. In addition, the ratio of large pores gradually increases. This means that during the process of F–T cycles, some of the small pores gradually deteriorate into large pores, resulting in an increase in the number of connected pores.
Figure 14f shows the change curve of the average pore size of the RAPC in water with the number of F–T cycles. As is exhibited in this figure, after 60 F–T cycles, the deterioration rate of the pore size is accelerated, and the macroscopic performance shows that the permeability coefficient and continuous void rate increase, and the mechanical properties are reduced.
Figure 15 shows that the compressive strength and porosity of the CT scanning varies with the average pore size after frost damage. It can be seen that the compressive strength of the RAPC gradually decreases with the increase in the average pore size, and there is a negative correlation between them. However, the porosity obtained by the CT scanning section increases with an increasing average pore size. This is attributed to the following reasons: the essence of RAPC frost damage is the process of micro-crack initiation, expansion and penetration between the aggregate bonding surfaces [
38]. A larger average pore size of the CT scanning section means more severe pore connectivity, which eventually leads to a reduction in compressive strength.
4. Freeze–Thaw Damage Model of RAPC
During the process of F–T cycles, the temperature in the concrete alternates positively and negatively, resulting in the F–T of the internal moisture of the RAPC. When the temperature in the concrete is below zero, the water in the pores freezes and its volume expands, which leads to the pore wall being subjected to hydrostatic pressure. When the temperature rises above the freezing point, the ice in the pores melts, and the hydrostatic pressure unloads. Consequently, the damage to the RAPC is due to the fatigue damage accumulation caused by the action of both the internal frost heave force and the osmotic pressure [
35]. However, frost damage to the concrete has its own characteristics compared with fatigue damage. Because of the heterogeneity of concrete components, such as the random distribution of pores and micro-cracks, probabilistic damage models (such as Weibull distribution or lognormal distribution) provide a new method for characterizing the uncertainty of material parameters.
In this work, a two-parameter Weibull distribution model was employed to quantify the frost deterioration of the RAPC under F–T actions. The probability density function of RAPC is expressed as:
where
α is the scale parameter and
β > 0 represents the shape parameter, respectively.
N represents the number of F–T cycles.
The failure probability of RAPC under different F–T media is as follows:
The failure probability function of the Weibull distribution is incremental, which indicates that the failure probability increases with the increase in F–T cycles. The concrete specimen is intact initially, and the failure probability is 0. After the specimen is fully damaged, the failure probability is equal to 1. The failure probability and damage to the concrete are both cumulative with an increasing number of F–T cycles.
Based on damage mechanics theory [
39], the damage accumulation degree of concrete specimens under different F–T cycles can be presented by the deterioration law of RDEM. The probabilistic damage variable of RAPC is given as:
where
E0 and
En are the dynamic elasticity of the modulus before and after tests, respectively.
By comparing (4) and (5), it can be deduced that the RDEM deterioration law of concrete specimens is the same as the Weibull failure probability function. With the increase in F–T cycles, both the degree of damage to and the probability of failure of the concrete increase gradually. Therefore, the deterioration degree is equivalent to failure probability. The evolution equation of frost damage to the RAPC based on the Weibull probability distribution model is established as follows:
The failure probability function of the RAPC can be calculated by the damage degree of the RDEM of the specimens.
Figure 16 shows the evolution curve of frost damage based on the Weibull probability distribution function by fitting parameters. It can be seen that the deterioration law of RAPC is basically similar under different F–T media; however, the degree of damage deterioration is different. Further research indicates that the damage degradation to the RAPC specimen is very close at the beginning of the F–T cycles (0~20 cycles) under different media. With the increase in F–T cycles, the difference between them gradually increases. It can be seen that the deterioration degree of the RAPC in NaCl solution decreases about 1.46 times as much as in water after 80 F–T cycles, which indicates that the frost damage to the RAPC is more serious under a chloride environment.
Figure 17 summarizes the relationship among the porosity, compressive strength and damage degree of the RAPC under different F–T media. From
Figure 17, it can be observed that the porosity increased, and the compressive strength decreased with the increase in frost damage.
5. Analysis of RAPC Damage Mechanism
The ITZs between the aggregates and the cement paste are the essential factor that affects the mechanical properties and durability of the RAPC [
36]. There are two failure mechanisms (see
Figure 18a) of PC subjected to F–T cycles [
40]. One is that the micro cracks are generated from tiny pores of cement paste, and they expand. The other is that the micro cracks expand among ITZs of different material components. Moreover, RAPC is composed of NCA, partially RCA, cement mortar and an interconnected pore system. The external load in RAPC is transmitted mainly through the occlusal force between the aggregate and the cement paste. As the micro cracks of RCAs are produced during mechanical crushing, the initial micro cracks are fulfilled with moisture under the action of F–T cycles. Therefore, the micro cracks negatively affect the durability of the RAPC.
Figure 18 shows the frost damage to the RAPC.
The rate of F–T deterioration of the RAPC in salt solution is greater than in water, which can be explained by two different damage mechanisms: the former is due to the fact that when 3.5 wt% NaCl solution is used as the F–T medium, the tensile stress inside the cement paste increases due to the difference in osmotic pressure and concentration. The surface of the cement mortar starts to crack when the tensile stress reaches the tensile strength of cement mortar. Moreover, the Cl
- in the salt solution reacts with the tricalcium aluminate (C
3A) in the cement stone to produce Friedel’s salt (3CaO·Al
2O
3·CaCl
2·10H
2O) [
41,
42]. The expansion pressure generated by the Friedel’s salt crystals leads to cracks developing gradually in the ITZ among new paste, old cement mortars and aggregates. Consequently, the surface of the cement mortar is damaged (see
Figure 18b,c).
For another reason, the volume expansion rate increases after NaCl transforming to crystalline hydrate NaCl·2H
2O, eventually causing the cement paste to crack and the bonding ability to decrease [
43]. In addition, the iced 3.5 wt% NaCl solution needs to absorb more heat from the surroundings when it melts, resulting in a greater temperature gradient difference between the inside and the outside of the cement paste, which causes more severe frost damage to the RAPC.
In addition, there is also a very serious impact on the mechanical properties and durability of concrete exposed to an acidic attack and an alkaline environment. The main reason for the poor acid resistance of Portland cement concrete is due to the fact that its internal chemical composition includes high calcium compounds [
44]. The results in the literature [
44,
45] all show that the mechanical properties and durability of concrete can be improved and enhanced by adding fly ash and silica fume in acidic environments.
In general, cement-based materials have better durability in an alkaline environment. However, concrete may be exposed to a high alkali environment, and alkaline solutions can cause further expansion of microcracks and even penetration into the cement matrix, which can lead to changes in the microstructure of cementitious materials and can eventually cause deterioration of the material properties [
46,
47,
48]. Therefore, the durability of cement-based materials must first be estimated before the cement can be used in actual field conditions.
6. Conclusions
In this work, the influence of the water–binder ratio, design porosity, SF and EA on the permeability and mechanical properties of RAPC were evaluated using an orthogonal design method. The evolution law of mechanical properties, pore size distribution and frost resistance durability of RAPC under different F–T media were investigated based on the optimal mix ratio. The specific conclusions are as follows.
The optimal mix ratio of RAPC is determined by the orthogonal test. The test results show that the water–binder ratio, the content of micro SF and EA have the greatest influence on the compressive strength, and the design porosity influences the continuous void rate and permeability the most.
Whether in water or in chloride medium, the mass loss rate of RAPC changes less during the overall process of F–T tests. Therefore, the mass loss rate is not a suitable index for evaluating the anti-frost durability of RAPC.
Under different F–T media, the deterioration degree of RDEM, compressive strength, continuous void rate and permeability coefficient of the RAPC increase with the increase in F–T cycles. At the end of 100 cycles, the compressive strength of the RAPC in NaCl solution decreases by about 1.69 times that in water. In addition, the deterioration in the NaCl solution is generally greater than in water, indicating that the frost damage to the RAPC is more likely occurring in a chloride environment.
The pore structure degradation of the RAPC after F–T cycles can be well observed using the CT technique. It can be seen that the internal pore size distribution of RAPC specimens obeys normal distribution before and after F–T cycles. With the increase in the number of F–T cycles, the average pore size of the RAPC gradually increases. In addition, the peak value of the normal distribution curve of pore size shifts to the right gradually, and the curve gradually becomes flat. After 60 F–T cycles, the pore size degradation rate accelerates.
Based on probability and damage theory, the evolution equations of the RAPC under different F–T media are established. These functions are proved to fit well with the test results.
The results obtained can provide an experimental reference and data support for the promotion and application of RAPC pavement in severely cold regions.
Author Contributions
Conceptualization, C.C. and K.Z.; methodology, C.C. and K.Z.; resources, Z.Y.; data curation, C.C. and K.Z.; writing—original draft preparation, C.C. and K.Z.; writing—review and editing, Z.Y. and J.Z.; supervision, J.Z. and Z.Y. All authors have read and agreed to the published version of the manuscript.
Funding
The study was financially supported by the Key Research and Development Program of Science and Technology Department of Jilin Province (grant no. 20210203141SF, grant no. 20220508146RC).
Data Availability Statement
Data are contained within the article.
Acknowledgments
This study was funded by Key Research and Development Program of Science and Technology department of Jilin Province (research on key technologies of ecological nano-photocatalytic recycled pervious concrete in cold regions, study on the key technologies of preparation of concrete for irrigation district drainage channels with water purification function). The authors gratefully acknowledge the financial support.
Conflicts of Interest
The authors declare no conflict of interest.
References
- Qaidi, S.; Najm, H.M.; Abed, S.M.; Özkılıç, Y.O.; Al Dughaishi, H.; Alosta, M.; Sabri, M.M.S.; Alkhatib, F.; Milad, A. Concrete Containing Waste Glass as an Environmentally Friendly Aggregate: A Review on Fresh and Mechanical Characteristics. Materials 2022, 15, 622. [Google Scholar] [CrossRef] [PubMed]
- Çelik, A.I.; Özkılıç, Y.O.; Zeybek, Ö.; Özdöner, N.; Tayeh, B.A. Performance Assessment of Fiber-Reinforced Concrete Produced with Waste Lathe Fibers. Sustainability 2022, 14, 11817. [Google Scholar] [CrossRef]
- Aksoylu, C.; Özkılıç, Y.O.; Hadzima-Nyarko, M.; Işık, E.; Arslan, M.H. Investigation on Improvement in Shear Performance of Reinforced-Concrete Beams Produced with Recycled Steel Wires from Waste Tires. Sustainability 2022, 14, 13360. [Google Scholar] [CrossRef]
- Li, T.; Xiao, J.; Zhu, C.; Zhong, Z. Experimental study on mechanical behaviors of concrete with large-size recycled coarse aggregate. Constr. Build. Mater. 2016, 120, 321–328. [Google Scholar] [CrossRef]
- Bravo, M.; Duarte, A.; De Brito, J.; Evangelista, L.; Pedro, D. On the Development of a Technical Specification for the Use of Fine Recycled Aggregates from Construction and Demolition Waste in Concrete Production. Materials 2020, 13, 4228. [Google Scholar] [CrossRef]
- Cantero, B.; del Bosque, I.S.; Matías, A.; de Rojas, M.S.; Medina, C. Inclusion of construction and demolition waste as a coarse aggregate and a cement addition in structural concrete design. Arch. Civ. Mech. Eng. 2019, 19, 1338–1352. [Google Scholar] [CrossRef]
- Polo-Mendoza, R.; Peñabaena-Niebles, R.; Giustozzi, F.; Martinez-Arguelles, G. Eco-friendly design of Warm mix asphalt (WMA) with recycled concrete aggregate (RCA): A case study from a developing country. Constr. Build. Mater. 2022, 326, 126890. [Google Scholar] [CrossRef]
- Zeybek, Ö.; Özkılıç, Y.O.; Karalar, M.; Çelik, A.I.; Qaidi, S.; Ahmad, J.; Burduhos-Nergis, D.D.; Burduhos-Nergis, D.P. Influence of Replacing Cement with Waste Glass on Mechanical Properties of Concrete. Materials 2022, 15, 7513. [Google Scholar] [CrossRef]
- Karalar, M.; Bilir, T.; Çavuşlu, M.; Özkiliç, Y.O.; Sabri, M.M.S. Use of recycled coal bottom ash in reinforced concrete beams as replacement for aggregate. Front. Mater. 2022, 9, 1064604. [Google Scholar] [CrossRef]
- Basaran, B.; Kalkan, I.; Aksoylu, C.; Özkılıç, Y.O.; Sabri, M.M.S. Effects of Waste Powder, Fine and Coarse Marble Aggregates on Concrete Compressive Strength. Sustainability 2022, 14, 14388. [Google Scholar] [CrossRef]
- Abdulwahid, M.Y. Influences of different stone powders on pervious concrete strength. Struct. Concr. 2020, 22, 1–7. [Google Scholar] [CrossRef]
- Delatte, N.; Mrkajic, A.; Miller, D.I. Field and Laboratory Evaluation of Pervious Concrete Pavements. Transp. Res. Rec. J. Transp. Res. Board 2009, 2113, 132–139. [Google Scholar] [CrossRef]
- Zaetang, Y.; Sata, V.; Wongsa, A.; Chindaprasirt, P. Properties of pervious concrete containing recycled concrete block aggregate and recycled concrete aggregate. Constr. Build. Mater. 2016, 111, 15–21. [Google Scholar] [CrossRef]
- Adamu, M.; Ayeni, K.O.; Haruna, S.I.; Mansour, Y.E.-H.I.; Haruna, S. Durability performance of pervious concrete containing rice husk ash and calcium carbide: A response surface methodology approach. Case Stud. Constr. Mater. 2021, 14, e00547. [Google Scholar] [CrossRef]
- Sherwani, A.F.H.; Faraj, R.; Younis, K.H.; Daraei, A. Strength, abrasion resistance and permeability of artificial fly-ash aggregate pervious concrete. Case Stud. Constr. Mater. 2021, 14, e00502. [Google Scholar] [CrossRef]
- Tennis, P.D.; Leming, M.; Akers, D. Pervious Concrete Pavements, Portland Cement Association; Illinois, and National Ready Mixed Concrete Association: Silver Spring, MD, USA, 2004; pp. 1–16. [Google Scholar]
- ACI (American Concrete Institute). ACI 522R-10: Report on Pervious Concrete; American Concrete Institute: Farmington Hills, MI, USA, 2010; pp. 1–40. [Google Scholar]
- Yang, J.; Jiang, G. Experimental study on properties of pervious concrete pavement materials. Cem. Concr. Res. 2003, 33, 381–386. [Google Scholar] [CrossRef]
- Liu, R.; Chi, Y.; Jiang, Q.; Meng, X.; Wu, K.; Li, S. Physical and mechanical properties of pervious concrete with multi-admixtures. Mag. Concr. Res. 2021, 73, 448–463. [Google Scholar] [CrossRef]
- Strieder, H.L.; Dutra, V.F.P.; Graeff, Â.G.; Núñez, W.P.; Merten, F.R.M. Performance evaluation of pervious concrete pavements with recycled concrete aggregate. Constr. Build. Mater. 2021, 315, 125384. [Google Scholar] [CrossRef]
- Güneyisi, E.; Gesoglu, M.; Kareem, Q.; Ipek, S. Effect of different substitution of natural aggregate by recycled aggregate on performance characteristics of pervious concrete. Mater. Struct. 2014, 49, 521–536. [Google Scholar] [CrossRef]
- Aliabdo, A.A.; Elmoaty, A.E.M.A.; Fawzy, A.M. Experimental investigation on permeability indices and strength of modified pervious concrete with recycled concrete aggregate. Constr. Build. Mater. 2018, 193, 105–127. [Google Scholar] [CrossRef]
- Lima, G.T.D.S.; Rocha, J.C.; Cheriaf, M. Investigation of the properties of pervious concrete with a recycled aggregate designed with a new combination of admixture. Constr. Build. Mater. 2022, 340, 127710. [Google Scholar] [CrossRef]
- Joshaghani, A.; Ramezanianpour, A.A.; Ataei, O.; Golroo, A. Optimizing pervious concrete pavement mixture design by using the Taguchi method. Constr. Build. Mater. 2015, 101, 317–325. [Google Scholar] [CrossRef]
- Zhang, Q.; Feng, X.; Chen, X.; Lu, K. Mix design for recycled aggregate pervious concrete based on response surface methodology. Constr. Build. Mater. 2020, 259, 119776. [Google Scholar] [CrossRef]
- Liu, R.; Chi, Y.; Chen, S.; Jiang, Q.; Meng, X.; Wu, K.; Li, S. Influence of Pore Structure Characteristics on the Mechanical and Durability Behavior of Pervious Concrete Material Based on Image Analysis. Int. J. Concr. Struct. Mater. 2020, 14, 29. [Google Scholar] [CrossRef]
- Akand, L.; Yang, M.; Gao, Z. Characterization of pervious concrete through image based micromechanical modeling. Constr. Build. Mater. 2016, 114, 547–555. [Google Scholar] [CrossRef]
- CJJ/T 253-2016; Technical Specification for Application of Pervious Recycled Aggregate Concrete. China Architecture and Building Press: Beijing, China, 2016.
- Wang, L.; Jin, M.M.; Guo, F.X.; Wang, Y.; Tang, S.W. Pore Structural and Fractal Analysis of the Influence of FLY ASH and Silica Fume on the Mechanical Property and Abrasion Resistance of Concrete. Fractals 2021, 29, 2140003. [Google Scholar] [CrossRef]
- GT/B 50081-2019; Standard for Test Method of Concrete Physical and Mechanical Properties. China Architecture and Building Press: Beijing, China, 2019.
- GT/B 50082-2009; Standard for Test Methods of Long-Term Performance and Durability of Ordinary Concrete. China Architecture and Building Press: Beijing, China, 2009.
- ASTM-C666/C666M-15; American Society for Testing and Materials. Standard Test Method for Resistance of Concrete to Rapid Freezing and Thawing. American Society for Testing and Materials: Philadelphia, PA, USA, 2015.
- Li, X.; Hao, J. Orthogonal test design for optimization of synthesis of super early strength anchoring material. Constr. Build. Mater. 2018, 181, 42–48. [Google Scholar] [CrossRef]
- Zhang, K.; Zhou, J.; Yin, Z. Experimental Study on Mechanical Properties and Pore Structure Deterioration of Concrete under Freeze–Thaw Cycles. Materials 2021, 14, 6568. [Google Scholar] [CrossRef] [PubMed]
- Akçaoğlu, T.; Tokyay, M.; Çelik, T. Assessing the ITZ microcracking via scanning electron microscope and its effect on the failure behavior of concrete. Cem. Concr. Res. 2005, 35, 358–363. [Google Scholar] [CrossRef]
- Liu, T.; Wang, Z.; Zou, D.; Zhou, A.; Du, J. Strength enhancement of recycled aggregate pervious concrete using a cement paste redistribution method. Cem. Concr. Res. 2019, 122, 72–82. [Google Scholar] [CrossRef]
- Meulenyzer, S.; Stora, E.; Perez, F. Impact of Pervious Concrete Porosity on Permeability by 3D Image Analysis; ASTM International: West Conshohocken, PA, USA, 2012. [Google Scholar] [CrossRef]
- Taheri, B.M.; Ramezanianpour, A.M.; Sabokpa, S.; Gapele, M. Experimental evaluation of freeze-thaw durability of pervious concrete. J. Build. Eng. 2020, 33, 101617. [Google Scholar] [CrossRef]
- Chen, F.; Qiao, P. Probabilistic damage modeling and service-life prediction of concrete under freeze–thaw action. Mater. Struct. 2014, 48, 2697–2711. [Google Scholar] [CrossRef]
- Zhong, R.; Wille, K. Influence of matrix and pore system characteristics on the durability of pervious concrete. Constr. Build. Mater. 2018, 162, 132–1411. [Google Scholar] [CrossRef]
- Valenza, J.J.; Scherer, G.W. A review of salt scaling: I. Phenomenology. Cem. Concr. Res. 2007, 37, 1007–1021. [Google Scholar] [CrossRef]
- Valenza, J.J.; Scherer, G.W. A review of salt scaling: II. Mechanisms. Cem. Concr. Res. 2007, 37, 1022–1034. [Google Scholar] [CrossRef]
- Zeng, Q.; Fen-Chong, T.; Li, K. Freezing behavior of cement pastes saturated with NaCl solution. Constr. Build. Mater. 2014, 59, 99–110. [Google Scholar] [CrossRef]
- Tripathi, D.; Kumar, R.; Mehta, P.K.; Singh, A. Silica fume mixed concrete in acidic environment. Mater. Today: Proc. 2020, 27, 1001–1005. [Google Scholar] [CrossRef]
- Barbhuiya, S.; Kumala, D. Behaviour of a Sustainable Concrete in Acidic Environment. Sustainability 2017, 9, 1556. [Google Scholar] [CrossRef] [Green Version]
- Şahmaran, M.; Li, V.C. Durability of mechanically loaded engineered cementitious composites under highly alkaline environments. Cem. Concr. Compos. 2008, 30, 72–81. [Google Scholar] [CrossRef]
- Yi, Y.; Zhu, D.; Guo, S.; Zhang, Z.; Shi, C. A review on the deterioration and approaches to enhance the durability of concrete in the marine environment. Cem. Concr. Compos. 2020, 113, 103695. [Google Scholar] [CrossRef]
- Li, Y.; Zhang, J.; He, Y.; Huang, G.; Li, J.; Niu, Z.; Gao, B. A review on durability of basalt fiber reinforced concrete. Compos. Sci. Technol. 2022, 225, 109519. [Google Scholar] [CrossRef]
Figure 1.
Flow chart for RCA preparation.
Figure 1.
Flow chart for RCA preparation.
Figure 2.
Particle size distributions of aggregate.
Figure 2.
Particle size distributions of aggregate.
Figure 3.
Preparation of RAPC.
Figure 3.
Preparation of RAPC.
Figure 4.
Apparatus of permeability coefficient test: (a) schematic diagram of the test device and (b) laboratory test.
Figure 4.
Apparatus of permeability coefficient test: (a) schematic diagram of the test device and (b) laboratory test.
Figure 5.
Sketch of F−T test apparatus and temperature change curve: (a) sketch of rapid freezing−thawing cabinet, (b) temperature change curve and (c) dynamic modulus of elasticity testing device.
Figure 5.
Sketch of F−T test apparatus and temperature change curve: (a) sketch of rapid freezing−thawing cabinet, (b) temperature change curve and (c) dynamic modulus of elasticity testing device.
Figure 6.
CT scanning images of RAPC.
Figure 6.
CT scanning images of RAPC.
Figure 7.
Influence of F–T cycles on mass loss rate and RDEM under different media: (a) mass loss rate and (b) RDEM.
Figure 7.
Influence of F–T cycles on mass loss rate and RDEM under different media: (a) mass loss rate and (b) RDEM.
Figure 8.
Relationship between compressive strength and F–T cycles.
Figure 8.
Relationship between compressive strength and F–T cycles.
Figure 9.
Failure patterns of RAPC specimen.
Figure 9.
Failure patterns of RAPC specimen.
Figure 10.
Change in continuous void rate and permeability coefficient with F–T cycles.
Figure 10.
Change in continuous void rate and permeability coefficient with F–T cycles.
Figure 11.
Three-dimensional images reconstructed with MIMICS: (a) aggregate, (b) cement mortar and (c) 3D RAPC.
Figure 11.
Three-dimensional images reconstructed with MIMICS: (a) aggregate, (b) cement mortar and (c) 3D RAPC.
Figure 12.
CT scanning image of RAPC specimens in water after F–T cycles: (a) 20 cycles, (b) 40 cycles, (c) 60 cycles, (d) 80 cycles, (e) 100 cycles and (f) average pore size.
Figure 12.
CT scanning image of RAPC specimens in water after F–T cycles: (a) 20 cycles, (b) 40 cycles, (c) 60 cycles, (d) 80 cycles, (e) 100 cycles and (f) average pore size.
Figure 13.
Porosity distribution in the RAPC under different media: (a) water and (b) 3.5 wt% Nacl solution.
Figure 13.
Porosity distribution in the RAPC under different media: (a) water and (b) 3.5 wt% Nacl solution.
Figure 14.
Pore size distribution and average pore size under water medium: (a) 20 cycles, (b) 40 cycles, (c) 60 cycles, (d) 80 cycles, (e) 100 cycles and (f) average pore size.
Figure 14.
Pore size distribution and average pore size under water medium: (a) 20 cycles, (b) 40 cycles, (c) 60 cycles, (d) 80 cycles, (e) 100 cycles and (f) average pore size.
Figure 15.
The change in compressive strength and porosity with average pore size: (a) compressive strength and (b) porosity of CT scanning.
Figure 15.
The change in compressive strength and porosity with average pore size: (a) compressive strength and (b) porosity of CT scanning.
Figure 16.
Relationship between damage degree and F–T cycles under different conditions.
Figure 16.
Relationship between damage degree and F–T cycles under different conditions.
Figure 17.
Change in porosity and compressive strength with damage degree under different conditions.
Figure 17.
Change in porosity and compressive strength with damage degree under different conditions.
Figure 18.
Frost damage assumption and cracks in cement mortar of RAPC: (a) frost damage assumption of RAPC, (b) crack in cement mortar and (c) part of the aggregate crack.
Figure 18.
Frost damage assumption and cracks in cement mortar of RAPC: (a) frost damage assumption of RAPC, (b) crack in cement mortar and (c) part of the aggregate crack.
Table 1.
Chemical position and basic physical properties of cement (in mass fraction).
Table 1.
Chemical position and basic physical properties of cement (in mass fraction).
| CaO (%) | SiO2 (%) | Al2O3 (%) | Fe2O3 (%) | MgO (%) | SO3 (%) | K2O+Na2O (%) |
|---|
| 58.09 | 21.76 | 6.23 | 3.24 | 1.32 | 2.14 | 1.16 |
Table 2.
Basic properties of coarse aggregates.
Table 2.
Basic properties of coarse aggregates.
| Type of Coarse Aggregate | Apparent Density (kg/m3) | Water Absorption (%) | Crushing Index (%) |
|---|
| RCA | 2650 | 5.3 | 16.8 |
| NCA | 2710 | 0.5 | 5.4 |
Table 3.
Chemical compositions of micro silica fume (SF).
Table 3.
Chemical compositions of micro silica fume (SF).
| SiO2(%) | Moisture Content (%) | Specific Surface Area (m2/g) | Loss on Ignition (%) | 45 μm Sieving Residue (%) | Density (kg/m3) | pH |
|---|
| 94.35 | 0.43 | 23 | 1.1 | 1.50 | 200~800 | 6.6 |
Table 4.
Chemical compositions and specific indicators of enhancer agent (EA).
Table 4.
Chemical compositions and specific indicators of enhancer agent (EA).
| SiO2 (%) | Moisture Content (%) | CaO (%) | Alkali Content (%) | Na2SO4 (%) | pH |
|---|
| 94.35 | 3.17 | 0.92 | 6.46 | 4.83 | 10.26 |
Table 5.
Physical properties of FDN superplasticizer.
Table 5.
Physical properties of FDN superplasticizer.
| Solids Content (%) | Fineness (%) | Water Reducing Rate (%) | Na2SO4 (%) | Surface Tension (N/m) | pH |
|---|
| 91.51 | 0.014 | 21 | 3.2 | 72.6 | 8.19 |
Table 6.
Orthogonal factors and levels of RAPC.
Table 6.
Orthogonal factors and levels of RAPC.
| Levels | Factors |
|---|
Water–Binder Ratio
A | Design Porosity (%)
B | Content of SF (%)
C | Content of EA (%)
D |
|---|
| 1 | 0.28 | 15 | 0 | 0 |
| 2 | 0.31 | 18 | 4 | 2 |
| 3 | 0.34 | 21 | 8 | 4 |
Table 7.
Mixture proportion of RAPC units: kg/m3.
Table 7.
Mixture proportion of RAPC units: kg/m3.
| Group | Coarse Aggregate | Sand | Cement | SF | EA | FDN | Water |
|---|
| RAPC-1 | 1460.6 | 127.0 | 425.3 | 0 | 0 | 4.25 | 94.09 |
| RAPC-2 | 1460.6 | 127.0 | 353.4 | 15.0 | 7.5 | 3.76 | 83.17 |
| RAPC-3 | 1460.6 | 127.0 | 287.4 | 26.1 | 13.1 | 3.27 | 72.25 |
| RAPC-4 | 1460.6 | 127.0 | 372.9 | 16.2 | 16.2 | 4.05 | 99.27 |
| RAPC-5 | 1460.6 | 127.0 | 329.6 | 28.7 | 0 | 3.58 | 87.75 |
| RAPC-6 | 1460.6 | 127.0 | 305.1 | 0 | 6.2 | 3.11 | 76.23 |
| RAPC-7 | 1460.6 | 127.0 | 348.4 | 31.0 | 7.7 | 3.87 | 103.99 |
| RAPC-8 | 1460.6 | 127.0 | 328.5 | 0 | 13.7 | 3.40 | 91.92 |
| RAPC-9 | 1460.6 | 127.0 | 285.4 | 12.0 | 0 | 3.00 | 79.85 |
Table 8.
Orthogonal test results of RAPC.
Table 8.
Orthogonal test results of RAPC.
| Group | Continuous Void Rate (%) | Permeability Coefficient (mm/s) | 28d Compressive Strength (MPa) |
|---|
| RAPC-1 | 19.8 | 2.8 | 14.5 |
| RAPC-2 | 21.4 | 3.3 | 10.3 |
| RAPC-3 | 23.6 | 3.7 | 12.5 |
| RAPC-4 | 20.4 | 3.0 | 27.1 |
| RAPC-5 | 21.5 | 3.4 | 15.6 |
| RAPC-6 | 25.7 | 4.3 | 13.4 |
| RAPC-7 | 18.5 | 2.3 | 24.4 |
| RAPC-8 | 19.4 | 2.9 | 16.3 |
| RAPC-9 | 25.8 | 3.7 | 16.0 |
Table 9.
Range analysis.
| Experimental Index | Factor | K1 | K2 | K3 | k1 = K1/3 | k2 = k2/3 | k3 = k3/3 | Range | Influence Degree |
|---|
| Continuous void porosity (%) | A | 64.8 | 67.6 | 63.7 | 21.60 | 22.53 | 21.23 | 1.3 | B > C > A > D |
| B | 58.7 | 62.3 | 75.1 | 19.57 | 20.77 | 25.03 | 5.47 |
| C | 67.9 | 67.6 | 63.6 | 22.63 | 22.53 | 21.20 | 1.43 |
| D | 67.1 | 65.6 | 63.4 | 22.37 | 21.87 | 21.13 | 1.23 |
| Permeability coefficient (mm/s) | A | 9.8 | 10.9 | 8.7 | 3.27 | 3.63 | 2.90 | 0.7 | B > A > D > C |
| B | 8.1 | 9.6 | 11.7 | 2.70 | 3.20 | 3.90 | 1.2 |
| C | 10.2 | 9.8 | 9.4 | 3.40 | 3.27 | 3.13 | 0.27 |
| D | 10.53 | 10.1 | 9.6 | 3.51 | 3.37 | 3.20 | 0.31 |
| 28d compressive strength (MPa) | A | 37.3 | 56.2 | 56.5 | 12.43 | 18.73 | 18.83 | 6.4 | B > A > D > C |
| B | 66 | 42.2 | 41.7 | 22.00 | 14.07 | 13.90 | 7.9 |
| C | 44.3 | 53.3 | 52.5 | 14.77 | 17.77 | 17.50 | 2.7 |
| D | 46 | 48.1 | 55.9 | 15.33 | 16.03 | 18.63 | 3.3 |
Table 10.
Optimal mix proportions of RAPC units: kg/m3.
Table 10.
Optimal mix proportions of RAPC units: kg/m3.
| NAC | RAC | Sand | Cement | SF | EA | FDN | Water |
|---|
| 1022.42 | 438.18 | 127.0 | 354 | 32.2 | 16.1 | 4.02 | 98.52 |
| Disclaimer/Publisher’s Note: The statements, opinions and data contained in all publications are solely those of the individual author(s) and contributor(s) and not of MDPI and/or the editor(s). MDPI and/or the editor(s) disclaim responsibility for any injury to people or property resulting from any ideas, methods, instructions or products referred to in the content. |
© 2023 by the authors. Licensee MDPI, Basel, Switzerland. This article is an open access article distributed under the terms and conditions of the Creative Commons Attribution (CC BY) license (https://creativecommons.org/licenses/by/4.0/).


