
The Floor Plan Design Method of Exhibition Halls in CGAN-Assisted Museum Architecture


Faculty of Humanities and Arts, Macau University of Science and Technology, Taipa, Macau, China
*
Authors to whom correspondence should be addressed.
†
These authors contributed equally to this work.
Buildings 2023, 13(3), 756; https://0-doi-org.brum.beds.ac.uk/10.3390/buildings13030756
Submission received: 7 February 2023
/
Revised: 12 March 2023
/
Accepted: 13 March 2023
/
Published: 14 March 2023
(This article belongs to the Collection Buildings, Infrastructure and SDGs 2030)
Abstract
:The floor plan designs of traditional museum exhibition halls are generally developed according to the position and streamlined accessibility of the exhibits. However, there are often many floors in the same building, and multi-story exhibition halls are similar, so architects often spend a large amount of time and energy designing floors individually. Thus, this paper proposes a conditional generative adversarial network (CGAN)-based method for designing the floor plans of museum exhibition halls, which can help architects to work more efficiently. In this study, the basic concepts and structures of CGAN are first introduced; then, the design and training process of the CGAN model used are described in detail, and the datasets and evaluation metrics adopted are briefly described. In the Results and Discussion sections, this paper presents an example of the generated floor plan design of a museum exhibition hall and evaluates and analyzes the floor plan design of a museum exhibition hall generated using the proposed method. Finally, this paper summarizes the advantages of the proposed method, but also notes its shortcomings. If the number of data sets is not sufficient, the scope of the application will be relatively small. For example, museums converted from certain historical buildings are not applicable. The research results show the following: (1) the method proposed in this paper takes advantage of the CGAN model and can generate a museum exhibition hall floor plan design with certain regularity according to the given conditions, rather than pure random generation. (2) This method can automatically generate a variety of plan designs for museum exhibition halls in different schemes, providing designers with more choices and flexibility. (3) This method can carry out design optimization through human–computer interaction, and iterative improvement can be carried out according to user needs and feedback, which improves the practicability of the design.
1. Introduction
1.1. Research Background: The Importance and Research Status of Floor Plan Design of Museum Exhibition Halls
Museum exhibition hall floor plan design is an important aspect of architectural environmental design. It not only affects the design of the museum’s architectural environmental space and the aesthetic effect of the exhibition hall, but it also has a direct impact on the presentation of the exhibition content and the visitor experience. Therefore, researching and perfecting the floor plan design methods of museum exhibition halls will help to improve the display effect of museum exhibition halls, enhance visitor satisfaction, and enhance museums’ cultural communication function. Displaying collections is a museum’s most important basic function, so the exhibition hall is the most important space opened to the outside world in the plan design. This space is the one with the closest distance to and the most frequent contact with the public. It undertakes the important tasks of preservation, display, and dissemination, telling stories and conveying information to visitors. The exhibition hall displays information in an orderly manner according to a certain classification method, and each display and combination has a high degree of fit with the information to be displayed. Different types of museums have different design methods, especially history museums, nature museums, and science and technology museums. There is also a common type of museum, which is a comprehensive museum. A history museum refers to a museum that provides history, news, cultural relic collections, cultural relic photos, and professional book introductions. A nature museum is an institution that collects, produces, and displays astronomical, geological, plant, animal, paleontological, and human specimens with historical significance for scientific research and cultural education. Finally, science and technology museums mainly display popular science knowledge through permanent and short-term exhibitions, participation, experience, interactive exhibits, and auxiliary display methods. Comprehensive museums include all of the above three exhibits, and their different exhibition halls have different themes. The design methods of these four types of museums are completely different. Although the information displayed and the materials presented are very different, the common point is based on the “streamlined narrative.” When designers design museums, their first consideration is narrative flow, so that there are exhibition paths and connections between exhibition halls. The form in which exhibits are displayed is a central criterion in the design of museum spaces. In the 20th century, museums became more than just places to show and store collections; they became cultural centers. People are starting to see museums’ architecture as part of the museum experience beyond the galleries, including the restaurants, shops, theaters, conference rooms, and research areas. Therefore, circulation planning is also at the core of the architectural design of these multi-functional museums. Everything inside the showroom space needs to be carefully designed [1,2].
1.2. Literature Review
At present, there is a growing interest in floor plan design for museums. Traditional floor plan design methods usually rely on the expertise and experience of architects, but this method is prone to bias and is inefficient during the design process. For example, every time a design is produced, it is necessary to extensively read background material to become familiar with the designed site, and it is also necessary to imagine each space individually. These tasks are tedious and repetitive. In the design of the same kind of museum exhibition halls, the architects who undertake the project may also vary due to the different project locations, and their different experiences. The level of design that ultimately leads to implementation is also different [3,4,5]. In order to improve design efficiency and accuracy, in recent years many scholars have proposed artificial-intelligence-based floor plan design methods for museum exhibition halls [6]. Among them, methods based on conditional generative adversarial networks (CGAN) have received extensive attention [7]. By imitating architects’ way of thinking, the CGAN model generates new floor plan design schemes on the basis of training data, which not only improves design efficiency, but also avoids architects’ deviations [8]. CGAN is a machine learning model for generating synthetic images that is capable of generating images similar to training data based on given conditions [9,10]. It approaches design from different angles, such as building facade generation [11], building volume generation [12], building floor plan optimizations [13], street view quality assessments [14], street view image generation [15], and architectural style migration [16]. All of these applications can greatly improve the efficiency of building assessment and building design. However, the application of CGAN to the floor plan design of buildings is still being explored, and the existing results are mostly applied to the design of residential buildings; for example, layout generation of the floor plan of an ordinary bungalow or layout generation of the floor plan of an apartment house [17,18,19,20]. However, museum buildings are different from ordinary residences. They must not only meet the exhibition needs of exhibits, but also satisfy the experience of people visiting to the greatest extent. According to its function, the building can be divided into exhibition space, storage space, public space, and office space [21,22]. At the same time, it has different requirements for the environmental conditions, such as lighting and temperature [23,24]. In addition, machine learning is good at finding patterns and drawing conclusions. In the past few years, some researchers used machine learning to speed up the process of finding the main floor plan sunlight patterns in buildings so they can choose the dimensionality reduction method that gives the most accurate picture of how the sunlight is spread [25]. There is also the application of machine learning to predict satisfaction from simulated images, a new tool for satisfaction assessment of window views in the early design of residential buildings [26], and identifying stress patterns in buildings using unsupervised machine learning algorithms [27]. All of these provide new research ideas for artificial intelligence in the field of construction science. In the floor plan design of museum exhibition halls, there is still plenty of room for further research. For example, CGAN can be used to generate floor plan designs of different exhibition halls so that designers can generate multiple design schemes according to different exhibition hall themes. The application of CGAN can greatly improve design efficiency. For example, for an exhibition hall focusing on history, CGAN can generate corresponding floor plan design drawings based on pictures of historical themes and training data so that designers can provide more design options according to different exhibition hall themes. In addition, CGAN can also be used to generate floor plan design drawings of different styles to meet the needs of different customers. For example, for a technology exhibition hall, CGAN can generate a variety of styles of floor plan design drawings, including a modern style, minimalist style, etc., based on technology-themed pictures and different styles of training data.
1.3. Problem Statement and Objectives
This study mainly examines the exhibition halls of comprehensive museums. The display content of this kind of museum covers a wide range of subjects. Throughout only one museum, one can quickly and roughly understand the natural and social history of a city and even see its development through cultural relics. In China, such museums are usually funded and managed by the government. Generally, there is a comprehensive museum in a local city, and some cities will build new exhibition halls as the collection increases. The museum condenses the history and cultural artifacts of a city. Therefore, comprehensive museums have more types of collections than other types of museums. The form, size, and storage conditions of collections determine the way they are displayed. The layout, planning, and design of this type of museum are representative.
In the past, architects relied on many design practices and finally created some rules for the floor plan design of museum exhibition halls. The same goes for artificial intelligence. CGAN, as a fast and efficient design assistance method, is a brand-new way to design the layout, which is completely based on the design results for simulation-generated learning. In exhibition buildings, the arrangement of collections has relatively high requirements for the architectural environment, but their plans also have similar rules. Using machine learning to assist in the rapid design of museum exhibition spaces can effectively improve architects’ efficiency. After collecting a variety of museum floor plans as raw data, more sorting and model training were performed to derive the four research questions below:
- (1)
- What are the characteristics of the museum building’s floor plan design and how are the functions partitioned?
- (2)
- What effect can CGAN achieve on its training?
- (3)
- What will happen to the museum’s exhibition hall floor plan after the training is completed and machine learning has been used?
- (4)
- What is the difference between the AI design and the architect’s subjective design?
2. Methods and Museum Situation Analysis
2.1. Research Methods and Process
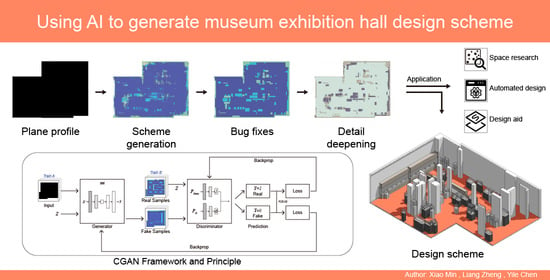
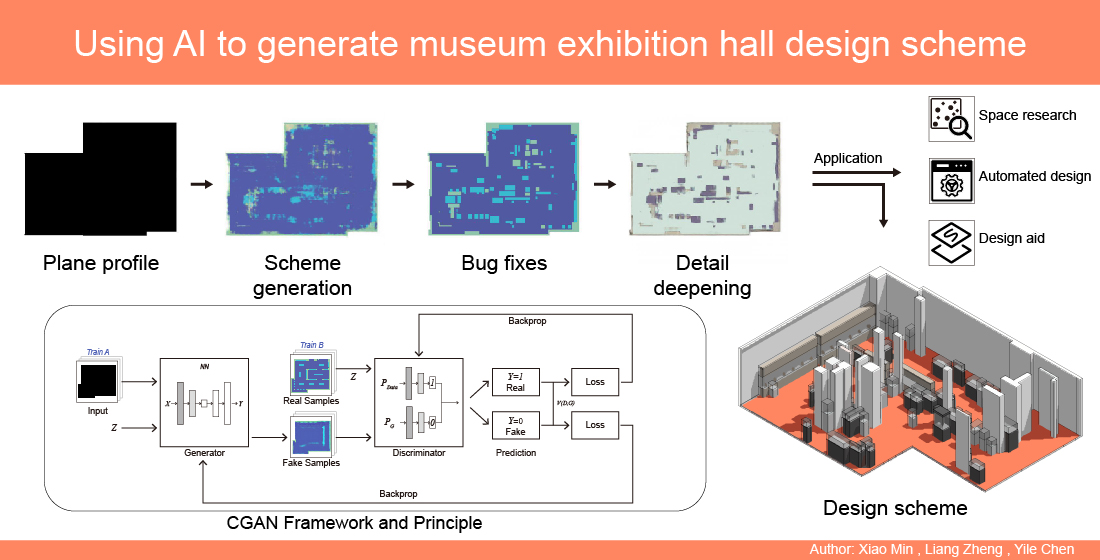
This paper proposes a method based on a conditional generative adversarial net-work (CGAN) to realize the automatic generation of museum exhibition hall plans in order to assist architects in the design of museum exhibition halls and build an automated design process. It can also be used as a tool for space research and has important practical value for the design of large-scale exhibition halls. The method of this study consists of five aspects: data capturing, data processing, model training, model evaluation, and model application (Figure 1). The details are as follows:
(1) Data capturing. In this step, a certain amount of museum exhibition hall data needs to be collected to provide the model for training so that the model can recognize the spatial characteristics of the museum exhibition hall. First, we conducted a survey and found the statistics of 30 museums (Table 1). In the study, there were four main categories of museum buildings: comprehensive museums, historical museums, art museums, and memorial museums. Additionally, these museums cover most of the provincial capital cities in China, which are typical representations of the country. These museums are new modern museums, and each museum has two to three floors of exhibition halls. The floor plan of the exhibition hall includes museum exhibition halls of different types, sizes, and layouts. According to past experience [28], the number of samples can be determined according to the number of labels, which is usually at least 20 times the number of labels. In this study, there are three labels for the exhibition hall: wall, ground, and showcase. Thus, at least 60 floor plan images are needed to train for better results. After basic screening, a total of 66 floor plans of the exhibition hall were selected as samples for the experiment. These data can provide enough information for the model to learn the characteristics of the floor plan of the museum exhibition hall.
(2) Data processing. In order to improve the model training results, some basic processing was performed on the data to avoid the problems of difficult convergence and uncontrollable results in the process of model training. The main processing methods include: (a) training the model in steps to control the generation effect of the model in each step. The collected floor plan samples are redrawn into pictures of three categories: floor plan profile (FPP), functional segmentation layout (FSL), and floor plan effect (FPE). Among them, FPP represents the design scope of the floor plan, FSL represents the functional division (wall, floor, showcase) inside the floor plan, and FPE represents more specific design content (thickness of the wall, scale, and quantity of showcases). (b) Unifying the above materials into 512 × 512 pixels, 96 dpi horizontal and vertical resolution, and 24-bit depth, so that the model can be trained efficiently and avoid model errors caused by differences in material size.
(3) Model training. The model framework of CGAN needs to use pairs of pictures as materials and at the same time follow the principle of model step-by-step training (the operating environment of machine learning refers to Appendix A). After the data processing, the three types of pictures (FPP, FSL, and FPE) are trained from outline to function and from function to effect, corresponding to the two models of Model 1 and Model 2, respectively. These two models cover all the steps from the design range to the final effect, which can effectively achieve the goal of the experiment.
(4) Model evaluation. The training process and training results of the model need to be evaluated in time to observe the actual effect and usability of the model. In this study, two methods are used to evaluate the model: (a) observe the size and overall trend of the loss value of each iteration during the model training process. The loss value in CGAN is used to measure the quality of the generated samples. The lower the loss value, the better the model training and the closer the generated samples are to the real samples. If the loss value keeps decreasing during the training process, this means that the model training is improving; on the contrary, if the loss value keeps rising, this means that the model training is worsening. (b) Test the model of each iteration, export the test picture, and judge whether the generated picture has “image noise” by observing the picture. “Image noise” will fool the discriminator’s true and false judgment, resulting in a lower loss value, but a poorly generated effect. The picture in the training set is the real picture, and the CGAN-generated picture is the fake picture. “Real picture” means the actual floor plan, and “fake picture” means a predicted or simulated floor plan. Through the above two judgment methods, one can basically understand the quality of model training so as to develop further solutions to the problems in model training, including: (a) trying to use different optimizers, such as Adam, RMSProp, or SGD, etc., in order to improve the convergence speed of the model; (b) changing the training parameters, such as learning rate, batch size, regularization parameters, etc., to improve model performance; (c) trying to change the network structure, such as by increasing or decreasing the number of layers, increasing or decreasing the number of neurons, etc., to improve the generalization ability of the model; and (d) replacing more training data to improve the generalization ability of the model.
(5) Model application. Once the training is completed, the model can be applied to many aspects of museum exhibition hall design, including design assistance, automatic design, and space research. In addition, in order to compare the difference between artificial design and machine design, four artificially designed showroom floor plans are used as materials in this step. We treat these materials as floor plan profile (FPP) samples for model application, require the model to use these samples to generate the final design effect, and compare the results with the artificial design to evaluate the possibility of model application.
2.2. Material Handling
The test material samples were collected from the actual projects of 30 museums in China. These museums are in Beijing, Jiangsu, Shanghai, Hubei, Fujian, and Guangxi in China, basically covering the common design forms of modern Chinese museums. A total of 66 floor plans of exhibition halls were extracted from these museums and scaled uniformly into pictures of the same size for easy analysis.
The test materials are shown in Figure 2. According to the needs of the experiment, the 66 floor plans were further divided into floor plan profiles (FPPs), functional segmentation layouts (FSLs), and floor plan effects (FPEs), for a total of 198 pictures. The FPP sample uses a grayscale image, and the color is black (R0, G0, B0). In the processing of FSL samples, in order to simplify the data, different colors represent the main elements of the floor plan of the exhibition hall and present them in the form of color pictures. In this study, three colors are used to represent the elements in the exhibition hall plan; for example, the walls are green (R151, G209, B163), the ground is dark blue (R84, G94, B170), and the showcase is light blue (R58, 195, B218).
2.3. CGAN Model
A CGAN is a type of generative adversarial network (GAN) that uses conditional variables to control the generated output. The main feature of CGAN is to allow users to control the generated output, such as color, size, and shape, to meet the needs of experiments. CGAN uses a pair of generators and discriminators to learn a distribution with a given condition: the generator attempts to generate samples that meet the given condition. While the discriminator attempts to distinguish between real samples and samples generated by the generator, the goal is to require the generator to produce samples that meet the given conditions as much as possible, while the discriminator attempts to distinguish between real and generated samples as much as possible.
As shown in Figure 3, the main principle [28] is as follows: (1) the discriminator receives a sample (whether real or synthetic) and a label (z) as input and outputs a scalar representing the probability that the sample is real. (2) The generator and the discriminator are trained together in an adversarial manner, where the generator attempts to generate samples that satisfy the requirements of the discriminator, while the discriminator attempts to correctly identify whether the samples are real or not. (3) The goal of the confrontation between the generator and the discriminator is to find a balance so that the samples generated by the generator are indistinguishable from real samples and the discriminator correctly identifies the samples with a probability of more than 50%. (4) Label information can be used to generate samples based on certain attribute or category conditions. All in all, CGAN uses conditional information to guide the generation of samples, which is more effective in matching the target distribution than the unconditional generation (GAN) model. The CGAN training process allows the model to learn how to balance the trade-off between authenticity and diversity, and how to capture the complex and subtle relationship between features and label information.
3. Model Training Process and Results
3.1. Training Process
The loss value (LOSS) of each iteration of the generator and the discriminator during the model training process is counted to obtain a line chart (Figure 4). Model 1 represents the model from FPP to FSL, and Model 2 represents the model from FSL to FPE. As can be seen from the figure, after Model 1 and Model 2 have been trained for 410 epochs and 140 epochs, respectively, the loss value gradually decreases and stabilizes in a lower value range, indicating that the performance and prediction accuracy of the models are improving and gradually converging.
The loss value of the model shows that (1) Model 1 needs a longer training iteration period to converge, which indicates that the model encounters difficulties in learning the relationship between FPP and FSL. The reason for this is that the relationship between FPP and FSL is complex or non-linear, and the model may take longer to learn. (2) Model 2 requires a shorter iteration cycle, which indicates that Model 2 has a better learning effect. The reason for this is that the relationship between FSL and FPE is simple, and the model can learn faster. (3) In comparison, a short iteration cycle usually indicates that the model has a better learning effect, but the specific accuracy and generalization ability of the model cannot be determined, and further verification is needed. (4) The relationship between the model LOSS, the number of iterations, and the size of the plan is as follows: (a) during the training process, the size of the input image and the quantity of iterations both have an impact on the size of the LOSS value. (b) The number of iterations will directly affect the performance of the model. Too few iterations will cause the model to fail to fully learn the data distribution, resulting in a large LOSS value. (c) The size of the input image will also directly affect the performance of the model. If the size of the input image is too small, information will be lost, which will affect the accuracy of the model. However, if the size of the input image is too large, it will also increase the training time and computing resources and increase the difficulty of training. (d) Selecting the appropriate input image size and number of iterations is an important factor to consider when training CGAN.
If the layout is constrained by the building structure (e.g., dimensions, internal columns, and beams), building dimensions, and artwork being exhibited (e.g., large monuments or buildings), the floor plan profile (FPP) will need to be adjusted. That is, we must allow the parts that cannot participate in the model generation to be modified to white. Because the model will only perform image generation on the black part of the FPP, the white part will be excluded. In addition, for the building size constraint, it is necessary to add a training model (such as Model 0) that recognizes the size. It can recognize the size before Model 1 generates the design drawing and provide corresponding constraints to Model 1.
During the model training process, we must test the model after each iteration and generate test images to determine the change in model accuracy (Figure 5): (1) the pictures generated by the last generation models, Model 1 and Model 2, are almost the same as the real ones, but with higher accuracy. (2) The training effect of Model 2 is better, and it is basically accurate at the 40th epoch, while Model 1 still has some errors at the 150th epoch. (3) The error in Model 1 is mainly due to the difference in the layout of the display cabinets in the exhibition hall, while the error in Model 2 is mainly due to the difference in the color of the dark lines. Overall, the model can finally achieve a better training result.
3.2. Model Test
After the model training is over, we must use the samples in the training set to test the model, which can evaluate the accuracy and generalization ability of the model, check the effect of machine learning, and judge whether the model has underfitting or overfitting problems. As shown in Figure 6, six sample pictures were obtained from the training set to test Model 1 and Model 2, respectively, where Samples 1 to 3 were used for Model 1 testing and Samples 4 to 6 were used for Model 2 testing. The research found that: (1) the overall test results of the models are good, and Model 1 and Model 2 can basically meet the requirements of the test. (2) Model 1 still has some deficiencies; a small amount of noise appears in samples 1 and 3, and the edge of the showcase generated in sample 2 has jagged phenomena. (3) Compared with the input picture, the generated result of Model 2 still has room for improvement in the degree of data richness. Generally speaking, Model 2 changed the color of the corresponding position of the input picture, but did not greatly increase the details in the picture (the division of the wall thickness and the scale of the showcase).
4. Discussion: Model Application and Comparison
4.1. Model Application
As shown in Figure 7, the feasibility of the model’s application to new samples is tested through four newly drawn FPP pictures. First, the four newly drawn FPP pictures are generated by Model 1, then the pictures generated by Model 1 are used as the input of Model 2, and finally the final picture is generated by Model 2. According to the overall generation results:
- (1)
- The effect produced by Model 1 is average, and there are obvious errors. This shows that the generalization ability of Model 1 is average and that further manual adjustment is required.
- (2)
- Due to the poor quality of Model 1’s epochs, the epoch effect of Model 2 is also affected, and the final result still cannot achieve the effect of direct application.
- (3)
- In comparison, from Test 1 to Test 3, we can see the general idea of the machine-designed exhibition hall layout, and the layout of the showcase is relatively reasonable, which has a certain reference value. However, the showcase generated in Test 4 is messier, without obvious regularity, and the reference is not high.
- (4)
- It can be seen from the plan generation results of the exhibition halls in Test 1 and Test 3 that the arrangement of showcases has an obvious density relationship. That is, the positions on the left, or lower, side are relatively dense, and the positions on the right, or upper, side are relatively sparse, which is in line with the concept of dynamic and static partitions in the design of the exhibition hall. The learning potential of the model for this design logic is shown.
- (5)
- It can be seen from the generated results of the exhibition hall plan in Test 2 that the layout of the showcases is mainly located in the center of the space, generally presenting a circular layout. This layout is more conducive to the arrangement of visiting streamlines, so that visitors to the exhibition hall can easily browse the exhibits. It shows the learning potential of the model in the streamlined layout of the exhibition hall.
- (6)
- In Test 4, the layout of the exhibition hall is relatively chaotic. The display cabinets are generally arranged along the edge of the wall. There are trivial display cabinets in the middle area, and there are more blank areas, which may be suitable for people who need more interactive space and rest spaces in the showroom.
In conclusion, various types of floor plan designs for museum exhibition halls can be generated by using the CGAN method, providing more choices and flexibility for museums. However, in the application, it was also found that some of the generated results are not ideal. The possible reasons are: (1) the content of the new picture is inconsistent with the content of the training set picture, and the model cannot accurately generate the desired image. At the same time, it shows the generalization ability of the model, which still requires continual improvement. (2) Insufficient training data: the 66 exhibition hall plan datasets used in this study may not be able to fully satisfy the learning needs of complex exhibition hall plans. Therefore, the model has an underfitting problem, resulting in poor image quality. Subsequent research needs to consider these factors and further improve the model to improve its accuracy and predictive ability.
4.2. Comparative Analysis of Differences with Architects’ Designs
In order to evaluate the performance of the model and whether it can generate results similar to or better than the artificial design, four actual exhibition hall projects were selected, and the FPP pictures extracted from them as the basic data for the model to generate the exhibition hall plan. The final result generated by the model was compared with the floor plan of the actual project. The significance of this step is as follows:
- (1)
- Evaluating the effect of the model: through comparison, the difference between the results generated by the machine learning model and the results of the manual design can be evaluated, thereby evaluating the effect of the model.
- (2)
- Improving model performance: if the results generated by the model are different from those designed by humans, this information can be used to improve the performance of the model, such as by adjusting parameters or using a more complex model.
- (3)
- Analyzing the applicability of the machine learning model: through comparison, we can see the applicability of the machine learning model in different application scenarios.
- (4)
- The limitations of the research model: if there is a difference between the results generated by the model and the results of the artificial design, the limitations of the model can be seen and provide inspiration for further improving the model’s performance.
As shown in Figure 8 and Figure 9, the FPP of four actual exhibition hall projects is used as the input to produce the model generation and design, and Model 1 uses the picture effect generated as the input picture. In order to establish the effect generated by Model 2 more ideal and avoid the situation in the application of the above model, the step of “Fixing Model 1” is added. That is, on the basis of Model 1, simple corrections are manually added to the pictures generated by the model, including reducing the noise in the picture and making the edges of the color blocks more clear. Model 2 is the final image generated after importing the image of Fix-Model 1 into Model 2. When the images of the Model 2 and the manual design are compared, it is clear that:
- (1)
- The difference between model design and manual design is large, and manual design is better than model design. In projects 1 to 4, the logic of model design is mainly to simply arrange the display cabinets horizontally or vertically in the exhibition hall, and the direction of the display cabinets roughly matches the outline of the exhibition hall. The artificial design has more considerations for the flow line and space division of the exhibition hall. On the whole, the flow line of the exhibition hall is relatively clear, and the space division is reasonable. There are also different spatial forms of circles and squares, and the space experience is richer.
- (2)
- The outcome of model generation is inferior to that of designs produced by qualified architects. However, the placement of showcases and basic space division can still be seen in the model generation plan. Thus, the layout of the showcase can be completed based on what the results show. This is useful as a point of reference, and architects can build on it to create more detailed plans.
- (3)
- The advantages of model design are mainly reflected in its efficiency, which can provide a simple and basic design scheme in a short period of time. In this research, model design cannot replace the work of manual design.
4.3. Generating a Variety of Museum Exhibition Hall Design Schemes
To generate several different museum exhibit design proposals, we used varying noise inputs. In CGAN, the noise input is a random vector, and different images can be generated by changing the noise vector. We used several different noise vectors to generate several different museum exhibit designs. These noise vectors were randomized each time an image was generated, so a large variety of designs can be generated.
In this study, we chose the contour map of the same museum exhibition hall as the conditional input. This ensures that the generated images are all of the same scene, but with different designs. Unlike the previous process, when using the CGAN model to generate images, different noise vectors were randomly selected, resulting in multiple different designs (Figure 10).
We found that this method produced several different designs by comparing the designs created by different noise vectors. This method provides designers of museum exhibition halls many new ideas and inspiration. At the same time, the user’s preferences and needs can also contribute to choosing the best design scheme.
5. Conclusions
The method proposed in this paper, the CGAN-based floor plan design method for museum exhibition halls, has the following advantages: (1) using generative adversarial networks (CGANs), it is easy to quickly develop several floor plan designs for museum exhibition halls. Under the premise that the results generated by CGAN are accurate and usable, architects can be provided with more choices and flexibility for reference in their schemes. (2) Both model training and results can be exported as easy-to-understand images from CGAN, which helps researchers evaluate and analyze them. (3) Using computer-aided methods, CGAN can generate richer design solutions.
However, this method also has some shortcomings: (1) since the CGAN training process requires a large amount of real floor plan design data, if there are not enough data, it may be difficult for CGAN to capture the features in the floor plan. This then further affects the results of the generative design, causing some bias. (2) Since CGAN can only generate floor plan designs that meet certain conditions, it cannot generate floor plan designs that do not meet the conditions. This may lead to a lack of creativity and novelty in the generated floor plan designs. (3) There may be certain deviations in the generated floor plan design, so in practical applications, the cooperation of professional architects is needed to complete the design project. (4) In addition, the automatically designed style comes from the training results of the model. The number of samples in the training set is limited. The resulting design style also depends on the sample. This may result in a floor plan without much novelty or creativity. (5) In generative design, this method is more about helping the architect make decisions about the design scheme. However, it is always difficult to replace the architect.
In the future, we can consider the following development directions and improvement methods: (1) using more data and higher-precision models to train generative adversarial networks to improve the quality and accuracy of generated floor plan designs; (2) developing more evaluation methods, including human–computer interaction, laboratory evaluation, and real-world evaluation, to more accurately evaluate the quality and acceptability of generated floor plan designs; and (3) developing more auxiliary tools, such as intelligent recommendation systems, automatic correction, and automatic optimization, so that architects can use this method more conveniently and quickly.
In addition to museum exhibition hall design, this method can also be applied to other similar fields, such as exhibition layout design, art gallery design, and museum showcase layout design.
Author Contributions
Conceptualization, X.M.; methodology, L.Z. and Y.C.; software, Y.C. and L.Z.; validation, Y.C. and X.M.; formal analysis, X.M. and L.Z.; investigation, Y.C. and L.Z.; resources, X.M.; data curation, X.M.; writing—original draft preparation, X.M., Y.C. and L.Z.; writing—review and editing, X.M., Y.C. and L.Z.; visualization, L.Z.; supervision, Y.C. and L.Z.; project administration, X.M.; funding acquisition, X.M. All authors have read and agreed to the published version of the manuscript.
Funding
This research was funded by the Philosophy and Social Science Research Project of the Jiangsu Provincial Department of Education: Research on Red Culture Propaganda Strategy from the Perspective of Visual Communication in Public Space (grant number 21Q079); CITT (Guangzhou) Enterprise Key Funding Project “Information System Engineering and Construction Engineering Testing” (grant number GZWX-23-007).
Institutional Review Board Statement
Not applicable for studies not involving humans or animals.
Informed Consent Statement
Not applicable for studies not involving humans.
Data Availability Statement
The original code of the program cannot be released yet because our program is being used in other research. The training set for the machine learning for this article can be found online at https://data.mendeley.com/datasets/szm2gkwhyp/1 (accessed on 8 March 2023).
Conflicts of Interest
The authors declare no conflict of interest.
Appendix A
Machine learning environment configuration: the operating system was Windows 11 (X64), the Cuda version was 11.5, the deep learning framework was Pytorch, the graphics card was GeForce GTX 3070 (16G), and the processor was AMD Ryzen 9 5900HX (3.30 GHz).
References
- Hsu, L. Circulation in Museums. 2004. Available online: https://core.ac.uk/download/pdf/151525986.pdf (accessed on 8 March 2023).
- Saleh, O.H. Interpreting the Spatial Organization of AdaptiveReuse Museums Considering Crowds Issue in Circulation Routes. Master’s Thesis, Eastern Mediterranean University (EMU)-Doğu Akdeniz Üniversitesi (DAÜ), Famagusta, North Cyprus, 2020. [Google Scholar]
- William, L.; Holden, K.; Butler, J. Universal Principles of Design, Revised and Updated: 125 Ways to Enhance Usability, Influence Perception, Increase Appeal, Make Better Design Decisions, and Teach through Design; Rockport Pub: Beverly, MA, USA, 2010. [Google Scholar]
- Nelson, H.G.; Stolterman, E. The Design Way: Intentional Change in an Unpredictable World; MIT Press: Cambridge, MA, USA, 2014. [Google Scholar]
- Goodwin, K. Designing for the Digital Age: How to Create Human-Centered Products and Services; John Wiley & Sons: Hoboken, NJ, USA, 2011. [Google Scholar]
- Wang, B. Digital Design of Smart Museum Based on Artificial Intelligence. Mob. Inf. Syst. 2021, 2021, 4894131. [Google Scholar] [CrossRef]
- Gui, J.; Sun, Z.; Wen, Y.; Tao, D.; Ye, J. A review on generative adversarial networks: Algorithms, theory, and applications. IEEE Trans. Knowl. Data Eng. 2021, 35, 3313–3332. [Google Scholar] [CrossRef]
- Wu, W.; Fu, X.M.; Tang, R.; Wang, Y.; Qi, Y.H.; Liu, L. Data-driven interior plan generation for residential buildings. ACM Trans. Graph. 2019, 38, 1–12. [Google Scholar] [CrossRef] [Green Version]
- Liu, Y.; Qin, Z.; Wan, T.; Luo, Z. Auto-painter: Cartoon image generation from sketch by using conditional Wasserstein generative adversarial networks. Neurocomputing 2018, 311, 78–87. [Google Scholar] [CrossRef]
- Rahbar, M.; Mahdavinejad, M.; Markazi, A.H.; Bemanian, M. Architectural layout design through deep learning and agent-based modeling: A hybrid approach. J. Build. Eng. 2022, 47, 103822. [Google Scholar] [CrossRef]
- Ali, A.K.; Lee, O.J. Facade style mixing using artificial intelligence for urban infill. Preprints 2021. [Google Scholar] [CrossRef]
- Chang, K.H.; Cheng, C.Y.; Luo, J.; Murata, S.; Nourbakhsh, M.; Tsuji, Y. Building-GAN: Graph-Conditioned Architectural Volumetric Design Generation. In Proceedings of the IEEE/CVF International Conference on Computer Vision, Virtual, 11–17 October 2021; pp. 11956–11965. [Google Scholar]
- Wang, S.; Zeng, W.; Chen, X.; Ye, Y.; Qiao, Y.; Fu, C.W. ActFloor-GAN: Activity-Guided Adversarial Networks for Human-Centric Floorplan Design. IEEE Trans. Vis. Comput. Graph. 2023, 29, 1610–1624. [Google Scholar] [CrossRef] [PubMed]
- Kinugawa, H.; Takizawa, A. Deep learning model for predicting preference of space by estimating the depth information of space using omnidirectional images. In Proceedings of the 37 Education and Research in Computer Aided Architectural Design in Europe and XXIII Iberoamerican Society of Digital Graphics, Joint Conference (N. 1), Porto, Portugal, 11–13 September 2019; Volume 7, pp. 61–68. [Google Scholar]
- Bachl, M.; Ferreira, D.C. City-GAN: Learning architectural styles using a custom Conditional GAN architecture. arXiv 2019, arXiv:1907.05280. [Google Scholar]
- Silvestre, J.; Ikeda, Y.; Guena, F. Artificial imagination of architecture with deep convolutional neural network. In Living Systems and Micro-Utopias: Towards Continuous Designing, Melbourne; The Association for Computer-Aided Architectural Design Research in Asia (CAADRIA): Hong Kong, China, 2016; pp. 881–890. [Google Scholar]
- Fei, Y.; Liao, W.; Huang, Y.; Lu, X. Knowledge-enhanced generative adversarial networks for schematic design of framed tube structures. Autom. Constr. 2022, 144, 104619. [Google Scholar] [CrossRef]
- Huang, W.; Zheng, H. Architectural drawings recognition and generation through machine learning. In Proceedings of the 38th Annual Conference of the Association for Computer Aided Design in Architecture, Mexico City, Mexico, 18–20 October 2018; pp. 18–20. [Google Scholar]
- Sharma, D.; Gupta, N.; Chattopadhyay, C.; Mehta, S. Daniel: A deep architecture for automatic analysis and retrieval of building floor plans. In 2017 14th IAPR International Conference on Document Analysis and Recognition (ICDAR); IEEE: Manhattan, MA, USA, 2017; Volume 1, pp. 420–425. [Google Scholar]
- Wan, D.; Zhao, X.; Lu, W.; Li, P.; Shi, X.; Fukuda, H. A Deep Learning Approach toward Energy-Effective Residential Building Floor Plan Generation. Sustainability 2022, 14, 8074. [Google Scholar] [CrossRef]
- Cho, M.E.; Kim, M.J. Measurement of user emotion and experience in interaction with space. J. Asian Archit. Build. Eng. 2017, 16, 99–106. [Google Scholar] [CrossRef] [Green Version]
- Koo, K.; Heo, Y.; Lee, H. A Study on the Environmental Spatial Composition Change According to the Extension of the Museum. J. Green Eng. 2021, 11, 3107–3122. [Google Scholar]
- Huang, X.; Zhu, S. Optimization of daylighting pattern of museum sculpture exhibition hall. Sustainability 2021, 13, 1918. [Google Scholar] [CrossRef]
- Ferdyn-Grygierek, J. Monitoring of indoor air parameters in large museum exhibition halls with and without air-conditioning systems. Build. Environ. 2016, 107, 113–126. [Google Scholar] [CrossRef]
- Kent, M.G.; Schiavon, S.; Jakubiec, J.A. A dimensionality reduction method to select the most representative daylight illuminance distributions. J. Build. Perform. Simul. 2020, 13, 122–135. [Google Scholar] [CrossRef] [Green Version]
- Kim, J.; Kent, M.; Kral, K.; Dogan, T. Seemo: A new tool for early design window view satisfaction evaluation in residential buildings. Build. Environ. 2022, 214, 108909. [Google Scholar] [CrossRef]
- Kim, B.; Yuvaraj, N.; Tse, K.T.; Lee, D.E.; Hu, G. Pressure pattern recognition in buildings using an unsupervised machine-learning algorithm. J. Wind. Eng. Ind. Aerodyn. 2021, 214, 104629. [Google Scholar] [CrossRef]
- Zhang, L.; Zheng, L.; Chen, Y.; Huang, L.; Zhou, S. CGAN-Assisted Renovation of the Styles and Features of Street Facades—A Case Study of the Wuyi Area in Fujian, China. Sustainability 2022, 14, 16575. [Google Scholar] [CrossRef]
Figure 1.
Research methods and process.

Figure 2.
Materials used in this study. (1) Floor plan profile (FPP); (2) Functional segmentation layout (FSL); (3) Floor plan effect (FPE), and the Chinese annotations in the floor plan represent its spatial function.
Figure 2.
Materials used in this study. (1) Floor plan profile (FPP); (2) Functional segmentation layout (FSL); (3) Floor plan effect (FPE), and the Chinese annotations in the floor plan represent its spatial function.

Figure 3.
CGAN framework and principle.

Figure 4.
The learning curve for model training.

Figure 5.
Model accuracy changes during iterative process (the Chinese annotations in the floor plan represent its spatial function).
Figure 5.
Model accuracy changes during iterative process (the Chinese annotations in the floor plan represent its spatial function).

Figure 6.
Testing the final model using the training samples (the Chinese annotations in the floor plan represent its spatial function).
Figure 6.
Testing the final model using the training samples (the Chinese annotations in the floor plan represent its spatial function).

Figure 7.
Utilizing the new FPP to test Model 1 and Model 2.

Figure 8.
Comparative analysis of differences with architects’ designs.

Figure 9.
A 3D model comparison based on architect design and CGAN model design results.

Figure 10.
Changing the noise label (Z) of the input model can generate multiple different results.


Table 1.
Research materials (museum floor plan) and exhibition hall statistics.
| No. | Museum Type | Project Name | Location | Year Established | Exhibition Area | Building Floors | Number of Floor Plans Involved in Training |
|---|---|---|---|---|---|---|---|
| 1 | Comprehensive museum | Nantong Haohe Museum | Nantong | 2012 | 1200 m2 | 1 building, 3 floors | 1 |
| 2 | Taiyuan Museum | Taiyuan | 2000 | 15,000 m2 | 5 buildings, each with 4 floors | 4 | |
| 3 | Zaozhuang Museum | Zaozhuang | 1988, newly built in 2016 | 3600 m2 | 1 building, 3 floors | 2 | |
| 4 | Gaoyou Museum | Gaoyou | 2017 | 5000 m2 | 1 building, 4 floors | 2 | |
| 5 | Hubei Provincial Museum | Wuhan | 2021 | 36,000 m2 | 1 building, 4 floors | 3 | |
| 6 | Nanjing Museum | Nanjing | 2013 | 5000 m2 | 1 building, 2 floors | 2 | |
| 7 | Nantong Museum (new building) | Nantong | 2005 | 6330 m2 | 1 building, 2 floors | 4 | |
| 8 | Shanghai Natural History Museum | Shanghai | 2015 | 32,200 m2 | 1 building, 4 floors | 3 | |
| 9 | Suzhou Silk Museum | Suzhou | 2006 | 4000 m2 | 1 building, 4 floors | 2 | |
| 10 | Suzhou Museum West Building | Suzhou | 2021 | 13,391 m2 | 1 building, 5 floors | 3 | |
| 11 | Historical Museum | Qingdao West Coast New Area Museum | Qingdao | 2019 | 552 m2 | 1 building, 2 floors | 1 |
| 12 | Fuzhou Historical and Cultural City Exhibition Hall | Fuzhou | 2015 | 1600 m2 | 1 building, 2 floors | 2 | |
| 13 | Huai’an Archaeological Achievements Exhibition Hall | Huai’an | 2019 | 800 m2 | 1 building, 1 floor | 1 | |
| 14 | Majiabang Cultural Museum | Jiaxing | 2019 | 1800 m2 | 1 building, 2 floors | 2 | |
| 15 | National Museum of Traditional Chinese Medicine | Beijing | 2020 | 2300 m2 | Main building 4 floors, annex building 3 floors | 2 | |
| 16 | Liangzhu Museum | Hangzhou | 2018 | 4000 m2 | 1 building, 2 floors | 2 | |
| 17 | Yao Nationality Museum | Laibin | 1992 | 804 m2 | 1 building, 2 floors | 1 | |
| 18 | Nanchang University History Museum | Nanchang | 2011 | 700 m2 | 1 building, 1 floor | 1 | |
| 19 | Nanjing Folklore Museum | Nanjing | 2010 | 5400 m2 | 1 building, 3 floors | 3 | |
| 20 | Art Museum | Zhao Meisheng Art Museum | Taiyuan | 2008 | 130 m2 | 1 building, 2 floors | 1 |
| 21 | Suzhou Art Museum New Building | Suzhou | 2008 | 2600 m2 | 1 building, 3 floors | 2 | |
| 22 | Suzhou Jinji Lake Art Museum | Suzhou | 2012 | 1500 m2 | 1 building, 1 floor | 1 | |
| 23 | Art Museum of Nanjing University of the Arts | Nanjing | 2012 | 6000 m2 | 1 building, 4 floors | 2 | |
| 24 | Nantong Art Museum | Nantong | 2021 | 20,000 m2 | 1 building, 4 floors | 5 | |
| 25 | Guangda Art Museum | Hangzhou | 2015 | 2800 m2 | 1 building, 2 floors | 3 | |
| 26 | Long Art Museum | Shanghai | 2015 | 16,000 m2 | 1 building, 3 floors | 3 | |
| 27 | Memorial Museum | Zhang Chunru Memorial Hall | Huai’an | 2017 | 1000 m2 | 1 building, 2 floors | 1 |
| 28 | Crossing the River Victory Memorial Hall | Nanjing | 2009 | 4000 m2 | 1 building, 2 floors | 2 | |
| 29 | Shanghai Songhu Anti-Japanese War Memorial Hall | Shanghai | 2000 | 1500 m2 | 1 building, 3 floors | 2 | |
| 30 | New Fourth Army Memorial Hall | Yancheng | 2014 | 9000 m2 | 1 building, 3 floors | 3 |
Disclaimer/Publisher’s Note: The statements, opinions and data contained in all publications are solely those of the individual author(s) and contributor(s) and not of MDPI and/or the editor(s). MDPI and/or the editor(s) disclaim responsibility for any injury to people or property resulting from any ideas, methods, instructions or products referred to in the content. |
© 2023 by the authors. Licensee MDPI, Basel, Switzerland. This article is an open access article distributed under the terms and conditions of the Creative Commons Attribution (CC BY) license (https://creativecommons.org/licenses/by/4.0/).
Share and Cite
MDPI and ACS Style
Min, X.; Zheng, L.; Chen, Y. The Floor Plan Design Method of Exhibition Halls in CGAN-Assisted Museum Architecture. Buildings 2023, 13, 756. https://0-doi-org.brum.beds.ac.uk/10.3390/buildings13030756
AMA Style
Min X, Zheng L, Chen Y. The Floor Plan Design Method of Exhibition Halls in CGAN-Assisted Museum Architecture. Buildings. 2023; 13(3):756. https://0-doi-org.brum.beds.ac.uk/10.3390/buildings13030756
Chicago/Turabian StyleMin, Xiao, Liang Zheng, and Yile Chen. 2023. "The Floor Plan Design Method of Exhibition Halls in CGAN-Assisted Museum Architecture" Buildings 13, no. 3: 756. https://0-doi-org.brum.beds.ac.uk/10.3390/buildings13030756
Note that from the first issue of 2016, this journal uses article numbers instead of page numbers. See further details here.