Article

INSPECT-SPSW: INelastic Seismic Performance Evaluation Computational Tool for Steel Plate Shear Wall Modeling in OpenSees

by
Mohammad AlHamaydeh
1,*,
Ahmed Mansour Maky
1 and
Mohamed Elkafrawy
2,3
1
Department of Civil Engineering, College of Engineering, American University of Sharjah, Sharjah P.O. Box 26666, United Arab Emirates
2
Materials Science and Engineering Program, College of Arts and Sciences, American University of Sharjah, Sharjah P.O. Box 26666, United Arab Emirates
3
Structural Engineering Department, Faculty of Engineering, Tanta University, Tanta P.O. Box 31733, Egypt
*
Author to whom correspondence should be addressed.
Submission received: 20 March 2023 / Revised: 8 April 2023 / Accepted: 17 April 2023 / Published: 19 April 2023
(This article belongs to the Special Issue Advances in the Behaviour of Steel Structures)

Abstract

:
Modeling Steel Plate Shear Wall (SPSW) behavior can be computationally demanding. This is especially true when high-fidelity modeling is carried out via shell or 3D solid elements. It has been shown that SPSW behavior can be captured with adequate accuracy through the strip method via nonlinear truss elements idealization. The widely accepted and reliable analysis platform, OpenSees, requires text-based input (.tcl) files created by a skilled programmer. Hence, a Pre/Post-processing User Interface (UI) software package (INSPECT-SPSW) is introduced herein. With basic input, the INSPECT-SPSW package allows the user to create the OpenSees (.tcl) input file, run different nonlinear analyses, and retrieve and visualize the output. In addition, the UI includes illustrated wrappers for several OpenSees commands for various material definitions, plasticity modeling options, modal analysis, and nonlinear analysis types. Validation and verification were conducted against published results of experimental and numerical cyclic loading specimens. The user-friendly interface successfully created accurate models that capture the SPSW nonlinear behavior, including the various possible failure mechanisms. e.g., beam or column plastic hinging, web plate yielding, etc. With demonstrated performance and intuitive UI, INSPECT-SPSW is expected to facilitate the broad adoption of the strip method for Performance-Based Earthquake Design (PBED) of SPSWs.

1. Introduction, Significance, and Limitations

Over the last four decades, the popularity of Steel Plate Shear Walls (SPSWs) has significantly increased. It provides sufficient lateral resistance as a structural system through adequate strength, stiffness, and ductility. As a result, they have been used in several building types, including high-rise constructions. An SPSW is a lateral force-resisting system that consists of a steel frame of Horizontal and Vertical Boundary Elements (HBEs and VBEs) infilled with unstiffened thin steel plates [1]. It can be multiple stories high and several bays wide. Additionally, HBE-to-VBE connections can be fabricated as a simple shear or a moment-resisting type. SPSW systems provide significant cost, performance, and construction time advantages compared to other systems. Under moderate lateral loads, the SPSW system ensures excellent lateral resistance performance because of the overall system stiffness and strength [2]. In contrast, the ductility of steel plates ensures robust performance during severe seismic loading. Recently, several studies investigated the feasibility of using composite FRP-SPSW [3,4,5]. They found that incorporating FRP with steel significantly improved the ultimate capacity of SPSWs.
The behavior of SPSW has been examined by multiple researchers who have studied different key parameters [6,7]. Compared with a braced frame system, the SPSW system can provide an equivalent stiffness with the same or less plan area and less time for construction due to a more manageable field welding process. While in comparison to reinforced concrete shear walls, the reduction of wall thickness, plan area, total mass (an influential factor in foundation design), and construction time are remarkable benefits for SPSW. Thus, the system’s stiffness and resistance functions allow structural designers to use spaces and assume plan layouts, including moderate-length, mid-rise, and high-rise constructions. The design of thin plates is typically governed by their buckling behavior [8,9,10]. Despite efforts to address it, buckling design for SPSWs remains a serious challenge for designers. While several studies have proposed formulas for the buckling design of SPSWs, more research and development are still needed to improve the accuracy and effectiveness of these approaches [11,12,13,14]. An example of the early SPSW buildings, the Shinjuku Nomura Building, was constructed in 1978 as Tokyo’s third tallest building (693 ft and 51 stories). The SPSW system consisted of 10 ft high by 16.5 ft long steel panels and reinforcing stiffeners in the horizontal and vertical axes.
Moreover, 200 to 500 bolts were needed to connect a single panel with its surrounding boundary elements, which was recognized as a construction challenge. Considerably, high-rise buildings were usually designed with patented precast concrete seismic wall cores during that era in Japan. Moreover, SPSWs were used in the seismic retrofits of other facilities. For example, the 1937 Oregon State Library, a reinforced concrete frame structure, was reinforced with SPSW to allow the structure to remain open during renovation and to preserve existing historical finishes. Since the early 1980s, SPSWs have become noticeably more prevalent in North America and Asia. It has also been used in many structures in the United States, Canada, Mexico, and Japan, for various building types, from single-family residences to high-rise constructions. Conversely, numerous other lateral force-resisting systems have been investigated in several studies [15,16,17,18].
Previously, the design of seismic load-resisting systems in older standards relied on linear elastic analysis methods. The assigned loads were reduced to account for ductility and overstrength factors. Modern design codes and standards require accurately predicting the inelastic structural behavior and failure modes. This methodological shift created a demand for commonly available numerical modeling software, which is relatively simple and computationally efficient. For designing an SPSW structure system, the strip model is considered a reliable analytical concept recommended by the Canadian steel design standard, CSA S16-14 [19]. In their respective commentaries, the strip model is also recommended with some guidance by the AISC seismic provisions (AISC 341-10—American Institute of Steel Construction 2010). This approach was developed by Thorburn et al. [20]. They noticed that the ultimate capacity of the SPSW could not only be estimated based on the buckling of the infill plate because of the post-buckling behavior of the tension fields within the panel. As shown in Figure 1, the panel was simulated as a group of parallel tension-only strips inclined with angle α. Furthermore, the HBEs were modeled to be significantly stiff to neglect any opposing tension forces from above and below the infill panel. Moreover, hinge connections were used at the ends of beams (ignoring frame joints’ behavior).
In order to investigate the accuracy of the strip model, an investigation was conducted by Timler and Kulak [21] to verify analytical predictions with similar experimental results. As a result of that research, Equation (1) was developed for estimating vertical angle α:
tan 4 α = 1 + t L 2 A c 1 + t h 1 A b + h 3 360 I c L
where t is the thin plate thickness, A b and A c are the areas of the beams and columns cross-sections, L and h are the width and height of the panel, I c is the moment of inertia for column sections, as shown in Figure 1.
Several building designers used the strip model for SPSWs in many published research studies [22,23,24]. After publishing the original strip model, it has been subjected to several investigations and modifications. The Canadian design provision for SPSW [19] defined the minimum tension field strips required to map the effects of distributed loads on the frame elements by 10. Furthermore, the authors of Seismic Provisions for Structural Steel Buildings (AISC [25]) recommended simplifying the strip model by taking the average angle of tension stress over the height of the building with the permission of a 5° change at most. Shishkin et al. [26] refine Thorburn et al.’s original strip model first introduced [20] to attain a better representative simulation for the SPSW’s nonlinear behavior. An axial compression strip was added to the model, located in the opposite orientation of the tension strips for each panel, and diagonally extended from the above corner to the lower corner, as described in Figure 2.
This addition was aimed to reflect; (1) the small contribution of the infill plates in the compression strength (which could not be negligible in the corner zones for some models, according to the plate thickness). (2) the effect of overturning moment cases in producing vertical tension forces on one side of the wall and in the corners near the infill panels. The imaginary area of the compression strut cross-sections A c s can be estimated as follows:
A c s =   L t   sin 2 α 2   sin Φ sin 2 Φ
In Equation (2),   Φ is the acute angle of the strut measured from the vertical axis. The refinements considered the effects of P-Delta in pushover analysis by first applying the gravity loads using a load-controlled static elastic analysis to the total value and then applying the lateral loads using a displacement-controlled nonlinear analysis.
For moment-resisting connections, the inelastic deformations of the panel zone (the VBE segment bounded by the connecting HBE depth) are usually negligible throughout lateral loading. Thus, the modified strip model contains panel nodes with a distance of d b / 2 in columns and d c / 2 in beams from the central connection node, as represented in Figure 3; d b and d c are the depths of the beam and column, respectively. Panel zone elements were modeled with relatively high rigidity to simulate the effect of the high stiffness of the joint region. Plastic hinges in frame elements were modeled as a discrete joint placed at a distance of one-half the cross-sectional depth from the panel zone edge. All line elements between the two hinges were determined to be elastic, as illustrated in Figure 3. The behavior of plastic hinges followed user-defined moment-versus-rotation relations, assuming the plastic hinge length is equal to the member depth.
Generally, the AISC [25] defines acceptance criteria to design all HBEs and VBEs of an SPSW model. All deformations of frame elements should remain in the elastic range till reaching the peak tension fields from the connected yielded infilled panels, except for ends of HBEs where plastic hinges are allowed to develop. However, there was no definition or recommendation for a specific analysis methodology to ensure this mechanism. Instead, some guidance is provided in the commentary that could be used for achieving these criteria. Nevertheless, it is likely for some SPSW design approaches to develop in-span hinges. However, some structural designers deliberately permit the formation of in-span plastic rotations along the HBE length. This approach leads to lighter frame sections, minimizing the overstrength and creating more economical designs. In 2012, R. Purba and M. Bruneau [27] evaluated the analytical seismic behavior of SPSW with frame elements designed by two opposing approaches; (1) the indirect design allows in-span plastic hinges to be used to occur on beam spans. (2) the capacity design ensures that plastic hinges can only form at the edges of beams. This assessment was based on prior research and parametric studies containing variations in the designed SPSW models’ geometrical properties (e.g., panel aspect ratios, number of floors) and included monotonic pushover, cyclic loading pushover, and inelastic time-history analyses. This study utilized ABAQUS/Standard [28], a popular commercial model for finite element validation, and detailed 3D models instead of 2D strip models. Both thin plates and frame elements were modeled as S4R shell element meshes with reduced integration and hourglass control, where the S4R shell is an isoparametric general-purpose four-node shell element. The study adopted a three-story SPSW reference model. It had a single bay, and its dimensions were 10 and 20 ft in width and height, respectively (the infill plate aspect ratio was equal to 2.0). The typical gravity loads carried by the SPSW were 352 kips on typical floors and 381 kips for the roof level (the total weight was 1085 kips). These values represented one-sixth of the cumulative layout weights. The modeling of materials was based on elastic-perfect plastic stress-strain curves. Respectively, light-gauge steel (Fy = 30 ksi) and ASTM A572 Gr. 50 (Fy = 50 ksi) materials were chosen for infill plates and boundary elements (VBEs and HBEs). SPSW-ID and SPSW-CD denote the resulting models of each approach, whereas the ID and CD abbreviations refer to, in order, the indirect design and the capacity design methods. A displacement-controlled pushover analysis was performed for both designs. The maximum chosen lateral drift was 4%, corresponding to a 14.4 in. for lateral roof displacement. The theoretical base shear was more than the obtained analytical estimation, with only 2.3% in the case of SPSW-CD, while the SPSW-ID case reached 13%. In addition, a cyclic displacement loading (3% as the maximum drift with 0.5% increments) was applied for both designs. As a result, the SPSW-CD model exhibits a beam rotation range of −0.03 to +0.0075 radians, while the SPSW-ID model’s rotation range was from 0.0 to 0.06 radians. Considerably, the special moment-resisting frame’s (SMRF) beam rotation demands 0.03 radians. Based on these results, the total (elastic and plastic) HBE rotations exceeded 0.03 radians when the model achieved 3% lateral drift in the cyclic loading program. Furthermore, the overall plastic strength was lower than the estimated values of code equations. The practical results of adding plastic hinges along beam spans were significant accumulated plastic incremental rotations and partial yielding on the infill plates.
In 2014, another progressive study was conducted by R. Purba and M. Bruneau [29] to calibrate the stress-strain relationships between infill plates and frame elements. It included a statistical analysis of the behavior of 36 test specimens regarding experimental failure modes, cyclic deformation capacity, ultimate strength, and the possible causes of structural component deterioration that led to SPSW failure. These include web tearing (WT), flexural or shear failure of boundary elements (FBE), and instability of boundary elements (IBE). Figure 4 summarizes the deduced relationship curves of that study. Generally, 2% strain hardening is assumed to occur after elastic strain up to the capping point. For infill strips, the deterioration began at 1.5% axial strain (i.e., 9.0 δy) and was accompanied by plate tearing till reaching 1.8% axial strain (i.e., 10.7 δy). Then, the flange fibers for frame boundary elements were modeled for a 0.04-radian rotation capping point and gradual strength reduction until 0.10-radians.
Conversely, web fibers were modeled with no degradation curves for numerical stability purposes (as boundary elements are required to resist axial forces during the time history duration). They used these assumptions for material behavior in another accompanying study [30] to analyze the seismic performance of SPSWs regarding two different approaches: whether frame boundary elements contribute to story shear. For this assessment of collapse potential, multiple SPSW archetypes were selected to include many critical structural configurations. The archetypes represent various combinations of (a) aspect ratios of infill panels, (b) the number of stories, (c) seismic weight, and (d) seismic design coefficients [response modification factor (R), inelastic deflection amplification factor (Cd), and structural system overstrength factor (Ωo)]. The archetypes were named based on the following convention: SW520GK = steel walls; the number of stories equal to 5; panel aspect ratio 2.0; high seismic weights (intensive gravity forces on the leaning column); designed as κbalanced (the second approach). Additionally, Vd, WP-Δ, WSPSW, and Wtotal refer to the design base shear, weights assigned to the P-Delta leaning column, weights on the SPSW elements, and the total seismic weights for base shear calculations (= WSPSW + WP-Δ), respectively. All reference models adopted the capacity design methods corresponding to the recommendations of AISC seismic provisions [25] in designing boundary elements to avoid the formation of in-span hinges, as recommended in one of their previous studies [27]. The numerical model used is shown in Figure 5. Dual strips with an axial hinge for each strip were adopted for infill plates. Otherwise, concentrated fiber flexural hinges at the edges of frame elements were modeled to simulate frame element degradation. To include P-Delta effects, “gravity-leaning-column” elements are modeled near the SPSW model. These elements have no contribution to the lateral resistance, so their cross-sectional area properties were multiplied by a tributary value of 100 (an assumption of the number of columns for the gravity system).
In contrast, the same tributary value divided their moment of inertia properties. Rigid links are used to attach gravity columns with SPSW on every floor. All seismic mass was applied to the strip model and divided equally between beam-to-column joints at each story, and no mass was assigned to the P-Delta column. Panel zones’ rigid boundaries are excluded as their influence on the overall structural system behavior is negligible. In conclusion, it was recommended to design SPSWs without counting frame elements in story shear resistance since the overall behavior will lead to severe consequences of possible unacceptable drifts.
OpenSees [31] stands for Open System for Earthquake Engineering Simulation. It is a globally shared compiled library that provides inelastic analysis and modeling methods with multiple definitions for materials and section objects. It is considered a powerful computational platform that adopts finite element methods to provide numerical simulations for structural and geotechnical models through dynamic loads and earthquake scenarios. For SPSW strip models, it was specially recommended because of its ability to model inelastic tension-only axial hinges through a time history (even with strength deterioration under cyclic deformation). It requires the Tool Command Language (TCL), a string-based input syntax used to construct model elements and perform analyses. This requirement provides a high range of flexibility for several simulations and control schemes. However, it adds more complexity, as advanced scripting skills are necessary for users to run their required problems or design checks. For one SPSW design iteration, many parameters can affect the ultimate strength and each story’s drift. These parameters include model properties (number of floors, dimensions, and panels aspect ratio), material and cross-sectional properties for all structural components, assigned gravity loads, and designer assumptions for numerical modeling of nonlinear behavior. Thus, optimizing SPSW design through many iterations is a time-consuming and complex process besides writing all model properties in a programmable script for OpenSees [31]. Alternatively, finite element software (e.g., ABAQUS) is often preferred by researchers because it offers a more intuitive user interface and is easier to use [32,33,34,35].
Recently, several user-friendly tools to ease the use of the OpenSees platform [36] became available. These tools include OpenSees Navigator [37], a Matlab interface that operates on Windows machines allowing users to create models and conduct analyses efficiently. NextFEM Designer [38] is another valuable tool that enables the performance of several FE analyses and can be linked to other FE software, such as ABAQUS and Midas Gen. Additionally, ETO [39] is a software package that can import s2k files produced by ETABS, while GID-OpenSees [40] is a versatile and powerful general graphical user interface for OpenSees that offers an extensive range of materials, including 1D, 2D, and 3D elements. It also provides linear and nonlinear, static and dynamic analysis capabilities. These tools have greatly helped many users in reaping the benefits of OpenSees. Additionally, many studies have focused on developing user-friendly graphical interfaces for conducting nonlinear analyses [41,42,43]. However, it is noteworthy that no specific UI for SPSW design has been released yet, to the best of the authors’ knowledge. Thus, this paper introduces INSPECT-SPSW (INelastic Seismic Performance Evaluation Computational Tool for Steel Plate Shear Wall modeling in OpenSees), a User Interface (UI) Pre/Post-processor package for OpenSees [31] as an attempt to reduce the modeling effort of SPSWs substantially. The main aim is to enable designers to take advantage of OpenSees without the complexity of writing a programmable script. The package will account for two factors: simplicity and variation. First, simplicity can be attained by requiring minimal input in the software; however, this creates design limitations if over-simplified. Second, variation is granted by allowing the end-user full access to all possible analysis options and model definitions. A balance between simplicity and variation must be met to design a user-friendly UI for the best experience.

1.1. Research Significance

The primary utility of INSPECT-SPSW is to provide a streamlined process for analyzing the structural response of SPSW systems to lateral loads, satisfying modern codes and standard provision requirements. The program utilizes OpenSees capabilities to produce the nonlinear structural response to several lateral load types, including wind and earthquake loads. To achieve this, INSPECT-SPSW adopts the strip model, a reliable numerical procedure first introduced by Thorburn et al. [20] and modified by Shishkin et al. [26]. The strip model has been recommended for SPSW analysis and design in several codes, including the Canadian steel design standard CSA S16-14 [19] and the AISC seismic provisions [25].
INSPECT-SPSW provides an interactive User Interface (UI) that allows users to create analysis scenarios, set their parameters, execute them, and extract and save the computational results. The UI automates many geometrical calculations and eliminates the advanced programming barrier, making it more accessible for structural engineers who do not possess the programming skills needed to use OpenSees. The user interface also facilitates sequencing the designer’s major decisions, making it easier for users to use the program effectively.
In addition to automating many calculations, INSPECT-SPSW provides graphical visualization features that enable seamless identification of failure mechanisms and event sequences (yielding, strain-hardening, strain-softening, etc.) throughout the analysis. The graphical representation of the results and the simplified animation viewer were designed to represent failure modes and the status (stress level) of each structural element throughout the loading protocol. These graphical components allow designers to assess the inelastic behavior of the whole model, understand the causes of local and global failures, and make design improvement decisions more efficiently.
Another aspect of the significance of this UI lies in its contribution toward eliminating input mistakes and reporting errors early on in the modeling process. By allowing effective use of this program, given numerically and logically valid parameters, INSPECT-SPSW improves the safety and reliability of the design of SPSW systems. Furthermore, the program’s automated calculations related to geometrical node locations, element meshing, and load definitions enhance productivity for all SPSW systems designers. Various users can use this advanced analysis and design tool to verify and validate numerical models against experimental results, enhance existing designs, quantify the effect of a significant element on the overall system’s stability and performance, etc.
The INSPECT-SPSW package has been validated and verified against several published experimental results from the literature, such as [30]. The thorough validation and verification process demonstrates the program’s performance and intuitive UI, which is expected to facilitate the broad adoption of the strip method for PBED of SPSWs.

1.2. INSPECT-SPSW Limitations and Potential Future Extensions

This version of INSPECT-SPSW is limited to 2D structural analyses, a widely used approach in the scientific literature, e.g., [44,45,46,47]. Moreover, it does not utilize shell elements, so local buckling of flanges and webs of the HBEs and VBEs are not captured. Instead, it utilizes the numerically-efficient strip method. As such, its focus is the general structural behavior of the system, including some component-level nonlinear responses, such as web yielding for individual diagonal strips and plastic hinge formation in HBEs and VBEs.
The INSPECT-SPSW package is a substantial contribution to the field of structural engineering, as it represents a significant step toward a fully automated platform for SPSW Performance-Based Earthquake Design (PBED). The program’s capabilities can be expanded in subsequent versions to include more detailed numerical procedures, 2D shell or 3D solid elements, and options for buildings with irregular frames or other special detailing variations. Adding multi-run features for automated design optimization, parametric investigations, and Incremental Dynamic Analysis (IDA) would further enhance the program’s capabilities.
Another promising feature that could be added in future versions is interoperability with other commonly used data management platforms, such as Computer-Aided Design (CAD), Building Information Modeling (BIM), or other similar programs. This feature would streamline importing, exporting, translating, and retrieving data from other compatible formats and sources, making it easier for designers to work with INSPECT-SPSW.
Additionally, software applications’ usability and effectiveness can be enhanced by incorporating Artificial Neural Networks (ANNs), e.g., [48]. By utilizing machine learning techniques, these networks can adapt and improve over time, providing a more personalized and efficient experience for the user. The development of user-friendly software that incorporates Artificial Neural Networks has the potential to benefit various industries and fields greatly.

2. Software Description

This paper introduces a software package designed to speed up the process of analyzing SPSWs using a straightforward UI. The end-user can build an SPSW numerical model and define all required analysis parameters directly and with various options. For analysis, the package can generate a TCL script as an input on the run-time using OpenSees [31] as a background process to analyze the created model. All captured results can be represented in organized graphs, tables, or simple 2D animation. The statement asserts that 3D effects and plan configurations in building codes are usually not system-specific and can be adequately represented through 2D models. Therefore, in most cases, 2D representations are sufficient. However, in rare instances where 3D effects cannot be adequately captured through 2D models, a 3D model may be necessary. The FEMA-P695 methodology permits using 2D modeling (which neglects torsional effects) instead of 3D modeling for regular structures without torsional irregularities.
The UI was designed to be unitless to facilitate diverse unit systems’ preferences. With this tool, designers can gain profound insights into the model behavior via modal analysis, monotonic pushover analysis, cyclic displacement loading, and time-history dynamic analysis for earthquake ground motions and other dynamic loads. All data would be saved in a file with a unique format to avoid repetition, and any changes can easily be added to a previous model. INSPECT-SPSW was developed with the C# programming language and “.NET” libraries for all UI components. This tool is executable in Windows-based operating systems, such as Windows 10. The “.NET” Framework Version 4.7.2 or higher must be installed.
In OpenSees, creating a Truss element with a Hysteretic material reference is conventional to describe each infill strip’s ultimate strength and deterioration behavior. Leaning column elements are modeled by elasticBeamColumn with rotational springs with a relatively small length and material stiffness at both ends to simulate moment release, as documented in the pushover analysis example for a 2-story moment frame provided by the OpenSees user manual [49]. Moreover, each rigid link element is represented with a Truss element command assigned to a relatively high cross-sectional area compared to the adjacent HBE. On the other hand, many techniques can be used to model boundary elements with nonlinear deterioration behavior. For example, a straightforward approach used in an evaluation study by S. A. Jalali and M. Banazadeh [50] depends on displacement-formulated distributed plasticity with fiber sections and the dispBeamColumn element command with three integration points for each frame segment (node-to-node element). Alternatively, applying Shishkin et al.’s [26] proposal for modeling plastic hinges at a discrete point requires a zeroLengthSection element assigned to a fiber-based section. The material definition should be modified as stress versus (strain × plastic hinge length) for this element. Another adopted technique, recommended by R. Purba and M. Bruneau [30], is modeling every frame segment by beamWithHinges (BCH) element command. In this method, the plastic hinge length was smaller for BCH elements in the inner segments, where plastic deformations were not expected to happen (typically assumed as one-tenth of the determined plasticity region length). INSPECT-SPSW was designed to implement any previously mentioned methods for user convenience. In addition, values for plastic hinge length and the number of integration points were kept as user-defined variables for each frame element.
Modeling structural elements with a flexible, clear, and direct scenario requires an object-oriented scheme. The design permits multiple material instances with simple graphs for model materials’ definitions. Four materials’ behaviors are available: Elastic behavior, elastic-perfectly plastic, elastic-steel strain hardening plastic, and generic hysteretic behavior. These four can be further mapped to OpenSees’ [51] uniaxial material commands: Elastic, ElasticPP, Steel01, and Hysteretic, respectively. Furthermore, materials can be defined as having tension only, tension-compression symmetric curves, or generic behavior to grant a more comprehensive range of assumptions. MinMax material command limits the ends of a stress-strain relationship curve. At least one ‘frame element model’ should be defined to model geometrical nonlinearity. The definition involved selecting one of OpenSees’ [51] nonlinear element commands (dispBeamColumn, zeroLengthSection, nonlinearBeamColumn, and beamWithHinges) and setting its related properties and location relative to a frame element VBE or HBE.
Furthermore, it is possible to create multiple instances of the ‘frame element model’ and then assign each frame element in the model to a specific instance. This method ensures that users can define frame elements and plasticity properties generically with a few steps. Program resources contain an external file as a database for all AISC steel W-shaped sections in “.xml” format. Deliberately, this file was kept in a readable format and a relative path for any customizing preference of in-use sections. Frame cross-section instances can be organized by assigning unique names to the W-shape or built-up section references, flange fibers material, and web fibers material. Similarly, the infill plate’s section properties are the material reference and thickness value ( t w ). The cross-sectional area of each infill strip ( A s ) can be estimated in run-time as determined in Equation (3), where L is the infill panel width, h is the infill panel height, n is the number of strips and α is the angle of tension stress (oriented from the vertical axis). The user is allowed to choose the equation of calculating α among the following: Thorburn et al. [20], Basler’s theory [52], and the Cardiff model [53]. Alternatively, a user-defined equation is also an option. The final step of setting structural elements is assigning the defined properties of frames and plates to each floor in organized tables. After defining the model elements, the user should define loading profiles and analysis object properties (algorithm, system, constraints, numberer, integrator, and analysis commands) according to their preferences.
A s = L cos α + h sin α   t w n
Software architecture was determined to be efficient and straightforward for the defined problem. It consists of three logical layers, as identified in the flow chart in Figure 6. The first layer represents the user’s controls, and each one is responsible for receiving model properties from the designer and visualizing the results. The second layer is an adapter component required to generate the TCL script in run-time as input for OpenSees [51] and extract the results from the output files. OpenSees packages could be considered the third and deepest layer.
The UI contains a 2D viewer to visualize the primary model, animate the deformations concerning time for lateral analysis, edit shapes, and plot diagrams of normal forces, shear forces, and bending moments. Furthermore, the flow chart in Figure 6 and the main program window in Figure 7 show that UI design prefers a chain of user-based commands, each representing a stage in the model creation process based on a group of parameters. The design only permits users to move from the current user control to the immediate control before or after the current. However, moving forward requires logical validity of all in-use input fields to avoid analysis errors and warns users of logical mistakes as early as possible. Moreover, the model file automatically updates the user’s current control change. Table 1 describes the UI process from model to results.

3. Results and Illustrative Examples

The assessment plan for this package had two different phases. First, some arbitrarily selected models with various parameters were used to conduct the coding and development stage of the quality control procedure. This approach is practical as it tests the effects of the individual fields on the logical workflow, the UI validation functions, and the components of the constructing program. Second, the testing procedure becomes more sophisticated and efficient after completing the development process, and an executable usable version becomes available. This phase aimed to assess the program’s accuracy, usability, and significance as a one-unit or a black box. It was based on previously published SPSW analytical designs and experiments. This section briefly represents some models and test cases used in the second phase of the testing process.

3.1. Verification with a Numerical Study

Part of R. Purba’s and M. Bruneau’s [30] investigation of SPSW design approaches was from considering boundary moment-resisting frames in resisting story shear forces or neglecting their contributions. Six main SPSW archetypes were prepared for a parametric dataset: three-story to ten-story office premises (i.e., each archetype was designed in conventional and balanced design methods). The analysis process depended on OpenSees [51] for its ability to model the nonlinear behavior of tension-only strips (infill axial hinges) during cyclic deformations. Materials were assumed to follow the proposed stress-strain curves of accompanying research [29], with 30 ksi and 50 ksi yield stress values for panel strips and frame elements, respectively. The Hysteretic uniaxial material command was used to model frame element materials. Pinching factors for force and deformation during reloading was set to 1.0.
In contrast, the damage parameters due to ductility and energy were set to zero. The last two parameters were determined to be zero because their effects on the deterioration of SPSWs were deemed negligible based on many experimental reports. The same assumptions were used for infill strip materials, except the force pinching factor was determined to be a small value (typically equal to 10−5). The purpose of this small value is to simulate zero-strength during compressive fields first, then a reset to the compression onset point before tension reloading, and to reload in tension till the maximum plastic strain is reached in earlier cycles. Based on a side comparison for all nonlinear modeling material options in OpenSees [51] on a simple cantilever structure, it was decided to model all VBE and HBE segments as beamWithHinges (BWH) with plastic Hinge length (Lp) set to 0.9 of the elements’ section depth at Beam-column connections and one-tenth of that value at in-span connections (with infill strips elements). Plastic zones were assigned to a very concentrated fiber section. The cross-sections were vertically divided into 65 fibers (16 fibers on both the flanges and 33 on the web), as all fibers have similar tributary areas. Assessment of the models’ collapse potential through monotonic pushover curves included estimating system overstrength (Ωo) and period-based ductility (μT). These parameters are defined as follows:
Ω o =   V m a x V d ; μ T = δ u δ y , e f f
In Equation (4), for a given SPSW design, Vmax and Vd represent the ultimate and design base shear strength, respectively. While the δu and δy, eff are the maximum and effective yield top displacements.
This dataset was used as a benchmark for testing INSPECT-SPSW, as it provides variety in several parameters, specific, meaningful results, and realistic in-practice designs. Additionally, it was dependent on the same finite element software OpenSees [51]). The purpose of testing is to measure the accuracy of the results, the usability as a model generator (e.g., defining materials, customizing cross-section properties, and assigning them to frame elements as designed), and the overall functionality. Upon modeling all archetypes using INSPECT-SPSW, the results demonstrated excellent agreement with the published results. As such, the results confirmed the previous studies’ conclusion that SPSWs designed as story shears, shared among the frame elements and thin plates, will lead to excessive and potentially unacceptable drifts. Comparing the obtained pushover results to their published counterparts reveals only minute and negligible differences, as seen in Figure 8. This slight difference could be attributed to the selected number of steps for the pushover analysis, the selected convergence tolerance, the selected solution algorithm, or a slight difference in infill strips’ vertical angle α. INSPECT-SPSW automatically adjusts the average value of α to have equal lengths in frame element segments, as permitted by the AISC-SPSW design guide [25]. Overall, the validation and verification process outcomes are satisfactory and promising in accurately generating a TCL input script, running OpenSees, then correctly extracting and displaying output.

3.2. Modeling of Experimental Specimens

In many experiments, SPSWs exhibited high initial stiffness, strength, and ductility during cyclic pushover tests. INSPECT-SPSW can map or replicate experimental results as a numerical model. Some well-known SPSW experiments were referenced to ensure this scenario. Previously, specimen degradation modes assumed nonlinear material behavior in each case. The main concern was not how identical the results were between numerical models and previous experiments but how far the program’s components and options were valuable and convenient to the user. In other words, the priority was asserting that creating a model, modifying it, or reading results could be completed with the least number of steps possible. This testing pattern showed that the main logic was implemented and programmed correctly, especially for material definition and plastic element modeling. More identical results could be obtained by investing more time predicting materials or inputting more details about applied cyclic loads. Table 2 summarizes the outputted results for different test cases, and the numerical assumption for each case is demonstrated as follows:

3.2.1. Single Story SPSW: Vian and Bruneau Specimen

In 2005, Vian and Bruneau [54] tested a single solid panel SPSW specimen, whose dimensions were 4000 mm wide by 2000 mm high (center to center). The selected beam and column sections were W18 × 65 and W18 × 71, respectively. In addition, reduced beam sections (RBSs) were implemented in the SPSW “anchor” beams to guarantee that flexural frame hinges will form at beam edges (rather than intermediate locations along beams or columns). All frame members were fabricated from ASTM A572 steel with a minimum yield strength of 345 MPa. The infill plate was specified to be 2.6 mm thick, in 2000 mm by 1230 mm sections, with yield and ultimate stresses of 165 and 305 MPa, respectively. The experiments were executed using displacement-controlled quasistatic cyclic loading, beginning with three cycles at 0.1% drift amplitude and gradually increasing until 7% inter-story drift. As a result, the system reached an ultimate base shear of 2115 kN at 2.5% drift amplitude. Then, cracks were noted at both panel corners of the column wall.
Moreover, fractures at the bottom beam RBSs triggered a strength deterioration of 18% from the peak strength at 3.0% inter-story drift. The numerical model consisted of dual 15-panel strips inclined at 45°. RBSs were modeled as flexural zero-length hinges (zeroLengthSection) located at a distance, d/2, of beam ends with a plastic hinge length of d/2. Infill axial hinges were assigned to material with a tension behavior of 2% strain hardening from the yield strain (εy) to 9 εy, then a plateau until 10.7 εy, and finally, a direct failure to reflect the experimental cracks. The infill hinges’ compression behavior was modeled as elastic-perfectly plastic with relatively small stress (0.25 of the tensile yielding stress) to add the small contribution of infill plates in compression resistance. The nonlinear behavior for fibers in the flexural hinges of beams was assumed to be tension-compression symmetric with 2% strain hardening from εy to 0.02 strain. Its deterioration stage was defined from 0.022 to 0.036 strain values accompanied by a 40% strength reduction from the ultimate stress, and then it plateaus. The numerical model produced similar behavior to the experiment, as shown in Figure 9. The peak base shear equaled 2135 kN and occurred at 2.6% inter-story drift. Gradually, infill strips started to reach failure strain one by one, and the strength of flexural hinges in beams began to degrade, causing a 20% reduction from the ultimate base shear at 3.2% drift.

3.2.2. Two-Story SPSW: Qu et al. Specimen

In 2008, Qu et al. [55] experimentally investigated the lateral behavior of two-story SPSW with RBS connections and composite floors. The Specimens had a typical floor height of 4000 mm and an aspect ratio equal to 1.0 for panels at each story. H-shaped steel sections (equivalent to the United States designation W-shapes) were selected for frame elements as follows; H 532 × 314 × 25 × 40 for columns, H 446 × 302 × 13 × 21 for top beam, H 350 × 252 × 11 × 19 for intermediate beam, and H 458 × 306 × 17 × 27 for the bottom beam. The names of H-shapes follow the Taiwan designation that identifies, in order, their depth, flange width, web thickness, and flange thickness. The infill panels were 3.2 mm and 2.3 mm thick, with the measured yield strength of 310 and 285 MPa at the first and second stories. Frame elements of A572 Grade 50 steel members were fabricated, and SS400 steel material was used for infill panels. Several material tests were conducted to determine each element’s yield and ultimate strengths. The results of specimen cyclic pushover reveal an ultimate base shear of 4245 kN at 3.0% first story drift and a collapse at 5.2% amplitude drift accompanied by 44% strength degradation. Failure modes were a WT in the first story infilled panel, an FBE of the intermediate beam, and minor tearings at the infill plate corners on the top story. The numerical description for plasticity included (1) flexural zero-length hinges (zeroLengthSection) assigned to a plastic hinge length of d/2, (2) a nonlinear frame element with a length of 0.9 d (nonlinearBeamColumn) at the start of each column (number of integration points are assumed to be 5), and (3) 15 dual axial hinge strips inclined with 41.19° vertical angle infill panels. The material behavior for infill strips was assumed to be with tension behavior, 2% strain hardening from εy to 0.018 strain, and a gradual deterioration to a zero stress for 0.025 strain accompanied with little compression strength (0.2 of yielding stress). Two models were defined for the frame elements’ material nonlinearity with 2% strain hardening from the yield strain (εy) to a strain value of 0.028 and a failure strain of 0.073. The first model did not experience strength degradation until it reached failure strain. The second model assumed a gradual deterioration in material strength that reaches up to 40% of peak stress at 0.046 strain. The hinges of intermediate beam RBSs were assumed to follow the deteriorated behavior, whereas the non-deteriorated model was used to identify plastic hinges of columns and other beams. The numerical results were almost similar to the experimental program. The modeled system achieved 4194 kN as a maximum base shear at 2.9% first story drift. Directly after the peak, the first story strips began to fail, and the strength of intermediate beam RBSs decreased from 3.7% drift. The collapse was determined at a 5.2% amplitude drift, and the final base shear was 45% less than the capping point with failures in some of the second-story panel strips. Figure 10 shows the resulting pushover curve compared to the experiment.

3.2.3. Three-Story SPSW: Choi and Park Specimen

In 2009, Choi and Park [56] tested several one-third scale models (3550 mm height) of fixed base three-story SPSW specimens with different connection methods between infill panels and surrounding frame elements. One of them (denoted as BSPW2 bolt-connected frame elements) was selected for verification. All infill plates were 2200 mm, 1000 mm, and 4 mm in width, height, and thickness, respectively. SS400 steel (Korean Standard, Fy = 240 MPa) was used for infill plates, while frame members were fabricated from SM490 steel (Korean Standard, Fy = 330 MPa). Deliberately, columns were designed with a minimal width-thickness ratio to prevent premature local buckling, achieve more significant deformations, and minimize the contribution of the moment-resisting frame action of the boundary elements in the global resistance (to determine the connection methods’ efficiency). H-shaped steel sections H 150 × 150 × 22 × 22, H 150 × 100 × 12 × 20, and H 250 × 150 × 12 × 20 were assigned to columns, intermediate and top beams, respectively. The flange and web plate elements of built-up cross-sections had met the width-thickness limits from the AISC seismic provisions [25]. The single top force cyclic program results showed that the peak occurred at 3.3% top story drift (110.5 mm top displacement) with 1961 kN maximum base shear. Before reaching the ultimate base shear, a beginning of WT in all plates was observed. However, their effect on the overall resistance propagates at a 4.4% top story drift condition until the maximum value of 5.2% (176.5 mm top displacement) with extreme infill cracks at 37% reported base shear degradation. In the numerical model, all axial hinges were assumed to have a strain hardening of 2% beyond yield. This strain-hardening continued till the peak stress reached 0.02 strain in the tension behavior and a small contribution in compression strength (5% of the tensile yielding stress). After the capping point, intermediate story strips were assumed to lose strength, gradually reaching zero stress at 0.042 strain. Conversely, infill strips’ strength was modeled to be steady in other stories. Flexural zero-length plastic hinges were added with a distance, d/2, from frame connection joints at the ends of all beam and column-base connections, using the zeroLengthSection nonlinear element command. This distance was chosen according to several performance-based guidelines (e.g., ASCE-SEI 41-17 [58]). The nonlinear behavior of frame element material involves tension-compression symmetry and no deterioration after 0.03 strain capping point. This model achieved 1971 kN maximum base shear strength for 129 mm top displacement and maximum deformation of 173 mm with 37% base shear reduction. Figure 11 highlights the similarity in the behavior among experimental works and the assumed numerical model regarding the cyclic pushover curve.

3.2.4. Four-Story SPSW: Driver et al. Specimen

Driver et al. [57] tested an SPSW specimen for a 50% scale four-story model (7421 mm height and 3050 mm width) four-story up to its maximum capacity. They showed apparent hysteretic behavior and strength degradation patterns. Infill panels’ mean static yield strength was 341 MPa for panels 1 and 2, 257 MPa for panel 3, and 262 MPa for panel 4. The design plate thickness was 4.8 mm for panels 1 and 2 and 3.4 mm for panels 3 and 4. The columns were W310 × 118 sections that were adopted along with the model height without splices. The beam section at levels 1, 2, and 3 was W310 × 60, and the beam section at level 4 was W530 × 82. The system reached the ultimate base shear of 3135 kN at 2.2% first story drift. However, the ultimate first story drift was 4.0%, with a 15% base shear reduction. Degradation behavior was presented by a significant WT at the top west corner of the first infilled panel, flanges local buckling at both edges of the east VBE of the first story, and the upper end of the west VBE. The numerical model contained several concentrated flexural hinges at beam edges and columns connected with the fixed base. Only plastic hinges of columns were assigned to a deterioration strength material represented as a gradual strength degradation after 0.033 strain and steady stress after 0.057 strain with 60% of the maximum stress. These values were meticulously determined through rigorous calibration iterations of the model, ensuring accuracy and reliability. After reaching the capping point, the material was assumed to keep the same strength as other frame elements. Similarly, the peak stress for all infill panels’ materials was determined to occur at 17 εy. Except for the first story, all infill elements would not lose this stress. This model achieved 3057 kN maximum base shear at 2.0% first story drift and 15% strength reduction at 4.1% drift, matching the experimental pushover profile, see Figure 12.

4. Discussion and Impact

The advantages of INSPECT-SPSW can be summarized as providing an accurate and well-tested program that allows SPSW designers to build a simplified strip model for multi-story single-bay SPSW and conduct finite element analyses on this model. This tool utilized OpenSees (McKenna, Scott, and Fenves 2010) capabilities to provide several options for analyzing lateral loading, defining materials’ nonlinear behavior, and modeling elements’ geometrical plasticity. It is effective for structural engineers who do not possess the programming skills needed to use OpenSees (McKenna, Scott, and Fenves 2010) and productive for all designers who need automated calculations related to geometrical node positions, elements segmentation, and load definitions. Furthermore, designing the UI as a chain of user controls, each responsible for a group of relative parameters facilitates sequencing the designer’s major decisions. Providing users with the ability to use this program effectively (given numerically and logically valid parameters) would contribute toward eliminating mistakes and reporting errors early on. The graphical representation of the results and the simplified animation viewer were designed to represent failure modes (e.g., infill plates WT, boundary elements FBE, or a combined case), and the status of each structural element’s strength through-loading cycles can be obtained directly. These graphical components would allow designers to assess the inelastic behavior of the whole model, understand the causes of numerical failure, and take enhancement actions more efficiently. A variety of users can take advantage of this design by verifying or mapping experimental results to numerical models, enhancing existing designs, or measuring the effect of a significant element on the overall system’s stability and performance. For example, in two arbitrary models shown in Figure 13 and Figure 14, the strength deterioration resulted from the second story WT in the first model, while the second model exposed FBE in the intermediate beam. The animation viewer indicated the status of each element’s resistance with a specific color and each element’s properties over time (force-deformation for axial hinges and moment-rotation for flexural hinges).
The INSPECT-SPSW package can be considered the first step toward a completely automated platform dedicated to SPSW Performance-Based Earthquake Design (PBED). Many development features may be implemented in subsequent versions beyond what has been developed thus far. For example, besides the simplified strip model, a more detailed numerical procedure depending on 3D solid elements would significantly enhance UI capabilities. Moreover, expanding the geometrical options for buildings to include 3D frames of multiple bays, irregular frames, or other special detailing variations. Furthermore, some natural development perspectives include developing multi-run features for automated design optimization, parametric investigations, and Incremental Dynamic Analysis (IDA). The crown jewel in feature development would be integrating interoperability methods within the most commonly used data management platforms, such as Computer-Aided Design (CAD), Building Information Modeling (BIM), or other si programs. This feature would create a substantially better-streamlined process of importing, exporting, translating, and retrieving data from other compatible formats and sources.
The developed codes in this UI software package can be regarded as solid demonstrations of logic scalability. The secret ingredient in this recipe was adopting Object-Oriented Programming (OOP) standards and following clean code principles throughout the entire UI development process.

5. Conclusions

SPSW systems are recognized as efficient lateral resistance systems for various building scales. The overall system stiffness provides adequate resistance in moderate load levels, and the ductility of the yielding shear panels provides damage control in case of overloading. Compared to alternative structural systems, SPSW introduced a more economical or space-efficient solution. Although SPSW buildings have been widely used since the early 1980s, no well-known software package is specialized in analyzing the lateral resistance of SPSW systems or assessing their collapse mechanism. This paper aims to introduce INSPECT-SPSW, a software package designed to facilitate achieving a streamlined realization of that objective. It produces the nonlinear structural response to several lateral load types to satisfy modern codes and standard provision requirements. The numerical modeling adopts the strip model, a reliable numerical procedure first introduced by Thorburn et al. [20] and modified by Shishkin et al. [26]. Moreover, the strip model was recommended in several codes, including the Canadian steel design standard CSA S16-14 [19] and the AISC seismic provisions [25]. The program aims to automatically produce a TCL script to model SPSWs in the OpenSees platform through interactive UI. The UI allows users to create analysis scenarios, set parameters, execute them, then extract and save the computational results. This workflow automates many geometrical calculations and eliminates the advanced programming barrier.
Moreover, the results graphical visualization feature enables seamless identification of failure mechanisms and event sequence throughout the analysis. A thorough validation and verification process was conducted against several published experimental results from the literature. For example, the INSPECT-SPSW yielded numerical results with impressive accuracy. The average ratios achieved were 96%, 99%, 101%, and 103% for drift at maximum base shear, maximum base shear, maximum drift, and strength reduction at maximum drift, respectively, compared to the corresponding experimental results. This highlights the robustness and reliability of the INSPECT-SPSW approach in predicting critical parameters related to the seismic performance of structures. With demonstrated performance and intuitive UI, INSPECT-SPSW is expected to facilitate the broad adoption of the strip method for PBED of SPSWs.

Author Contributions

Conceptualization, M.A.; methodology, M.A.; software, A.M.M.; validation, A.M.M. and M.A.; formal analysis, A.M.M. and M.A.; investigation, M.A., A.M.M. and M.E.; resources, M.A.; data curation, A.M.M.; writing—original draft preparation, A.M.M.; writing—review and editing, M.A. and M.E.; visualization, A.M.M., M.A. and M.E.; supervision, M.A.; project administration, M.A.; funding acquisition, M.A. All authors have read and agreed to the published version of the manuscript.

Funding

This research was financially supported by the American University of Sharjah (AUS) through the Faculty Research Grant program (FRG20-M-E152) and the Open Access Program (OAP). The authors greatly appreciate this financial support. This paper represents the opinions of the authors and does not intend to represent the position or opinions of the AUS.

Data Availability Statement

All data, models, or code generated or used during the study are available in a repository or online in accordance with funder data retention policies. All materials can be found at the following link: https://github.com/alhamaydeh/INSPECT-SPSW_2 (accessed on 16 March 2023).

Acknowledgments

The authors greatly appreciate the financial support from AUS. This paper represents the opinions of the authors and does not intend to represent the position or opinions of the AUS.

Conflicts of Interest

The authors declare no conflict of interest.

References

  1. Daryan, A.S.; Salari, M.; Palizi, S.; Farhoudi, N. Size and layout optimum design of frames with steel plate shear walls by metaheuristic optimization algorithms. Structures 2023, 48, 657–668. [Google Scholar] [CrossRef]
  2. Parvizi, M.; Fathi, M.; Zamani, S.S.M.; Shakib, H.; Karami, A. Experimental and numerical study of concrete frames with steel plate shear walls. J. Constr. Steel Res. 2022, 196, 107404. [Google Scholar] [CrossRef]
  3. Yu, J.-G.; Zhu, S.-Q.; Feng, X.-T. Seismic behavior of CFRP-steel composite plate shear wall with edge reinforcement. J. Constr. Steel Res. 2023, 203, 107816. [Google Scholar] [CrossRef]
  4. Nateghi-Alahi, F.; Khazaei-Poul, M. Analytical Study on the Strengthened Steel Plate Shear Walls by FRP Laminate. Procedia Eng. 2013, 54, 377–386. [Google Scholar] [CrossRef]
  5. Du, Y.; Gao, D.; Chen, Z.; Yan, J.-B.; Jia, P.; Dong, S. Experimental and theoretical investigation of FRP-steel composite plate under cyclic tensile loading. Thin-Walled Struct. 2023, 183, 110358. [Google Scholar] [CrossRef]
  6. AlHamaydeh, M.; Sagher, A. Key parameters influencing the behavior of Steel Plate Shear Walls (SPSW). In Proceedings of the 2017 7th International Conference on Modeling, Simulation, and Applied Optimization (ICMSAO), Sharjah, United Arab Emirates, 4–6 April 2017; pp. 1–6. [Google Scholar] [CrossRef]
  7. AlHamaydeh, M.; Elayyan, L. Impact of diverse seismic hazard estimates on design and performance of steel plate shear walls buildings in Dubai, UAE. In Proceedings of the 2017 7th International Conference on Modeling, Simulation, and Applied Optimization, ICMSAO, Sharjah, United Arab Emirates, 4–6 August 2017; pp. 1–3. [Google Scholar] [CrossRef]
  8. Elkafrawy, M.; Alashkar, A.; Hawileh, R.; AlHamaydeh, M. FEA Investigation of Elastic Buckling for Functionally Graded Material (FGM) Thin Plates with Different Hole Shapes under Uniaxial Loading. Buildings 2022, 12, 802. [Google Scholar] [CrossRef]
  9. Alashkar, A.; Elkafrawy, M.; Hawileh, R.; AlHamaydeh, M. Buckling Analysis of Functionally Graded Materials (FGM) Thin Plates with Various Circular Cutout Arrangements. J. Compos. Sci. 2022, 6, 277. [Google Scholar] [CrossRef]
  10. AlHamaydeh, M.; Elayyan, L.; Najib, M. Impact of Eliminating Web Plate Buckling on the Design, Cost and Seismic Performance of Steel Plate Shear Walls. In Proceedings of the 2015 International Conference on Steel and Composite Structures (ICSCS15), Incheon, Republic of Korea, 25–29 August 2015; Available online: https://www.researchgate.net/publication/282734007_Impact_of_Eliminating_Web_Plate_Buckling_on_the_Design_Cost_and_Seismic_Performance_of_Steel_Plate_Shear_Walls?channel=doi&linkId=5714d99008aebda86c0d2182&showFulltext=true (accessed on 16 April 2023).
  11. Hou, J.; Guo, L.; Gao, S.; Chen, J.; Xu, H. Out-plane interaction behavior of partially buckling-restrained steel plate shear walls. Thin-Walled Struct. 2023, 183, 110352. [Google Scholar] [CrossRef]
  12. Zhao, Q.; Qiu, J.; Li, Y.; Yu, C. Lateral behavior and PFI model of sinusoidal corrugated steel plate shear walls. J. Constr. Steel Res. 2023, 203, 107812. [Google Scholar] [CrossRef]
  13. Hou, J.; Guo, L.; Zhong, H.; Gao, S.; Chen, J. Hysteretic behavior of partially buckling-restrained steel plate shear walls with coupled restraining steel tubes. Eng. Struct. 2023, 276, 115388. [Google Scholar] [CrossRef]
  14. Sun, H.-J.; Guo, Y.-L.; Wen, C.-B.; Zuo, J.-Q. Local and global buckling prevention design of corrugated steel plate shear walls. J. Build. Eng. 2023, 68, 106055. [Google Scholar] [CrossRef]
  15. AlHamaydeh, M.; Elkafrawy, M.; Banu, S. Seismic Performance and Cost Analysis of UHPC Tall Buildings in UAE with Ductile Coupled Shear Walls. Materials 2022, 15, 2888. [Google Scholar] [CrossRef]
  16. AlHamaydeh, M.; Elkafrawy, M.E.; Amin, F.M.; Maky, A.M.; Mahmoudi, F. Analysis and design of UHPC tall buildings in UAE with ductile coupled shear walls lateral load resisting system. In Proceedings of the 2022 Advances in Science and Engineering Technology International Conferences (ASET), Dubai, United Arab Emirates, 21–24 February 2022; pp. 1–6. [Google Scholar] [CrossRef]
  17. AlHamaydeh, M.; Elkafrawy, M.E.; Kyaure, M.; Elyas, M.; Uwais, F. Cost effectiveness of UHPC ductile coupled shear walls for high-rise buildings in UAE subjected to seismic loading. In Proceedings of the 2022 Advances in Science and Engineering Technology International Conferences (ASET), Dubai, United Arab Emirates, 21–24 February 2022; pp. 1–6. [Google Scholar] [CrossRef]
  18. AlHamaydeh, M.; Elkafrawy, M.E.; Aswad, N.G.; Talo, R.; Banu, S. Evaluation of UHPC tall buildings in UAE with ductile coupled shear walls under seismic loading. In Proceedings of the 2022 Advances in Science and Engineering Technology International Conferences (ASET), Dubai, United Arab Emirates, 21–24 February 2022; pp. 1–6. [Google Scholar] [CrossRef]
  19. S16-01; Limit States Design of Steel. Canadian Standard Association (CSA): Toronto, ON, Canada, 2003.
  20. Thorburn, C.J.; Kulak, L.J.; Montgomery, G.L. Analysis of Steel Plate Shear Walls; Department of Civil Engineering, University of Alberta: Edmonton, AB, Canada, 1983. [Google Scholar] [CrossRef]
  21. Timler, P.A.; Kulak, G.L. Experimental Study of Steel Plate Shear Walls; Department of Civil Engineering, University of Alberta: Edmonton, AB, Canada, 1983. [Google Scholar]
  22. Feng, L.; Sun, T.; Ou, J. Elastic buckling analysis of steel-strip-stiffened trapezoidal corrugated steel plate shear walls. J. Constr. Steel Res. 2021, 184, 106833. [Google Scholar] [CrossRef]
  23. Ozcelik, Y.; Clayton, P.M. Strip model for steel plate shear walls with beam-connected web plates. Eng. Struct. 2017, 136, 369–379. [Google Scholar] [CrossRef]
  24. Ozcelik, Y. Expeditious strip model for steel plate shear walls with beam-connected web plates. J. Constr. Steel Res. 2021, 184, 106799. [Google Scholar] [CrossRef]
  25. AISC 341-10; American Institute of Steel Construction, Seismic Provisions for Structural Steel Buildings. American Institute of Steel Construction: Chicago, IL, USA, 2010.
  26. Shishkin, J.J.; Driver, R.G.; Grondin, G.Y. Analysis of Steel Plate Shear Walls Using the Modified Strip Model. J. Struct. Eng. 2009, 135, 1357–1366. [Google Scholar] [CrossRef]
  27. Purba, R.; Bruneau, M. Case Study on the Impact of Horizontal Boundary Elements Design on Seismic Behavior of Steel Plate Shear Walls. J. Struct. Eng. 2012, 138, 645–657. [Google Scholar] [CrossRef]
  28. Dassault Systèmes Simulia Corp. ABAQUS/Standard User’s Manual; Dassault Systèmes Simulia Corp: Providence, RI, USA, 2009. [Google Scholar]
  29. Purba, R.; Bruneau, M. Seismic Performance of Steel Plate Shear Walls Considering Two Different Design Philosophies of Infill Plates. I: Deterioration Model Development. J. Struct. Eng. 2014, 141, 040141160. [Google Scholar] [CrossRef]
  30. Purba, R.; Bruneau, M. Seismic Performance of Steel Plate Shear Walls Considering Two Different Design Philosophies of Infill Plates. II: Assessment of Collapse Potential. J. Struct. Eng. 2014, 141, 040141161. [Google Scholar] [CrossRef]
  31. OpenSees. Open System for Earthquake Engineering Simulation. Available online: https://opensees.berkeley.edu/ (accessed on 2 April 2023).
  32. Elkafrawy, M.E.; Khalil, A.M.; Abuzaid, W.; Hawileh, R.A.; AlHamaydeh, M. Nonlinear finite element analysis (NLFEA) of pre-stressed RC beams reinforced with iron-based shape memory alloy (Fe-SMA). In Proceedings of the 2022 Advances in Science and Engineering Technology International Conferences (ASET), Dubai, United Arab Emirates, 21–24 February 2022; pp. 1–7. [Google Scholar] [CrossRef]
  33. Khalil, A.E.-H.; Etman, E.; Atta, A.; Essam, M. Nonlinear behavior of RC beams strengthened with strain hardening cementitious composites subjected to monotonic and cyclic loads. Alex. Eng. J. 2016, 55, 1483–1496. [Google Scholar] [CrossRef]
  34. Khalil, A.; Elkafrawy, M.; Abuzaid, W.; Hawileh, R.; AlHamaydeh, M. Flexural Performance of RC Beams Strengthened with Pre-Stressed Iron-Based Shape Memory Alloy (Fe-SMA) Bars: Numerical Study. Buildings 2022, 12, 2228. [Google Scholar] [CrossRef]
  35. Markou, G.; AlHamaydeh, M. 3D Finite Element Modeling of GFRP-Reinforced Concrete Deep Beams without Shear Reinforcement. Int. J. Comput. Methods 2017, 15, 1850001. [Google Scholar] [CrossRef]
  36. OpenSees. User-Friendly Tools. Available online: https://opensees.berkeley.edu/OpenSees/user/tools.php (accessed on 31 March 2023).
  37. Yang, T.; Schellenberg, A. OpenSees Navigator, Pacific Earthquake Engineering Research Center (PEER). Available online: https://openseesnavigator.berkeley.edu/ (accessed on 2 April 2023).
  38. Team, N. NextFEM. Available online: https://www.nextfem.it/it/home/ (accessed on 2 April 2023).
  39. Chen, D. ETO(ETABS To OpenSees). Available online: http://www.dinochen.com/article.asp?id=149 (accessed on 2 April 2023).
  40. Papanikolaou, T.; Kartalis-Kaounis, V.K.; Protopapadakis, T.; Papadopoulos, V.K. GiD+OpenSees Interface: An Integrated Finite Element Analysis Platform; Laboratory of R/C and Masonry Structures, Aristotle University of Thessaloniki: Thessaloniki, Greece, 2017. [Google Scholar]
  41. AlHamaydeh, M.; Siddiqi, M. OpenSEES GUI for elastomeric seismic isolation systems. In Proceedings of the First Eurasian Conference on OpenSEES (OpenSEES Days Eurasia), Hong Kong, China, 20–21 June 2019. [Google Scholar]
  42. AlHamaydeh, M.; Najib, M.; Alawnah, S. INSPECT: A graphical user interface software package for IDARC-2D. Softwarex 2016, 5, 243–251. [Google Scholar] [CrossRef]
  43. Alhamaydeh, M.; Aly, N.; Najib, M.; Alawnah, S. INSPECT-PBEE: A performance-based earthquake engineering GUI for IDARC-2D. Softwarex 2019, 9, 132–144. [Google Scholar] [CrossRef]
  44. ElSinawi, A.H.; Jhemi, A.; AlHamaydeh, M. Adaptive seismic isolation of structures using MR-fluid dampers. In Proceedings of the 2013 5th International Conference on Modeling, Simulation and Applied Optimization (ICMSAO), Hammamet, Tunisia, 28–30 April 2013; pp. 1–6. [Google Scholar] [CrossRef]
  45. AlHamaydeh, M.; Aly, N.; Galal, K. Seismic response and life-cycle cost of reinforced concrete special structural wall buildings in Dubai, UAE. Struct. Concr. 2017, 19, 771–782. [Google Scholar] [CrossRef]
  46. Aly, N.; Alhamaydeh, M.; Galal, K. Quantification of the Impact of Detailing on the Performance and Cost of RC Shear Wall Buildings in Regions with High Uncertainty in Seismicity Hazards. J. Earthq. Eng. 2018, 24, 421–446. [Google Scholar] [CrossRef]
  47. Shokrabadi, M.; Banazadeh, M.; Mellati, A. Assessment of seismic risks in code conforming reinforced concrete frames. Eng. Struct. 2015, 98, 14–28. [Google Scholar] [CrossRef]
  48. Li, H.; Li, J.; Farhangi, V. Determination of piers shear capacity using numerical analysis and machine learning for generalization to masonry large scale walls. Structures 2023, 49, 443–466. [Google Scholar] [CrossRef]
  49. Eads, L. Pushover Analysis of 2-Story Moment Frame; OpenSees Structural Examples. 2012. Available online: https://opensees.berkeley.edu/wiki/index.php/Pushover_Analysis_of_2-Story_Moment_Frame (accessed on 16 April 2023).
  50. Jalali, S.A.; Banazadeh, M. Computer-based evaluation of design methods used for a steel plate shear wall system. Struct. Des. Tall Spéc. Build. 2016, 25, 904–925. [Google Scholar] [CrossRef]
  51. McKenna, F.; Scott, M.H.; Fenves, G.L. Nonlinear Finite-Element Analysis Software Architecture Using Object Composition. J. Comput. Civ. Eng. 2010, 24, 95–107. [Google Scholar] [CrossRef]
  52. Basler, K. Strength of Plate Girders in Shear. J. Struct. Div. 1961, 87, 151–180. [Google Scholar] [CrossRef]
  53. Evans, H.; Porter, D.; Rockey, K. The collapse behaviour of plate girders subjected to shear and bending. Available online: https://www.e-periodica.ch/digbib/view?pid=bse-pe-004:1978:2::34#187 (accessed on 16 April 2023).
  54. Vian, D.; Bruneau, M.; Hall, K. Steel Plate Shear Walls for Seismic Design and Retrofit of Building Structures; State University of New York at Buffalo: Buffalo, NY, USA, 2005. [Google Scholar]
  55. Qu, B.; Bruneau, M.; Lin, C.-H.; Tsai, K.-C. Experimental Investigation of Full-Scale Two-Story Steel Plate Shear Walls with Reduced Beam Section Connections; Multidisciplinary Center for Earthquake Engineering Research: Buffalo, NY, USA, 2008. [Google Scholar]
  56. Choi, I.-R.; Park, H.-G. Steel Plate Shear Walls with Various Infill Plate Designs. J. Struct. Eng. 2009, 135, 785–796. [Google Scholar] [CrossRef]
  57. Driver, R.G.; Kulak, G.L.; Kennedy, D.J.L.; Elwi, A.E. Cyclic Test of Four-Story Steel Plate Shear Wall. J. Struct. Eng. 1998, 124, 112–120. [Google Scholar] [CrossRef]
  58. ASCE/SEI 41-17; Seismic Evaluation and Retrofit of Existing Buildings. American Society of Civil Engineers: Reston, VA, USA, 2017.
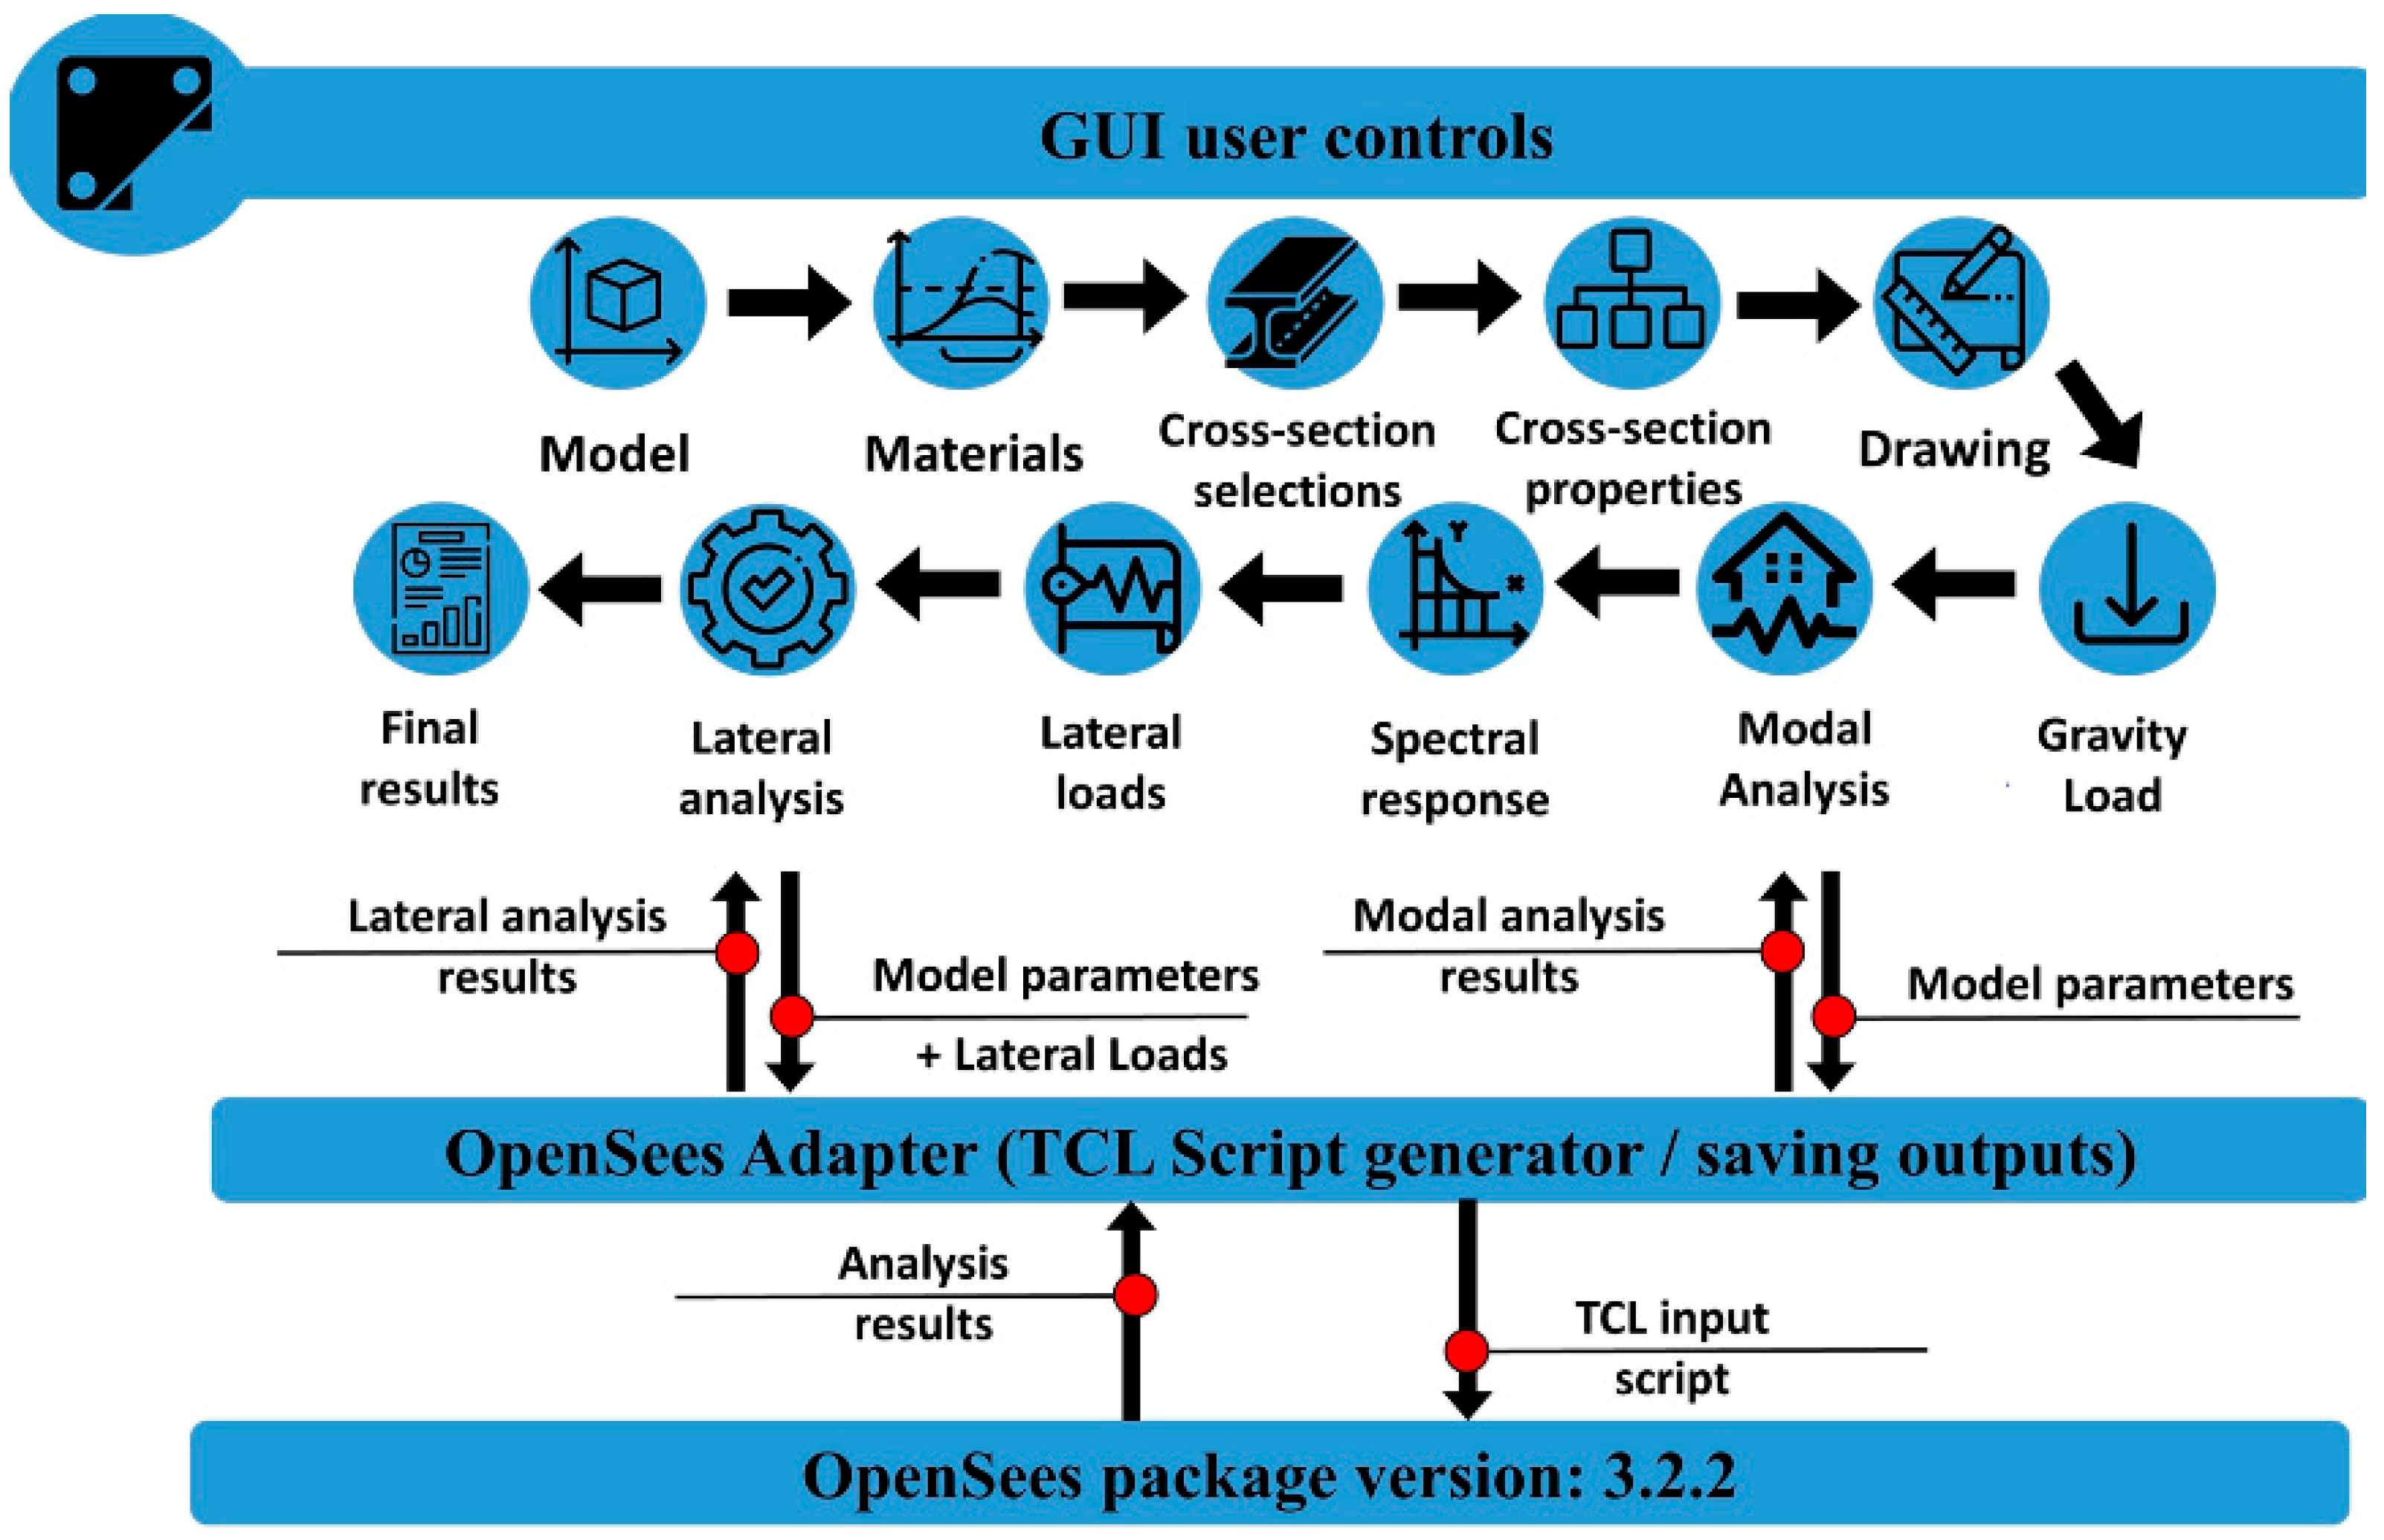
Figure 1. The strip model by Thorburn et al. [20].
Buildings 13 01078 g001
Figure 2. The modified strip model by Shishkin et al. [26].
Buildings 13 01078 g002
Figure 3. Frame-joint arrangement for moment-resisting connections in the modified strip model by Shishkin et al. [26].
Buildings 13 01078 g003
Figure 4. Degradation models by R. Purba and M. Bruneau [29]; (a) strips; (b) boundary elements.
Buildings 13 01078 g004
Figure 5. Nonlinear model for collapse simulation [27]; example structural model of a three-story archetype.
Buildings 13 01078 g005
Figure 6. Flow chart of INSPECT-SPSW architecture.
Buildings 13 01078 g006
Figure 7. Illustration for INSPECT-SPSW components.
Buildings 13 01078 g007
Figure 8. Comparison of monotonic pushover analysis curves published by R. Purba and M. Bruneau [30] and solved by INSPECT-SPSW for the SW320 model.
Buildings 13 01078 g008
Figure 9. Comparison between numerical and experimental pushover curves for the single-story specimen by Vian and Bruneau [54].
Buildings 13 01078 g009
Figure 10. Comparison between numerical and experimental pushover curves for the two-story specimen by Qu et al. [55].
Buildings 13 01078 g010
Figure 11. Comparison between numerical and experimental pushover curves for the three-story specimen by Choi and Park [56].
Buildings 13 01078 g011
Figure 12. Comparison between numerical and experimental pushover curves for the four-story specimen by Driver et al. [57].
Buildings 13 01078 g012
Figure 13. Visualizing the failure mechanism in INSPECT-SPSW; (a) web tearing failure; (b) frame flexural deterioration failure.
Buildings 13 01078 g013
Figure 14. Representing elements’ local behavior; (a) axial force-deformation relation for an axial hinge in a monotonic pushover; (b) flexural moment-section rotation relation for a flexural plastic hinge through cyclic pushover.
Buildings 13 01078 g014
Table 1. The primary user controls for INSPECT-SPSW.
User Control Main Functions
Modelcreates general model parameters: number of stories, plate width, floor heights, base fixation model, number of plate strips, and the method to calculate tension stress angle.
Materialsdefines nonlinearity parameters: materials stress-strain curves and frame element models.
Cross-section selectionsselects the used W-shape sections from the entire database of sections.
Cross-section propertiesdefines frame cross-section properties for frame elements and infill plates.
Drawingassigns selected sections and frame elements model for each story infill plate and boundary elements.
Gravity loaddefines gravity loads for SPSW and the leaning column for each story.
Modal analysisSets the number of mode shapes, runs a TCL script for modal analysis, and shows the modal analysis results regarding Eigenvalue, period time, frequency modal mass participation factor, and the deformed mode of all solved modes.
Spectral responseSets design spectral response acceleration parameter at short periods and 1-s period (SDS) and (SD1), response modification coefficient (R-factor), Importance factor (I), and system overstrength (Ωo) for calculating spectral response, natural period (T), seismic response coefficient ( C s ) and design base shear ( V d ) .
Lateral loadsidentifies the type of lateral load (monotonic pushover, cyclic loading, or time history dynamic analysis) and sets the sub-parameters, such as maximum drift displacement control, damping coefficients, or cycling loading record.
Lateral analysistriggers an event to generate a TCL script for lateral analysis, notifying the user if the analysis process is successful or not, providing the reason for failure, and reading analysis output files to restore it within the objects scheme.
Final resultsAll analysis outputs include a pushover curve, node deformations, support reactions, normal, shear forces and bending moment diagrams, connections rotations, and infill strips stress-strain curves.
Table 2. Results of cyclic pushover analyses for some SPSW experimental tests and solved numerically by INSPECT-SPSW.
Specimen Scale Measured Drift Results δ y (%) V m a x (kN) δ u (%) Δ V (%)
TS1Full scale (1/1)Inter-story driftexperimental2.521153.018
numerical2.621353.220
TS2Full scale (1/1)first story driftexperimental3.042455.244
numerical2.941945.245
TS3one-third scale (1/3)top story driftexperimental3.319615.237
numerical3.119715.037
TS4half-scale (1/2)first story driftexperimental2.231354.015
numerical2.030574.115
Note: δ y = drift of the Maximum base shear; V m a x = Maximum base shear strength; δ u = Maximum achieved Drift; Δ V = Strength reduction at maximum Drift; TS1 = Single Story SPSW by Vian and Bruneau Specimen [54]—(S2); TS2 = Two-Story SPSW by Qu et al. Specimen [55]; TS3 = Three-Story SPSW by Choi and Park Specimen [56]—(BSPW2); TS4 = Four-Story SPSW by Driver et al. Specimen [57].
Disclaimer/Publisher’s Note: The statements, opinions and data contained in all publications are solely those of the individual author(s) and contributor(s) and not of MDPI and/or the editor(s). MDPI and/or the editor(s) disclaim responsibility for any injury to people or property resulting from any ideas, methods, instructions or products referred to in the content.

