3.3. Numerical Modelling
The
SeismoStruct software platform [
30] was used to develop nonlinear analysis models for both the bare and infilled frames.
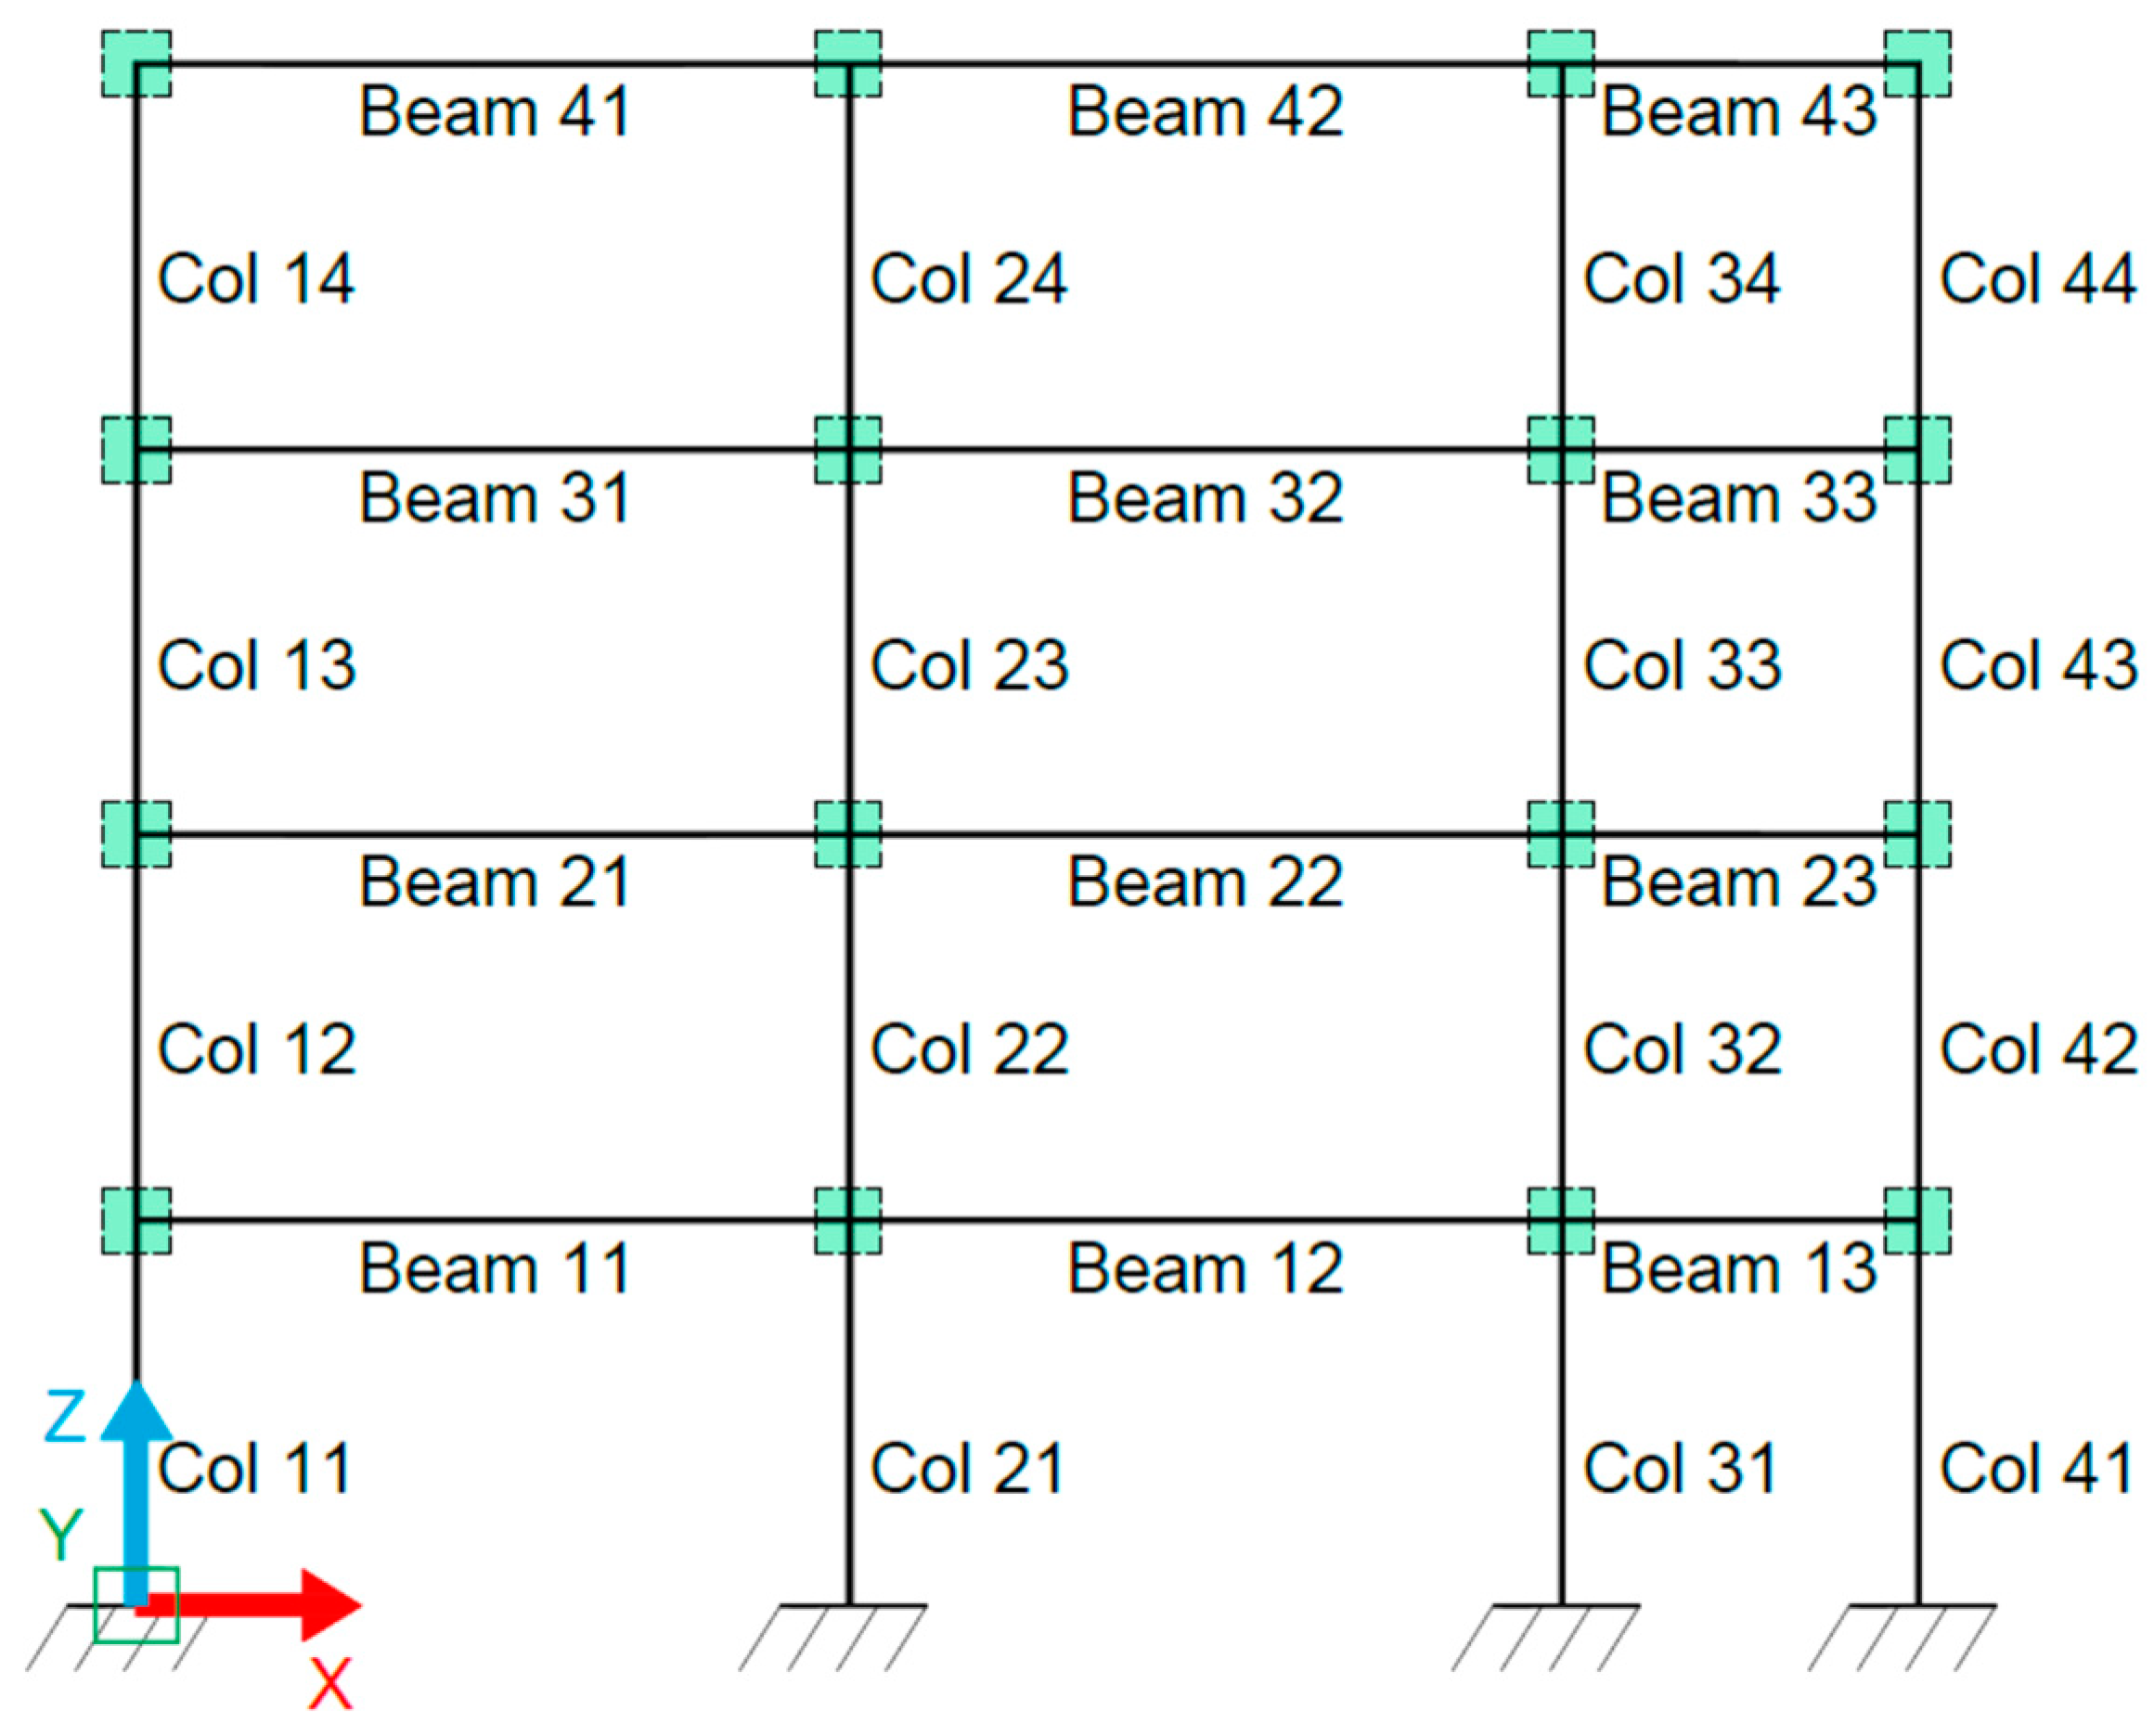
Figure 13 displays the general characteristics of the BF model. The RC frame members were modelled using a distributed plasticity model with approximately 200 fibres per cross-section. A force-based FE formulation was implemented, with one FE per member and five integration sections per element, following the recommendations of Calabrese et al. [
31]. The cyclic behaviour of the concrete and steel rebar materials were respectively defined using the Mander et al. model [
32] and the Menegotto and Pinto model [
33], combined with isotropic hardening rules proposed by Filippou et al. [
34]. The mechanical properties of the materials used were as follows (mean values): concrete compressive strength
; concrete tensile strength
; concrete modulus of elasticity (initial elastic stiffness)
; concrete strain at unconfined peak compressive stress
; concrete specific weight
; steel yield stress
; steel modulus of elasticity (initial elastic stiffness)
; steel strain hardening parameter
; and steel specific weight
. Further details can be found in [
10].
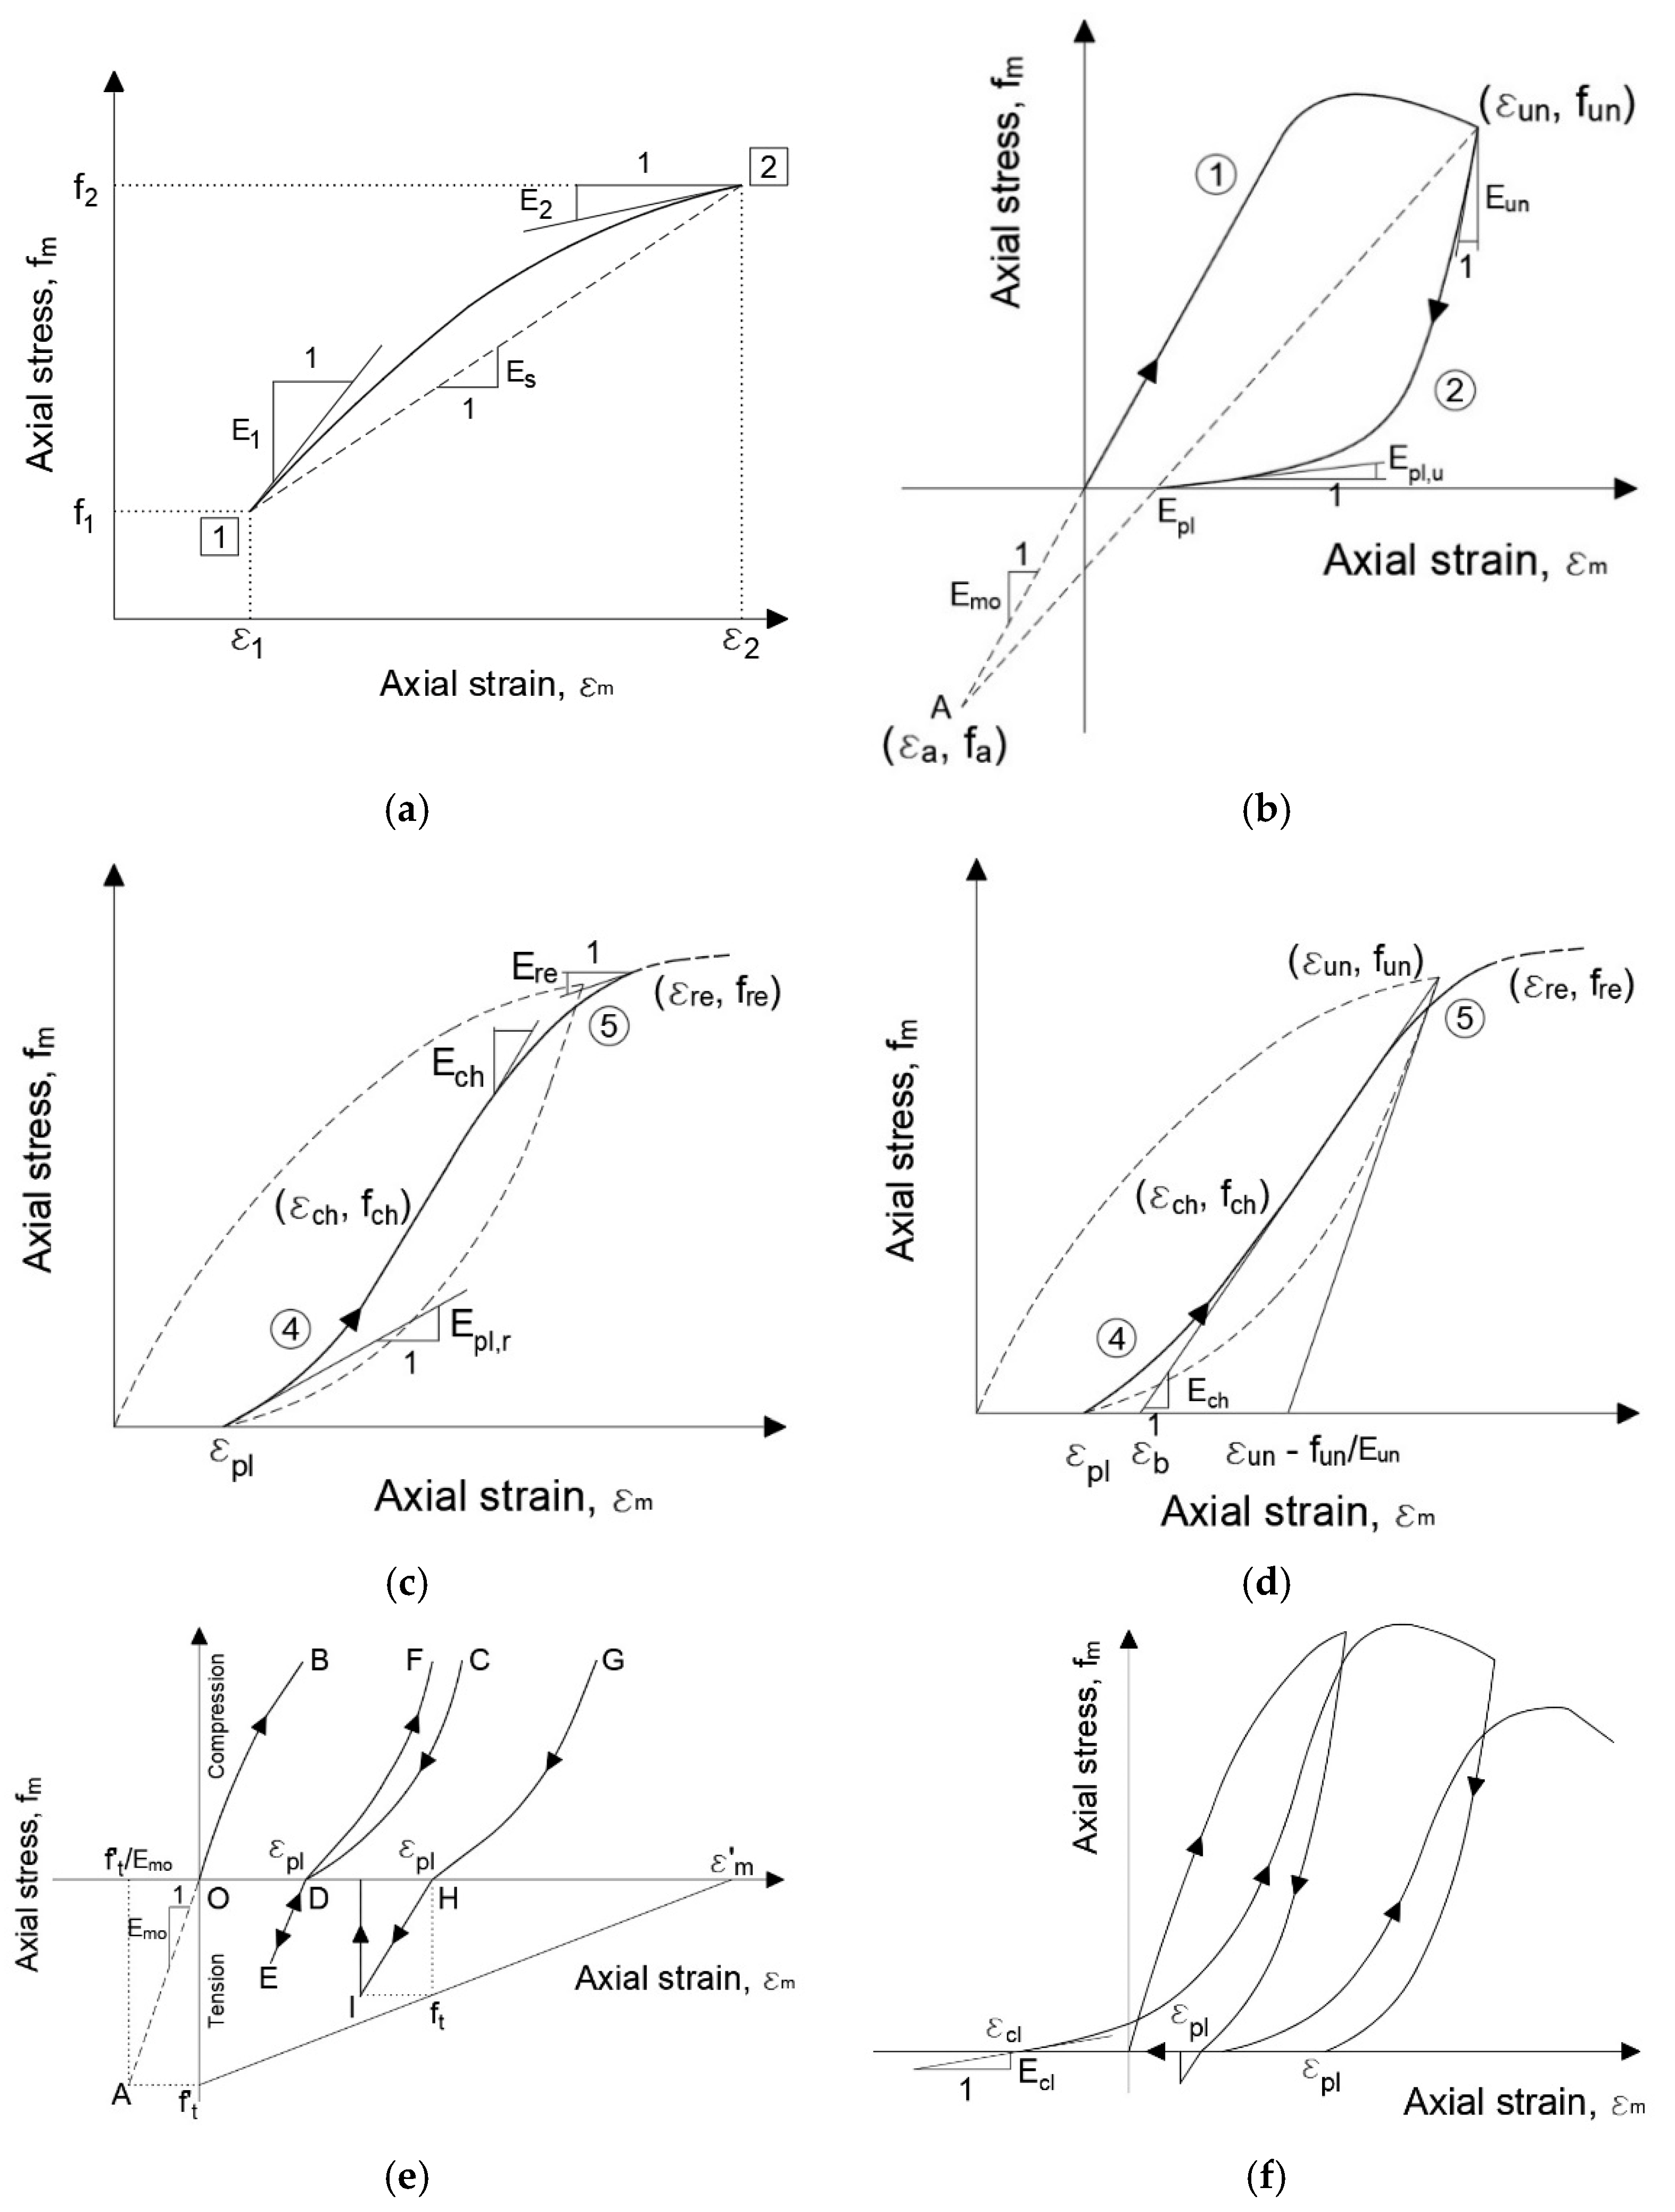
The nonlinear cyclic model for masonry panels developed by Crisafulli [
19]—briefly presented in
Section 2 and implemented in
SeismoStruct by Blandon [
35]—was used to model the infill walls. As previously mentioned, this model has the advantage of accounting for the local effects caused by the infill panels in the surrounding frame without a significant increase in the complexity of the analysis. However, it does require the definition of a large number of parameters to fully characterize the nonlinear element. These parameters may be organized in three groups according to their nature: (i) mechanical; (ii) geometrical; and (iii) empirical. The mechanical and geometrical parameters define the monotonic behaviour of the strut elements, while the empirical parameters are exclusively associated with the cyclic loading rules. The adopted final values (presented below) were set according to available experimental results and/or the recommendations of Crisafulli [
19], Smyrou et al. [
11], and O’Reilly [
12].
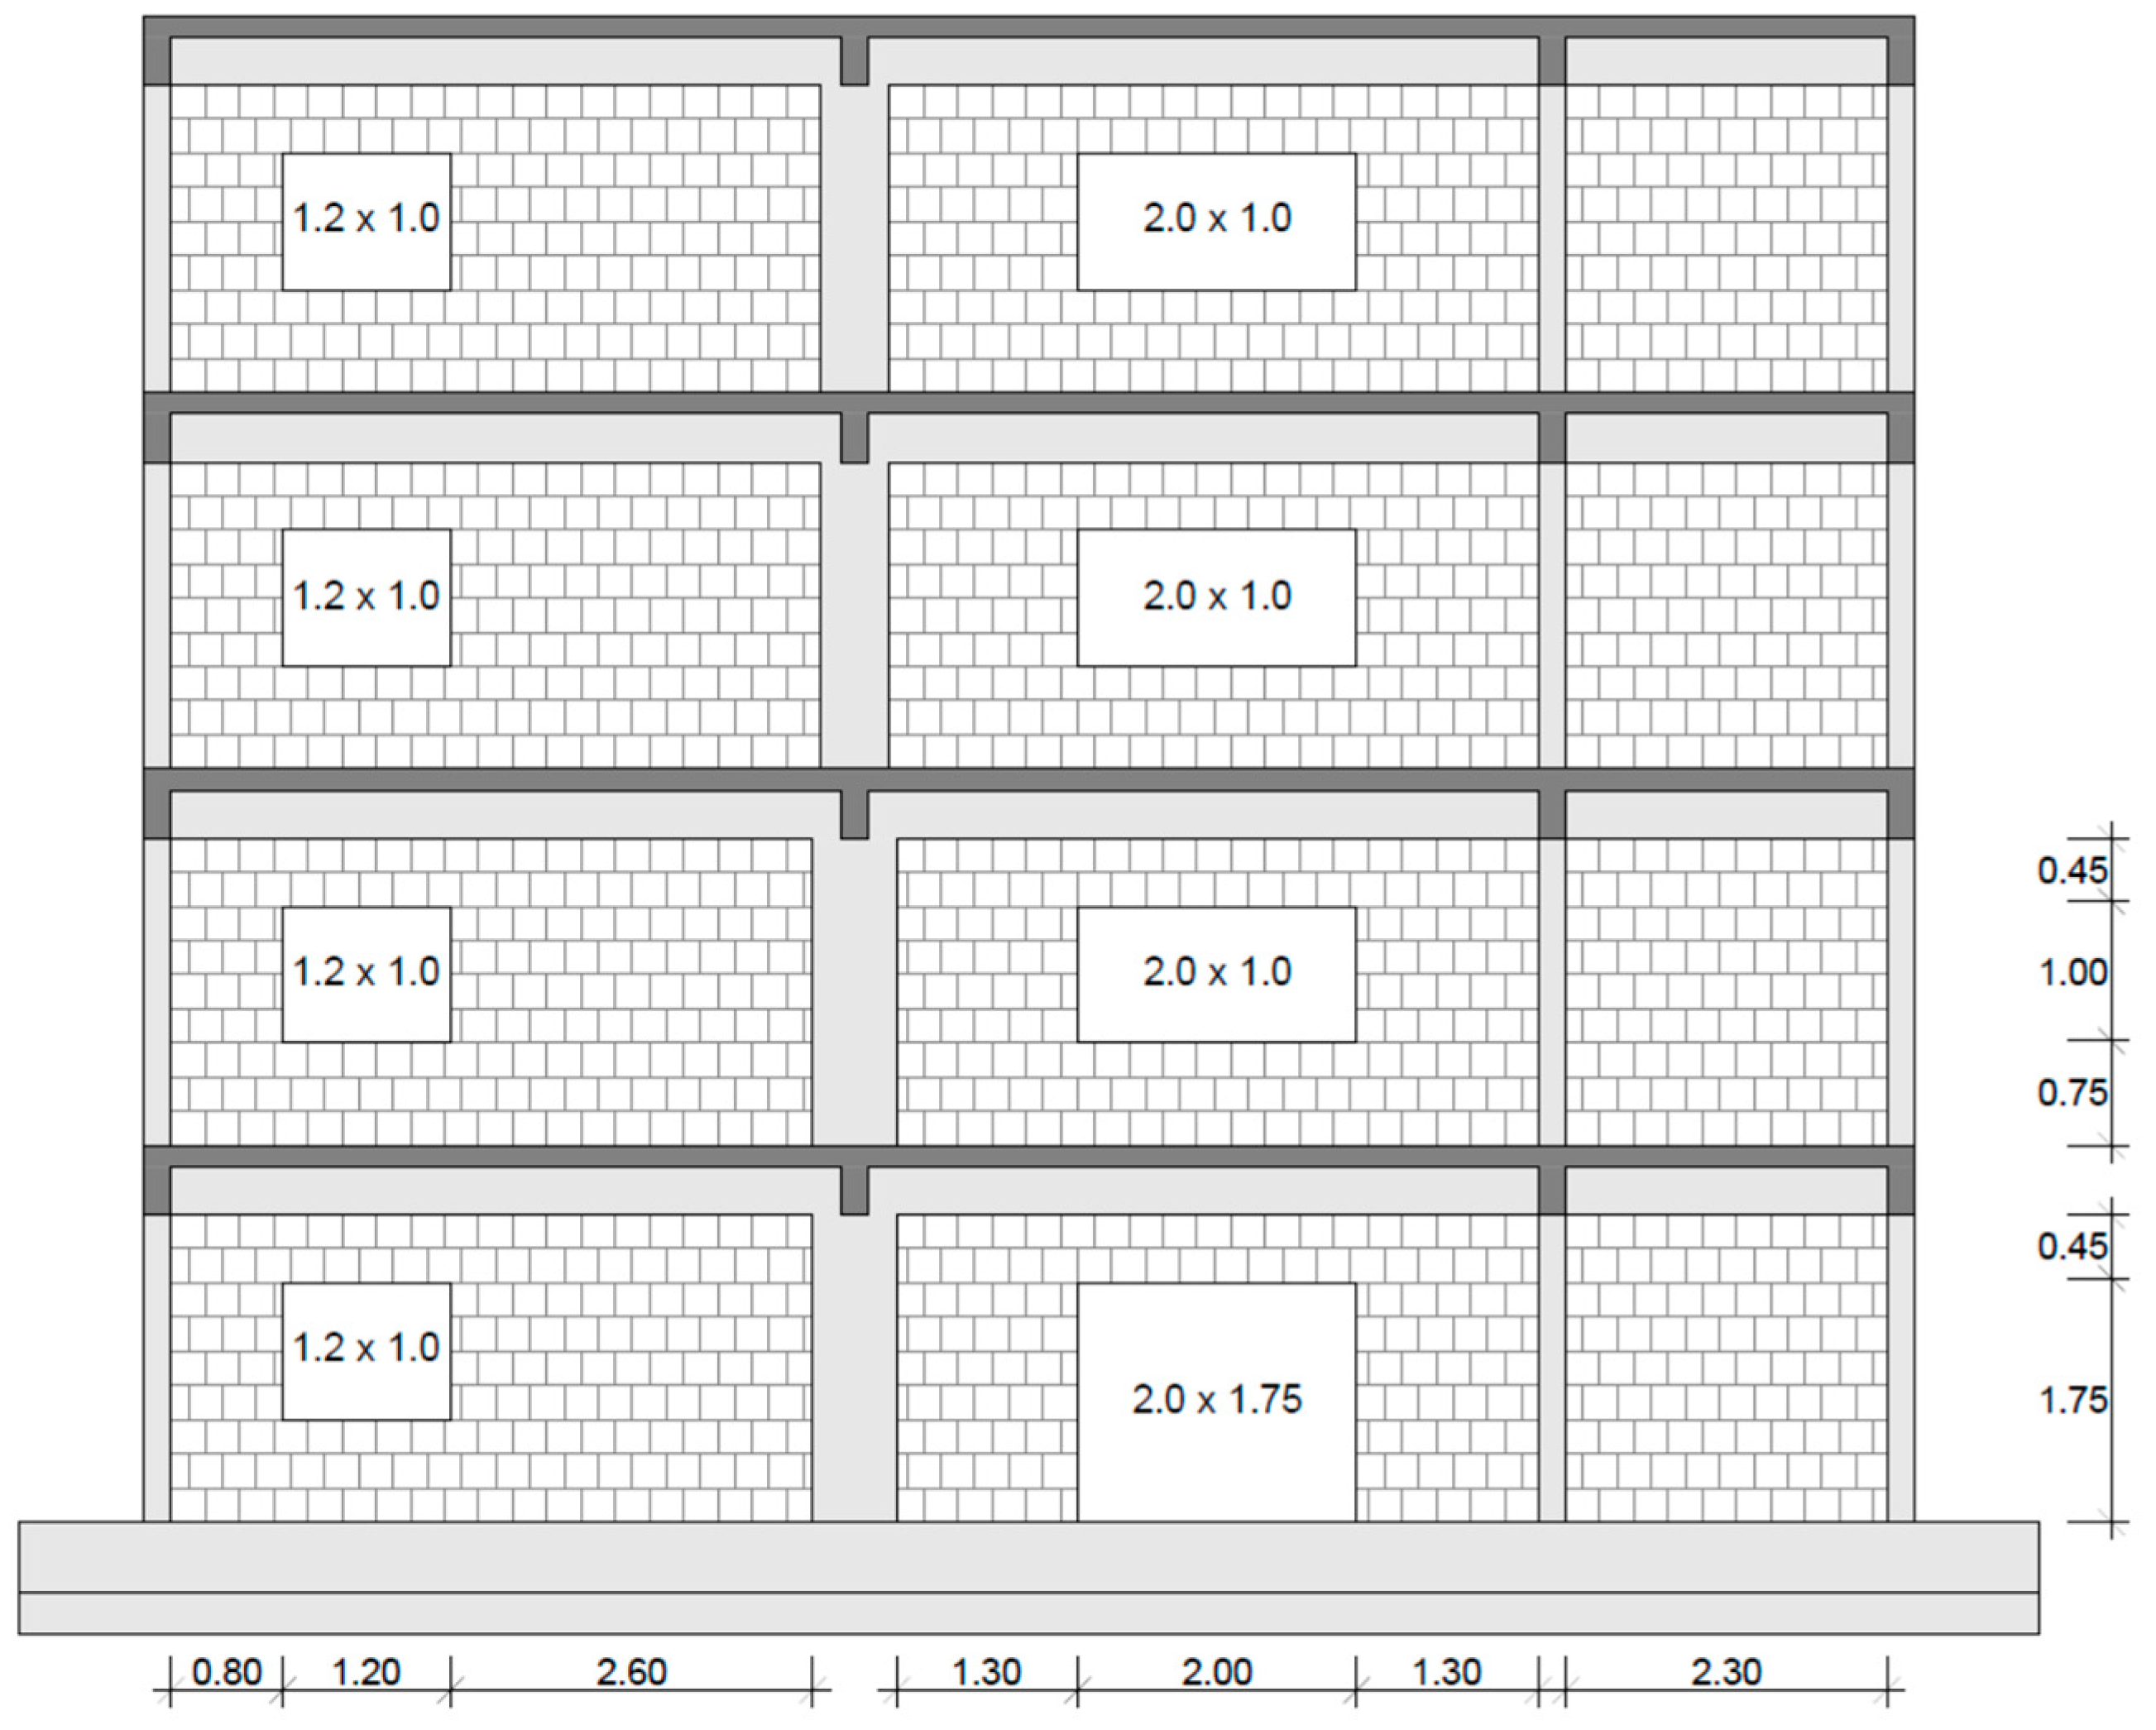
Due to their different characteristics, the infill panels were divided into four groups with specific parameters: (i) “Full_IN”, including all the short panels with no openings; (ii) “Door_IN”, including the central long panel with a door opening at the 1st storey; (iii) “LargeW_IN”, including the central long panels with large window openings at the second, third, and fourth storeys; and (iv) “SmallW_IN”, including all the external long panels with small window openings.
Table 1 summarizes the general dimensions of each panel group, where
is the span of beam between centre line of supporting columns;
is the storey height;
is the length of the masonry panel between adjacent columns;
is the height of the masonry panel;
is the thickness of the masonry infill (12 cm thick bricks + 1.5 cm of plaster on each side);
and
are, respectively, the height and length of the bricks;
is the diagonal length of the masonry panel; and
is the inclination of the diagonal of the masonry panel to the horizontal axis. The size of the openings are given as width × height.
The compression/tension cyclic relationship is characterized by six mechanical parameters: (i) initial elastic modulus ; (ii) compressive strength for angle , ; (iii) tensile strength ; (iv) strain at maximum stress ; (v) ultimate strain ; and (vi) closing strain . When no sufficient experimental information exists, the usual approach is to estimate values by applying the empirical expressions and value ranges found in the literature. Along with the experimental test results, the following were used to evaluate the initial elastic modulus :
Refs. [
36,
37]
where
represents the standard compressive strength of masonry (measured in a vertical compression test) in MPa. It is worth noting, however, that these expressions define a secant modulus
at a stress level between one-third to two-thirds of the maximum compressive stress, while the initial elastic modulus
represents the initial slope of the stress-strain curve. Therefore, the direct use of such values may underestimate the initial stiffness of the infilled frame. Crisafulli [
19] thus recommends, in order to obtain an adequate ascending branch of the strength envelope, that
. These considerations led to a uniform value of
, which was used for the four infill panel groups.
The compressive strength for angle
,
, is the main parameter to control the resistance of the struts. It does not, however, represent the above referred standard compressive strength of masonry, as it depends on the expected failure mode for the panel. Four basic failure modes are considered, each with a corresponding equivalent failure compressive stress: (i) diagonal tension; (ii) sliding shear along horizontal joints (the most common); (iii) crushing of corners in contact with the RC frame; and (iv) diagonal compression at the centre of the panel. The expressions described in Decanini et al. [
25,
26,
27] and O’Reilly [
12] for each failure mode are given below in the same order:
where
is the shear strength measured in diagonal compression tests;
is the vertical compression stress due to gravity loads (usually equal to zero, as infill panels are typically not load-bearing);
is the equivalent width of the strut;
is the sliding resistance of mortar joints measured in triplet tests;
is a non-dimensional parameter—originally proposed by Stafford Smith [
24] and given below by Expression (11)—which expresses the relative stiffness of the infill panel to the RC frame;
and
are two constants which depend on the value of
and on the cracking state of the infill panel (i.e., cracked or uncracked), and are also given below.
In Expression (11),
and
represent the elastic modulus of concrete and the moment of inertia of the adjacent columns, respectively. It should be kept in mind, however, that the value of
significantly decreases after cracking develops in the columns. The value of
to be used should also correspond to the considered state of the infill panel (cracked or uncracked). Concerning coefficients
and
, these were initially introduced by Decanini and Fantin [
40], and were later adapted by Bertoldi et al. [
41]. However, as values for when
< 3.14 in an uncracked panel state are not found in these references, those shown in Expression (13) are proposed herein by the authors. Given all these considerations, the equivalent failure compressive stresses corresponding to each failure mode can be determined, with the most likely to occur being defined by the minimum value. The latter should then be taken equal to the panel’s
. This process led to values of 1.00 MPa and 0.50 MPa for the short (Full_IN) and long (Door_IN, LargeW_IN and SmallW_IN) panels, respectively.
The tensile strength
represents either the fundamental tensile strength of masonry, or the bond strength of the panel-frame interfaces (whichever is smaller). Its consideration brings generality to the model; however, as it has no significant influence on the overall response, it can be assumed as equal to zero in the absence of better information. The strain at maximum stress
influences the overall response of the infilled frame through the modification of the secant stiffness of the ascending branch of the stress-strain curve. This parameter usually varies between −0.001 and −0.005, but should be calibrated based on experimental data. The ultimate strain
is a parameter used to control the descending branch of the stress-strain relationship. The adoption of a large value such as
ensures a smooth decrease of the strut’s compressive stress. Lastly, the closing strain
defines the limit strain at which cracks partially close and compressive stresses can develop. Values ranging between 0 and 0.003 lead to results which are in sufficient agreement with the experimental data. Alternatively, if a large negative value is adopted (e.g.,
), this effect is not considered in the analysis.
Table 2 shows the final values adopted for these parameters.
In addition to the above-described mechanical parameters, a set of nine empirical (less intuitive and harder to calibrate) factors is required to complete the characterization of the compression/tension cyclic relationship:
Unloading stiffness factor (): this defines the unloading modulus in proportion to , thus controlling the slope of the unloading branch, modifying the internal cycles but not the envelope;
Reloading strain factor (): this predicts the strain at which the reloading curve reaches the strength envelope;
Inflection strain factor (): this predicts the strain at which the reloading curve should feature an inflexion point, thus controlling the loops’ “fatness”;
Unloading strain factor (): this defines an auxiliary point to determine the plastic deformation after complete unloading;
Inflection stress factor (): this predicts the stress at which the reloading curve should feature an inflexion point;
Zero stress stiffness factor (): this defines the modulus of the hysteretic curve at zero stress, in proportion to , after complete unloading has occurred;
Reloading stiffness factor (): this defines the modulus of the reloading curve, in proportion to , after complete unloading has occurred;
Plastic unloading stiffness factor (): this defines the unloading tangent modulus corresponding to the plastic strain in proportion to ;
Repeated cycle strain factor (): this defines the strain that the envelope curve should reach after inner cycling, thus representing the cumulative damage inside the repeated cycles.
Crisafulli [
19] defined the limits for which each parameter has meaning, and proposed a range of recommended values based on experimental results. A few years later, Smyrou et al. [
11] carried out a sensitivity study that seems to show that, when running nonlinear dynamic analyses, only three of these parameters (
,
,
) play significant roles in the energy dissipation capacity of the infill panel (i.e., the remaining parameters are not expected to have a major impact if changed from the proposed default values).
Table 3 shows the recommended range and final adopted values for these parameters (valid for the four infill panel groups).
Concerning the cyclic shear relationship, four parameters need to be defined to fully characterize this response curve: (i) initial shear bond strength
; (ii) friction coefficient
; (iii) maximum permissible shear stress
; and (iv) shear stress distribution factor
. The values of
and
can either be evaluated by direct shear tests or obtained from the design specifications. However, whilst the former may lead to an overestimation of values [
42,
43], the latter tend to be over-conservative, so caution is advised when selecting the approach. Crisafulli [
19], for instance, within the proposed modification to the Mann and Müller’s [
44] theory, referred the following expressions for reducing values obtained from shear tests, where
and
are, respectively, the reduced shear bond strength and the reduced friction coefficient, and
is a constant that can be taken equal to 1.5 for practical application.
Several researchers (e.g., [
37,
39]) have experimentally determined the initial shear bond strength
, suggesting either relatively narrow value ranges such as 0.3 to 0.6 MPa, or broader ones such as 0.1 to 0.7 MPa, or even 0.1 to 1.5 MPa. However, the wide variety of tested materials should be noted. Empirical expressions (dependent on various parameters) have also resulted from these and other research initiatives, but should be used with caution given the large number of involved variables. In parallel, the friction coefficient
has been reported to vary within a range as large as 0.1 to 1.2. However, some of the proposed values are meant for design applications rather than assessment, therefore being conservatively low. Atkinson et al. [
45] suggested a default range of 0.70 to 0.85 for assessment purposes. These considerations led to values of
equal to 0.25 and 0.30 MPa for the modelling of the infill panels with and without openings, respectively, and to a uniform value of
equal to 0.70.
The maximum permissible shear stress
represents an upper limit to the infill panels’ shear strength calculation as given by the hysteresis rules proposed by Crisafulli [
19]. It is based upon experimental and analytical evidence indicating that values provided by such rules become unrealistic when computing medium to high values of compressive stresses at bed joints. Values for
can be selected from the shear failure envelope given by the above referenced modification of Mann and Müller’s [
44] theory, depending on the expected failure mode. However, in the absence of better information, a default range of 0.5 to 1.0 MPa can be considered. Concerning the shear stress distribution factor
, it is used to take into account the non-uniform distribution of shear stresses along the horizontal section of the infill panels, being defined as the ratio between the maximum and average shear stresses. It usually varies between 1.40 and 1.65, with a proposed default value of 1.50, which will work well for most situations. Values of
equal to 0.6 and 1.0 MPa were used in this study for the modelling of the infill panels with and without openings, respectively, along with a uniform value of
equal to 1.50.
Finally, for the characterization of the nonlinear element to be complete, the following parameters are still required: (i) initial strut area ; (ii) residual strut area ; (iii) strut area reduction strain ; (iv) residual strut area strain ; (v) equivalent contact length ; (vi) horizontal offset ; (vii) vertical offset ; and (viii) shear stiffness factor . The initial strut area is defined as the product of the infill panel’s thickness by the equivalent width of the strut , the latter typically varying between 10% and 40% of the diagonal length of the panel , as reported by several authors based on experimental data. Numerous empirical expressions have also been proposed—featuring varying degrees of complexity—that can be used to estimate the value of when no sufficient experimental information exists. Expressions (15) to (19) below are some of the most popular.
From the above reference, Expression (19) has the interesting feature of being linked to Expressions (11) to (13), thus allowing for the calculation of
associated with both the cracked and uncracked states of the infill panel. It should be noted, however, that the values provided by these expressions refer to fully infilled panels. If openings exist in a panel, Smyrou et al. [
11] suggests reducing the initial strut area
in proportion to the area of the opening in relation to that of the panel, so as to consider the expected reduction of the panel’s stiffness. In practical terms, this is done by reducing the value of
corresponding to the fully infilled panel. The value of the reduction factor will depend on the relative size of the opening to that of the panel, as already stated, but also on its location within (e.g., centred vs. near loaded ends of the compressed struts). Engineering judgement and experience are, therefore, of the utmost importance to deal with this matter for which uncertainties are still so predominant.
The residual strut area
is a parameter that accounts for the fact that, due to cracking, the contact length between the frame and the infill panel decreases as the lateral and (consequently) axial displacements increase, thus affecting the area of the equivalent strut. A linear variation as a function of the axial strain is assumed between
and
(
Figure 14). According to the experimental results reported by Decanini and Fantin [
40], cracking induces a decrease of about 20% to 50% of the equivalent width of the strut. Therefore, a default range of about 50% to 80% can be used to define
as a percentage of
absent better information. Concerning the definition of the strut area reduction strain
and the residual strut area strain
, these are parameters for which it is (obviously) difficult to find experimental evidence. Crisafulli [
19] suggests using estimated values of
and
, respectively, if no better information is available. Other authors have proposed default value ranges that can also help to determine the starting values for these parameters.
The equivalent contact length
represents the vertical distance between the compression/tension struts, thus accounting for the actual contact length
between the frame and the infill panel, as defined by Expression (20), as proposed by Stafford Smith [
24]. In Crisafulli’s [
19] model, given that it is a double-strut model,
is typically taken as equal to
and introduced as a percentage of the storey’s height,
. The geometrical definition of the contact length
is shown in
Figure 15, along with that of several other geometrical parameters that have been referenced up to this point. Concerning the horizontal and vertical offsets
and
, these are introduced as a percentage of the beam’s centreline span
and storey height
, respectively, and represent the reduction of the latter due to the depth of the frame’s members. Lastly, the shear stiffness factor
represents the percentage of the total stiffness of the element to be assigned to the shear spring, thus also affecting the stiffness of the compression/tension struts. A default range of 50% to 75% is suggested by Crisafulli et al. [
13], to be used given the lack of better information.
Table 4 shows the final values adopted herein for the above referred parameters (after several iterations of comparing numerical and experimental results). The values of
were estimated with the help of Expressions (15)–(19), thus referring to the equivalent width of the strut of the fully infilled panels (i.e., with no reduction due to the openings). The reduction factors
—defining the ratio of the strut areas
of the panels with openings to that of the fully infilled panels—were obtained following the above-mentioned recommendations of Smyrou et al. [
11], combined with the information provided by the available experimental results in terms of the strength and stiffness of the individual panels. It is worth noting that the values of the equivalent contact length
—obtained with Expressions (11), (20) and (21)—were also corrected as to somehow consider the effect of the reduction factors
on the equivalent width of the struts
. Even though no evidence of this procedure was found in the reviewed literature, it made sense to the authors and the agreement between numerical and experimental results seemed to be well influenced by it. Concerning the remaining parameters, all were calibrated based on the information provided by the available experimental results, except the horizontal and vertical offsets
and
that only depend on the geometry of the panel vs. that of the RC frame elements.
Concerning the modelling of damping effects, given that the hysteretic component is implicitly included in the nonlinear model formulation/force-deformation laws describing the post-yield behaviour of inelastic elements under cyclic loading, only the effects of other (non-modelled) energy dissipation mechanisms need to be added as viscous damping (VD). The value to be employed will depend (among other things) on the imposed deformation level; i.e., low deformation levels may justify VD values that are higher than those used in analyses during which buildings are pushed deep into their inelastic range (in the latter case, the contribution of the non-modelled energy dissipation mechanisms is likely to be even smaller). From the available options to introduce VD in nonlinear analysis models, the tangent stiffness-proportional damping (TSPD) approach was used in this study. The value of the stiffness matrix multiplier
was thus defined by Expression (22):
where
is the period of the vibration mode with the highest base shear, and
is the defined VD ratio (percentage of critical). The TSPD matrix
was then automatically updated at every load increment during the analyses. The values of
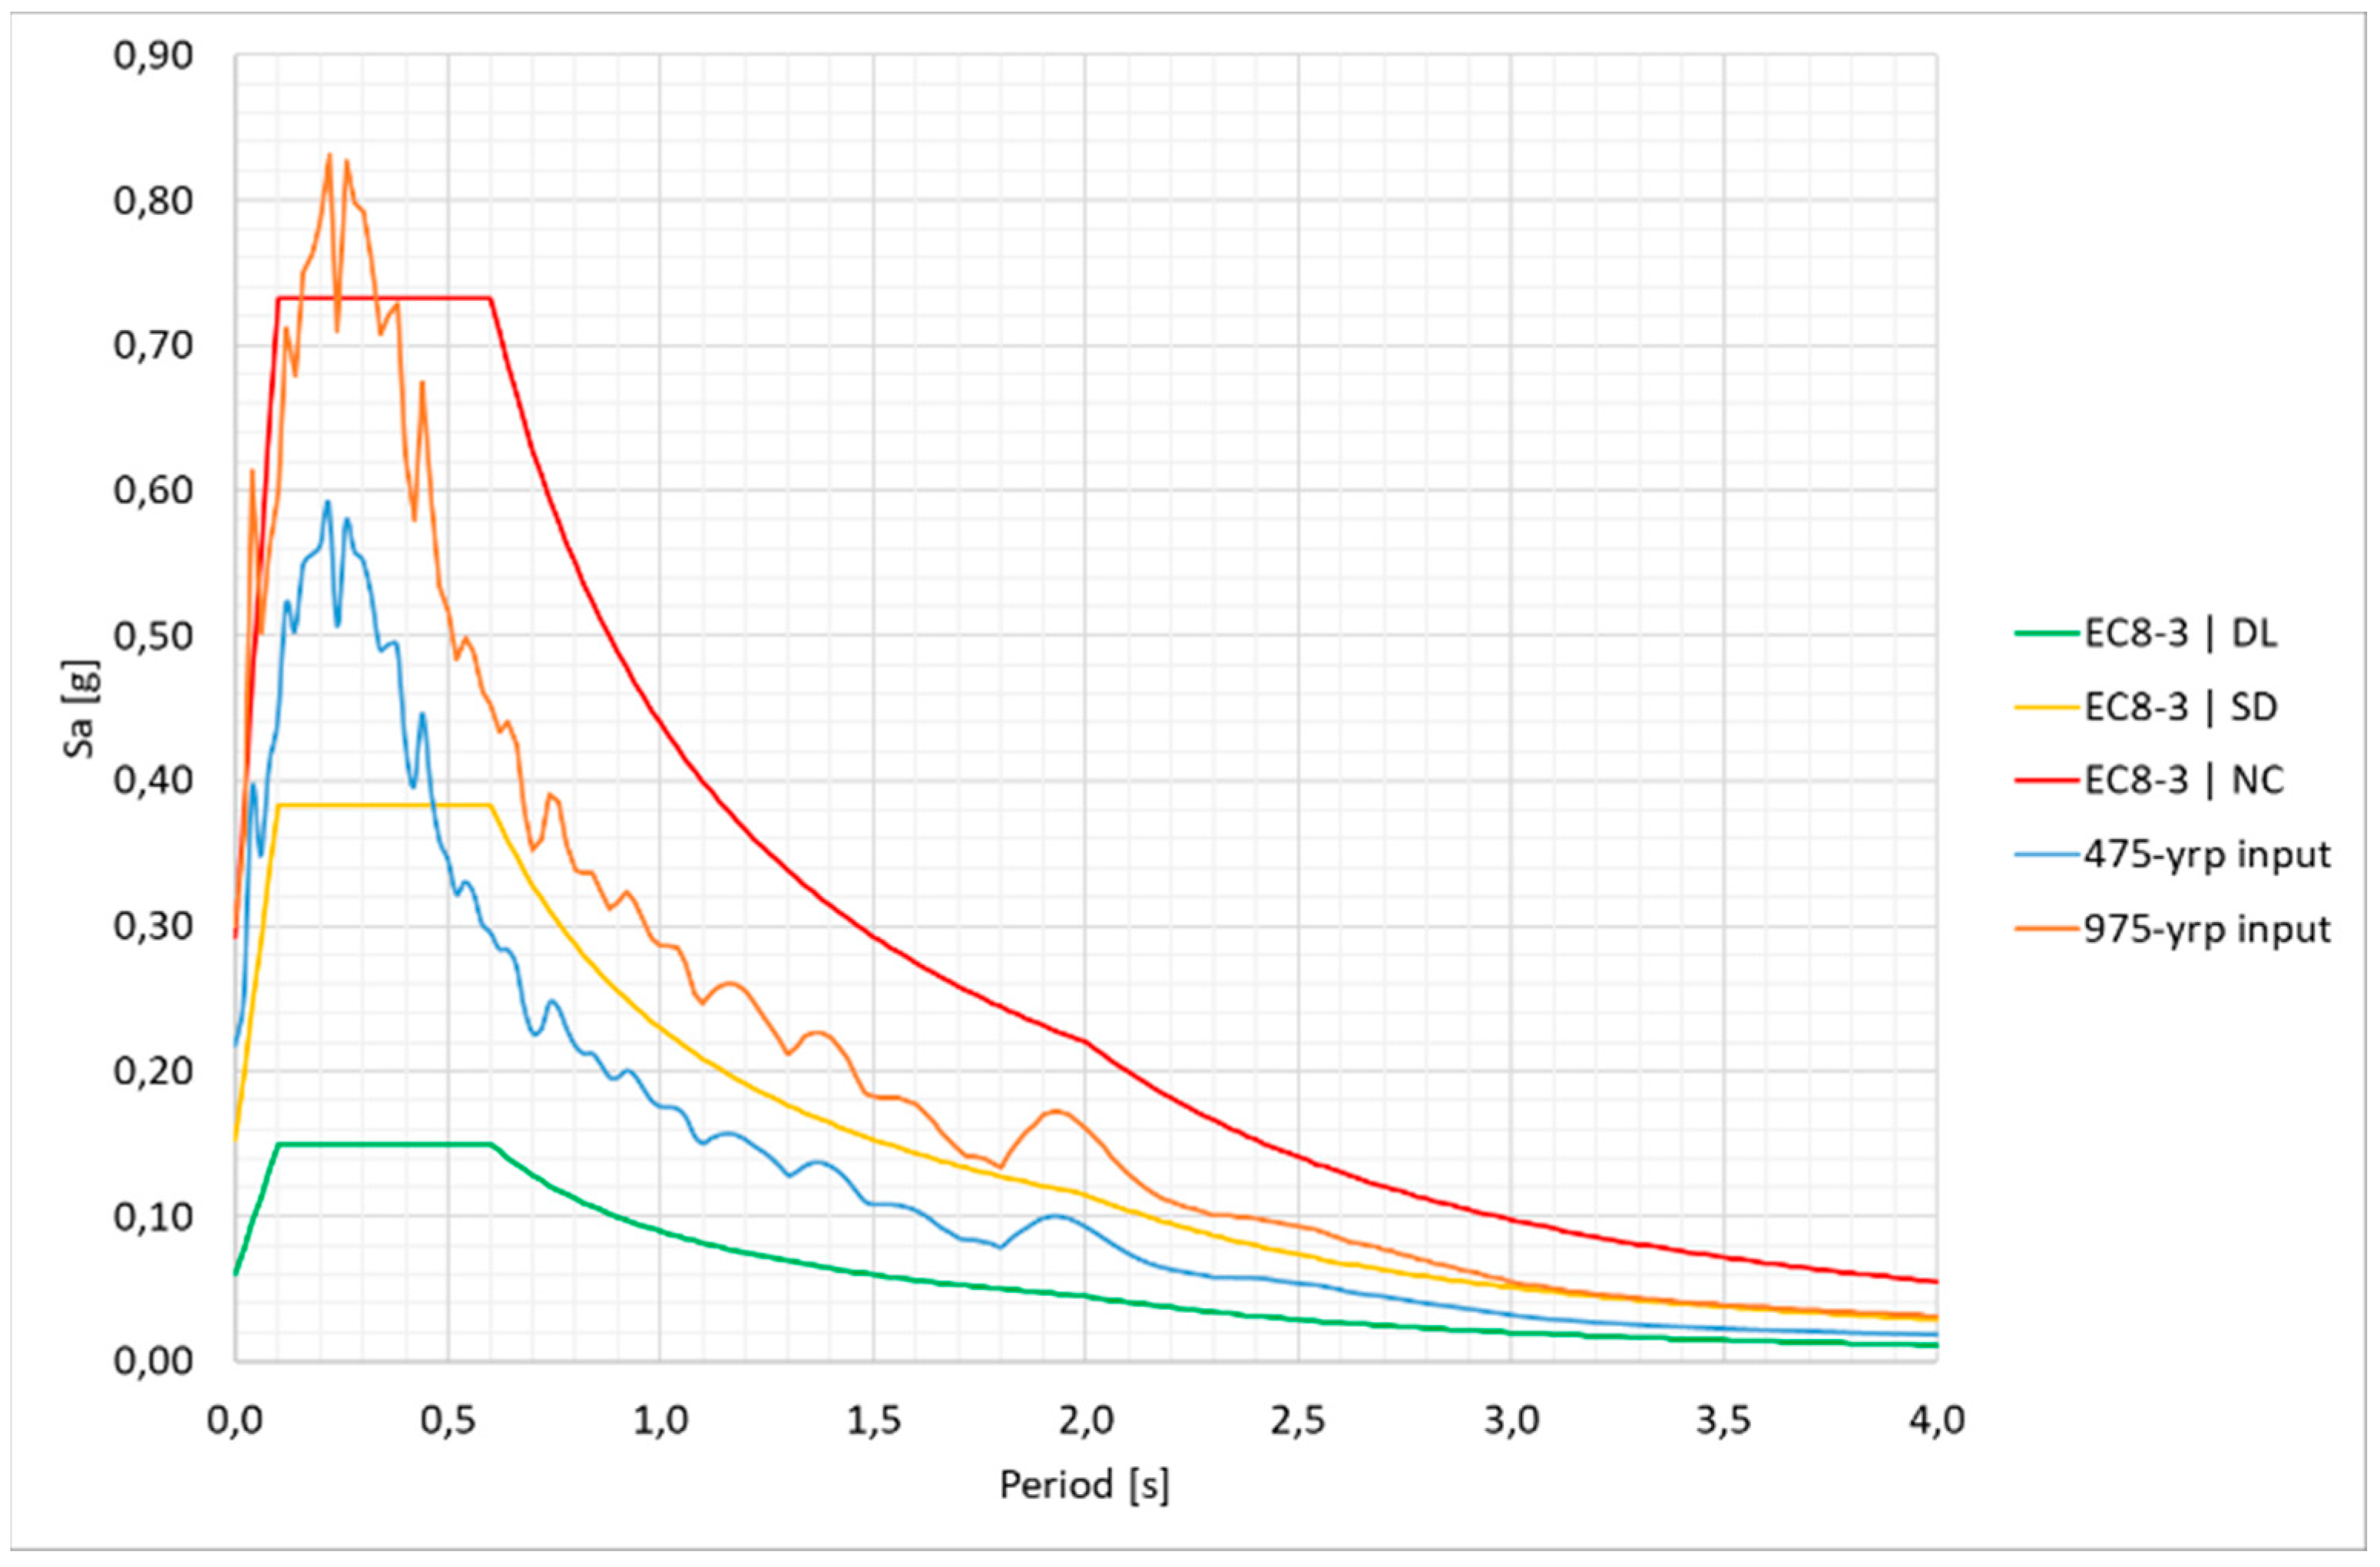
introduced in the models varied with the return period of the earthquake demand, and were different for the BF and IN. After several runs and subsequent comparisons between experimental and numerical results, the best agreement was found with the following setup: (i) 475-yrp:
;
; (ii) 975-yrp:
;
; (iii) 2000-yrp:
. Although some authors claim that this approach may not be totally adequate for vibrations with amplitudes below the elastic limits, these values have been judged to reproduce reality well. It is worthy of note, however, that the IN model proved to be much more sensitive to slight variations of
than the BF model.
3.7. Discussion
Before discussing the results of the seismic assessment process—and consequently drawing conclusions about the safety of the frames—it is important to compare the outcomes of the nonlinear static and dynamic analyses.
Figure 21,
Figure 22,
Figure 23,
Figure 24,
Figure 25,
Figure 26,
Figure 27 and
Figure 28 (above) allow for the comparison in terms of
ratios, while
Table 8,
Table 9 and
Table 10 (below) compare global storey parameters. Given the added complexity of nonlinear dynamic analysis when compared to its static equivalent, the purpose is to verify if similar conclusions are obtained, and (eventually) validate the use of pushover analysis as a swift way to evaluate the seismic performance of the frames.
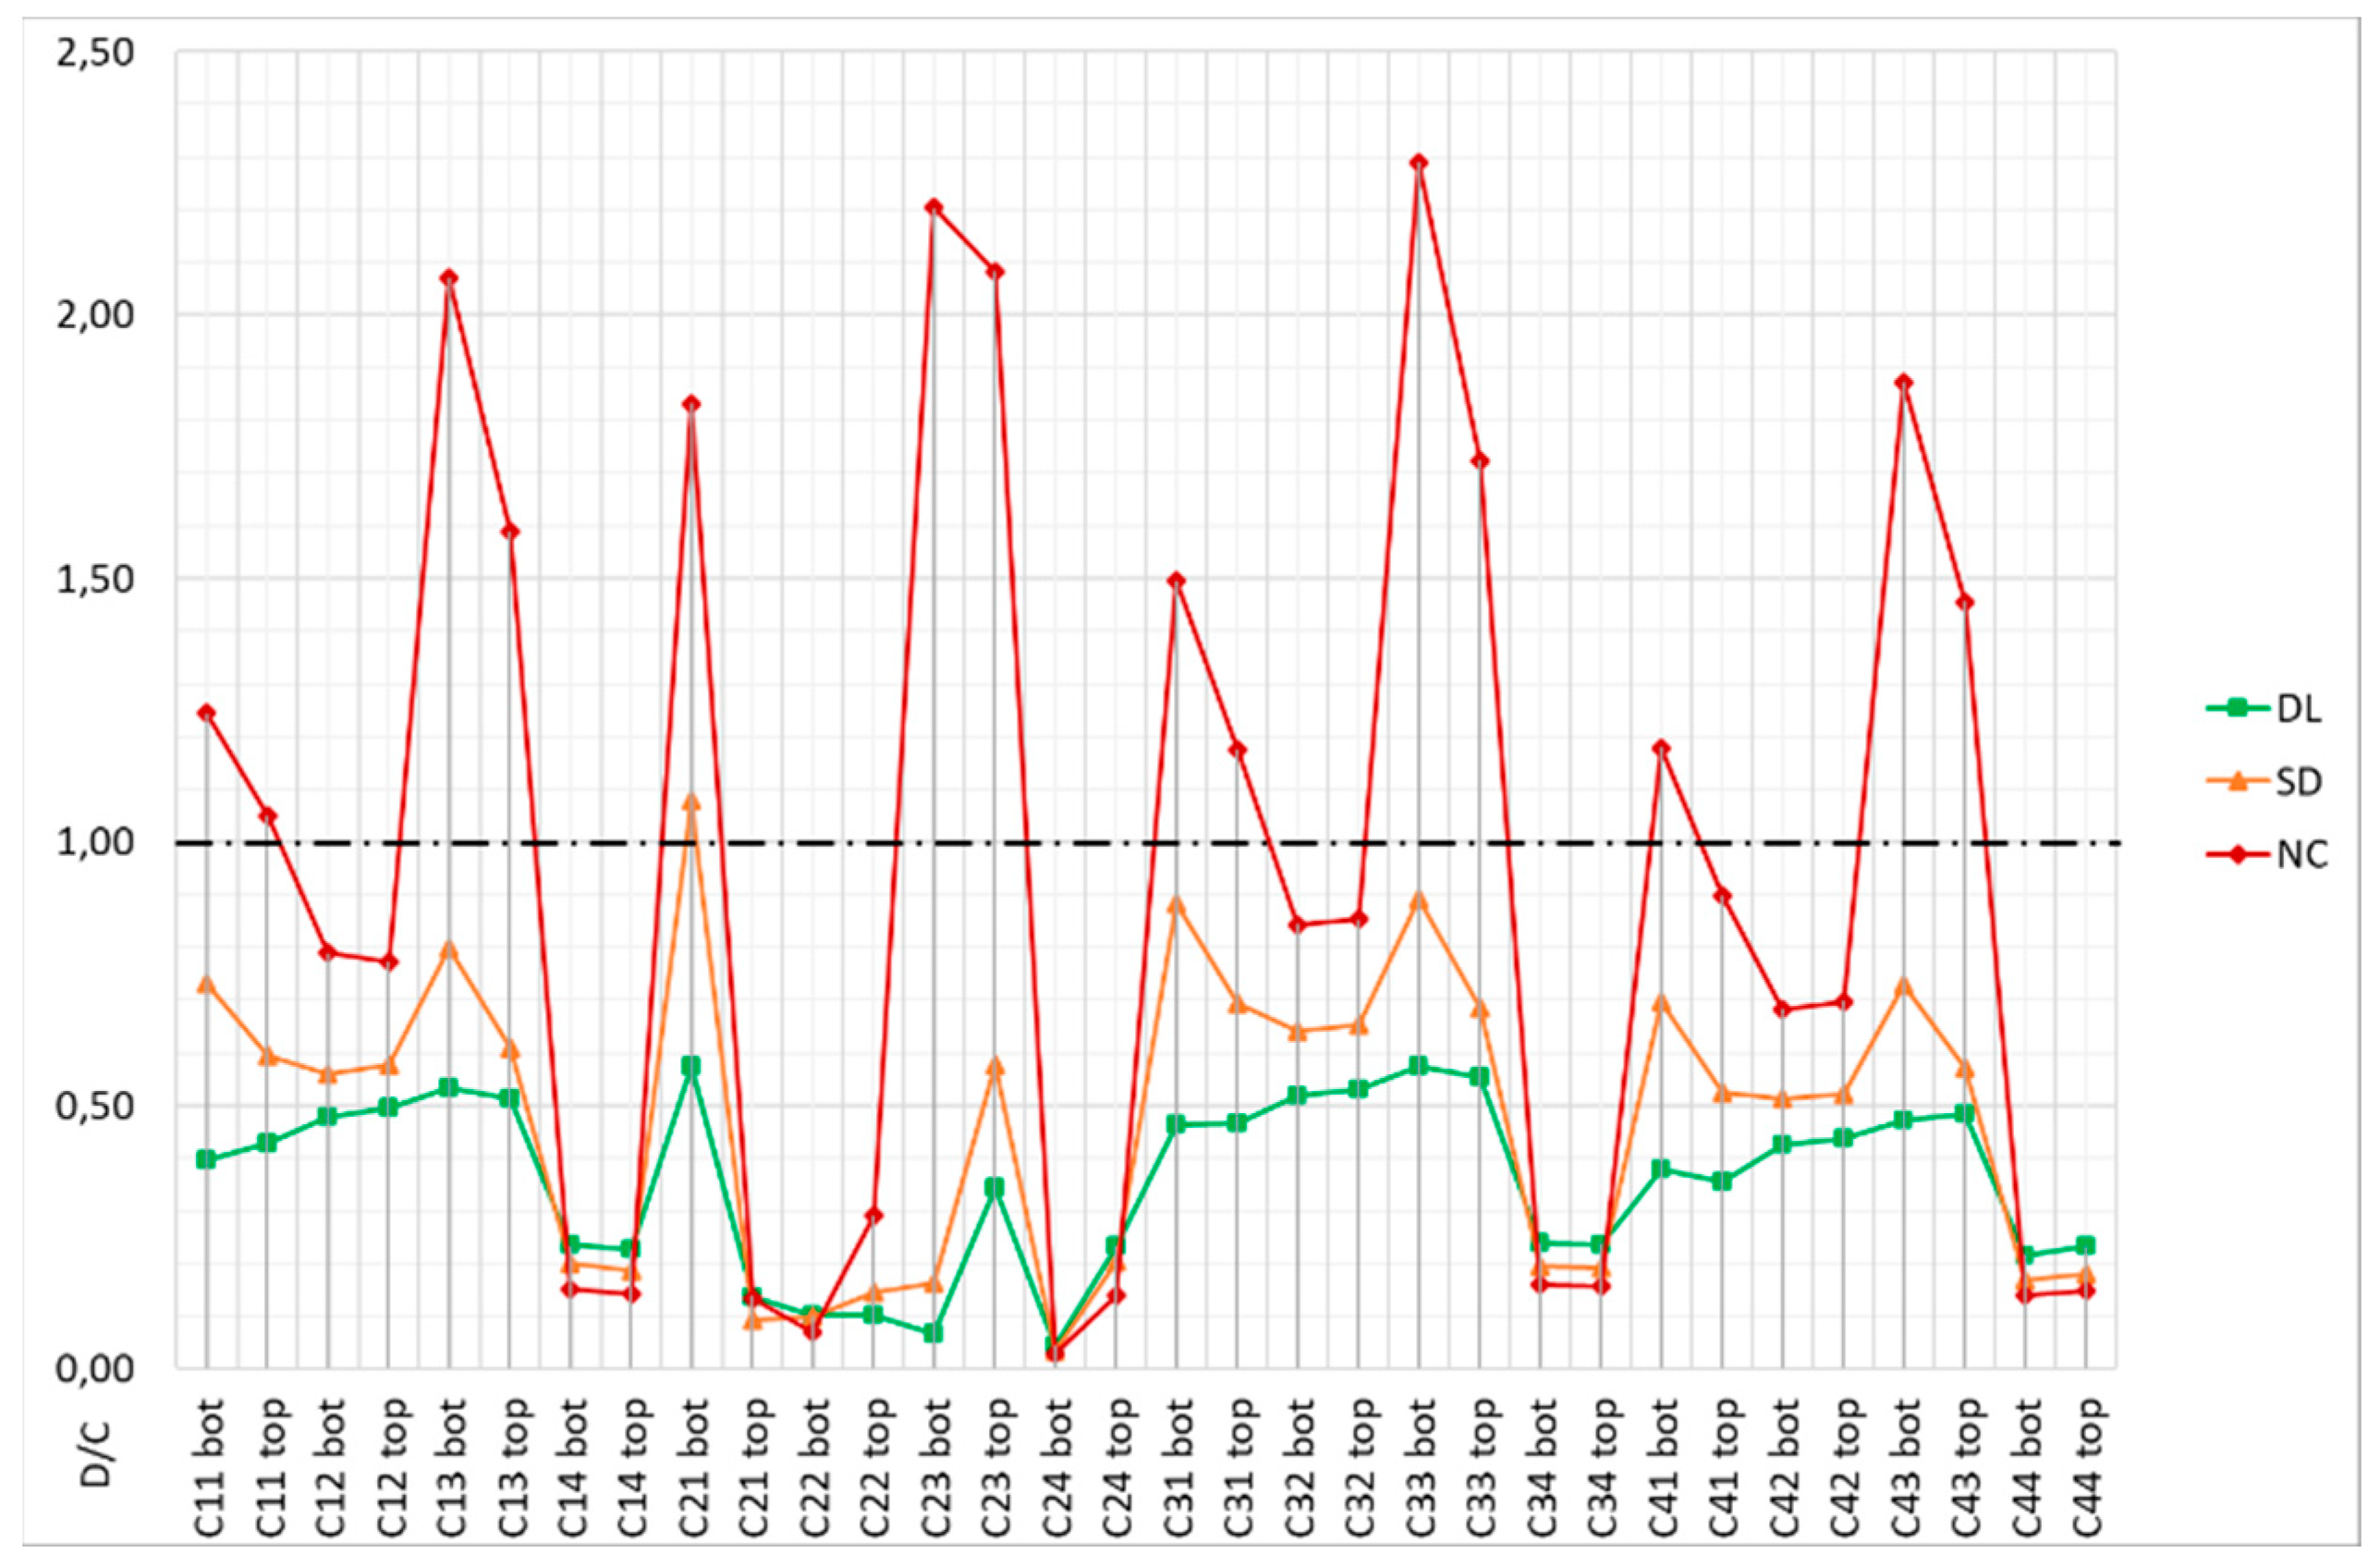
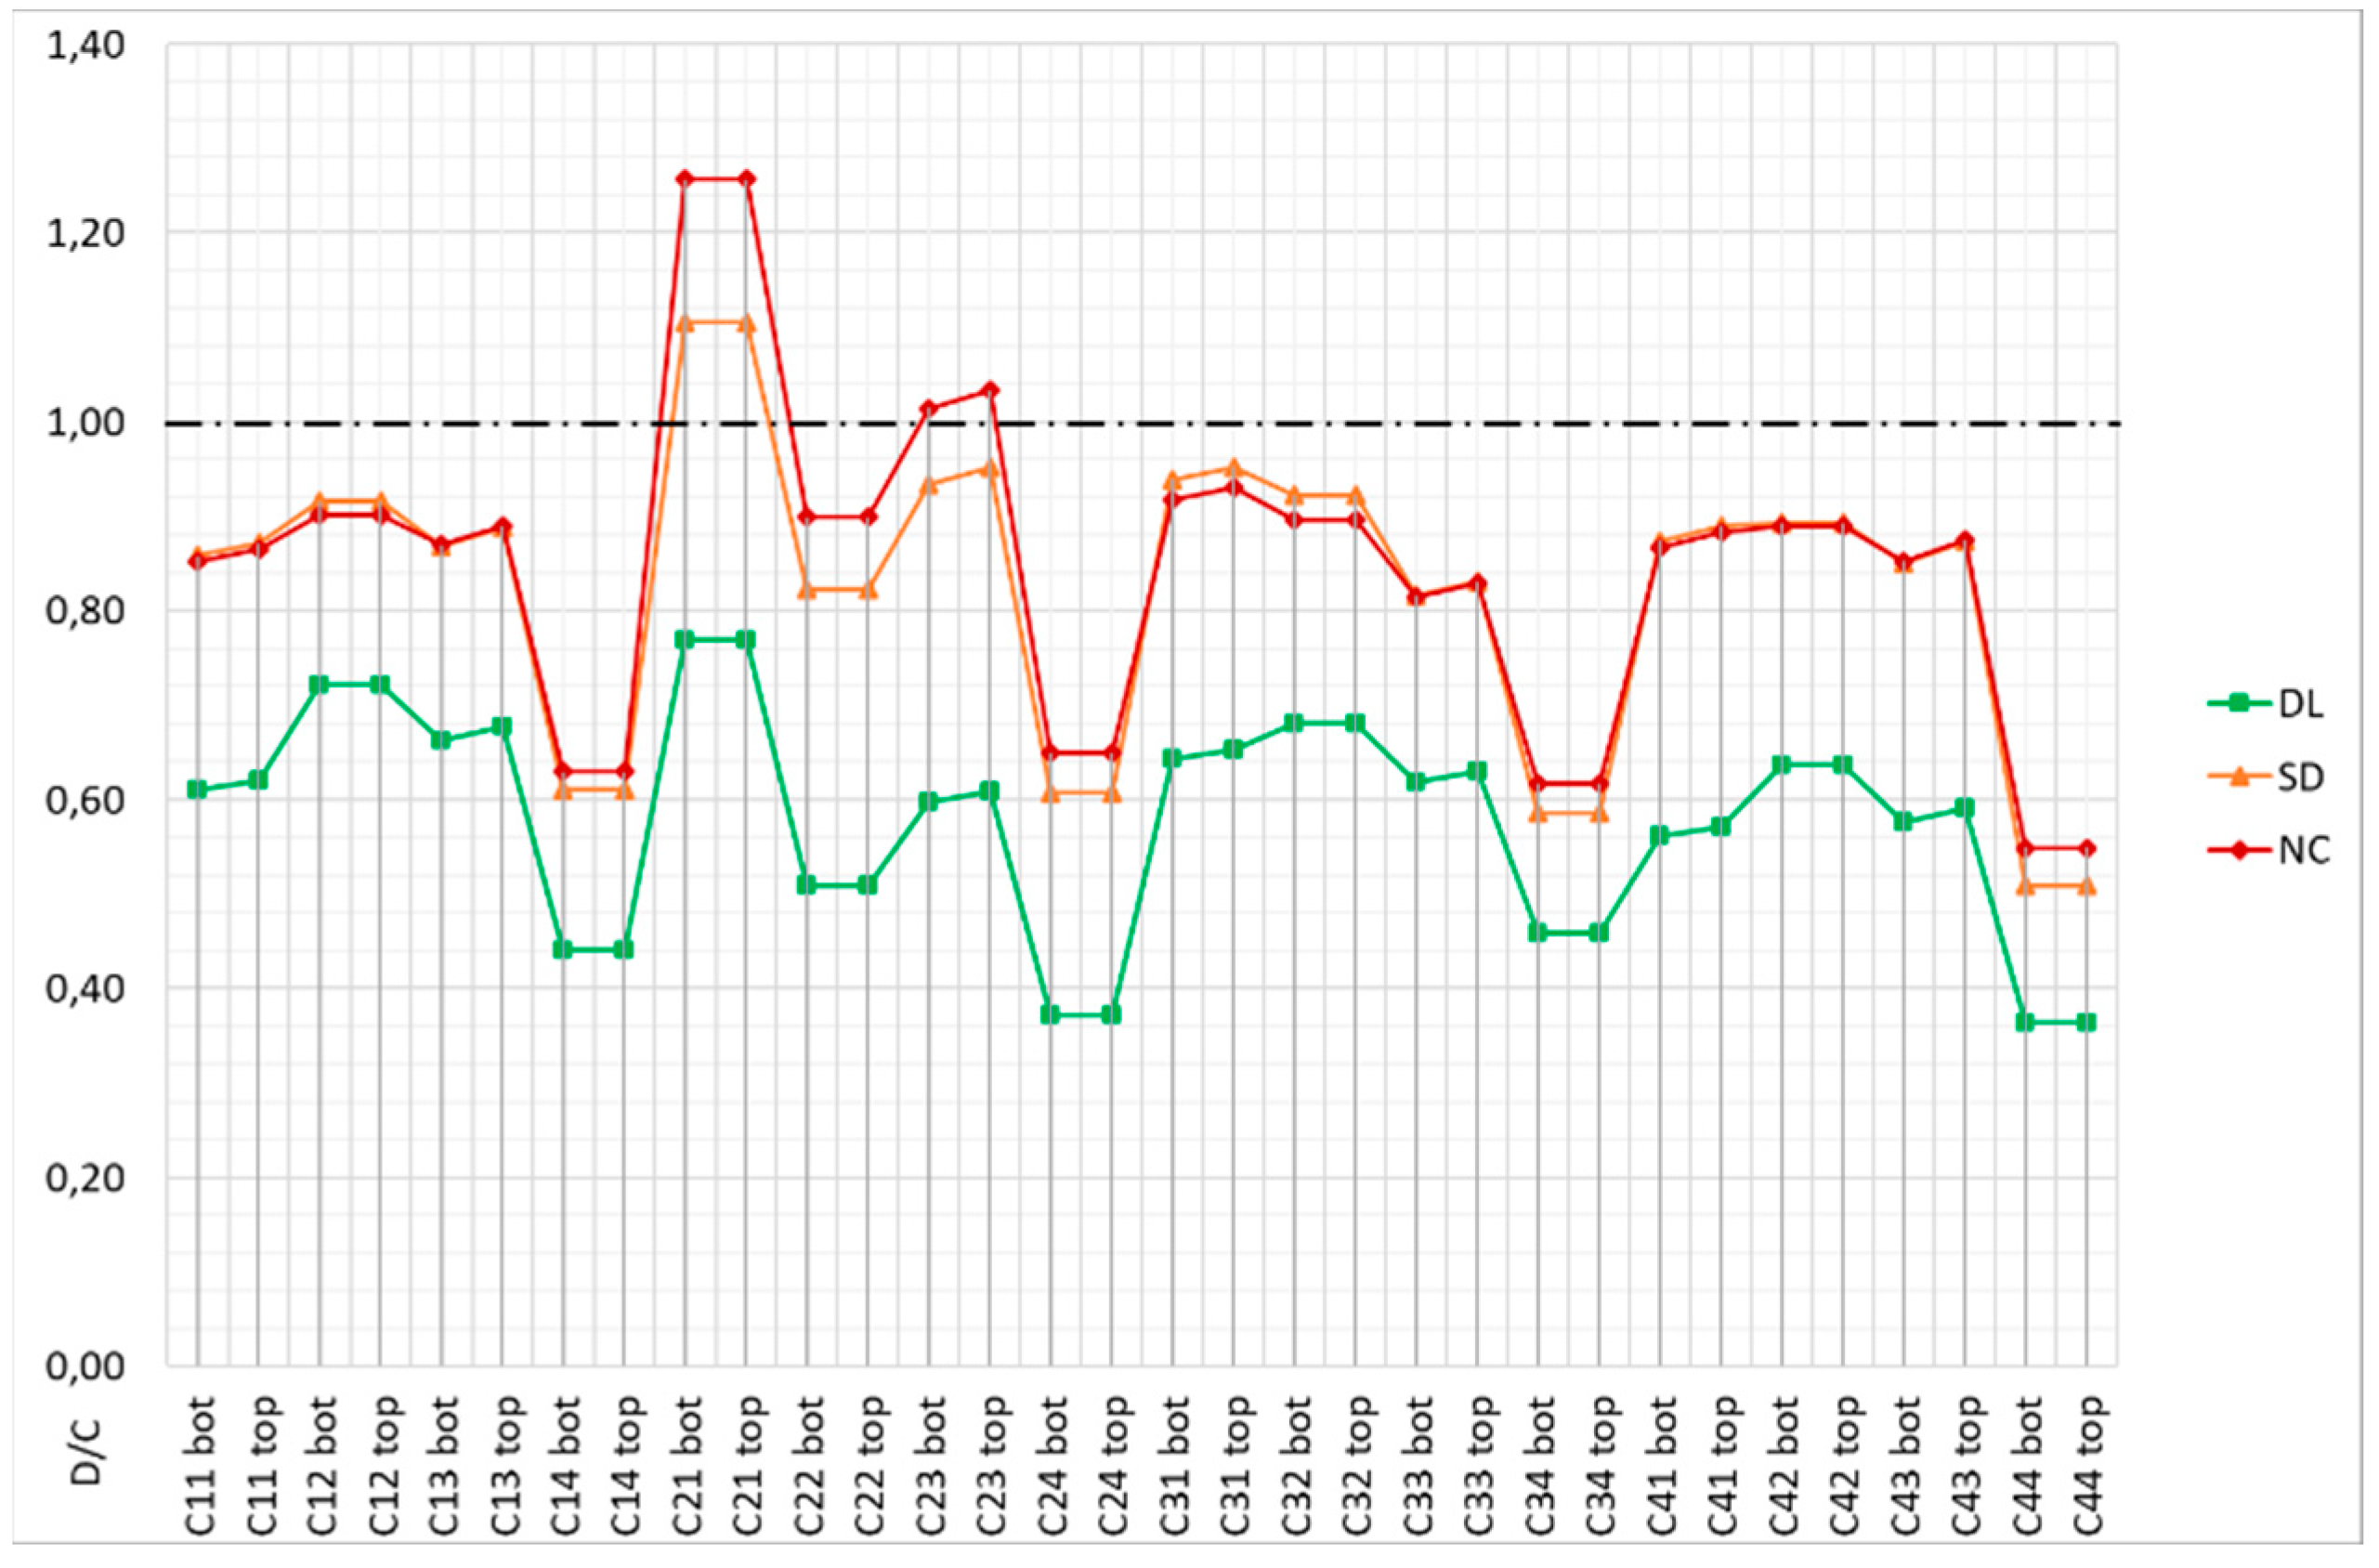
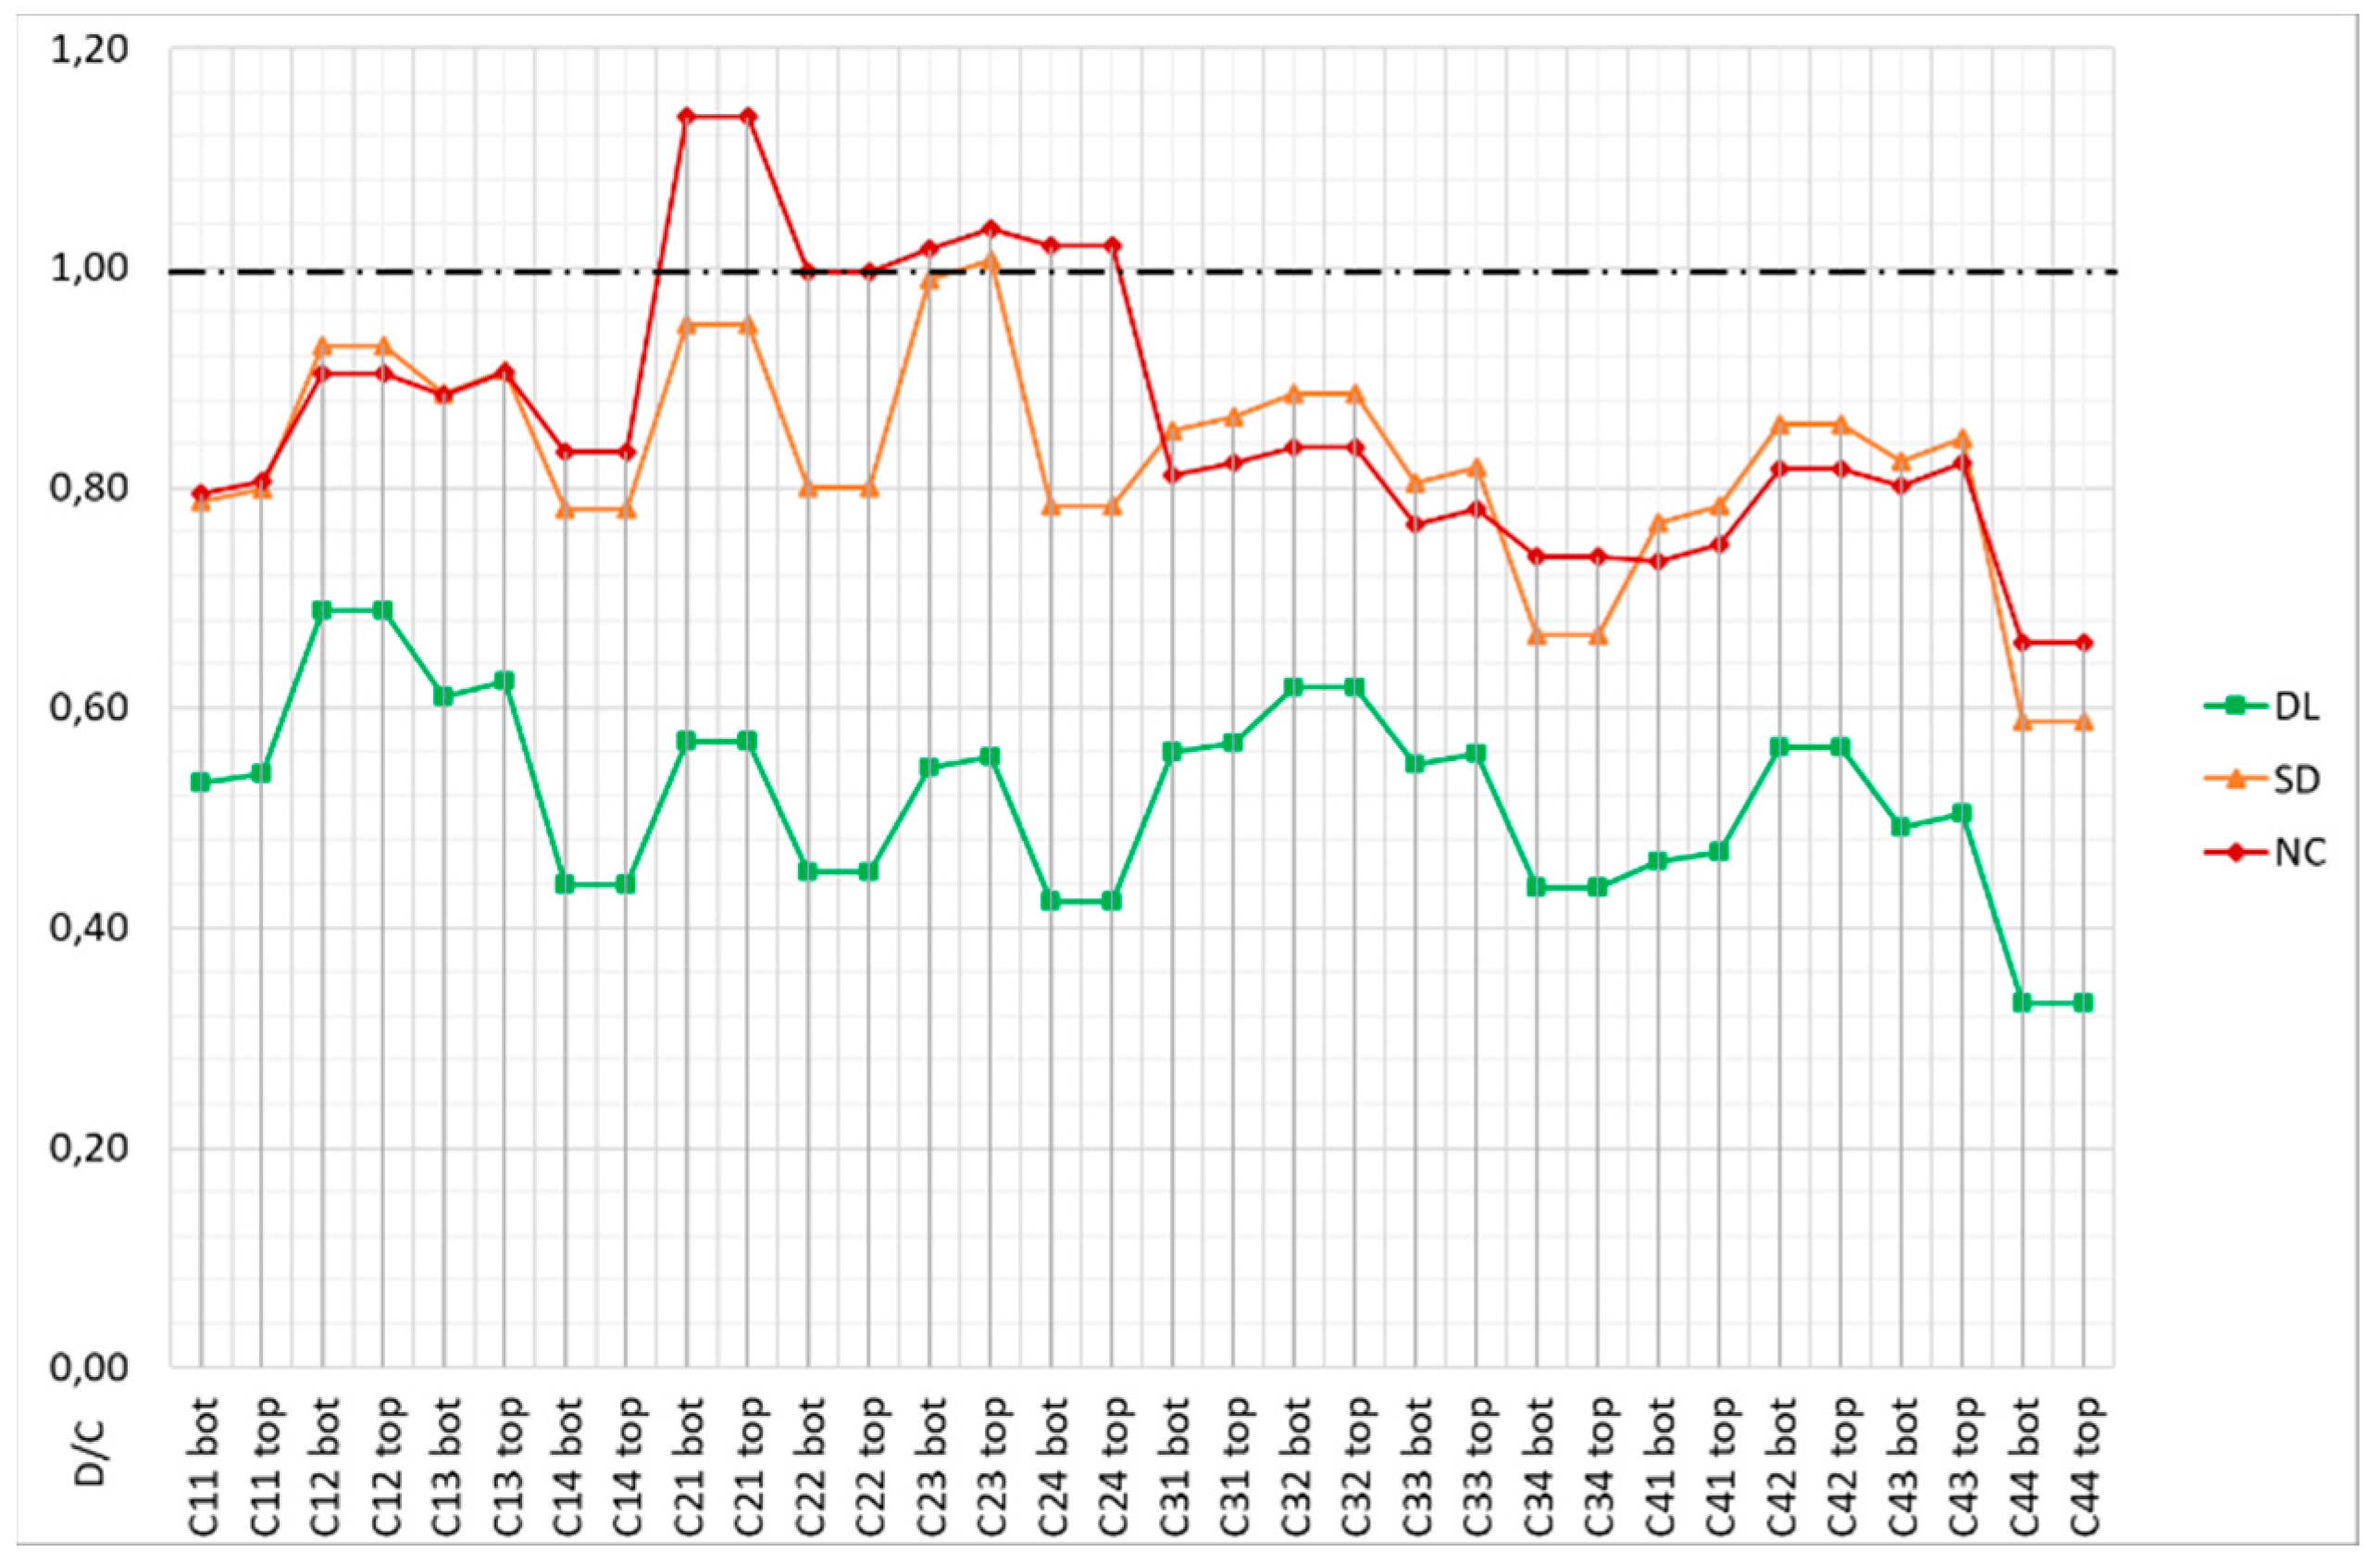
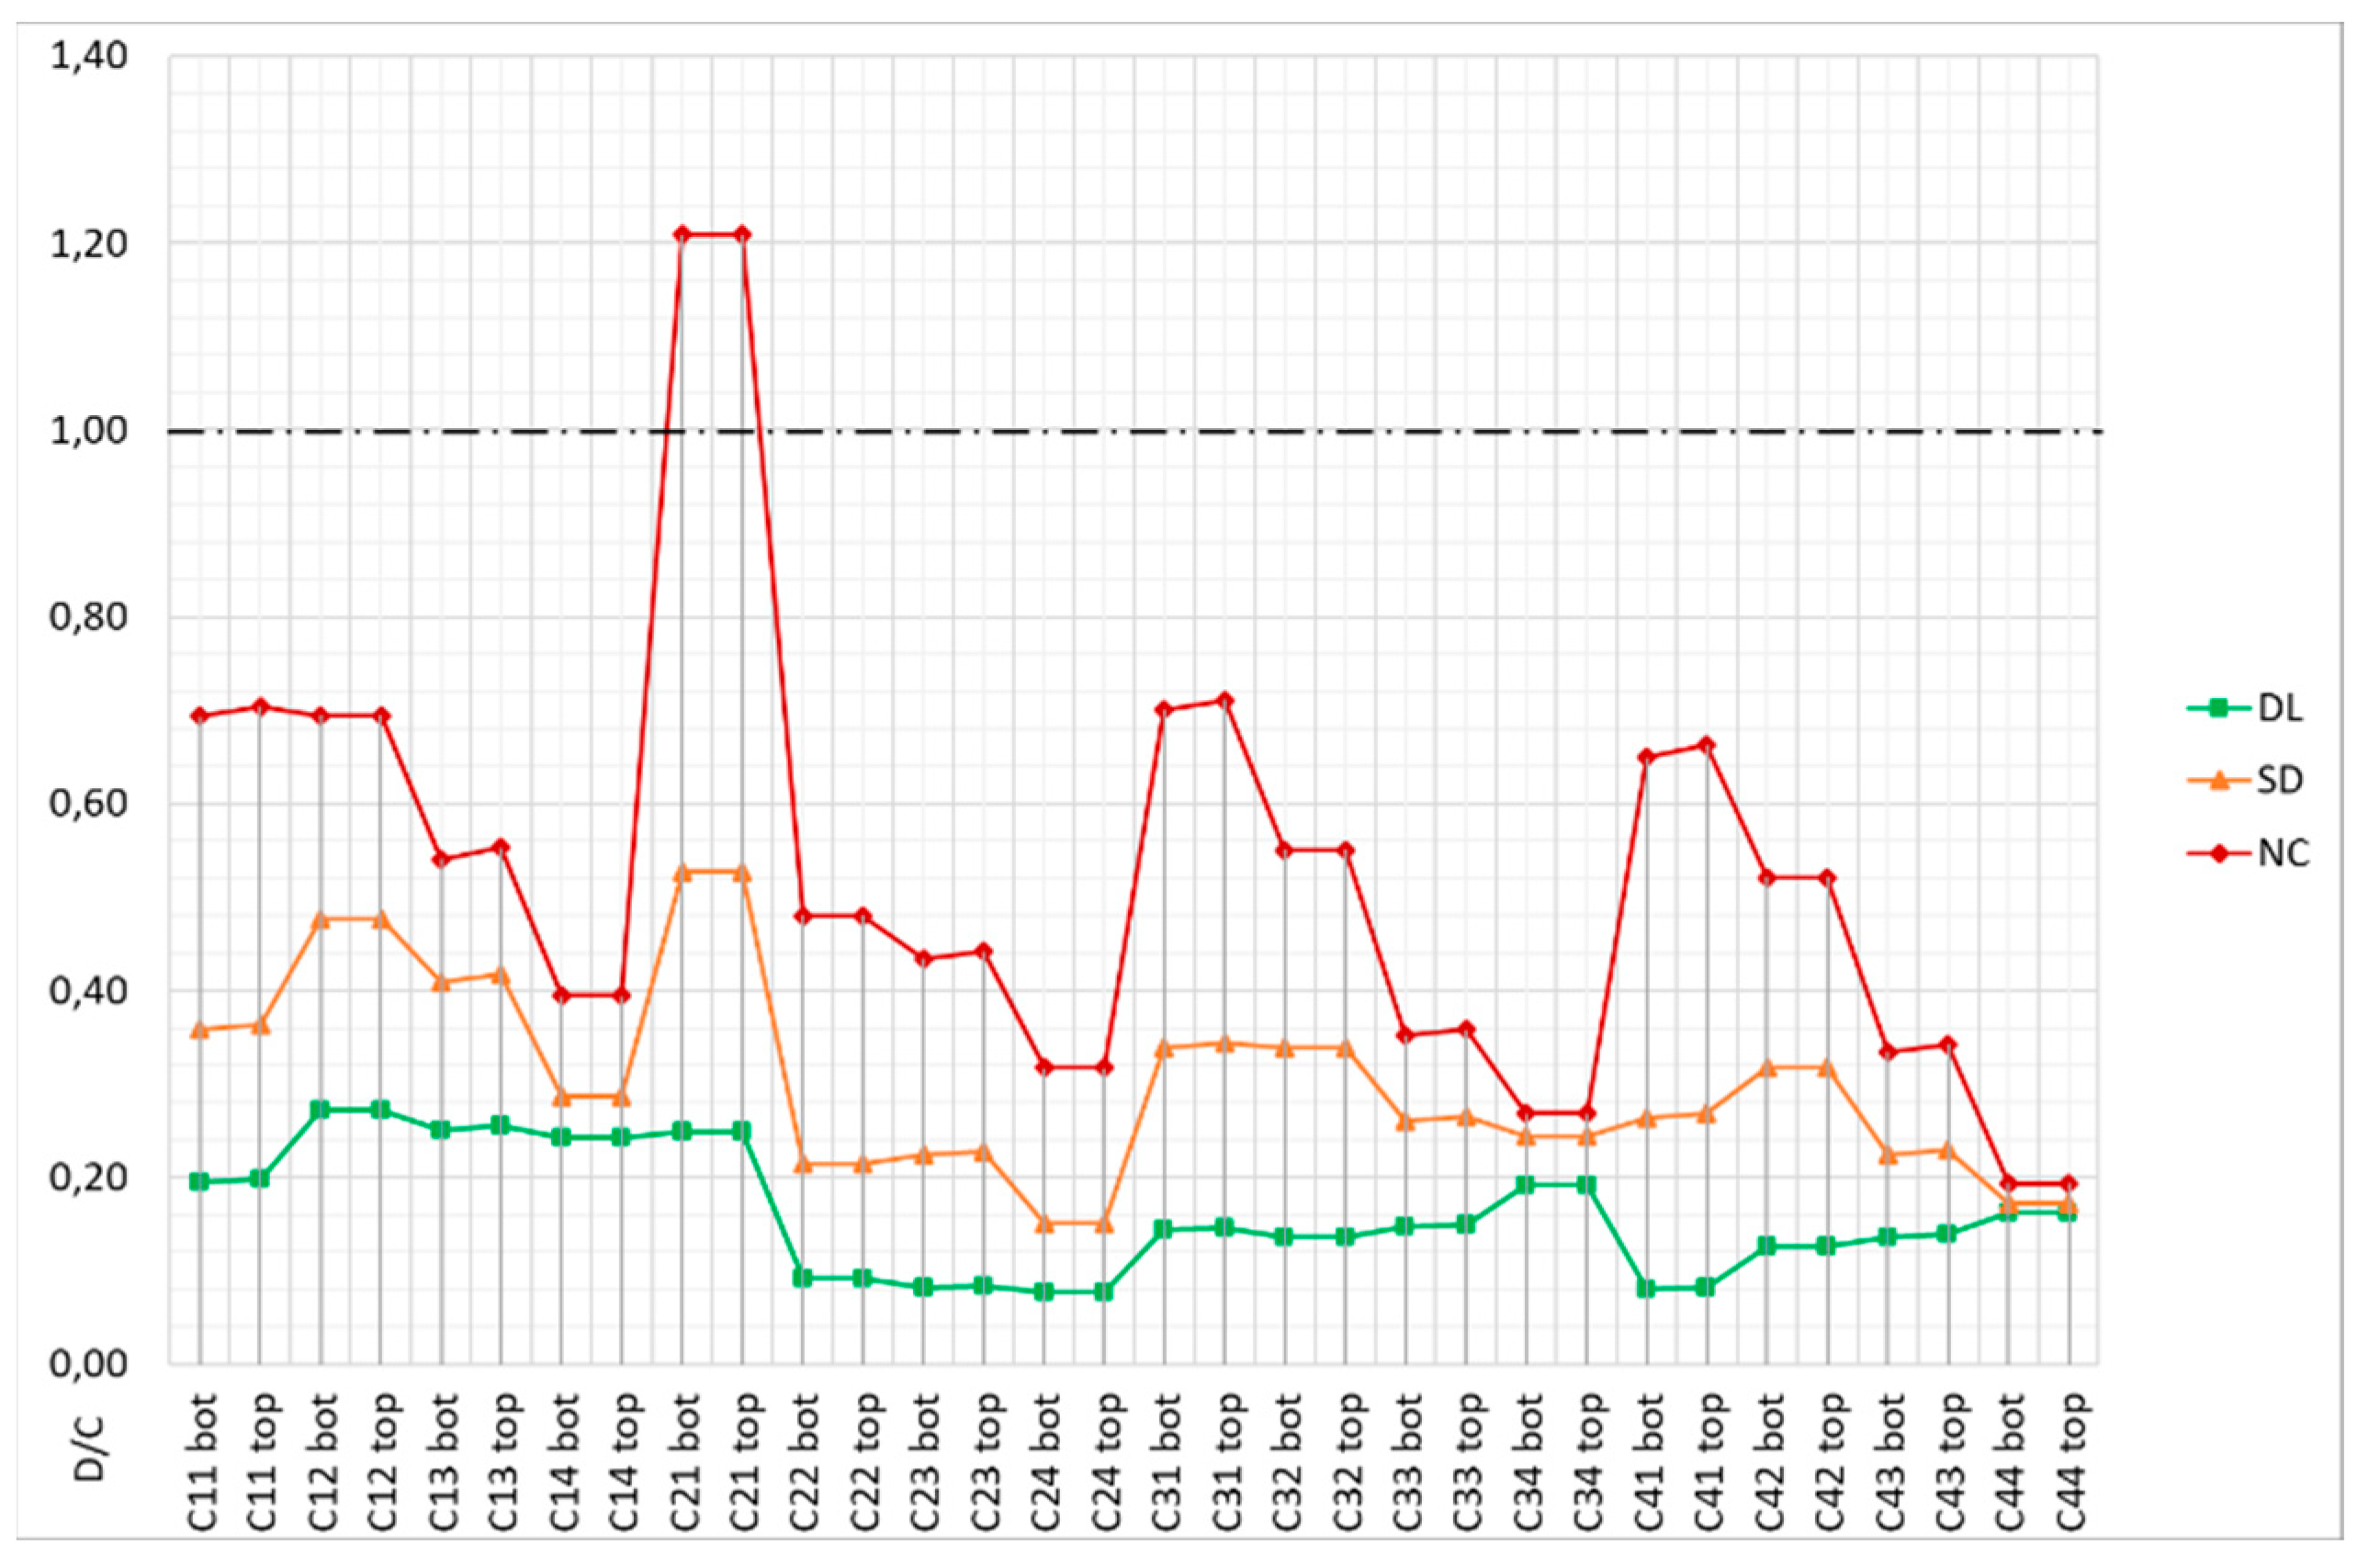
In terms of ratios, similar results were obtained with the two approaches, leading essentially to the same assessment conclusions (i.e., the same control sections were deemed unsafe). For the LSs of DL and SD, the pushover analysis results were found to be generally conservative. On the other hand, the NC chord rotation ratios obtained with the nonlinear dynamic analysis were found to be higher (on several control sections) than those given by the pushover analysis. A closer look revealed that this was relevant for the columns located at the storeys which are prone to form soft-storey mechanisms (i.e., the third storey in the case of the BF, and the first storey in the case of the IN). Concerning the NC shear force ratios, no relevant differences were found. The results in terms of global storey parameters also compared well, but some differences are worth mentioning. Higher parameter values were obtained with the pushover analysis for the LSs of DL and SD, for both frames. However, for the LS of NC, the highest floor displacements and inter-storey drifts were achieved by the nonlinear dynamic analysis. Nonetheless, the formation of the above-referred soft-storey mechanisms was captured well by both analysis methods (see inter-storey drift values), which constitutes an important validation of the nonlinear static approach. Concerning the NC base shear values, again no relevant differences were found between the results provided by the two analysis methods. Based on these findings, and even though the irregular response of the frames when pushed to a state of near collapse is better captured by the nonlinear dynamic method of analysis, the nonlinear static approach is deemed accurate enough for the purpose of evaluating the seismic performance of the BF and the IN.
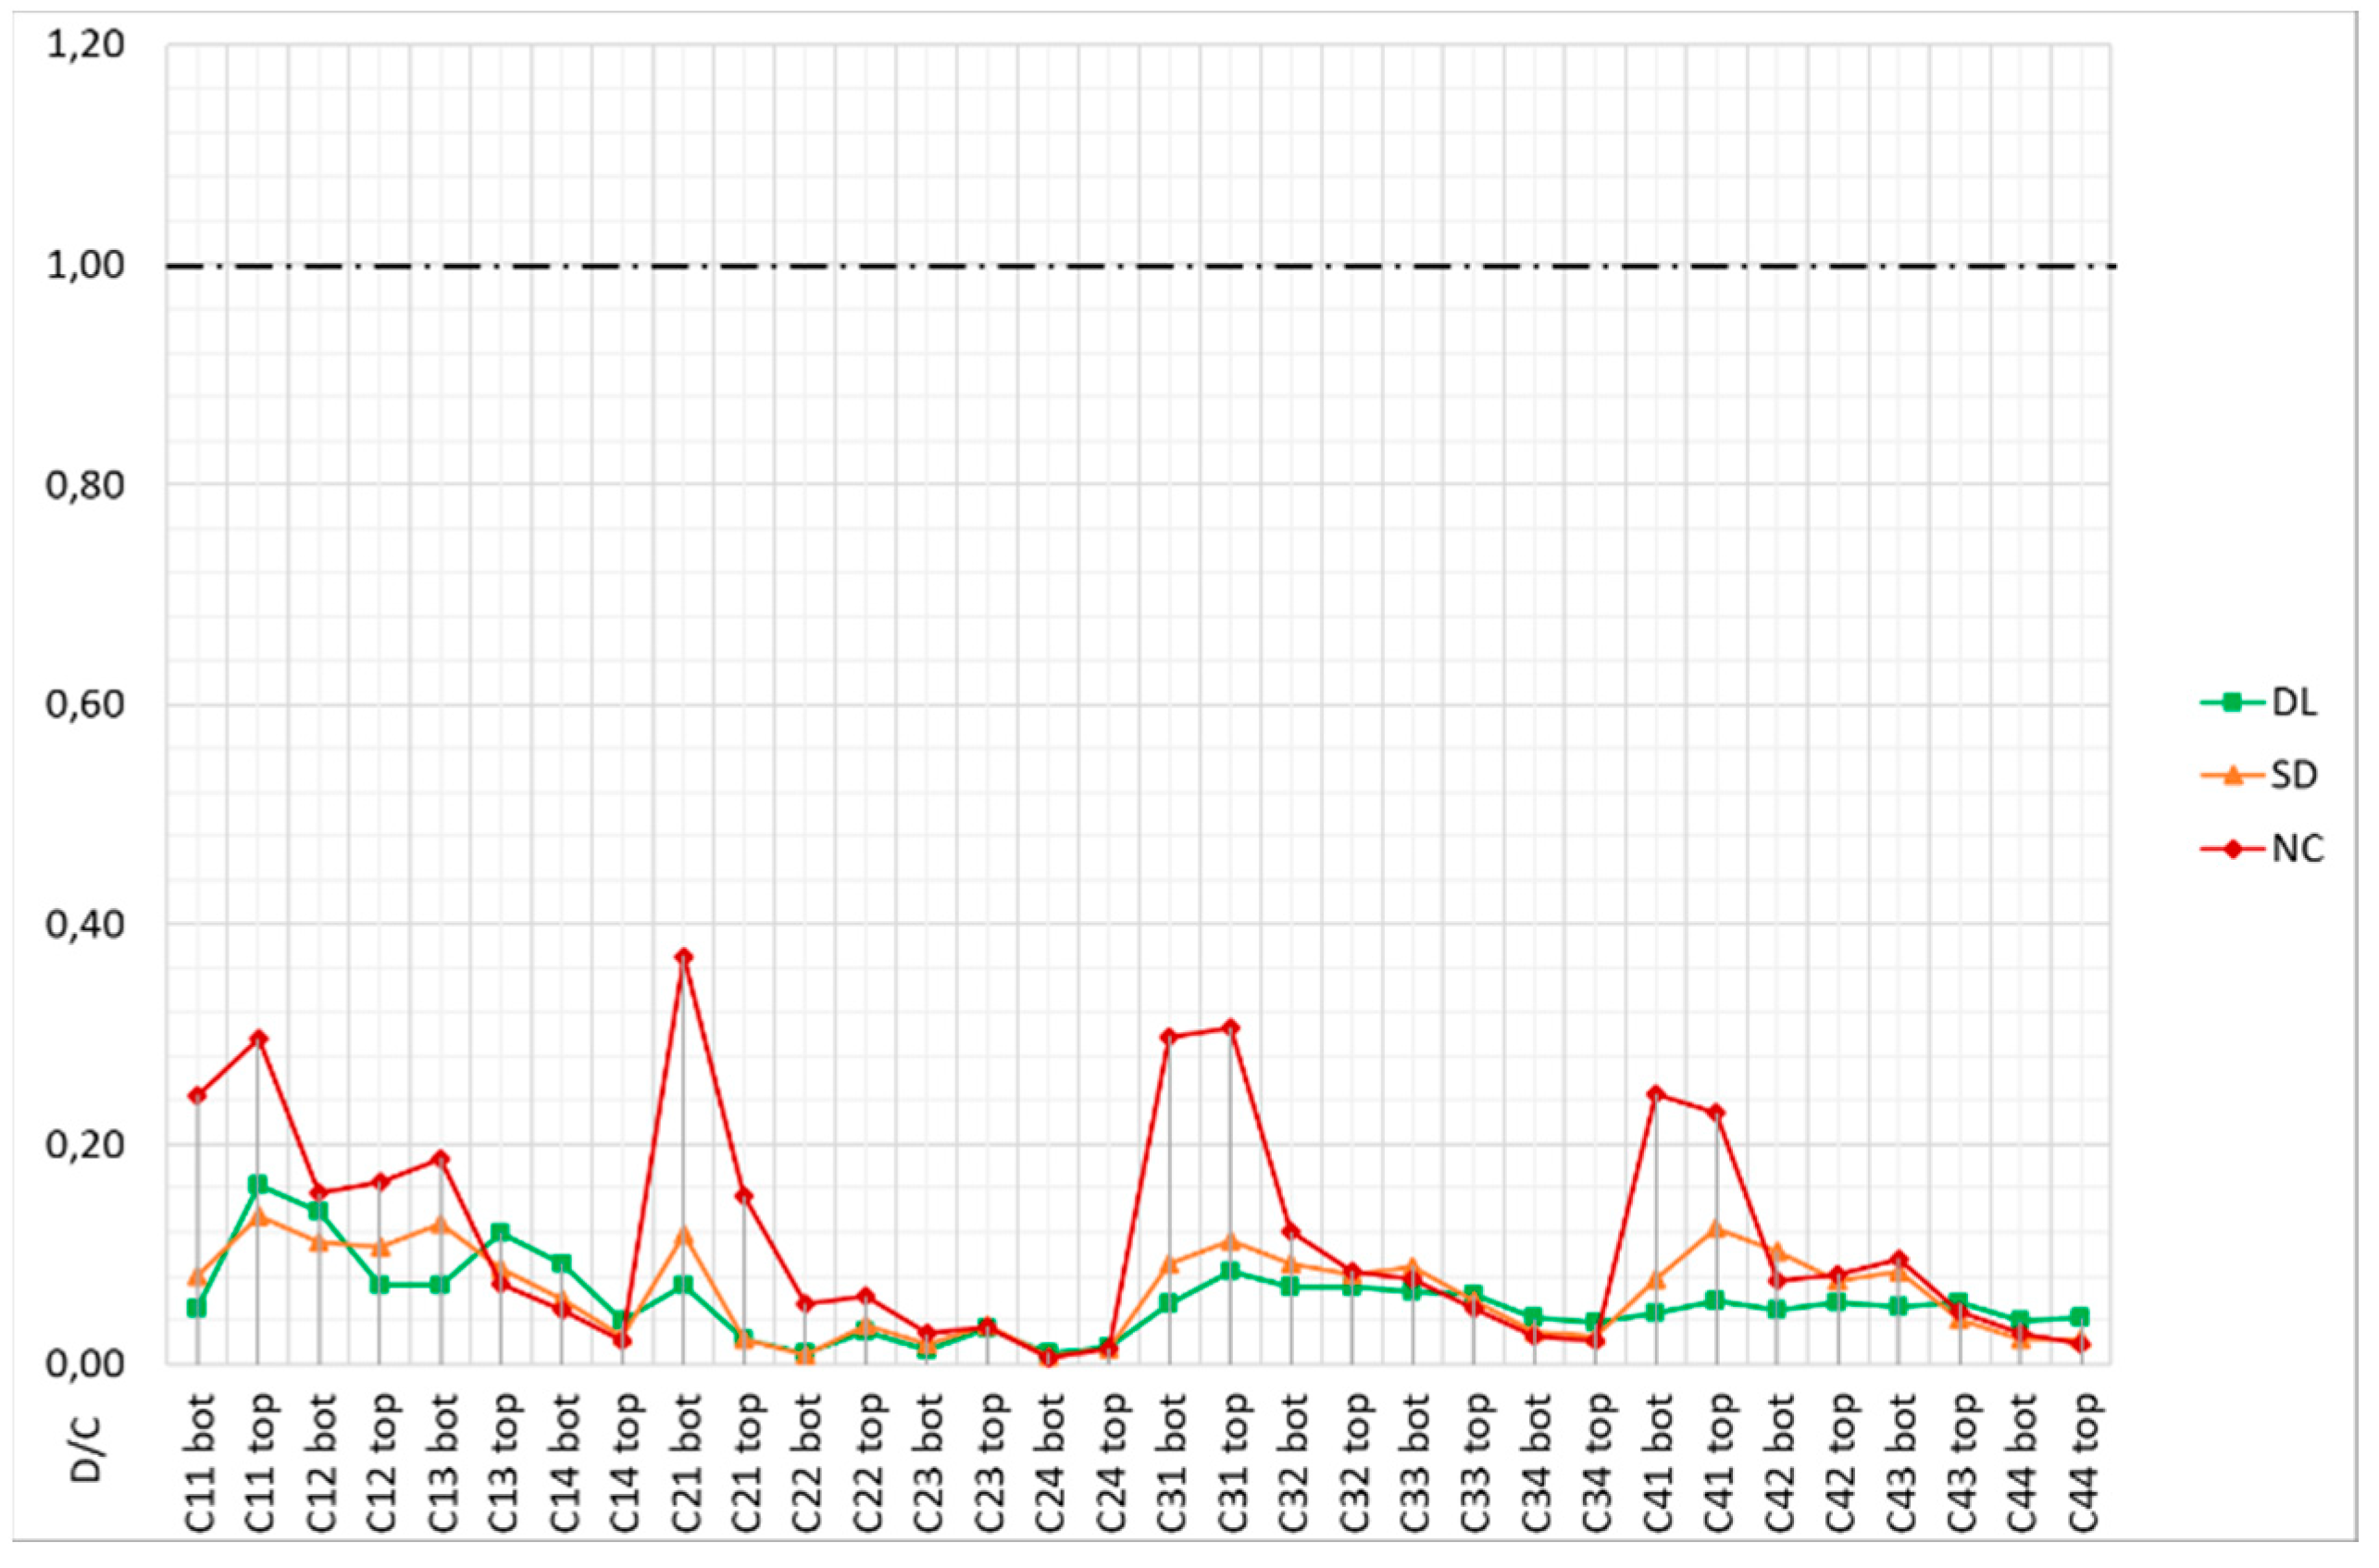
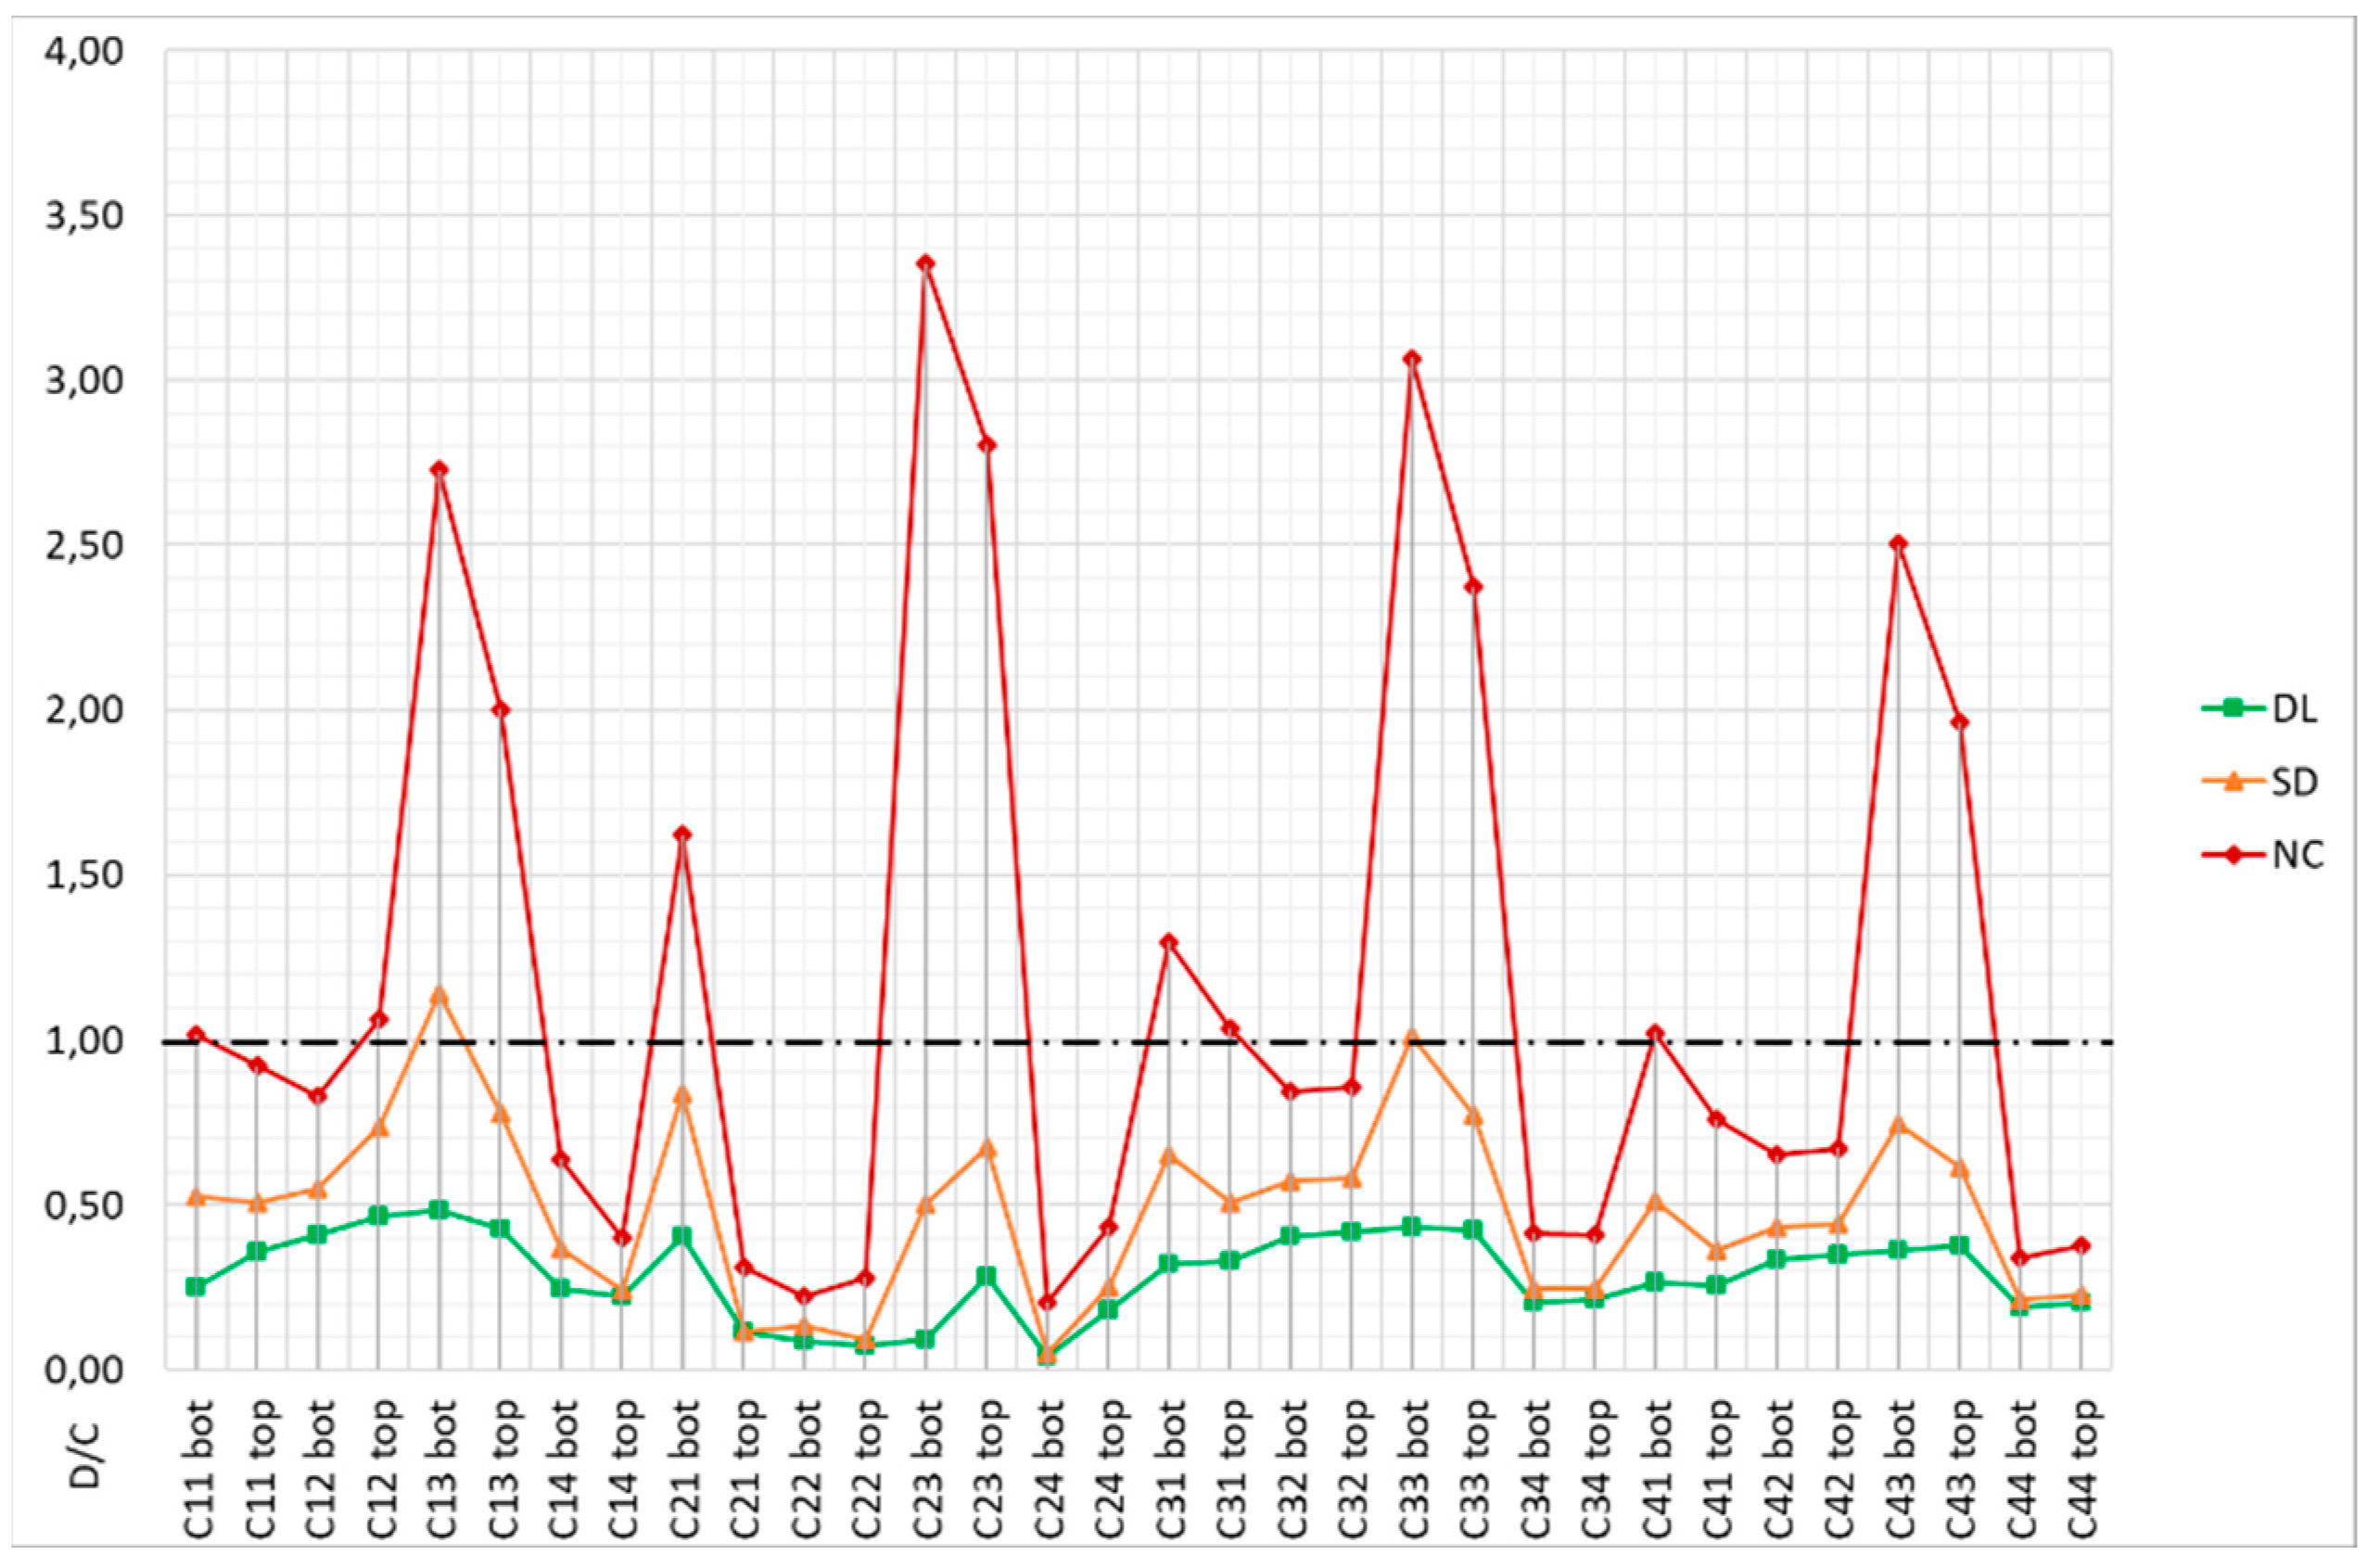
Concerning the outcome of the seismic assessment process itself, different conclusions were reached for the BF and for the IN, depending on the LS under evaluation. For the LS of DL, the chord rotation and shear force ratios were found to be below 1.0 on all control sections, thus allowing both frames to be deemed safe. However, it is noteworthy that: (i) the chord-rotation ratios of the BF are typically under 50%, while those of the IN are below 15%; and (ii) the shear force ratios of the BF are between 40% and 70%, while those of the IN are below 30%. Next, for the LS of SD, the ratios of the IN continued to be quite low (below 15% and 50% for chord rotation and shear force ratios, respectively), thus allowing it to be deemed safe. On the other hand, the ratios of the BF were found to be considerably high, both in terms of chord rotation and of shear force, in several control sections (even slightly above 1.0 in three of them). Signs of excessive deformation and shear force effectively started to show for this LS, respectively, on the columns of the third storey and on the strong column (C2) at all storeys. Therefore, in strict terms, and mainly due to the potentially excessive shear forces, the BF should not be deemed safe for the LS of SD. Finally, it was for the LS of NC that the most relevant differences were found between the BF and the IN. The chord rotation ratios of the latter, although exhibiting a significant increase on the columns of the first and second storeys, continued to be below 1.0 on all control sections. However, in terms of shear force, the capacity of the strong column was clearly exceeded on the first storey. Regarding the BF, its chord rotation capacities were exceeded on a considerable number of control sections, with ratios above 2.5 being found on the columns of the third storey. In terms of shear force, the capacities of the strong column were exceeded on all storeys. Therefore, even though the scenario for the BF is much worse than for the IN, both frames should be deemed unsafe for the LS of NC.
The conclusions drawn above show that the option to consider (or not) the masonry infill walls in the modelling of existing RC buildings might have a significant impact on the outcome of the EC8-3 seismic assessment process. For this particular case, recalling that structural importance class II only requires the verification of the LS of SD, it would mean the difference between deeming the structure to be perfectly safe and finding it to be borderline unsafe, both in terms of deformation- and strength-controlled collapse mechanisms. The latter conclusion would most likely lead to the decision to retrofit the building, with the associated financial investment, in order to make it code compliant. As such, when low and medium seismic input motions constitute the base demand for the assessment of older-type RC-framed buildings, the protection provided to the RC members by the confined masonry infill panels should not be neglected. Therefore, the effect of the latter should be accurately modelled and analysed if reliable (and realistic) seismic performance results wish to be obtained.
A closer look at the results obtained for the LS of NC, combined with the insight provided by the experimental tests, provides additional conclusions about the collapse mechanisms of the frames and the type of retrofitting that would be more adequate. The results obtained for the BF, concerning both
ratios and global storey parameters, indicate that deformation tends to be concentrated at the third storey, resulting in the formation of a soft-storey mechanism (
Figure 29). They also suggest that the strong column is most likely to suffer damage due to excessive shear force, as it absorbs the majority of the total storey shear (typically more than 70%). Additionally, the chord rotation and shear force ratios on other members are high, implying that the BF would benefit the most from a global retrofitting solution capable of reducing floor displacements, eliminating the third storey’s irregular response, and increasing the columns’ shear capacity. The results for the IN, on the other hand, show a scenario that is quite different. Looking exclusively to the
ratios, one could think that the only potentially unsafe situation would be the excessive shear force on the strong column of the first storey, and just recommend a local strengthening solution. However, the inter-storey drift results and the damage by the end of the 975-yrp experimental test show the potential that exists for a soft-storey mechanism in the case of the sudden failure of the first storey infill panels (
Figure 30). Therefore, to replace those infill panels by a solution capable of maintaining the storey’s deformation under control and increasing the shear capacity of the selected columns, while being less vulnerable to abrupt failure, would be a safer retrofitting option. The authors thus recommend that analysts do not become dependent on just
ratios, but also analyse the evolution of inelastic lateral displacement profiles.


