
Mapping the Risk of Occurrence of Defects in Façades with Ceramic Claddings


1
Civil and Environmental Engineering Department, PECC—University of Brasília, Campus Darcy Ribeiro, Asa Norte, Brasília 70910-900, Brazil
2
Lisbon School of Architecture, University of Lisbon, R. Sá Nogueira, 1349-063 Lisbon, Portugal
3
Civil Engineering Research and Innovation for Sustainability (CERIS), Instituto Superior Técnico (IST), University of Lisbon, Av. Rovisco Pais, 1049-001 Lisbon, Portugal
*
Author to whom correspondence should be addressed.
Buildings 2023, 13(5), 1209; https://0-doi-org.brum.beds.ac.uk/10.3390/buildings13051209
Submission received: 6 April 2023
/
Revised: 26 April 2023
/
Accepted: 30 April 2023
/
Published: 3 May 2023
(This article belongs to the Special Issue Rethinking Building Maintenance)
Abstract
:When a building façade does not meet its performance requirements, the integrity and safety of the structure may be compromised, resulting in the reduction of the building’s service life. Ceramic tiles are a commonly applied cladding solution due to their aesthetic value and durability. However, as soon as ceramic claddings are installed, the claddings are subjected to various degradation agents, thus starting a degradation process in which different anomalies occur sequentially and simultaneously over the years. This study intends to find patterns of incidence of anomalies in distinct areas of the façade and to map the risk of occurrence of a given anomaly. For that purpose, 345 ceramic claddings are analysed (46 buildings, corresponding to 81,500 m2) in the region of Brasília, Brazil. Four main defects are identified based on visual inspections and using auxiliary diagnosis techniques, namely (i) detachment of ceramic tiles; (ii) cracking; (iii) grout failure; (iv) efflorescence. The results reveal that the detachment is the most frequent defect. The sensitivity maps proposed allow identifying a certain pattern in the occurrence of defects on ceramic claddings, revealing that continuous walls, transition between floors, and the top of the building are areas critically vulnerable to defects. The results obtained allow mapping the sensitivity of each part of the ceramic claddings to a given defect, aiding the detection and diagnosis of the degradation condition when carrying out inspections on new façades.
1. Introduction
Durability is defined as the ability of a building or its components to perform over time under specific conditions of use and maintenance [1,2]. According to the Brazilian standard NBR 15575 [3], a building’s façade must fulfil the basic principles of safety, habitability, and sustainability. When the façade does not meet the required criteria, the building’s durability and appearance is compromised, its service life is reduced, and its maintenance costs increase [4]. Rational and adequate maintenance strategies must be selected in order to optimise the funds and resources applied in the preventative maintenance strategies adopted for ceramic-tiled façades [5].
Ceramic tiles are commonly used as a cladding solution due to a number of advantages, namely ease of cleaning, durability, thermal and acoustic insulation, fire resistance, and moisture tightness. However, when the ceramic cladding is incorrectly applied, a set of defects may appear prematurely, jeopardising the performance of the cladding system [6,7]. Each defect has unique conditions that depend on the materials applied, geometric and design parameters, execution conditions, and climatic, in-use, and maintenance factors. In an ideal scenario, all types of defects can be avoided during design or construction, but this is a very difficult objective to achieve [8] since, regardless of whether adequate design and execution conditions are adopted, ceramic claddings will naturally degrade due to the continuous action of environmental degradation agents [9]. In this sense, research on ceramic cladding façades is being developed to identify the frequency, causes, and consequences of the most common defects in the façade cladding system [10,11].
Various studies [12,13,14] address the monitoring and classification of defects in façade cladding. Most of these studies adopt statistical analysis to identify degradation patterns and trends, which can be translated into graphic schemes that identify the susceptibility to defects along the façade. These maps of risk of occurrence of defects can be used to improve design and maintenance strategies for the elimination or mitigation of the occurrence of defects [15,16].
This study intends to contribute to the state of knowledge regarding the degradation of ceramic claddings on façades, mapping the various defects that occur, their severity, and region of occurrence. Four main defects are analysed: (i) detachment of ceramic tiles; (ii) cracking; (iii) grout failure; (iv) efflorescence. A sensitivity map is defined for each defect, according to six regions of the façade. Patterns of degradation for each region of the façade are obtained through statistical and graphical analyses that may improve the process of prevention of common defects. Maps showing the risk of given defects are proposed, which can be used to adopt retro-feedback measures to improve design and maintenance procedures [17].
2. Degradation of Façades with Ceramic Claddings
The use of ceramic claddings in external façades is common, especially in Mediterranean countries and in South America, both in ancient buildings preserving a past cultural identity and in modern ones due to the benefits of using this type of tiling [17,18]. Generally, ceramic-cladded façades consist of a monolithic set of rigid layers fastened to the substrate, in which the final layer is represented by ceramic tiles with movement joints. The construction techniques adopted vary across countries. For example, in Spain, ventilated façade systems are widely used due to their energy efficiency, lower maintenance costs, and smaller deterioration ratios, adopting aluminium supports fixed to a substructure [19]. In Brazil, the use of ceramic blocks is associated with cultural and economic factors, thus making brick masonry the most common substrate to which ceramic tiles are glued using rendering or adhesive mortars [20]. This system presents a fragile non-linear mechanical behaviour due to low tensile strength and irregularity of adhesion between the different layers/materials of the system [21].
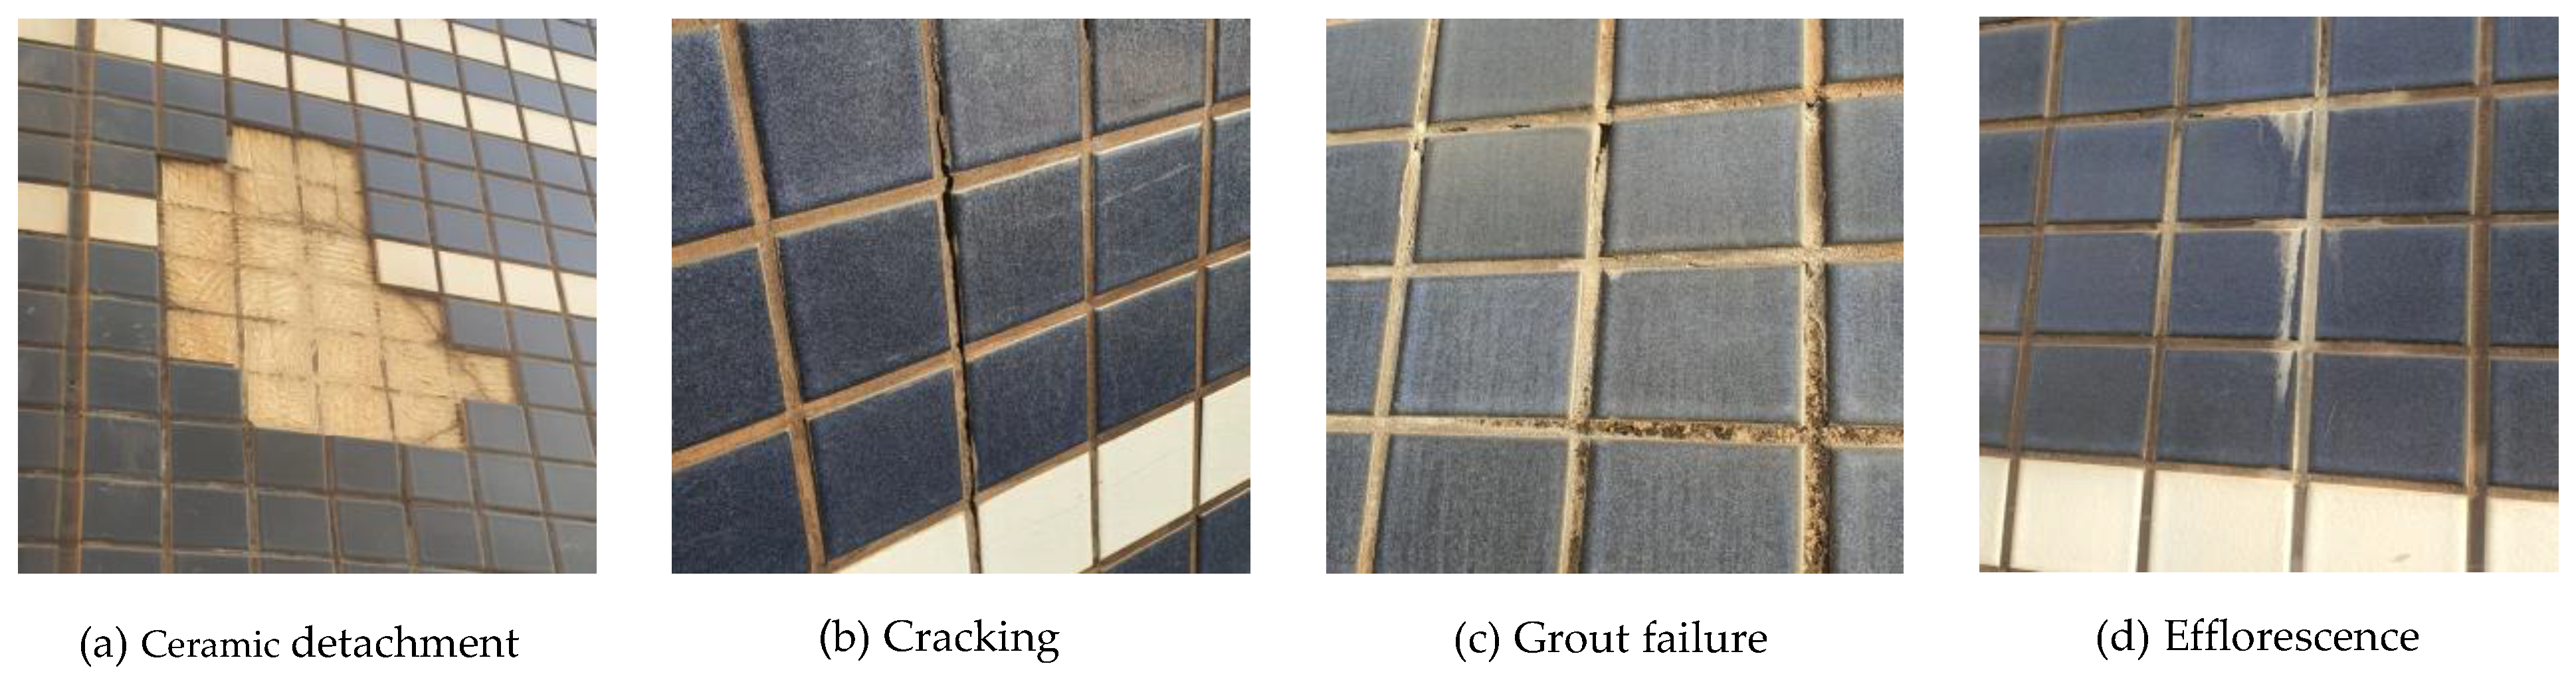
Brasília presents a unique research opportunity, since most buildings belonging to the original plan, the “Plano Piloto”, share similar architectural features. In fact, these residential buildings correspond to six-floor horizontal blocks, supported by pilotis, with façades clad with ceramic tiling [22,23]. The latter display several common defects due to their long periods of exposure, easily typified, which render them particularly relevant for the present research. According to Souza [24], the most recurrent defects in ceramic cladding systems are ceramic detachment, cracking, grout failure, and efflorescence (Figure 1).
Detachment is defined by the loss of adhesion between the system’s layers, i.e., the tile, the adhesive mortar, and the substrate [25]. Ceramic detachment is probably the most frequently observed defect in façades [26,27] and, in Brasilia, this anomaly corresponds to 71% of the anomalies in façades [28]. It is assumed that a substantial part of this problem is associated with design and execution errors and the use of inadequate materials [29].
Cracking defects are caused by tensile stresses and differential movements between the cladding system and the substrate, which is often subject to deformation under the influence of thermal and mechanical phenomena [30]. Cracking is a concerning anomaly, since it can promote the occurrence of other anomalies, such as detachment, thus having a strong influence on the ceramic-cladding system’s service life [31].
Regarding grout failure, the main defects are related to the degradation of the filling material or the loss of material in the joints. These anomalies occur due to the natural weathering processes associated with the lack of maintenance activities [11]. The defects in the joints’ filling material can allow the infiltration of water, which may compromise the overall condition of the ceramic cladding, reducing its durability and service life, a process that occurs more rapidly the more aggressive the environmental context [32].
Efflorescence is caused by the crystallisation of soluble salts after the evaporation of water. This anomaly is characterised by the deposition of salts on the surface of the claddings. The percolation of water and soluble salts in the microstructure of the ceramic tile or substrate can promote the chemical and physical degradation of ceramic claddings [33].
Although the different defects have distinct causes, several studies suggest the recurrent occurrence of certain defects in specific areas of the façade. These studies [15,34,35,36,37] map the occurrence of anomalies, dividing the façade into regions. In this study, the façade is divided into six regions, as shown in Figure 2, namely: (i) continuous walls (CW), which represent the area of the façade without discontinuities, i.e., the façade surface area without openings for window frames or balconies; (ii) openings (OP), which correspond to the perimeter of the frames around windows and doors; (iii) balconies (BA), corresponding to the protruding area of the façade more exposed to weather degradation agents; (iv) corners and borders (CB); (v) transitions between floors (TF); (vi) top, corresponding to the area above the last level, that is, a platband, wall, or other type of protection above the roof or courtyard of a building. Such regions of the façade are defined considering previous studies and the architectural characteristics of the buildings that respect a pilot construction plan, thus presenting a homogeneous typology.
The evaluation of a façade’s degradation requires an understanding of the extent, frequency, and cause of defects. To measure the degradation condition of buildings and their components, in situ inspections are performed. In this study, this analysis starts with the collection of information regarding the design, use, and maintenance of the building. Then, after a visual analysis that can be complemented by auxiliary tests, a degradation or damage map can be defined. The damage map consists of a precise representation of defects and changes in materials through graphic symbols with which the different categories and levels of degradation are represented.
Often, the lack of systematisation of procedures for representing the damage map can contribute to insufficient information or can compromise the diagnosis and even the degradation condition evaluation. To standardise the measurement of the degradation condition of façade claddings, the degradation measurement method (DMM) was created by the University of Brasília [11] to assess the degradation of building façades, comprising 46 buildings in its database. This methodology is organised in a systematic way, including the façade inspection and the identification, quantification, and measurement of the defects through degradation indicators. Figure 3 illustrates the different stages for the assessment of the defects observed in the façades under analysis. The first stage corresponds to the image recording of the inspected façade, which can be carried out by conventional cameras or installed in equipment such as drones. In the second stage, the image of the façade is orthogonalised (for a correct measure of the areas affected by the different defects). The third stage is the representation of the defects registered during the inspection by the creation of a sketch. Finally, the last stage corresponds to the subdivision of the façade in regions (defined in Figure 2), together with the use of the overlapping mesh, with 0.25 m2 of mesh unit, to quantify the degraded area.
3. Methods
This research is divided into three stages, as illustrated in Figure 4. The first stage consists of analysing the database, which was developed by researchers from the project “Degradation, Measurement and Modelling (DMMproject)” of the graduate program in structures and civil construction at the University of Brasília, Brazil [11]. The second stage corresponds to the adaptation of the methodology proposed by Gaspar and Brito [15] to evaluate the probability and sensitivity to a specific defect of the different areas of the façades. The third stage comprises the definition of a model to represent the probability of occurrence of specific defects on ceramic claddings in the six regions of the façade considered, taking into consideration the database of 345 façades inspected in Brasília, with ages between 5 and 43 years of construction and an average value of approximately 23.5 years.
3.1. Database
The database covers an area of inspected façades of approximately 81,500 m2. The samples are characterised according to their age, number of floors, colour and size of the ceramic tile, characteristics and location of the cladding, orientation, and, finally, bioclimatic zone. Brasília has a tropical climate with dry winters, according to the Köppen classification, due to the long dry period during the year, corresponding to bioclimatic zone 4 [39].
After the visual inspection, combined with the auxiliary methods of diagnosis (percussion tests, pull-out tests, and thermography), the mapping of the defects is defined. As mentioned, four types of defects are considered: detachment, cracking, grout failure, and efflorescence. Subsequently, the adapted DMMProject index is applied to quantify the degradation condition of the ceramic tiles analysed, as well as to assess the degradation trend of the façades under analysis, which will be explained in the following section. The use of the measurement mesh (Figure 3d) helps to quantify the area affected by the different anomalies in the six regions considered.
3.2. Adaptation of Probability and Sensitivity Indexes
Gaspar and Brito [15] proposed an index to estimate the probability of occurrence of a defect with a given degradation level, mapping the sensitivity of the façade to the appearance of defects. In the research of Gaspar and Brito [15], the probability of occurrence of a given defect is obtained by the product between the defect occurrence frequency and the defect condition level, as described in Equation (1).
where is the probability of occurrence of a defect, is the frequency of occurrence of the defect, and is the condition level of the defect.
The indicator reflects the intensity of degradation in a given region of the façade. This indicator is obtained by the ratio between the affected area of the region and the total area of the region on each façade (Equation (2)).
where is the frequency of occurrence of the defect, is the damaged area of the analysed region (in m2), is the total area of the region (in m2), and is the façade region (continuous walls, openings, corners and borders, balconies, transition between floors, and top).
The condition level of the defect () considers a hierarchical level of degradation according to the degree of occurrence of defects. Table 1 presents the definition of the degradation levels, which are classified according to the extent of degradation.
The expresses the sensitivity of a façade to a given defect (Equation (3)). This indicator is obtained by the product between the probability of occurrence of a defect () and the relative weight between defects ().
where is the sensitivity of a façade to a defect, is the probability of occurrence of a defect, and is the relative weight between defects.
The is a constant that weights the relationship between the defect and how this defect affects the overall performance of the cladding system. In addition, this constant considers the origins and causes of the defect. The value of the constant is equivalent to 1.00 for ceramic detachment, 0.77 for cracking, 0.28 for grout failure, and 0.11 for efflorescence [38,39,40].
3.3. Model Façade and Standard Maps
There are different forms of representation proposed for the damage maps as a record of the level of commitment of the constructive elements and the functionality of the buildings [41,42]. However, the most common maps used present insufficient information, compromising an efficient understanding of the degradation condition of the element under analysis. In this sense, the systematisation of the procedures and an accurate graphic representation of the degradation is required to minimise inaccuracies in the analysis and diagnosis of the degradation condition of ceramic claddings.
A prototype façade is proposed to obtain a representative façade from the database. As mentioned, Brasília was built using an urban and architectural master plan [7], therefore having a relatively standardised construction, which implies that the sample buildings have comparatively homogeneous characteristics similar to the prototype proposed in this study. Therefore, the prototype façade is defined considering the common characteristics to all buildings in the database. This prototype façade has three floors plus the pilotis (an open area supported by pillars that corresponds to the projection of the surface of the floor immediately above) and is subdivided into six regions, as illustrated in Figure 5. This prototype façade is adopted for the definition of a standard map and to carry out the analysis of sensitivity of ceramic claddings to degradation by region.
The definition of the standard maps is carried out using current computer aided design software and adopting topographic techniques applied to the prototype façade. The standard maps of sensitivity to the degradation of ceramic claddings are defined based on the technique of linear interpolation in combination with the triangular irregular network (TIN) technique. The similar values are interconnected, generating contour lines, i.e., lines that connect points with the same “altitude”. This technique is widely used in topographic studies for the definition of contour lines [43].
In this study, the prototype façade is treated as a topographic plane in which the contour lines represent the sensitivity values of the façade to degradation, resulting in standard maps. The data entered in the standard maps refer to the indicator of sensitivity of the façade’s ceramic claddings to degradation. A standard map for the sensitivity of ceramic claddings to each defect is defined and is discussed in the next section.
4. Discussion of the Results
Sensitivity maps are tools that allow verifying which regions are the most sensitive to defects. These sensitivity maps are extremely important to understand in more detail the degradation mechanisms of ceramic claddings, thus identifying the regions most prone to the occurrence of a given defect. The use of these maps is crucial for the prevention and mitigation of defects on the façade as a whole and for specific regions at the project stage and during construction, use, and maintenance phases. The results of the façade’s sensitivity to degradation (Table 2) provide information for the definition of the standard maps. Because these are measurements multiplied by an impact factor (), the resulting values are non-dimensional.
Ceramic tile detachment is the most important anomaly to be mapped, since its occurrence compromises the integrity of the coating and the safety of users and passers-by. Figure 6 presents the probability of the occurrence of detachment in the six regions considered and Figure 7 shows the standard map for the ceramic cladding sensitivity to detachment. The results reveal that the regions of transition between floors (0.694) and continuous walls (0.654) are more prone to the occurrence of detachment of ceramic claddings. When analysing the occurrence of detachment with the highest degradation level (level 4, in Figure 6), the results show a higher incidence of severe detachment in the transition between floors (TF), in the top of the building (TO), and in the borders and corners (BC).
The results of the occurrence of cracking in ceramic claddings (Figure 8 and Figure 9) reveal that the top region of the building presents a higher sensitivity to cracking (0.178). This region is more subjected to differential movements by thermal expansion due to high solar incidence and exposure to rain that promote the occurrence of cracks [44,45]. When analysing the highest degradation level (Figure 8), the higher occurrence of cracking in level 4 occurs for the regions of transition between floors (TF), for the top of the building (TO), and for the borders and corners (BC), which can be also justified by the concentration of loads in these regions [15]. Several researchers [7,11,46] suggest that, despite their high incidence on the façade, cracks are anomalies that tend to stabilize after their occurrence. Nevertheless, cracks due to shrinkage or expansion movements of various natures tend to occur in regions of higher defect concentration, being a headway to other eventual future anomalies.
The sensitivity map and the probability of occurrence of defects seem to reveal that detachment tends to occur in the regions with higher accumulated stresses; in fact, continuous walls concentrate loads from structural movements and the transition region between floors tends to accumulate the loads of the structure, coming from pillars, beams, and slabs for later distribution to the foundation of the building. Consequently, the lack of movement joints and/or the inadequate sizing of the structure tend to cause low mechanical strength and inefficiency in the absorption of structural deformations. Moreover, the detachment of ceramic claddings is conditioned by execution errors, such as laying the ceramic tiles on a contaminated or mistreated surface, inadequate thickness and rigidity of the bending mortar, and the absence or deterioration of the joints, which accelerate the ceramic claddings’ degradation process [29].
Regarding the probability of occurrence of grout failure in ceramic claddings by region (Figure 10 and Figure 11), the sensitivity map reveals a higher sensitivity for the regions of transition between floor (0.020) and top of the building (0.018). The transitions between the floors, the top, and the borders and corners present the higher occurrences of anomalies in level 3. These regions are particularly affected by differential movements, whose concentrated stresses are absorbed by the cladding joints. In this sense, the main reasons for the prevalence of grout failure in these regions are the inadequate dimensioning of joints (e.g., insufficient or with inadequate width), the adoption of inadequate grout filling materials, and the absence of regular maintenance actions [47]. The sensitivity of the top region is associated with a high exposure to weather agents, such as solar incidence and UV radiation exposure and driving rain, whose cumulative effects over time tend to increase the occurrence of grout failure defects [46,47,48,49].
Figure 12 and Figure 13 present the sensitivity and probability of the occurrence of efflorescence in ceramic claddings by region. Efflorescence is often related to the ingress of moisture into the cladding system. The formation of stains may be a response to the lack of elements to conduct water percolation, promoting the accumulation of soluble salts in the composition of the materials of the cladding system. The results reveal a prevalence of occurrence of efflorescence of levels 2 and 3 in transition between floors, borders and corners, and continuous walls (Figure 12). The regions most prone to efflorescence tend to be those that receive a greater intensity of weathering actions. Continuous walls and borders and corners are regions exposed to wetting/drying cycles during driving rainfalls, which lead to the presence of water in the cladding during long periods of exposure. These regions are also highly prone to detachment, which in turn may promote the ingress of moisture into the cladding system [50,51,52]. The transition between floors and thermal bridges can also influence moisture absorption variations in the wall, as well as differential deposition of dirt and sediments into ceramic cladding systems. Finally, the design conditions and the presence of sills, drip pans, and water drainage ways may also influence the occurrence and the development of efflorescence and moisture-related defects into the different regions [53,54].
Sensitivity analysis to detachment, cracking, grout failure, and efflorescence reveals that balconies are the regions with lower incidences of defects, with a value equal to 0.071, 0.010, 0.002, and 0.00003, respectively. In addition, the balconies are elements that present individual degradation patterns, since they are separate/protruding from the continuous façade, functioning as instruments for moisture deviation and percolation.
Despite not computing specific characteristics of the buildings, the factors that compose the database directly influence the results, to which the average of the results is analysed for the definition of the sensitivity maps. The age, number of floors, colouration, size of the tiling, and orientation of the façade will be analysed in future studies.
Regarding the initial phases of data collection, the percussion test is crucial to ascertain the current degradation of the façades, as well as the adoption of complementary tests on the ceramic tiles, such as water absorption and expansion by humidity. The deterioration of existing façades is the result of the combined action of degradation agents that are intertwined with various factors. The different degradation agents that act on the façade system and impair its durability, as well as the conditions under which the failure process takes place, must be considered in the design. Once durability is compromised, the service life of the system is reduced. The causes and behaviour of the degradation are not completely understood, since several factors that affect the degradation mechanism act simultaneously [10,14,40].
5. Conclusions
This study considers the research hypothesis that graphical models can be used to illustrate and map the levels of degradation of buildings’ façades. To confirm this hypothesis, the mapping of the degradation of buildings in Brasília, Brazil are carried out based on an extensive database of the condition of ceramic-clad façades previously assessed through visual inspections. The data collected allow assessing the pattern of degradation of façades with ceramic tiles, considering the four main defects observed in these claddings (detachment, cracking, grout failure, and efflorescence). In this context, different sensitivity maps are drawn that illustrate the probability of occurrence of the most common defects in six distinct regions of the façade.
Overall, it is concluded that detachment is the most common type of defect in ceramic tiles applied to façades and the one that presents the most serious consequences. This defect often occurs due to a reduced adhesion resistance caused by intense heating and cooling cycles. An incorrect execution and inadequate selection of materials can also promote the detachment of ceramic tiles. This defect is considered the most serious among the different defects analysed, since it jeopardises the safety of owners and users. Moreover, this defect is difficult and expensive to correct, sometimes requiring a complete replacement of the cladding. Although the occurrence of other defects on the façades, such as efflorescence and grout failure, is common, the latter occur in less significant proportions, with less influence on the overall degradation process of the façade.
The continuous wall region—wall surfaces without openings—presents the higher incidence of defects, given its greater extension when compared with other regions of the façade. The sensitivity map allows evaluating the area affected by the defects relative to one another by assessing the probability of occurrence of defects in the different regions.
When analysing the area affected by the defects in a relative way, assessing the probability of occurrence of defects through the sensitivity map, the continuous wall region presents a higher incidence of defects, thus compromising the overall degradation condition of ceramic claddings. The regions of transition between floors, the top of the building, and borders and corners are strongly vulnerable to detachment, cracking, and grout failure. The high predominance of these defects in these regions can be explained by the concentration of stresses caused by differential movements (e.g., interface between the masonry and structural beams on rigid construction systems). Significantly, the sample analysed reveals improperly designed joints, either due to inadequate dimensions or by inadequate filling materials, which promote the appearance of defects in those regions due to the inability to absorb the deformations suffered by the cladding during its service life. When compared with the other regions under analysis, balconies have a lower sensibility to the presence of defects.
This information may be used for better design and construction decisions at the beginning of a building’s life cycle, helping to prevent and mitigate the occurrence of defects. It is worth mentioning that the standard façade model was produced by CAD (computer aided design) software. It is therefore possible to transform it into an IFC (industry foundation classes) file, which establishes international standards of properties for objects in the construction industry. In this way, it is possible to introduce this information at the initial design stage of the project in order to control the first levels of degradation and to prevent the defects in the construction elements.
Author Contributions
Conceptualization, W.C. and J.S.; funding acquisition, W.C.; investigation, W.C. and J.S.; writing—original draft, W.C., J.S. and A.S.; writing—review and editing, W.C., J.S., P.G. and A.S. All authors have read and agreed to the published version of the manuscript.
Funding
This research was funded by Fundação para a Ciência e Tecnologia (FCT) through the individual project CEECIND/01337/2017.
Data Availability Statement
The data presented in this study are available on request from the corresponding author.
Acknowledgments
The authors would like to thank the researchers of the DMM Project, which is part of the Graduate Program in Structures and Civil Construction at the University of Brasília, for providing the data. It is important to mention the Technical Superior Institute of University of Lisbon as a supporter of the research and as a promoter of the analysis of results. They would also like to thank the Brazilian National Council for Scientific and Technological Development (CNPq) for funding the research in question.
Conflicts of Interest
The authors declare no conflict of interest.
References
- ASTM E 632; Standard Practice for Developing Accelerated Tests to Aid Prediction of the Service Life of Building Components and Materials. American Society for Testing and Materials: West Conshohocken, PA, USA, 1996.
- De Brito, J.; Silva, A.; Task Group. The factor method as a general framework for service life prediction: Past and future trends. In CIB W080-Prediction of Service Life for Buildings and Components; International Council for Research and Innovation in Building and Construction: Kanata, ON, Canada, 2021; Available online: https://cibworld.org/wp-content/uploads/2022/01/CIBW080-Factor-method_report_v14-final.pdf (accessed on 10 January 2023).
- ABNT NBR 15575-1; Residential Buildings—Performance. Part 1: General Requirements, Brazilian Association of Technical Standards. Associação Brasileira de Normas Técnicas (ABNT): Rio de Janeiro, Brazil, 2021. (In Portuguese)
- Guo, J.; Wang, Q.; Li, Y.; Liu, P. Façade defects classification from imbalanced dataset using meta learning-based convolutional neural network. Comput. Civ. Infrastruct. Eng. 2020, 35, 1403–1418. [Google Scholar] [CrossRef]
- Flores-Colen, I.; de Brito, J. A systematic approach for maintenance budgeting of buildings façades based on predictive and preventive strategies. Constr. Build. Mater. 2010, 24, 1718–1729. [Google Scholar] [CrossRef]
- Silvestre, J.D.; de Brito, J. Inspection and Repair of Ceramic Tiling within a Building Management System. J. Mater. Civ. Eng. 2010, 22, 39–48. [Google Scholar] [CrossRef]
- Souza, J.; Silva, A.; de Brito, J.; Bauer, E. Application of a graphical method to predict the service life of adhesive ceramic external wall claddings in the city of Brasília, Brazil. J. Build. Eng. 2018, 19, 1–13. [Google Scholar] [CrossRef]
- Lee, K.; Hong, G.; Sael, L.; Lee, S.; Kim, H.Y. MultiDefectNet: Multi-Class Defect Detection of Building Façade Based on Deep Convolutional Neural Network. Sustainability 2020, 12, 9785. [Google Scholar] [CrossRef]
- Lee, J.-S. Value Engineering for Defect Prevention on Building Façade. J. Constr. Eng. Manag. 2018, 144, 04018069. [Google Scholar] [CrossRef]
- Pacheco, C.P.; Vieira, G.L. Quantitative and qualitative analysis of deterioration of facades with ceramic external coating. Ceramic 2017, 63, 432–445. [Google Scholar] [CrossRef]
- Bauer, E.; Souza, A. Failure patterns associated with facade zones and anomalies in the initiation and propagation of degradation. Constr. Build. Mater. 2022, 347, 128563. [Google Scholar] [CrossRef]
- Pereira, C.; de Brito, J.; Silvestre, J.D. Harmonised Classification of the Causes of Defects in a Global Inspection System: Proposed Methodology and Analysis of Fieldwork Data. Sustainability 2020, 12, 5564. [Google Scholar] [CrossRef]
- Pereira, C.; de Brito, J.; Silvestre, J.D. Harmonising the classification of diagnosis methods within a global building inspection system: Proposed methodology and analysis of fieldwork data. Eng. Fail. Anal. 2020, 115, 104627. [Google Scholar] [CrossRef]
- Silvestre, J.D.; de Brito, J. Ceramic tiling inspection system. Constr. Build. Mater. 2009, 23, 653–668. [Google Scholar] [CrossRef]
- Gaspar, P.; de Brito, J. Mapping defect sensitivity in external mortar renders. Constr. Build. Mater. 2005, 19, 571–578. [Google Scholar] [CrossRef]
- Krahmalny, T.A.; Evtushenko, S.I. Typical defects and damage to the industrial buildings’ facades. IOP Conf. Series: Mater. Sci. Eng. 2020, 775, 012135. [Google Scholar] [CrossRef]
- del Solar Serrano, P.; del Río Merino, M.; Villoria Sáez, P. Methodology for continuous improvement projects in housing constructions. Buildings 2020, 10, 199. [Google Scholar] [CrossRef]
- Botas, S.M.D.S.; Veiga, M.D.R.S.; Velosa, A.L. Adhesion of Air Lime–Based Mortars to Old Tiles: Moisture and Open Porosity Influence in Tile/Mortar Interfaces. J. Mater. Civ. Eng. 2015, 27, 04014161. [Google Scholar] [CrossRef]
- Ribeiro, A.; Mariot, H.; Angioletto, E.; Junior, A.D.N. Fire exposure behavior of epoxy reinforced with jute fiber applied to ceramic tiles for a ventilated facade system. Mater. Res. 2019, 22, e20180885. [Google Scholar] [CrossRef]
- Bezerra, L.M.; Uchôa, J.C.B.; Araújo, J.A.; Bonilla, J. Experimental and Numerical Investigation of Fatigue in Base-Rendering Mortar Used in Façades Undergoing Thermal Cycles. J. Mater. Civ. Eng. 2018, 30, 04018192. [Google Scholar] [CrossRef]
- Nadoushani, Z.S.M.; Akbarnezhad, A.; Jornet, J.F.; Xiao, J. Multi-criteria selection of façade systems based on sustainability criteria. Build. Environ. 2017, 121, 67–78. [Google Scholar] [CrossRef]
- França, F.; Holanda, F. Indiscipline which transforms architecture appropriations of domestic space in the Federal District. In Proceedings of the 7th International Space Syntax Symposium, Stockholm, Sweden, 8–11 June 2009; pp. 1–14. [Google Scholar]
- Moura, A.C.; Ribeiro, S.; Correa, I.; Braga, B. Parametric modelling of urban landscape: Decoding the Brasília of Lúcio costa from modernism to present days. J. Land Use Mobil. Environ. 2014, 1, 695–708. [Google Scholar]
- Souza, J.; Silva, A.; de Brito, J.; Bauer, E. Service life prediction of ceramic tiling systems in Brasília-Brazil using the factor method. Constr. Build. Mater. 2018, 192, 38–49. [Google Scholar] [CrossRef]
- Silvestre, J.; de Brito, J. Ceramic tiling in building façades: Inspection and pathological characterization using an expert system. Constr. Build. Mater. 2011, 25, 1560–1571. [Google Scholar] [CrossRef]
- Lourenço, T.; Matias, L.; Faria, P. Anomaly diagnosis in ceramic claddings by thermography-A review. In Proceedings of the 7th International Conference on Safety and Durability of Structures, ICOSADOS, Vila Real, Portugal, 10–12 May 2016; pp. 1–8. [Google Scholar]
- Lourenço, T.; Matias, L.; Faria, P. Anomalies detection in adhesive wall tiling systems by infrared thermography. Constr. Build. Mater. 2017, 148, 419–428. [Google Scholar] [CrossRef]
- Bauer, E.; de Freitas, V.P.; Mustelier, N.; Barreira, E.; de Freitas, S.S. Infrared thermography—Evaluation of the results reproducibility. Struct. Surv. 2015, 33, 20–35. [Google Scholar] [CrossRef]
- Feldfogel, S.; Rabinovitch, O. Evolution and stability of tile detachment—Experiments and modeling. Int. J. Solids Struct. 2021, 210, 145–161. [Google Scholar] [CrossRef]
- Galbusera, M.M.; de Brito, J.; Silva, A. Application of the Factor Method to the Prediction of the Service Life of Ceramic External Wall Cladding. J. Perform. Constr. Facil. 2015, 29, 04014086. [Google Scholar] [CrossRef]
- Bauer, E.; Milhomem, P.M.; Aidar, L.A.G. Evaluating the damage degree of cracking in facades using infrared thermography. J. Civ. Struct. Health Monit. 2018, 8, 517–528. [Google Scholar] [CrossRef]
- Silvestre, J.; de Brito, J. Statistical analysis of defects of tiles joints. Mater. Construcción 2007, 57, 85–92. [Google Scholar]
- Sun, K.; Peng, X.; Wang, S.; Zeng, L.; Ran, P.; Ji, G. Effect of nano-SiO2 on the efflorescence of an alkali-activated metakaolin mortar. Constr. Build. Mater. 2020, 253, 118952. [Google Scholar] [CrossRef]
- Gaspar, K.; Casals, M.; Gangolells, M. Classifying System for Façades and Anomalies. J. Perform. Constr. Facil. 2016, 30, 04014187. [Google Scholar] [CrossRef]
- de Souza, J.S.; Bauer, E.; Nascimento, M.L.M.; Capuzzo, V.M.S.; Zanoni, V.A.G. Study of damage distribution and intensity in regions of the facade. J. Build. Pathol. Rehabilitation 2016, 1, 3. [Google Scholar] [CrossRef]
- Bersch, J.D.; Verdum, G.; Guerra, F.L.; Socoloski, R.F.; Giordani, C.; Zucchetti, L.; Masuero, A.B. Diagnosis of Pathological Manifestations and Characterization of the Mortar Coating from the Facades of Historical Buildings in Porto Alegre—Brazil: A Case Study of Château and Observatório Astronômico. Int. J. Arch. Herit. 2021, 15, 1145–1169. [Google Scholar] [CrossRef]
- da Costa, V.S.; da Silveira, A.M.; Torres, A.D.S. Evaluation of Degradation State of Historic Building Facades through Qualitative and Quantitative Indicators: Case Study in Pelotas, Brazil. Int. J. Arch. Herit. 2022, 16, 1642–1665. [Google Scholar] [CrossRef]
- Bauer, E.; De Souza, J.S.; Piazzarollo, C.B. Application of the degradation measurement method in the study of facade service life. In Building Pathology, Durability and Service Life; Springer: Cham, Switzerland, 2020; pp. 105–119. [Google Scholar]
- Dubreuil, V.; Fante, K.P.; Planchon, O.; Sant’anna Neto, J.L. The types of annual climates in Brazil: An application of the classification of Koppen from 1961 to 2015. Confins-revue Franco-bresilienne De Geographie-revista Franco-brasileira De Geografia 2018, 23, 23. [Google Scholar] [CrossRef]
- Bauer, E.; Piazzarollo, C.B.; de Souza, J.S.; dos Santos, D.G. Relative importance of pathologies in the severity of facade degradation. J. Build. Pathol. Rehabil. 2020, 5, 7. [Google Scholar] [CrossRef]
- Ruggiero, G.; Marmo, R.; Nicolella, M. A Methodological Approach for Assessing the Safety of Historic Buildings’ Façades. Sustainability 2021, 13, 2812. [Google Scholar] [CrossRef]
- da Costa, V.S.; Torres, A.D.S. Diagnosis of degradation state of the historic building facade through qualitative and quantitative indicators: Case study of the Former School of Agronomy Eliseu Maciel. Int. J. Build. Pathol. Adapt. 2021. [Google Scholar] [CrossRef]
- Ibrahim, P.O.; Sternberg, H.; Samaila-Ija, H.A.; Adgidzi, D.; Nwadialor, I.J. Modelling topo-bathymetric surface using a triangulation irregular network (TIN) of Tunga Dam in Nigeria. Appl. Geomatics 2022, 15, 281–293. [Google Scholar] [CrossRef]
- Wetzel, A.; Zurbriggen, R.; Herwegh, M.; Greminger, A.; Kaufmann, J. Long-term study on failure mechanisms of exterior applied tilings. Constr. Build. Mater. 2012, 37, 335–348. [Google Scholar] [CrossRef]
- Zurbriggen, R.; Herwegh, M. Daily and seasonal thermal stresses in tilings: A field survey combined with numeric modeling. Mater. Struct. 2016, 49, 1917–1933. [Google Scholar] [CrossRef]
- Yang, J.; Wang, Z.-H.; Kaloush, K.E. Environmental impacts of reflective materials: Is high albedo a ‘silver bullet’ for mitigating urban heat island? Renew. Sustain. Energy Rev. 2015, 47, 830–843. [Google Scholar] [CrossRef]
- Yiu, C.; Ho, D.; Lo, S.M. Weathering effects on external wall tiling systems. Constr. Build. Mater. 2007, 21, 594–600. [Google Scholar] [CrossRef]
- Wetzel, A.; Herwegh, M.; Zurbriggen, R.; Winnefeld, F. Influence of shrinkage and water transport mechanisms on microstructure and crack formation of tile adhesive mortars. Cem. Concr. Res. 2012, 42, 39–50. [Google Scholar] [CrossRef]
- Herwegh, M.; Zurbriggen, R.; Mettier, R.; Winnefeld, F.; Kaufmann, J.; Wetzel, A. Hygrical shrinkage stresses in tiling systems: Numerical modeling combined with field studies. Cem. Concr. Compos. 2015, 55, 1–10. [Google Scholar] [CrossRef]
- Blocken, B.; Dezsö, G.; van Beeck, J.; Carmeliet, J. Comparison of calculation models for wind-driven rain deposition on building facades. Atmospheric Environ. 2010, 44, 1714–1725. [Google Scholar] [CrossRef]
- Bordalo, R.; de Brito, J.; Gaspar, P.L.; Silva, A. Service life prediction modelling of adhesive ceramic tiling systems. Build. Res. Inf. 2011, 39, 66–78. [Google Scholar] [CrossRef]
- Costa, J.; Paulo, P.V.; Branco, F.A.; de Brito, J. Modeling Evolution of Stains Caused by Collection of Dirt in Old Building Facades. J. Perform. Constr. Facil. 2014, 28, 264–271. [Google Scholar] [CrossRef]
- Chwast, J.; Todorović, J.; Janssen, H.; Elsen, J. Gypsum efflorescence on clay brick masonry: Field survey and literature study. Constr. Build. Mater. 2015, 85, 57–64. [Google Scholar] [CrossRef]
- Pereira, C.; de Brito, J.; Silvestre, J.D. Contribution of humidity to the degradation of façade claddings in current buildings. Eng. Fail. Anal. 2018, 90, 103–115. [Google Scholar] [CrossRef]
Figure 1.
Most common defects in ceramic tile systems: (a) ceramic detachment; (b) cracking; (c) grout failure; and (d) efflorescence.
Figure 1.
Most common defects in ceramic tile systems: (a) ceramic detachment; (b) cracking; (c) grout failure; and (d) efflorescence.

Figure 2.
Regions adopted in this study.

Figure 3.
Details of the sample definition: (a) obtaining the digital image, (b) orthogonalisation, (c) sketch, and (d) quantification with mesh overlay (adapted from Bauer et al. [38]).
Figure 3.
Details of the sample definition: (a) obtaining the digital image, (b) orthogonalisation, (c) sketch, and (d) quantification with mesh overlay (adapted from Bauer et al. [38]).

Figure 4.
Research stages.

Figure 5.
Prototype façade and subdivision by regions.

Figure 6.
Occurrence of detachment in ceramic claddings by region and by degradation level.

Figure 7.
Standard map of the sensitivity of ceramic claddings to detachment.

Figure 8.
Occurrence of cracking in ceramic claddings by region and by degradation level.

Figure 9.
Standard map of the sensitivity of ceramic claddings to cracking.

Figure 10.
Occurrence of grout failure in ceramic claddings by region and by degradation level.

Figure 11.
Standard map of the sensitivity of ceramic claddings to grout failure.

Figure 12.
Occurrence of efflorescence in ceramic claddings by region and by degradation level.

Figure 13.
Standard map of the sensitivity of ceramic claddings to efflorescence.


Table 1.
Defects condition level (adapted by Bauer et al. [11]).
Table 1.
Defects condition level (adapted by Bauer et al. [11]).
| Condition Level ( ) | Affected Area (%) | ||||
|---|---|---|---|---|---|
| Ceramic Detachment | Cracking | Grout Failure | Efflorescence | ||
| 1 | Good condition (acceptable) | No degradation | No degradation | <10% | <10% |
| 2 | One-off degradation condition | <5% | <20% | 10% < < 30% | 10% < < 30% |
| 3 | Service limit state condition | 5% < < 30% | 20% < <50% | >30% | >30% |
| 4 | Ultimate limit state condition | >30% | >50% | Condition level 3 | Condition level 3 |
Table 2.
Ceramic cladding sensitivity to degradation for each defect and by region.
| Sensibility | Detachment | Cracking | Grout Failure | Efflorescence |
|---|---|---|---|---|
| Continuous walls | 0.654 | 0.105 | 0.012 | 0.0035 |
| Openings | 0.390 | 0.038 | 0.016 | 0.0003 |
| Balconies | 0.071 | 0.010 | 0.002 | 0.00003 |
| Corners and borders | 0.634 | 0.121 | 0.017 | 0.0026 |
| Transition between floors | 0.694 | 0.140 | 0.020 | 0.0027 |
| Top | 0.559 | 0.178 | 0.018 | 0.0009 |
Disclaimer/Publisher’s Note: The statements, opinions and data contained in all publications are solely those of the individual author(s) and contributor(s) and not of MDPI and/or the editor(s). MDPI and/or the editor(s) disclaim responsibility for any injury to people or property resulting from any ideas, methods, instructions or products referred to in the content. |
© 2023 by the authors. Licensee MDPI, Basel, Switzerland. This article is an open access article distributed under the terms and conditions of the Creative Commons Attribution (CC BY) license (https://creativecommons.org/licenses/by/4.0/).
Share and Cite
MDPI and ACS Style
Castro, W.; Souza, J.; Gaspar, P.; Silva, A. Mapping the Risk of Occurrence of Defects in Façades with Ceramic Claddings. Buildings 2023, 13, 1209. https://0-doi-org.brum.beds.ac.uk/10.3390/buildings13051209
AMA Style
Castro W, Souza J, Gaspar P, Silva A. Mapping the Risk of Occurrence of Defects in Façades with Ceramic Claddings. Buildings. 2023; 13(5):1209. https://0-doi-org.brum.beds.ac.uk/10.3390/buildings13051209
Chicago/Turabian StyleCastro, Wilamy, Jéssica Souza, Pedro Gaspar, and Ana Silva. 2023. "Mapping the Risk of Occurrence of Defects in Façades with Ceramic Claddings" Buildings 13, no. 5: 1209. https://0-doi-org.brum.beds.ac.uk/10.3390/buildings13051209
Note that from the first issue of 2016, this journal uses article numbers instead of page numbers. See further details here.