
Design Efficacy and Exploration Behavior of Student Architect-Engineer Design Teams in Shared Parametric Environments

Department of Architectural Engineering, The Pennsylvania State University, 104 Engineering Unit A, University Park, State College, PA 16802, USA
*
Author to whom correspondence should be addressed.
Buildings 2023, 13(5), 1296; https://0-doi-org.brum.beds.ac.uk/10.3390/buildings13051296
Submission received: 12 April 2023
/
Revised: 9 May 2023
/
Accepted: 13 May 2023
/
Published: 16 May 2023
(This article belongs to the Special Issue Architectural Design Supported by Information Technology)
Abstract
:Increasingly, architects and building engineers use parametric modeling programs to explore design solutions as professionals and as students. However, little is known about their combined efficacy and exploration in these tools when working in mixed design teams. While disciplinarily diverse teams of designers have been shown to develop more creative design solutions, this occurs primarily when there is a conducive environment and a shared understanding of design goals. Because architects and engineers are traditionally taught to use different tools and processes to address their professional goals, indicators of students’ combined efficacy in parametric tools are unclear. In response, this research uses a conceptual design experiment to study aspects of design efficacy and the exploration behavior of student architect-architect, engineer-engineer, and architect-engineer pairs within a live parametric modeling tool. The dimensions of their collaborative exploration within the tool were recorded, and their success at achieving the desired criteria was rated by professionals. Noticeable performance differences between team types were expected, including that the mixed design teams would better balance all goals and that the homogenous teams would better address their own disciplinary criteria. However, this was not the case when working in a shared, multidisciplinary digital environment, as the teams performed similarly despite having different member composition. We discuss several factors, such as the effect of digital design feedback and the still-developing student design process, which may have relationships with the design efficacy of the teams when using the study’s parametric modeling tool. Future research can further investigate the effect of mutually approachable working environments on design team performance.
1. Introduction
As the building needs of our society grow in scale and dimension, design objectives for the built environment become more entangled, requiring architects and building engineers to collaborate wholistically on design solutions. Their goals are rarely independent of each other’s influence, and major redesigns late in design phases due to incohesive decisions can cost time, money, and the integrity of the design team. When developing comprehensive proposals during the conceptual design phase, computational tools such as parametric modeling can allow designers to rapidly iterate across possibilities and consider qualitative and quantitative objectives. Rather than rebuilding a model for each design variation, parametric models enable designers to easily explore different solutions by changing variables that control objectives in a design problem. However, architects and building engineers have historically followed different design processes to achieve their goals [1,2]. Yet the exact nature of these differences are not fully agreed upon and may be changing with technology and evolving disciplines [3,4,5,6]. For example, researchers have proposed that engineers assume problems can be well-defined, start with problem-analysis, and emphasize the “vertical” dimension (linear, procedural) of systems engineering, while architects assume partially defined problems and approach them with an opportunistic, argumentative process that emphasizes the horizontal dimension (iterative, problem-solving) [1]. However, there is diversity among engineering disciplines in their exact approach, and there has been more recent emphasis on iterative problem-solving for engineering problems, potentially breaking this dichotomy [7,8].
Despite this ambiguity, many researchers still observe differences specific to architects and building engineers [6,9,10,11], and different approaches may hinder their combined efficacy when working in parametric tools. Stemming from their disciplinary training as students, they may even approach design differently based on the professional identity of their collaborators [12]. Research has shown that diversity in teams can lead to more creative solutions, but an inconducive design environment and lack of shared understanding can impede design performance [13]. At the same time, designers increasingly use digital forms of communication to collaborate, such as video meetings with screensharing for quicker feedback about design performance. When working in remote, parametric environments, it is unclear how students’ disciplinary identity may predict their design efficacy and behavior when collaborating with designers of similar or different educational backgrounds.
1.1. Parametric Models as Design Tools
Parametric 3D-modeling tools allow designers to readily explore design options by adjusting model variables and reviewing geometric and performance feedback, which can enable quick, multi-disciplinary decision making. These tools can potentially improve on traditionally separate design and analysis software, which may not most optimally address the range of complex requirements [14]. For example, architects rely heavily on sketching [15] and digital geometry tools [16], while building engineers use discipline-specific analysis programs such as SAP2000 and ETABs for structural design or EnergyPlus for energy modeling. While previous research has shown 3D digital modeling to be a less conducive environment for collaboration compared to sketching [17], this was due to the tedious nature of digital model building and may not apply to all forms of digital design exploration. An advantage to computational tools is that they enable efficient design responses and allow for more avenues of communication between the professions [18].
Specifically useful for early design collaboration, parametric 3D-modeling tools allow designers to quickly explore a range of qualitative design options and receive multi-dimensional feedback about quantitative design performance [19,20]. Such an environment allows rapid exploration, albeit with more constraints, but also provides more information about the design than a sketch. These tools can improve design performance [21], and previous research has supported that working in parametric models is a viable environment for design decision making [22,23,24,25,26,27]. Parametric design tools can be part of an equally accessible environment for different professions that provides quick, simultaneous feedback about both geometry and performance [28,29,30]. Building designers increasingly use parametric design, thinking to explore solutions in a variety of applications, such as building forms [31], structural design [28], building energy [29], and urban development [32]. Some established examples of parametric modelling in practice include the Beyond Bending pavilion at the 2016 Venice Biennale [33] and the iterative structural, energy, or daylighting analyses used by firms such as ARUP [34] and Foster + Partners [35].
In addition, computational design tools can be combined with digital platforms for collaboration. Due to shifts in the nature of work, expedited by the COVID-19 pandemic in 2020, online video meetings are increasingly used by the AEC community to design real buildings [36] and can be beneficial to conceptual design development [37]. As remote work becomes more normalized, digital mediums are increasingly used as the context for real design conversations in both engineering and architecture [36,38]. As an alternative to screen sharing and sketching in remote meeting platforms, shared online parametric models and their corresponding visualizations can provide an additional form of feedback. While dynamics within design teams in digital technologies have been studied before [39,40,41], much of the work does not account for the context of parametric design environments, nor do they directly connect team efficacy based on team composition and defined design criteria. Understanding disciplinary identity when using these tools may influence how designers approach collaboration on computational platforms, resulting in differences of combined team design efficacy.
1.2. Collaborative Design Processes of Architect-Engineer Teams
Collaboration between diverse teams has been studied, characterized, and documented [13,42,43,44], but there is still much to understand about the specific interactions of engineers and architects, particularly when attempting to evaluate indicators of design efficacy. To best include the efforts of both architects and engineers, whose performance could be measured by different metrics, we follow Marriam-Webster dictionary’s definition of efficacy to be “the power to produce an effect”. Specific to buildings, design efficacy can be used to describe the successful achievement of desired outcomes such as cost, sustainability, efficiency, and discipline-specific goals such as spatial needs and structural requirements. Previously, engineering efficacy has been measured by how thoroughly engineers are able to address specified criteria [45] and by measurable, outcome-based metrics [46,47]. Conversely, efficacy in architecture is harder to identify, as architectural goals can be more qualitative or experiential. Methods such as the Consensual Assessment Technique (CAT) method [48] have been used to evaluate design quality when criteria are subjective and less measurable, such as in graphic design [49].
Also significant is that building designers rarely work alone and must consider both qualitative and quantitative goals, which can obscure representations of their design process. While diversity in design teams stimulates creativity, with heterogeneous teams benefitting from a combination of expert perspectives, improved team performance most readily occurs if there is shared vocabulary and a conducive design environment [13]. The team should also share similar conceptual cognitive structures [50], which may differ by profession. While diverse teams of engineers and architects work towards the same end goal of a building, some acknowledge their different design processes and have shown they use separate design tools [51]. However, as argued earlier because it is a main motivator of this paper, the development of new design models and the context of digital tools makes the distinctions of their processes less clear.
No model of design process has perfectly captured the activities of a whole profession [3], and the integration of digital tools have further confounded understanding of design process. Oxman [4] recognized that while some concepts reoccur in digital tools, design methods can vary depending on the media used. Design process models in parametric tools of architects have been illustrated by Stals et al. [26] as the amplified exploration of ideas compared to processes supported by traditional tools. Oxman [27] considered parametric design as a shift in understanding of design thinking, less bound by a representative model. However, these studies on parametric tools did not consider the differences between architects’ and engineers’ exploration. Increasingly, architects and engineers work in these tools together; therefore, studying their collaborative efforts is valuable to better understand and eventually incentivize effective teamwork given potential disciplinary barriers. Such challenges in design collaboration may stem from designers’ education where they begin to identify with a profession [52]. Understanding the behaviors of student populations when using these tools can inform how they may collaborate in parametric environments in their future careers.
1.3. Decision Processes of Student Designers
While many assert that architects and engineers follow different design processes, there is evidence to support that student designers may not yet possess the cognitive processes that are emblematic to their profession. Kavakli and Gero [53] found that when comparing series of cognitive actions in design, students followed a greater range of sequences of cognitive processes compared to experts, who employed a smaller range of sequence variation and were more efficient in their cognitive actions. Similarly, Ahmed et al. [54] found that students tend to follow “trial and error” processes and do not have as refined design strategies as professionals, who were more systematic. However, these studies do not account for the influence of computational decision making on design. Abdelmohsen and Do [55] found that novice architect designers performed prolonged processes to achieve the same goal as experts when responding to both sketching and parametric modeling tasks. In their study though, students worked independently and did not account for team collaboration in parametric tools.
As students are still developing as design thinkers in their fields, it is important to consider how they may collaborate with teammates who are trained in a different discipline. Architecture and engineering students often receive divergent instruction on how to address design goals when working in digital tools. While engineers have traditionally followed problem-solving methods with an emphasis on “right” answers [56], this has been challenged recently as instructors incorporate more project-based learning [57]. There is also increased discussion of preparing engineers for cross-disciplinary design thinking [58,59,60]. Conversely, architectural education emphasizes spatial thinking with 3D modeling, and incorporates digital forms of learning though emerging tools [15], parametric models [61], optioneering [62], and collaborative methods [63]. While distinctions in design education may become harder to define as both disciplines evolve, many still note disciplinary divides between both architecture and engineering education and practice [11]. Both types of expertise also tend to play defined roles in practice. In traditional building design procedures, architects may finalize many characteristics of a building before consulting with their engineers, limiting the autonomy of engineers to positively influence the design. Researchers from both professions suggest that early integration of engineers in the building design process can improve design performance and efficiency [64,65], but early integration has its challenges, as the professions have developed different disciplinary cultures [66]. Overcoming these issues can be considered in their education for multi-disciplinary thinkers, but we need to first understand how they behave in mixed teams working in a parametric modeling environment.
1.4. Research Questions and Hypotheses
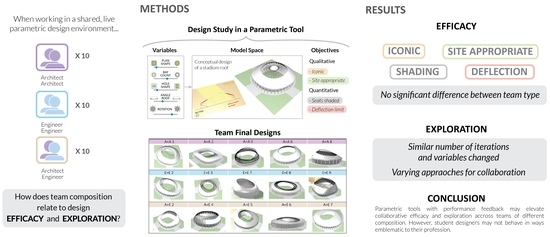
In response, this research asks two questions about student architect and engineer designers: (1) How does team composition relate to design efficacy in a shared, live parametric design environment? And (2) How does team composition relate to design exploration in this environment? To answer these questions, a study was developed that compared pairs of two architecture students (A+A), two engineering students (E+E), and one of each discipline (A+E) as they jointly responded digitally to a conceptual design task with two engineering and two architectural criteria. Thirty pairs of designers, with ten of each team type, worked in an equally accessible online parametric design space which allowed them to explore a pre-built model using editable sliders. The model provided considerable geometric diversity and real-time engineering feedback, addressing the simulated performance needs of both professions and reducing barriers in aptitude of disciplinary tool familiarity. The teams’ ability to address the four criteria, as assessed by professional evaluators, was used to measure the efficacy of the final designs. Audio, video, and tool-use recordings of the design sessions captured information about the teams’ collaborative efforts and design exploration.
It was hypothesized that the diverse teams (A+E) would be more effective at addressing all the design criteria, and that design strategies would vary by team type. This hypothesis was based on previous literature describing the environment-dependent benefits of diverse teams. However, we noted the potential for no significant differences between team performance, possibly indicating unexpected and equalizing influences of the parametric tool on design processes. We also considered that disciplinary differences might not yet emerge in mutually approachable environments for student designers who are not yet experts in their field. Additionally, as this study was conducted through a digital video interface, it speaks to the potential screensharing strategies present in remote, collaborative working environments. Understanding how student architects and engineers cooperate in digital, parametric platforms can help discern effective team strategies in emerging design environments, inform educators about the preparedness of future designers to think multi-objectively, and reveal unexpected influences of parametric tools on conceptual design processes.
2. Materials and Methods
To understand how diverse pairs of student engineers and architects perform compared to same-wise pairs, this research relied on two digital design tools that are increasingly used in practice: a readily approachable parametric modeling platform, and remote video meetings to host collaborative design sessions. While parametric design can occur at various stages of building development and can be applied to many scales of design detail, this work focused on the conceptual design phase of a stadium roof, which required both architectural and engineering input, and was an approachable task for student designers. Although naturally occurring design processes can manifest in many environments, this work focused on parametric models as design tools to capture evidence of effective behavior specifically in this medium.
The teams worked remotely In an online parametric tool, not native to either discipline, which provided visual and numeric feedback. The intent was to facilitate an environment that was not directly familiar and thus did not favor the efforts of either profession. Participants performed the design task together in an online video meeting, which was able to record information about their exploration. In addition, the teams submitted screenshots of their final design and a design statement, which four professional designers used to evaluate team efficacy in addressing the design task objectives. Figure 1 illustrates the study’s protocol with an example of the design tool interface.
2.1. Design Session Procedure and Participants
The study was conducted through recorded online video meetings, and the sessions lasted approximately one hour. In the first 20 min, the teams were briefed on the study tools, given the design task, and allowed 5 min to become familiar with the materials before developing a design with their assigned partner. The teams were then allowed 30–35 min to work on their design and submit deliverables from the design task.
Prior to running the study and collecting data, the interface and protocol were piloted on 3 teams to verify the clarity of the design task, usability of the tool, and accuracy of the data collection methods. The sample participants were either members of the research team who did not participate in the script development, or graduate students in an architectural engineering program with at least 1 year of experience in 3D parametric modeling. The sample participants were able to finish the task in the allotted time. Upon completing the test design session, these sample participants provided feedback about the study’s procedures, which were then further refined. The sample data was used to ensure the reliability of the data collection, processing, and analysis approaches.
This study was approved by the researchers’ Institutional Review Board. The participants were structures-focused engineering or architecture students from one of two large, public U.S. universities. Participation was limited to 4th or 5th year undergraduates with AEC internship experience for engineers and National Architecture Accrediting Board (NAAB) accredited structures courses for architects, or students of either discipline at the graduate level. Participants were paired based on disciplinary major and availability. The research questions of the study were not revealed to the participants so to not influence their performance. While the moderator was available to answer questions, they had minimal interaction with the teams during design and did not prompt any behaviors.
Although the students may experience more elaborate design challenges over longer periods of time through their coursework or in their future professional practice, replicating extensive, multi-year design processes is beyond the scope of this paper’s research questions. It has been established that design study protocols must consider limitations of tools and resources to collect clear, dependable data [67]. To reduce cognitive fatigue and minimize uncontrollable external influences on team behavior, this research used a concise design task and focused metrics to evaluate the team processes.
2.2. Design Task Criteria
The conceptual design task asked participants to develop the geometry of an Olympic stadium roof for a fictional site plan in a tropical climate. There is precedent for stadium roof design as a good sample project to judge designer performance in parametric modeling [34]. The design statement provided to the designers contained four criteria that used as design goals and used to assess the efficacy of the teams. Two of the criteria were qualitative requirements that aligned with architectural values: that the design be iconic and site appropriate. The other two quantitative requirements aligned with engineering goals: that the roof shade a certain percentage of seats during noon on the summer solstice and not exceed a maximum deflection limit, which the participants were required to calculate. These goals were considered accessible based on participants’ level of study and degree requirements. For the final deliverables of their proposed conceptual designs, teams were asked to submit 3–6 screenshots and a 5–8 sentence design statement that discussed how their design addressed the prompt. Additional detail of the design task and requirements can be found in Appendix A.
2.3. Design Environment Details
The study’s primary tool consisted of an online parametric stadium roof model that the designers could edit by changing ten variable sliders. The tool was intended to be neutral to not favor the capabilities of one profession over the other, and novel to the designers, in that no participant had used the exact interface before. While the parametric model would limit the detailed development of the project, this design task asks the participants to focus on developing the roof design in the late-conceptual design phase, when aspects such as the structural systems and likely materials would have already been decided.
The model was constructed in the parametric modeling program Grasshopper and uploaded to Shapediver [68], an online file hosting platform that allows external users to change model variables and obtain design feedback without editing the base file. Shapediver and similar cloud-based platforms have been gaining popularity in several fields due to their ease of access from a browser and utility in developing 3D model solutions. The Shapediver API interface was used to embed the model in a custom website built for the study that tracked user click and design data, such as when variables were changed. Before designing, participants were shown how to use the tool and they independently accessed the website during the video meeting. They were briefed on how to share their screens, but screen sharing was not required nor explicitly encouraged. Figure 2 shows the structure of the tool’s files and examples of three screensharing strategies that may be used by the design teams, such as one person sharing their screen and the other watching for the whole session, one person sharing their screen while the other person keeps working, or sharing screens back and forth throughout the session.
The tool’s ten editable sliders mostly modified geometric qualities of the stadium and the variables all impacted the four design criteria in some capacity. Authentic to a design challenge in practice, the base model was built such that no “best” solution existed. For example, a larger roof area improved shading, but also increased deflection, which was undesirable. In the model, the quantitative criteria were achievable for a range of visual solutions but could not be met under all variable settings. Providing ten variables allowed designers of both types to consider combinations of solutions and use different approaches to explore the design space. The variables were mostly continuous, which gave participants the ability to directly manipulate the design. Collectively across all variables, there were over 5 trillion possible solutions. While the parametric model would limit the detailed development of the project, this design task asks the participants to focus on developing the roof design in the late-conceptual design phase, when some aspects such as the structural systems and likely materials would have already been decided. In addition, the tool used Karamba3D [69] to perform live deflection calculations of the roof as the users changed the variables. Details about the tool’s variables and internal calculations of deflection and seat shading can be found in Appendix B.
2.4. Methods for Evaluationg Team Efficacy and Exploration
To answer the study’s research questions, three streams of data were evaluated: final design efficacy based on professionals’ evaluations, exploration behavior based on engagement with the tool, and team collaboration strategies based on how they chose to work remotely in the video meeting.
2.4.1. Assessing Team Efficacy
Following the design task, team efficacy was assessed by four professionals (one licensed engineer, one engineering professor, one licensed architect, and one architecture professor) for how well the teams addressed the criteria in their visual submissions and design statements. All reviewers held professional degrees in their field and were located at schools or firms in the southwestern US, northeastern US, or western Europe. The licensed professionals had at least 8 years of experience in practice and the professors taught for at least 7 years. Their evaluation followed the Consensual Assessment Technique method [48], which uses professionals to evaluate design quality, responding to questions about criteria performance using a Likert scale. The CAT method is often used in evaluating design ideas that rely on qualitative evaluation, but it has been used in engineering applications as well [70]. The professional evaluators were asked “how well did the project from team X address criterion Y of the design task”. They reported their opinions on a five-item scale including the responses “not at all”, “somewhat well”, “moderately well”, very well”, or “extremely well”. The professionals completed their assessments individually and were not told which team type they were evaluating. To mitigate evaluation fatigue, each professional evaluated only 12 designs (four of each team type). To verify the agreeance between the evaluators, they evaluated six of the same projects and six different projects. For the same six projects that they evaluated, an intraclass correlation coefficient was calculated for all criteria.
2.4.2. Assessing Team Collaborative Design Exploration
In addition to efficacy, design exploration was documented by measuring the teams’ interaction with the design tool using click data and by observing how the teams collaborated in the shared work environment. As the professions increasingly rely on online forms of design cooperation, considering the student participants’ behavior when working in the digital environment can inform how the professions use these tools when designing.
To capture the designers’ exploration of the tool, we included a tracking mechanism in the design website that recorded variable changes and corresponding iterations during the session. Comparing differences in number of variables explored and iterations tested can suggest the relative breadth of the design exploration. Yu [25] observed that parametric design has two kinds of cognitive processes: “design knowledge”, which relies on a designer’s knowledge for their decisions, and “rule algorithm”, in which the designer’s decisions respond to the rules of the model. Using more variables and creating more iterations can reflect the application of both cognitive processes. Although the teams in our study did not exhaustively engage all the variables, they mostly adjusted all variables at least once. In the time allowance of the study, this reflected enough dimensions for authentic engagement, but not too many variables for the designers to consider. The numbers of iterations were compared to the efficacy ratings for each criterion, since more iteration may relate to improved design performance. Significant iteration, though, might align with an architect’s process, whereas an engineering process may lead more directly to a solution.
2.4.3. Assessing Team Screensharing
The method by which the teams chose to collaborate in their visual efforts was also noted. Although previous research has considered collaboration through digital file exchange [71], it did not account for active environment engagement. Alternatively, virtual reality tools can allow two users to move around in the same environment with an integrated video platform, but virtual reality is not yet pervasive in architecture and engineering firms for collaborative design environments. In the online environment used in this study, participants were allowed to choose how to work in the digital modeling environment. They could develop their solutions through various screensharing tactics, which were observed by team type. The researchers noted which partner shared screens, how long they shared, and if they alternated screensharing. This empirical approach to describing team collaboration styles allowed the researchers to note new behaviors as they occurred. If the majority of a team type’s pairs followed the same screensharing method to develop their models, it may speak to a likeness in collaborative process, but if all the pairs behave differently, this would further confound the disciplinary process’s identities when working in video shared, parametric design environments.
3. Results
A total of 30 designs were created, with 10 designs from each team type. Figure 3 shows screenshots of 18 of the 30 projects. Initial visual assessment suggests a range of solutions with the most visually noticeable characteristics being plan shape, roof angle, and roof coverage. However, the professionals’ assessments provide more critical examination of the teams’ efficacy, which provided a baseline by which to compare the teams’ collaboration and design space exploration.
3.1. Professional Assessment of Team Efficacy
To determine team efficacy, four professionals evaluated the projects for how well the design pairs addressed the four criteria. Figure 4 shows the professional’s evaluations as box and whisker plots of the team type efficacy for each objective. The A+A teams had higher average effectiveness than the other teams at meeting all four criteria, but in “site” and “deflection”, at least one of the A+A teams was judged to have not addressed the criteria at all. The A+E teams had the lowest average effectiveness in “iconic”, “shading”, and “deflection”, with the largest range in performance. While the E+E teams were not more effective than the other team types at any criteria, all E+E teams were at least somewhat effective at addressing the four criteria.
A Kruskal–Wallis test was performed for each criterion to determine if there were any statistical differences between team types at a p = 0.05 level of significance. No team type was significantly different in the efficacy of achieving any of the four criteria, with deflection having the lowest p-value of 0.334. Since five of the twelve team type criteria had evaluations scoring from 0 to 1, the outlying values in the large range may have overly influenced the data, reducing the data’s statistical significance. To test if the large ranges had a negative impact on statistical significance, the highest and lowest evaluation value for each team type in each criterion were removed, and the Kruskal–Wallis tests were run again. While the p-values for each criterion in the Kruskal–Wallis test were closer to a significance level of 0.05, they were still not significant. The p-values from these tests are shown in Table 1.
Based on their ratings, an intraclass correlation coefficient was calculated across all the evaluators for all criteria. It was found to be 0.719, which meets an acceptable level of agreeability. While coefficients between 0.900 and 1.000 are considered in very high agreeance, and those above 0.7 are considered acceptably high, interpretation of coefficients are conditional to each application. In this study, because the assessments are both qualitative and quantitative, judged by four raters with unique expertise, and use an evaluation scale with five options, an agreeance of greater than 90% would be unexpected. The CAT method for creativity evaluation, which often uses ICC to consider evaluator agreeance, assumes that the professionals all have the same area of expertise. In contrast, this study uses both architects and engineers to evaluate the projects, who have their own areas of expertise, and still meets a level of agreeance above 0.7 with an ICC of 0.719.
3.2. Characteristics in Collaborative Exploration
The teams’ exploration of the design space was measured by their engagement with the design tool and by their behavior when collaborating in the online environment.
3.2.1. Characteristics in Collaborative Exploration
Figure 5 shows the number of iterations and average variables changed for each team type. No team type explored a statistically greater number of iterations than the other team types nor changed a greater number of variables, based on a Kruskal–Wallis test at p = 0.05 level of significance. However, comparing iterations to individual criteria may yield more informative results.
When considering the relationship between the number of iterations created by each team type and the efficacy performance ratings for each criterion, a pattern emerges. Figure 6 shows the plots of criteria ratings vs. iterations for each criterion and their fitted linear regression line. The figure also provides the slope for each linear regression equation and the p-value at a 0.05 level of significance based on a simple linear regression analysis for statistical significance between the variables. For the test, the null hypothesis is that the slope is 0 and the alternative hypothesis is that the slope is not 0. The p-values of the regression analyses are greater than 0.05; therefore, there is not enough evidence to say that iterations have a linear statistical relationship to criteria efficacy. However, the signs of the slopes for their relationship are consistent in each criterion. While more iterations relate positively to greater criteria efficacy for the E+E and A+E teams, the opposite is true for the A+A teams, for which the relationship is negative or negligible.
3.2.2. Screen Sharing the Collaborative Environment
When working collaboratively in the design environment, we noted several patterns on how pairs explored the model while using the remote design tools. Figure 7 shows a sample of the different screensharing strategies and the number of teams for each team type that followed the strategies. The most common method for sharing ideas, labeled Strategy 1, was when one team member shared their screen within 5 min of starting their session and moved in the model while the other designer watched and made suggestions. This strategy was followed by 5 A+A teams, 7 E+E teams, and 4 A+E teams. Strategy 2 was when one person shared, but their partner continued working on their own model. Strategy 3 was when each teammate shared their screen at least once. In some cases, teams shared their screen multiple times. Strategy 4 represents other methods. For example, team AE10 never screenshared, but verbally updated each other about their variable settings when they found solutions that they liked. Team AA8 worked independently and only shared their design towards the end of the session. A third team, AE4, chose to screenshare both designers’ screens while allowing both designers to control the mouse. There was no screensharing method consistently used by a team type.
4. Discussion
In summary, we hypothesized that when working in a parametric, digital modelling environment, diverse teams would show significantly better performance when A+E, A+A, and E+E pairs were given the same design task, but this finding was not supported by the data. It was also expected that explicit behaviors based on team type would become evident in efficacy or design space exploration. However, this was not the case. It was surprising that the teams performed similarly and did not show greater proficiency at addressing their own disciplinary design criteria. While some differences between team types were noted, few rose to the level of statistical significance at traditional confidence levels. Further discussion for each research question is given below:
RQ 1: How does team composition relate to design efficacy in a shared, live parametric design environment? Diverse pairs of building designers were not significantly more effective at addressing the design criteria than same-wise pairs, despite what is predicted by existing literature. Although the provided parametric design environment may not have allowed for enough design diversity between team types, it is possible that for the student designers, live feedback from the parametric tool may have benefitted the efforts of the teams in absence of other disciplines. In a traditional practice workflow, the professions serve their own roles and provide disciplinary expertise, and there is a lag in communication while they perform their respective responsibilities in sequence. The shared modeling space with multidisciplinary feedback may have partially performed the jobs of both architects and engineers at the resolution of early-stage design. However, it is also possible that student designers are not yet proficient in their field and did not perform in a way that is emblematic to their profession and therefore did not show differences in performance. In addition, Lee et al. [50] reports that, regarding creativity, simply including designers with different backgrounds does not guarantee improved results if the designers do not share mental models for problem solving. Future research should consider whether providing live, visual, or quantitative feedback, alongside geometric flexibility, can help serve roles of both professions and increase the ability of homogeneous pairs to manage multidisciplinary criteria.
RQ 2: How does team composition relate to design exploration in this environment? Although no team type explored the model significantly more based on the number of iterations and number of variables changed, the increase of iterations compared to team type efficacy does suggest some differences between groups. While greater iterations related to improved design efficacy ratings for the E+E and A+E teams, the same was not true for A+A teams. Since iterative processes are associated with architects [42], an increase in iterations should have, theoretically, improved the design performance by all teams, especially the A+A teams. Furthermore, no team type consistently followed the same strategy for sharing screens to develop their designs. Screensharing in collaboration is not specific to a particular profession and may not differ by disciplinary background, but it is important in effective student education [72,73]. The students in this study may be better at working remotely through screensharing due to their remote experiences during the COVID-19 pandemic. In addition, the relationship between team type characteristics and team efficacy is inconclusive, suggesting that diversity in engineering and architect teams does not guarantee improved results when considered in the context of a collaborative, parametric environment.
A summary of what was learned regarding each research question is provided in Figure 8. Overall, the study’s metrics may suggest the presence of an equalizing influence of parametric tools on efficacy and exploration, or that student designers do not have differing behavior between professions in the provided design environment. Parametric tools have been shown to positively support design performance [74], and it could be that the mutually approachable environment influenced the design process. However, impacts on design team performance can be generally hard to discern, as previous research on construction design teams have also shown inconclusive results [75]. Although further research is needed to understand the impact of multi-disciplinary tools on mixed disciplinary teams, the lack of distinct differences presented in this paper provides a baseline for assessing exploration and efficacy in the context of collaborative design.
Limitations
There are several limitations to the study. Despite its methodological advantages, using a pre-made parametric design space does not allow for exhaustive analysis of all possible conceptual design approaches for buildings. However, as McGrath [67] established, there are three goals in understanding and quantifying team group interaction: generalizing of evidence from a large population, precision of measurements, and realism of the simulation. This study conducted concise yet somewhat abstract design simulations to achieve precision of measurement across a reasonably large population, which sacrificed some aspects of realism of the design simulation. However, having fewer participants with rich data is reasonable for studying design to capture the subtlety and depth of the process, particularly in studies which follow protocol analysis methods [76] (p. 15).
McGrath also acknowledges that to evaluate the results of a team groups study, one should be critical of the methods and tools used that are specific to the study or profession. While this study uses one design challenge, in focusing on just the stadium roof, the designers were able to complete the task in the allotted time and respond to the disciplinary specific design goals using their respective knowledge. Other limitations could include perceived ambiguity in the design criteria, or the fact that the data collected for collaboration and exploration does not perfectly characterize those corresponding behaviors—there is some subjectivity in mapping between data collection and behavior for a specific design challenge. Nevertheless, the study relied on established methods for design evaluation and had clear protocols for data collection to determine statistical significance in the design teams’ different characteristics.
5. Conclusions
This paper presented the results of a design study that considered relationships between the efficacy and behavior of diverse and same-wise pairs of student engineer and architect designers. While it was expected that diverse teams would be more effective at addressing varied design criteria, a professional assessment of the designs did not suggest that any team type performed significantly better than the others. However, the lack of significant differences in design performance and behavior raises questions about the influence of the digital design environment on the design process—it is possible that an online digital modeling platform may have influenced design strategies to converge. Subtle differences between the A+A and E+E teams’ behavior suggest narratives relating to team type characteristics, but there are few notable distinctions. In applying these results to practice, it may be that parametric modeling tools can be helpful for designers of either architecture or engineering backgrounds to explore design spaces. Such approaches may not be useful for all professional firms or all design stages, but managers may consider opportunities afforded by parametric models, especially during conceptual design and other instances in which options are visually compared by multidisciplinary teams. Future work will consider how teams of professional engineers and architects may collaborate when working on the same design task in a more extensive design scenario. This will overcome limitations introduced by the reliance on the parametric design space. In addition, the methods used in this study could be applied to understanding the behaviors of larger building design teams over more extensive design sessions. As design tools evolve and design requirements continue to push construction boundaries, it is important to continually understand effective indicators of architect-engineer team performance.
Author Contributions
Conceptualization, S.B. and N.C.B.; methodology, S.B. and N.C.B.; software, S.B.; validation, S.B. and N.C.B.; formal analysis, S.B.; investigation, S.B.; resources, S.B.; data curation, S.B.; writing—original draft preparation, S.B.; writing—review and editing, S.B. and N.C.B.; visualization, S.B.; supervision, N.C.B.; project administration, N.C.B.; funding acquisition, S.B. All authors have read and agreed to the published version of the manuscript.
Funding
This research was funded by the U.S. Department of Education’s Graduate Assistance in Areas of National Need, grant number CFDA 84.200.
Data Availability Statement
The data presented in this study are available with limitations on request from the corresponding author and with accommodation from the International Review Board. The data are not publicly available due to the participant’s personal confidentiality.
Acknowledgments
The authors are thankful to Shapediver for their technical support and use of their platform during the creation of the online design study.
Conflicts of Interest
The authors declare no conflict of interest. The funders had no role in the design of the study; in the collection, analyses, or interpretation of data; in the writing of the manuscript; or in the decision to publish the results.
Appendix A
Figure A1 shows the site plan and the design task that was provided to the participants. The design task was provided in paragraph form with design criteria embedded so that the designers would need to identify the design goals by their own observation. Two of the criteria aligned with architectural values: that the design be iconic and site appropriate. The other two requirements aligned with engineering goals: that the roof shade 82% of seats during noon on the summer solstice and not exceed a maximum deflection limit of l/180. The shading goal was determined by inspecting existing stadiums for how many seats were shaded on average during the summer solstice. This threshold was also shown during model exploration and test sessions to approximate a percentage goal that was achievable under many variables’ settings to allow for design flexibility, but would challenge the participants to respond to the need for shade. A deflection of l/180 is a typical limit for several types of structures in building codes.
Figure A1.
(a) The site plan showing the approximate footprint of the stadium in a dashed red line with surrounding site context (b) and design task.
Figure A1.
(a) The site plan showing the approximate footprint of the stadium in a dashed red line with surrounding site context (b) and design task.

Appendix B
Figure A2 shows the names of the variables and graphic representations of what they change. All variables, except “truss depth”, could impact the overall visual appearance of the model. Meanwhile, the criteria to be appropriate on site was most affected by “plan shape”, “hole scale”, and “angle of roof”. For the quantitative criteria, “truss depth”, “hole scale”, “bay count”, and “roof height” directly impacted deflection, and the “cover size”, “hole angle”, “hole scale”, and “roof height” greatly impacted the percentage of seats shaded. Participants were provided with the Figure A2 graphic with the design task to help navigate the model’s variables.
The stadium roof model was developed in Grasshopper and used Karamba3D [69] to perform live deflection calculations of the roof as participants changed the variables. The participants did not directly interact with Karamba3D, but the structural analysis program ran in the background while they worked. The percentage of seats shaded was calculated within Grasshopper by projecting the angle of the sun on 15 August (an approximate date for the Olympics) for a theoretical tropical climate approximately 12 degrees north of the equator on seats visible in the section cut. Figure A3 shows the tool’s section cut display and two quantitative feedback metrics.
Figure A2.
The ten editable variables in the design tool showing their name, images of what they change in the model, and the range of their values.
Figure A2.
The ten editable variables in the design tool showing their name, images of what they change in the model, and the range of their values.

Figure A3.
The tool’s section cut display, showing the maximum deflection, deflection shape, and the percentage of seats shaded from the sun.
Figure A3.
The tool’s section cut display, showing the maximum deflection, deflection shape, and the percentage of seats shaded from the sun.

References
- Cross, N.; Roozenburg, N. Modelling the design process in engineering and in architecture. J. Eng. Des. 1991, 3, 325–337. [Google Scholar] [CrossRef]
- Visser, W. More or less following a plan during design: Opportunistic deviations in specification. Int. J. Man-Mach. Stud. 1990, 33, 247–278. [Google Scholar] [CrossRef]
- Gericke, K.; Blessing, L. Comparisons of design methodologies and process models across disciplines: A literature review. In Proceedings of the 18th International Conference on Engineering Design, Copenhagen, Denmark, 15–18 August 2011. [Google Scholar]
- Oxman, R. Theory and design in the first digital age. Des. Stud. 2006, 27, 229–265. [Google Scholar] [CrossRef]
- Wynn, D.; Clarkson, J. Chapter 1: Models of Designing. In Design Process Improvement: A Review of Current Practice; Clarkson, J., Eckert, C., Eds.; Springer Science & Business Media: Berlin/Heidelberg, Germany, 2005; pp. 34–59. [Google Scholar]
- Cross, N. Design Thinking: Understanding How Designers Think and Work; Berg: Oxford, UK, 2011. [Google Scholar]
- Clarkson, J.; Eckert, C. Introduction: The Reality of Design. In Design Process Improvement: A Review of Current Practice; Springer Science & Business Media: Berlin/Heidelberg, Germany, 2005. [Google Scholar]
- Cross, N. Engineering Design Methods: Strategies for Product Design; John Wiley & Sons Ltd.: Hoboken, NJ, USA, 2021. [Google Scholar]
- Allen, E. Keynote address: The essence of building technology. In 2006 Building Technology Educators’ Symposium Proceedings; Oakley, D.J., Smith, R.E., Eds.; Lulu Press Inc.: Morrisville, NC, USA, 2006; pp. 5–11. [Google Scholar]
- Davis, M. Distinguishing architects from engineers: A pilot study in differences between engineers and other technologists. In Philosophy and Engineering; Springer: Dordrecht, The Netherlands, 2009; pp. 15–30. [Google Scholar] [CrossRef]
- Tessmann, O. Collaborative Design Procedures for Architects and Engineers; University of Kassel: Kassel, Germany, 2008. [Google Scholar]
- Borrego, M.; Newswander, L. Characteristics of successful cross disciplinary engineering education collaborations. J. Eng. Edu. 2008, 97, 123–134. [Google Scholar] [CrossRef]
- Lee, J.H.; Ostwald, M.J.; Gu, N. Preface. In Design Thinking: Creativity, Collaboration and Culture; Springer Ebook: Cham, Switzerland, 2020. [Google Scholar] [CrossRef]
- Edmonds, A.; Mourtis, T.; Boyle, M. Parametric design–A drive towards a sustainable future. In Innovation in Construction; Gaffar, S.H., Mullett, P., Pei, E., Roberts, J., Eds.; Springer: Cham, Switzerland, 2020; pp. 221–257. [Google Scholar] [CrossRef]
- de Gaulmyn, C.; Dupre, K. Teaching sustainable design in architecture education: Critical review of Easy Approach for Sustainable and Environmental Design (EASED). Front. Arch. Res. 2019, 8, 238–260. [Google Scholar] [CrossRef]
- Pallasmaa, J. The Thinking Hand: Existential and Embodied Wisdom in Architecture; John Wiley & Sons Ltd.: Chichester, UK, 2009. [Google Scholar]
- Gul, L. The impact of digital design representations on synchronous collaborative behaviour. J. Inf. Technol. Constr. 2014, 19, 47–71. [Google Scholar]
- Anton, I.; Tanase, D. Informed Geometries. Parametric modelling and energy analysis in early stages of design. Energy Procedia 2015, 85, 9–16. [Google Scholar] [CrossRef]
- Turrin, M.; von Buelow, P.; Kilian, A.; Stouffs, R. Performance skins for passive climate comfort. Autom. Constr. 2012, 22, 36–50. [Google Scholar] [CrossRef]
- Gu, N.R.; Behbahani, P.A. Parametric design: Theoretical development and algorithmic foundation for design generation in architecture. In Handbook of the Mathematics of the Arts and Sciences; Springer International Publishing: Cham, Switzerland, 2021; pp. 1361–1383. [Google Scholar] [CrossRef]
- Wortmann, T.; Tunçer, B. Differentiating parametric design: Digital workflows in contemporary architecture and construction. Des. Stud. 2017, 52, 173–197. [Google Scholar] [CrossRef]
- Arnaud, V.B. Quantifying Architects’ and Engineers’ Use of Structural Design Software. Doctoral Dissertation, Massachusetts Institute of Technology, Boston, MA, USA, 2013. [Google Scholar]
- Brown, N.C.; Mueller, C.T. The effect of performance feedback and optimization on the conceptual design process. In Proceedings of the International Association for Shell and Spatial Structures (IASS) Symposium 2016, Tokyo, Japan, 26–30 September 2016; Available online: https://www.researchgate.net/publication/316107726 (accessed on 2 February 2021).
- Lee, J.H.; Gu, N.; Ostwald, M.J. Creativity and parametric design? Comparing designer’s cognitive approaches with assessed levels of creativity. Int. J. Des. Creat. Innov. 2015, 3, 78–94. [Google Scholar] [CrossRef]
- Yu, R.; Gero, J.; Gu, N. Architects’ cognitive behaviour in parametric Design. Int. J. Archit. Comput. 2015, 13, 83–101. [Google Scholar] [CrossRef]
- Stals, A.; Jancart, S.; Elsen, C. Parametric modeling tools in small architectural offices: Towards an adapted design process model. Des. Stud. 2021, 72, 100978. [Google Scholar] [CrossRef]
- Oxman, R. Thinking difference: Theories and models of parametric design thinking. Des. Stud. 2017, 52, 4–39. [Google Scholar] [CrossRef]
- Rolvink, A.; van de Straat, R.; Coenders, J. Parametric structural design and beyond. Int. J. Archit. Comput. 2010, 8, 319–336. [Google Scholar] [CrossRef]
- Touloupaki, E.; Theodosiou, T. Optimization of building form to minimize energy consumption through parametric modelling. Procedia Environ. Sci. 2017, 38, 509–514. [Google Scholar] [CrossRef]
- Liu, Q.; Han, X.; Yan, Y.; Ren, J. A parametric design method for the lighting environment of library building based on building performance evaluation. Energies 2023, 16, 832. [Google Scholar] [CrossRef]
- Stavric, M.; Marina, O. Parametric modeling for advanced architecture. Int. J. Appl. Math. Inform. 2011, 5, 9–16. Available online: https://www.researchgate.net/publication/285467523 (accessed on 5 May 2021).
- Beirão, J.; Arrobas, P.; Duarte, J. Parametric Urban Design: Joining morphology and urban indicators in a single interactive model. In Proceedings of the Digital Physicality-Proceedings of the 30th eCAADe Conference, Prague, Czech Republic, 12–14 September 2012; Volume 1, pp. 167–175. [Google Scholar]
- Block, P.; Van Mele, T.; Rippman, M.; Paulson, N. Beyond Bending: Reimagining Compression Shells; Detail: Munich, Germany, 2017. [Google Scholar]
- Holzer, D.; Hough, R.; Burry, M. Parametric design and structural optimisation for early design exploration. Int. J. Archit. Comput. 2007, 5, 625–643. [Google Scholar] [CrossRef]
- Tsigkari, M.; Chronis, A.; Joyce, S.C.; Davis, A.; Feng, S.; Aish, F. Integrated Design in the Simulation Process. In Proceedings of the Symposium on Simulation for Architecture & Urban Design, San Diego, CA, USA, 22–24 May 2017; pp. 153–162. [Google Scholar]
- Utami, N. Design-work from home: Zoom as a video conferencing platform in architecture consultant firm. In Proceedings of the International Conference on Information Technology, Multimedia, Architecture, Design, and E-Business; LPPM Institut Desain dan Bisnis Bali: Kota Denpasar, Bali, Indonesia, 2020; pp. 102–109. [Google Scholar]
- Koutsabasis, P.; Vosinakis, S.; Malisova, K.; Paparounas, N. On the value of Virtual Worlds for collaborative design. Des. Stud. 2012, 33, 357–390. [Google Scholar] [CrossRef]
- Ferguson, S.; Lai, K.; Chen, J.; Faidi, S.; Leonardo, K.; Olechowski, A. ‘Why couldn’t we do this more often?’: Exploring the feasibility of virtual and distributed work in product design engineering. Res. Eng. Des. 2022, 33, 413–436. [Google Scholar] [CrossRef]
- Bassanino, M.; Fernando, T.; Wu, K.C. Can virtual workspaces enhance team communication and collaboration in design review meetings? Archit. Eng. Des. Manag. 2014, 10, 200–217. [Google Scholar] [CrossRef]
- Gül, L.F. Evaluating design behaviour when using emerging collaboration technologies. Archit. Eng. Des. Manag. 2009, 5, 107–123. [Google Scholar] [CrossRef]
- Rosenman, M.A.; Smith, G.; Maher, M.L.; Ding, L.; Marchant, D. Multidisciplinary collaborative design in virtual environments. Autom. Constr. 2007, 16, 37–44. [Google Scholar] [CrossRef]
- Cross, N.; Clayburn Cross, A. Observations of teamwork and social processes in design. Des. Stud. 1995, 16, 143–170. [Google Scholar] [CrossRef]
- Dong, A. The latent semantic approach to studying design team communication. Des. Stud. 2005, 26, 445–461. [Google Scholar] [CrossRef]
- Goldschmidt, G. The designer as a team of one. Des. Stud. 1995, 16, 189–209. [Google Scholar] [CrossRef]
- Fu, K.; Cagan, J.; Kotovsky, K. Design team convergence: The influence of example solution quality. J. Mech. Des. 2010, 132, 111005. [Google Scholar] [CrossRef]
- Shah, J.J.; Smith, S.M.; Vargas-Hernandez, N. Metrics for measuring ideation effectiveness. Des. Stud. 2003, 24, 111–134. [Google Scholar] [CrossRef]
- Zeiler, W. The difference in communication between architects and engineers and the effectiveness within integral design. In Proceedings of the 16th International Conference on Engineering and Product Design Education, Twente, The Netherlands, 4–5 September 2014; pp. 238–243. [Google Scholar]
- Amabile, T.M. Social psychology of creativity: A consensual assessment technique. J. Pers. Soc. Psychol. 1982, 43, 997–1013. [Google Scholar] [CrossRef]
- Jeffries, K.K. A CAT with caveats: Is the Consensual Assessment Technique a reliable measure of graphic design creativity? Int. J. Des. Creat. Innov. 2017, 5, 16–28. [Google Scholar] [CrossRef]
- Lee, J.H.; Ostwald, M.J.; Gu, N. Chapter 8: Design Thinking Across Borders. In Design Thinking: Creativity, Collaboration and Culture; Springer EBooks: Cham, Switzerland, 2020; pp. 191–209. [Google Scholar] [CrossRef]
- Attia, S.; Hensen, J.M.L.; Beltrán, L.; De Herde, A. Selection criteria for building performance simulation tools: Contrasting architects’ and engineers’ needs. J. Build. Perform. Simul. 2012, 5, 155–169. [Google Scholar] [CrossRef]
- Wicklund, R.A.; Gollwitzer, P.M. Symbolic Self-Completion; Lawrence Erlbaum Associates, Inc.: Mahwah, NJ, USA, 1982. [Google Scholar]
- Kavakli, M.; Gero, J.S. Strategic knowledge differences between an expert and a novice designer. In Human Behavior in Design; Lindemann, U., Ed.; Springer: Berlin/Heidelberg, Germany, 2003; pp. 42–52. [Google Scholar] [CrossRef]
- Ahmed, S.; Wallace, K.M.; Blessing, L.T. Understanding the differences between how novice and experienced designers approach design tasks. Res. Eng. Des. 2003, 14, 1–11. [Google Scholar] [CrossRef]
- Abdelmohsen, S.M.; Do, E.Y.-L. Analyzing the significance of problem solving expertise and computational tool proficiency in design ideation. In Proceedings of the 13th International Conference on Computer Aided Architectural Design Futures, Montreal, QC, Canada, 19–22 June 2009; pp. 273–287. [Google Scholar]
- Lucas, B.; Hanson, J. Thinking like an engineer: Using engineering habits of mind and signature pedagogies to redesign engineering education. Int. J. Eng. Ped. 2016, 6, 4–13. [Google Scholar] [CrossRef]
- Dym, C.L.; Agogino, A.M.; Eris, O.; Frey, D.D.; Leifer, L.J. Engineering design thinking, teaching, and learning. J. Eng. Educ. 2005, 94, 103–120. [Google Scholar] [CrossRef]
- Yazici, H.J.; Zidek, L.A.; St. Hill, H. A Study of Critical Thinking and Cross-Disciplinary Teamwork in Engineering Education. Women in Industrial and Systems Engineering; Springer: Cham, Switzerland, 2020; pp. 185–196. [Google Scholar] [CrossRef]
- Van den Beemt, A.; MacLeod, M.; Van der Veen, J.; Van de Ven, A.; Van Baalen, S.; Klaassen, R.; Boon, M. Interdisciplinary engineering education: A review of version, teaching, and support. J. Eng. Educ. 2020, 109, 508–555. [Google Scholar] [CrossRef]
- Hadgraft, R.G.; Kolmos, A. Emerging learning environments in engineering education. Aust. J. Eng. Educ. 2020, 109, 3–16. [Google Scholar] [CrossRef]
- Ponzio, A.P.; Gonzaga, M.G.; de Castro, M.P.; Vale, A.; Bruscato, U.M.; Mog, W. Parametric design learning strategies in the context of architectural design remote teaching. In Proceedings of the SIGRADI 2021 Designing Possibilities Ubiquitous Conference, Online, 8–12 November 2021; pp. 1077–1088. [Google Scholar]
- Gerber, D.J.; Flager, F. Teaching design optioneering: A method for multidisciplinary design optimization. In Computing in Civil Engineering; American Society of Civil Engineering: Reston, VA, USA, 2011; pp. 883–890. [Google Scholar] [CrossRef]
- Rodriquez, C.; Hudson, R.; Niblock, C. Collaborative learning in architectural education: Benefits of combining conventional studio, virtual design studio and live projects. British J. Educ. Tech. 2018, 49, 337–353. [Google Scholar] [CrossRef]
- den Otter, A.; Emmitt, S. Design team communication and design task complexity: The preference for dialogues. Archit. Eng. Des. Manag. 2008, 4, 121–129. [Google Scholar] [CrossRef]
- Luyten, L. Architect and structural engineer communication in multi-disciplinary creativity. In Proceedings of the First International Conference on Structures and Architecture, Guimarães, Portugal, 21–23 July 2010; pp. 1793–1800. [Google Scholar]
- Rameezdeen, R.; Gunarathna, N. Comparison of cultures in consultant and contractor organizations in construction industry. Built-Environ. -Sri Lanka 2003, 3, 59–66. [Google Scholar] [CrossRef]
- McGrath, J.E. Method for Study of Groups. In Groups: Interactions and Performance; Prentice-Hall Inc.: Hoboken, NJ, USA, 1984; pp. 31–37. [Google Scholar]
- Shapediver GmbH; Shapediver: Wien, Austria, 2019; Available online: https://shapediver.com/ (accessed on 15 November 2020).
- Preisinger, C.; Heimrath, M. Karamba—A toolkit for parametric structural design. Struct. Eng. Int. 2014, 24, 217–221. [Google Scholar] [CrossRef]
- Chiu, I.; Salustri, F.A. Evaluating design project creativity in engineering design courses. In Proceedings of the Canadian Engineering Education Association (CEEA), Toronto, ON, Canada, 18–22 June 2022. [Google Scholar] [CrossRef]
- Senescu, R.R.; Haymaker, J.R.; Meža, S.; Fischer, M.A. Design process communication methodology: Improving the effectiveness and efficiency of collaboration, sharing, and understanding. J. Archit. Eng. 2014, 20, 05013001. [Google Scholar] [CrossRef]
- Stevenson, M.; Lai, J.W.M.; Bower, M. Investigating the pedagogies of screen-sharing in contemporary learning environments—A mixed methods analysis. J. Comp. Assist. Learn. 2022, 38, 770–783. [Google Scholar] [CrossRef]
- Adou-Khalil, V.; Helou, S.; Khalifé, E.; Chen, M.A.; Majumdar, R.; Ogata, H. Emergency online learning in low-resource settings: Effective student engagement strategies. Educ. Sci. 2021, 11, 24. [Google Scholar] [CrossRef]
- Schnabel, M. Architectural parametric designing. In Proceedings of the Communicating Space(s): 24th eCAADe Conference Proceedings, Volos, Greece, 6–9 September 2006; pp. 216–221. [Google Scholar]
- Senaratne, S.; Gunawardane, S. Application of team role theory to construction design teams. Archit. Eng. Des. Manag. 2015, 11, 1–20. [Google Scholar] [CrossRef]
- Lee, J.H.; Ostwald, M.J.; Gu, N. Introduction: Exploring design thinking. In Design Thinking: Creativity, Collaboration and Culture; Springer eBook: Cham, Switzerland, 2020; pp. 1–32. [Google Scholar] [CrossRef]
Figure 1.
Methodology. Overview of the methodology, design task, tools, and data collected from the study. The sample tool interface shows 4 of 10 parameters controlling the model and a sample of the 3D modeling space with visual geometric and performance feedback. Details of the 3D modeling space graphic feedback can be found in Appendix B Figure A3.

Figure 2.
The design tool’s structure and possible screensharing strategies used by participants to collaborate in the tool.
Figure 2.
The design tool’s structure and possible screensharing strategies used by participants to collaborate in the tool.

Figure 3.
A sample of eighteen of the thirty final designs with six from each team type.

Figure 4.
The professional assessment of efficacy for each team type of each criterion.

Figure 5.
Design exploration of teams by (a) the number of iterations explored by each team type and (b) the number of variables changed by each team type.
Figure 5.
Design exploration of teams by (a) the number of iterations explored by each team type and (b) the number of variables changed by each team type.

Figure 6.
Plots of criteria efficacy rating vs. iterations by each team, showing the fitted linear regression line for each team type and stating the slope of the simple regression analysis equation and its associated p-value.
Figure 6.
Plots of criteria efficacy rating vs. iterations by each team, showing the fitted linear regression line for each team type and stating the slope of the simple regression analysis equation and its associated p-value.

Figure 7.
The strategies used by the team types when screensharing, showing 13 of the teams’ strategies.
Figure 7.
The strategies used by the team types when screensharing, showing 13 of the teams’ strategies.

Figure 8.
Summary of the findings from the study, focusing on the team efficacy and how efficacy related to collaboration and design exploration.
Figure 8.
Summary of the findings from the study, focusing on the team efficacy and how efficacy related to collaboration and design exploration.


Table 1.
The p-values of Kruskal–Wallis tests for significantly different results in team type efficacy.
Table 1.
The p-values of Kruskal–Wallis tests for significantly different results in team type efficacy.
| Criteria | All Projects | Remove Max. and Min. |
|---|---|---|
| Iconic | 0.535 | 0.461 |
| Site Appropriate | 0.439 | 0.357 |
| Shading | 0.495 | 0.462 |
| Deflection | 0.334 | 0.136 |
Disclaimer/Publisher’s Note: The statements, opinions and data contained in all publications are solely those of the individual author(s) and contributor(s) and not of MDPI and/or the editor(s). MDPI and/or the editor(s) disclaim responsibility for any injury to people or property resulting from any ideas, methods, instructions or products referred to in the content. |
© 2023 by the authors. Licensee MDPI, Basel, Switzerland. This article is an open access article distributed under the terms and conditions of the Creative Commons Attribution (CC BY) license (https://creativecommons.org/licenses/by/4.0/).
Share and Cite
MDPI and ACS Style
Bunt, S.; Brown, N.C. Design Efficacy and Exploration Behavior of Student Architect-Engineer Design Teams in Shared Parametric Environments. Buildings 2023, 13, 1296. https://0-doi-org.brum.beds.ac.uk/10.3390/buildings13051296
AMA Style
Bunt S, Brown NC. Design Efficacy and Exploration Behavior of Student Architect-Engineer Design Teams in Shared Parametric Environments. Buildings. 2023; 13(5):1296. https://0-doi-org.brum.beds.ac.uk/10.3390/buildings13051296
Chicago/Turabian StyleBunt, Stephanie, and Nathan C. Brown. 2023. "Design Efficacy and Exploration Behavior of Student Architect-Engineer Design Teams in Shared Parametric Environments" Buildings 13, no. 5: 1296. https://0-doi-org.brum.beds.ac.uk/10.3390/buildings13051296
Note that from the first issue of 2016, this journal uses article numbers instead of page numbers. See further details here.