

Study of Improved Grey BP (Back Propagation) Neural Network Combination Model for Predicting Deformation in Foundation Pits

1
PowerChina Kunming Engineering Co., Ltd., Kunming 650000, China
2
Faculty of Engineering, China University of Geosciences, Wuhan 430000, China
3
School of Civil Engineering, Southeast University, Nanjing 210000, China
4
Guiyang Humanities Development Co., Ltd., Guiyang 550000, China
*
Author to whom correspondence should be addressed.
Buildings 2023, 13(7), 1682; https://0-doi-org.brum.beds.ac.uk/10.3390/buildings13071682
Submission received: 5 May 2023
/
Revised: 19 June 2023
/
Accepted: 21 June 2023
/
Published: 30 June 2023
(This article belongs to the Collection Innovation of Materials and Technologies in Civil Construction)
Abstract
:Deep excavation engineering is a comprehensive discipline that involves multiple fields such as engineering geology, hydrogeology, and foundation engineering. With the improvement of the utilization rate of underground space, the demand for the construction of large-scale underground structural engineering is growing, making the excavation of underground soil become increasingly frequent, which also brings about the safety problems of deep foundation pit engineering and the surrounding environment. Prediction of foundation pit deformation is an important research direction with diverse historical developments, but it is also facing a series of difficulties and challenges. In order to solve these problems, this article proposes an improvement plan, establishes a prediction model based on the combination model of grey BP (back propagation) neural network, and verifies its effectiveness through experiments. The results show that the average error of the new model’s prediction of horizontal deformation is about 0.31, which is about 32% lower than the traditional model’s prediction error. The difference between the vertical deformation prediction and actual monitoring results is also controlled. The vertical deformation predicted by wavelet transform is 7% to 9% larger than the actual monitoring results, meeting the prediction requirements. Finally, this article explores the research on the prediction of foundation pit deformation in deep excavation engineering, An improved grey BP neural network combination model was proposed and its effectiveness was verified through experiments. This article has important reference value for the study of deformation prediction in deep excavation engineering.
1. Introduction
In the 1940s, Terzaghi and Peek et al. abroad first conducted research on foundation pits and proposed theoretical methods for predicting excavation and calculating load forces. In the 1950s, Eide et al. proposed corresponding ideas and analyzed the principles and methods of foundation pit floor uplift. Since the early 1960s, scientific instruments have been introduced for monitoring excavation engineering, with the most influential example being the excavation monitoring in Oslo [1]. Since the 1970s, many countries have been formulating guiding regulations for excavation and construction of foundation pits. Afterwards, more and more scholars devoted themselves to research and achieved a series of breakthroughs [2].
Since 1990, systematic monitoring of deep foundation pit engineering has been carried out in China [3]. The prediction of deformation in foundation pit engineering has always been a key and difficult problem to solve in construction engineering. With the joint efforts of numerous researchers and builders, we have accumulated a wealth of engineering experience [4]. Traditional deformation prediction methods, such as numerical method, empirical formula method, numerical estimation method, etc., are all derived from foundation pit engineering. Although these methods have been widely applied in engineering practice, they also face many problems with the increasing complexity of engineering. Traditional methods mainly rely on instance estimation and do not form a systematic theory, which is too idealistic when considering external influencing factors. Therefore, there are often significant differences between the calculated results and the actual results. At the same time, there are many factors that affect the deformation of foundation pit engineering, and the engineering has a certain timeliness, so it is difficult to analyze each factor reasonably [5]. If specific analysis is carried out every day, it will also lose the practical value of engineering [6].
In order to solve these problems, many researchers and scientists have begun to try new methods and technologies, such as using neural network models for prediction. Junemin and Eide proposed corresponding analysis methods when studying the uplift and rebound of the foundation pit bottom plate. However, due to the insufficient integration of these theoretical methods with actual situations, there is a certain gap between the predicted and measured values [7]. This inspired Hopfield to propose the Hopfield neural network model and begin exploring its practical significance. This marks the beginning of research on the application of neural networks. The most popular application of artificial neural networks is the BP neural network. It continuously trains predictive data as samples to obtain the desired output mode. Todorovic was the first person to use it to predict ground subsidence caused by Velenje coal mining [8].
Accurate prediction of deformation in foundation pit engineering is still a challenging issue, but with the help of new technologies and methods, we can gradually solve this problem. We need to collaborate with experts to improve the prediction model based on actual situations and use advanced technological means to improve the accuracy and reliability of the model. Future research should also focus more on the development of prediction models for excavation deformation and optimize these models based on actual situations. This will provide more precise and effective solutions for construction projects, while also helping to improve project quality and reduce costs [9].
Kalman et al. proposed a recursive filtering algorithm that is very useful for timely data processing in dynamic systems (Zou Jiting, 2007). Next came the emergence of 3D laser scanning technology, which was another revolution in the surveying and mapping industry after GPS. At this time, 3D laser scanning technology can be used for data collection and analysis [10,11,12]. Since the 1980s, artificial neural networks have developed rapidly and are widely used in various fields (Cheng Weiliang, 2005). Because of their parallel processing, strong fault tolerance, approaching complex nonlinear systems, self-learning, and self adaptation, they have a broad application prospect in deformation monitoring data processing and prediction. Among them, F. Rosenblatt is the first to integrate artificial neural network theory into practice, which has achieved certain results in fields such as signal recognition [13].
Wavelet analysis is a practical discipline that has rapidly developed based on the research achievements of Meyer, S. Mallat, I. Daubechies, and others. It is widely used in the fields of detecting edge features of images, determining the accuracy of gravity tidal sand parameters, and so on. Wan Chenghui used wavelet analysis to process the dam deformation monitoring data, and realized the analysis and prediction of deformation [14]. Wen Hongyan et al. studied the feasibility and superiority of wavelet denoising technology in the application of wavelet analysis and data processing of deformation analysis. In 2007, Zheng Dezhong et al. discussed the image denoising method of node threshold wavelet packet transform, using soft threshold for threshold processing and spectral entropy method for noise estimation, and verified significant image denoising performance.
Combination forecasting analysis is a comprehensive forecasting method that has developed rapidly in recent years. The concept of combination refers to the effective combination of different forecasting models or methods, and the prediction is carried out by combining the advantages and advantages of a single model or method. Other combination models such as grey time series model, wavelet grey combination model, wavelet neural network model, Kalman filter grey combination model, etc., have also been widely proposed and applied. The development of deformation prediction methods for foundation pits can be represented by Figure 1 before.
Due to the complexity of the engineering hydrogeological conditions and surrounding environmental conditions where the foundation pit is located, as well as the complexity of the supporting structure’s own stress system, as well as the lack of necessary theoretical data support and engineering experience accumulation, there is currently no good quantitative evaluation and analysis model for the safety prediction of the foundation pit, nor is there a good quantitative evaluation standard. Generally, judgments can only be made based on experience by the responsible unit of the foundation pit engineering or its entrusted expert group, which can easily be blinded and misled by surface phenomena, resulting in significant one-sidedness and blindness in management decisions.
Regional condition is one of the most important factors in foundation pit engineering. Different geological conditions, hydrological conditions, and other factors will produce great differences in the foundation pit, so the results obtained during the survey are also susceptible to the influence of external factors, resulting in an increase in data error, so that the safety of the project can not be fully guaranteed.
Compared with shallow foundation pits, the deformation factors of deep foundation pits are more complex. The construction of a deep foundation pit involves many fields of knowledge, such as geotechnical engineering, structural engineering, etc., requiring the consideration of many factors. Considering only structural reasons or external environmental factors is far from enough. Therefore, the common influence of many factors must be considered comprehensively in deep foundation pit engineering. For example, during the excavation process, the soil quality may change and the water table may change, which may cause the delay of the project.
To sum up, the safety and reliability of foundation pit engineering are greatly affected by regional conditions, so it is necessary to fully consider geological conditions, hydrological conditions, and other factors. The construction of deep foundation pits needs to deal with the influence of many factors comprehensively to ensure the smooth progress of the project. Therefore, in the research and practice of deep foundation pit engineering, it is necessary to consider many factors comprehensively, so as to improve the safety and reliability of the project.
In the process of deep foundation pit excavation, the influencing factors are complex, and the variability of these factors often leads to safety accidents and significant losses in foundation pit engineering. Moreover, deep excavation is the foundation of the overall construction of the project, and its stability and safety are self-evident for the safety guarantee of the entire project. Therefore, the quality of deep excavation engineering must meet high standards and strict requirements, and control dangerous factors within a controllable range.
2. Improved Grey BP Neural Network Combination Model
2.1. Optimization of Data Preprocessing Methods
After collecting foundation pit deformation data, the method of wavelet transform signal is used to process the discrete data. The calculation method is as follows:
where: J(x) is the collected data; Z(x) is the real data; L(x) is the degree of data anomaly.
In order to obtain more accurate and reliable data, we usually need to process abnormal data. In the process of data acquisition, if there is a high-frequency signal, it is likely to be an abnormal signal and will need to be stripped. Wavelet transform data analysis can help us deal with abnormal signals, so as to distinguish real data from monitoring data. The specific principle is to decompose space P into P11 and P21 through orthogonal decomposition, and then further decompose P11 into P12 and P13, so that the original space can be decomposed into an infinite number of orthogonal decomposition quantities. Finally, the space where the deformed data reside can be represented by these orthogonal decomposition quantities, thus achieving the processing of abnormal signals and accurate measurement of the data.
The decomposition of the wavelet signal conversion diagram is shown; the original signal Y represents, after Qi and Wi, the space decomposition of high-frequency and low-frequency signals, in order to be able to further enhance the accuracy of low-frequency signal of the signal decomposition, the decomposition of the low frequency of the next space model, and the high-frequency signal, so that you can make the signal infinite close to reality.
In the process of data processing, it is found that the choice of wavelet transform method and threshold will affect the result of data processing. At present, Dobesie wavelet and Semlett wavelet are popular. Semlett’s method is obtained by perfecting Dobesie’s method. These two processing methods have a certain symmetry, which can make the collected data more accurate and real. In this paper, according to different situations, several different threshold determination methods are adopted (Figure 2), which increase the selectivity of threshold and affect the result orientation.
- (1)
- Threshold correction method [15].
- (2)
- Limit threshold method [13].
This method can avoid the maximization of risk and provides the lower limit of data. The mean square error is used to determine whether it is appropriate. The calculation is as follows [15]:
- (3)
- Unbiased risk estimation method [14].
This method takes the minimum point of risk value as the reference point based on the risk curve, and finally calculates the unbiased risk threshold, which is calculated as follows:
2.2. Abnormality Discrimination
When the collected abnormal data exceed a certain value, they are disordered, so that we can accurately exclude the risky data in a short time. This method is not only fast but also efficient. We define this value as the threshold value, which is why we have the threshold definition method above. In order to test the accuracy of these threshold calculation methods, this study will use different evaluation systems to evaluate these different methods. The first evaluation system is mean square error analysis, and the evaluation method is as follows [15]:
where y(i) is the original signal, and RMSE value is the calculated fit coefficient. In real life, if the obtained RMSE value is small, it means that the difference between the abnormal signal and the original signal is small, that is to say, the data collection can meet the calculation needs.
The other method is the QZ method, which represents the ratio between the collected value and outliers. It can be clearly seen that if the QZ value is too large, the difference between the two values is too large to meet the requirements of data collection [16]. The calculation method is as follows:
where LS is the power of the original signal and Ln is abnormal
data power.
2.3. Grey Prediction Model
The Grey GM (1,1) is a common prediction model [17]:
Each accumulation generates a new sequence:
The residual of this method is calculated as follows:
The accuracy of this model can be verified by the variance and error probability:
where S1 and S2 are the variances of model sequence.
2.4. BP Neural Network Model
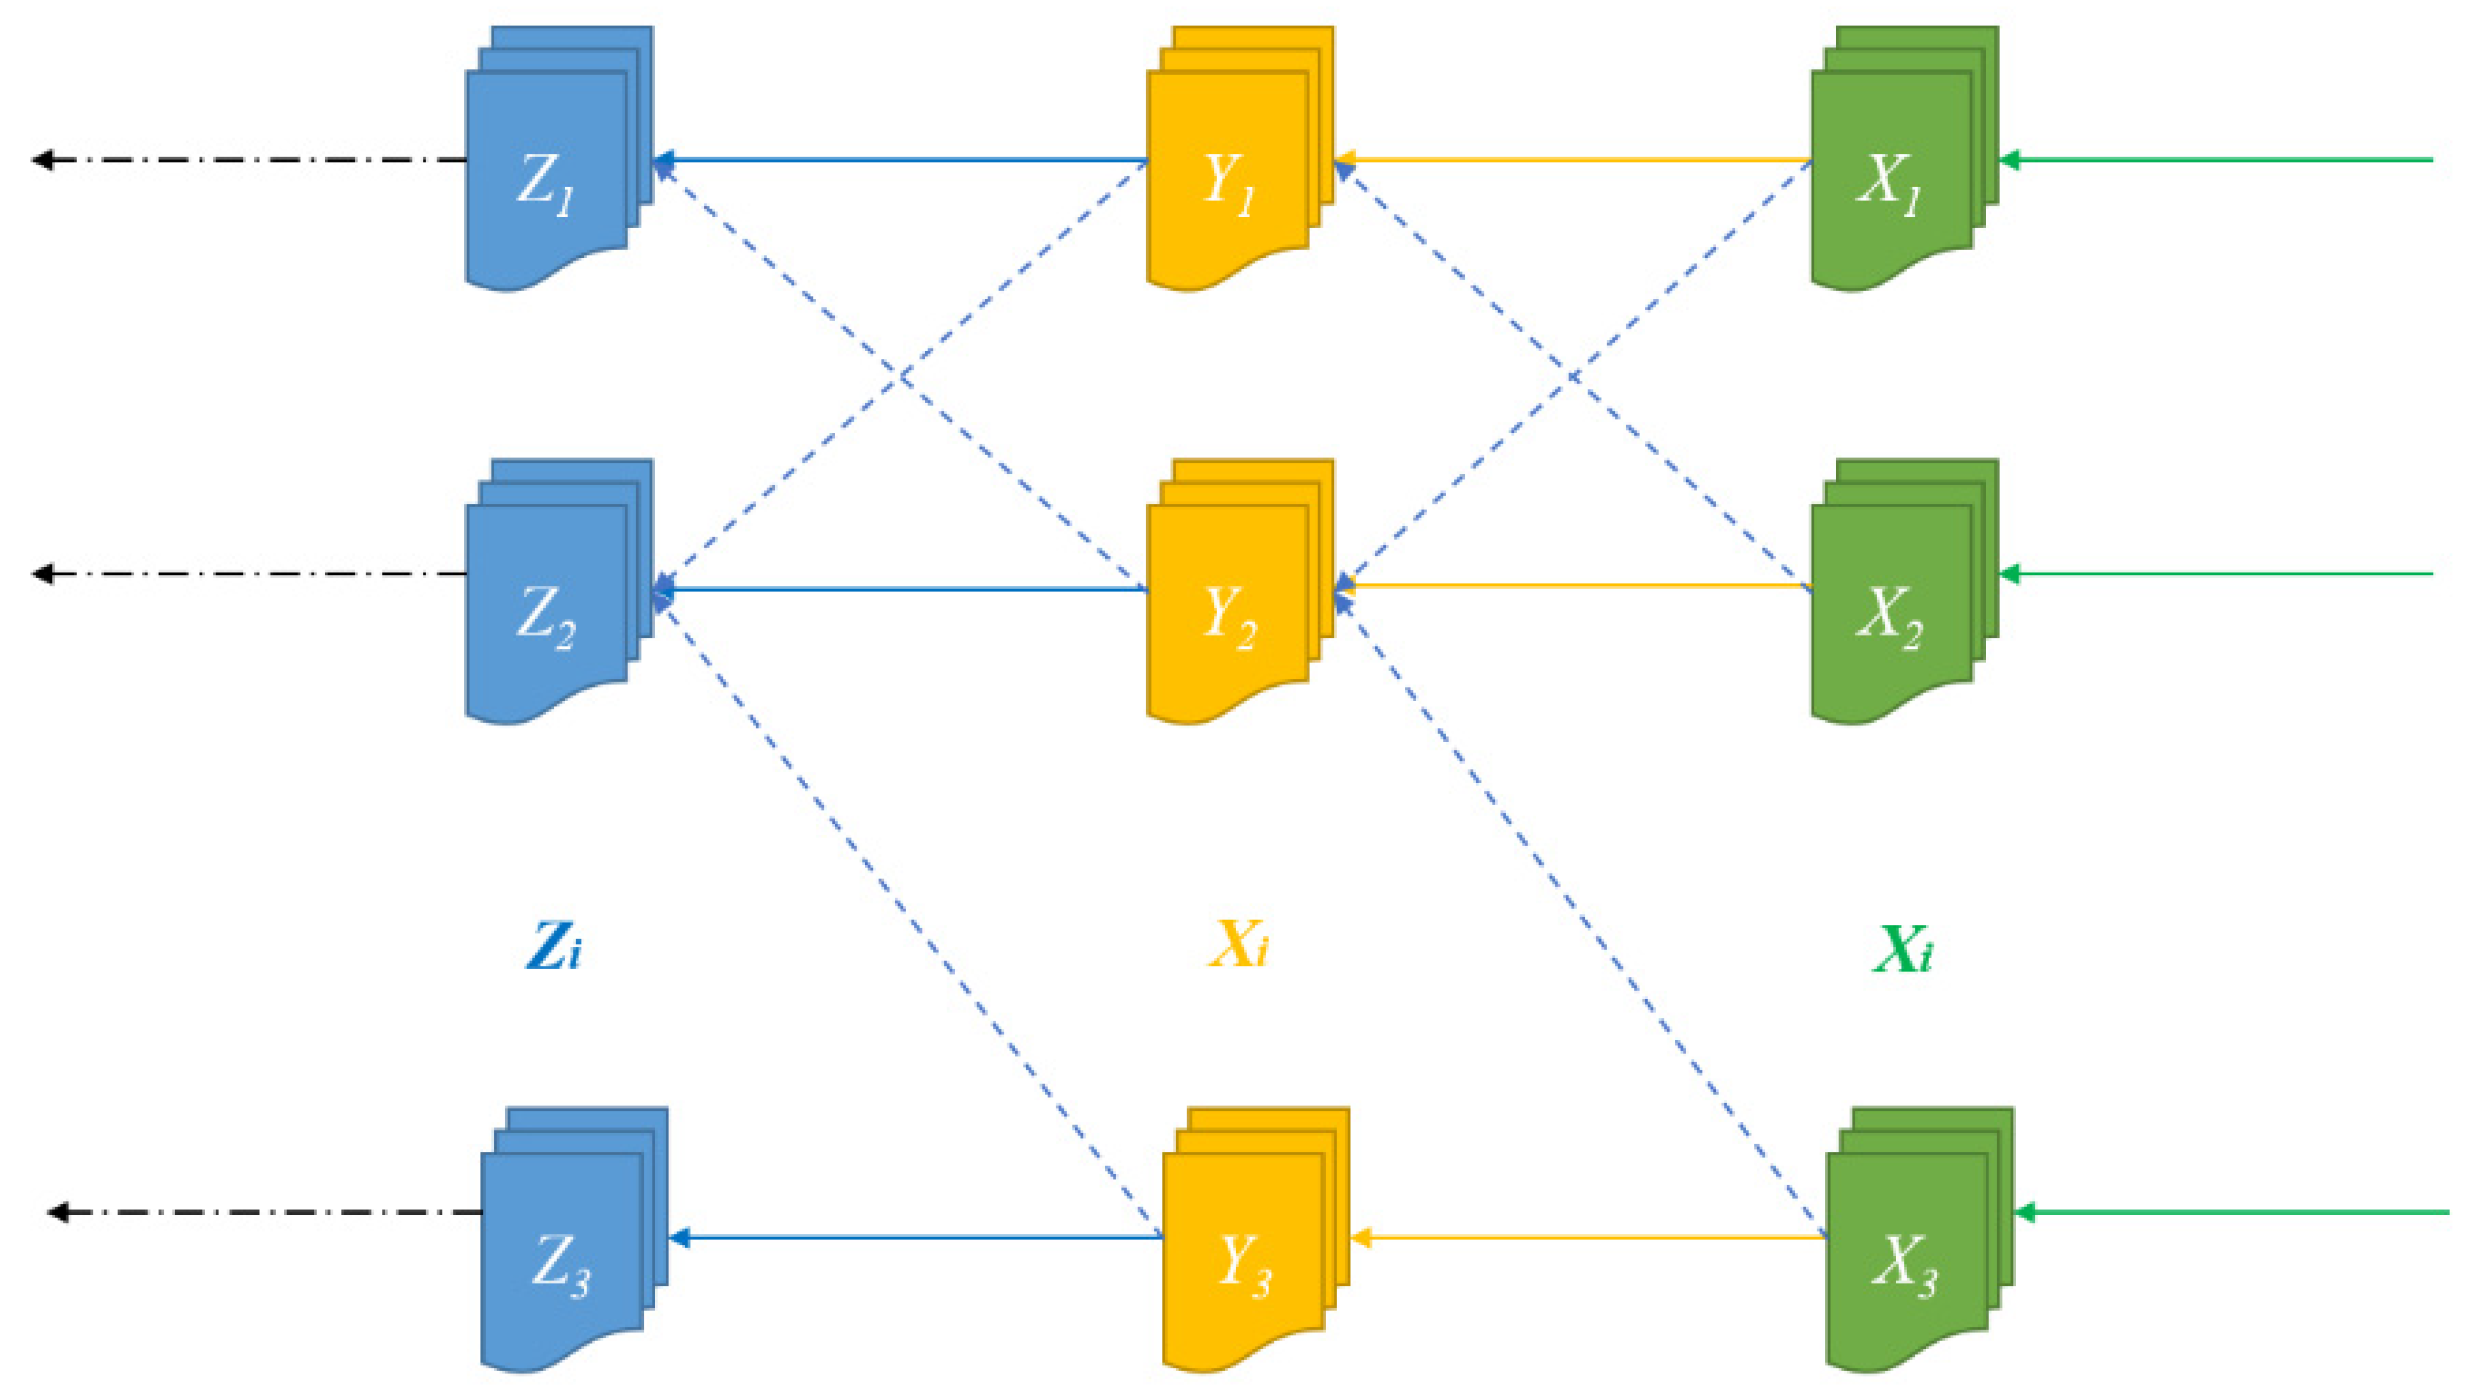
The The BP neural network system can learn autonomously through input data, and the errors in layer upon layer propagation will also be fed back along with the propagation. The general process is shown in Figure 3. The output of the hidden layer is as follows [18]:
Node error is calculated as follows:
where E is the true or no value. If the calculation result meets the requirements, the result will be output; if not, further correction is required.
In this study, the conversion width of grey BP neural network is improved by using a more appropriate threshold and appropriate point stopping method. In order to improve the training amount and training results of neural network, multiple sets are used to train the neural network [19]. The first is the training set, which is used to get a more appropriate threshold and a more accurate weight of network relations. The second set is the validation set, which is used to verify whether the neural network trained by the first set can meet the calculation error requirements, and obtain a faster calculation method by training here. The third set is the final experimental set, which is used to test whether the neural network trained by the first two sets can meet the requirements of result output and improve data quality.
Figure 3.
Neural network working diagram.

In this study, we used three different hierarchical BP neural networks to calculate the data and predict the deformation of the foundation pit. This method involves different relationships and dependencies, and requires some data to verify these relationships. In the process of selecting data volume, we need to consider it moderately, as too much data can affect the accuracy of neural network learning, and we must avoid this situation [20].
In order to ensure the reliability of the results, this study selected fixed values from the original data as the training data for the neural network, and specified the method for selecting predicted values.
The corresponding number of hidden nodes can be obtained by using the input and division of foundation pit deformation summarized above. The speed of training will be affected by the number of hidden layers less than the number of input nodes. Therefore, we need to select appropriate input variables and output variables to obtain the number of hidden layer nodes that meet the conditions, so as to ensure that the training speed meets the requirements [21]. Of course, this must be carried out under the condition of meeting the accuracy. The training accuracy is set to 0.0001, and the maximum number of training steps is set to 10,000 [22].
Combining some of the problems in wavelet analysis with grey BP neural network can solve them, and the training of grey BP neural network can also simplify this problem. Therefore, this article chooses to establish a combination prediction model for deep excavation deformation that is different from the former by combining wavelet analysis with grey BP neural network. We will use a new BP neural network model for data processing, and the processed data will undergo a new round of wavelet transform processing. The determination of threshold can remove abnormal data values and obtain more accurate data. After cyclic training, we will obtain more accurate data than the original model.
Use the wavelet transform method to process the data and obtain the corresponding data that meet the threshold conditions. Then, determine whether the data after wavelet transform meet the conditions of the grey model. If it does, use these data. If it does not, change it again to obtain the data that meets the conditions. Bring the data obtained from the above two steps into the grey GM (1,1) model for calculation. Finally, according to the training method of the grey neural network, the data calculated by the model are imported into the grey neural network. After continuous data learning and training, data that meet the output conditions are obtained and used as a predictive value.
The improvement of accuracy will be changed through the establishment of this model. The deletion of abnormal data has an important impact on the improvement of accuracy. The removal of unqualified data is also very important. The addition of new data can meet the needs of training. When the judgment of data value has been calculated again and again, we will get a series of reaction data, and the data that do not meet the conditions before will be deleted. This process is defined as “policy loop”, so in this study, we will modify the general GM (1,1) model to meet the usage conditions and optimize the calculation process to save time [23]. The optimized algorithm is as follows:
For the prediction accuracy of deep foundation pit deformation under different conditions, this model also needs to meet the following conditions: When the coefficient calculation results are within the controllable range, the model can be used with good accuracy; however, when the coefficient calculation result has a divergent trend, it cannot be used.
The grey BP neural network model has stringent requirements for the input of data; if you can completely test the basis of the conditions of various initial data, you can use this data modeling. If these conditions are not met temporarily, you cannot use this data modeling and need tested data after the data conversion; the converted data must meet the requirements to use. Pay special attention to the range of ranks.
3. The Model Combination
3.1. Selection of Working Conditions and Determination of Threshold
In this study, the lateral pressure test data of deep foundation pit are selected as the input data, and the original data are introduced into the calculation to obtain the initial data accumulation sequence, that is, the initial value of the input data. Since the grey BP neural network model needs to use the data to verify the accuracy of the model, we will select the appropriate data range as the sample for data training, and then select other sequential data to test the model. The training and input and output methods of the whole model are shown in the following figure.
This study evaluates the practical use value of the model based on the field data provided by the actual project. The data of the deep foundation pit used this time comes from a two-story basement structural project. The deep foundation pit is approximately 10 m long and located in a newly built urban area. The dig of the deep foundation pit has a certain impact or affects other aspects, pipe corridors, bridges, and other projects, so it is necessary to test the deformation of the foundation pit and evaluate its impact on other buildings. The results of soil exploration are as follows: the first layer of mixed fill, the second layer of silt, the third layer of silt, the fourth layer of silt, the fifth layer of silt clay, and the sixth layer of coarse sand. The thickness of each layer is different. The thickness of coarse sand can reach about 12 m, the thickness of silty soil can reach about 16 m, and the thickness of other layers is about 3~6 m [24].
The hydrologic exploration of this deep foundation pit shows that silty soil and silty clay in the foundation pit are the basic aquifer; the water level control line is about 4 m. Different data selection methods will get different results, and the accuracy will be greatly affected.
A single roof w piles is used as the support system for the deep foundation pit, and the protection level is level 1. Multiple horizontal observation points are set to detect the horizontal displacement of the foundation pit [25]. The deep foundation pit excavation can be divided into the following steps: First, to test the excavation of the foundation pit, the grid is formed with the corresponding point as the initial point, and then begins the testing of the foundation pit excavation, excavation before the need for pile foundation reinforcement, and excavation of the laying template; after the first layer upon the concrete pouring to the next layer of excavation, and before every excavation of the foundation pit enclosure, testing must be well done, in order according to the cycle, step by step until the bottom in turn is reached [26].
Because the excavation scope is small each time, the force in the middle of the foundation pit is concentrated, and the deformation of the foundation pit needs to be monitored in real time, among which the support structure plays a decisive role in the safety of the foundation pit [27]. The reliability of this study is verified by selecting a certain point as the experimental object, recording the lateral movement of this point, collecting data for simulation training, and finally conducting model data training to achieve the expected effect and requirements.
In order to guarantee the authenticity and accuracy of training data, we study the model phase and will update the data each time. The data will have a synchronous connection with the actual situation; the new move will take the place of the previous level mobile. Using this method to continuously update the data, we can accurately predict real-time data.
The model established by the above method is more sensitive to data. The selection of threshold value is very important, and the model of training data must be on the right side of the number line to ensure the convergence of model calculation. In order to reduce the errors in the basic training stage, we adopted the time accumulation method to process the horizontal motion data in the case of small data collection and few training times, so as to better play the role of the model.
The wavelet change method is used to exclude abnormal data from the collected data. The selection of threshold value and the type of function used for wavelet change will have a great impact on the accuracy of the results. In this study, a variety of different wavelet transform functions and different threshold values are combined to compare the calculation results. Finally, determine the combination of wavelet function and threshold value that meet the conditions and accuracy requirements, and then proceed to the next step.
According to the different selection of thresholds, this study uses the unified range of wavelet transform function in the process of using the estimated threshold, enlightenment threshold, and stable threshold method to calculate the collected data, remove abnormal data, and obtain several different wavelet transform results.
According to the data in the table and the concepts of RMSE and QZ, it is not difficult to find that the larger the difference between abnormal data and the original collected data, the worse the removal effect of the abnormal data. The higher the ratio of QZ, the better the removal effect of abnormal data. In the comparison of threshold evaluation methods, it can be found that the unbiased estimation method has the strongest ability to remove abnormal data, and the degree of adaptation will obviously be the most consistent with the treatment capacity of deep foundation pit. Next, we will use the combination of wavelet transform and threshold to carry out the following research.
Evaluation of wavelet transform function. The selection of wavelet transform function has different effects on the results. Only Db6 and Sym6 wavelet transform are selected in this study, and the threshold determination method selected in the previous section is used to handle abnormal data of the initial collected data.
From the above table it can be obtained that after Db6 wavelet transform function USES the root mean square error of small, QZ value is bigger, that is to say, using Db6 wavelet transform function after the data is more similar to the original data, and represents a more realistic data situation, so we will use the Db6 wavelet function for abnormal data processing of the original data.
3.2. Lateral Deformation Prediction
According to the above method, an appropriate normal model is selected to collect the horizontal movement data of pile top and predict the horizontal movement of other pile tops. The horizontal movement of the pile top may not be collected because of the continuous strengthening and improvement of the protective device during the deformation of the deep foundation pit; the movement capacity of the pile top is constantly limited and the conditions are constantly changing. At an early stage, the movement of the pile head can be more quickly captured, but in the process of moving, big probability will produce abnormal data, leading to inaccurate data. Information provided by the training data will also not be true; the whole will not be able to serve as an effective learning algorithm for the BP neural network, so in the process, data blocks moving faster during the pile head collection should be avoided.
The learning process of the BP neural network is a process of constantly improving its own calculation method. In this process, abnormal data need to be eliminated. It is more effective to use different threshold method to control the accuracy of data, which is why we use a variety of different prediction methods. The Tripe distribution diagram are shown as Figure 4.
It can be clearly seen from the above table that the final average error of the model prediction is 0.31, indicating that the accuracy level of the model is relatively high, and indicating that the prediction results are consistent with the actual results and have high reliability. Data in the table, on the other hand, can clearly show with the extension of testing time, that the relative error of the prediction data also increases; this is because as time goes on, the pile top level moving trend is increasingly small, the data represent an increasingly smooth area, there is a grey prediction error of the data due to gradual accumulation, and the prediction accuracy is increasingly low. The decrease in prediction accuracy will have an impact on the actual project, which needs to be avoided.
In order to improve the prediction accuracy of deep foundation pit deformation, we use the grey GM (1,1) model for data prediction, and extract the data of the previous time period for data training, leaving fewer final data for inspection and finally obtaining the prediction results of BP neural network. Compared with the ordinary grey model, the predicted data processed by BP neural network is more accurate, and the final average error of the predicted data is smaller than that of the ordinary grey model. Therefore, it is necessary to combine BP neural network for data training and projection, which can improve the final prediction accuracy of deep foundation pit deformation, especially for the case of a small number of samples. Linear diagram of error comparison between predicted value and real value are shown as Figure 5.
3.3. Vertical Deformation Prediction
BP neural network prediction uses wavelet transform. Here, early on we use a small amount of data in the wavelet transforms and then the gray model of pile top horizontal displacement is calculated, and of course, this will include abnormal data to remove. Then, the data are finally generated into the training of the BP neural network after a few periods of data testing. The prediction results are evaluated using the above methods, mainly focusing on the one-step relative error and the average relative error. Through comparison, we find the rules and finally summarize them.
It can be clearly observed from the above table that with the passage of time, the relative error did not present a linear change; after a few periods, the relative error is small, but the previous period had large relative error. This also means that using wavelet transform in this way to process data leads to better accuracy; the response of pile top level movement fits better with the actual. Linear diagram of error comparison between predicted value and real value are shown as Figure 6.
Looking at the table, it is found that the predicted results using grey BP neural network after wavelet transformation exceed the actual results, which may be due to the changes caused by the processing of the original data. According to the evaluation results, it can be concluded that the average error of predicting deep foundation pit deformation using only grey BP neural network is larger than that using wavelet transform, which indicates that it is very important to remove abnormal data, and the selection of threshold value needs subjective judgment. The grey BP neural network based on wavelet transform is more suitable for practical applications than the single grey BP neural network. In the process of model calculation, the process should be strictly limited in order to be rigorous, and the powerful simplification and calculation function of the model should be fully explored.
In addition, the combined model combines a variety of optimization calculation methods and improves the traditional model. The improved model not only has different trajectories and application range, but is also more perfect and can be used under complex conditions. Therefore, the combined model is a reliable tool in the field of civil engineering prediction, and its use significantly improves the prediction accuracy. In order to improve the stability and reliability of the model, it is suggested to continue to study and explore the optimization methods and application scenarios of the model. Difference comparison diagram of three prediction methods and Comparison of relative errors of three prediction methods are shown as Figure 7 and Figure 8, respectively.
With deeper excavation depth, the change of the horizontal position of the pile top will gradually appear. However, the rate of change is always slow. Under the condition of continuous foundation pit change, the maintenance and support system is also improving. Through effective control, the foundation pit supporting system can stabilize the pile top and controlling its moving speed will not exceed the range of use. This once again proves the importance of a deep foundation pit supporting system in engineering practice. In addition to ensuring the stability of pile top, it can also ensure the continuous and stable operation of the foundation pit.
4. Conclusions
Prediction of foundation pit deformation is a very important part of construction engineering, which plays an important role in ensuring project safety, improving project quality, and reducing project costs. Therefore, research on predictive models is also very important. In past research, we conducted a literature review on different methods for predicting excavation deformation and found that traditional prediction methods have some problems, such as low accuracy, which affect the effectiveness of the model in practical engineering applications.
To this end, we adopted an improved combination model to improve the accuracy and reliability of the prediction model. This combination model adopts the abnormal data removal method and threshold method of wavelet transform, combined with technical means such as grey model and BP neural network to establish a prediction model. Through experimental verification of the combined model, we found that its average error reached 0.31, which is significantly better than traditional models.
Although the combined model is relatively conservative in predicting vertical deformation, it has a good effect on ensuring the safety of the project. However, it should be noted that we did not consider the impact of other factors on the model during the modeling process. Due to the many limitations of these factors, we are not yet clear about their impact on the model. Therefore, future research needs to clarify the impact principles of these factors, explore key areas, and improve our research to obtain more accurate prediction models.
Author Contributions
Conceptualization, X.O. and J.N.; methodology, J.N.; writing—original draft preparation, X.O., J.N. and X.X. All authors have read and agreed to the published version of the manuscript.
Funding
This research received no external funding.
Data Availability Statement
The basic data supporting the research results are all in the article.
Conflicts of Interest
The authors declare that they have no known competing financial interest or personal relationships that could have appeared to influence the work reported in this paper.
References
- Liu, Q.; Yang, C.Y.; Lin, L. Deformation Prediction of a Deep Foundation Pit Based on the Combination Model of Wavelet Transform and Gray BP Neural Network. Math. Probl. Eng. 2021, 2021, 2161254. [Google Scholar] [CrossRef]
- Yang, X.H.; Wu, F.W.; Chen, T.; Liu, X. Analysis of monitoring results of a deep foundation pit with pile-anchor retaining structure. In Applied Mechanics and Materials; Trans Tech Publications Ltd.: Wollerau, Switzerland, 2014; Volume 580, pp. 28–33. [Google Scholar]
- Song, D.; Chen, Z.; Dong, L.; Tang, G.; Zhang, K.; Wang, H. Monitoring analysis of influence of extra-large complex deep foundation pit on adjacent environment: A case study of Zhengzhou City, China. Geomat. Nat. Hazards Risk 2020, 11, 2036–2057. [Google Scholar] [CrossRef]
- Ma, S.; Fu, X.; Lu, H.; Huang, Z.; Zhang, J. A combined support method of isolation pile and diaphragm wall for protection of buildings adjacent to deep foundation pit. Arab. J. Geosci. 2021, 14, 2005. [Google Scholar] [CrossRef]
- Feng, T.; Wang, C.; Zhang, J.; Zhou, K.; Qiao, G. Prediction of stratum deformation during the excavation of a foundation pit in composite formation based on the artificial bee colony–back-propagation model. Eng. Optim. 2022, 54, 1217–1235. [Google Scholar] [CrossRef]
- Esmaeili-Falak, M.; Benemaran, R.S. Ensemble deep learning-based models to predict the resilient modulus of modified base materials subjected to wet-dry cycles. Geomech. Eng. 2023, 32, 583–600. [Google Scholar]
- Lijuan, L. Prediction of subsidence deformation of subway project by improved markov chain and optimized wavelet neural network model. In IOP Conference Series: Earth and Environmental Science; IOP Publishing: Bristol, UK, 2020; Volume 513, p. 012066. [Google Scholar]
- Zhang, J.; Li, P.; Yin, X.; Wang, S.; Zhu, Y. Back Analysis of Surrounding Rock Parameters in Pingdingshan Mine Based on BP Neural Network Integrated Mind Evolutionary Algorithm. Mathematics 2022, 10, 1746. [Google Scholar] [CrossRef]
- Wang, H.; She, H.; Xu, J.; Liang, L. A three-point hyperbolic combination model for the settlement prediction of subgrade filled with construction and demolition waste. Materials 2020, 13, 1959. [Google Scholar] [CrossRef] [Green Version]
- Huang, M.Q.; Zhou, L.; Qi, L.X.; Huang, H.Y.; Tang, M.Y.; Shi, Y.J. Multi-Factor Building Deformation Analysis and Prediction Model Based on Multi-Source Date. The International Archives of Photogrammetry. Remote Sens. Spat. Inf. Sci. 2020, 42, 193–198. [Google Scholar]
- Ma, Q.; Liu, S.; Fan, X.; Chai, C.; Wang, Y.; Yang, K. A time series prediction model of foundation pit deformation based on empirical wavelet transform and NARX network. Mathematics 2020, 8, 1535. [Google Scholar] [CrossRef]
- Niu, T.; Zhang, L.; Zhang, B.; Li, B.; Zhang, B.; Wang, W. PSO-Markov residual correction method based on Verhulst-Fourier prediction model. Syst. Sci. Control Eng. 2021, 9, 32–43. [Google Scholar] [CrossRef]
- Lu, F.; Zeng, H. Application of Kalman filter model in the landslide deformation forecast. Sci. Rep. 2020, 10, 1028. [Google Scholar] [CrossRef] [Green Version]
- Li, L.; Hou, G.; Quan, X.; Yang, Y.; Ma, X.; Liu, W. A Forecasting Framework Based on GM (1, 1) Model and Long Short-Term Memory Network. J. Grey Syst. 2020, 32, 78–89. [Google Scholar]
- Miao, F.; Wu, Y.; Xie, Y.; Li, Y. Prediction of landslide displacement with step-like behavior based on multialgorithm optimization and a support vector regression model. Landslides 2018, 15, 475–488. [Google Scholar] [CrossRef]
- Chen, X.; Xu, J.L.; Sun, R.S. Improved GM-SVR combined prediction model of pavement skid resistance condition based on finite data. J. Phys. Conf. Ser. 2021, 2044, 012111. [Google Scholar] [CrossRef]
- Diao, W. Network Security Situation Forecast Model Based on Neural Network Algorithm Development and Verification. In Proceedings of the 2021 IEEE 4th International Conference on Automation, Electronics and Electrical Engineering (AUTEEE), Shenyang, China, 19–21 November 2021; IEEE: Piscataway, NJ, USA, 2021; pp. 462–465. [Google Scholar]
- Yuan, S. High-Rise Building Deformation Monitoring Based on Remote Wireless Sensor Network. IEEE Sens. J. 2021, 21, 25133–25141. [Google Scholar] [CrossRef]
- Zhu, Y.; Gao, Y.; Wang, Z.; Cao, G.; Wang, R.; Lu, S.; Li, W.; Nie, W.; Zhang, Z. A Tailings Dam Long-Term Deformation Prediction Method Based on Empirical Mode Decomposition and LSTM Model Combined with Attention Mechanism. Water 2022, 14, 1229. [Google Scholar] [CrossRef]
- Intrieri, E.; Carlà, T.; Gigli, G. Forecasting the time of failure of landslides at slope-scale: A literature review. Earth-Sci. Rev. 2019, 193, 333–349. [Google Scholar] [CrossRef]
- Liu, C.; Wang, Y.; Hu, X.; Han, Y.; Zhang, X.; Du, L. Application of GA-BP neural network optimized by Grey Verhulst model around settlement prediction of foundation pit. Geofluids 2021, 2021, 5595277. [Google Scholar] [CrossRef]
- Hu, Y.B.; Shao, F.; Huang, Y.X.; Liu, Y.W.; Liang, J.J. Application of BP-ARMA Combined Model based on Entropy Method in the Prediction of Circle Beam Displacement of Foundation Pit. Appl. Mech. Mater. 2015, 697, 530–534. [Google Scholar] [CrossRef]
- Jia, G.; Cai, M.; Du, B.; Li, R.; Shi, Y. Research on RBF neural network prediction of oil and gas pipe dent depth. In Proceedings of the 2016 IEEE International Conference on Aircraft Utility Systems (AUS), Beijing, China, 10–12 October 2016; IEEE: Piscataway, NJ, USA, 2016; pp. 335–339. [Google Scholar]
- Zhang, G.H.; Jiao, Y.Y.; Chen, L.B.; Wang, H.; Li, S.C. Analytical model for assessing collapse risk during mountain tunnel construction. Can. Geotech. J. 2015, 53, 326–342. [Google Scholar] [CrossRef]
- Li, T.; Li, Y.; Yang, X. Rock burst prediction based on genetic algorithms and extreme learning machine. J. Cent. South Univ. 2017, 24, 2105–2113. [Google Scholar] [CrossRef]
- Zhao, S.L.; Zhang, G.; Li, M.X.; Ren, Q.G. The Feature of Deformation at Convex Corner of Deep Foundation Pit Based on FLAC3D. IETI Trans. Comput. 2016, 2, 1–9. [Google Scholar]
- Zhou, Y.; Yao, A.; Zheng, X.; Li, H. A Model Test Study of Double-row Piles in Deep Foundation Pit Excavation. Electron. J. Geotech. Eng. 2016, 21, 1701–1714. [Google Scholar]
Figure 1.
Development process of deformation prediction for foundation pits.

Figure 2.
Spatial component partition process diagram.

Figure 4.
Triple distribution diagram.

Figure 5.
Linear diagram of error comparison between predicted value and real value.

Figure 6.
Linear diagram of error comparison between predicted value and real value.

Figure 7.
Difference comparison diagram of three prediction methods.

Figure 8.
Comparison of relative errors of three prediction methods.

Disclaimer/Publisher’s Note: The statements, opinions and data contained in all publications are solely those of the individual author(s) and contributor(s) and not of MDPI and/or the editor(s). MDPI and/or the editor(s) disclaim responsibility for any injury to people or property resulting from any ideas, methods, instructions or products referred to in the content. |
© 2023 by the authors. Licensee MDPI, Basel, Switzerland. This article is an open access article distributed under the terms and conditions of the Creative Commons Attribution (CC BY) license (https://creativecommons.org/licenses/by/4.0/).
Share and Cite
MDPI and ACS Style
Ouyang, X.; Nie, J.; Xiao, X. Study of Improved Grey BP (Back Propagation) Neural Network Combination Model for Predicting Deformation in Foundation Pits. Buildings 2023, 13, 1682. https://0-doi-org.brum.beds.ac.uk/10.3390/buildings13071682
AMA Style
Ouyang X, Nie J, Xiao X. Study of Improved Grey BP (Back Propagation) Neural Network Combination Model for Predicting Deformation in Foundation Pits. Buildings. 2023; 13(7):1682. https://0-doi-org.brum.beds.ac.uk/10.3390/buildings13071682
Chicago/Turabian StyleOuyang, Xu, Jianwei Nie, and Xian Xiao. 2023. "Study of Improved Grey BP (Back Propagation) Neural Network Combination Model for Predicting Deformation in Foundation Pits" Buildings 13, no. 7: 1682. https://0-doi-org.brum.beds.ac.uk/10.3390/buildings13071682
Note that from the first issue of 2016, this journal uses article numbers instead of page numbers. See further details here.