
Strategies on Uniformity Lighting in Office Space under Energy-Saving Environment

1
Department of Architecture, National United University, Miaoli 360301, Taiwan
2
Department of Architecture, National Taipei University of Technology, Taipei 106344, Taiwan
*
Author to whom correspondence should be addressed.
Buildings 2023, 13(7), 1797; https://0-doi-org.brum.beds.ac.uk/10.3390/buildings13071797
Submission received: 16 June 2023
/
Revised: 3 July 2023
/
Accepted: 12 July 2023
/
Published: 14 July 2023
(This article belongs to the Special Issue Built Environment, Energy and Health)
Abstract
:In this study, our focus was on exploring the changing illuminance of work surfaces in different ambient uniformity spaces in the office, with a specific emphasis on sustainability and energy-saving considerations. To investigate this, we conducted a comprehensive study in a laboratory setting that replicated an office environment. The study involved the participation of 20 adults as subjects. The findings of our study revealed a strong correlation between the uniformity of ambient lighting illuminance within the indoor space and the illuminance levels observed specifically at the task plane. Notably, when the surrounding illuminance exhibited uniformity, we observed a significant reduction in the EH as adjusted by participants during VDT operation. Interestingly, the task illuminance adjusted by the subjects was lower than the usual standard. However, we did not find any significant correlation between the uniformity of indoor ambient lighting illuminance and the appropriate VDT screen luminance. In situations where energy-saving measures are required, it is crucial to maintain an even luminance in the surrounding space to ensure that the minimum lighting level in the office is upheld. Future discussions should delve into task-ambient lighting models, exploring beyond task illuminance standards alone.
1. Introduction
After the Paris Agreement was signed by almost every country, the world began to focus on climate change and ESG-related policies in the context of sustainability. However, the conflict between Russia and Ukraine in 2022 triggered a European energy crisis, resulting in significant power shortages across the continent and affecting energy costs worldwide. Therefore, how to reduce energy consumption in office buildings while maintaining a healthy environment is a very important issue now.
The majority of individuals spend approximately 90% of their lives indoors. According to the IEA, the energy consumption for buildings accounts for nearly thirty to forty percent of energy consumption. The energy consumption of office buildings in Taiwan is shown in Figure 1 [1,2,3].
As a result, energy-saving initiatives in buildings have primarily focused on air-conditioning and lighting equipment. Creating a favorable indoor environment is crucial for preserving human health and comfort. Extensive research has demonstrated the significant influence of the environment’s quality on human life [4,5,6,7,8]. With advances in lighting technology, the scope of the lighting environment has expanded beyond the effects of artificial interior lighting to include the effects of lighting on satisfaction and comfort.
When assessing the quality of indoor lighting environments, multiple parameters can be used. However, in practical applications, illuminance is considered a fundamental and essential metric for estimating the satisfaction, comfort, and ergonomics of the lighting environment. It plays a vital role in ensuring the visibility of visual objects and overall visual comfort. International standards such as ISO 8995:2002(E) [9] and regional lighting design standards, such as those in Europe and Japan, provide guidelines for illuminance levels in office task areas. These standards establish minimum illuminance levels based on a balance of visual ergonomics and practical experience. Typically, a reference illuminance of 500 lux is recommended for office task areas. However, research has shown that the demand for illuminance in task areas often exceeds these standards, especially during high-intensity mental work conducted over short periods [10,11,12]. The European indoor lighting standard as UNE-EN 12464-1-2012 [13] recommends that the reference illuminance of office task areas is 500 lux. The Japanese lighting design standard as JISZ9110:2010 [14] requires general office illuminance to be within the range of 500–750 lux. Studies have demonstrated that higher illuminance levels can positively impact attention levels, concentration, and task performance. For instance, research by Grünberger et al. [15] indicated that subjects exhibited significantly higher attention levels at an illuminance of 2500 lux compared to 500 lux. Similarly, Tanabe’s findings suggested that an environment with 800 lux was less likely to induce visual fatigue compared to a setting with only 3 lux [16]. These studies suggest that higher illuminance levels may be beneficial for tasks requiring intense concentration or attention, potentially reducing eye fatigue and enhancing overall comfort. However, there is limited research available on the relationship between low horizontal illuminance, uniformity, and energy shortage situations. Further investigations in this area are warranted.
On the other hand, it is important to consider the demands of the task when designing an office lighting system. For tasks that require high levels of concentration or attention, it may be necessary to provide higher illuminance levels than the minimum standards. This can help to improve productivity and reduce eye fatigue. In contemporary office environments, users’ activities have shifted from traditional paper-based tasks such as reading and writing to computer-centric activities involving a visual display terminal (VDT) [17]. When working on VDTs, the employee’s focus is no longer primarily on the task surface, as the reliance on paper documents or drawing has been largely replaced by VDT work. Consequently, the employee’s personal task space is predominantly oriented vertically, with the computer screen serving as the primary source of illumination. Thus, a significant portion of the light reaching the eyes originates from the luminosity of the computer monitor, the ambient lighting in the space, and the reflection from the task surface. Therefore, considering the impact of appropriate lighting on work efficiency becomes crucial in modern office environments.
However, very few studies have discussed the relationship between the task-ambient lighting environment and VDT in office space, especially in a power-saving or power shortage situation. Previous studies have only addressed to a limited extent the impact of low illumination on power saving in office environments. Lin et al. reported that participants were satisfied with a desk horizontal illuminance of 246 lux in power shortage situations, whereas the illuminance is usually adjusted to 500 lux under normal conditions. Thus, energy consumption can be reduced by approximately 50% with such an adjustment. In brighter environments, the task illuminance can be lowered, whereas in darker environments, the illuminance of the task plant must be added [18]. In 2013, Ko et al. developed a brightness formula that discussed the ambient luminance of uniformity and magnitude of luminance in space to describe brightness [19].
There is a scarcity of research conducted in Taiwan regarding the relationship between the uniformity of the ambient lighting space, illuminance of the task plant (EH), vertical illuminance (EV), and the luminance of the computer monitor in VDT. This study aims to develop a lighting control plan for VDT employees in sustainable and net-zero emission office buildings. The plan focuses on achieving a min. allowable horizontal illuminance (EH,min), appropriate horizontal illuminance (EH,app) under different levels of uniformity in ambient lighting space, and the corresponding luminance uniformity (expressed as luminance standard deviation, LSD). To simulate an office environment, a full-scale laboratory facility free from significant sunlight was utilized, and five distinct ambient luminance conditions were implemented at the subjects’ eye positions to represent a varying surrounding lighting environment.
A total of twenty adult participants with physical and mental health were recruited to measure the EH. All participants were provided with detailed information regarding the process of this experiment and precautions, and they all signed the informed consent form voluntarily. In order to enhance the steadiness and dependable experimental findings, participants were instructed to prioritize sufficient sleep, maintain regular eating habits, and avoid significant mood fluctuations prior to the experiment. They were strictly prohibited from consuming any neurological medications. Furthermore, participants were required to abstain from consuming alcohol, coffee, and other stimulating beverages for at least 12 h before the test, as well as refraining from smoking for a minimum of 8 h [20,21,22].
This paper aims to provide an in-depth lighting control plan for general office workers using visual display terminals (VDTs) during power shortage situations. The plan covers the EH,min, EH,app, EV, and the corresponding uniformity of surrounding luminance space (LSD). In order to accomplish the purpose of the experiment, a real space was used to simulate the office environment without windows and sunlight. Five distinct levels of uniformity in luminance space, determined by the standard deviation of luminance (LSD), were selected to represent different surrounding lighting space. Twenty adults without vision disabilities participated as subjects in assessing EH on a task plant. In the dimming and computer monitor luminance adjustment experiment, users were instructed to modify the EH,min and EH,app level by adjusting the horizontal work surface illuminance and computer monitor luminance. Furthermore, this study gathered experimental data, conducted correlation and regression analyses, and elucidated the relationship between the optimal uniformity range of the surrounding light space and the level of illumination required for the task. The study exhibits particular innovation in two aspects:
- This study focuses on establishing the EH,min level for a VDT employee in Taiwan, providing a possible suggestion for reducing energy consumption in the office lighting environment.
- This study explores the interaction between ambient lighting and work surface lighting with the aim of establishing energy-efficient lighting environments.
2. Methodology
2.1. Overview
The objective of this experiment was to conduct a lighting control experiment in a real office setting, specifically focusing on different uniformity of office space with VDT work. The experiment involved participants performing a task that involved dimming the lights, utilizing both surrounding lighting and task plant lighting. The ambient lighting comprised five fixed modules, while the work surface lighting consisted of a single module. Participants were given the freedom to adjust the illuminance level of the work surface lighting within a range of 0 to 750 lux, based on their preferences. The entire desk surface was designated as the task area, and participants were tasked with performing VDT work. Throughout the experiment, the uniformity of the ambient lighting condition was fixed, and participants were instructed to adjust the task illuminance of the work surface in two models: the EH,min model and EH,app model. In addition to this, vertical illuminance at the participants’ eye positions and horizontal illuminance on the work surface were measured. A flowchart outlining the study, along with specific details of the experiment, is depicted in Figure 2 [20].
2.2. Field Study
The full-scale experimental room used to conduct each independent variable experiment in this study was a windowless and sunlight-free room. Linear tube LED lights were used to adjust the surrounding lighting environment, and accessible to the experimenter. The details of the lighting are detailed in Table 1.
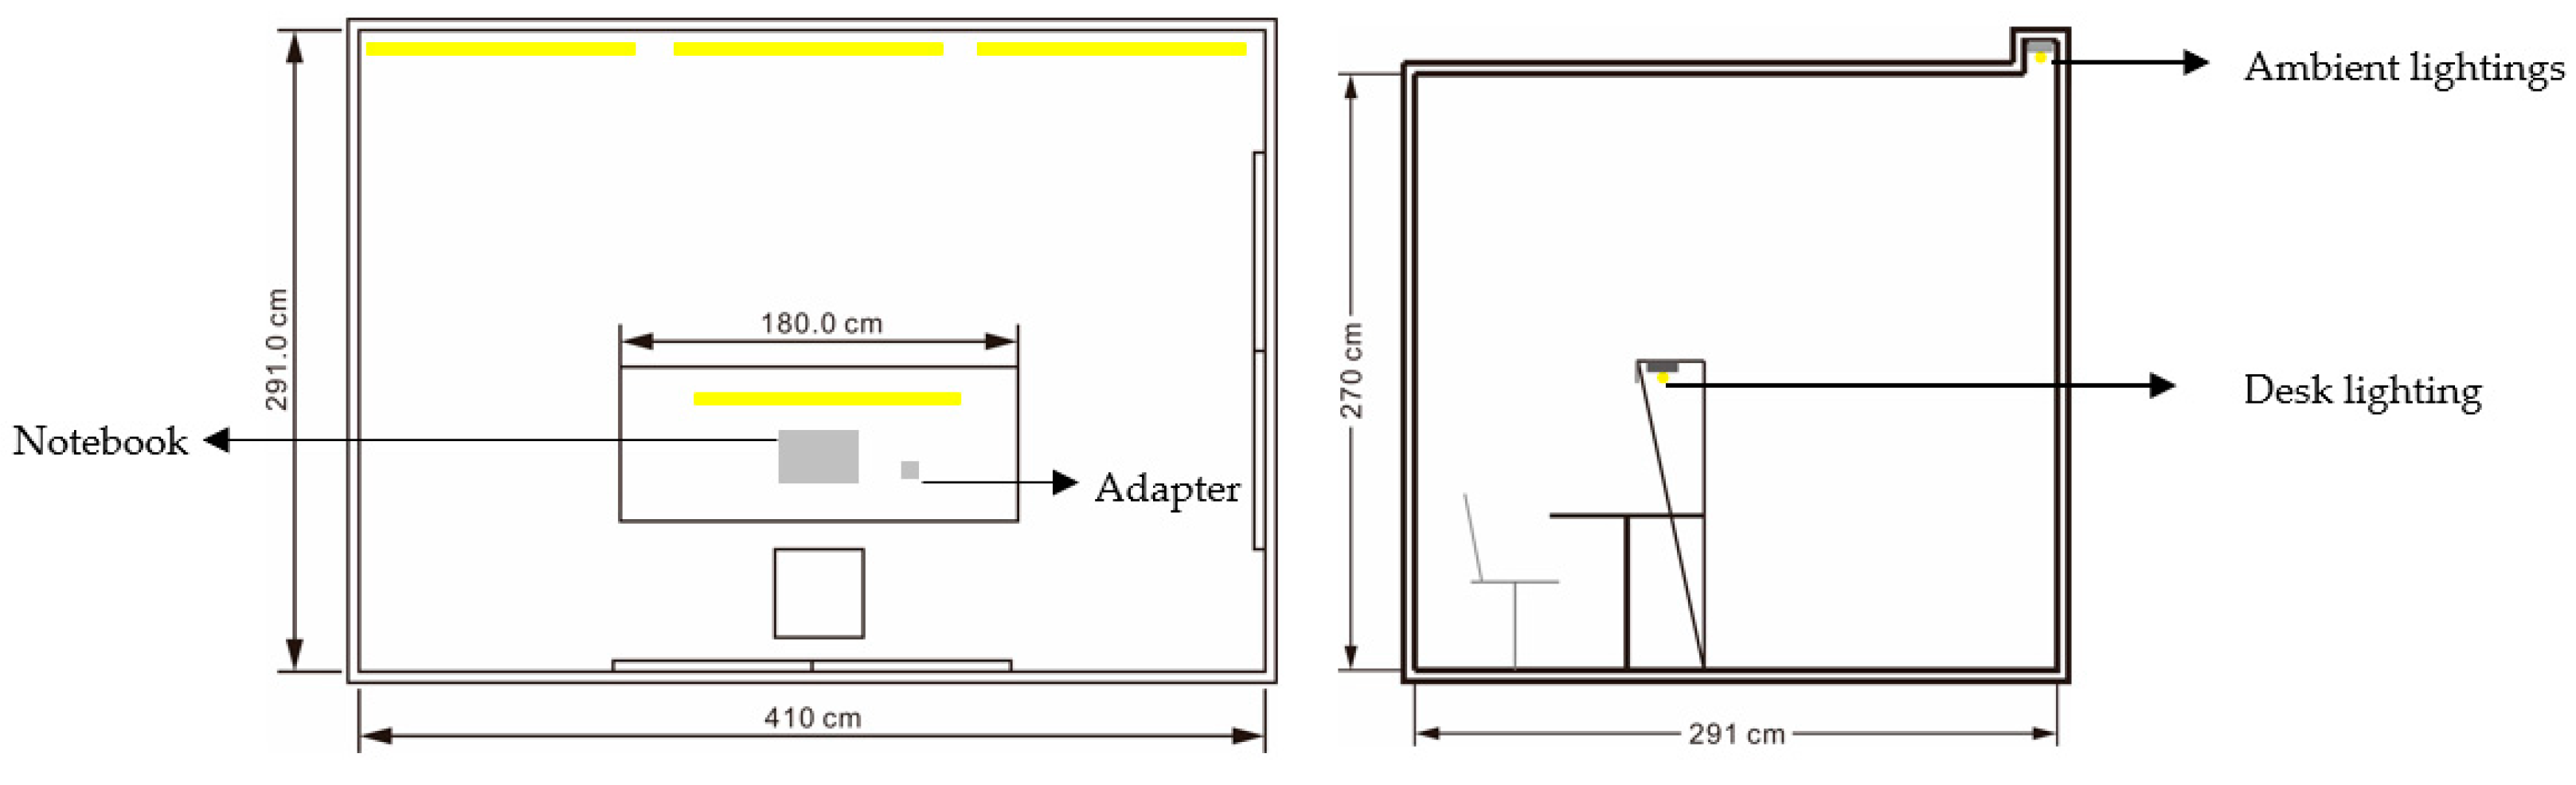
Ceiling-mounted ambient lighting fixtures were strategically positioned in front of the desk area. These fixtures were equipped with linear tube LED lights (Maker and Product model: Endo ERK9708W) and had the ability to adjust their power output from 5% to 100%. The researcher had control over this adjustment through an adapter. To ensure that the subjects were not directly influenced by the light, the ambient lighting fixtures were concealed within the ceiling, as depicted in Figure 3. Similarly, the task lighting system resembled the surrounding lighting setup, with an adapter conveniently put on the table within reach of the subjects’ hands.
2.3. Measurement
2.3.1. The Measurement of Illuminance on the Task Plane
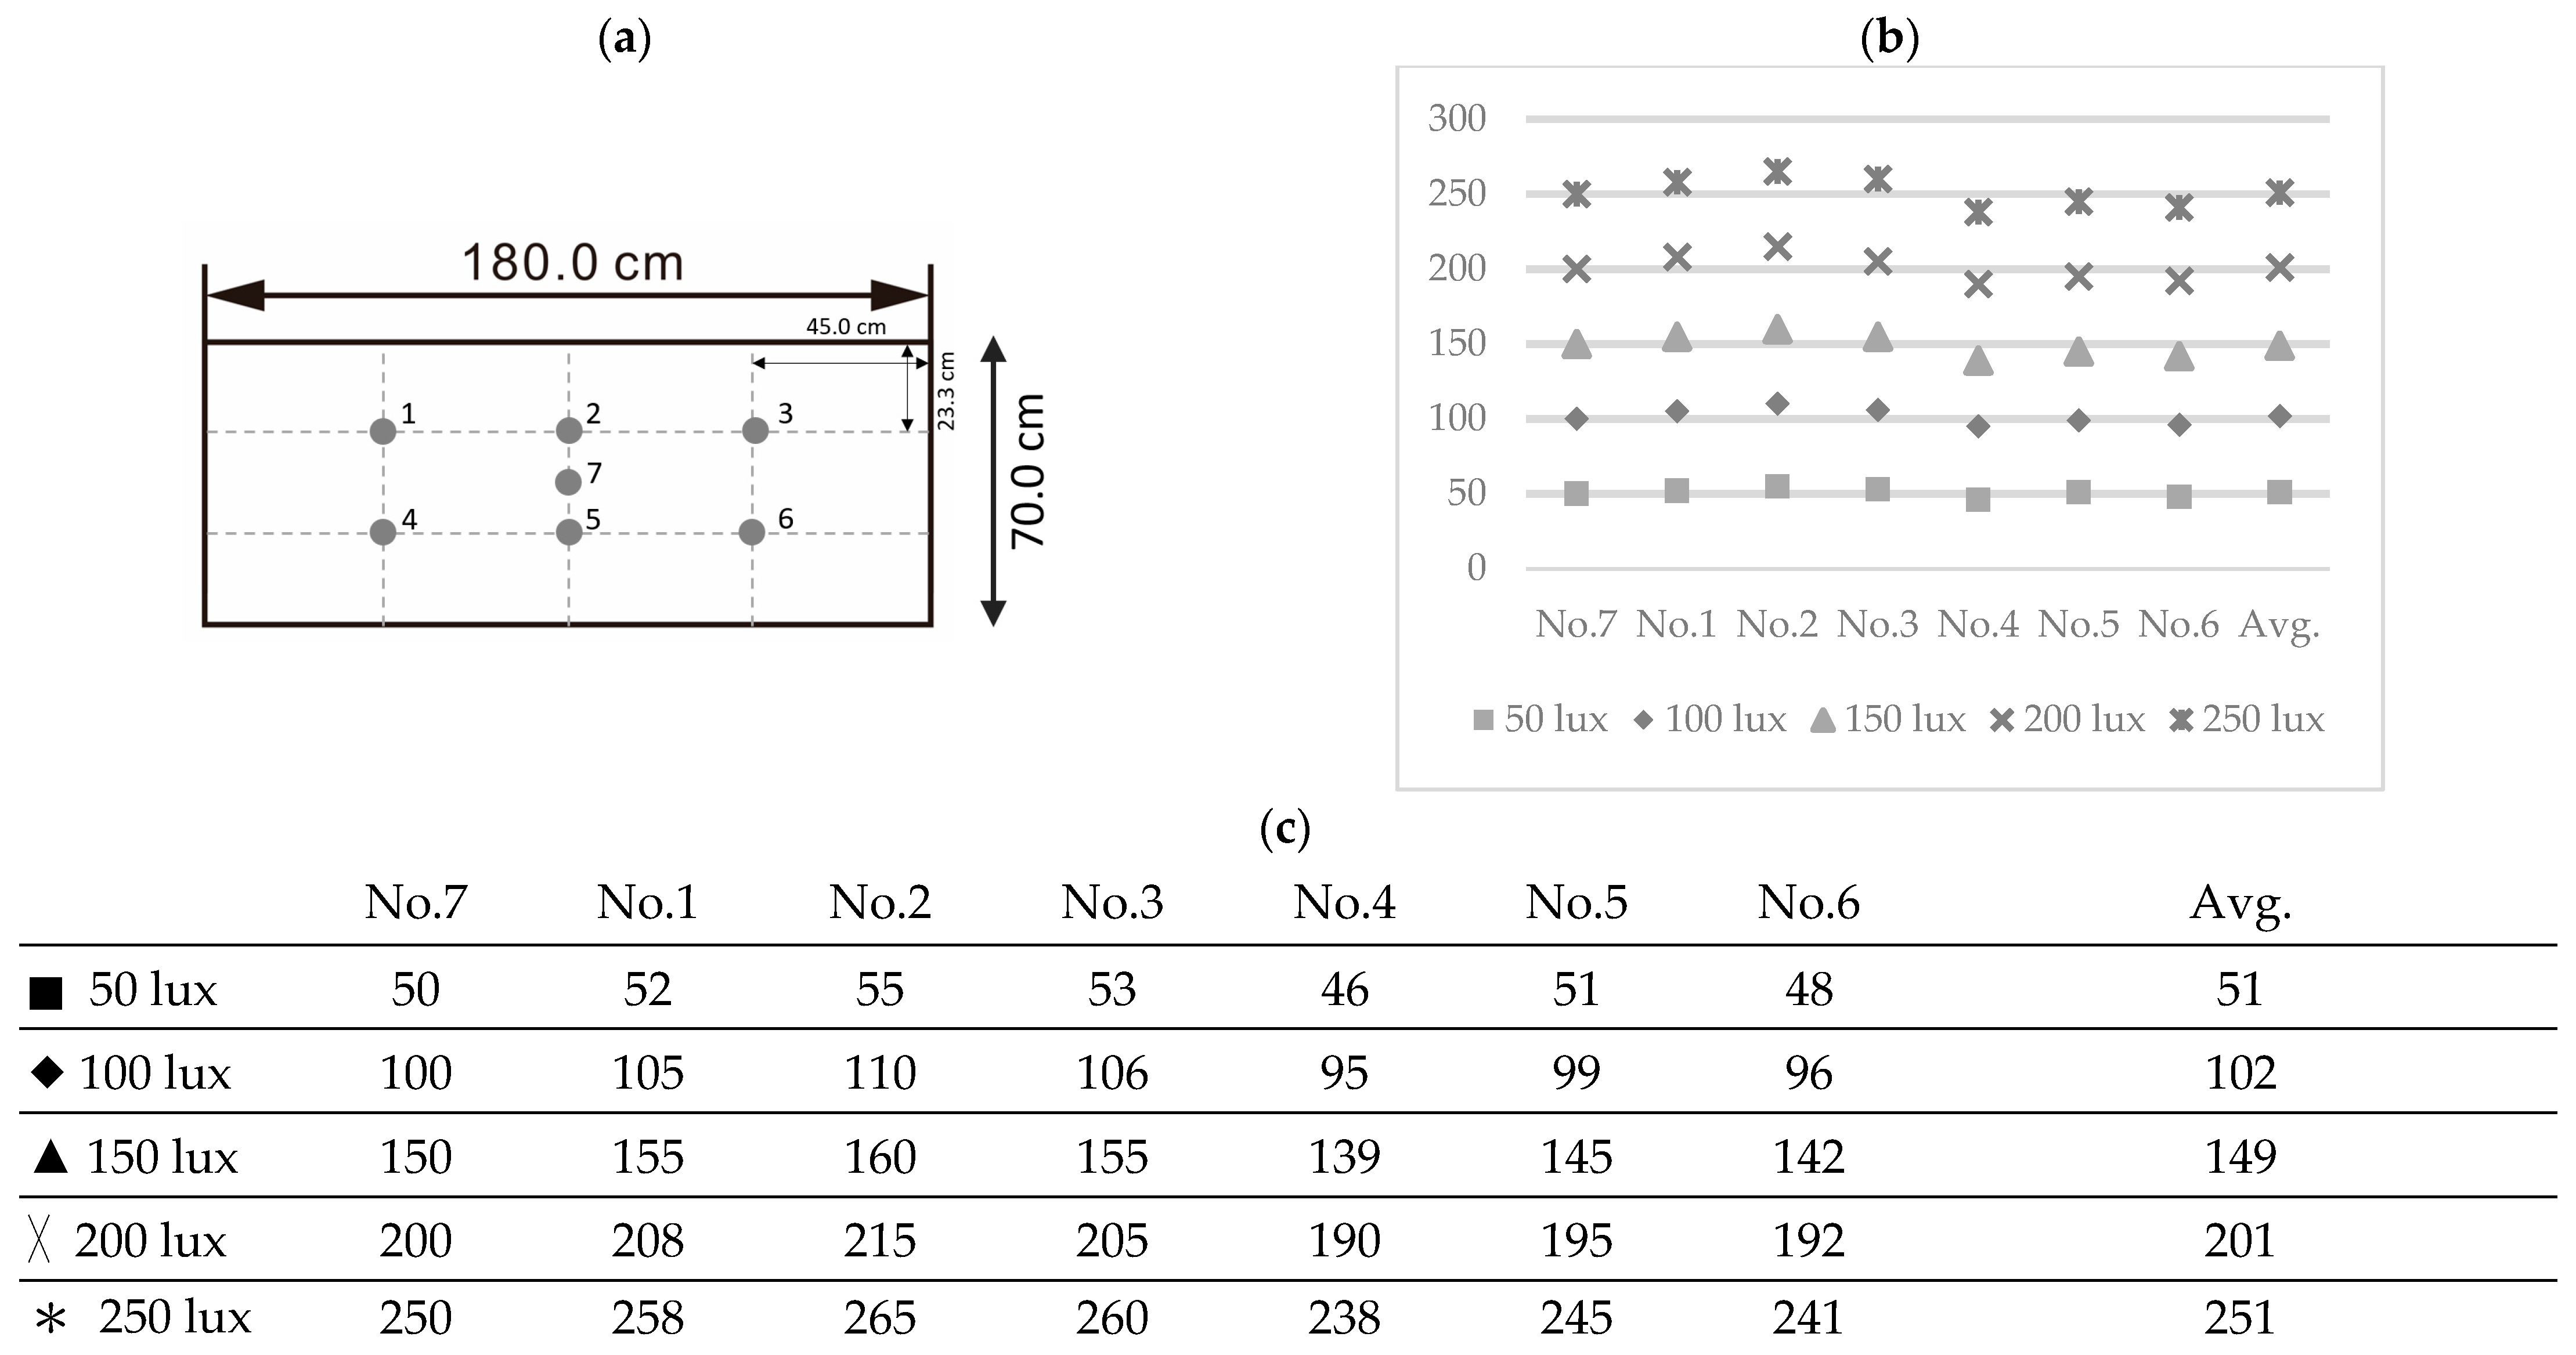
The illuminance on the desk was measured using a Konica Minolta T-10 (Minolta, Osaka, Japan) illuminance meter at 7 different points, as shown in Figure 4. The center on this task plane is Point No. 7, which was the position of the VDT mouse, keyboard, and document area in a general office space. The adapter was set on the subject’s right-hand side in Point No. 6. To ensure the HI on the task plane was even, the illuminance on Point No. 7 was set from 50 lux to 250 lux using the adapter and measured the illuminance for Point No. 1 to No. 6 by an illuminance meter. The average illuminance values of the other 6 points were very close to that of point No. 7. As the task lighting was in the form of a line with a uniform luminous intensity distribution curve, the HI of point No. 7 was used as representative in this study. The level of vertical illuminance was assessed at the height of the subject’s eyes, which positioned at 120 cm from the ground.
2.3.2. VDT Monitor Brightness Measurement
The luminance of the VDT monitor was measured by the VESA FPDM standard, using the TOPCON BM-910D (TOPCON, Tokyo, Japan) to be a luminance meter to measure 9 points on the screen and averaging the values, as illustrated in Table 2.
2.3.3. Ambient Luminance Distribution
To capture the ambient luminance image, a digital luminance camera manufactured by KKE (KOZO KEIKAKU ENGINEERING Inc., Tokyo, Japan) was used. This camera with a fisheye lens had a horizontal angle of 103.6° for both right and left sides, while the vertical angle was 75.5° for the upper and lower sides. Positioned at a height of 120 cm from the floor, the luminance camera was aligned with the subject’s eye level. This setup aimed to depict the distribution of luminance in the ambient lighting space. The resulting captured image provided valuable information regarding the average luminance of the area and the uniformity of luminance throughout it [23,24,25] (See Table 3).
2.4. Experiment Setting
2.4.1. VDT Arrangement
Every subject was instructed to watch the monitor and focus on web news in English displayed on a VDT monitor. The monitor was a fourteen-inch laptop, which allowed for easy adjustment of the TFT-LCD luminance. The monitor screen, with a diagonal measurement of 358 mm, provided a visible viewing range of 311 mm (W) × 175 mm (H). The pixel resolution was set at 1366 (W) × 768 (H) = 1,049,088 pixels. The refreshed frequency was sixty Hz. The TFT-LCD had a maximum contrast ratio and maximum luminance that could be adjusted across 10 levels ranging from 20 to 220 cd/m2. Subjects were able to modify the luminance to a level that felt comfortable to them.
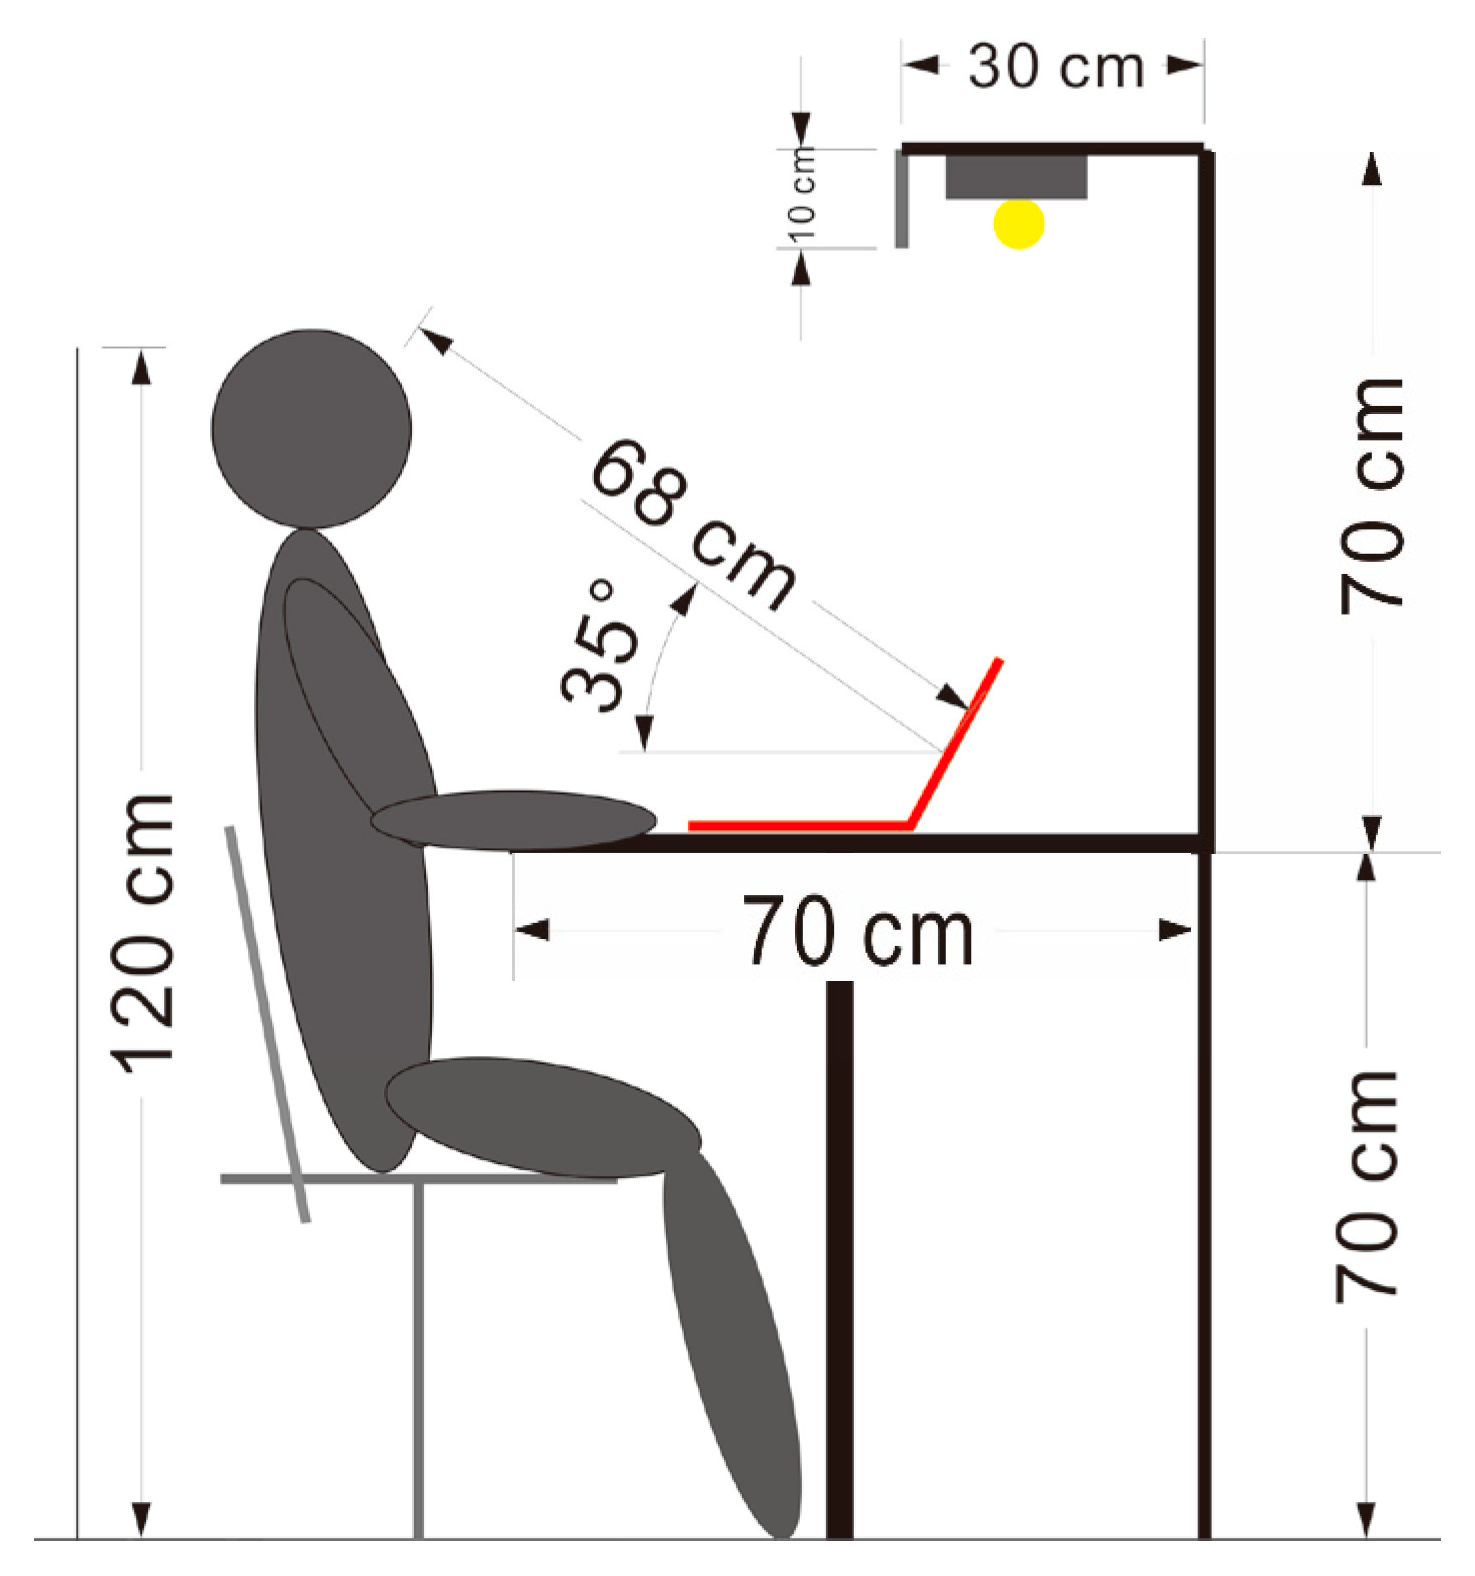
To minimize glare and reflection, the monitor was coated with a polarizer. The recommended guidelines for text size, as outlined in ISO 9241-303:2011 [26], suggest that the VDT user should keep a distance from 50 and 70 cm for healthy vision. Additionally, it is generally recommended that 12 pt text size is sufficient for displaying text on the web and in applications. In accordance with Figure 5, the distance was set at 68 cm between monitor to subjects’ eye and ensured a line of sight of 35° on the monitor.
2.4.2. Explanatory Variable of Experiment
The main objective of this study is to explore the relationship between the uniformity of surrounding lighting and the lighting at the desktop level. To investigate this, we categorized the uniformity of surrounding lighting illuminance into five distinct modules. A luminance camera was utilized to measure and control this experimental variable, as outlined in Table 4. The standard deviation (SD) of luminance was recorded as 10.74, 7.48, 5.88, 4.75, and 2.42. The SD of luminance indicates the level of evenness or diffusion in the subject’s visual perception. These values were considered as independent variables in our study. Meanwhile, we maintained the EH and vertical illuminance (VI) at specific values, aiming for a uniform level of around 15 lux and 23 lux, respectively. Additionally, the average luminance of the surrounding lighting was maintained at 5 cd/m2. These values were treated as control variables in the study.
2.5. Experimental Process
A study was conducted involving twenty participants below the age of 40. These participants had normal physiological conditions, perfect vision, had sufficient sleep, and were not taking any medication on the day preceding the test. The experiment had a duration of approximately 60 min, which included a 30 min dark adaptation phase. Prior to the experiment, the participants received instructions on the experimental procedures and completed a questionnaire. To begin the experiment, the desk lighting on the office table was turned on and adjusted to the EH,min level for each participant. Subsequently, the brightness of the monitor was adjusted to the desired level. Then, to ensure every subject was able to get the EH,app level, they were asked to adjust the lighting on the task plane from 0 lux to the EH,app level. Additionally, they adjusted the luminance of the computer monitor to a suitable setting. After 3 min, the subject asked to adjust the adapter to maximum power to 750 lux. From there, the participants gradually decreased the illuminance to the EH,app level while simultaneously reducing the luminance of the monitor. In the next step, subjects were asked to switch the adapter to a maximum of 750 lux again and down to the EH,min level. They also adjusted the monitor brightness to a comfortable value again. The experiment was terminated after three minutes. For each adjustment, the experimenter recorded the HI on the task plane, VI at the participant’s eye location, and the luminance of the computer monitor. The sequence of independent variables models was used to determine the Latin Square Design method, as depicted in Table 5 [20].
3. Results
3.1. Adjusting the Illuminance in Minimum and Appropriate Horizontal Illuminance Model
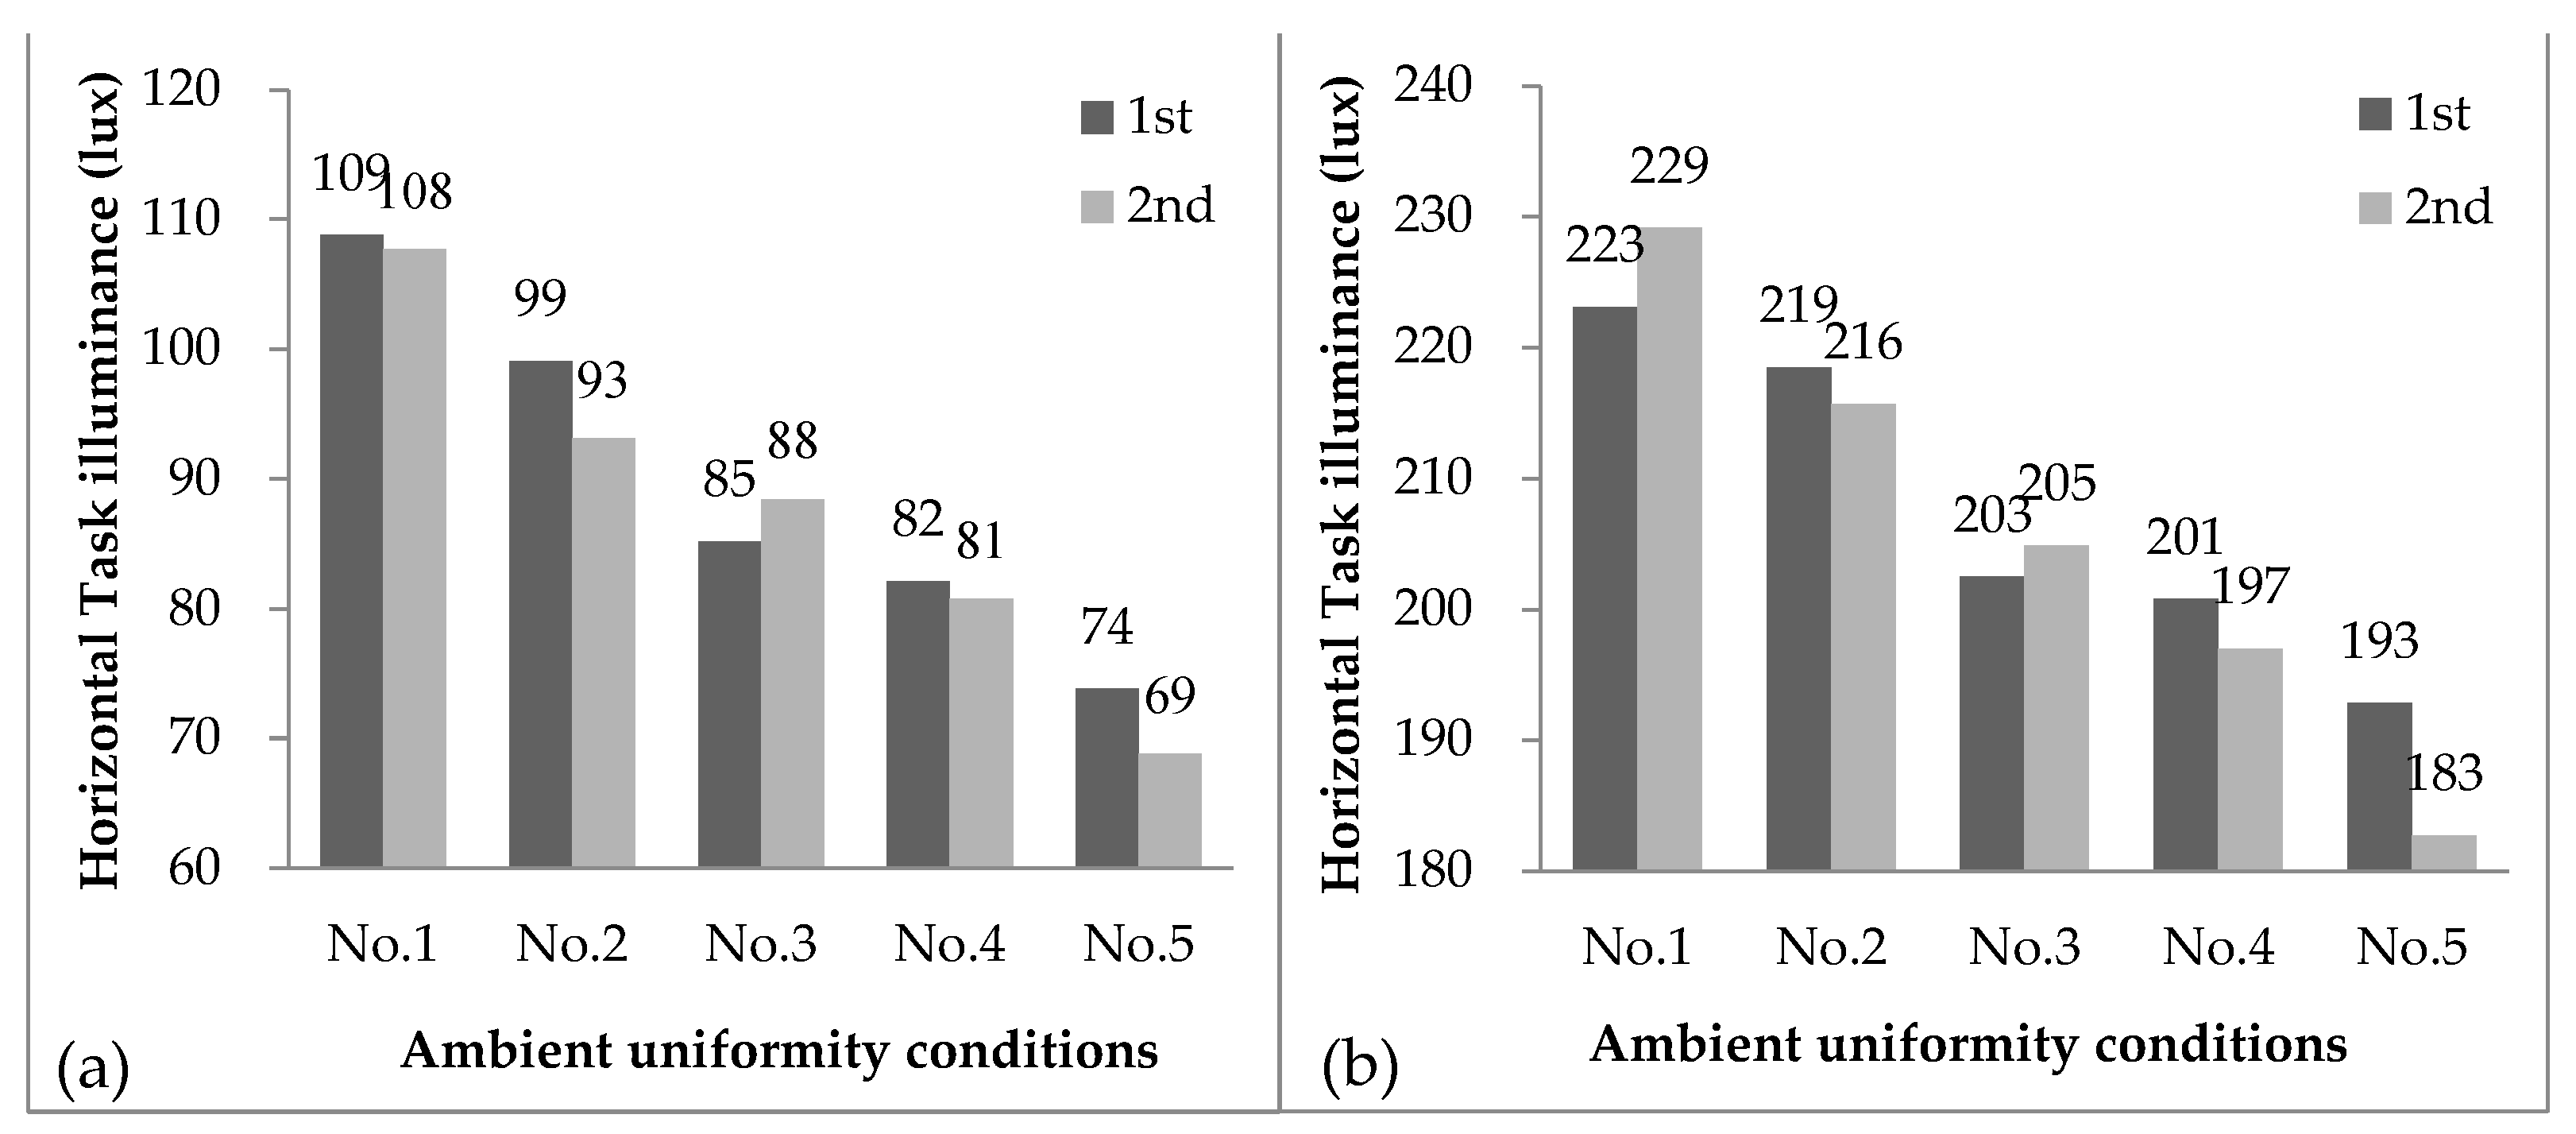
During the experiment, participants were required to make four adjustments to the task illuminance of the working surface. Each participant switched on the desk lighting of the task plane and made the necessary adjustments to achieve the desired task illuminance. The first two adjustments aimed to reach the minimum allowable illuminance level, while the last two adjustments focused on achieving a comfortable and satisfactory illuminance level. According to the statistical analysis, there was no significant difference observed in these two adjustments (p-value = 0.89). The results of the last two illuminance adjustments at appropriate and satisfaction levels were found to be similar to the first two adjustments, as determined by the t-test (p-value = 0.82). The values obtained from these four adjustments are presented in Figure 6.
Accordingly, the EH,min value was no different (p value > 0.05) between two adjustments and the EH,app model was the same; the Emin value and the Eapp value were averaged and compared with the uniformity of the surrounding luminance by a luminance camera, as shown in Figure 7.
The average EH,min across the five modules was measured at 89 lux, which fell below the current UNE-EN 12464-1-2012 and JISZ9110:2010 [13,14] illuminance standard. It was observed that as the luminance uniformity decreased, the minimum tolerable illuminance also decreased. This indicates that when ambient lighting is uneven, the employee needs a higher HI on the task plane. In appropriate modules where the illuminance was relatively comfortable and satisfactory, all participants turned on the task plane lighting and made illuminance adjustments. The average of the EH,app model in five experiment groups of work surfaces was recorded as 207 lux. Each EH,app was also below the recommended CNS standard in the office lighting environment. This suggests that individuals feel comfortable with lower illuminance levels when the ambient lighting is uniform. Likewise, in the experiment involving the appropriate illuminance model, it was observed that as the LSD increased, the EH,app was also increased from 226 to 188 lux. This indicates that people can tolerate lower illuminance levels when they have good visibility in other directions. Furthermore, the study analyzed the horizontal illuminance of the task plane adjusted by twenty participants across the five different modules representing varying levels of surrounding luminance uniformity. It was found that each participant adjusted illuminance values differently in each experiment group, further confirming they were significant according to a t-test (p value < 0.01). As illustrated in Figure 8, a regression analysis was conducted on the illuminance of task lighting adjusted by each subject. The analysis revealed that as the uniformity of surrounding luminance improved, the illuminance on the task plane decreased in the EH,min and EH,app model. Hence, the findings from these two illumination modules were consistent.
3.2. Relationship between Uniformity of Surrounding Luminance and Horizontal Illuminance
This study indicates that the uniformity of surrounding luminance significantly influences the horizontal illuminance value on the task plane for VDT workers in an office environment. This explains that when the surrounding lighting environment is more even, there is a decreased need for high illuminance on the task plane. Consequently, when uniform ambient lighting conditions are established, the employee is likely to choose lower illuminance levels on their task plane. This preference for lower illuminance can result in energy savings and contribute to sustainability efforts. The EH adjustment by 20 participants was analyzed to a linear regression curve, as Figure 7 illustrates. Statistical analyses were performed using IBM SPSS Statistics V28.0.1, and the slope and intercept were statistically analyzed through the least squares method to determine the mean and standard deviation. The values of the slope, constant, and correlation coefficient can be found in Appendix A. The correlation coefficient (R) falls within the range of 0.8 to 1, indicating a strong positive correlation between horizontal illuminance and the uniformity of surrounding luminance. Moreover, the coefficient of determination (R2) surpasses 0.8, indicating that over 80% of the variability in the dependent variable can be explained by the explanatory variable. These findings underscore the significance of considering the uniformity of surrounding luminance when designing office lighting systems. By promoting more uniform ambient lighting, the demand for EH on the task plane can be reduced. This not only contributes to energy savings but also aligns with sustainability goals.
This study explored the relationship between the uniformity of surrounding luminance and task horizontal illuminance, including minimum allowable and satisfactory comfortable models. To maximize energy savings while ensuring a visible lighting environment, the EH,min can be considered as the minimum limit value for workers to perform usual VDT work. According to normal distribution, two standard deviations mean 95% of the parent range. Therefore, the following formula can be obtained and it calculates the EH,min tolerated by 95% of employees in the office space, as it varies with LSD.
EH,min = 5.19 × LSD + 56,
Certainly, the EH level necessary for achieving satisfactory and comfortable conditions on the task plane tends to be brighter than the EH,min value. This higher illuminance requirement results in increased energy consumption. As a result, we propose prioritizing energy savings in lighting systems over solely meeting the lighting demands of the general workforce. To that end, we can develop a formula that takes into account the EH,app, LSD, and the average value representing half of the population. Hence, it is essential to strike a balance between providing adequate lighting conditions for workers’ comfort and satisfaction while optimizing energy efficiency. By deriving a formula that considers EH,app, LSD, and Avg., it becomes possible to assess and implement lighting solutions that meet both the ergonomic needs of the workforce and the goal of reducing energy consumption.
EH,app = 5.57 × LSD + 170,
However, a t-test comparing the coefficients of the minimum and appropriate models yielded a p value of 0.12. Here, linear regression was calculated again using SPSS, and the regression coefficient was 5.38, as shown in Formula (3).
EH = 5.38 × LSD + C, C = constant
In light of the power-shortage scenario and the imperative for energy conservation, Figure 9 presents linear plots that depict the relationship between the illuminance of the EH and the LSD. These plots are correlated using Formulas (1) and (2). The red blocks in Figure 8 represent the unacceptable zone, which is implemented to safeguard the visual health of workers. The green region, on the other hand, represents a suitable lighting environment range. This range corresponds to an illuminance level that ninety-five percent of the population can tolerate, with fifty percent of the population reporting a comfortable VDT work experience within this range. Furthermore, the blue regions in the plot indicate that a very comfortable condition was reported by 50–95% of the population. However, it is worth noting that the zone over the blue line does not align with the requirements for energy savings. It is important to highlight that this study focuses on analyzing the uniformity within the range of 2.4 to 10.74. Consequently, illuminance values below 2.4 and above 10.74 are not discussed within the scope of this study. These findings underscore the significance of considering both the visual health of workers and the goal of energy conservation. By identifying suitable lighting ranges that cater to the comfort and tolerance levels of the majority, while also ensuring energy efficiency, it becomes possible to strike a balance between meeting the needs of the workforce and mitigating power consumption.
3.3. VDT Work Monitor Luminance
In addition to studying the impact of EH on the work surface, this study also discusses the influence of LVDT,app. Figure 10 illustrates the LVDT,app in the minimum and appropriate experiment models. It can be observed that the LVDT,app and the LSD had no relationship. In the minimum model, the average LVDT,app ranged from 117 cd/m2 to 134 cd/m2, while in the appropriate model, it ranged from 137 cd/m2 to 152 cd/m2. According to Paired samples t-test analysis, there is a significant difference between the minimum and the appropriate model for LVDT,app. However, the correlation coefficient analysis illustrated that the correlation between LVDT,app and the LSD was not substantial (coefficient = 0.2, p value = 0.004 < 0.05). On the other hand, there was a significant correlation between LVDT,app and EV, with a correlation coefficient of 50.576 (p value = 0.000 < 0.05).
The brightness of the monitor was adjusted after the subject determined the EH,min and EH,app on the task plane, the EV was also measured at the same time in this study. As shown in Table 6, the Pearson’s correlation coefficient between EV and LVDT,app is −0.37.
Figure 11 presents the matrix depicting the relationship among luminance SD, appropriate VDT screen luminance, and vertical illuminance. The findings reveal a positive correlation between EV and LVDT,app. However, the points representing the LSD of the ambient space and LVDT,app are scattered and form five parallel lines.
Furthermore, to gain a deeper understanding of their correlations, it is important to delve into the analysis of LSD, LVDT,app, and EV. Through one-way ANOVA, as shown in Table 7, it was found that there is a highly significant relationship between LVDT,app and EV (F = 4.94, p value = 0.000 < 0.05). On the other hand, the analysis indicated that there is no significant relationship between the LVDT,app and LSD of the ambient space (F = 0.78, p value = 0.75 > 0.05). These results suggest that vertical illuminance has a notable impact on the LVDT,app, while the uniformity of surrounding space does not influence it significantly. In other words, an increase in EV necessitates a corresponding increase in LVDT,app.
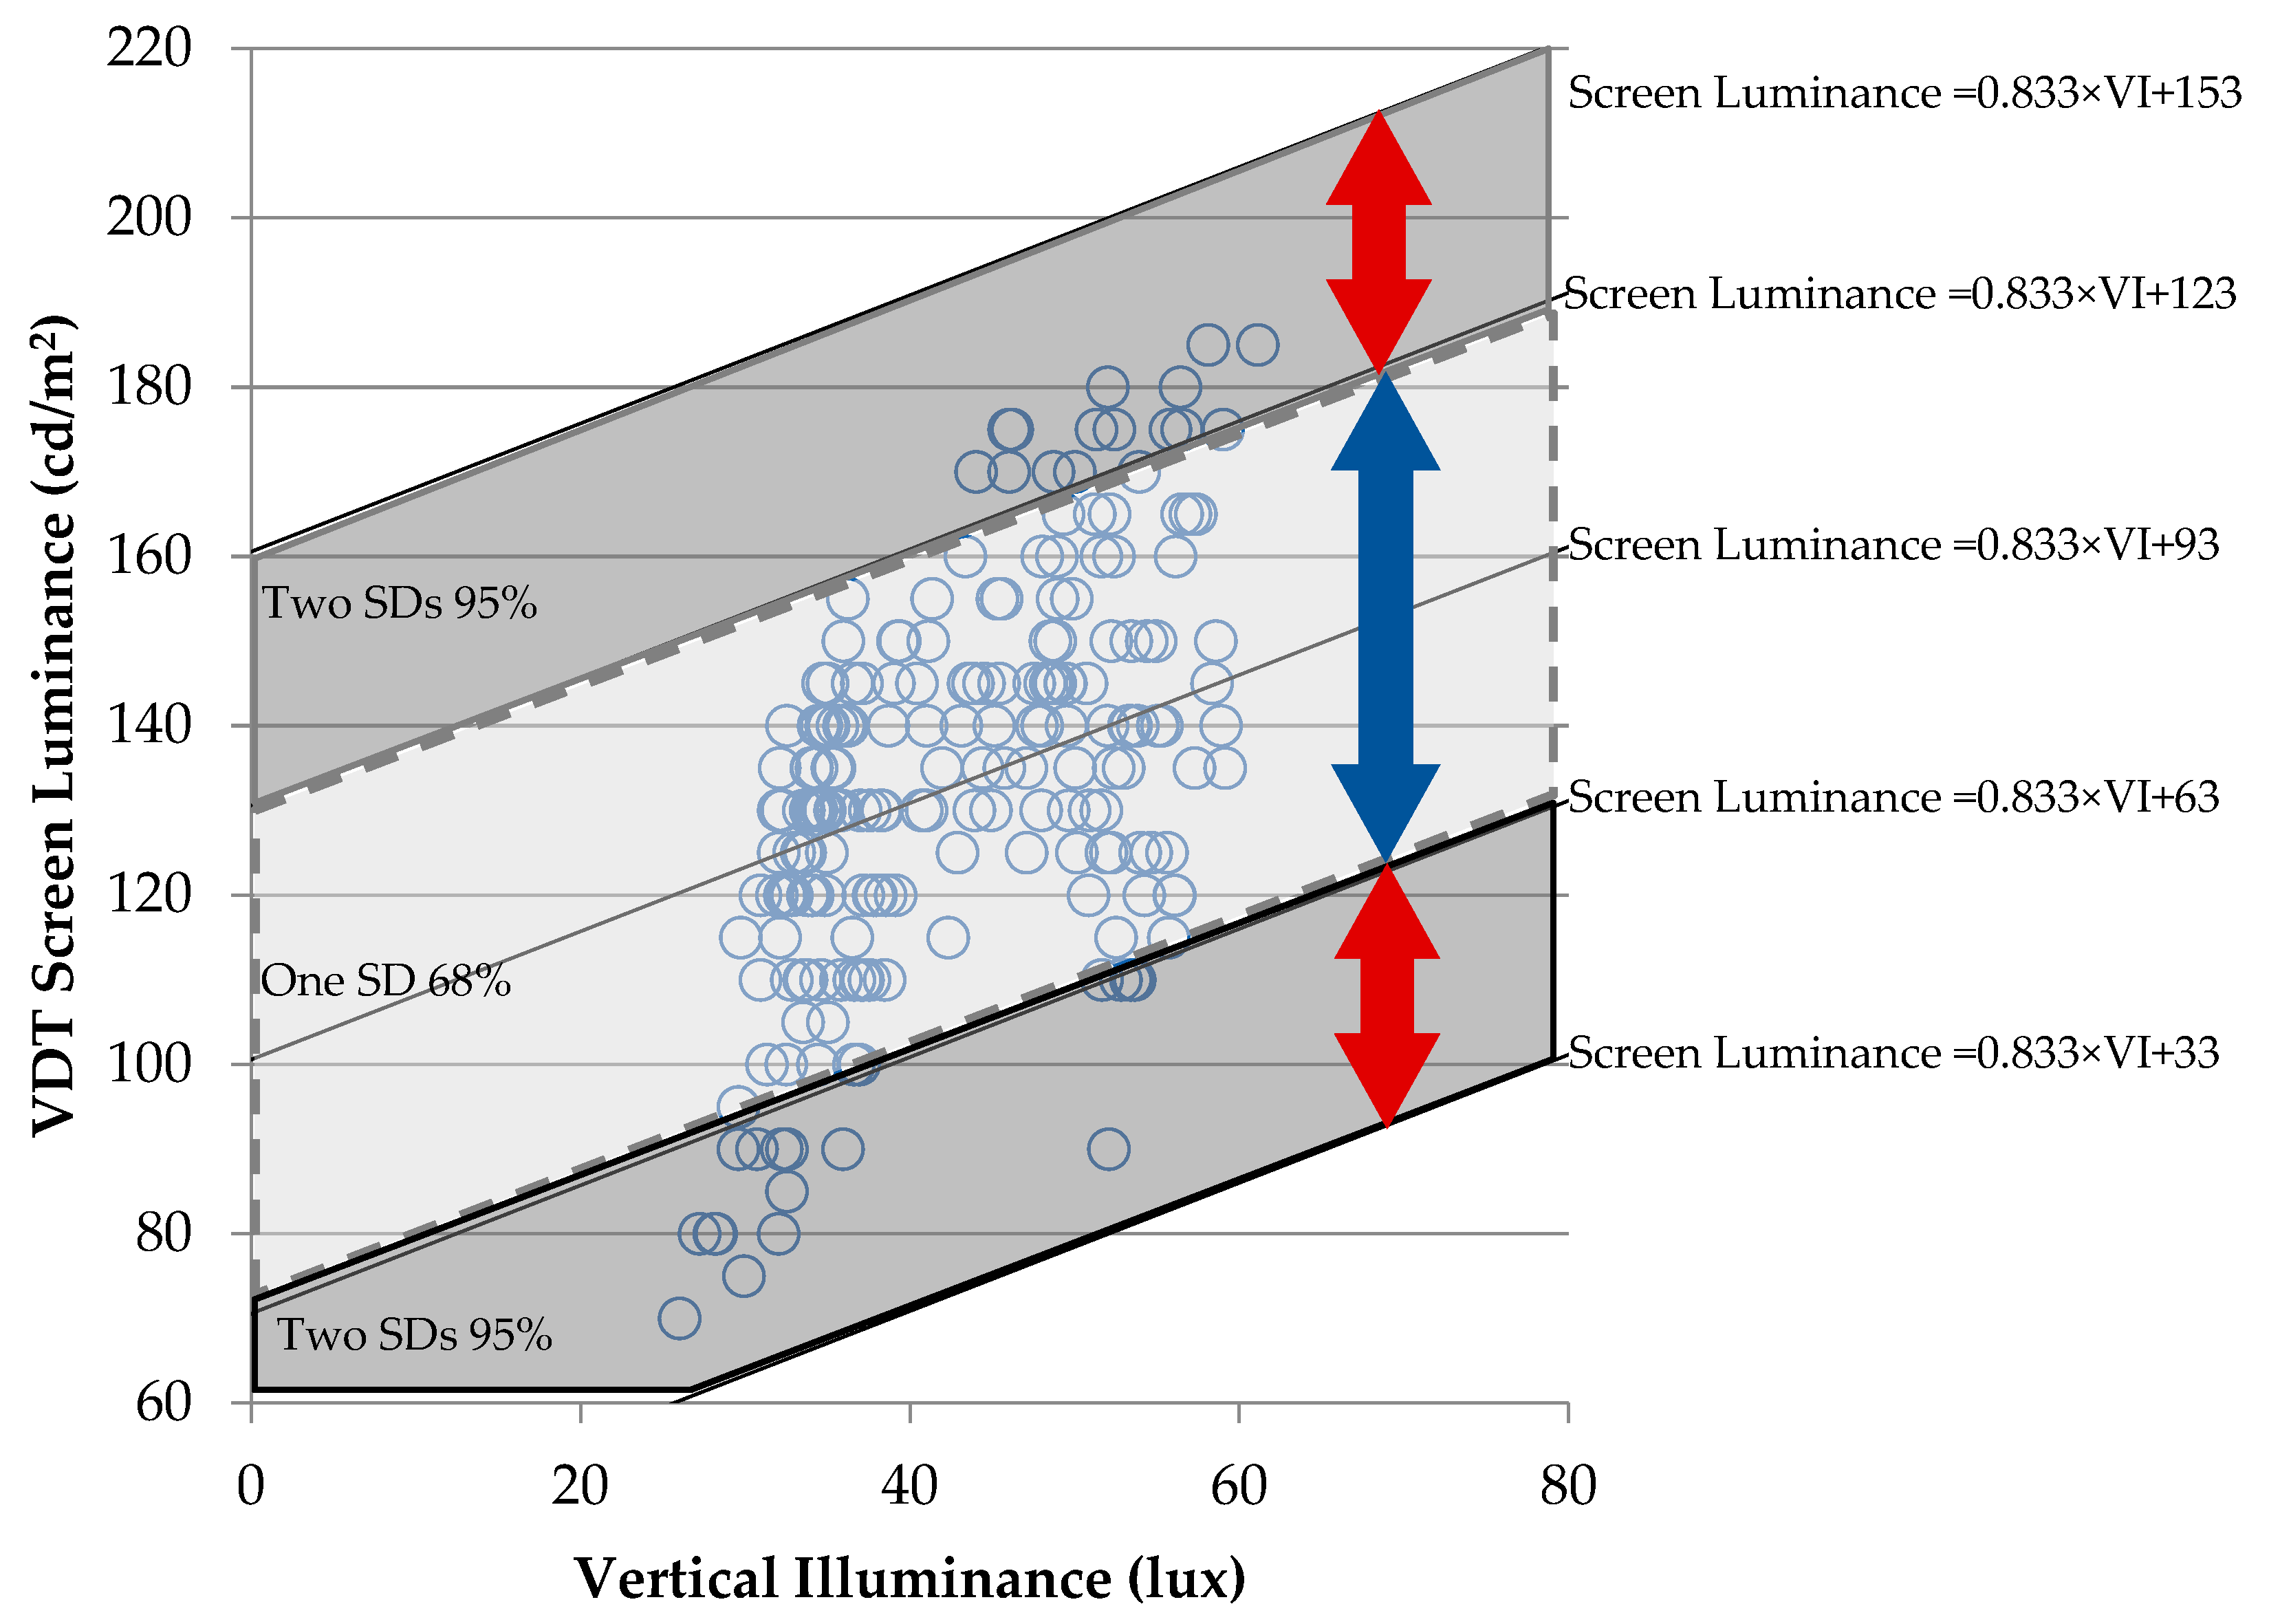
Considering the simple regression analysis between EV and LSD, the regression coefficient was 0.83, constant was 93, and standard deviation was 30, as shown in Formula (4).
Appropriate Screen Luminance = 0.83 LSD + 93,
In a normal distribution, approximately sixty-eight percent of the samples are expected to fall within one standard deviation of the mean, whereas about ninety-five percent of the samples fall within two standard deviations of the mean. In our analysis, we observed that the blue arrow zone, representing one standard deviation from Figure 12, contained nearly all of the data points from each subject (with the constant ranging from 63 to 123). Similarly, the red arrow zone plus blue arrow zone, representing two standard deviations from Formula 4, encompassed all of the data points (with the constant ranging from 33 to 153). These findings indicate that the data distribution aligns with the expected patterns of a normal distribution.
4. Discussion
This study aimed to investigate the impact of luminance uniformity on task illuminance and VDT screen luminance. Twenty participants were involved in adjusting these parameters under different luminance uniformity conditions, which were measured using a luminance camera (Luminocam). The experiment consisted of five luminance uniformity conditions: 10.74, 7.48, 5.88, 4.75, and 2.42, while the average luminance remained fixed at 5 cd/m2.
- When the LSD of the ambient space increases, it indicates a lack of uniformity in the luminance distribution and a higher level of contrast. In such cases, regardless of the EH,min or the EH,app, participants tend to adjust them to higher values. Conversely, when the LSD of the ambient space decreases, participants prefer lower task horizontal illuminance levels because the uniformity is even.
- By conducting regression analysis using the data from each participant, we derived equations, as shown in Formula 3. These equations demonstrate that for every 1 cd/m2 decrease in luminance SD of the ambient space, the task horizontal illuminance can be reduced by 5.38 lux.
- Through correlation coefficient analysis and one-way ANOVA, we found that the LVDT,app is not significantly influenced by the LSD of the ambient space. However, it is significantly affected by the EV. Therefore, Formula 4 can be utilized as a reference for determining the appropriate VDT screen luminance, and all the data points were within the range of two standard deviations.
Overall, this study provides insights into the relationship between luminance uniformity, task illuminance, and VDT screen luminance, offering valuable information for optimizing lighting conditions in work environments.
5. Conclusions
We conducted lighting experiments involving 20 subjects to explore the relationship between EH, LSD, and LVDT,app, focusing on the impact on visual comfort. The experiment in a full-scale office space revealed a direct correlation between the LSD and the EH. In order to create a sustainable lighting environment, it is desirable to have uniform surrounding luminance, which helps reduce energy consumption for each task. Conversely, in situations where the surrounding space exhibits uneven or discontinuous luminance, it becomes necessary to increase the illuminance of the work surface.
It is important to highlight that our study was conducted in an office environment facing power shortages. In such circumstances, participants were required to regulate their own desk lighting while engaging in VDT work to conserve energy. Typically, the recommended EH is set at 500 lux. However, our findings showed that participants expressed satisfaction with an illuminance level of 188 lux for the desk horizontal surface when confronted with a power shortage scenario in a uniformly illuminated ambient space. Adjusting the illuminance to this level enables significant energy savings. According to the Figure 9 blue zone, if the general lighting is uniform from the ceiling, and controlling the task illuminance over 183 lux, a personal desk lamp is not required for VDT work in a power shortage situation. However, when the general lighting is irregular, a personal desk lamp which is adjustable is encouraged to be used and the task illuminance adjusted from 228 to 303 lux is appropriate for the employee in office VDT work.
Nevertheless, it is important to acknowledge the limitations of our study. The experiment was conducted in an enclosed space without daylight, and the subjects were restricted to sitting in their seats and performing Visual Display Terminal (VDT) tasks according to the experimenter’s rules. The light source in the environment was unidirectional, originating from the front of the sight line rather than the surroundings. Although the subjects were instructed to maintain a forward gaze and avoid moving their eyes left and right, this setup differed from a typical office space. At the same time, we did not extensively explore the visual health implications for employees who are exposed to lower illuminance levels than the recommended values for extended periods of time. Additionally, we did not investigate the effects of such lighting conditions on prolonged screen-based activities like extended reading.
Our focus was primarily on the impact of artificial lighting on the employee’s VDT work experience. To address these limitations, we plan to extend the duration of our experiments or conduct studies directly in real office settings. This will allow us to examine specific and time-dependent effects while considering participants’ visual comfort, visual health, and productivity. We also aim to analyze the impact of ambient lighting uniformity on visual comfort and verify the reproducibility of our experimental results in field offices by integrating laboratory prototypes with daylight. Furthermore, we intend to explore different circadian stimuli, such as Equivalent Melanopic Lux (EML), to evaluate the effects of different lighting spectra on users’ physical and mental states, as well as their attention levels. These future endeavors will enable us to provide more detailed recommendations for lighting control strategies in actual office environments.
Author Contributions
Conceptualization, Y.L. and C.-C.C.; methodology, Y.L. and C.-C.C.; software, Y.L.; formal analysis, Y.L.; investigation, C.-C.C.; data curation, Y.L.; writing—original draft, Y.L.; writing—review & editing, C.-C.C.; supervision, C.-C.C. All authors have read and agreed to the published version of the manuscript.
Funding
This research received no external funding.
Data Availability Statement
The data are not publicly available due to privacy.
Conflicts of Interest
The authors declare no conflict of interest.
Nomenclature
| EH | Horizontal illuminance |
| EV | Vertical illuminance |
| EH,min | Allowable minimum horizontal illuminance |
| EH,app | Appropriate horizontal illuminance |
| LSD | Standard deviation (SD) of luminance |
| LVDT,app | Appropriate VDT monitor of luminance |
| VDT | Visual display terminal |
Appendix A

Table A1.
Correlation and regression analyses for each subject.
| EH,min Model | EH,app Model | ||||||
|---|---|---|---|---|---|---|---|
| No. | Slope | Constant | R2 | No. | Slope | Constant | R2 |
| 1 | 4.42 | 52.20 | 0.963 | 1 | 6.03 | 142.56 | 0.907 |
| 2 | 5.49 | 34.54 | 0.941 | 2 | 6.67 | 119.48 | 0.959 |
| 3 | 5.91 | 50.71 | 0.828 | 3 | 3.58 | 255.27 | 0.792 |
| 4 | 5.35 | 77.23 | 0.889 | 4 | 6.42 | 190.89 | 0.849 |
| 5 | 4.47 | 52.20 | 0.991 | 5 | 4.68 | 138.80 | 0.744 |
| 6 | 5.56 | 15.38 | 0.888 | 6 | 5.14 | 150.88 | 0.850 |
| 7 | 4.65 | 77.48 | 0.815 | 7 | 6.76 | 174.96 | 0.893 |
| 8 | 4.28 | 58.48 | 0.987 | 8 | 5.34 | 112.14 | 0.751 |
| 9 | 4.88 | 44.93 | 0.917 | 9 | 6.07 | 186.36 | 0.879 |
| 10 | 5.23 | 45.27 | 0.940 | 10 | 4.90 | 190.68 | 0.831 |
| 11 | 5.24 | 53.04 | 0.883 | 11 | 5.96 | 195.70 | 0.971 |
| 12 | 5.51 | 52.14 | 0.943 | 12 | 4.97 | 213.52 | 0.917 |
| 13 | 4.99 | 50.11 | 0.942 | 13 | 3.75 | 223.16 | 0.843 |
| 14 | 4.96 | 63.24 | 0.932 | 14 | 5.79 | 122.20 | 0.841 |
| 15 | 5.20 | 60.95 | 0.987 | 15 | 6.99 | 130.83 | 0.844 |
| 16 | 5.23 | 61.91 | 0.937 | 16 | 5.77 | 190.95 | 0.995 |
| 17 | 4.59 | 68.51 | 0.962 | 17 | 6.87 | 159.45 | 0.911 |
| 18 | 6.19 | 70.45 | 0.906 | 18 | 5.75 | 159.21 | 0.938 |
| 19 | 5.89 | 41.89 | 0.936 | 19 | 4.75 | 184.03 | 0.804 |
| 20 | 5.74 | 89.56 | 0.990 | 20 | 5.25 | 160.87 | 0.925 |
| AVG | 5.19 | 56.01 | 0.929 | AVG | 5.57 | 170.10 | 0.872 |
| SD | 0.54 | 16.52 | 0.05 | SD | 0.97 | 37.39 | 0.070 |
References
- Reveshti, A.M.; Ebrahimpour, A.; Razmara, J. Investigating the effect of new and old weather data on the energy consumption of buildings affected by global warming in different climates. Int. J. Thermofluids 2023, 19, 100377. [Google Scholar] [CrossRef]
- Hong, T.; Piette, M.A.; Chen, Y.; Lee, S.H.; Taylor-Lange, S.C.; Zhang, R.; Sun, K.; Price, P. Commercial Building Energy Saver: An energy retrofit analysis toolkit. Appl. Energy 2015, 159, 298–309. [Google Scholar] [CrossRef] [Green Version]
- Perez, K.X.; Cole, W.J.; Rhodes, J.D.; Ondeck, A.; Webber, M.; Baldea, M.; Edgar, T.F. Nonintrusive disaggregation of residential air-conditioning loads from sub-hourly smart meter data. Energy Build. 2014, 81, 316–325. [Google Scholar] [CrossRef]
- Elnaklah, R.; Walker, I.; Natarajan, S. Moving to a green building: Indoor environment quality, thermal comfort and health. Build. Environ. 2021, 191, 107592. [Google Scholar] [CrossRef]
- McCunn, L.J.; Kim, A.; Feracor, J. Reflections on a retrofit: Organizational commitment, perceived productivity and controllability in a building lighting project in the United States. Energy Res. Soc. Sci. 2018, 38, 154–164. [Google Scholar] [CrossRef]
- Aslanoğlu, R.; Pracki, P.; Kazak, J.K.; Ulusoy, B.; Yekanialibeiglou, S. Short-term analysis of residential lighting: A pilot study. Build. Environ. 2021, 196, 107781. [Google Scholar] [CrossRef]
- Jia, L.-R.; Li, Q.-Y.; Chen, X.; Lee, C.-C.; Han, J. Indoor Thermal and Ventilation Indicator on University Students’ Overall Comfort. Buildings 2022, 12, 1921. [Google Scholar] [CrossRef]
- Wolkoff, P.; Azuma, K.; Carrer, P. Health, Work Performance, and Risk of Infection in Office-like Environments: The Role of Indoor Temperature, Air Humidity, and Ventilation. Int. J. Hyg. Environ. Health 2021, 233, 113709. [Google Scholar] [CrossRef] [PubMed]
- ISO 8995-1:2002-05; CIE S 008:2002-05. CIE Central Bureau: Vienna, Austria, 2002.
- Zhang, S. Demonstration of Natural Lighting Design Optimization Using Galapagos and Octopus Taking the Daylighting Opening of Institutional Pension Building as an Example; TianJin University: Tianjin, China, 2017. [Google Scholar]
- Logar, V.; Kristl, Z.; Skrjanc, I. Using a fuzzy black-box model to estimate the indoor illuminance in buildings. Energy Build. 2014, 70, 343–351. [Google Scholar] [CrossRef]
- Wagiman, K.R.; Abdullah, M.N.; Hassan, M.Y.; Radzi, N.H.M. A New Optimal Light Sensor Placement Method of an Indoor Lighting Control System for Improving Energy Performance and Visual Comfort. J. Build. Eng. 2020, 30, 101295. [Google Scholar] [CrossRef]
- UNE-EN 12464-1-2012; Light and Lighting—Lighting of Workplaces—Part 1: Indoor Workplaces. British Standards Institution: London, UK, 2012.
- JISZ9110:2010; Japanese Industrial Standards. Japanese Standards Association: Tokyo, Japan, 2011.
- Grünberger, J.; Linzmayer, L.; Dietzel, M.; Saletu, B. The effect of biologically-active light on the noo- and thymopsyche and psychophysiological variables in healthy volunteers. Int. J. Psychophysiol. Off. J. Int. Organ. Psychophysiol. 1993, 15, 27. [Google Scholar] [CrossRef] [PubMed]
- Tanabe, S.; Nishihara, N. Productivity and fatigue. Indoor Air 2004, 14 (Suppl. S7), 126. [Google Scholar] [CrossRef] [PubMed]
- Visual Display Terminal Usage Rate. Important Gender Statistics Database. Department of Gender Equality, Executive Yuan on 2021-09-03. Available online: https://www.gender.ey.gov.tw/gecdb/Stat_Statistics_DetailData.aspx?sn=HdRa9CNh3hfoKtWhG56A9Q%40%40 (accessed on 2 December 2021).
- Liu, K.; Chiang, C.; Lin, Y. Influences of visual fatigue on the productivity of subjects using visual display terminals in a light-emitting diode lighting environment. Archit. Sci. Rev. 2010, 53, 384–395. [Google Scholar] [CrossRef]
- Ko, B.; Koga, T.; Lu, B.; Hirate, K.; Mitsuno, M.; Suzuki, N. Brightness of a Space in Terms of Variation of Luminance. J. Illum. Eng. Inst. Jpn. 2013, 97, 429–435. [Google Scholar] [CrossRef] [Green Version]
- Lin, Y.; Chen, C.-C.; Ashraf Gandomi, Y. Strategies on Visual Display Terminal Lighting in Office Space under Energy-Saving Environment. Energies 2023, 16, 1317. [Google Scholar] [CrossRef]
- Ma, J.H.; Lee, J.K.; Cha, S.H. Effects of lighting CCT and illuminance on visual perception and task performance in immersive virtual environments. Build. Environ. 2022, 209, 108678. [Google Scholar] [CrossRef]
- Chen, R.; Tsai, M.C.; Tsay, Y.S. Effect of Color Temperature and Illuminance on Psychology, Physiology, and Productivity: An Experimental Study. Energies 2022, 15, 4477. [Google Scholar] [CrossRef]
- Kruisselbrink, T.K.; Dangol, R.; Van Loenen, E.J. Feasibility of ceiling-based luminance distribution measurements. Build Environ. 2020, 172, 106699. [Google Scholar] [CrossRef]
- Czyżewski, D. The Influence of a Photometric Distance on Luminance Measurements. Energies 2023, 16, 4166. [Google Scholar] [CrossRef]
- Bishop, D.; Chase, J.G. Development of a Low-Cost Luminance Imaging Device with Minimal Equipment Calibration Procedures for Absolute and Relative Luminance. Buildings 2023, 13, 1266. [Google Scholar] [CrossRef]
- ISO 9241-303:2011; Ergonomics of Human-System Interaction—Part 303: Requirements for Electronic Visual Displays. ISO: Geneva, Switzerland, 2011.
Figure 1.
Energy consumption in buildings.

Figure 2.
The experiment process.

Figure 3.
The plan and section view of full-scale space.

Figure 4.
Illuminance distribution on the desk: (a) measure point on the desk; (b) liner chart of each illuminance value, and (c) illuminance value in each point.
Figure 4.
Illuminance distribution on the desk: (a) measure point on the desk; (b) liner chart of each illuminance value, and (c) illuminance value in each point.

Figure 5.
Diagram of Ergonomics in VDT and Reading.

Figure 6.
HI varied with different uniformity of ambient luminance: (a) EH,min model and (b) Eapp model.
Figure 6.
HI varied with different uniformity of ambient luminance: (a) EH,min model and (b) Eapp model.

Figure 7.
HI varied with surrounding illuminance: (a) EH,min and LSD in five experiment groups and (b) EH,app and LSD in five experiment groups.
Figure 7.
HI varied with surrounding illuminance: (a) EH,min and LSD in five experiment groups and (b) EH,app and LSD in five experiment groups.

Figure 8.
Variation of (a) EH,min model and (b) EH,app model with uniformity of surrounding luminance. Every line represents the value of the adjusted EH for each participant. Each symbol means the illuminance data from No. 1 to No. 5 model for each subject.
Figure 8.
Variation of (a) EH,min model and (b) EH,app model with uniformity of surrounding luminance. Every line represents the value of the adjusted EH for each participant. Each symbol means the illuminance data from No. 1 to No. 5 model for each subject.

Figure 9.
Saving Energy area for EH in different uniformity luminance.

Figure 10.
Average VDT screen luminance adjusting by subjects of the (a) EH,min and (b) EH,min model with uniformity of surrounding luminance.
Figure 10.
Average VDT screen luminance adjusting by subjects of the (a) EH,min and (b) EH,min model with uniformity of surrounding luminance.

Figure 11.
Matrix of LSD, LVDT,app, and EV.

Figure 12.
Suitable range of appropriate VDT screen equation. Each blue circle is the VDT screen luminance data of each subject. Blue arrow means 68% of subjects’ data is expected to fall within one standard deviation. screen luminance is in suitable zone; Red arrows plus blue arrow zone means over 95% of subjects’ data is expected to fall within two standard deviation.

Table 1.
Linear tube LED specifications.
| Product | Technical Specifications | Lighting Distribution Curve | Pic. |
|---|---|---|---|
| Linear tube LED Maker: Endo Product model: ERK9708W | CCT: 4000 K CRI: 82 Tilt angle: 0° Color: Cool White Wattage: 40 W |  |  |
Table 2.
Luminance meter technical specifications.
| Measure Points | Luminance Meter | Technical Specifications |
|---|---|---|
 |  | Measurement angle: 1° f = 36 mm, F2.5 Measurement range: 0.1~1,999,000 cd/m2 |
Table 3.
Luminance camera technical specifications.
| Measure Location | Luminance Camera | Technical Specifications |
|---|---|---|
 |  | Measurement angle: Wide: 103.6° Hight: 75.5° Measurement range: 0.4~9584 cd/m2 |
Table 4.
Properties of five independent variables.
| Models | No. 1 | No. 2 | No. 3 | No. 4 | No. 5 |
|---|---|---|---|---|---|
| EV (lux) | 25 | 23 | 23 | 23 | 21 |
| EH (lux) | 17 | 16 | 15 | 16 | 14 |
| Avg. luminance (cd/m2) | 5.09 | 5.17 | 4.90 | 5.00 | 5.09 |
| LSD | 10.74 | 7.48 | 5.88 | 4.75 | 2.42 |
| Max. luminance in space (cd/m2) | 97.33 | 56.75 | 37.36 | 30.13 | 25.72 |
| Photo of full-scale space |  |  |  |  |  |
Table 5.
Latin square design with five model.
| 1 | 2 | 3 | 4 | 5 | 1 = No. 1 model, 5 lux |
| 2 | 3 | 4 | 5 | 1 | 2 = No. 2 model, 10 lux |
| 5 | 1 | 2 | 3 | 4 | 3 = No. 3 model, 20 lux |
| 3 | 4 | 5 | 1 | 2 | 4 = No. 4 model, 50 lux |
| 4 | 5 | 1 | 2 | 3 | 5 = No. 5 model, 100 lux |
Table 6.
Correlation coefficients of LSD of space, LVDT,app, and EV.
| Correlation Analysis | LSD of Space | LVDT,app | EV |
|---|---|---|---|
| LVDT,app | 1 | −0.037 | 0.576 |
| LSD of space | 1 | 0.200 | |
| EV | 1 |
Table 7.
One-way ANOVA test of LVDT,app.
| VDT Monitor Luminance | Sum of Squares | df | Mean Square | F | Sig. | |
|---|---|---|---|---|---|---|
| EV | Between Groups | 6300.14 | 23 | 273.92 | 4.94 | 0.000 |
| Within Groups | 9763.84 | 176 | 55.48 | |||
| Total | 16,063.98 | 199 | ||||
| LSD | Between Groups | 137.06 | 23 | 5.96 | 0.78 | 0.75 |
| Within Groups | 1342.63 | 176 | 7.63 | |||
| Total | 1479.69 | 199 | ||||
Disclaimer/Publisher’s Note: The statements, opinions and data contained in all publications are solely those of the individual author(s) and contributor(s) and not of MDPI and/or the editor(s). MDPI and/or the editor(s) disclaim responsibility for any injury to people or property resulting from any ideas, methods, instructions or products referred to in the content. |
© 2023 by the authors. Licensee MDPI, Basel, Switzerland. This article is an open access article distributed under the terms and conditions of the Creative Commons Attribution (CC BY) license (https://creativecommons.org/licenses/by/4.0/).
Share and Cite
MDPI and ACS Style
Lin, Y.; Chen, C.-C. Strategies on Uniformity Lighting in Office Space under Energy-Saving Environment. Buildings 2023, 13, 1797. https://0-doi-org.brum.beds.ac.uk/10.3390/buildings13071797
AMA Style
Lin Y, Chen C-C. Strategies on Uniformity Lighting in Office Space under Energy-Saving Environment. Buildings. 2023; 13(7):1797. https://0-doi-org.brum.beds.ac.uk/10.3390/buildings13071797
Chicago/Turabian StyleLin, Yusen, and Cheng-Chen Chen. 2023. "Strategies on Uniformity Lighting in Office Space under Energy-Saving Environment" Buildings 13, no. 7: 1797. https://0-doi-org.brum.beds.ac.uk/10.3390/buildings13071797
Note that from the first issue of 2016, this journal uses article numbers instead of page numbers. See further details here.