
Advanced Timber Construction Industry: A Quantitative Review of 646 Global Design and Construction Stakeholders
 , , , , , and
Abstract
:1. Introduction
1.1. Aim of the Study
1.2. Literature Review
2. Materials and Methods
2.1. Data Collection Methods
2.2. Analysis Methods
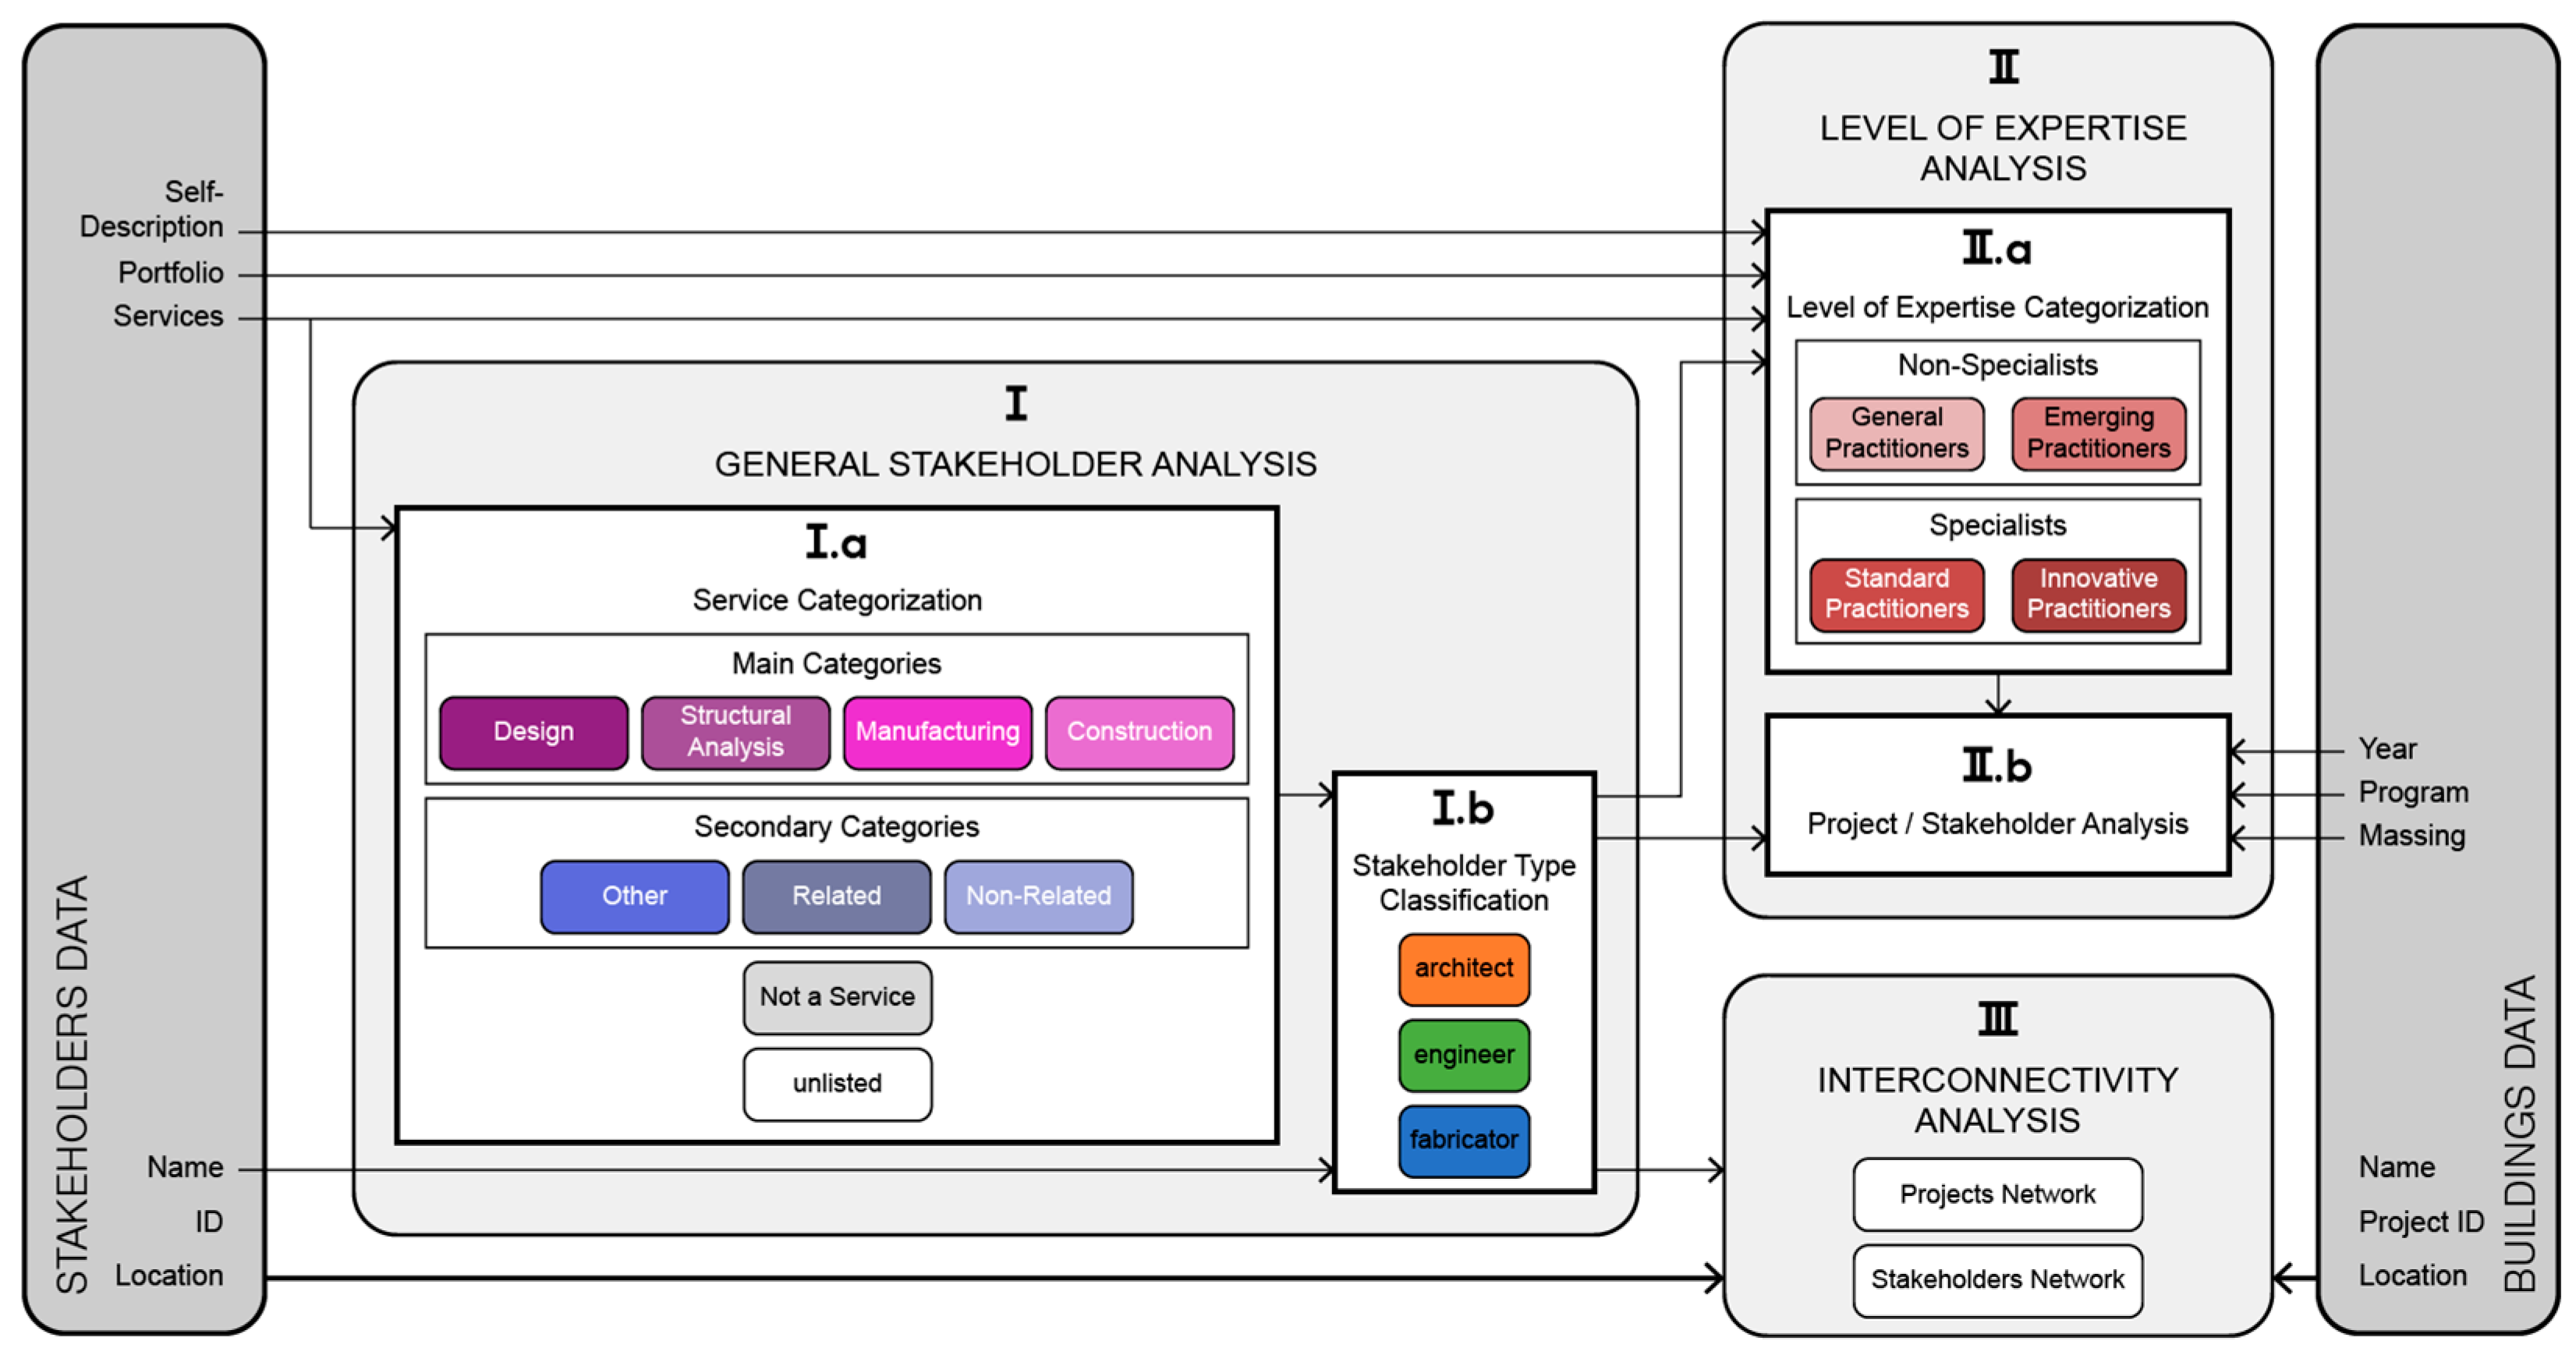
2.2.1. General Stakeholder Analysis
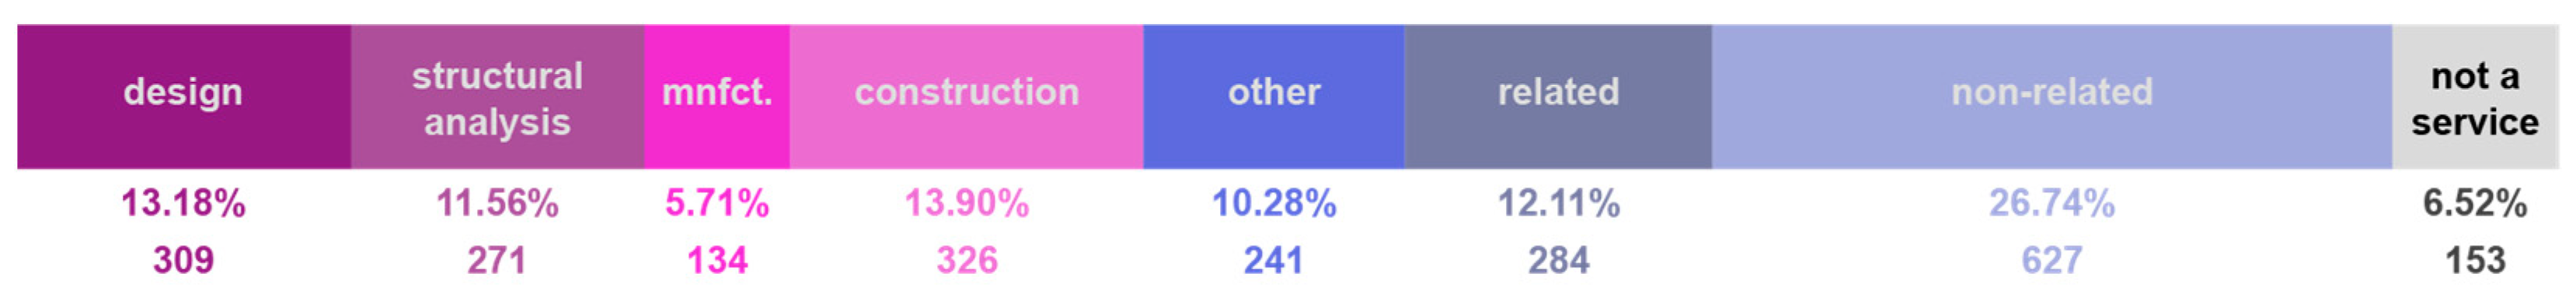
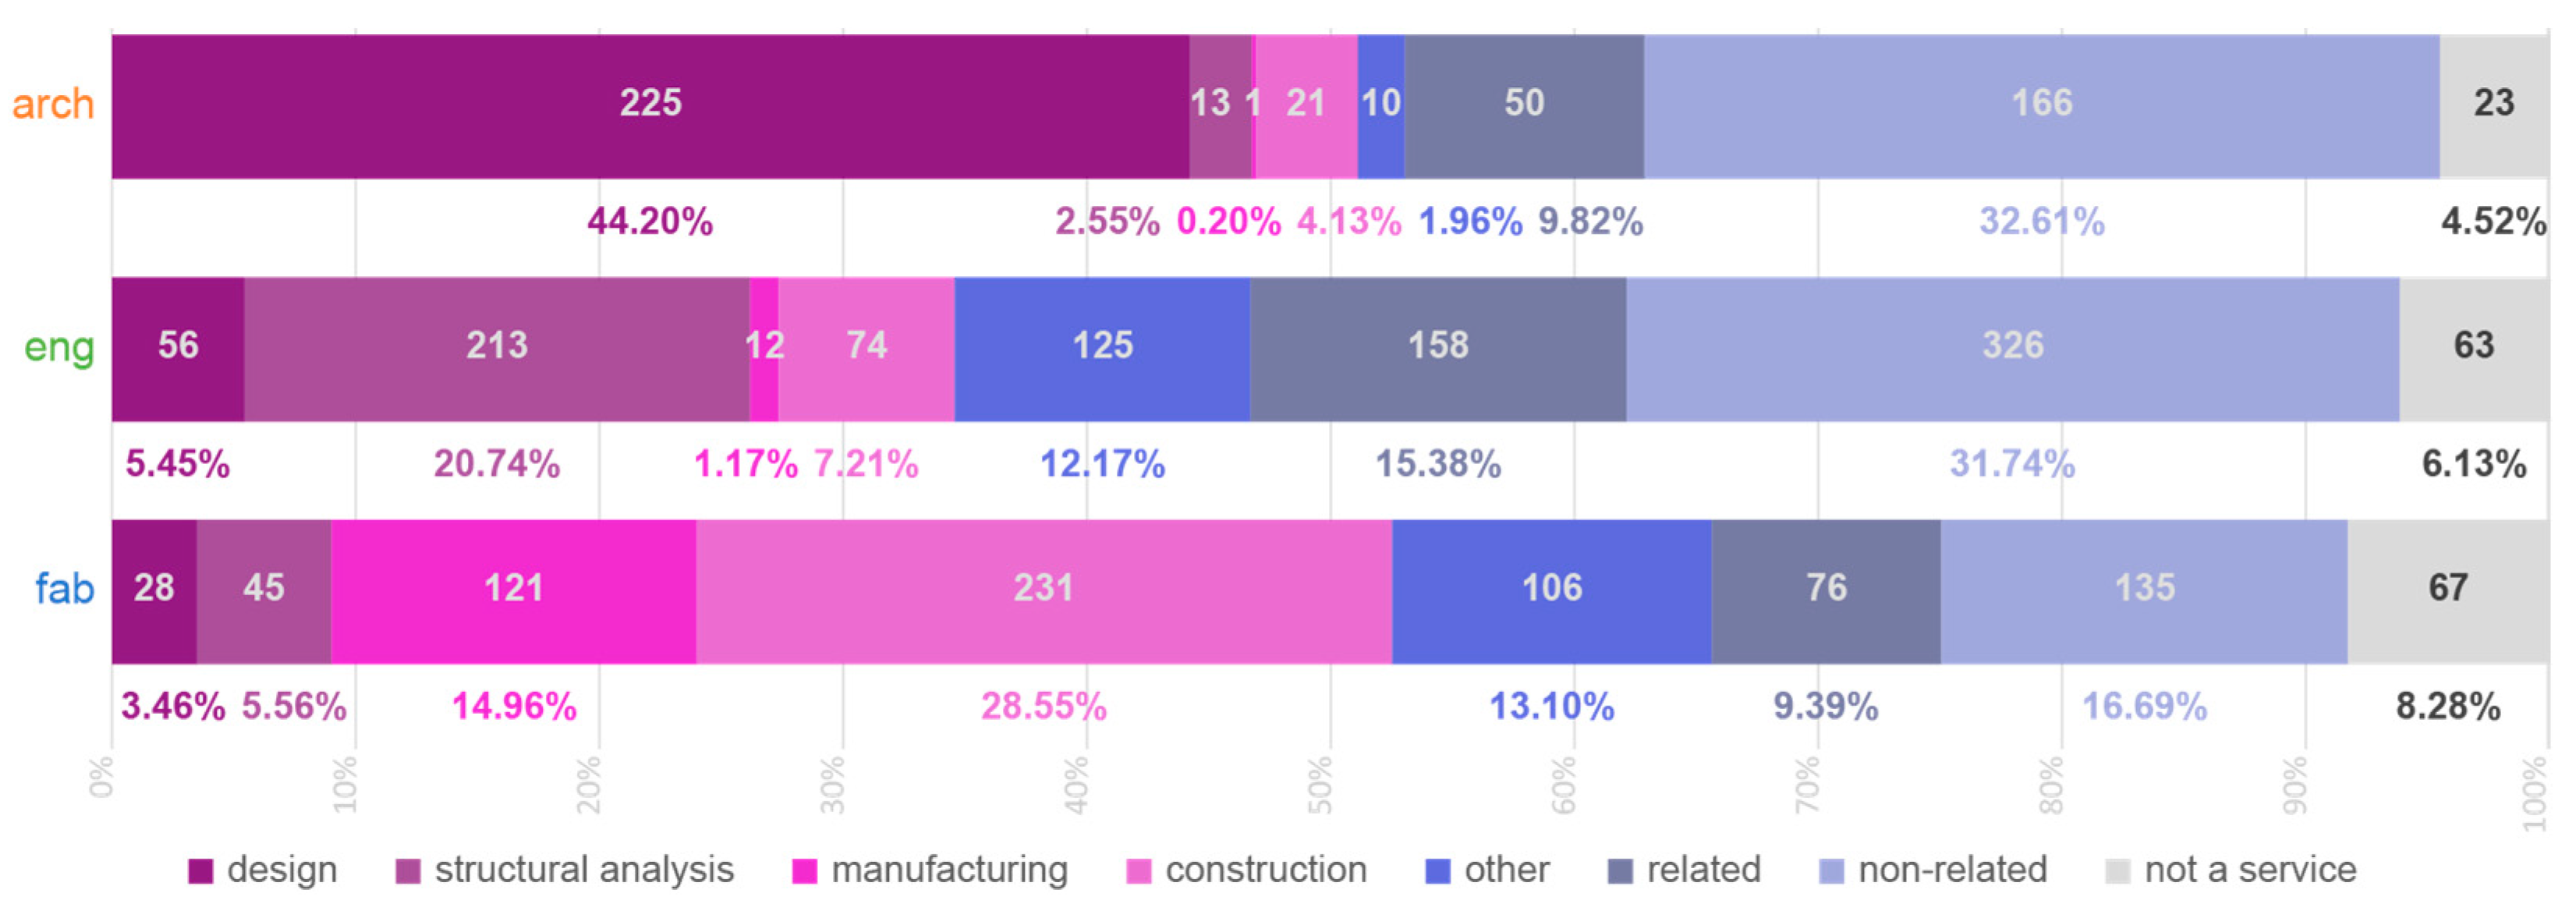
(I.a) Service Categories
- Design (implementation of the structural system);
- Structural Analysis (analysis and simulation of the structural system);
- Manufacturing (prefabrication of the structural system);
- Construction (on-site assembly and construction of the structural system).
- 5.
- Other (part of the construction process);
- 6.
- Related (related to construction but not part of the construction process);
- 7.
- Non-related (not related to the construction process).
(I.b) Stakeholder Type
2.2.2. Level of Expertise Analysis
(II.a) Level of Expertise
- Non-specialists
- General Practitioners;
- Emerging Practitioners.
- Specialists
- c.
- Standard Practitioners;
- d.
- Innovative Practitioners.
(II.b) Project/Stakeholder Analysis
2.2.3. Interconnectivity Analysis
3. Results
3.1. Collected Data Results
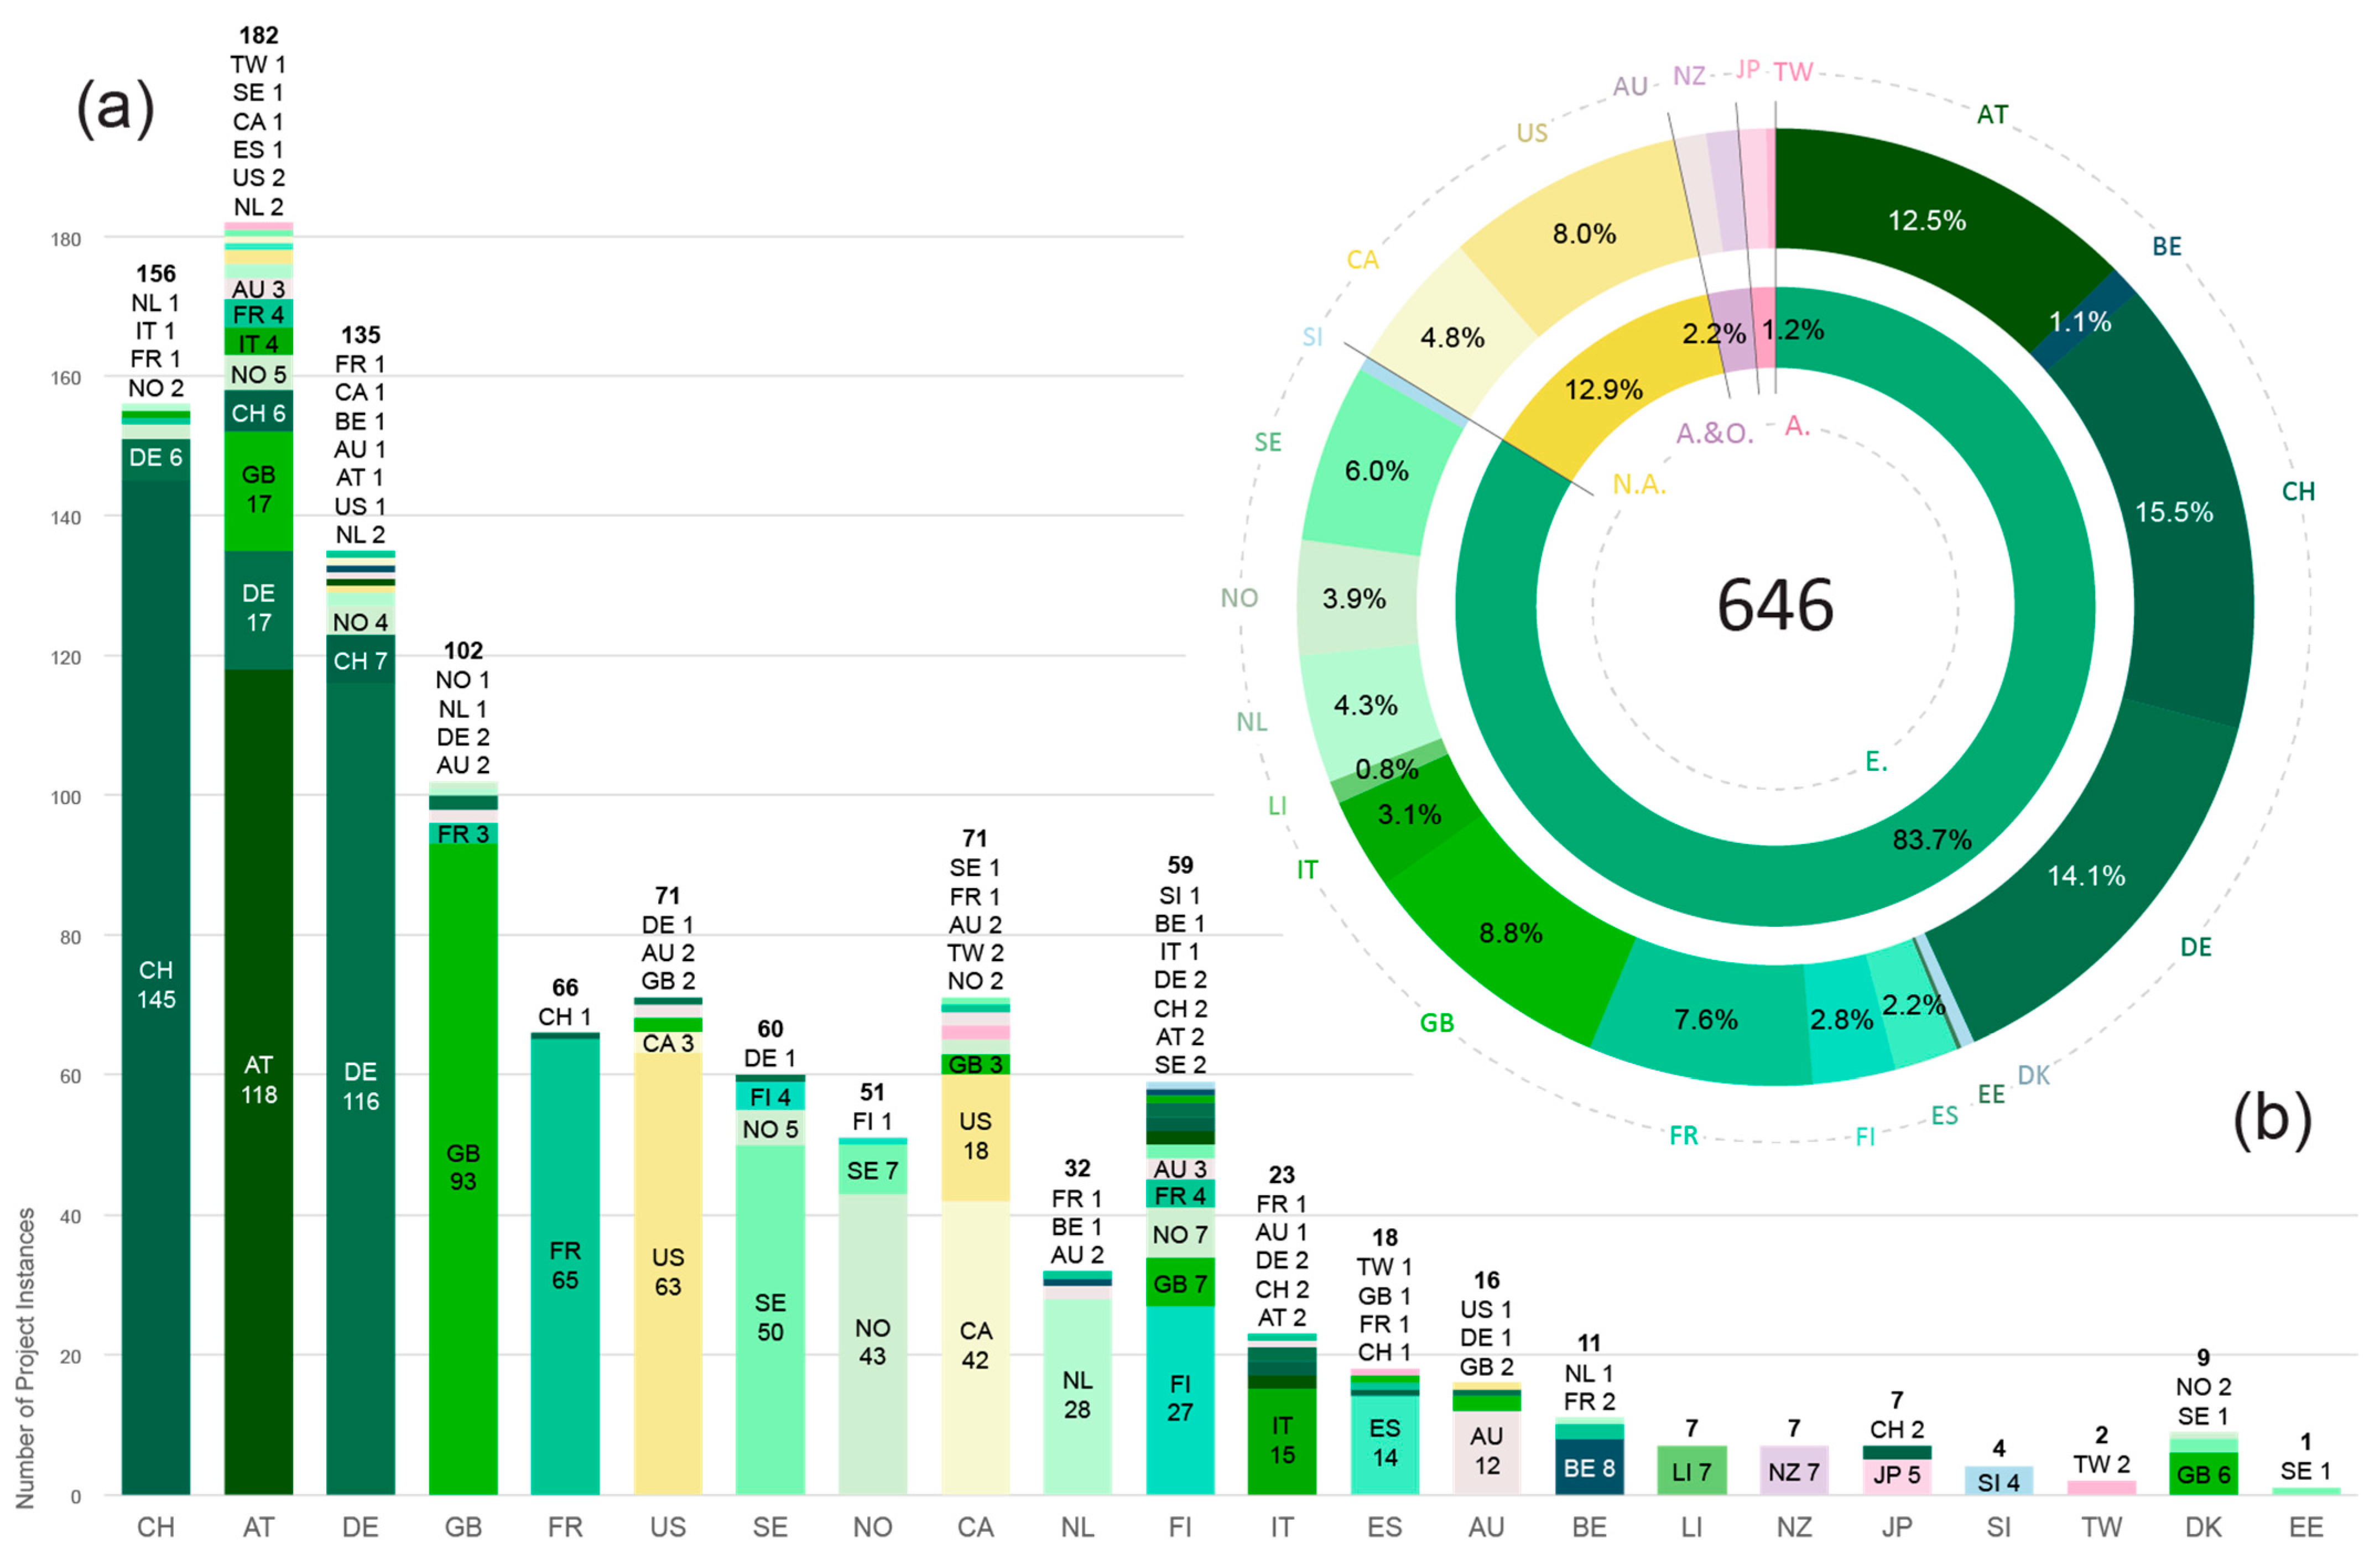
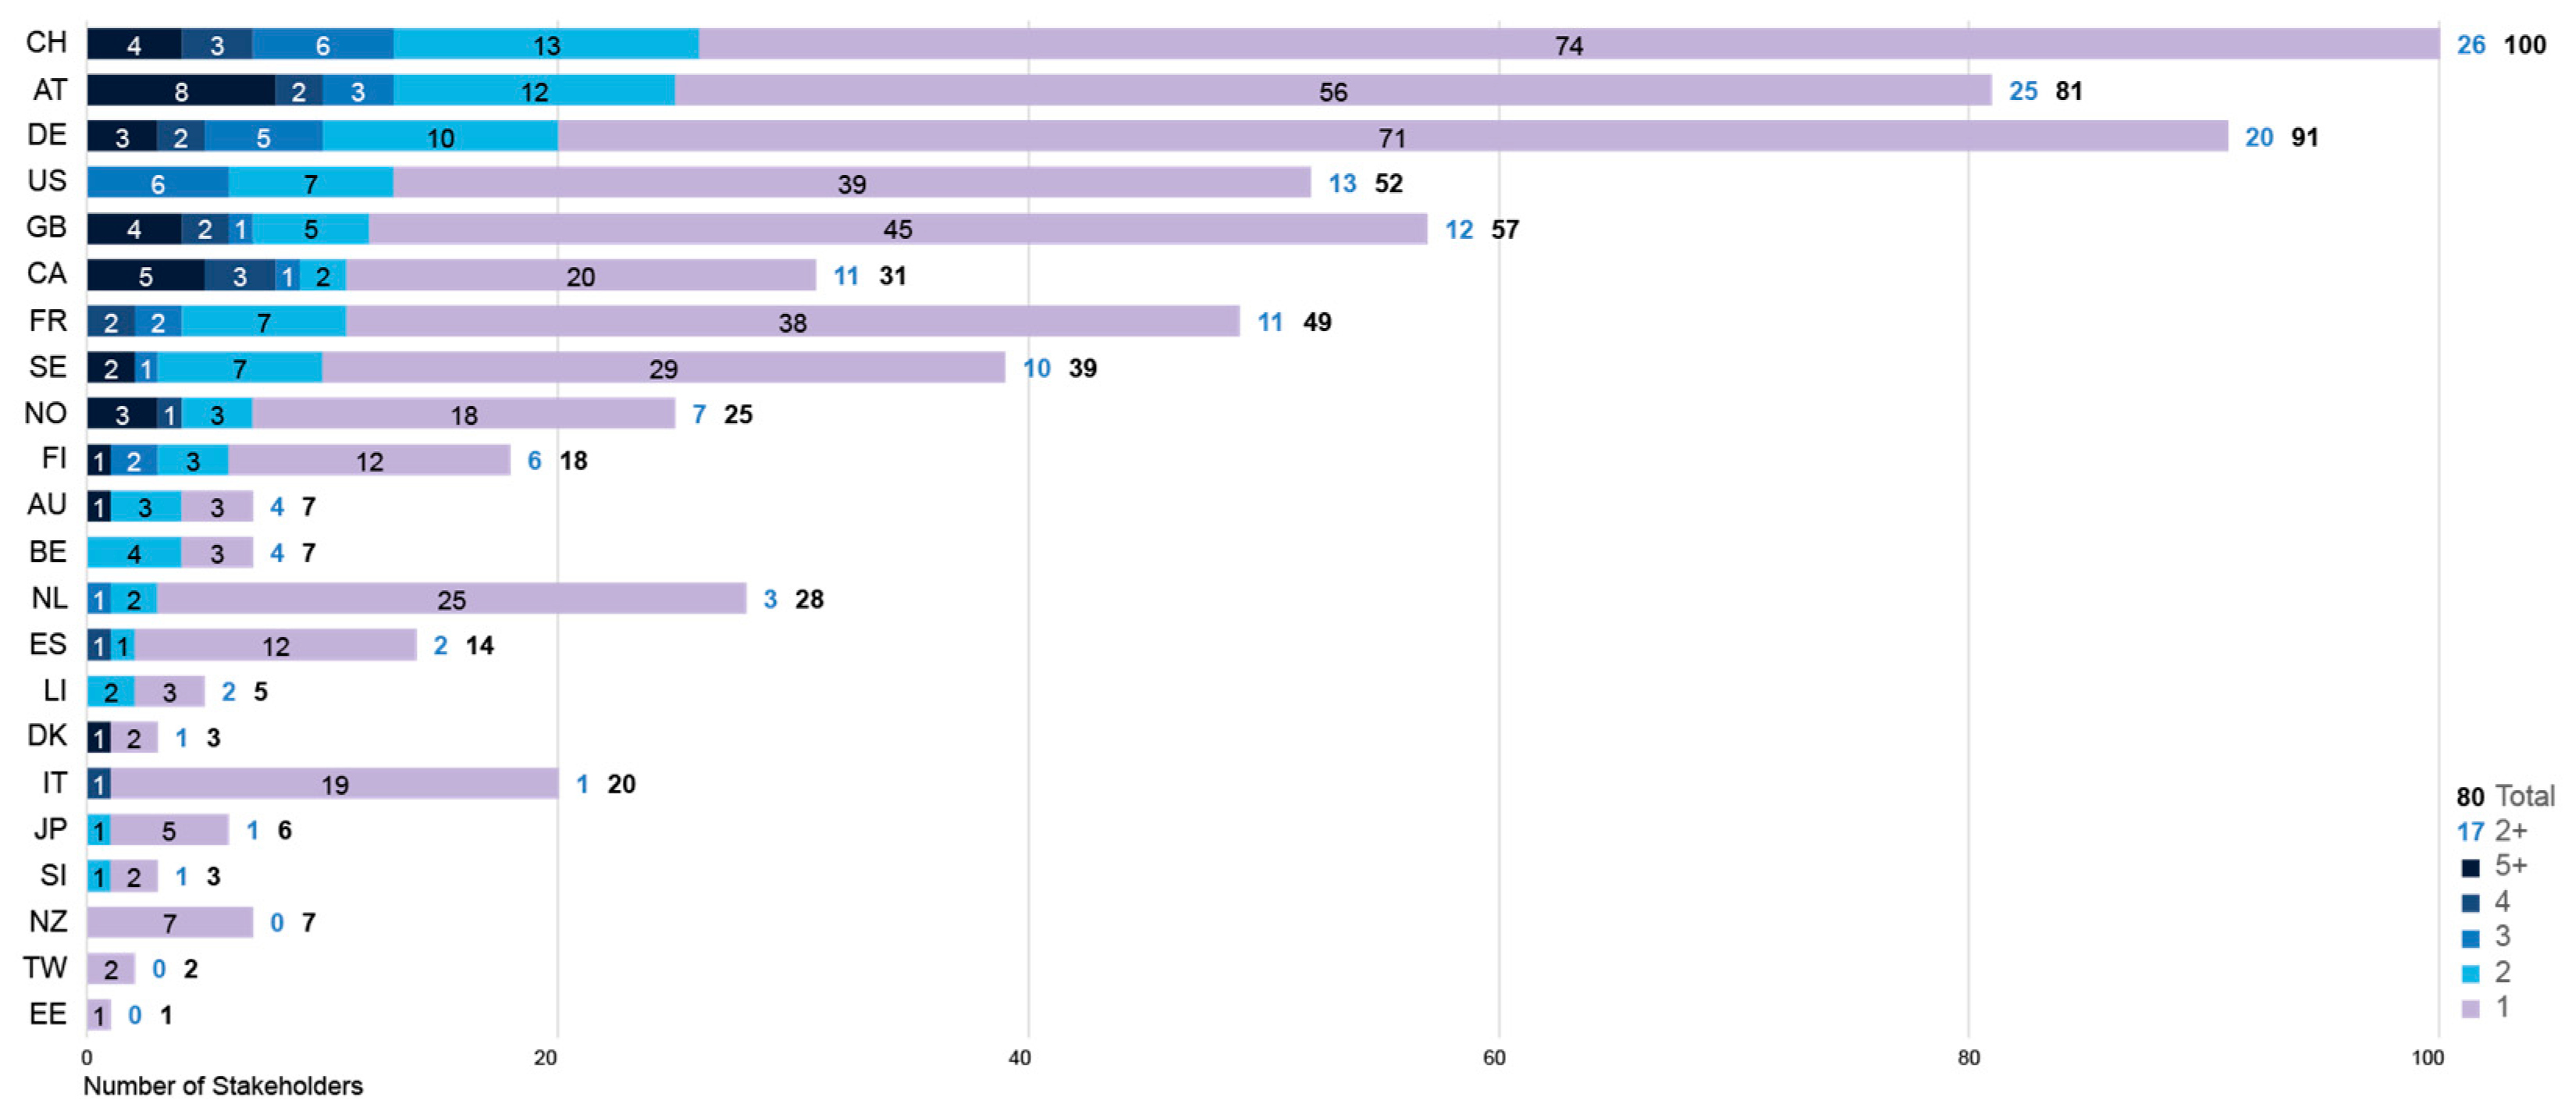
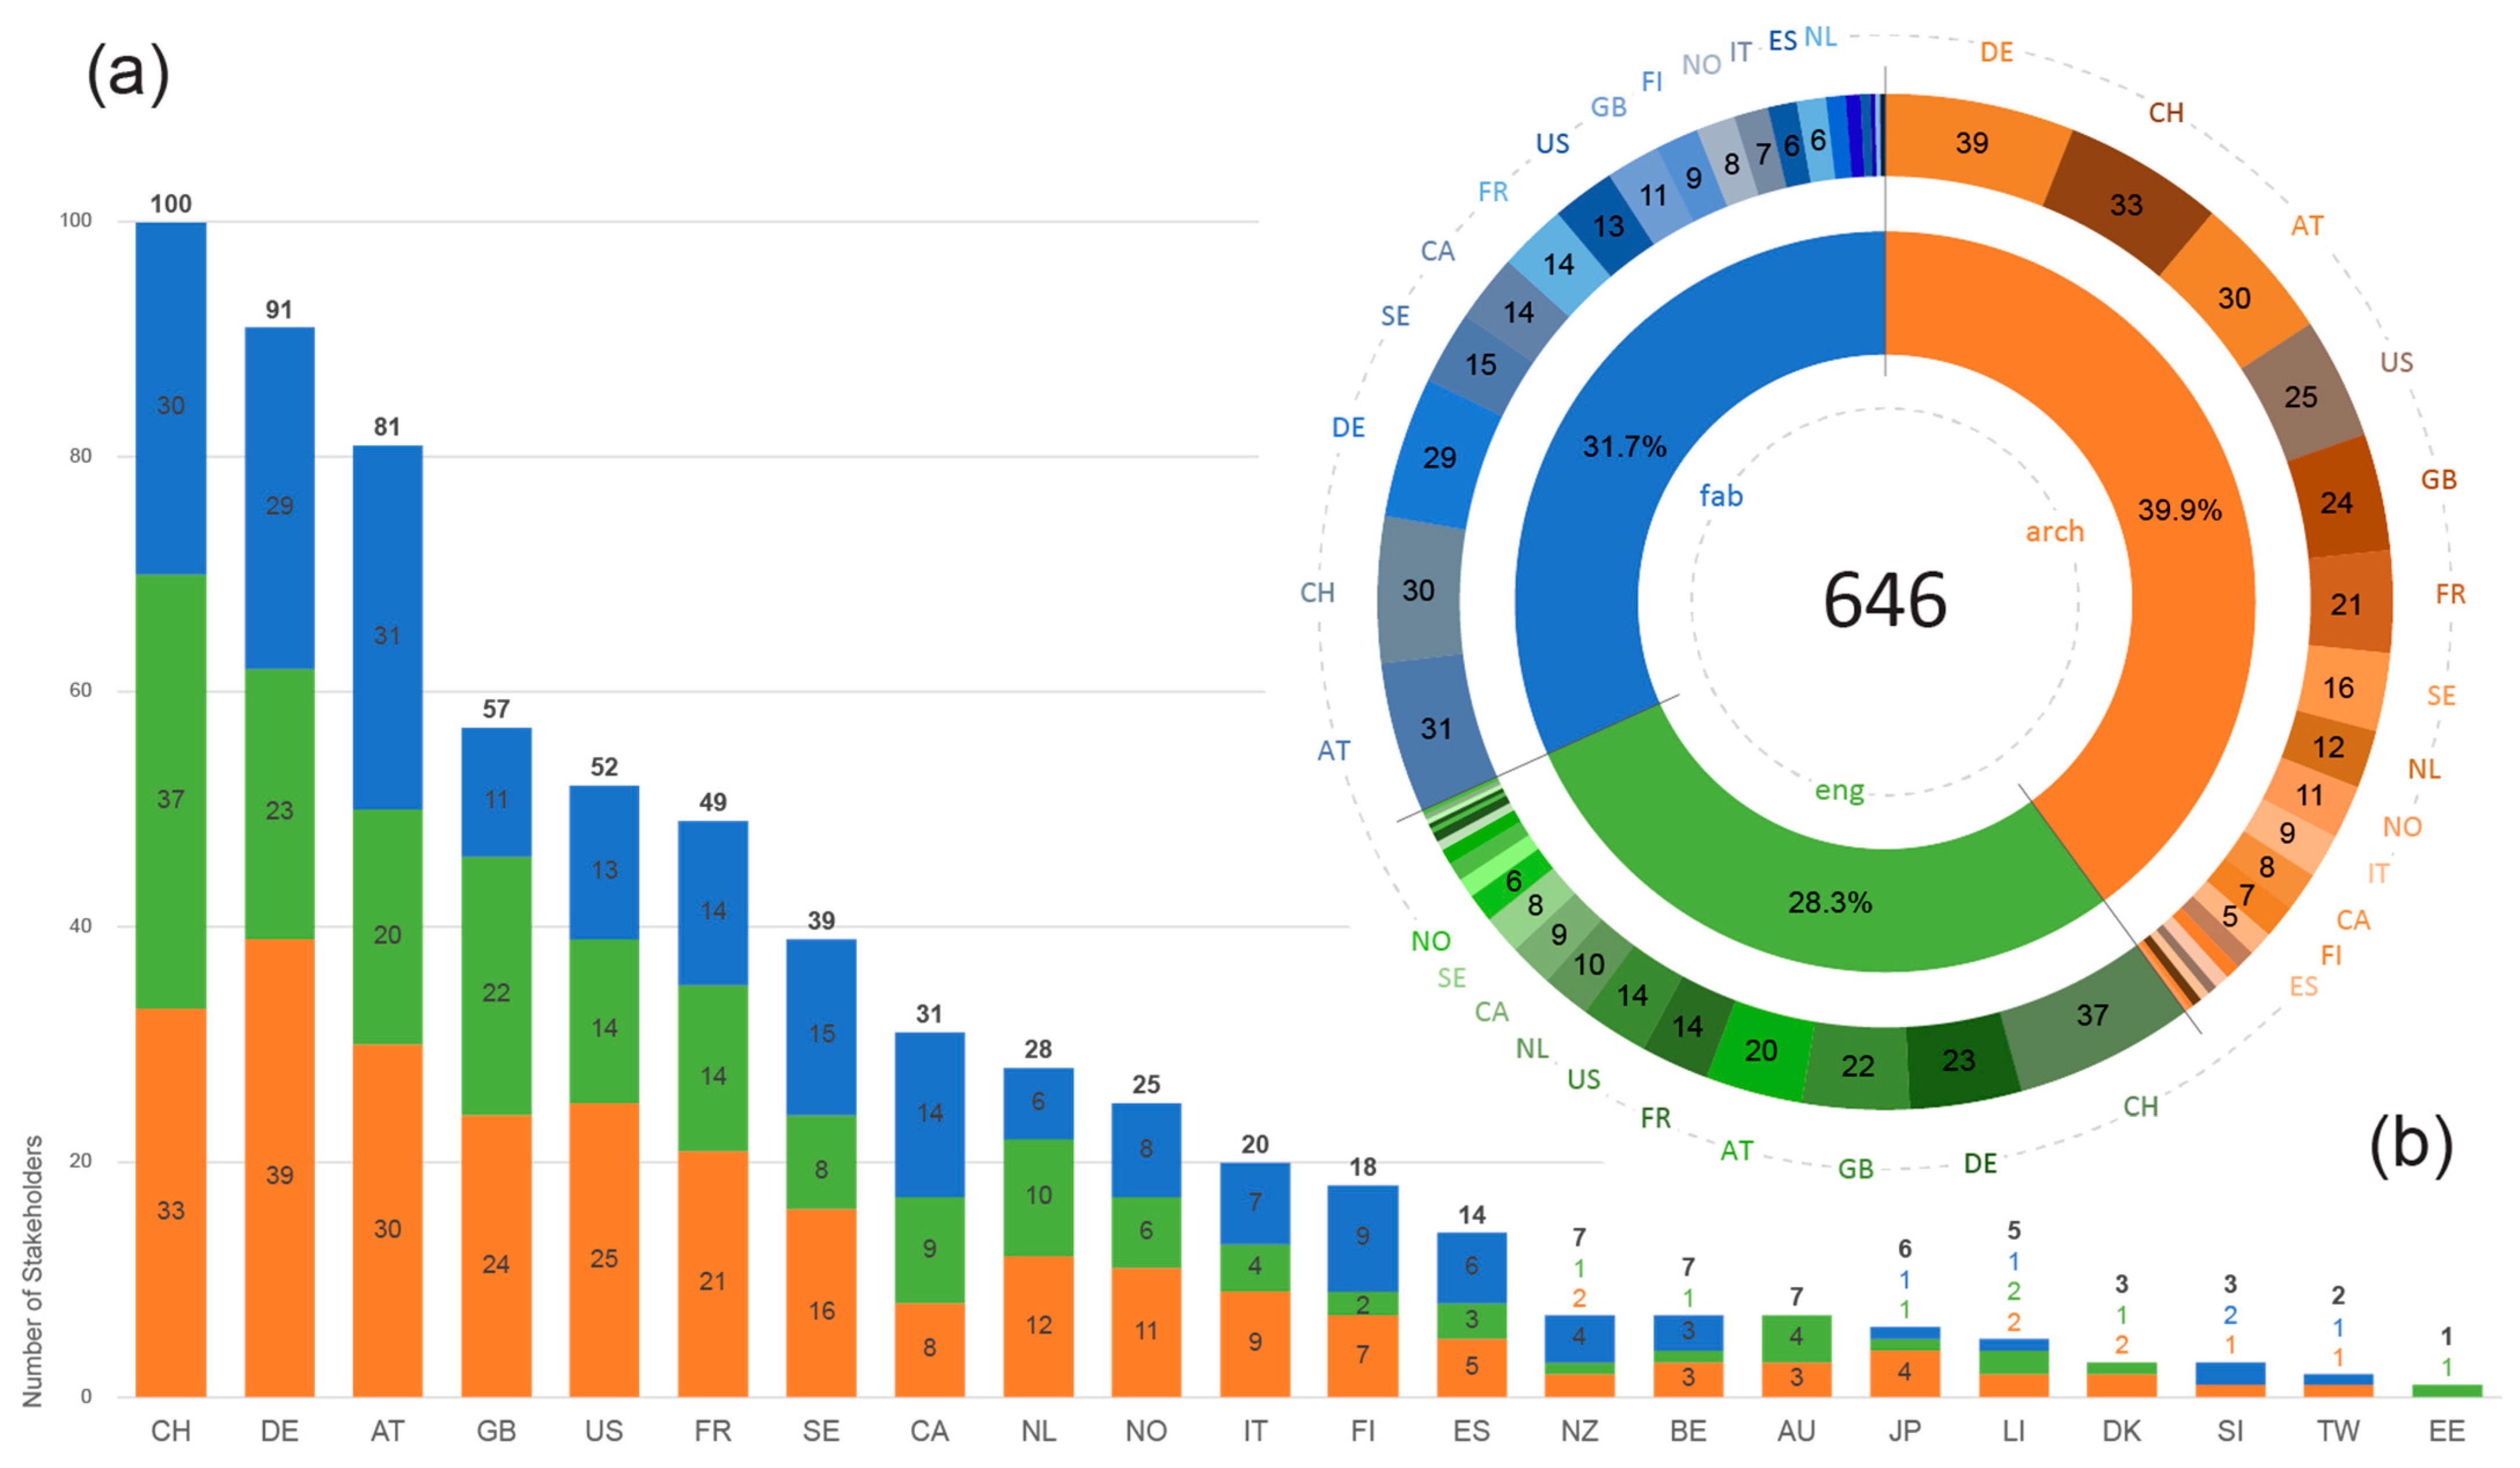
3.1.1. Stakeholder Location
3.1.2. Project Locations
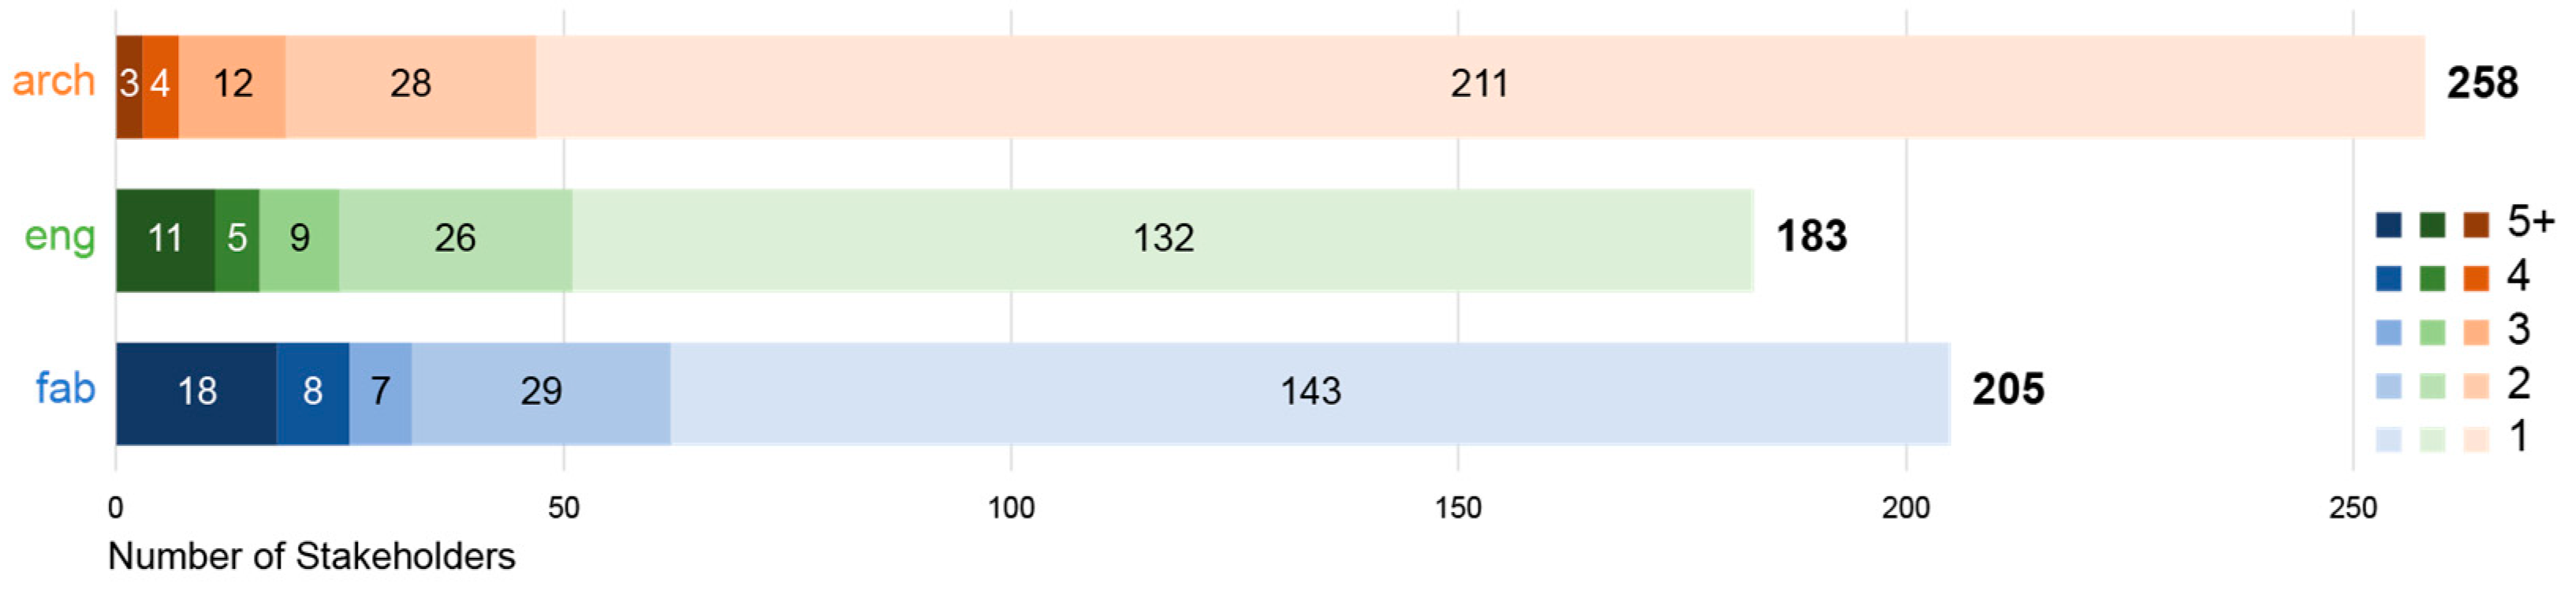
3.1.3. Recurrent Stakeholders
3.2. General Analysis Results
3.2.1. Service Categories
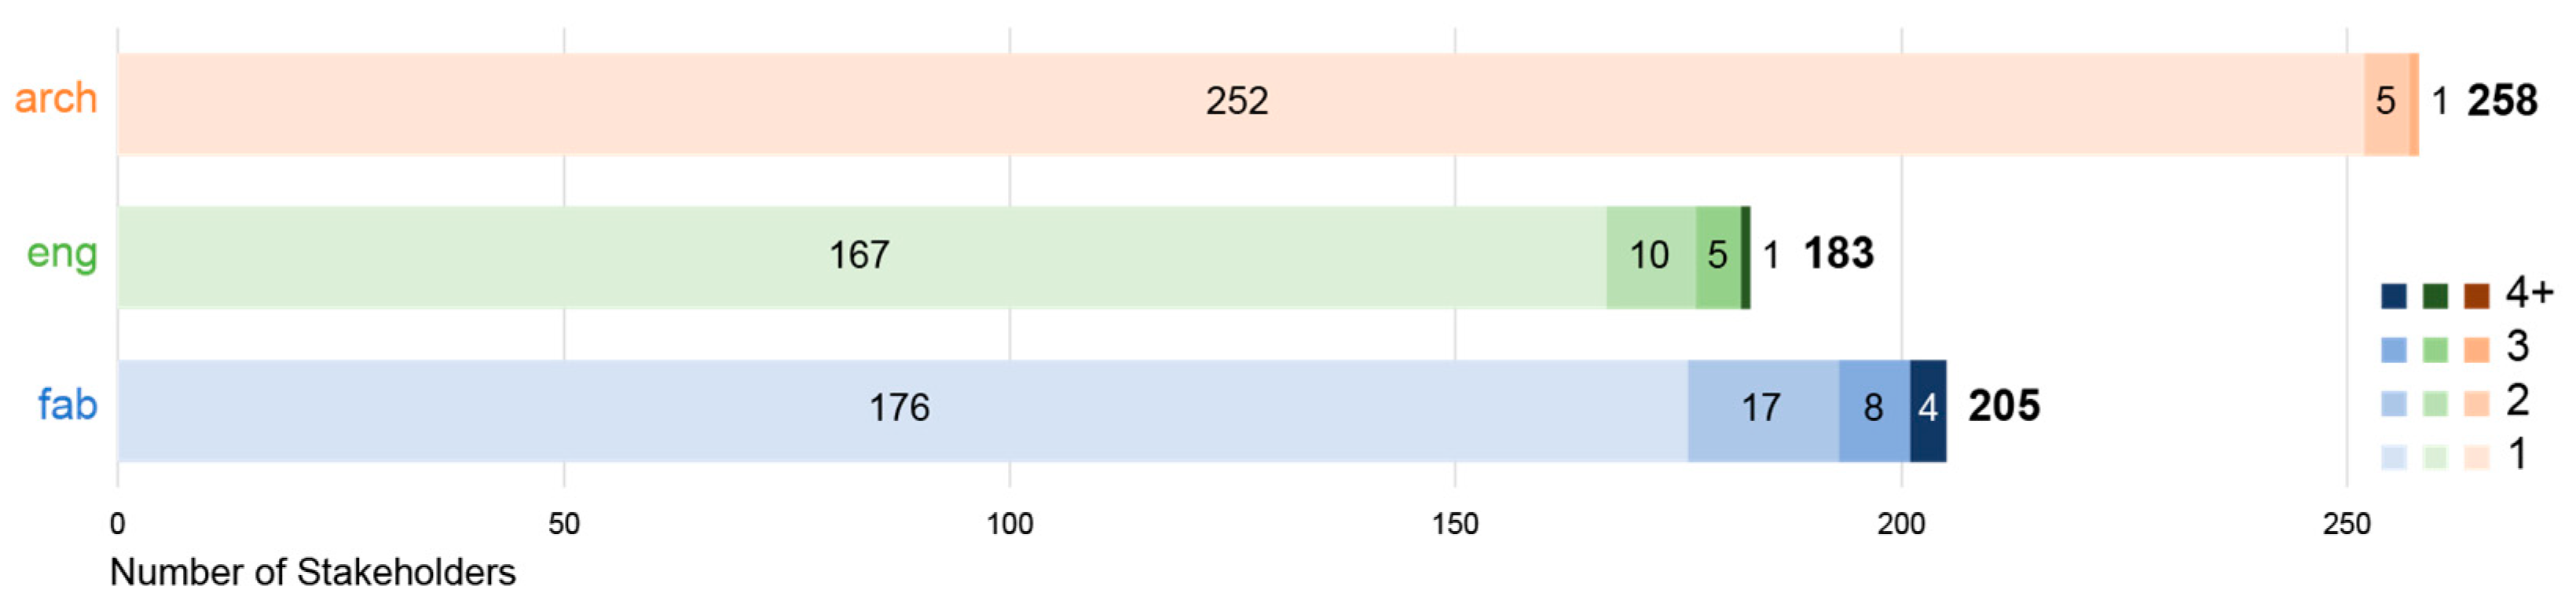
3.2.2. Stakeholder Type
3.2.3. Recurrent Stakeholders
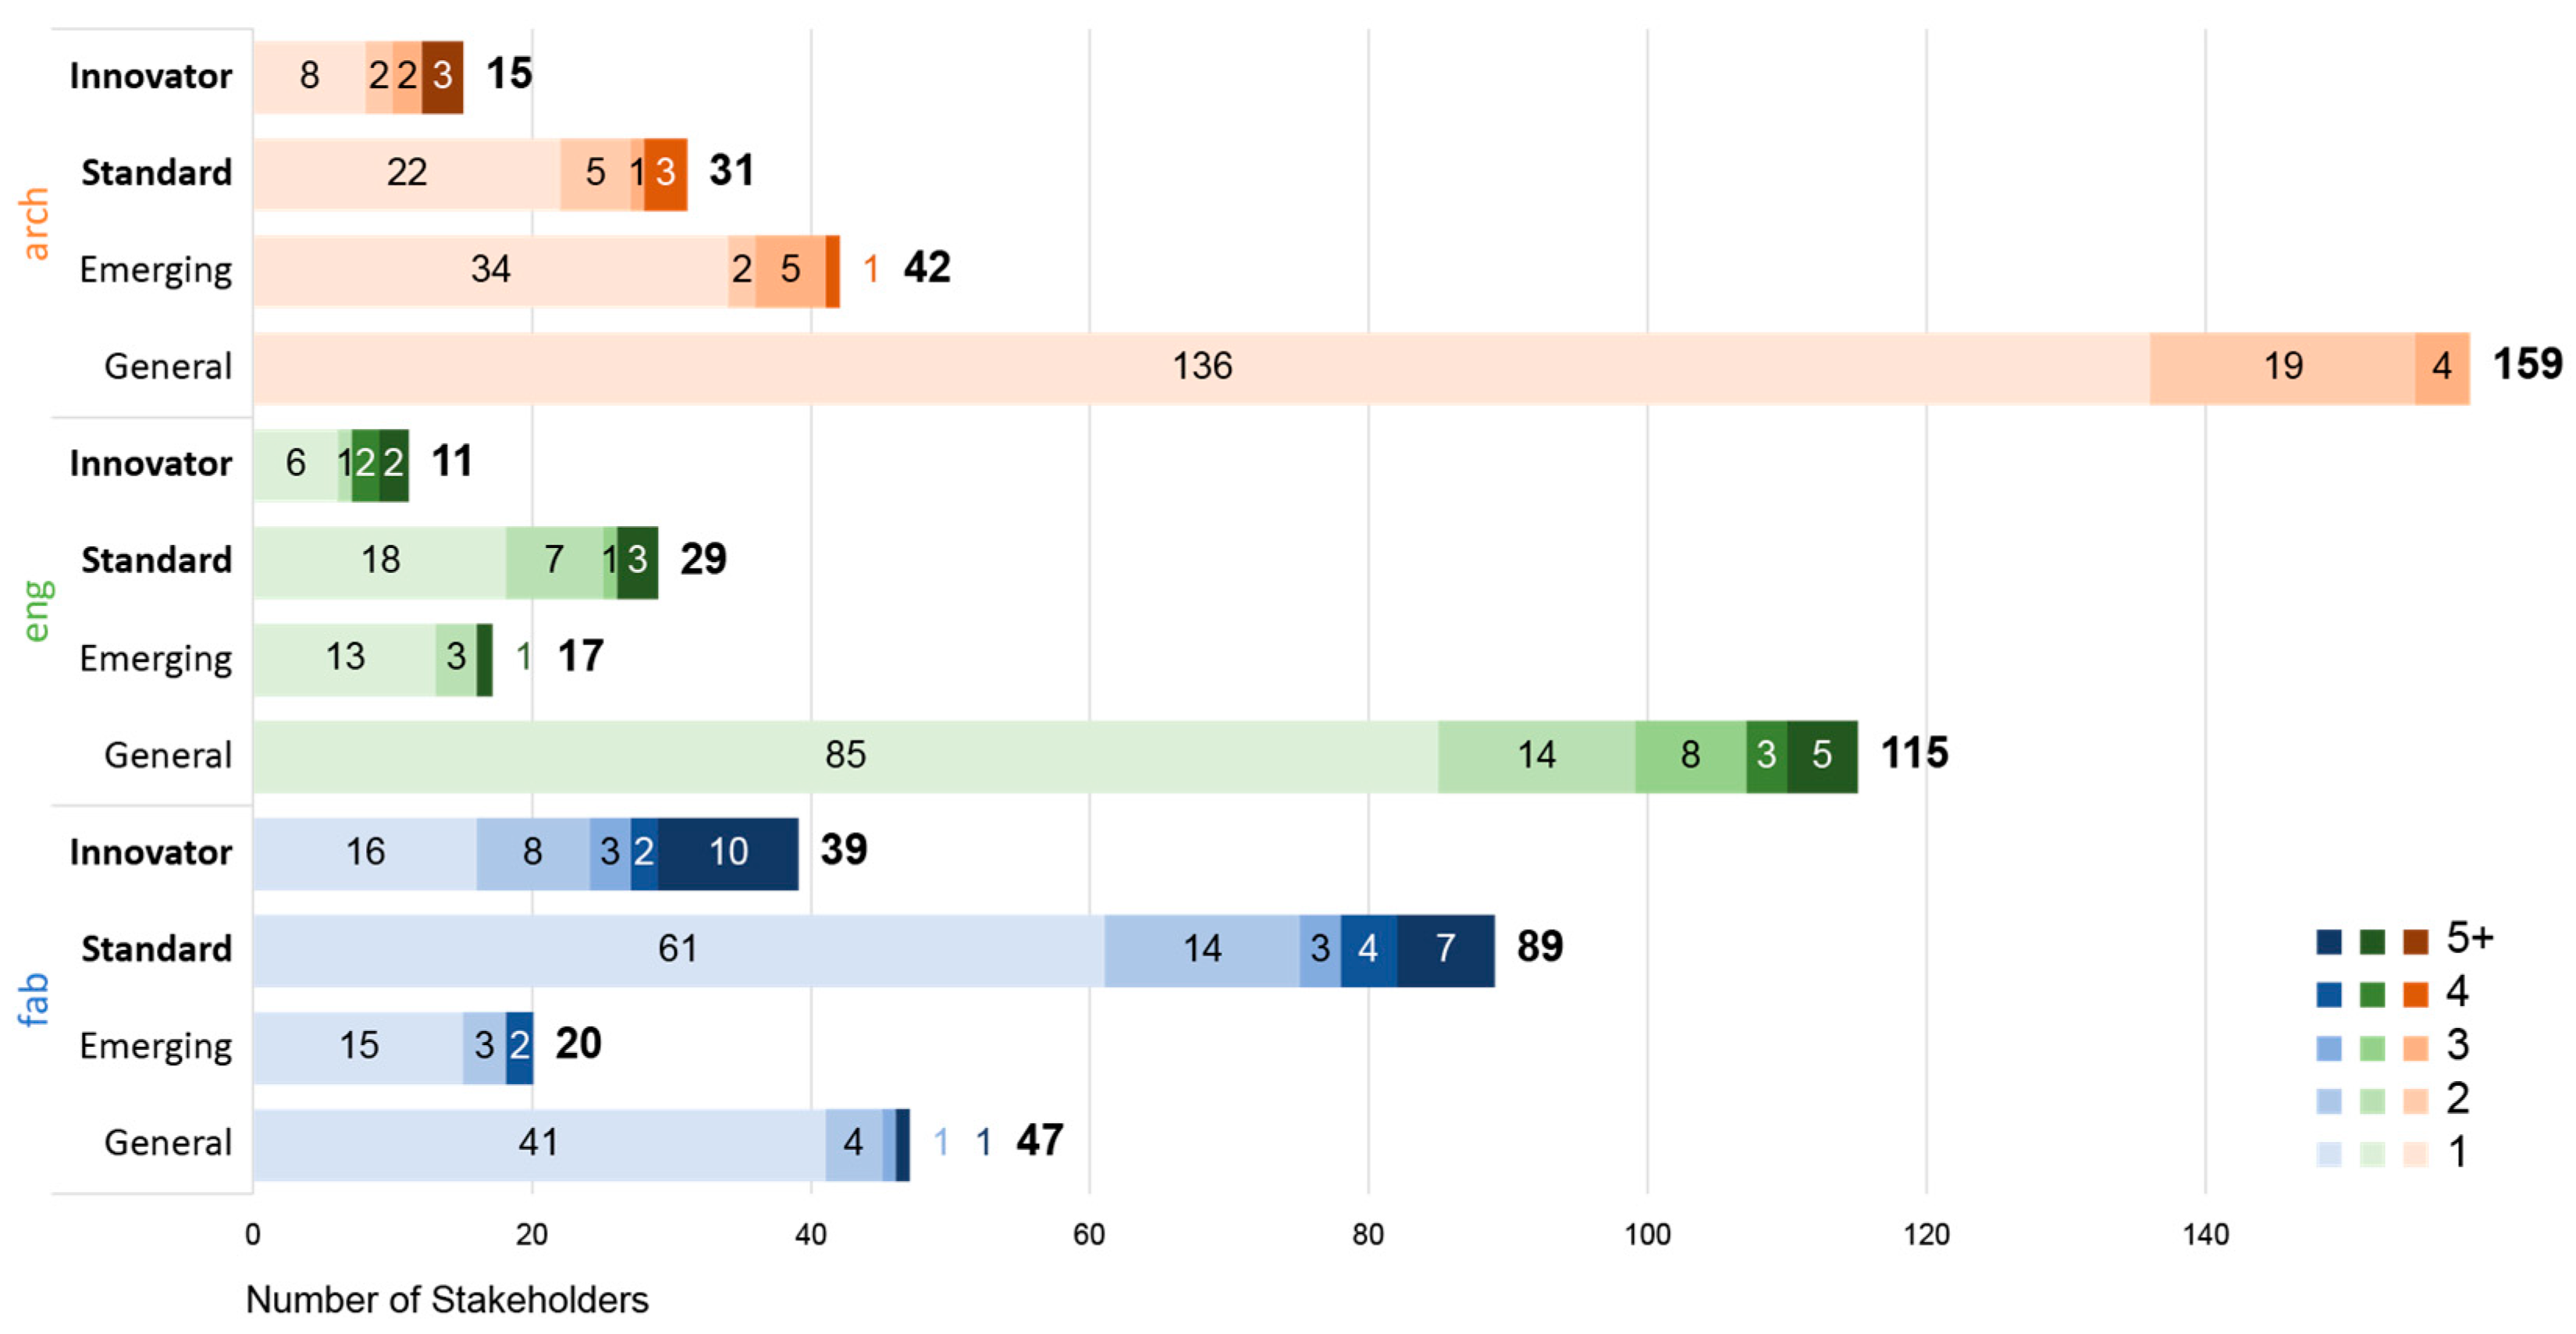
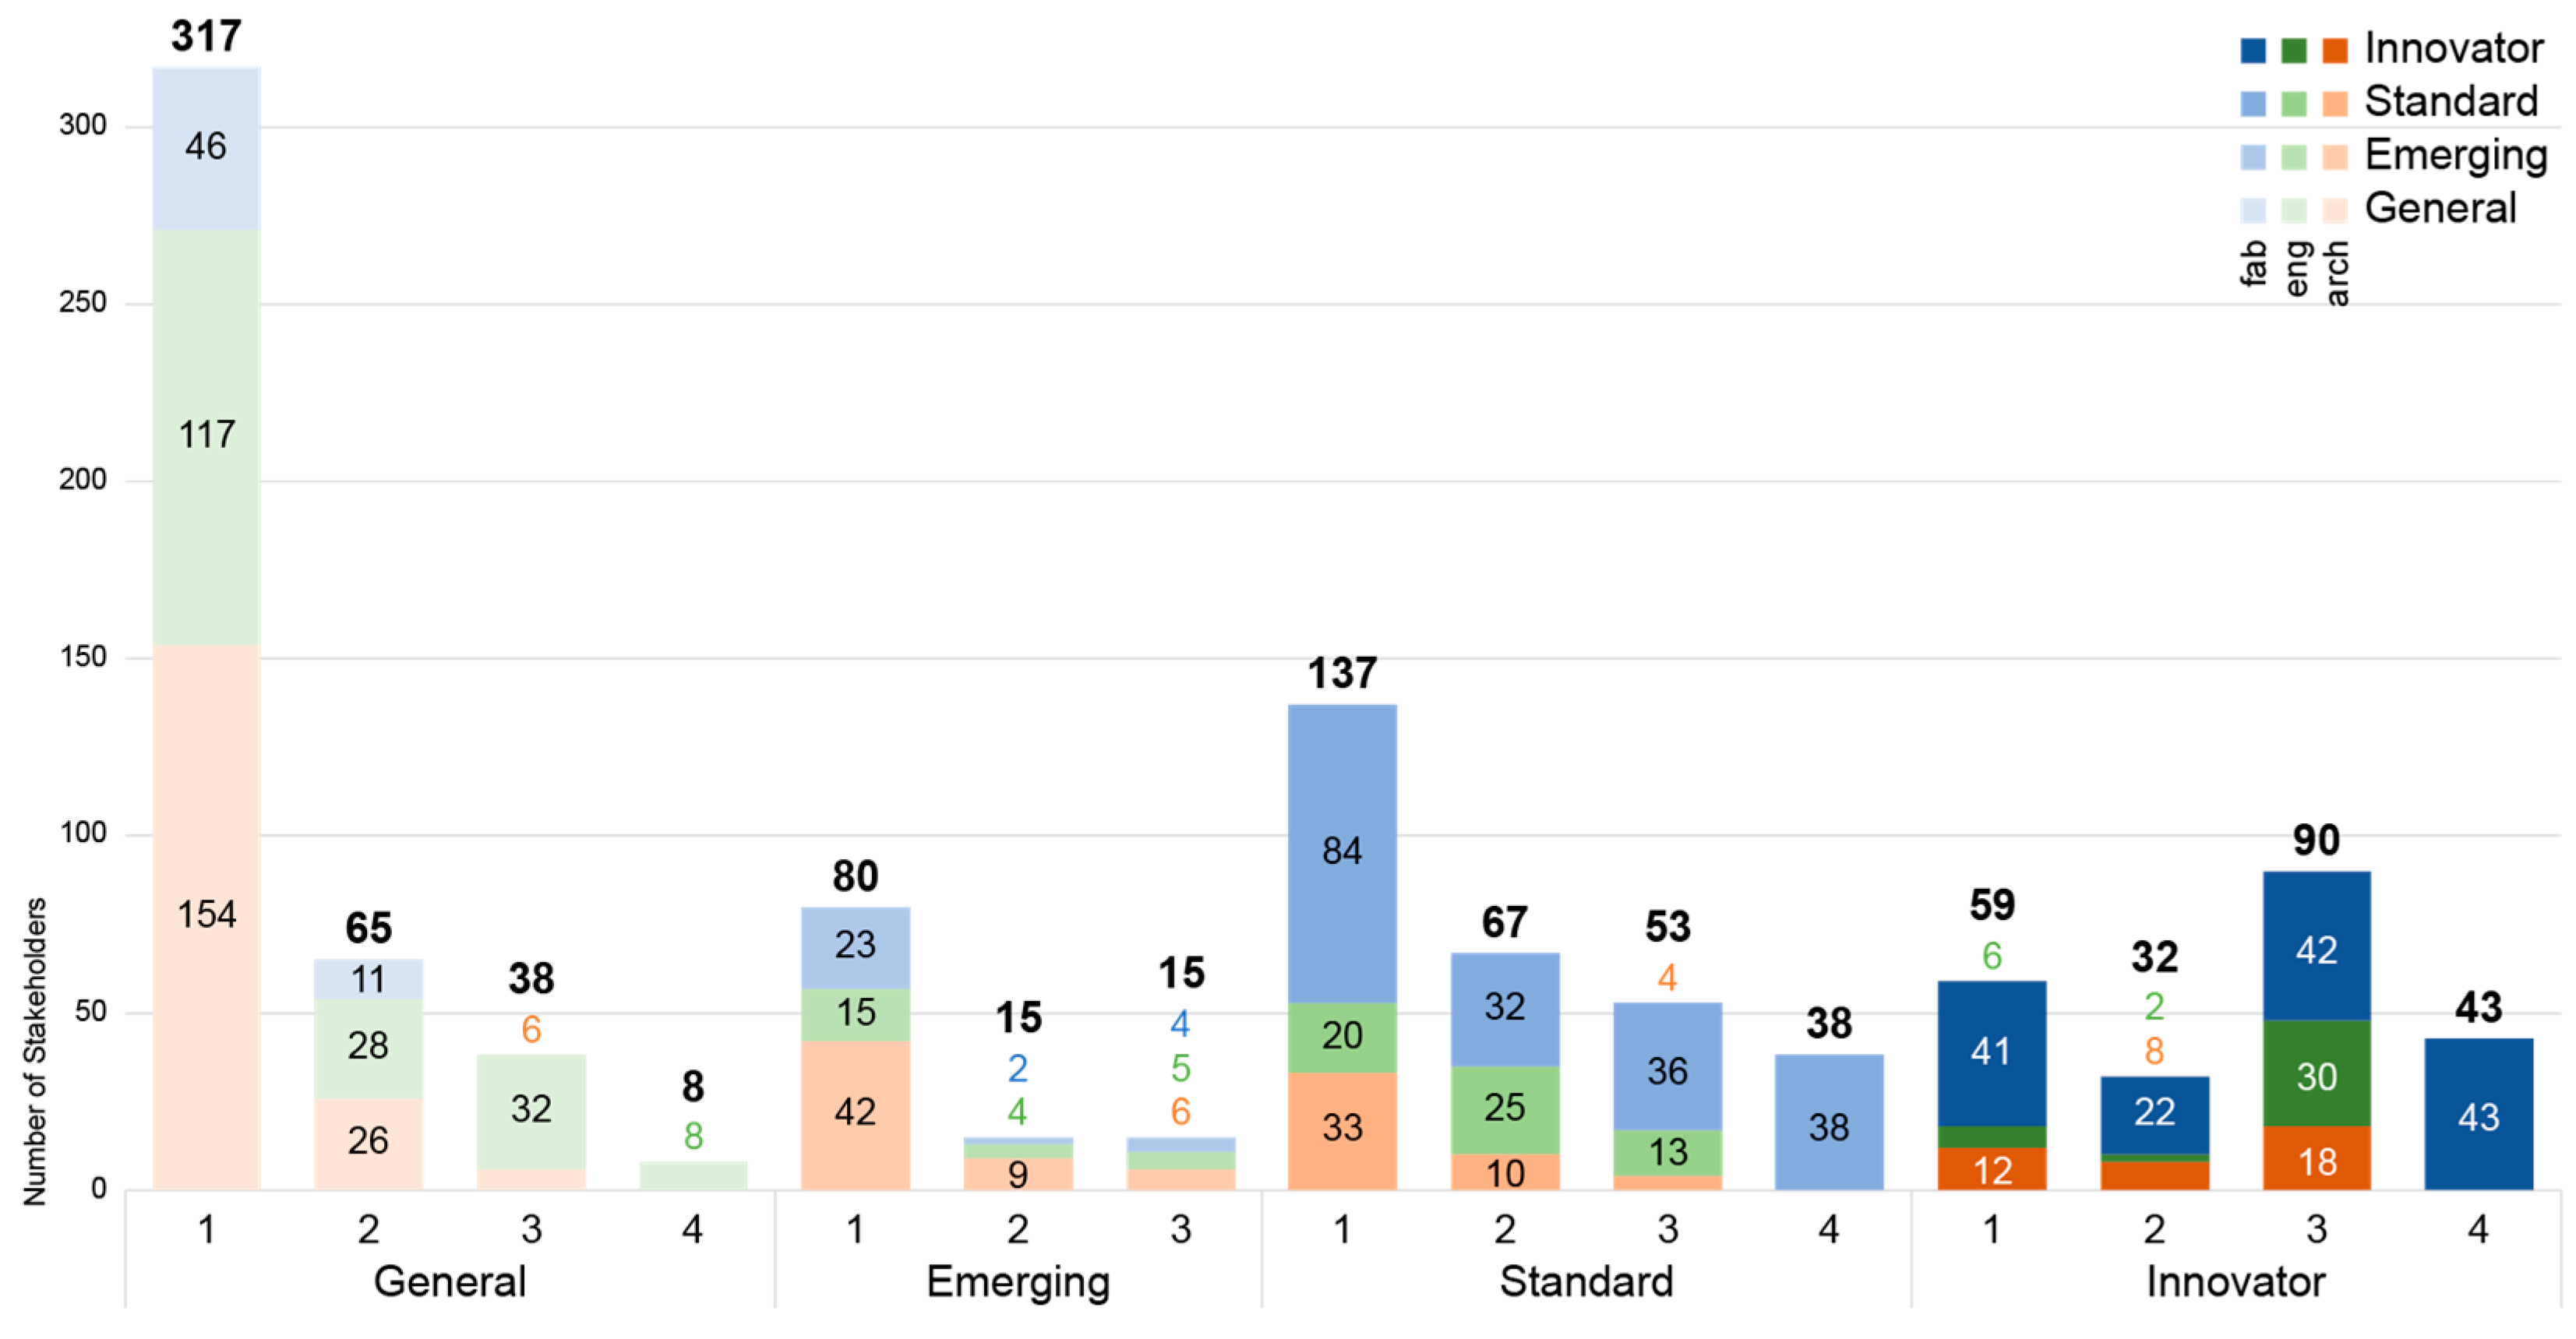
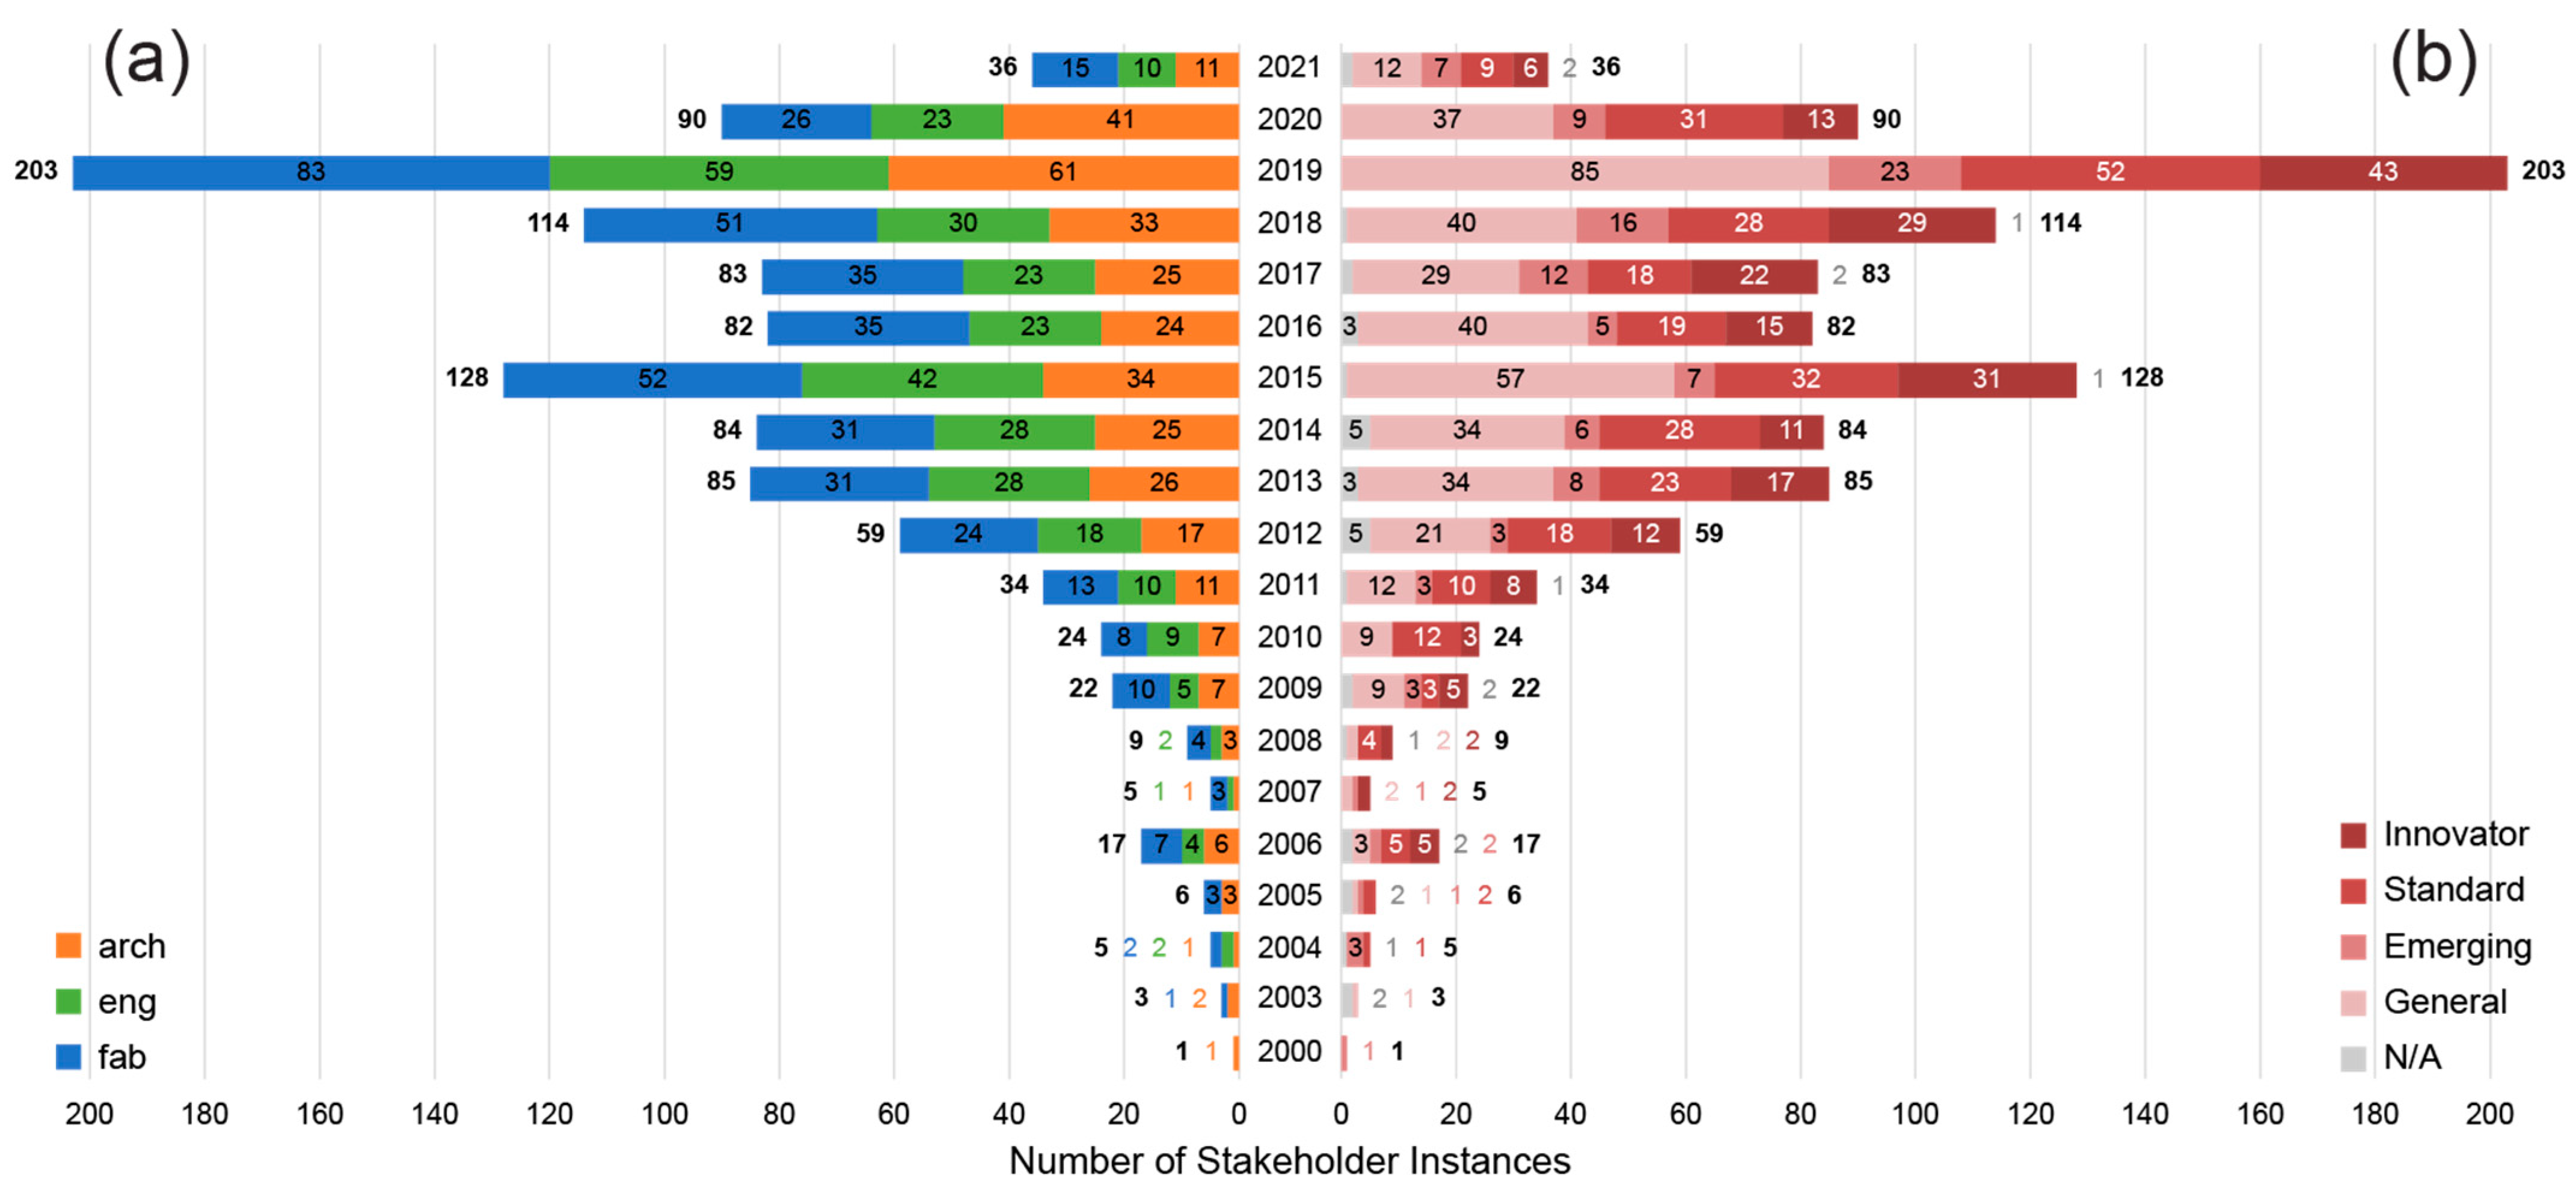
3.3. Level of Expertise Results
3.3.1. Project Program Analysis
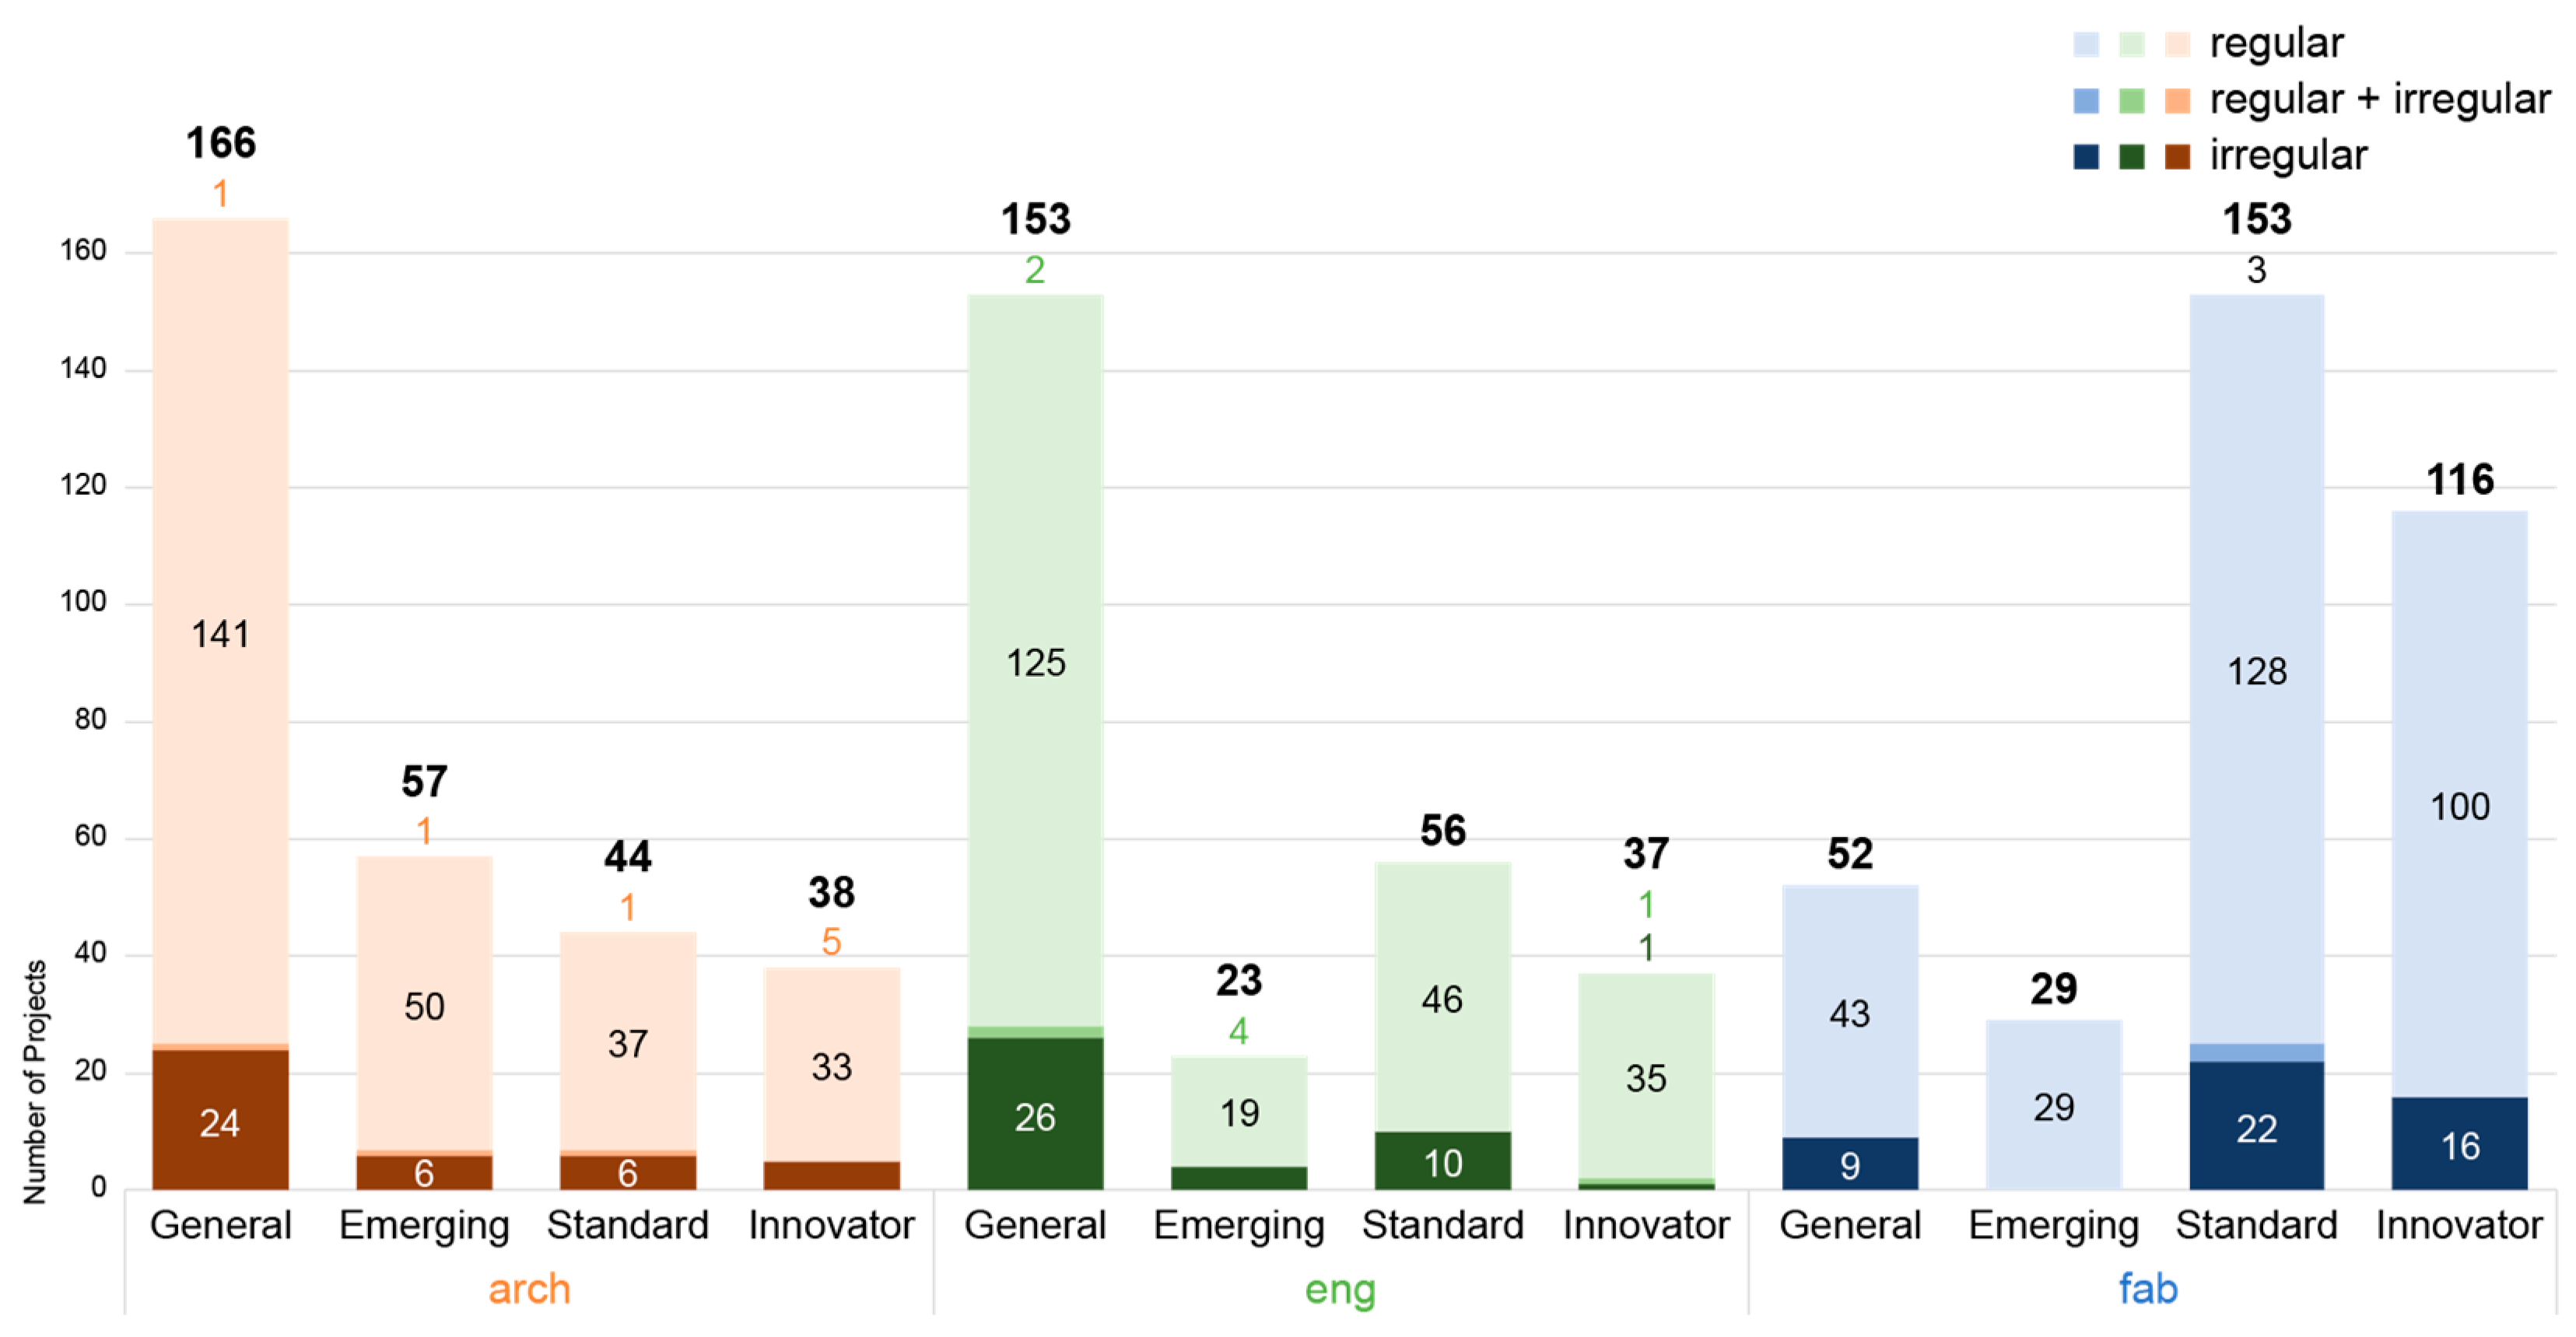
3.3.2. Project Massing Analysis
3.3.3. Project Year Analysis
3.4. Interconnectivity Results
3.4.1. Projects Network
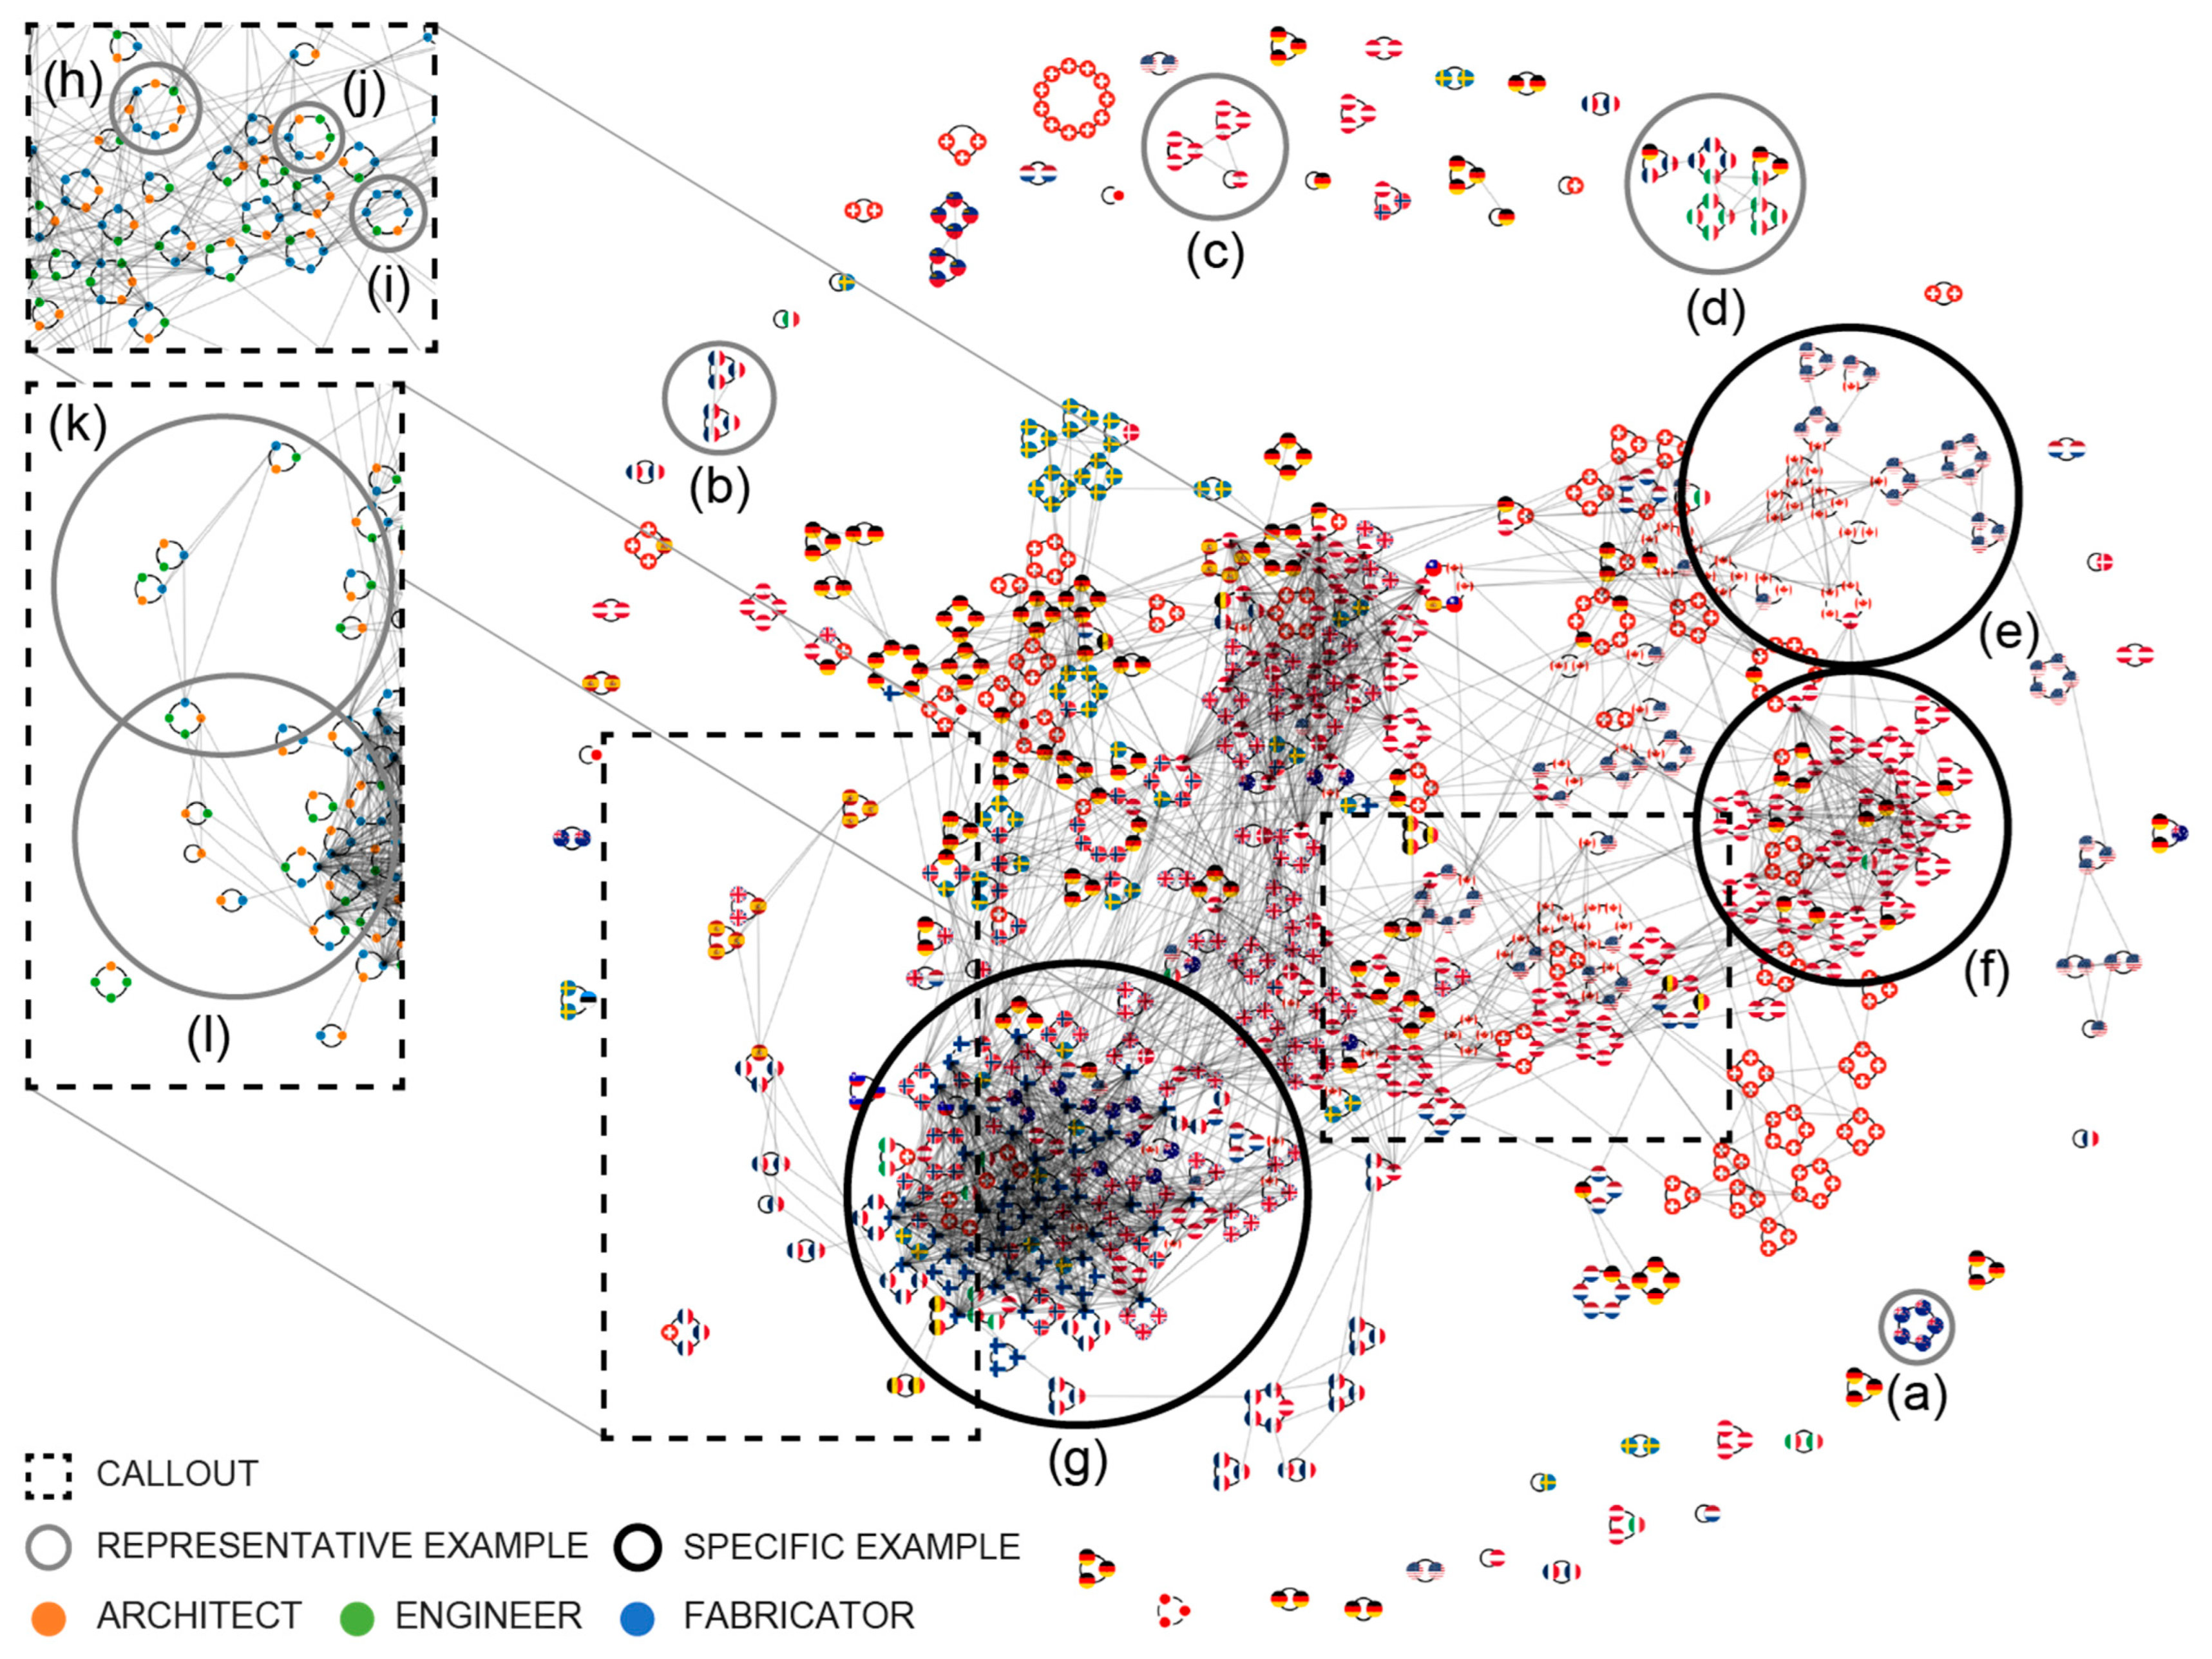
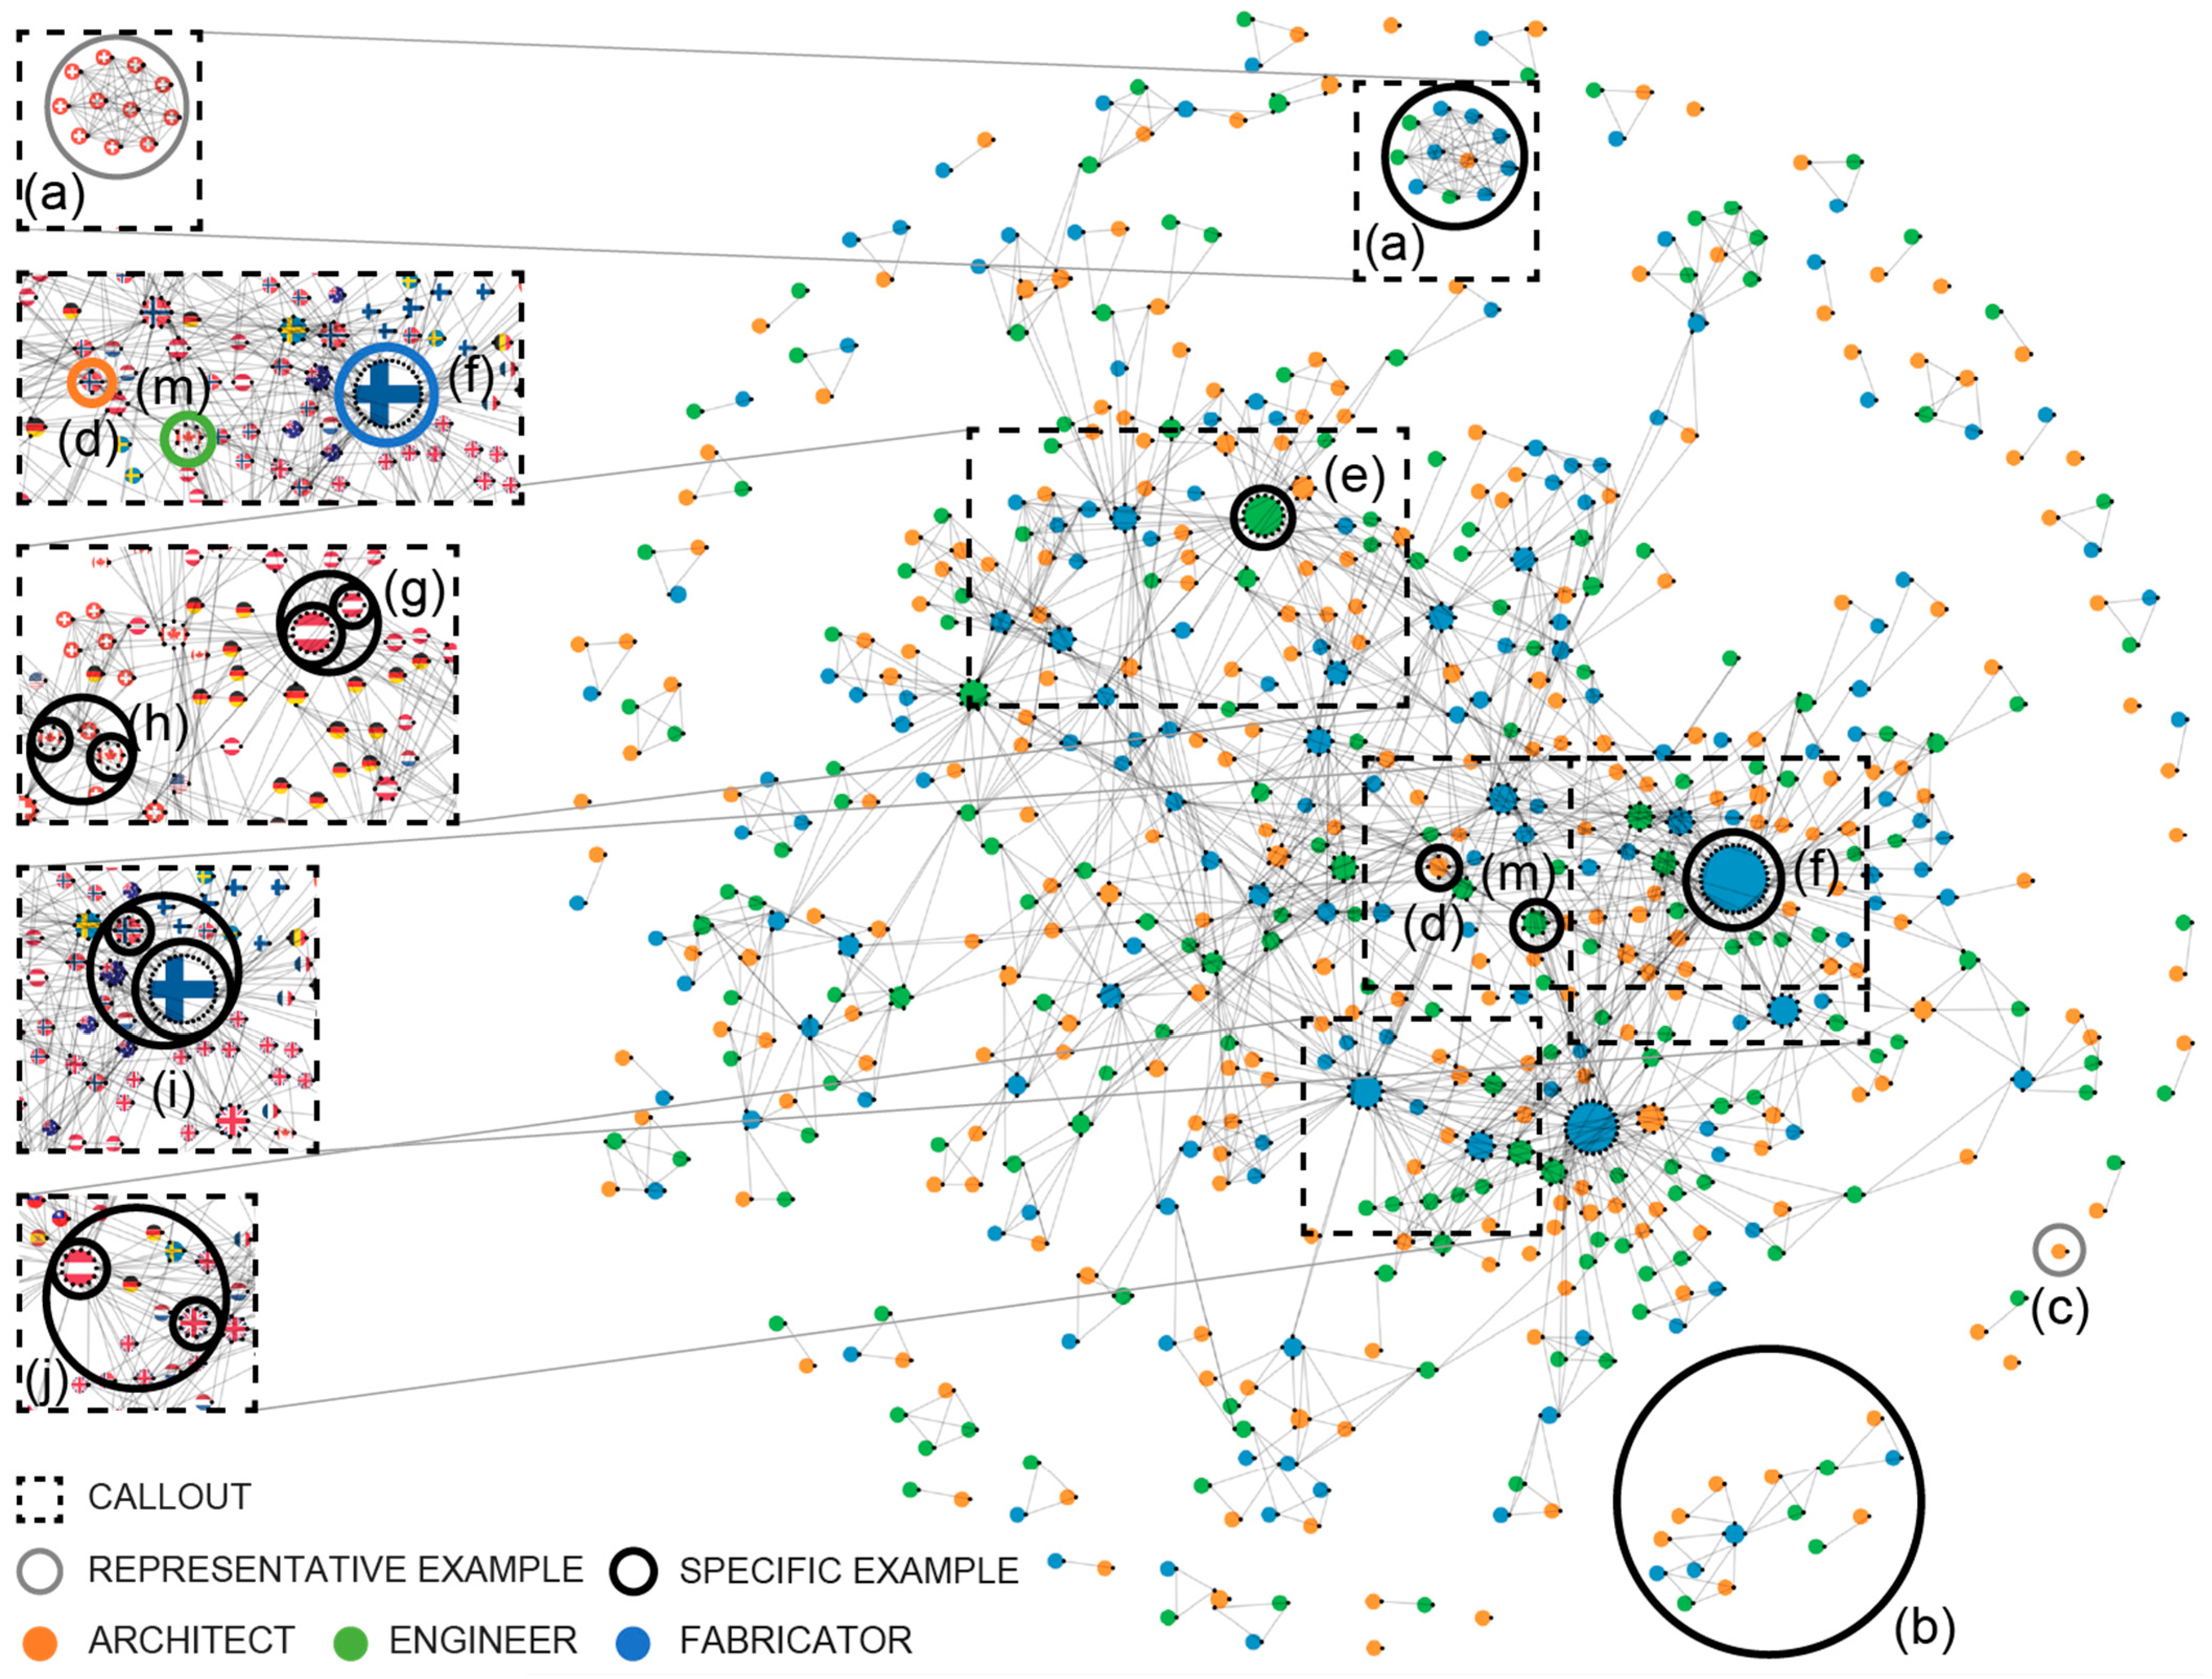
3.4.2. Stakeholders Network
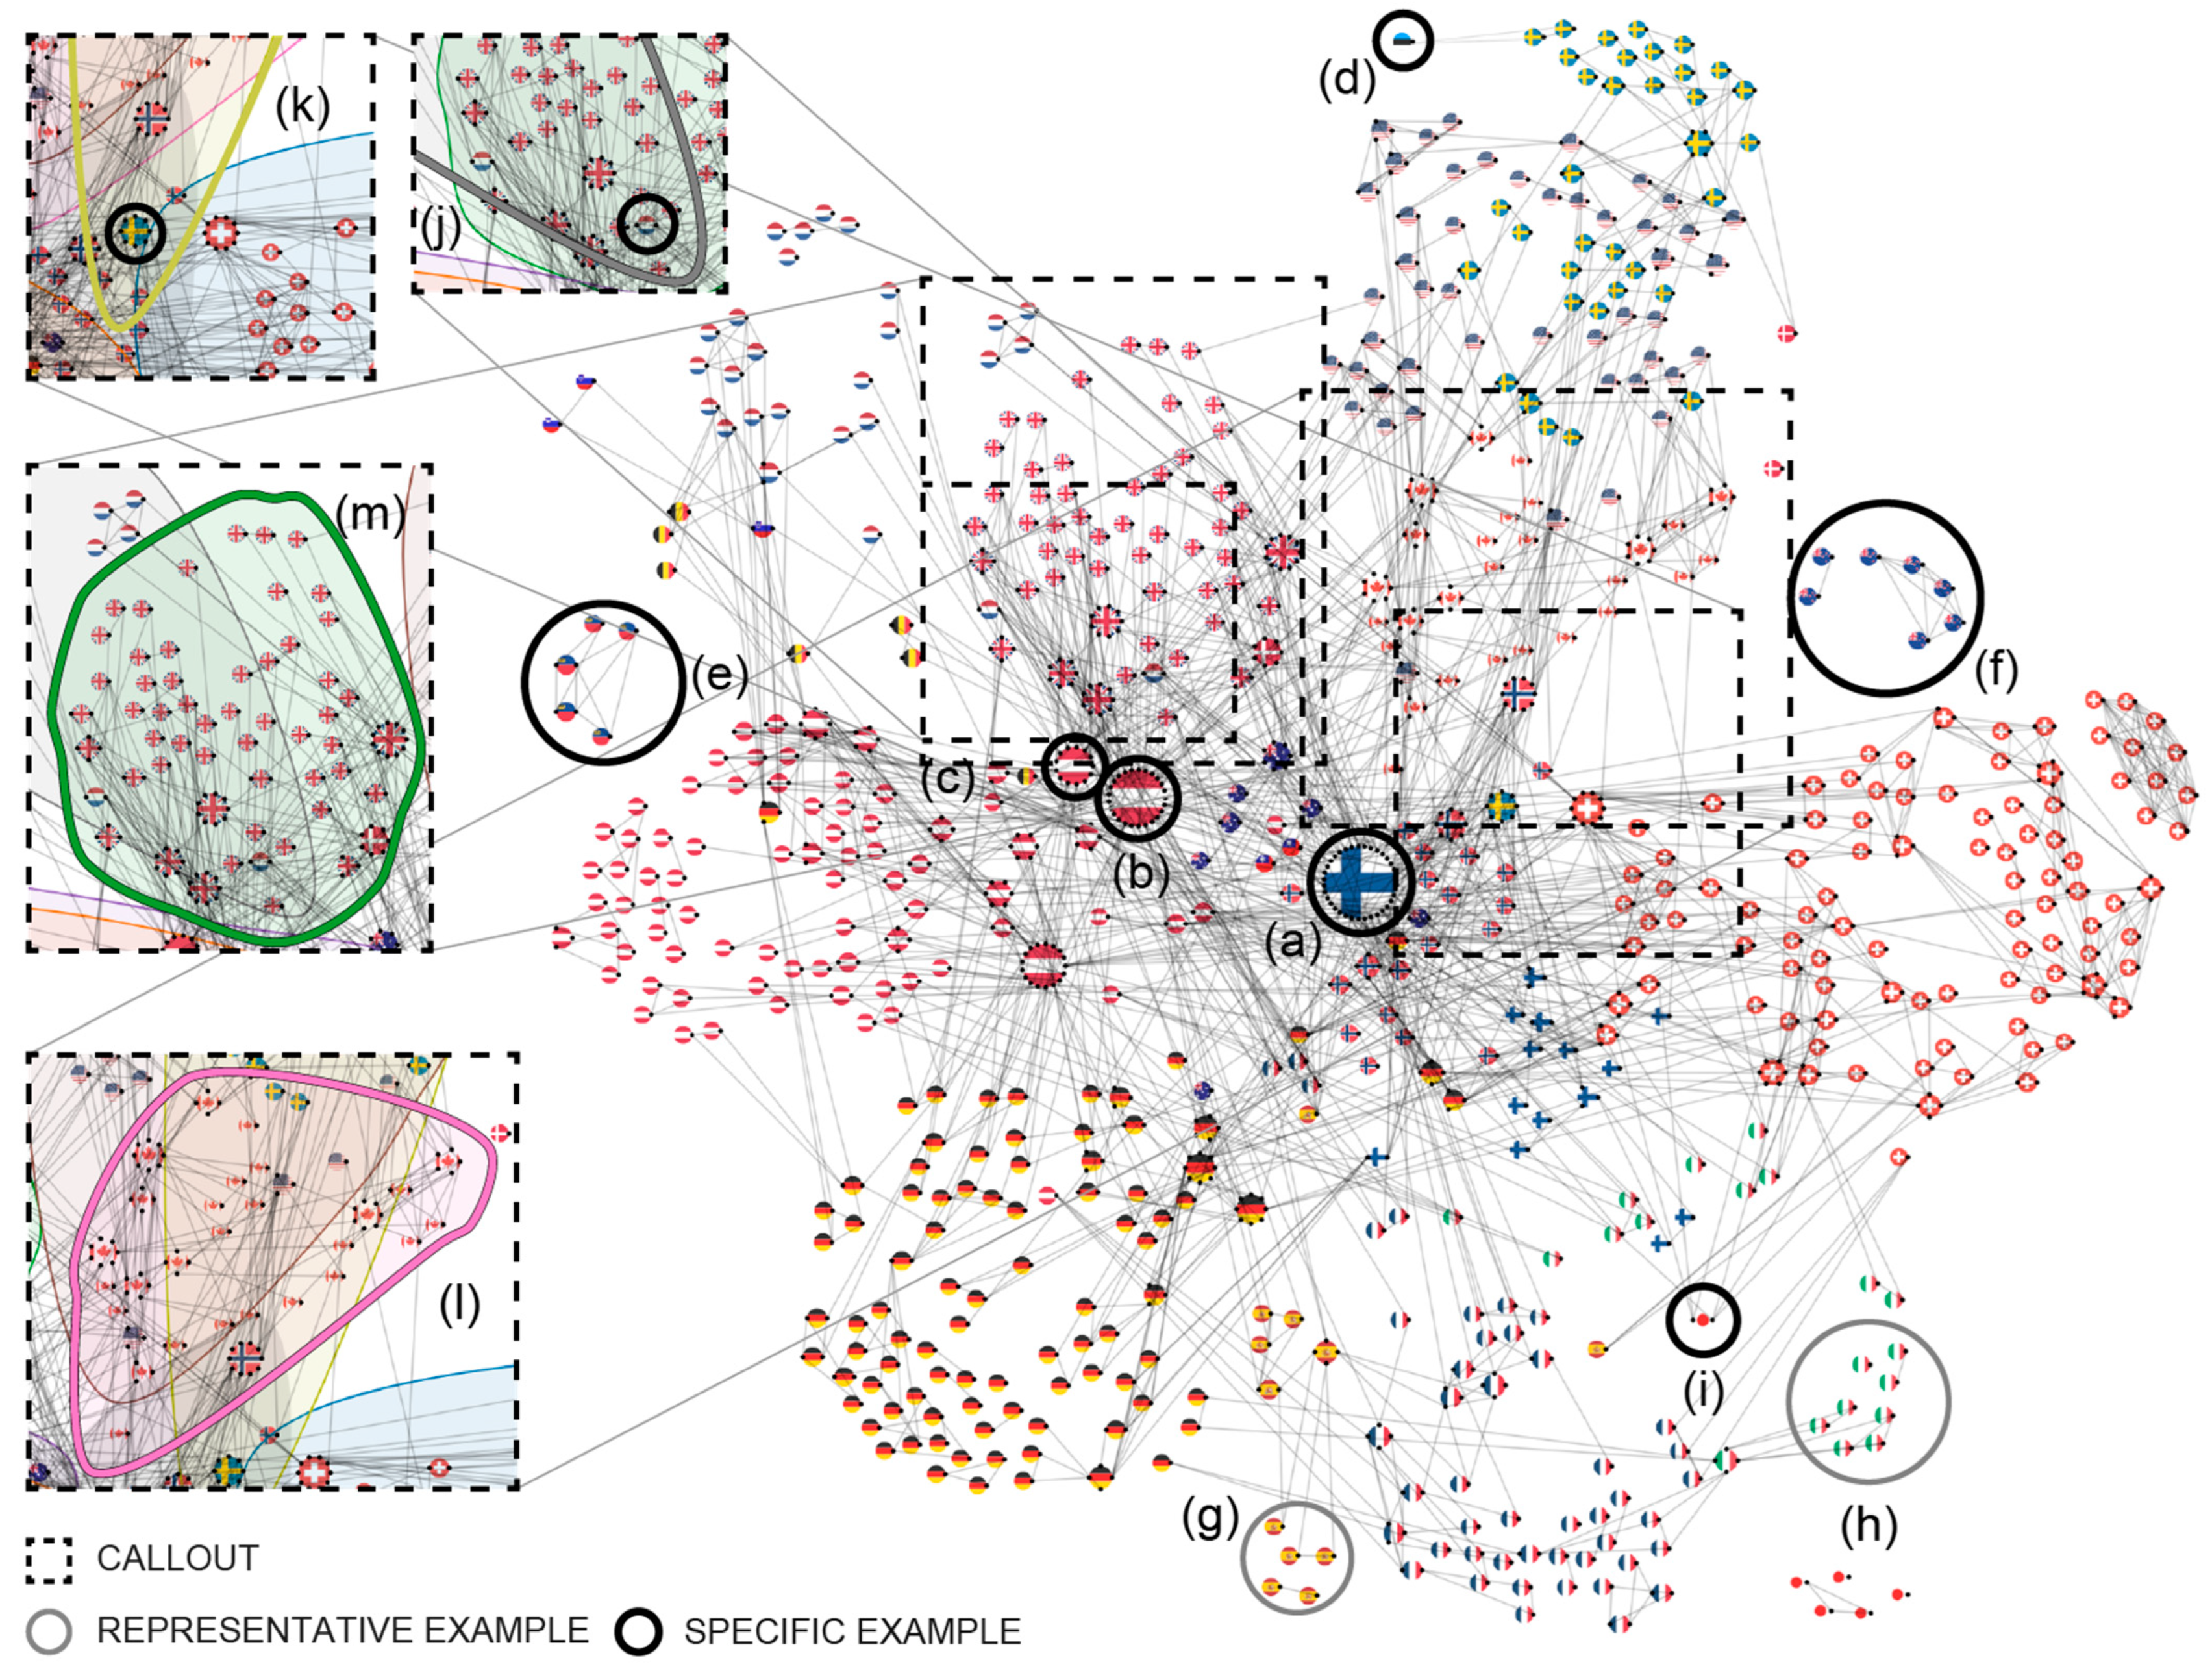
3.4.3. Stakeholder Countries Network
4. Discussion
5. Conclusions
Supplementary Materials
Author Contributions
Funding
Data Availability Statement
Acknowledgments
Conflicts of Interest
Appendix A

| ID | Name | Country | City | LoE | # of Projects | # of Proj. Countries |
|---|---|---|---|---|---|---|
| 259 | Hermann Kaufmann + Partner ZT GmbH | AT | Schwarzach | Inn | 6 | 3 |
| 311 | Jean-Paul Viguier | FR | Paris | Eme | 4 | 2 |
| 400 | Michael Green Architects | CA | Vancouver | Sta | 4 | 2 |
| 180 | dRMM | GB | London | Inn | 3 | 2 |
| 453 | Perkins & Will | US | Chicago | Eme | 3 | 2 |
| 212 | Fokkema & Partners | NL | Delft | Gen | 2 | 2 |
| ID | Name | Country | City | LoE | # of Projects | # of Proj. Countries |
|---|---|---|---|---|---|---|
| 634 | WSP | CA | Montreal | Gen | 7 | 5 |
| 398 | Merz Kley Partner | AT | Dornbirn | Inn | 17 | 3 |
| 457 | Pirmin Jung | CH | Rain | Sta | 10 | 3 |
| 356 | Lendlease DesignMake | AU | Melbourne | Gen | 7 | 3 |
| 196 | Equilibrium Consulting | CA | Vancouver | Sta | 5 | 3 |
| 64 | ARUP | GB | London | Gen | 4 | 3 |
| ID | Name | Country | City | LoE | # of Projects | # of Proj. Countries |
|---|---|---|---|---|---|---|
| 555 | Stora Enso | FI | Helsinki | Inn | 35 | 12 |
| 334 | KLH Massivholz GmbH | AT | Teufenbach | Sta | 25 | 9 |
| 99 | binderholz | AT | Fügen | Sta | 13 | 7 |
| 248 | Hasslacher Norica Timber | AT | Sachsenburg | Inn | 5 | 4 |
| 394 | Mayr-Melnhof Holz | AT | Leoben | Inn | 8 | 3 |
| 631 | Woodcon | NO | Brumunddal | Sta | 8 | 3 |
| 646 | Züblin Timber | DE | Stuttgart | Inn | 8 | 3 |
| 328 | Kaufmann Bausysteme | AT | Reuthe | Sta | 6 | 3 |
| 186 | Egoin | ES | Bilbao | Sta | 4 | 3 |
| 260 | Hess Timber | DE | Kleinheubach | Inn | 4 | 3 |
| 503 | Rubner Holzbau | IT | Kiens | Sta | 4 | 3 |
| 627 | Wiehag | AT | Altheim | Sta | 3 | 3 |
Appendix B
| ID | Name | Country | City | LoE | # of Projects |
|---|---|---|---|---|---|
| 616 | Waugh Thistleton Architects | GB | London | Inn | 9 |
| 259 | Hermann Kaufmann + Partner ZT GmbH | AT | Schwarzach | Inn | 6 |
| 321 | Kaden + Lager | DE | Berlin | Inn | 5 |
| 254 | Helen & Hard | NO | Oslo | Sta | 4 |
| 311 | Jean-Paul Viguier | FR | Paris | Eme | 4 |
| 315 | Johannes Kaufman Architektur | AT | Dornbirn | Sta | 4 |
| 400 | Michael Green Architects | CA | Vancouver | Sta | 4 |
| ID | Name | Country | City | LoE | # of Projects |
|---|---|---|---|---|---|
| 398 | Merz Kley Partner | AT | Dornbirn | Inn | 17 |
| 457 | Pirmin Jung | CH | Rain | Sta | 10 |
| 85 | bauart Konstruktions | DE | Lauterbach | Sta | 8 |
| 564 | Sweco | SE | Stockholm | Gen | 8 |
| 356 | Lendlease DesignMake | AU | Melbourne | Gen | 7 |
| 471 | Price & Myers | GB | London | Gen | 7 |
| 484 | Ramboll | DK | Copenhagen | Gen | 7 |
| 634 | WSP | CA | Montreal | Gen | 7 |
| ID | Name | Country | City | LoE | # of Projects |
|---|---|---|---|---|---|
| 555 | Stora Enso | FI | Helsinki | Inn | 35 |
| 334 | KLH Massivholz GmbH | AT | Teufenbach | Sta | 25 |
| 99 | binderholz | AT | Fügen | Sta | 13 |
| 198 | Eurban | GB | London | Inn | 11 |
| 406 | Moelven | NO | Moelv | Sta | 10 |
Appendix C

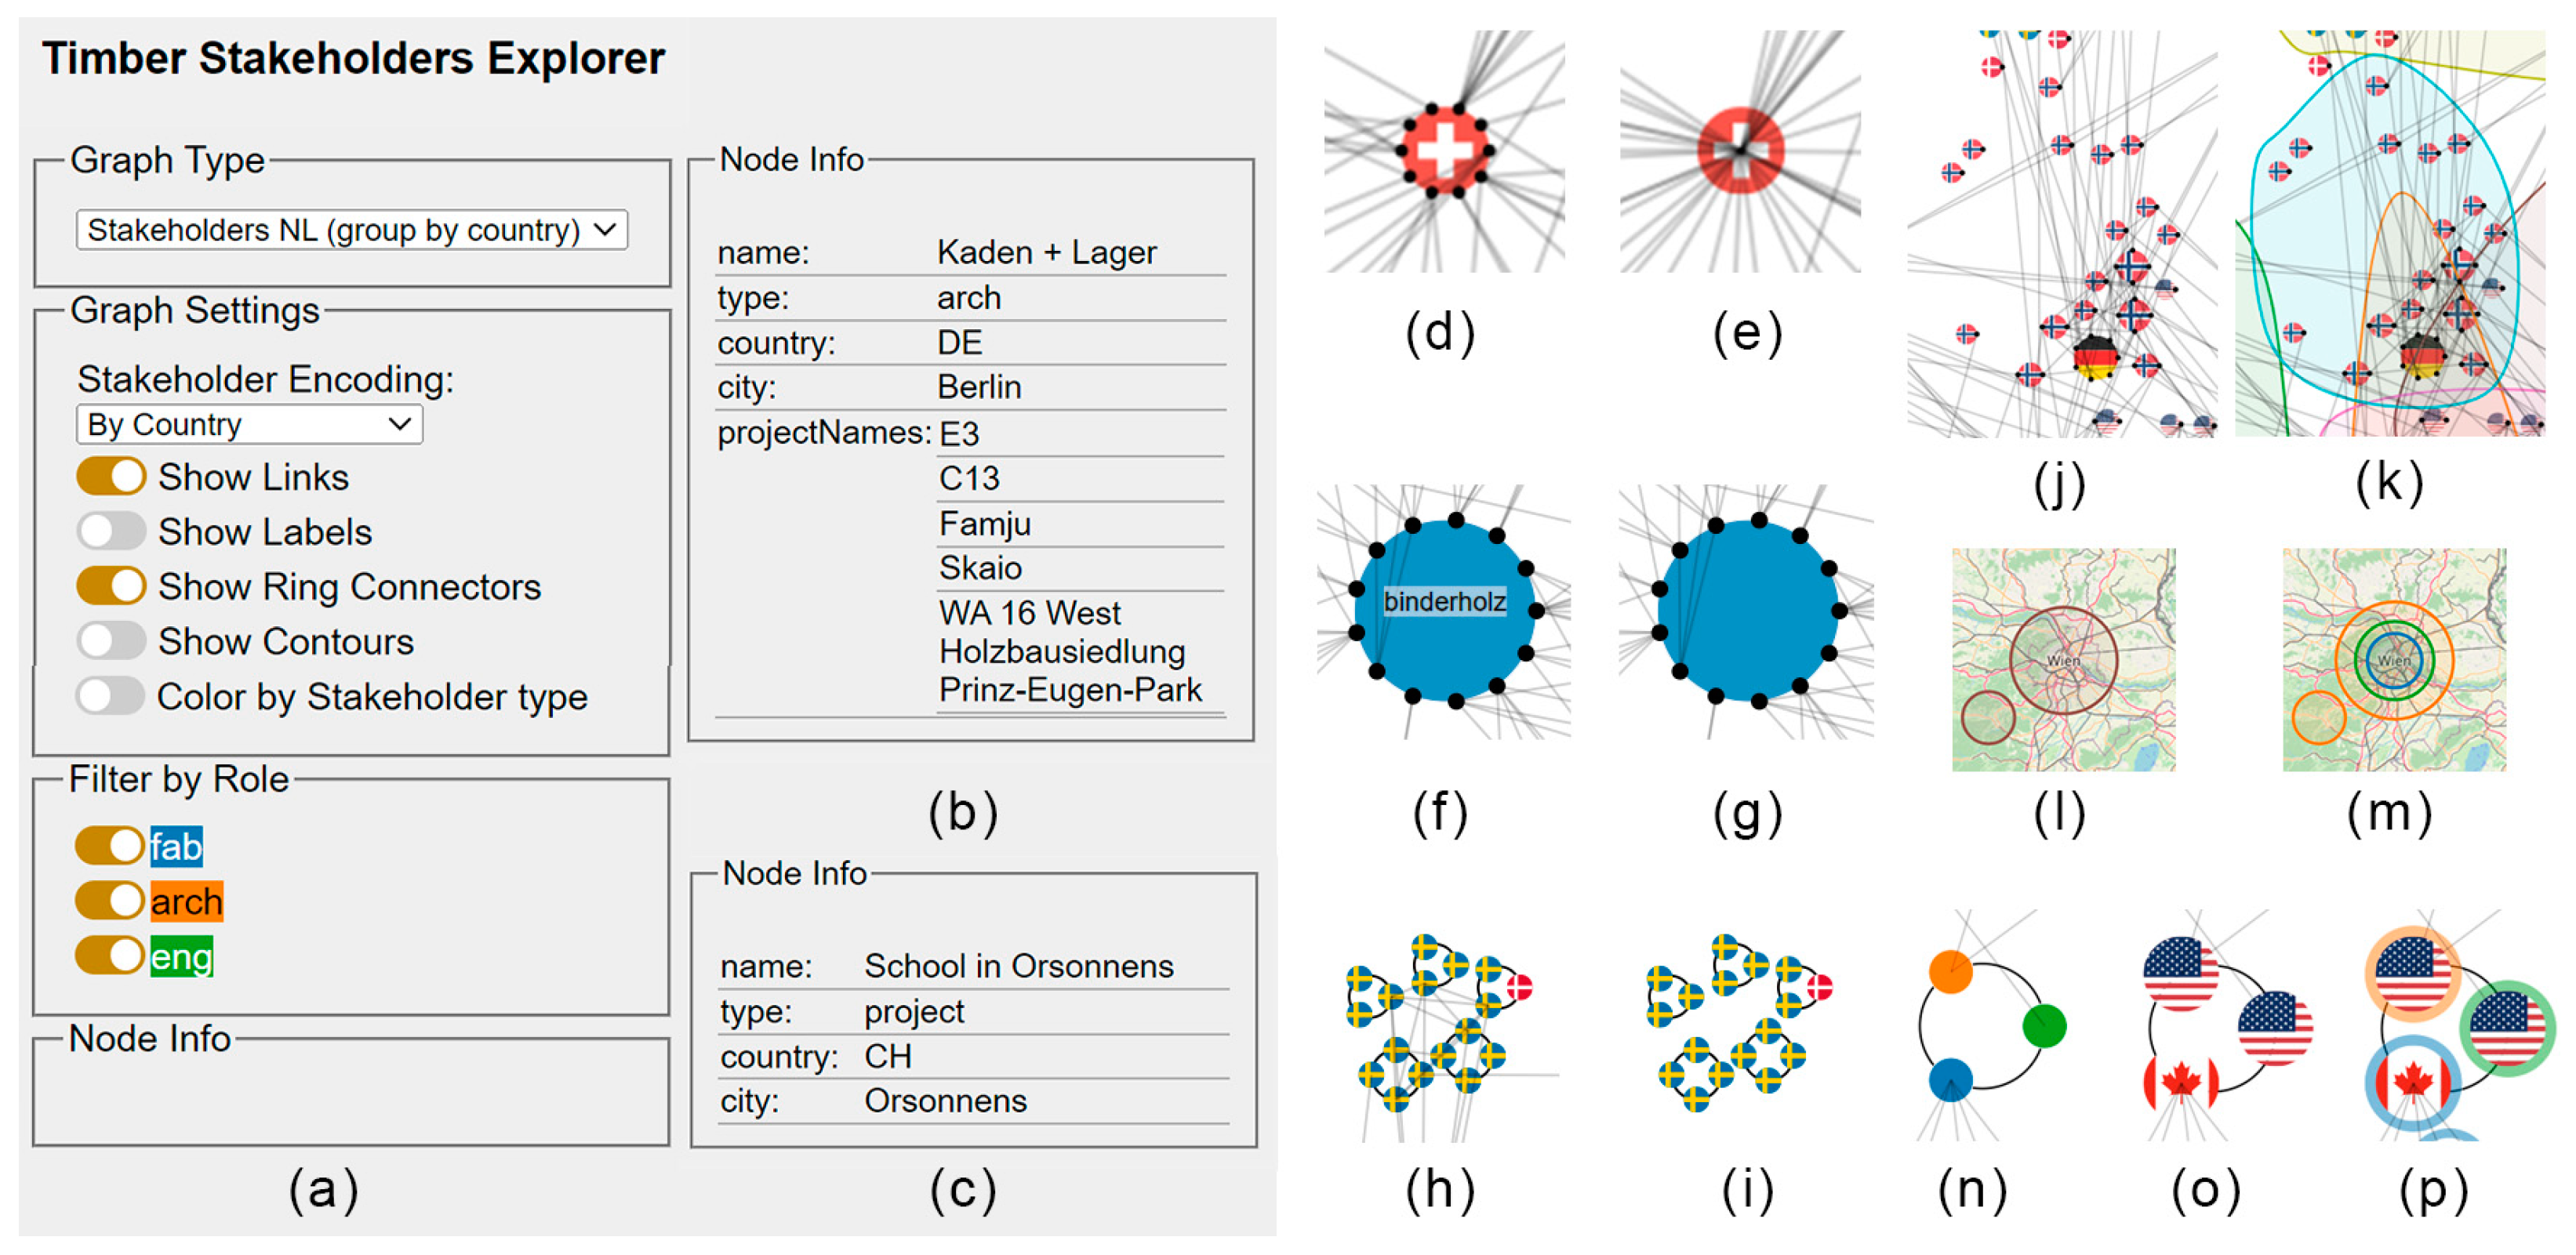
- “Projects NL”, which shows the projects as ring nodes (Figure A1n). Projects each appear once. Stakeholders appear as circles on the ring node of the projects they worked on. Projects become connected when they share one or more stakeholders. In that case, links are drawn as straight lines to connect the same stakeholders on each ring node;
- “Stakeholders NL”, which shows the stakeholders as nodes and projects as the black dots attached to the nodes (Figure A1g). The size of the node represents how many projects each stakeholder worked on. The “Show Ring Connectors” button toggles the visibility of project dots attached to the stakeholder node (Figure A1d,e);
- “Stakeholders NL (group by country)” is a variant of the “Stakeholders NL” where the nodes are rearranged so that stakeholders from the same country are placed close to each other. The “Show Contours” button toggles the visibility of contours that highlight each country’s stakeholders (Figure A1j,k) based on the Gimenez grouping layout [58];
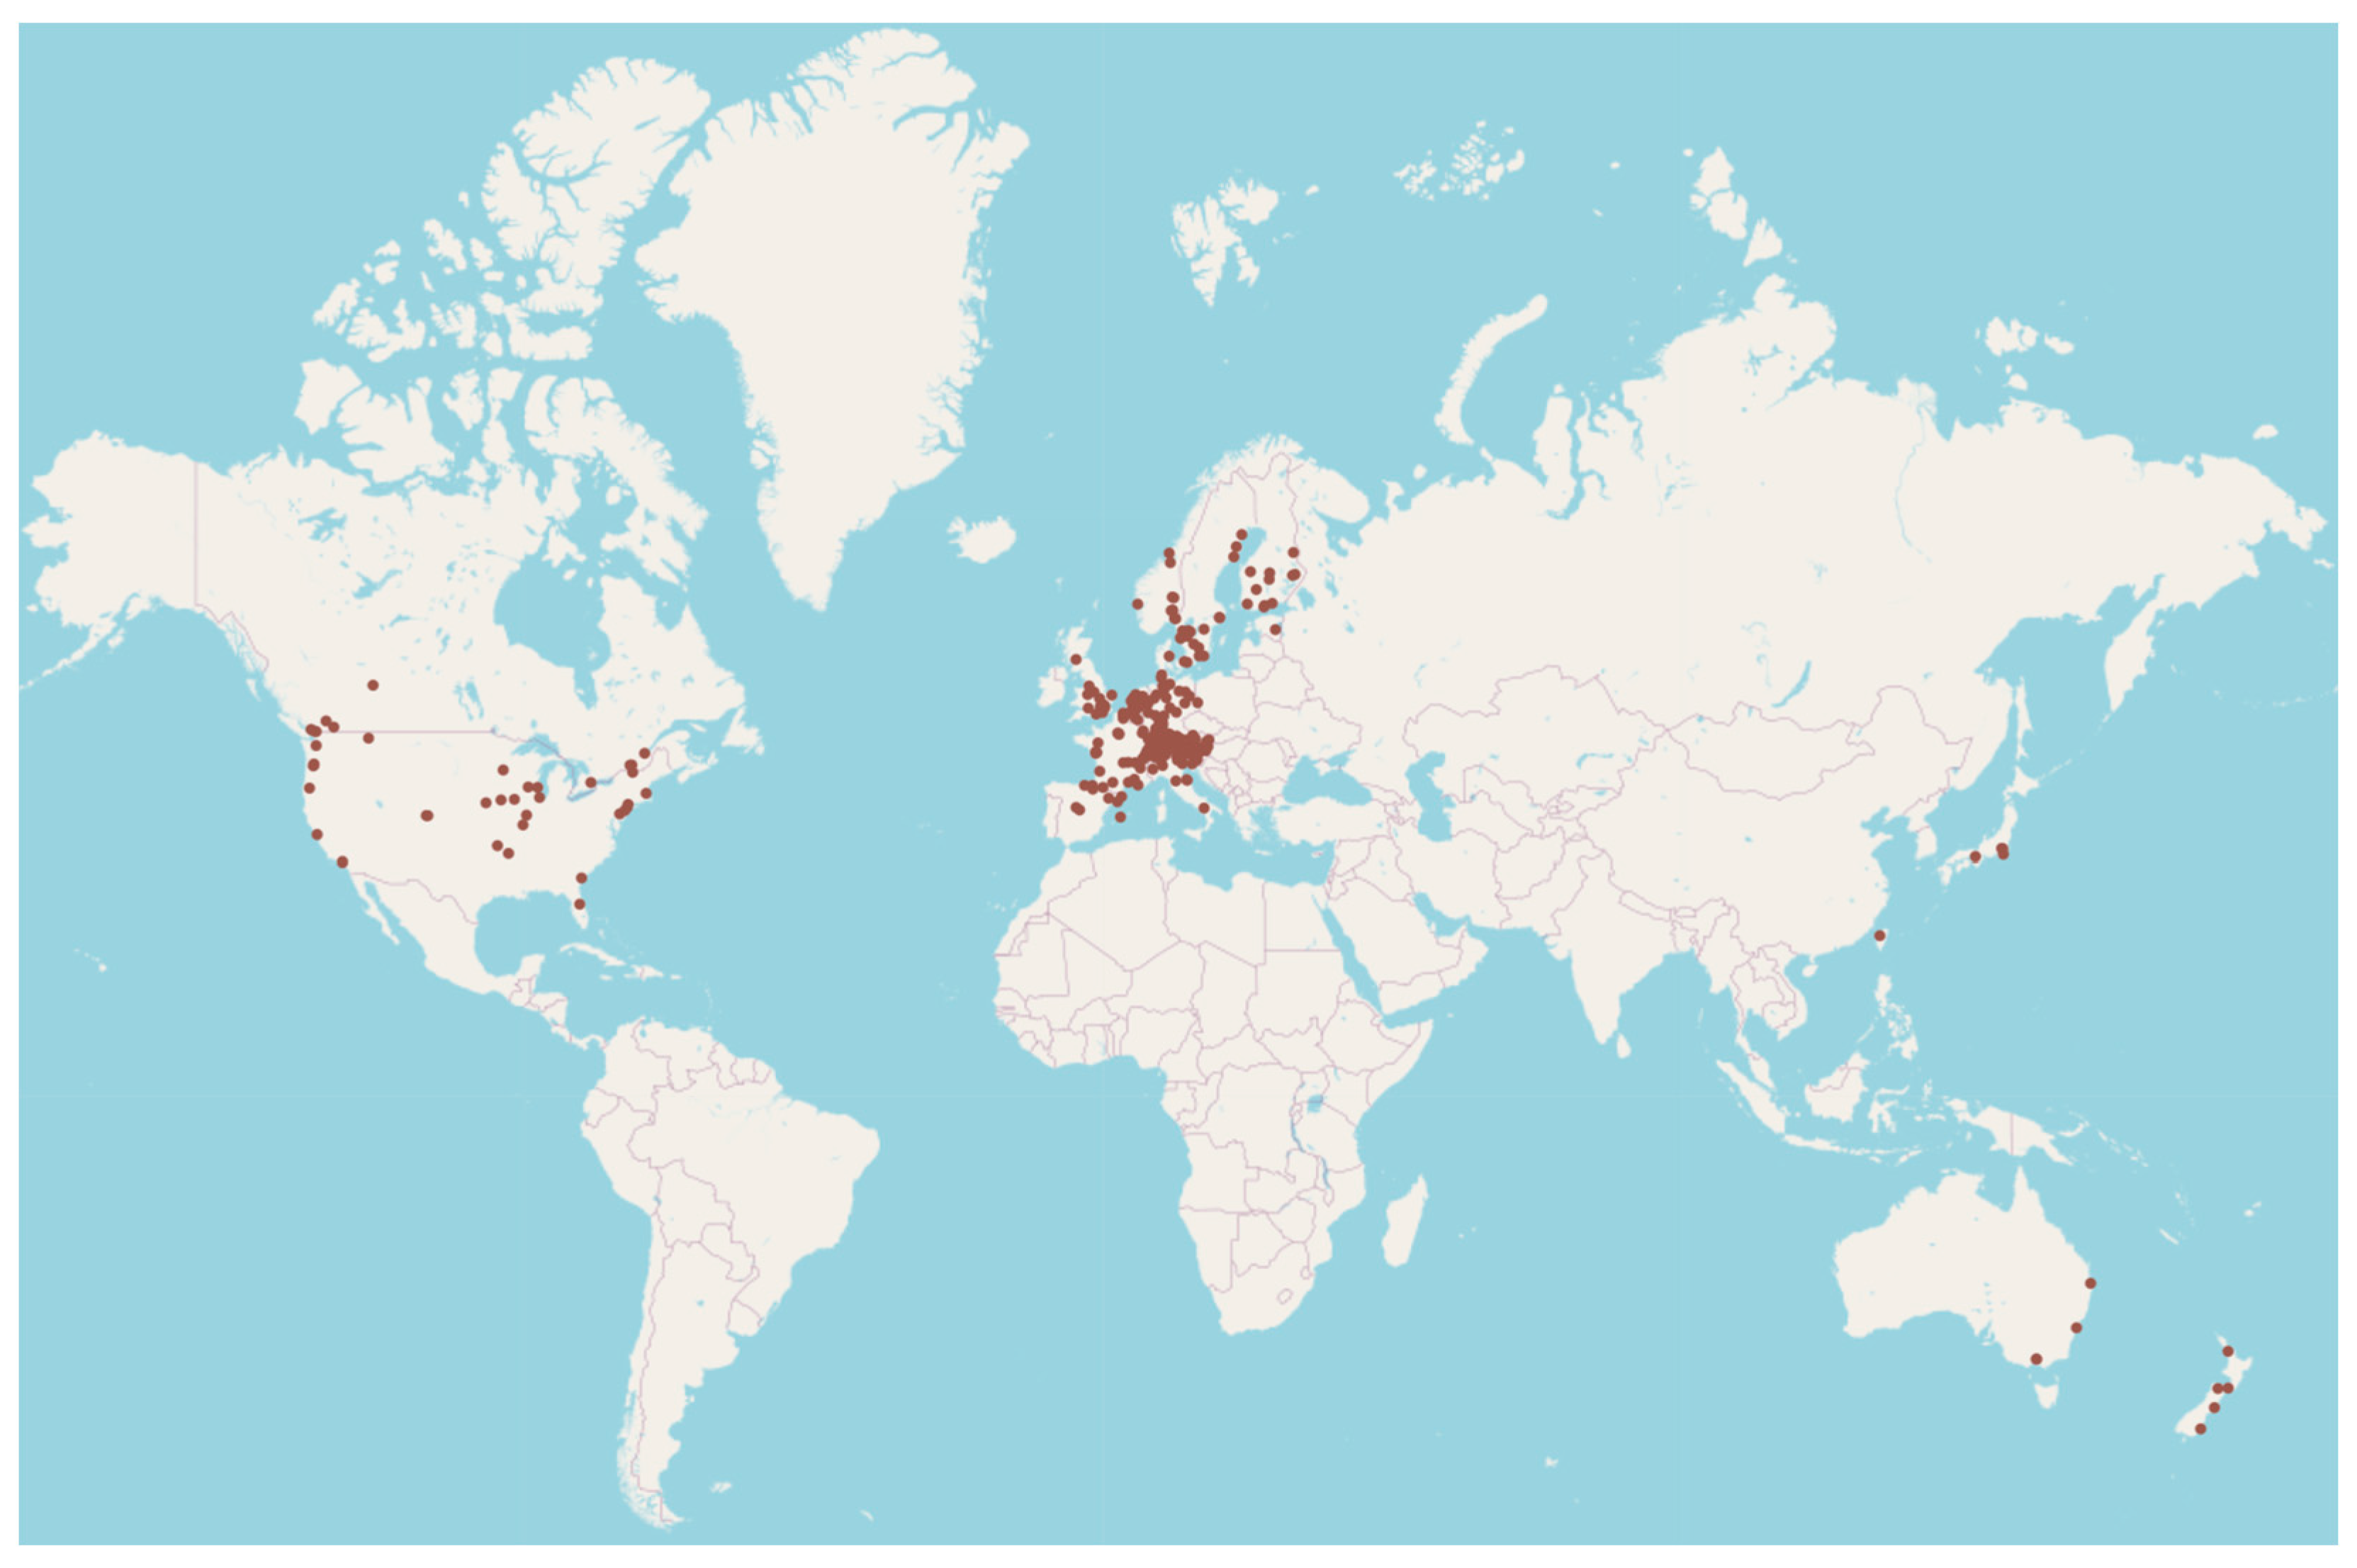
- “Stakeholders GeoMap” shows the location of all stakeholders on a world map (Figure 1). For each location, a brown circle is drawn to signify the existence of one or more stakeholders in that location (Figure A1l). The size of the circle reflects the total number of stakeholders in each location. By default, the circle counts stakeholders regardless of type. However, when the “Color by Stakeholder type” button is toggled, each location receives one, two, or three colored circles depending on the number of stakeholders by type at each location (Figure A1m);
- “Projects GeoMap” shows the location of all projects on a world map. For each location, a brown circle is drawn to signify the existence of one or more projects in that location. The size of the circle reflects the total number of projects in each location.
Appendix D
| ID | Name | Country | City | LoE | # of Projects | # of Connections | # of Connection Countries |
|---|---|---|---|---|---|---|---|
| 254 | Helen & Hard | NO | Oslo | Sta | 4 | 19 | 7 |
| 616 | Waugh Thistleton Architects | GB | London | Inn | 9 | 18 | 4 |
| 49 | Archobau | CH | Chur | Gen | 2 | 15 | 3 |
| 259 | Hermann Kaufmann + Partner ZT GmbH | AT | Schwarzach | Inn | 6 | 14 | 3 |
| 509 | SAAHA architects | NO | Oslo | Gen | 1 | 11 | 4 |
| ID | Name | Country | City | LoE | # of Projects | # of Connections | # of Connection Countries |
|---|---|---|---|---|---|---|---|
| 398 | Merz Kley Partner | AT | Dornbirn | Inn | 17 | 38 | 4 |
| 457 | Pirmin Jung | CH | Rain | Sta | 10 | 35 | 6 |
| 564 | Sweco | SE | Stockholm | Gen | 8 | 24 | 5 |
| 634 | WSP | CA | Montreal | Gen | 7 | 19 | 8 |
| 196 | Equilibrium Consulting | CA | Vancouver | Sta | 5 | 19 | 6 |
| 471 | Price & Myers | GB | London | Gen | 7 | 18 | 5 |
| ID | Name | Country | City | LoE | # of Projects | # of Connections | # of Connection Countries |
|---|---|---|---|---|---|---|---|
| 555 | Stora Enso | FI | Helsinki | Inn | 35 | 93 | 16 |
| 334 | KLH Massivholz GmbH | AT | Teufenbach | Sta | 25 | 69 | 14 |
| 99 | binderholz | AT | Fügen | Sta | 13 | 50 | 10 |
| 406 | Moelven | NO | Moelv | Sta | 10 | 36 | 6 |
| 646 | Züblin Timber | DE | Stuttgart | Inn | 8 | 29 | 8 |
Appendix E
| ID | Type | Name | LoE | # of Projects | Link # | Link ID | Link Name | LoE |
|---|---|---|---|---|---|---|---|---|
| 555 | fab | Stora Enso 1 | Inn | 35 | 8 | 631 | Woodcon 1 | Sta |
| 631 | fab | Woodcon 1 | Sta | 8 | 8 | 555 | Stora Enso 1 | Inn |
| 198 | fab | Eurban | Inn | 11 | 6 | 555 | Stora Enso | Inn |
| 398 | eng | Merz Kley Partner 2 | Inn | 17 | 5 | 259 | Hermann Kaufmann + Partner ZT GmbH 2 | Inn |
| 259 | arch | Hermann Kaufmann + Partner ZT GmbH 2 | Inn | 6 | 5 | 398 | Merz Kley Partner 2 | Inn |
| 99 | fab | binderholz 3 | Sta | 13 | 5 | 77 | B&K Structures 3 | Sta |
| 77 | fab | B&K Structures 3 | Sta | 9 | 5 | 99 | binderholz 3 | Sta |
| 429 | fab | Nordic Structures 4 | Inn | 7 | 5 | 205 | FGP Construction 4 | Inn |
| 205 | fab | FGP Construction 4 | Inn | 5 | 5 | 429 | Nordic Structures 4 | Inn |
| 356 | eng | Lendlease DesignMake | Gen | 7 | 5 | 555 | Stora Enso | Inn |
Appendix F
| ID | Name | Country | City | LoE | # of Projects | # of Connections | # of Connection Countries |
|---|---|---|---|---|---|---|---|
| 254 | Helen & Hard | NO | Oslo | Sta | 4 | 19 | 7 |
| 596 | Tzannes | AU | Sydney | Gen | 2 | 6 | 6 |
| 212 | Fokkema & Partners | NL | Delft | Gen | 2 | 10 | 5 |
| 180 | dRMM | GB | London | Inn | 3 | 9 | 5 |
| 24 | Aimeric Audebeau | FR | Paris | 1 | 8 | 5 | |
| 530 | SF Design | FR | Paris | Gen | 1 | 8 | 5 |
| 81 | BAS Arkitekter | NO | Sarpsborg | Gen | 2 | 7 | 5 |
| ID | Name | Country | City | LoE | # of Projects | # of Connections | # of Connection Countries |
|---|---|---|---|---|---|---|---|
| 634 | WSP | CA | Montreal | Gen | 7 | 19 | 8 |
| 356 | Lendlease DesignMake | AU | Melbourne | Gen | 7 | 17 | 8 |
| 19 | AECOM | US | Los Angeles | Gen | 3 | 11 | 8 |
| 457 | Pirmin Jung | CH | Rain | Sta | 10 | 35 | 6 |
| 196 | Equilibrium Consulting | CA | Vancouver | Sta | 5 | 19 | 6 |
| 484 | Ramboll | DK | Copenhagen | Gen | 7 | 15 | 6 |
| ID | Name | Country | City | LoE | # of Projects | # of Connections | # of Connection Countries |
|---|---|---|---|---|---|---|---|
| 555 | Stora Enso | FI | Helsinki | Inn | 35 | 93 | 16 |
| 334 | KLH Massivholz GmbH | AT | Teufenbach | Sta | 25 | 69 | 14 |
| 99 | binderholz | AT | Fügen | Sta | 13 | 50 | 10 |
| 260 | Hess Timber | DE | Kleinheubach | Inn | 4 | 23 | 9 |
| 646 | Züblin Timber | DE | Stuttgart | Inn | 8 | 29 | 8 |
References
- Kuzmanovska, I.; Gasparri, E.; Tapias Monné, D.; Aitchison, M. Tall Timber Buildings: Emerging trends and typologies. In Proceedings of the World Conference on Timber Engineering, Seoul, Republic of Korea, 20–23 August 2018. [Google Scholar]
- Timber, T. A Global Audit. CTBUH J. 2017, 2, 47–49. [Google Scholar]
- Hugues, T.; Steiger, L.; Weber, J. Timber Construction: Details, Products, Case Studies; Detail Praxis, Edition Detail; Birkhäuser: Basel, Switzerland, 2004. [Google Scholar]
- Niemann, A. Solid wood and wood-based products. In Manual of Multi-Storey Timber Construction; Kaufmann, H., Krötsch, S., Winter, S., Eds.; Edition Detail; Detail Business Information: München, Germany, 2018; pp. 18–23. [Google Scholar]
- Trummer, A.; Krestel, S.; Aicher, S. KIELSTEG—Defining the design parameters for a lightweight wooden product. In WCTE 2016—World Conference on Timber Engineering; Technische Universität: Wien, Austria, 2016. [Google Scholar]
- Wagner, H.J.; Alvarez, M.; Kyjanek, O.; Bhiri, Z.; Buck, M.; Menges, A. Flexible and transportable robotic timber construction platform—TIM. Autom. Constr. 2020, 120, 103400. [Google Scholar] [CrossRef]
- Wagner, H.J.; Chai, H.; Guo, Z.; Menges, A.; Yuan, P.F. Towards an On-site Fabrication System for Bespoke, Unlimited and Monolithic Timber Slabs. In Proceedings of the IEEE/RSJ International Conference on Intelligent Robots and Systems (IROS), Las Vegas, NV, USA, 24 October–24 January 2021. [Google Scholar]
- Willmann, J.; Knauss, M.; Bonwetsch, T.; Apolinarska, A.A.; Gramazio, F.; Kohler, M. Robotic timber construction—Expanding additive fabrication to new dimensions. Autom. Constr. 2016, 61, 16–23. [Google Scholar] [CrossRef]
- Weinand, Y.; Roos, A. (Eds.) Advanced Timber Structures: Architectural Designs and Digital Dimensioning; Birkhäuser: Basel, Switzerland, 2017. [Google Scholar]
- Menges, A.; Schwinn, T.; Krieg, O.D. (Eds.) Advancing Wood Architecture; Routledge: New York, NY, USA, 2016. [Google Scholar] [CrossRef]
- Mahapatra, K.; Gustavsson, L. General Conditions for Construction of Multi-Storey Wooden Buildings in Western Europe; School of Technology and Design, Växjö University: Växjö, Sweden, 2009. [Google Scholar]
- Hurmekoski, E.; Jonsson, R.; Nord, T. Context, drivers, and future potential for wood-frame multi-story construction in Europe. Technol. Forecast. Soc. Change 2015, 99, 181–196. [Google Scholar] [CrossRef]
- Nord, T.; Tykkä, S.; McCluskey, D.; Bajric, F.; Bouriaud, L.; Hugosson, M.; Nyrud, A.Q.; Ollonqvist, P.; Roos, A.; Ukrainski, K.; et al. Role of policies and national programmes on innovations in timber-frame construction. In Innovation in Forestry: Territorial and Value Chain Relationships; Weiss, G., Pettenella, D., Ollonqvist, P., Slee, B., Eds.; CABI: Wallingford, UK, 2011; pp. 204–232. [Google Scholar] [CrossRef]
- Vihemäki, H.; Ludvig, A.; Toivonen, R.; Toppinen, A.; Weiss, G. Institutional and policy frameworks shaping the wooden multi-storey construction markets: A comparative case study on Austria and Finland. Wood Mater. Sci. Eng. 2019, 14, 312–324. [Google Scholar] [CrossRef]
- Clark, D. Innovative wood-based products. In Forest Products Annual Market Review 2013–2014; United Nations: New York, NY, USA, 2014; pp. 23–31. [Google Scholar] [CrossRef]
- Gosselin, A.; Blanchet, P.; Lehoux, N.; Cimon, Y. Main motivations and barriers for using wood in multi-story and non-residential construction projects. BioResources 2017, 12, 546–570. [Google Scholar] [CrossRef]
- Leszczyszyn, E.; Heräjärvi, H.; Verkasalo, E.; Garcia-Jaca, J.; Araya-Letelier, G.; Lanvin, J.-D.; Bidzińska, G.; Augustyniak-Wysocka, D.; Kies, U.; Calvillo, A.; et al. The Future of Wood Construction: Opportunities and Barriers Based on Surveys in Europe and Chile. Sustainability 2022, 14, 4358. [Google Scholar] [CrossRef]
- Goodland, H. Promoting Sustainable Building Materials and the Implications on the Use of Wood in Buildings: A Review of Leading Public Policies in Europe and North America; United Nations: New York, NY, USA, 2016. [Google Scholar]
- Bowyer, J.; Bratkovich, S.; Howe, J.; Fernholz, K.; Frank, M.; Hanessian, S.; Groot, H.; Pepke, E. Modern Tall Wood Buildings: Opportunities for Innovation; Dovetail Partners Inc.: Minneapolis, MN, USA, 2016. [Google Scholar]
- Lazarevic, D.; Kautto, P.; Antikainen, R. Finland’s wood-frame multi-storey construction innovation system: Analysing motors of creative destruction. For. Policy Econ. 2020, 110, 101861. [Google Scholar] [CrossRef]
- Östman, B.; Källsner, B. National Building Regulations in Relation to Multi-Storey Wooden Buildings in Europe; SP Trätek and Växjö University: Växjö, Sweden, 2011. [Google Scholar]
- Riala, M.; Ilola, L. Multi-storey timber construction and bioeconomy—Barriers and opportunities. Scand. J. For. Res. 2014, 29, 367–377. [Google Scholar] [CrossRef]
- Toppinen, A.; Sauru, M.; Pätäri, S.; Lähtinen, K.; Tuppura, A. Internal and external factors of competitiveness shaping the future of wooden multistory construction in Finland and Sweden. Constr. Manag. Econ. 2019, 37, 201–216. [Google Scholar] [CrossRef]
- Wiegand, E.; Ramage, M. The impact of policy instruments on the first generation of Tall Wood Buildings. Build. Res. Inf. 2022, 50, 255–275. [Google Scholar] [CrossRef]
- Salvadori, V. The Development of a Tall Wood Building; Politecnico di Milano: Milan, Italy; TU Wien: Vienna, Austria, 2017. [Google Scholar]
- Svatoš-Ražnjević, H.; Orozco, L.; Menges, A. Advanced Timber Construction Industry: A Review of 350 Multi-Storey Timber Projects from 2000–2021. Buildings 2022, 12, 404. [Google Scholar] [CrossRef]
- Marfella, G.; Winson-Geideman, K. Timber and Multi-Storey Buildings: Industry Perceptions of Adoption in Australia. Buildings 2021, 11, 653. [Google Scholar] [CrossRef]
- Emre Ilgın, H.; Karjalainen, M.; Pelsmakers, S. Finnish architects’ attitudes towards multi-storey timber-residential buildings. Int. J. Build. Pathol. Adapt. 2021. [Google Scholar] [CrossRef]
- Wang, Z.; Yin, T. Cross-Laminated Timber: A Review on Its Characteristics and an Introduction to Chinese Practices. In Engineered Wood Products for Construction; Gong, M., Ed.; IntechOpen: Rijeka, Croatia, 2022. [Google Scholar] [CrossRef]
- Emre Ilgın, H.; Karjalainen, M.; Koponen, O.-P.; Soikkeli, A. A Study on Contractors’ Perception of Using Wood for Construction. In Engineered Wood Products for Construction; Gong, M., Ed.; IntechOpen: Rijeka, Croatia, 2022. [Google Scholar] [CrossRef]
- Savolainen, J.M.; Ilgın, H.E.; Oinas, E.; Karjalainen, M. Finnish Multi-Story Timber-Framed Apartment Buildings: Tampere Residents’ Perspectives. Buildings 2022, 12, 1998. [Google Scholar] [CrossRef]
- Holt, R.; Wardle, K. Lessons from Tall Wood Buildings: What We Learned from Ten International Examples. Perkins Will Res. J. 2014, 6, 7–19. [Google Scholar]
- Falk, A. Architectural Aspects of Massive Timber: Structural form and Systems. Ph.D. Thesis, Luleå Tekniska Universitet, Luleå, Sweden, 2005. [Google Scholar]
- Lattke, F.; Lehmann, S. Multi-Storey Residential Timber Construction: Current Developments in Europe. J. Green Build. 2007, 2, 119–129. [Google Scholar] [CrossRef]
- Lehmann, S. Sustainable Construction for Urban Infill Development Using Engineered Massive Wood Panel Systems. Sustainability 2012, 4, 2707–2742. [Google Scholar] [CrossRef]
- Smith, R.E.; Griffin, G.; Rice, T. Solid Timber Construction, Process Practice Performance; Report Sponsored by American Institute of Architects, USDA Forest Products Laboratory and FPI Innovations. 2015. Available online: https://research.thinkwood.com/en/permalink/catalogue974 (accessed on 14 August 2023).
- Timber Online. DataCube: Production Surveys. Timber-Online.Net. Available online: https://www.timber-online.net/datacube/production-surveys.html (accessed on 3 November 2021).
- Gold, S.; Rubik, F. Consumer attitudes towards timber as a construction material and towards timber frame houses—Selected findings of a representative survey among the German population. J. Clean. Prod. 2009, 17, 303–309. [Google Scholar] [CrossRef]
- Kylkilahti, E.; Berghäll, S.; Autio, M.; Nurminen, J.; Toivonen, R.; Lähtinen, K.; Vihemäki, H.; Franzini, F.; Toppinen, A. A consumer-driven bioeconomy in housing? Combining consumption style with students’ perceptions of the use of wood in multi-storey buildings. Ambio 2020, 49, 1943–1957. [Google Scholar] [CrossRef]
- Petruch, M.; Walcher, D. Timber for future? Attitudes towards timber construction by young millennials in Austria—Marketing implications from a representative study. J. Clean. Prod. 2021, 294, 126324. [Google Scholar] [CrossRef]
- De Araujo, V.; Christoforo, A. The Global Cross-Laminated Timber (CLT) Industry: A Systematic Review and a Sectoral Survey of Its Main Developers. Sustainability 2023, 15, 7827. [Google Scholar] [CrossRef]
- The Editors. Timber Feature: Mapping the Industry. Archit. Newsp. 2019, 17, 18–19. [Google Scholar]
- The Editors. Timber Map of the United States and Canada: Mapping the Industry. Archit. Newsp. 2021, 19, 12–15. [Google Scholar]
- The Editors. Timber Map of the United States and Canada: Mapping the Industry. Archit. Newsp. 2022, 20, 14–17. [Google Scholar]
- Bysheim, K.; Nyrud, A.Q. Architects’ perceptions of structural timber in urban construction. In COST E53; European Cooperation in Science and Technology: Delft, The Netherlands, 2008; Volume 1, pp. 75–86. [Google Scholar]
- Karjalainen, M.; Ilgın, H.E.; Tulonen, L. Main Design Considerations and Prospects of Contemporary Tall Timber Apartment Buildings: Views of Key Professionals from Finland. Sustainability 2021, 13, 6593. [Google Scholar] [CrossRef]
- Roos, A.; Woxblom, L.; McCluskey, D. Architects’, and Building Engineers’, and Stakeholders’ Perceptions to Wood in Construction—Results from a Qualitative study. In Proceedings of the Scandinavian Forest Economics: Proceedings of the Biennial Meeting of the Scandinavian Society of Forest Economics, Lom, Norway, 6–9 April 2008; Volume 42, pp. 184–194. [Google Scholar]
- Roos, A.; Woxblom, L.; McCluskey, D. The influence of architects and structural engineers on timber in construction—Perceptions and roles. Silva Fenn. 2010, 44, 871–884. [Google Scholar] [CrossRef]
- Salvadori, V. Multi-Storey Timber-Based Buildings: An International Survey of Case-Studies with Five or More Storeys Over the Last Twenty Years. Ph.D. Thesis, TU Wien, Vienna, Austria, 2021. [Google Scholar]
- Tykkä, S.; McCluskey, D.; Nord, T.; Ollonqvist, P.; Hugosson, M.; Roos, A.; Ukrainski, K.; Nyrud, A.Q.; Bajric, F. Development of timber framed firms in the construction sector—Is EU policy one source of their innovation? For. Policy Econ. 2010, 12, 199–206. [Google Scholar] [CrossRef]
- Svatoš-Ražnjević, H.; Menges, A. Multi-Storey Timber Buildings Data: Architectural and Structural Data on 350 Mass-Timber Projects from 2000–2021. DaRUS. 2022. [CrossRef]
- Orozco, L.; Svatoš-Ražnjević, H.; Menges, A. Stakeholders in Multi-Storey Timber Data. DaRUS. 2022. Available online: https://darus.uni-stuttgart.de/citation?persistentId=doi:10.18419/darus-2740 (accessed on 1 February 2023).
- ISO 3166-1 alpha-2; Country Codes. ISO: Geneva, Switzerland, 2020.
- Aronsohn. Expertises & Diensten—Aronsohn. 2022. Available online: https://www.aronsohn.nl/specialismen/expertises-diensten/ (accessed on 30 November 2022).
- SmartLam. SmartLam North America—Design. 2021. Available online: https://www.smartlam.com/design-engineering/ (accessed on 30 November 2022).
- GG-Loop. About. Available online: https://gg-loop.com/about/ (accessed on 3 November 2021).
- Bostock, M.; Ogievetsky, V.; Heer, J. D³: Data-Driven Documents. IEEE Trans. Vis. Comput. Graph. 2011, 17, 2301–2309. [Google Scholar] [CrossRef]
- Gimenez, X. Grouping Nodes in a Force Directed Graph. 2017. Available online: https://gist.github.com/XavierGimenez/a8e8c5e9aed71ba96bd52332682c0399 (accessed on 12 December 2022).
- Fu, J. The Share of Wood-Framed Homes Increased in 2021. Available online: https://eyeonhousing.org/2022/07/the-share-of-wood-framed-homes-increased-in-2021/ (accessed on 3 November 2021).


| Study | Year | Scope | Stakeholder # | Types of Stakeholders | Focus/Analysis |
|---|---|---|---|---|---|
| Araujo and Christoforo | 2023 [41] | global | 97 | CLT manufacturers | stakeholder qualities |
| Architect’s Newspaper | 2019 [42] | North America | 43 | schools organizations manufacturers planned factories | research and development |
| 2021 [43] | 58 | ||||
| 2022 [44] | 59 | ||||
| Bysheim and Nyrund | 2008 [45] | Norway | 285 | architects (unrelated to use of timber, names not disclosed) | perceptions of structural timber and attitudes |
| Karjalainen et al. | 2021 [46] | Finland | 21 | builders principal designers structural designers construction supervisors contractors wood suppliers city planners (names not disclosed) | views of key professionals on boundary condition effects design parameters affected issues that need development barriers and measures to tall timber |
| Roos et al. | 2008 [47] | Sweden | 23 | architects engineers (names not disclosed) | perceived benefits/motivations |
| 2010 [48] | 26 | attitudes perceived norms hampering factors facilitating Factors | |||
| Salvadori | 2021 [49] | global | 701 | architects engineers timber engineers general contractors timber suppliers developers clients | clients and influences types of commission motivation stakeholder analysis |
| Tykkä et al. | 2010 [50] | Europe | 6 | firms (names not disclosed) | innovations in timber construction |
| Project ID | Project Name | Country | City | Website | Stakeholders |
|---|---|---|---|---|---|
| 143 | Rue des Ardennes | FR | Paris | https://www.woodskyscrapers.org/projects.html (accessed on 3 November 2021) | Aimeric Audebeau Fokkema & Partners Engenuity Price & Myers B&K Structures binderholz Rubner Holzbau |
| https://www.construction21.org/case-studies/fr/the-ardennes,es.html (accessed on 3 November 2021) |
Disclaimer/Publisher’s Note: The statements, opinions and data contained in all publications are solely those of the individual author(s) and contributor(s) and not of MDPI and/or the editor(s). MDPI and/or the editor(s) disclaim responsibility for any injury to people or property resulting from any ideas, methods, instructions or products referred to in the content. |
© 2023 by the authors. Licensee MDPI, Basel, Switzerland. This article is an open access article distributed under the terms and conditions of the Creative Commons Attribution (CC BY) license (https://creativecommons.org/licenses/by/4.0/).
Share and Cite
Orozco, L.; Svatoš-Ražnjević, H.; Wagner, H.J.; Abdelaal, M.; Amtsberg, F.; Weiskopf, D.; Menges, A. Advanced Timber Construction Industry: A Quantitative Review of 646 Global Design and Construction Stakeholders. Buildings 2023, 13, 2287. https://0-doi-org.brum.beds.ac.uk/10.3390/buildings13092287
Orozco L, Svatoš-Ražnjević H, Wagner HJ, Abdelaal M, Amtsberg F, Weiskopf D, Menges A. Advanced Timber Construction Industry: A Quantitative Review of 646 Global Design and Construction Stakeholders. Buildings. 2023; 13(9):2287. https://0-doi-org.brum.beds.ac.uk/10.3390/buildings13092287
Chicago/Turabian StyleOrozco, Luis, Hana Svatoš-Ražnjević, Hans Jakob Wagner, Moataz Abdelaal, Felix Amtsberg, Daniel Weiskopf, and Achim Menges. 2023. "Advanced Timber Construction Industry: A Quantitative Review of 646 Global Design and Construction Stakeholders" Buildings 13, no. 9: 2287. https://0-doi-org.brum.beds.ac.uk/10.3390/buildings13092287