Towards Designing Durable Sculptural Elements: Ensemble Learning in Predicting Compressive Strength of Fiber-Reinforced Nano-Silica Modified Concrete

Abstract
:1. Introduction
2. Materials and Methods
2.1. AdaBoost
2.2. XGBoost
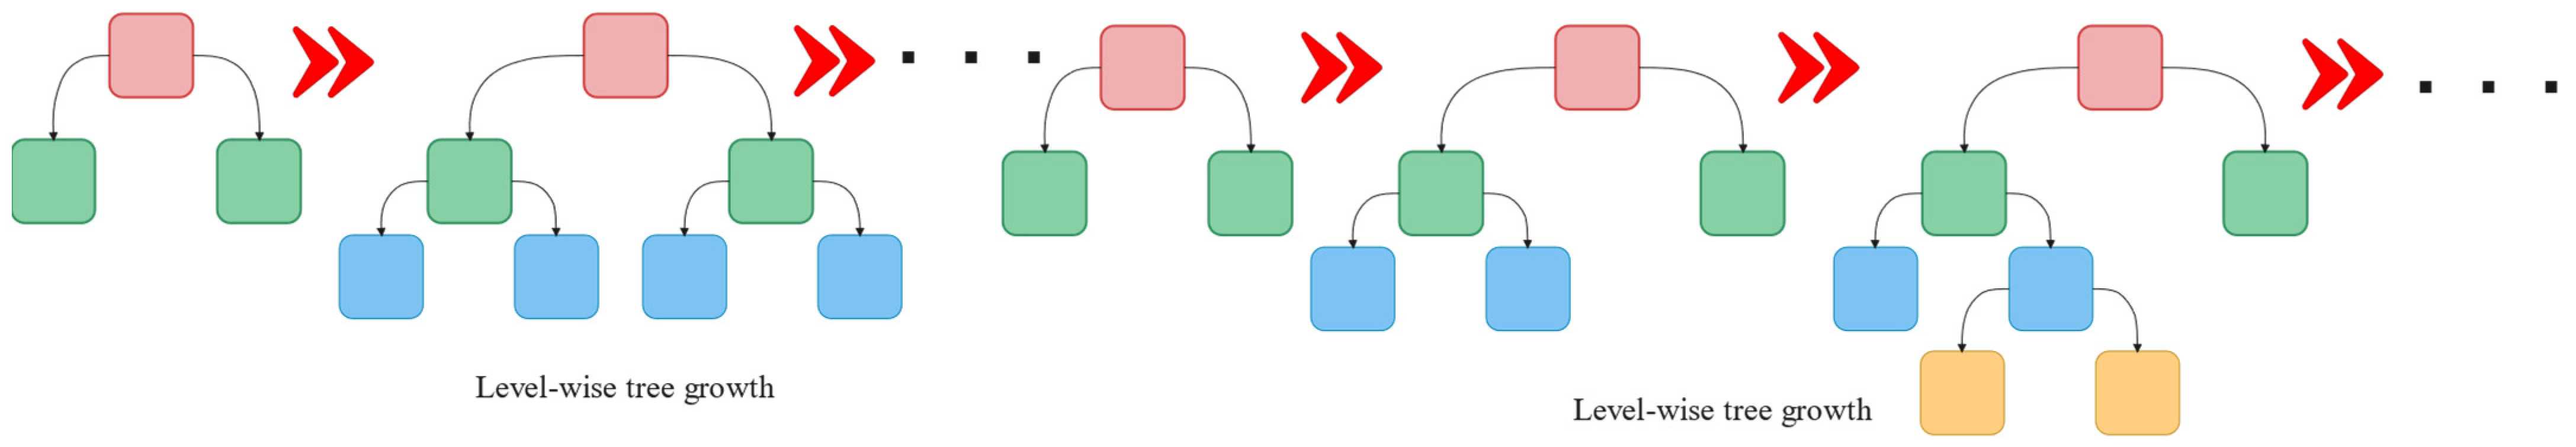
2.3. LightGBM
2.4. CatBoost
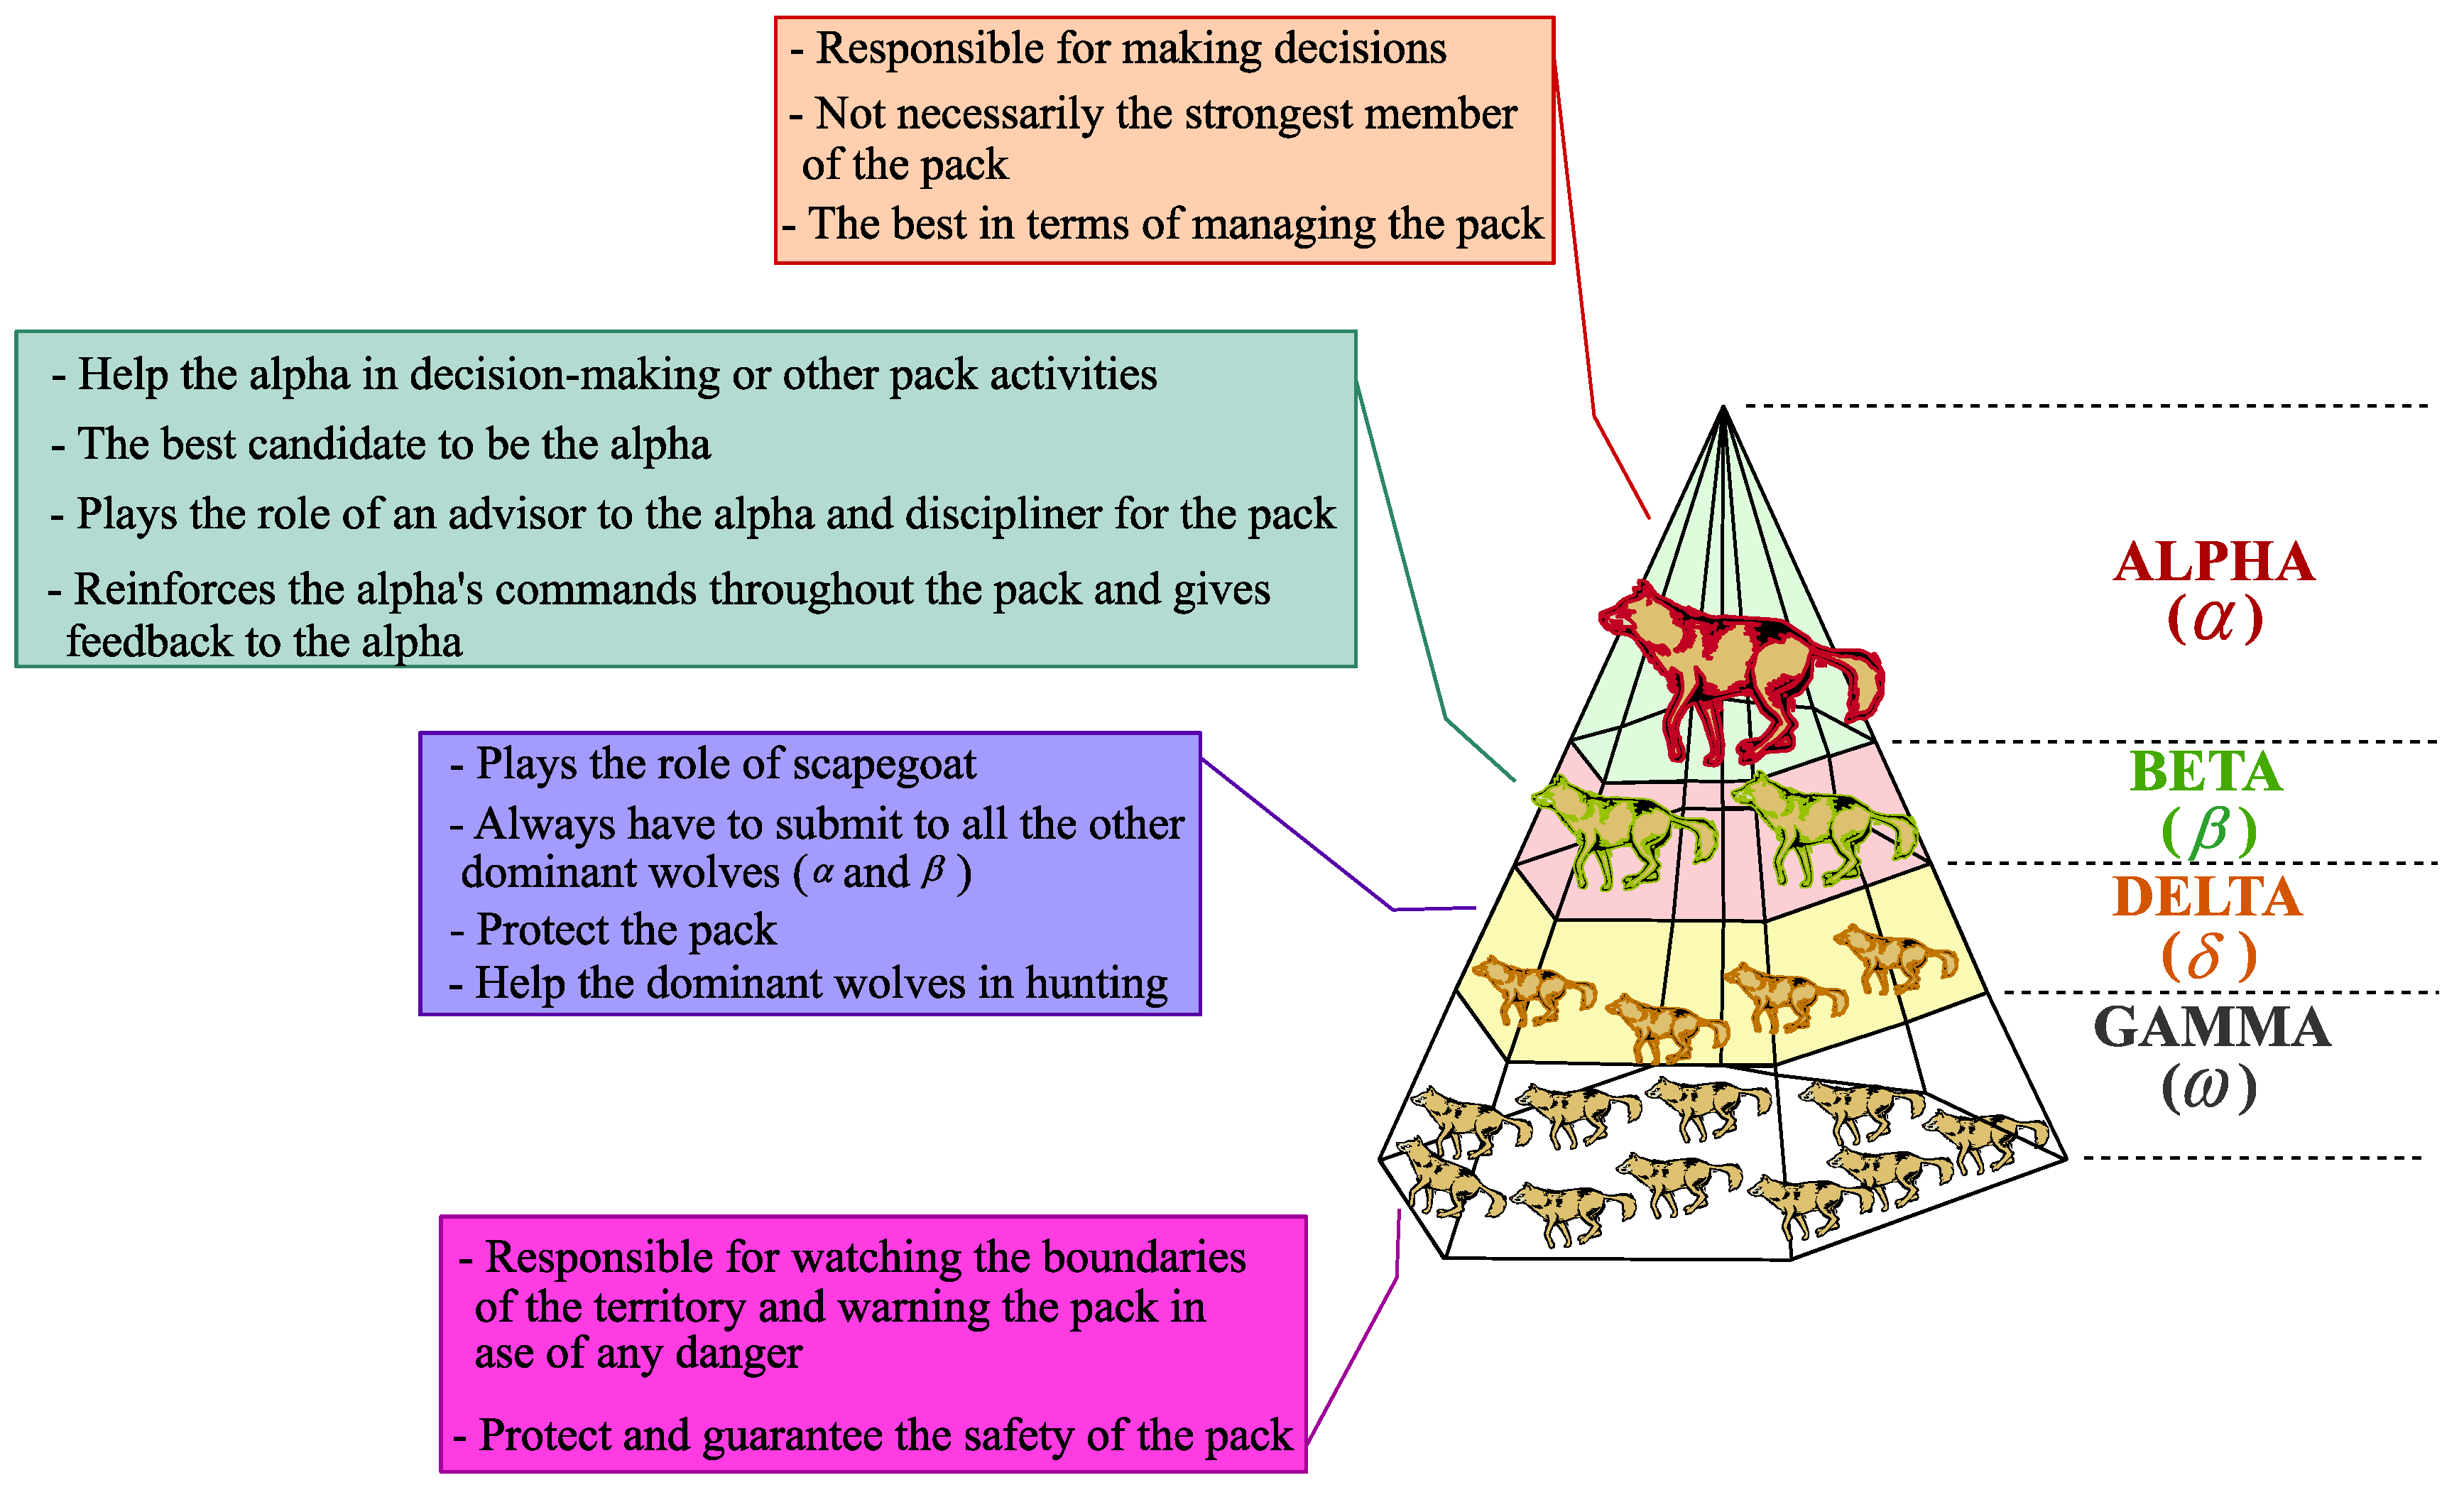
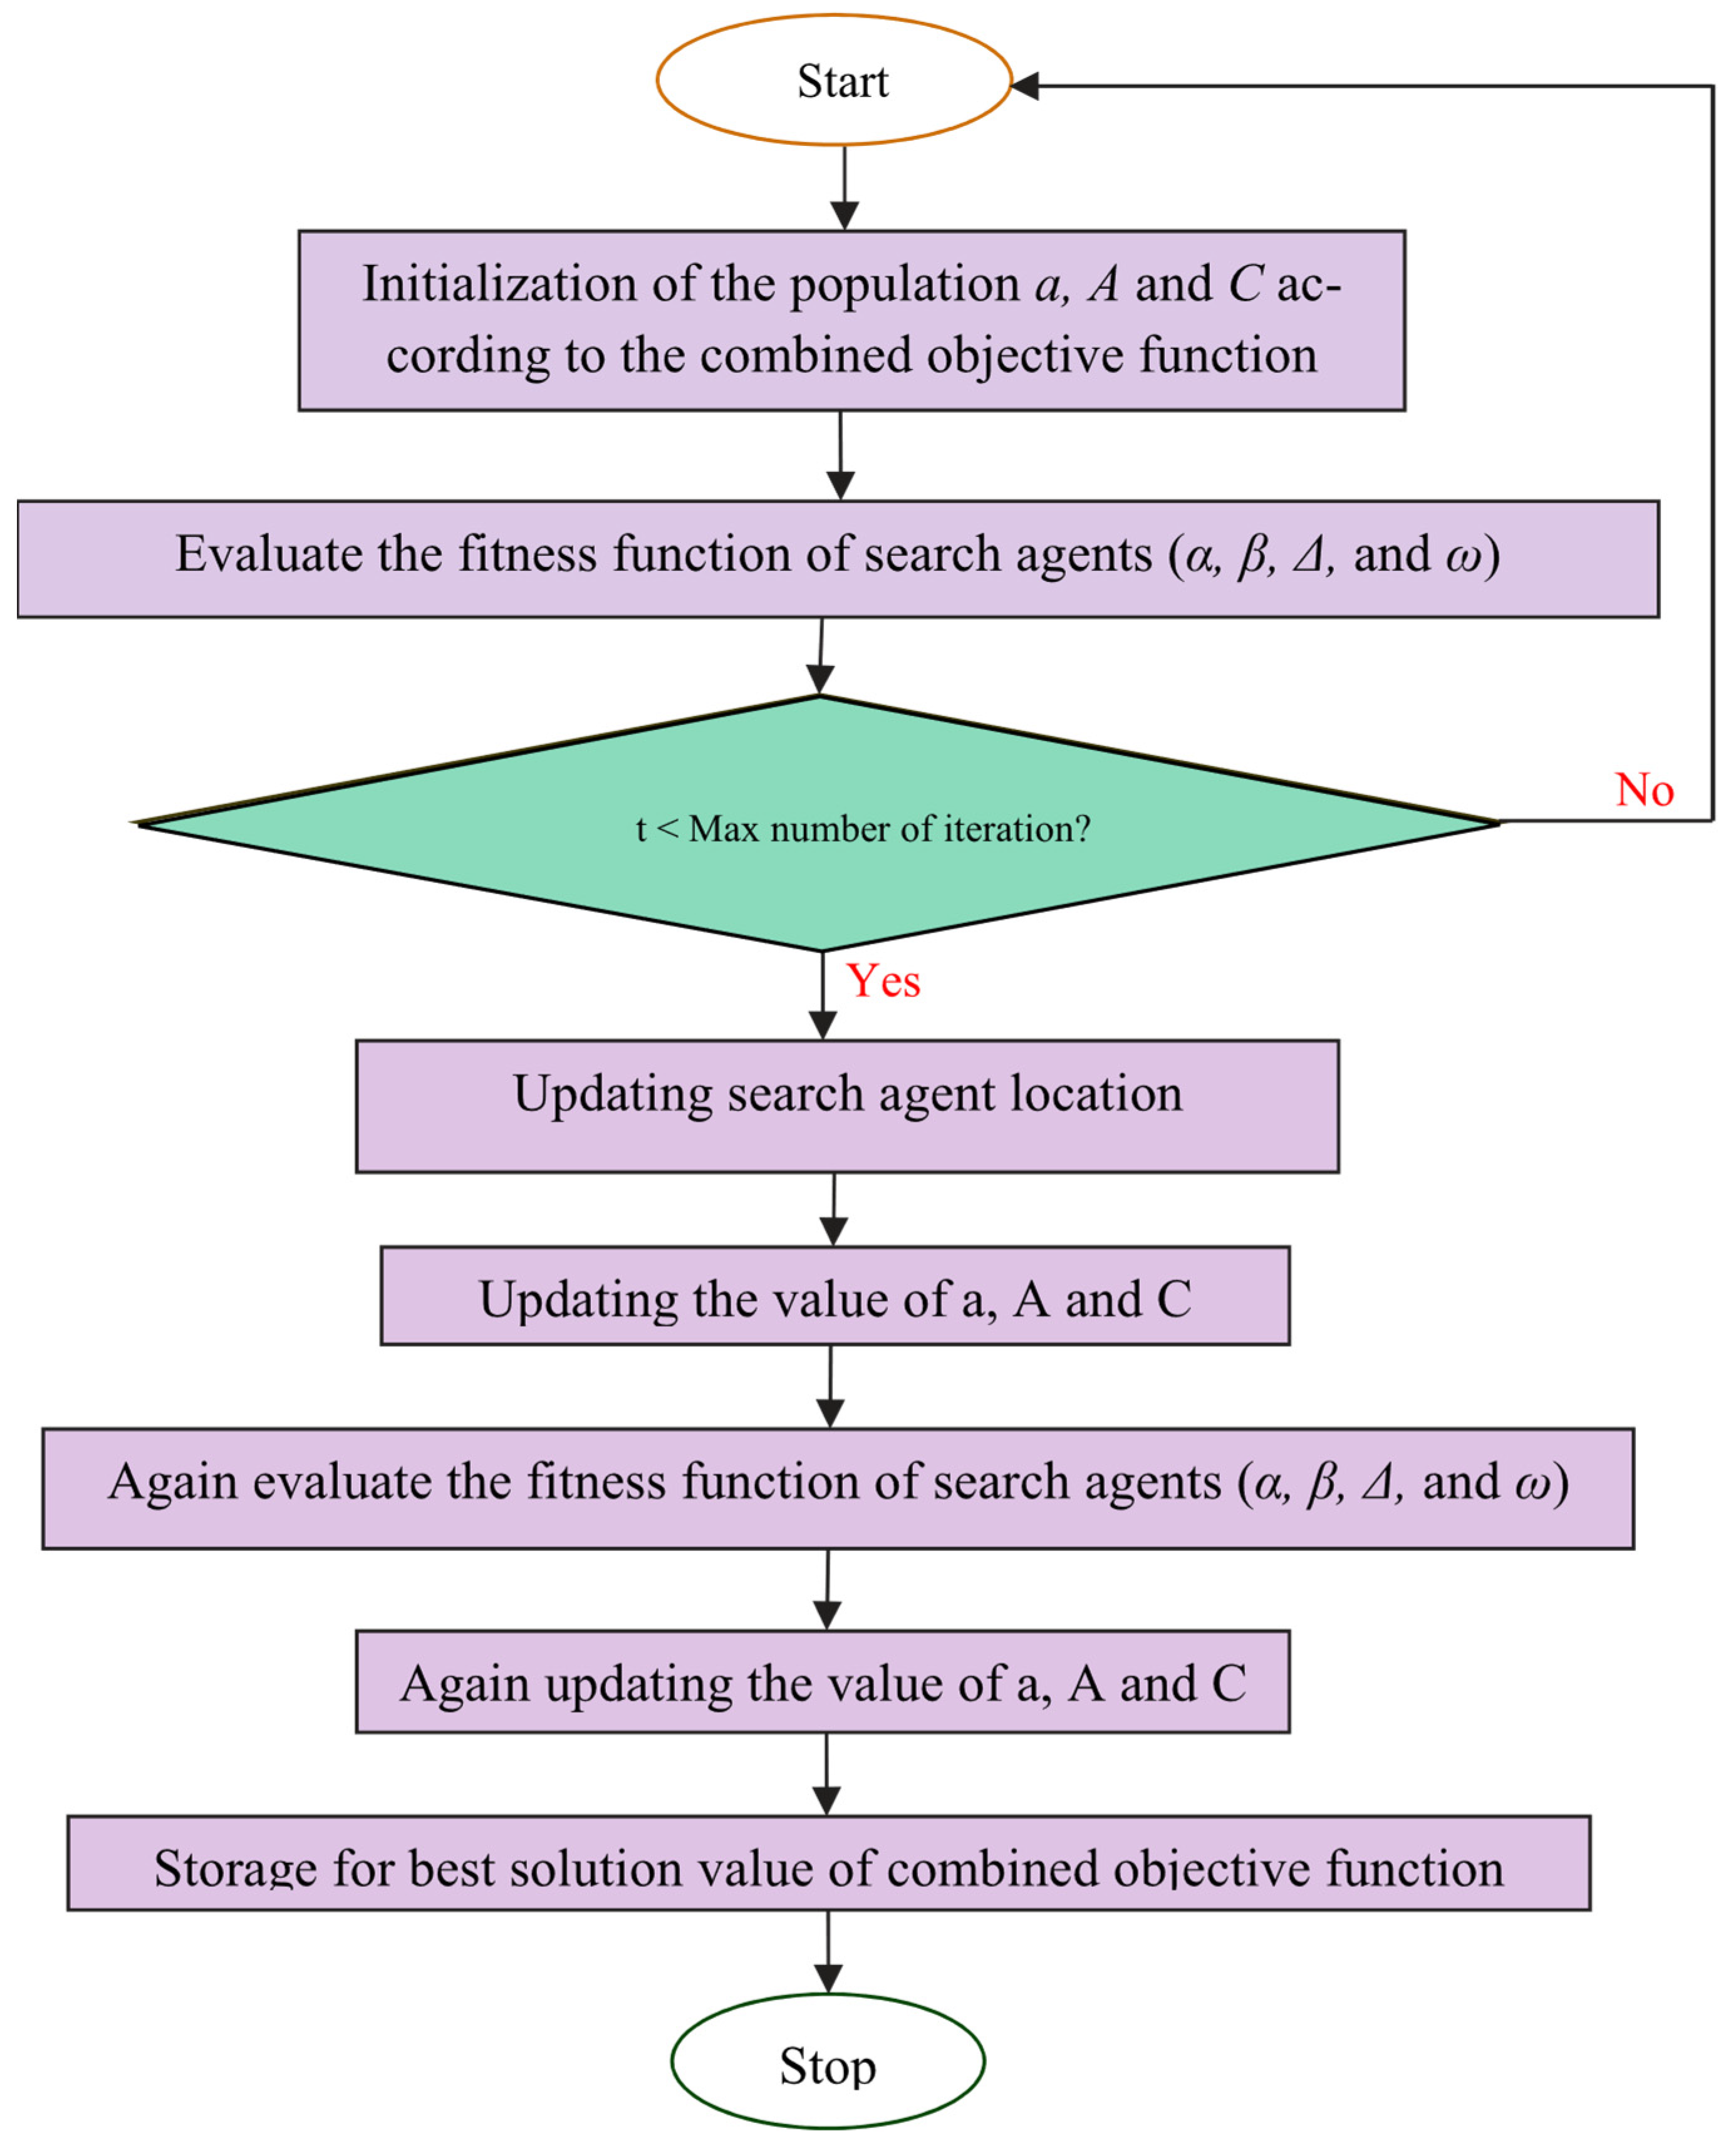
2.5. Grey Wolf Optimization Algorithm


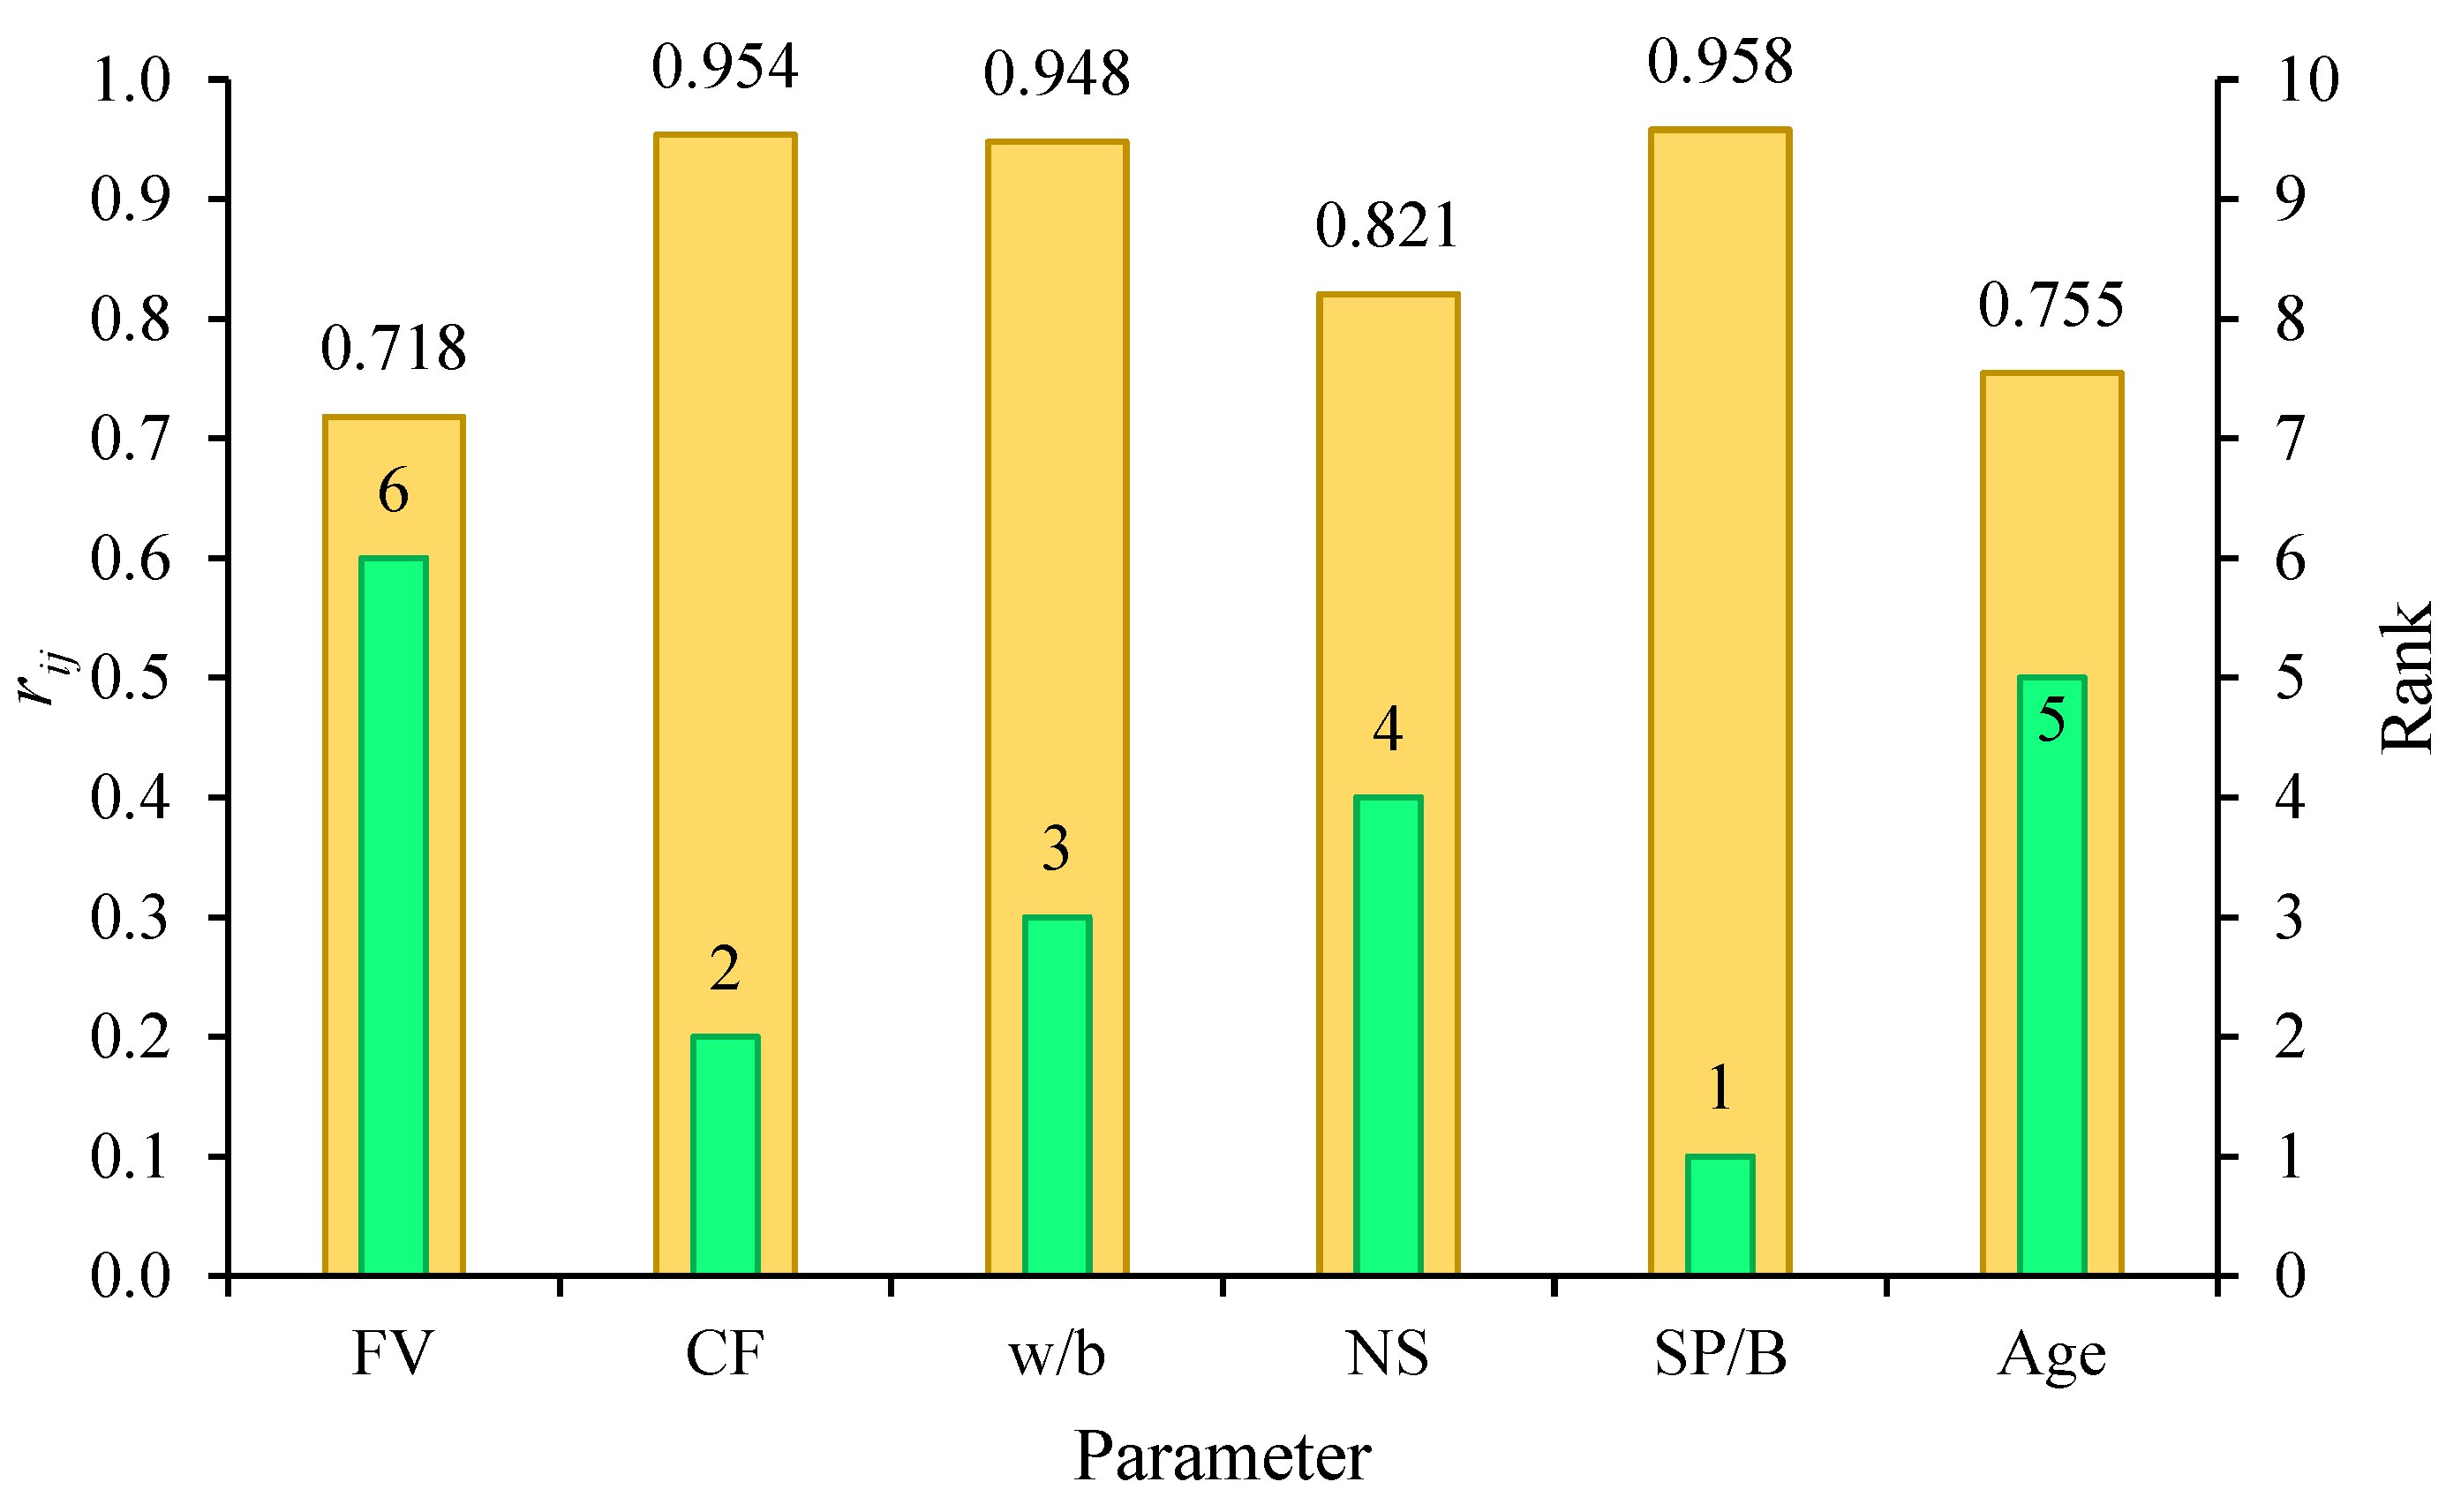
3. Data Analysis and Data Preparation
4. Prediction Results
4.1. Hyperparameters Tunning
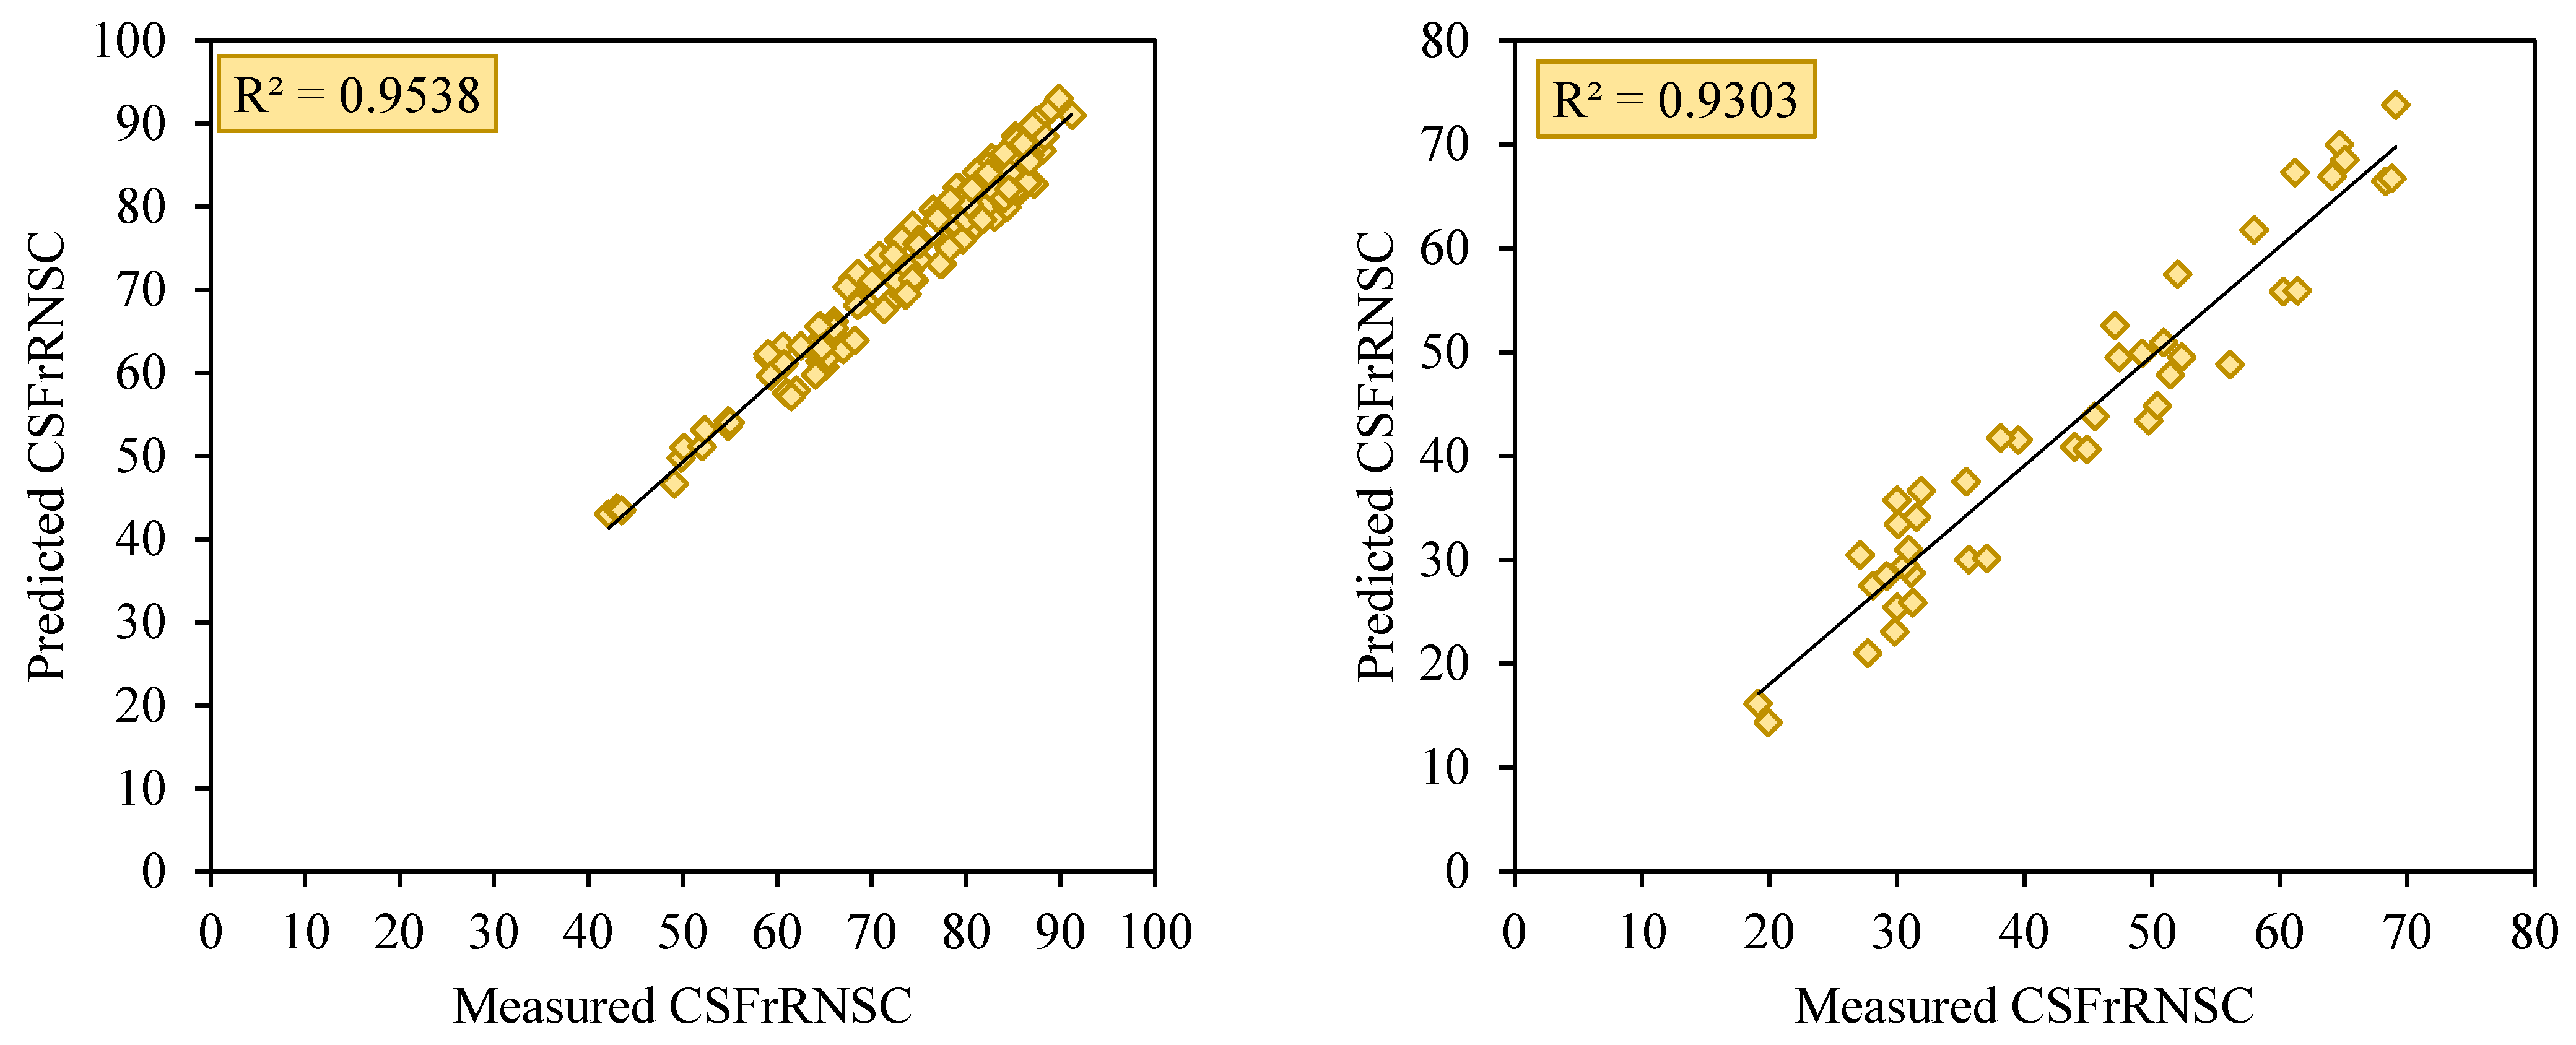
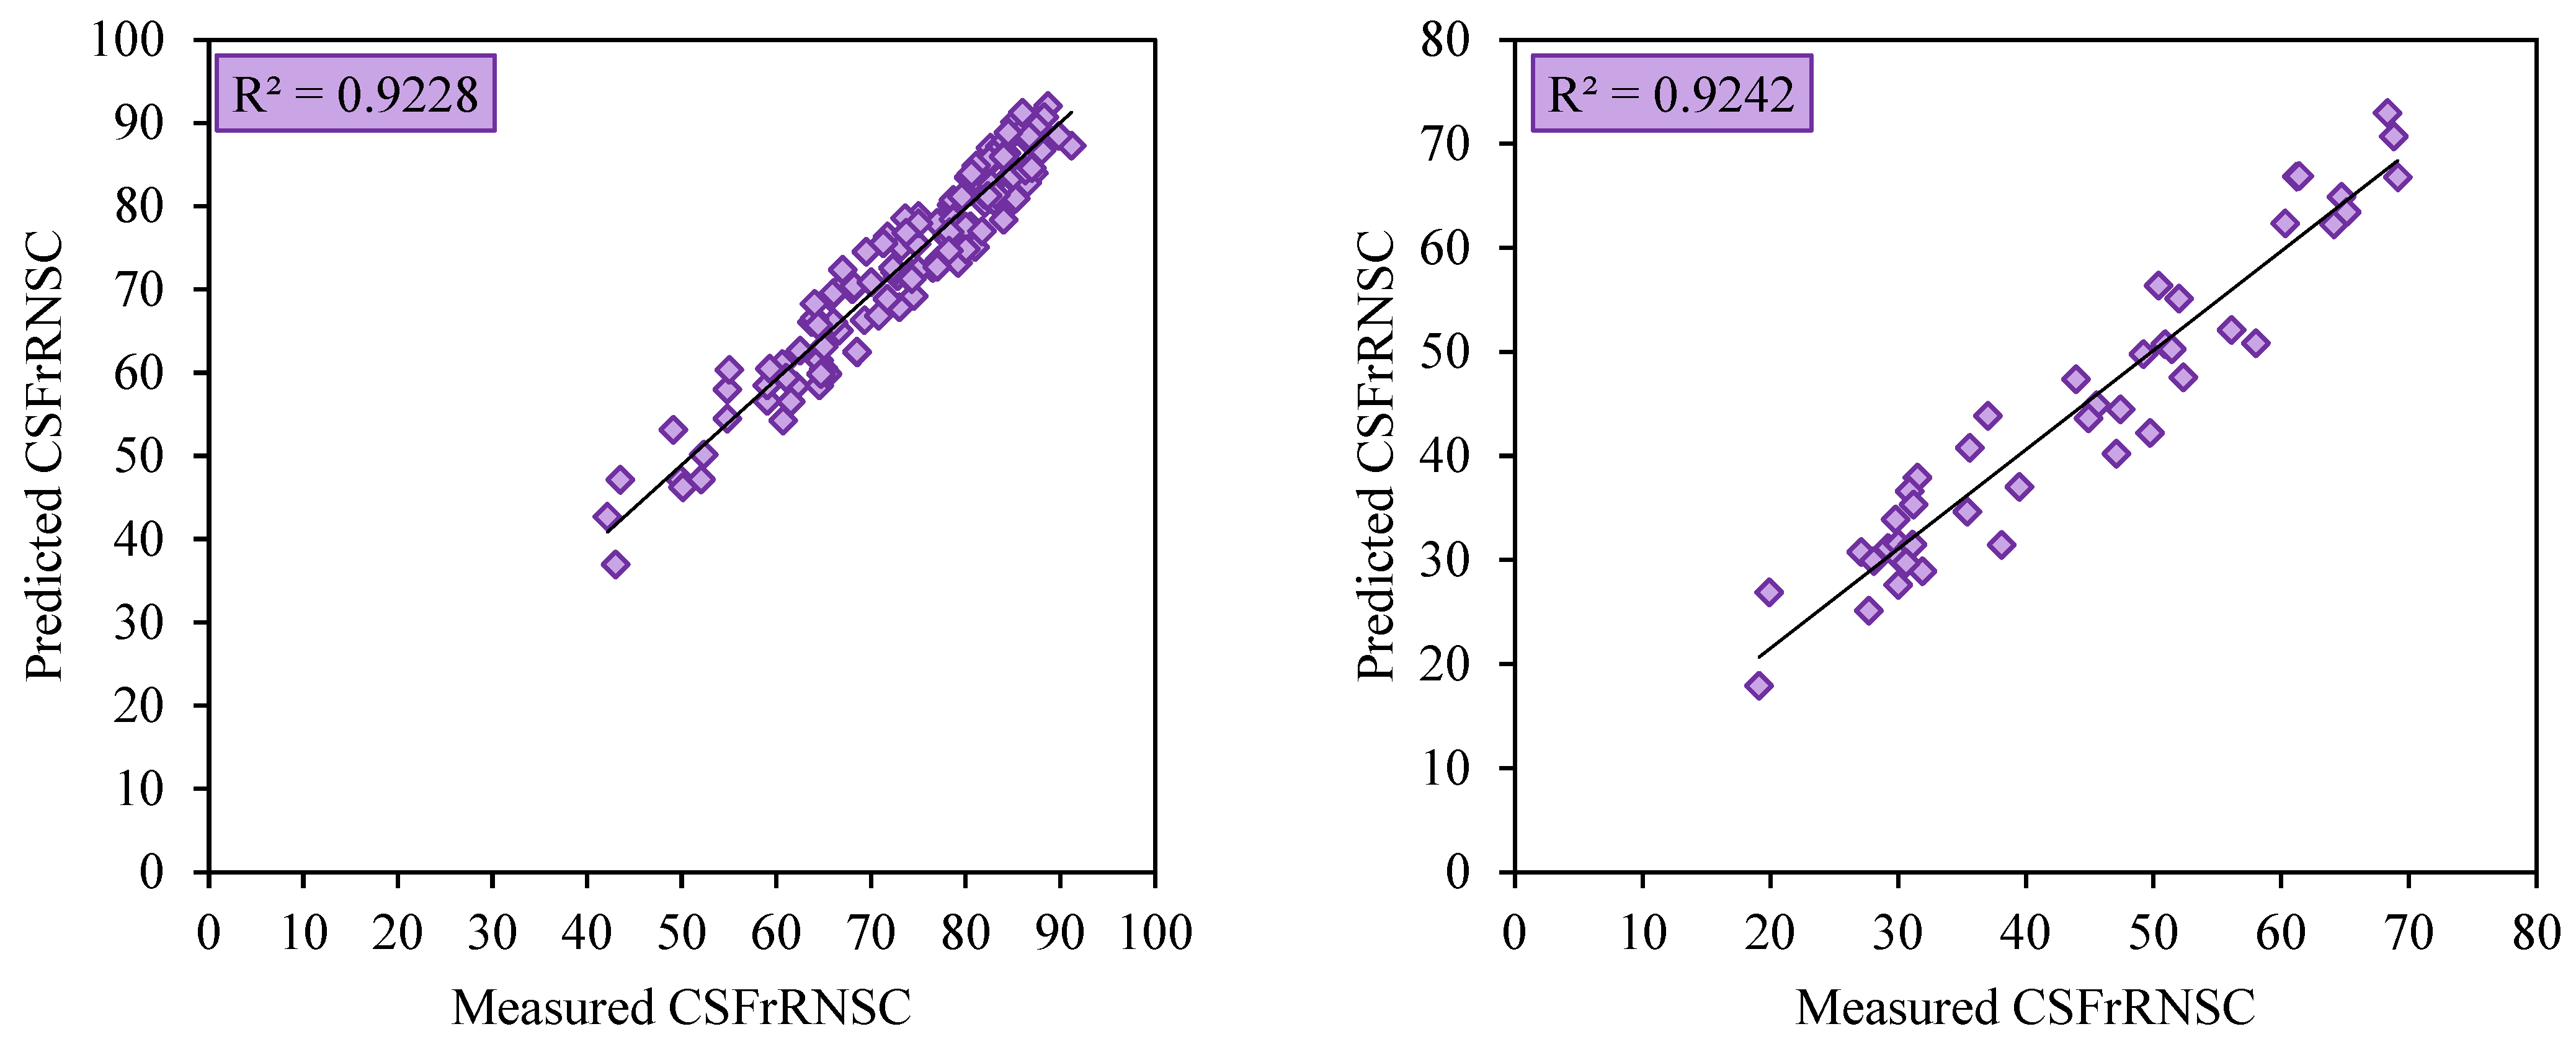
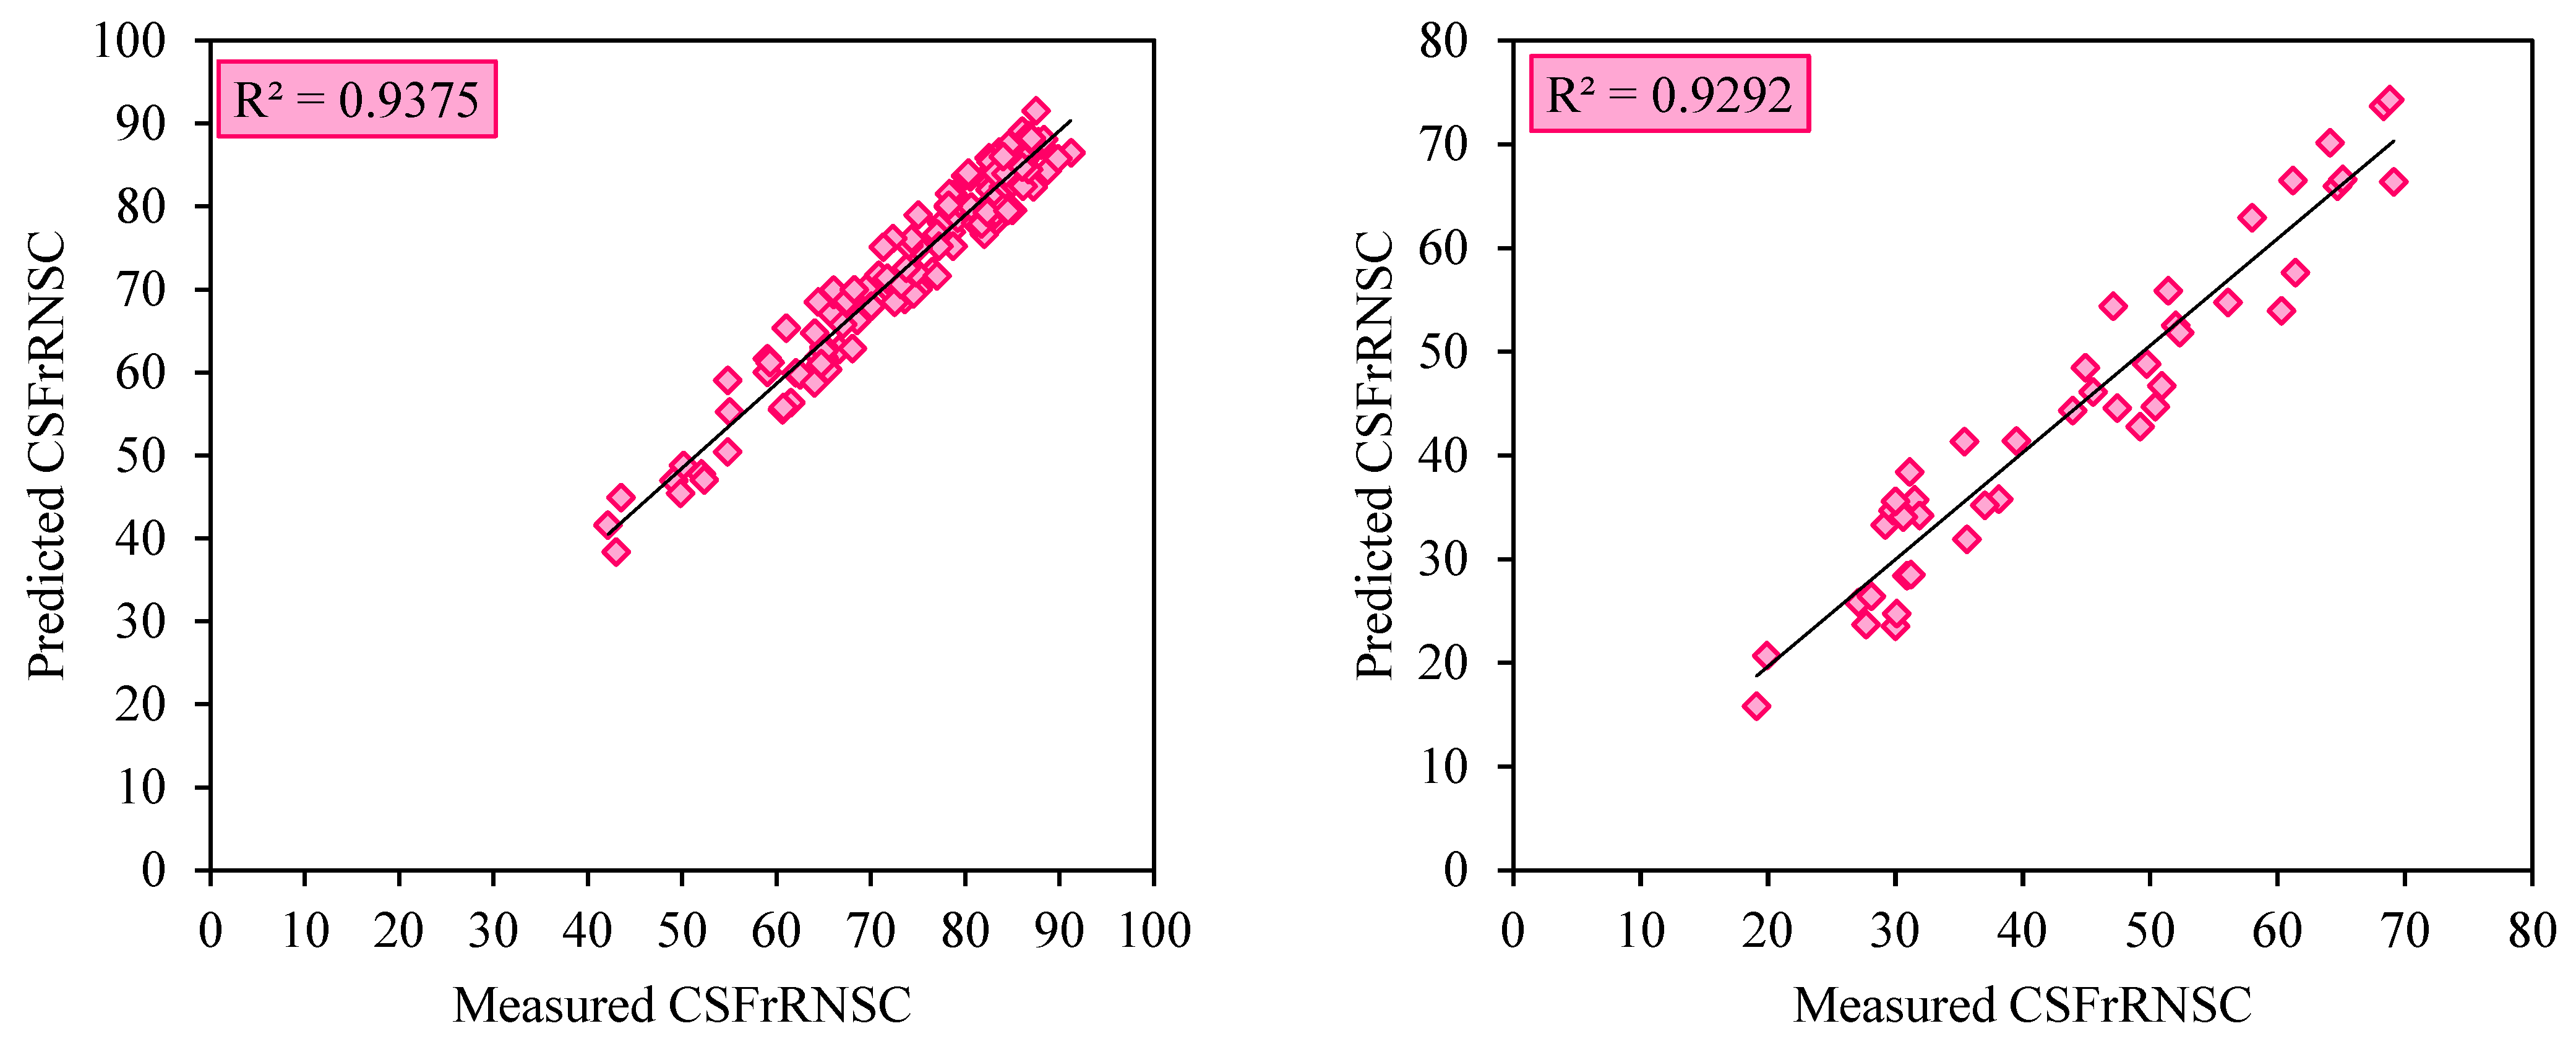
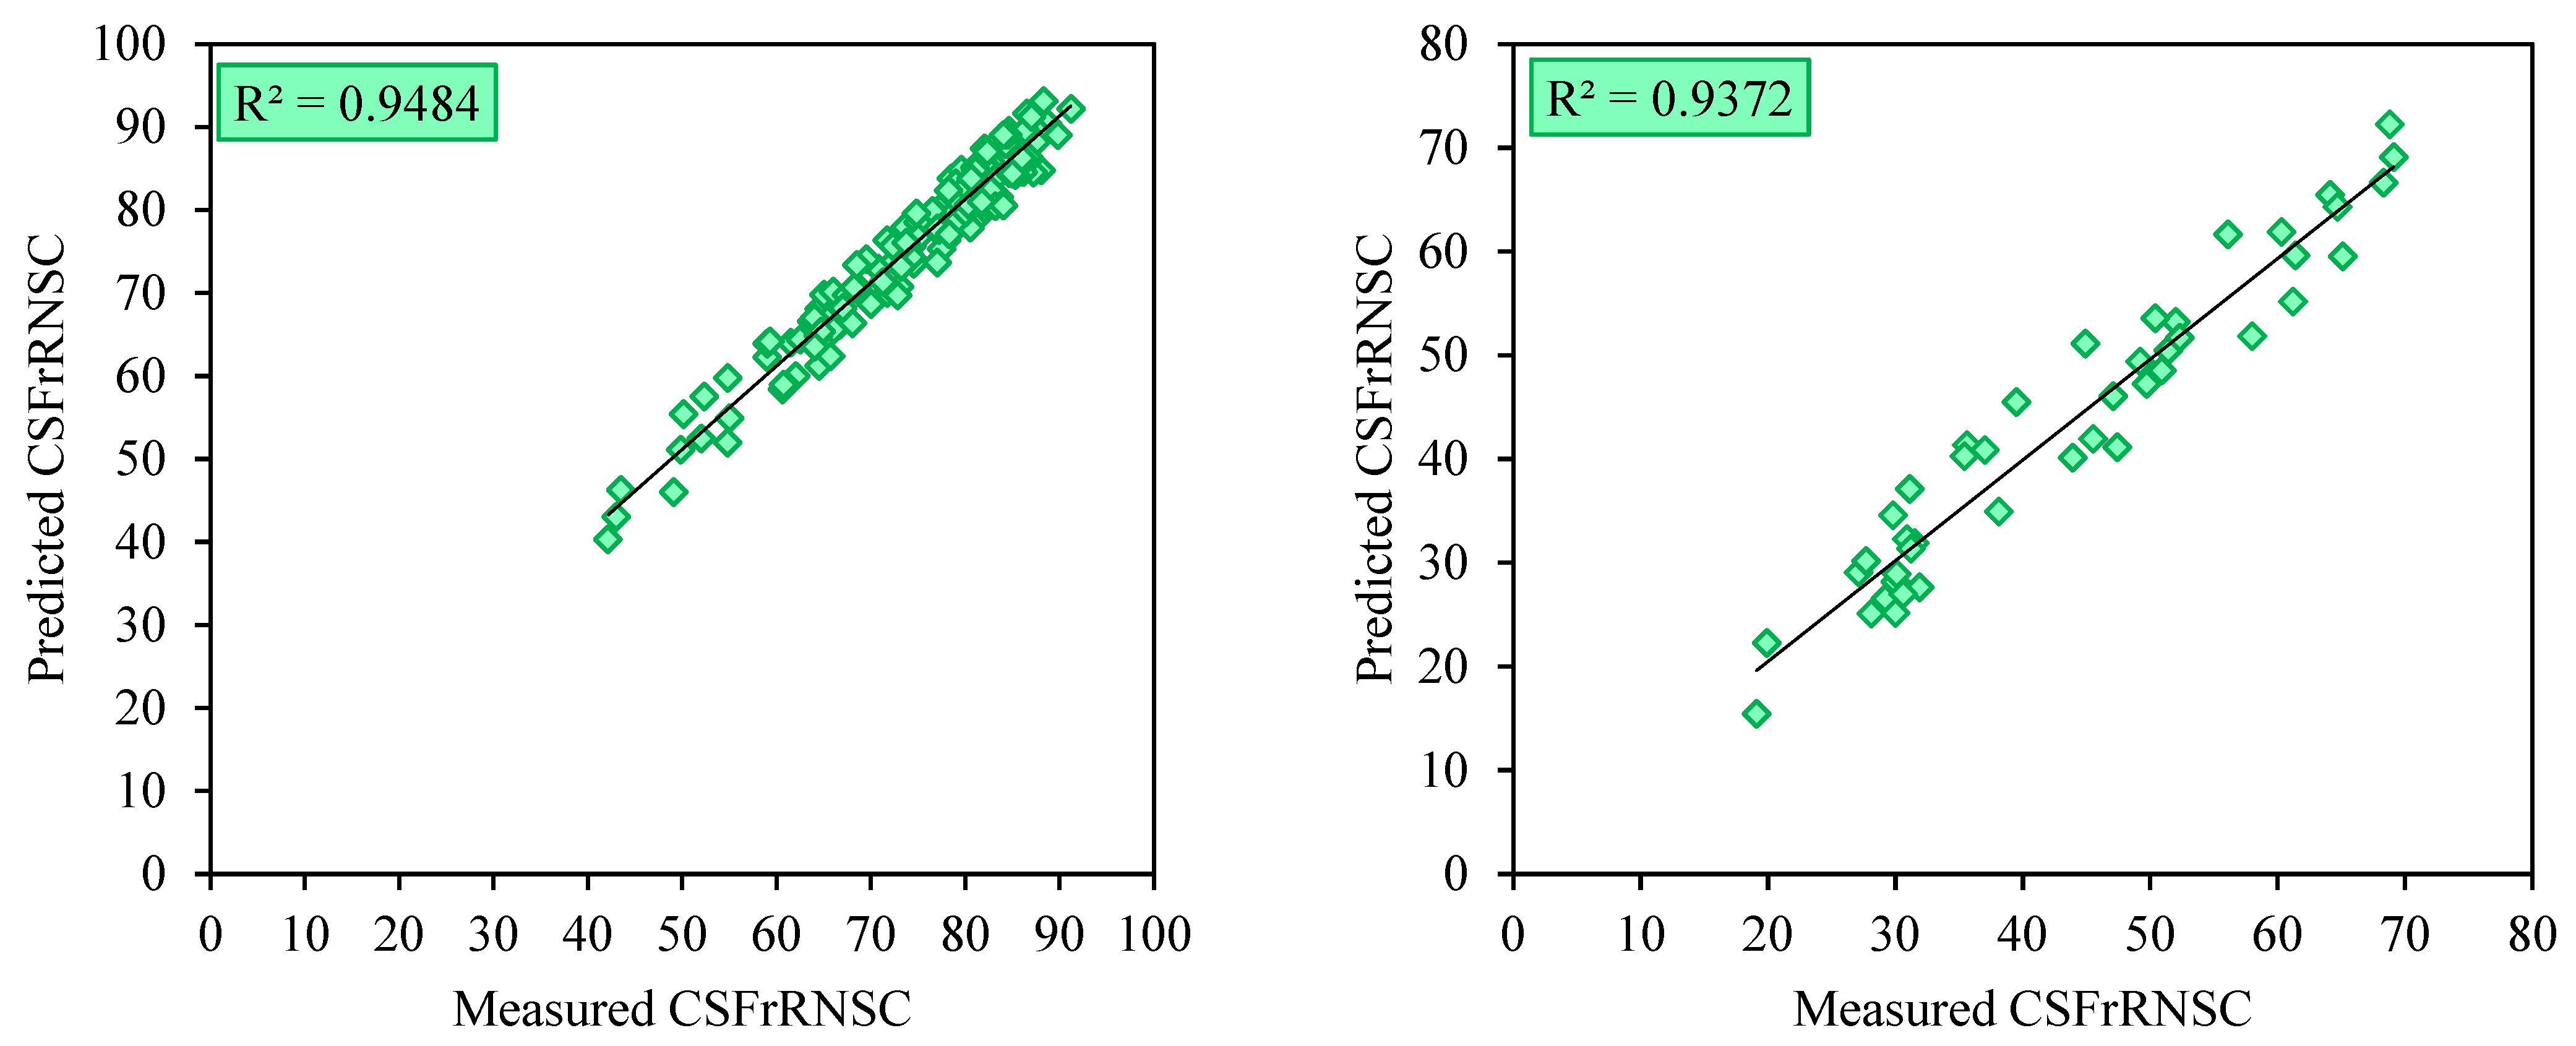
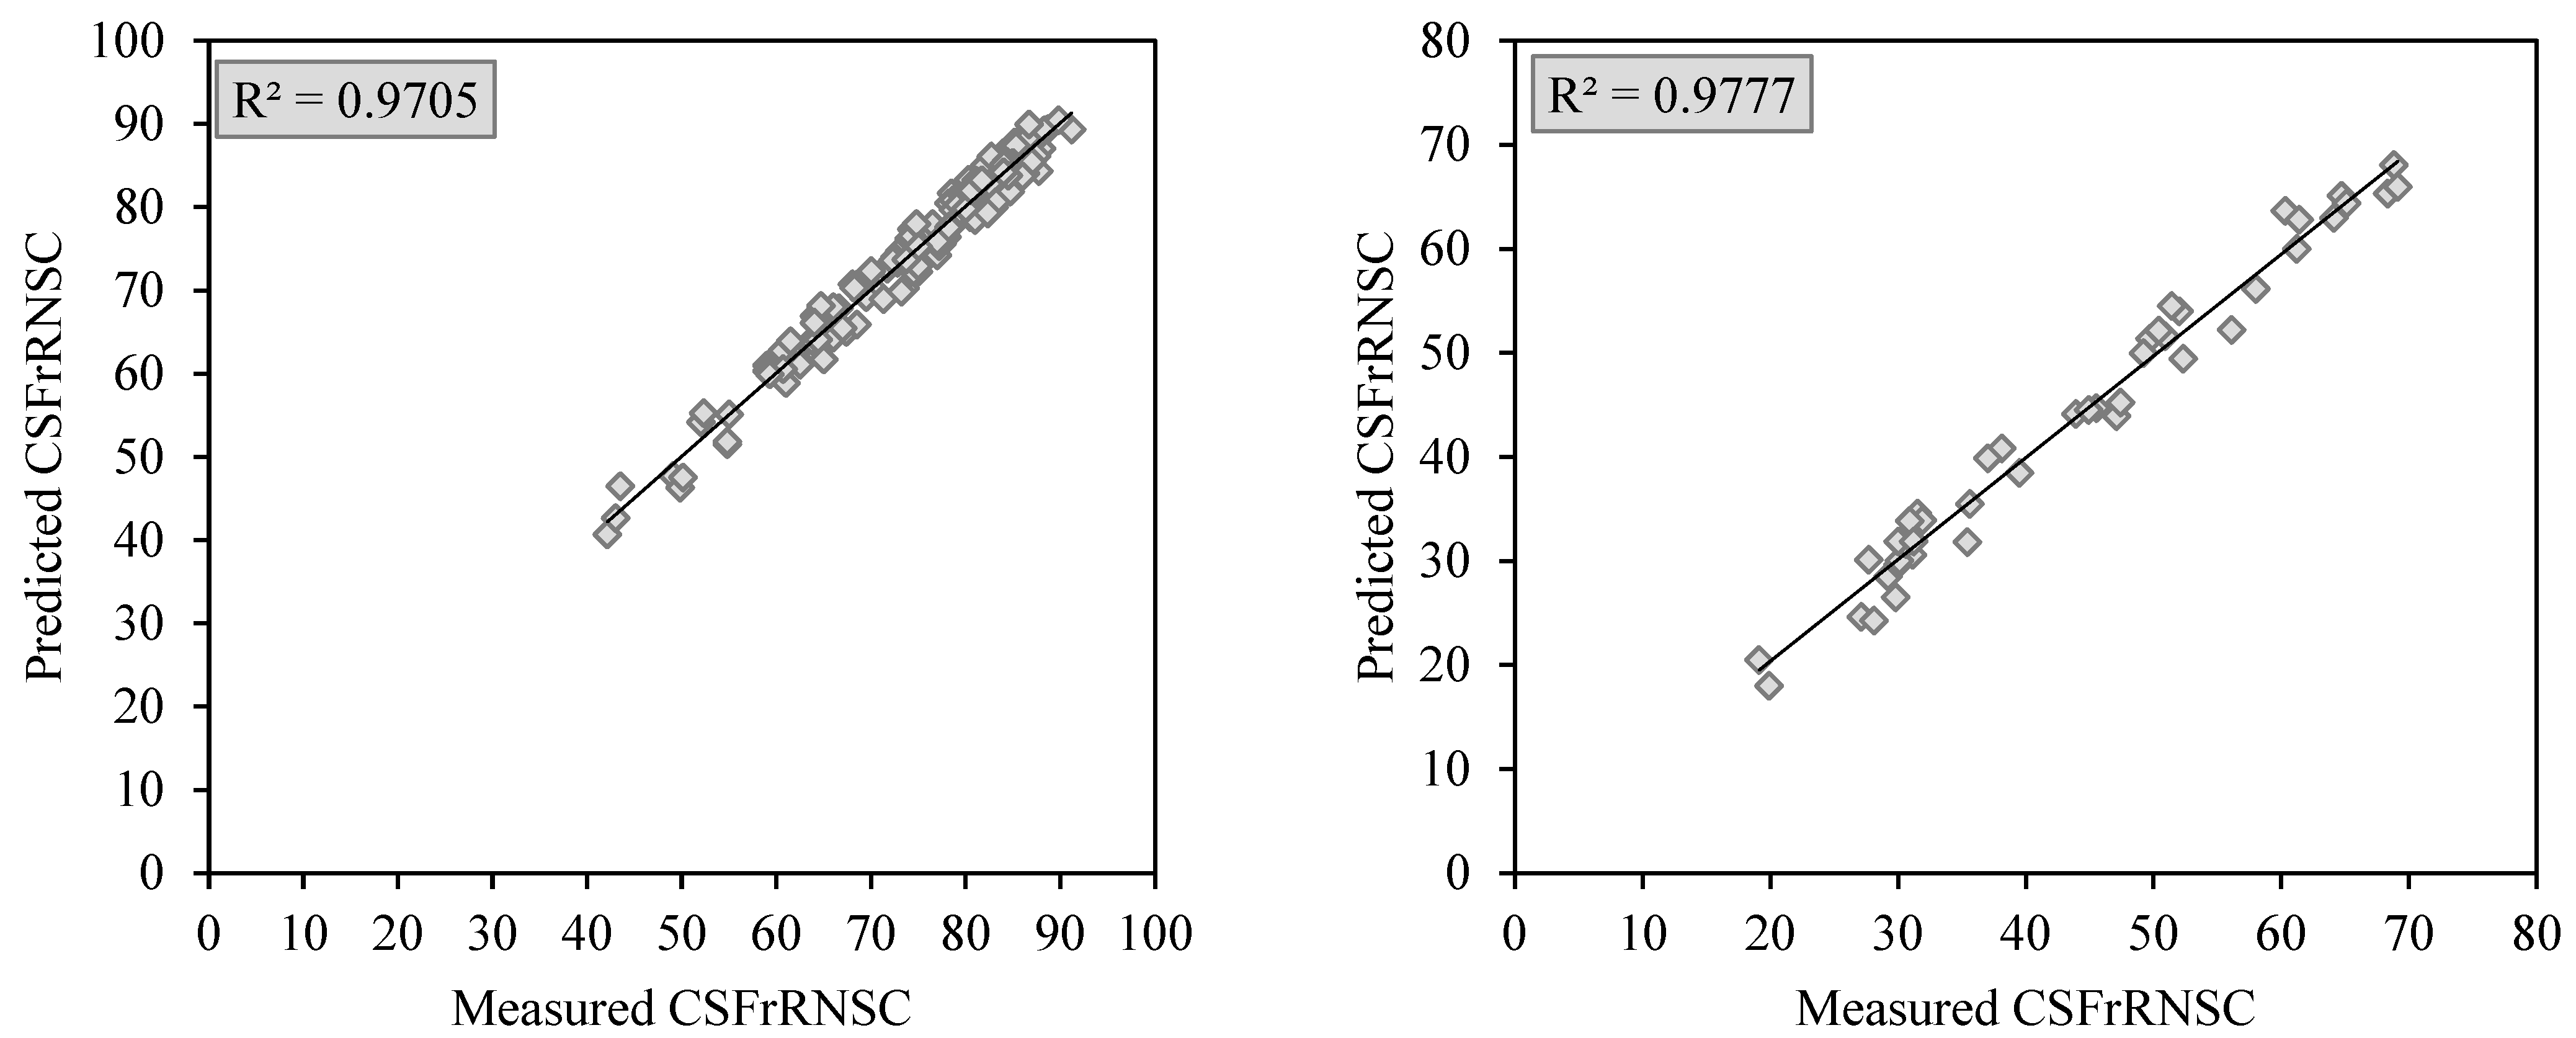
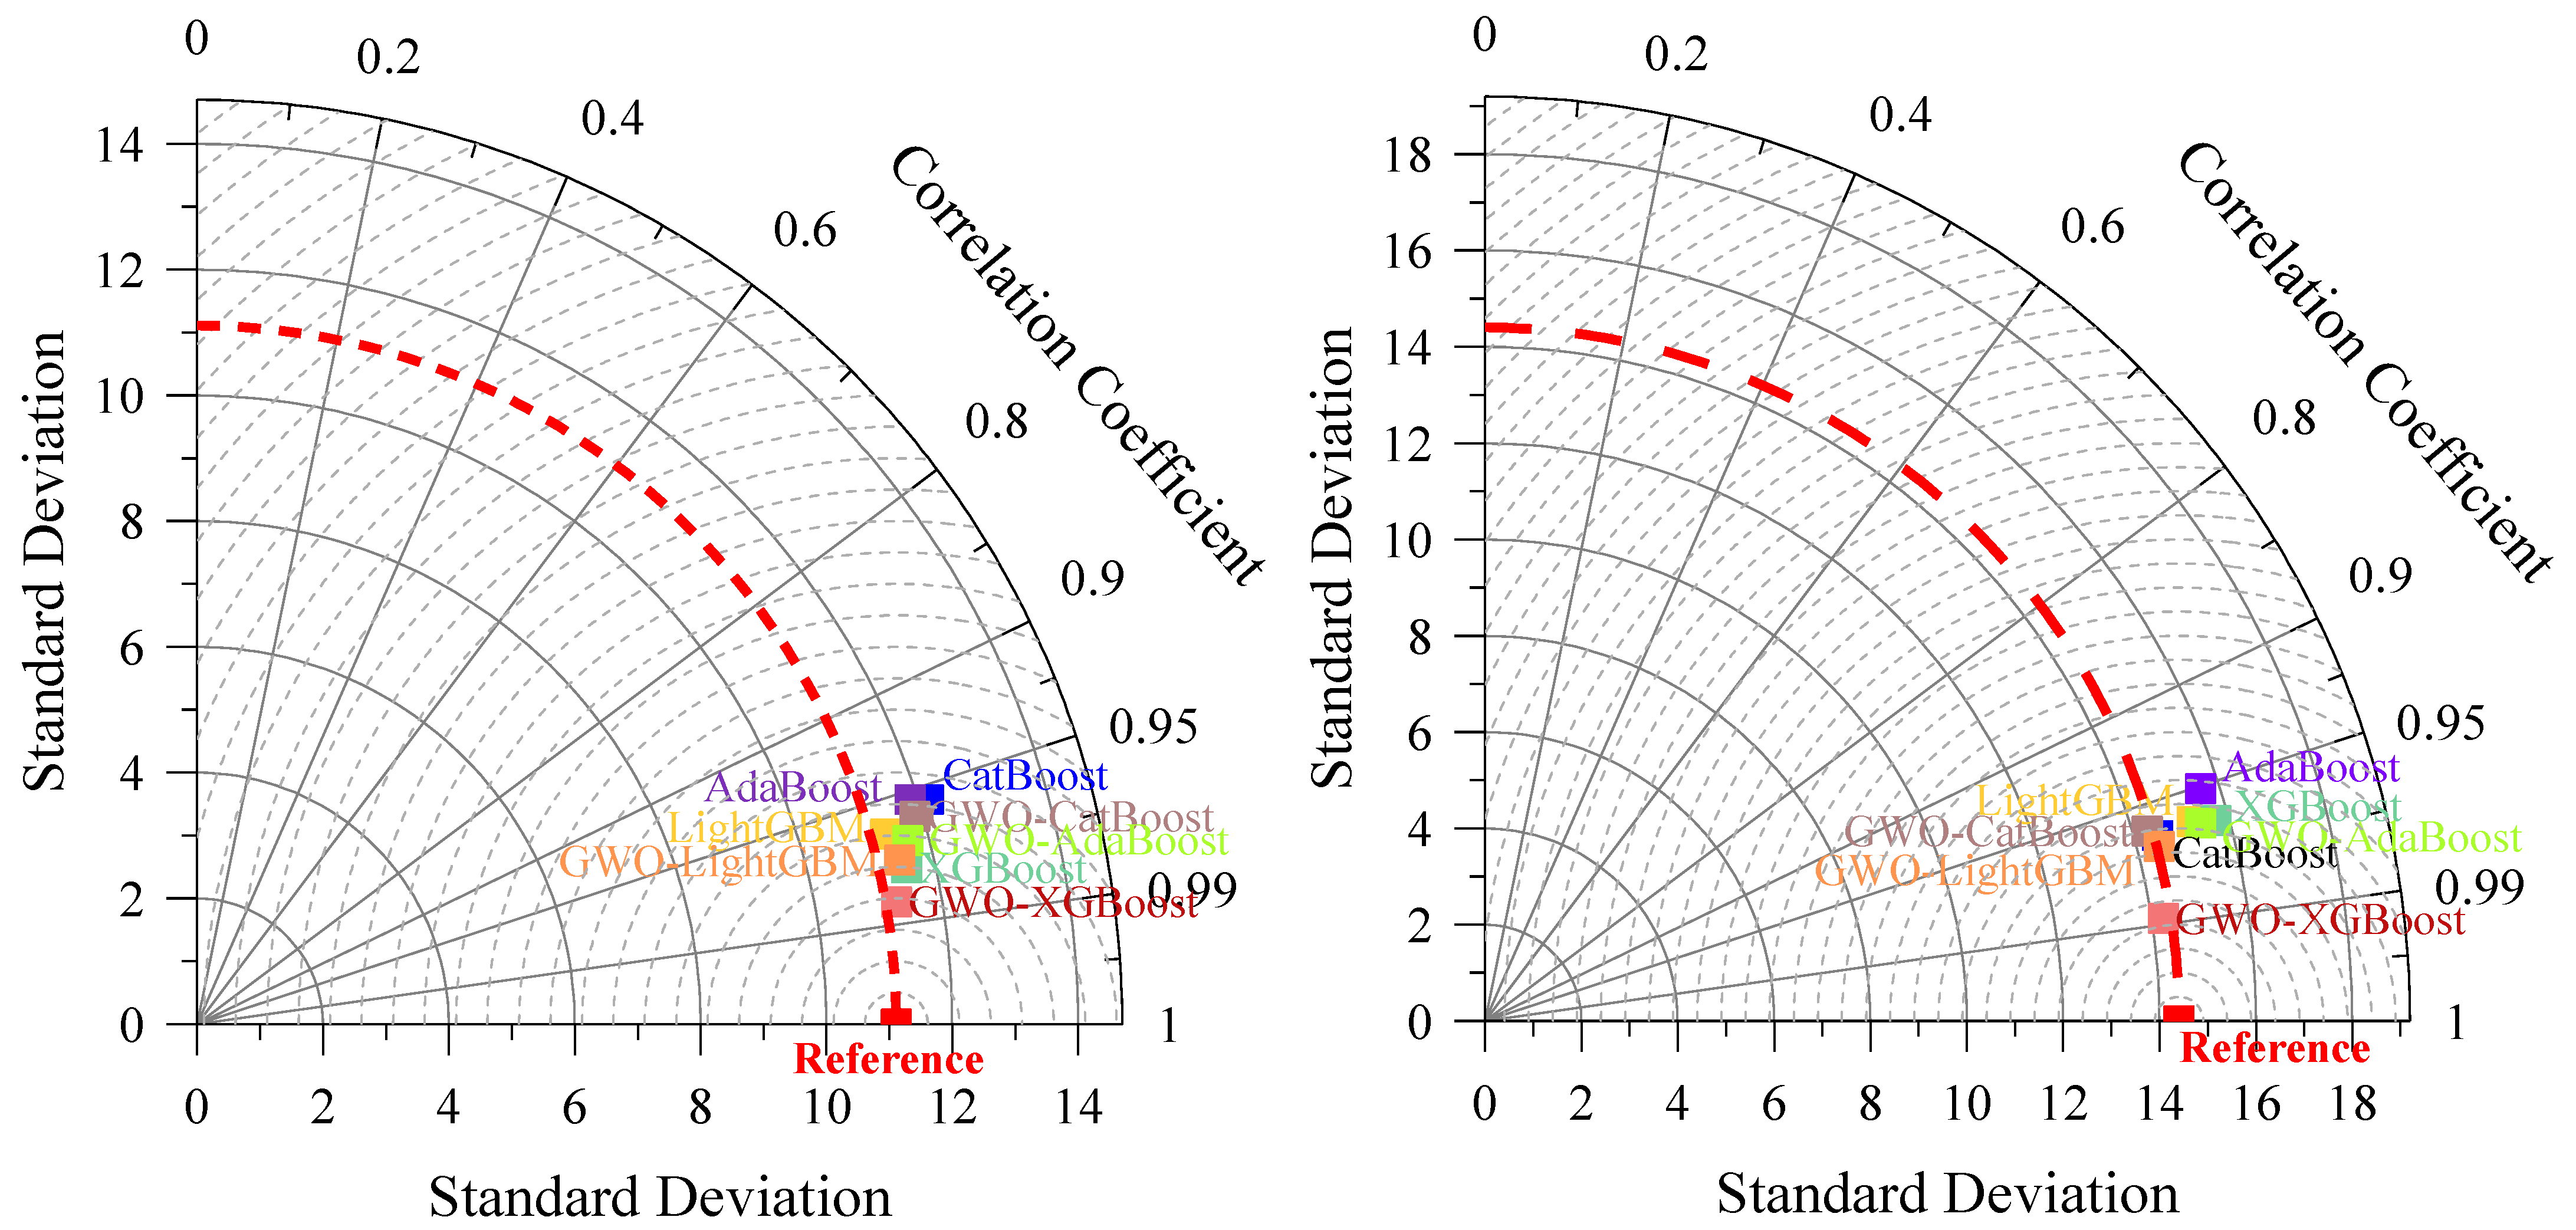
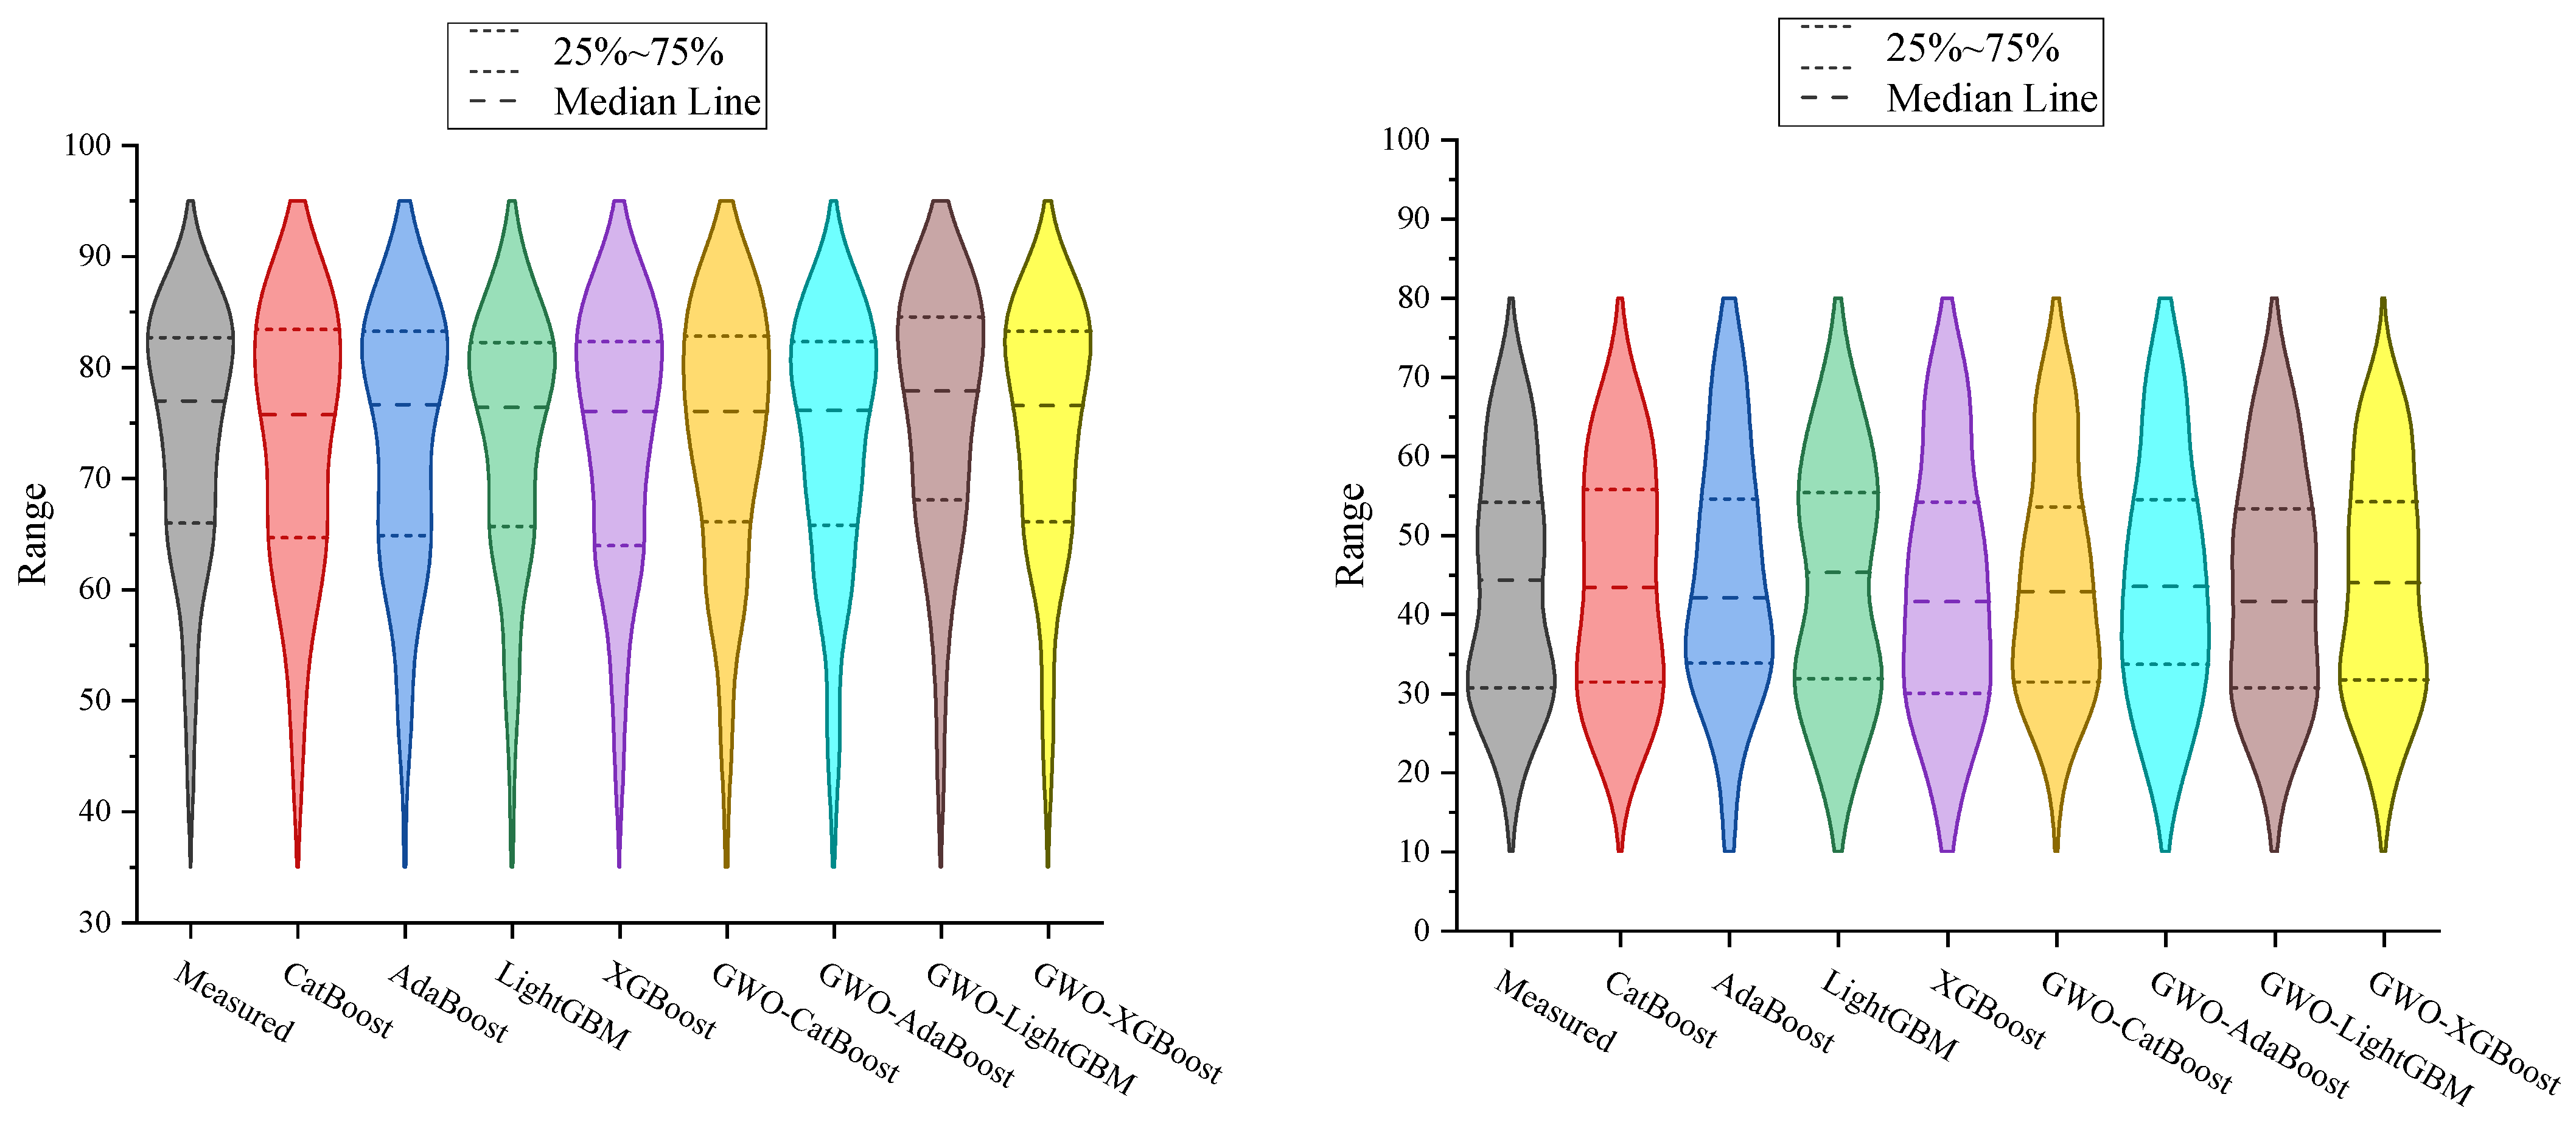
4.2. Results of Predictive Models
5. Conclusions
Author Contributions
Funding
Data Availability Statement
Conflicts of Interest
References
- Khan, M.; Cao, M.; Xie, C.; Ali, M. Effectiveness of Hybrid Steel-Basalt Fiber Reinforced Concrete under Compression. Case Stud. Constr. Mater. 2022, 16, e00941. [Google Scholar] [CrossRef]
- Khan, M.; Cao, M.; Chaopeng, X.; Ali, M. Experimental and Analytical Study of Hybrid Fiber Reinforced Concrete Prepared with Basalt Fiber under High Temperature. Fire Mater. 2022, 46, 205–226. [Google Scholar] [CrossRef]
- Khan, M.; Cao, M.; Ai, H.; Hussain, A. Basalt Fibers in Modified Whisker Reinforced Cementitious Composites. Period. Polytech. Civ. Eng. 2022, 66, 344–354. [Google Scholar] [CrossRef]
- Ren, J.L.; Xu, Y.S.; Zhao, Z.D.; Chen, J.C.; Cheng, Y.Y.; Huang, J.D.; Yang, C.X.; Wang, J. Fatigue Prediction of Semi-Flexible Composite Mixture Based on Damage Evolution. Constr. Build. Mater. 2022, 318, 126004. [Google Scholar] [CrossRef]
- Cao, M.; Mao, Y.; Khan, M.; Si, W.; Shen, S. Different Testing Methods for Assessing the Synthetic Fiber Distribution in Cement-Based Composites. Constr. Build. Mater. 2018, 184, 128–142. [Google Scholar] [CrossRef]
- Sun, Y.T.; Bi, R.Y.; Chang, Q.L.; Taherdangkoo, R.; Zhang, J.F.; Sun, J.B.; Huang, J.D.; Li, G.C. Stability Analysis of Roadway Groups under Multi-Mining Disturbances. Appl. Sci. 2021, 11, 7953. [Google Scholar] [CrossRef]
- Cui, K.; Chang, J.; Sabri, M.M.S.; Huang, J.D. Toughness, Reinforcing Mechanism, and Durability of Hybrid Steel Fiber Reinforced Sulfoaluminate Cement Composites. Buildings 2022, 12, 1243. [Google Scholar] [CrossRef]
- Afroughsabet, V.; Biolzi, L.; Ozbakkaloglu, T. Influence of Double Hooked-End Steel Fibers and Slag on Mechanical and Durability Properties of High Performance Recycled Aggregate Concrete. Compos. Struct. 2017, 181, 273–284. [Google Scholar] [CrossRef]
- Afroughsabet, V.; Ozbakkaloglu, T. Mechanical and Durability Properties of High-Strength Concrete Containing Steel and Polypropylene Fibers. Constr. Build. Mater. 2015, 94, 73–82. [Google Scholar] [CrossRef]
- Chun, B.; Kim, S.; Yoo, D.-Y. Reinforcing Effect of Surface-Modified Steel Fibers in Ultra-High-Performance Concrete under Tension. Case Stud. Constr. Mater. 2022, 16, e01125. [Google Scholar] [CrossRef]
- Murad, Y. Compressive Strength Prediction for Concrete Modified with Nanomaterials. Case Stud. Constr. Mater. 2021, 15, e00660. [Google Scholar] [CrossRef]
- Cao, M.; Khan, M.; Ahmed, S. Effectiveness of Calcium Carbonate Whisker in Cementitious Composites. Period. Polytech. Civ. Eng. 2020, 64, 265. [Google Scholar] [CrossRef]
- Bahari, A.; Berenjian, J.; Sadeghi-Nik, A. Modification of Portland Cement with Nano SiC. Proc. Natl. Acad. Sci. India Sect. A Phys. Sci. 2016, 86, 323–331. [Google Scholar] [CrossRef]
- Wang, X.F.; Huang, Y.J.; Wu, G.Y.; Fang, C.; Li, D.W.; Han, N.X.; Xing, F. Effect of Nano-SiO2 on Strength, Shrinkage and Cracking Sensitivity of Lightweight Aggregate Concrete. Constr. Build. Mater. 2018, 175, 115–125. [Google Scholar] [CrossRef]
- Ren, J.L.; Xu, Y.S.; Huang, J.D.; Wang, Y.; Jia, Z.R. Gradation Optimization and Strength Mechanism of Aggregate Structure Considering Macroscopic and Mesoscopic Aggregate Mechanical Behaviour in Porous Asphalt Mixture. Constr. Build. Mater. 2021, 300, 124262. [Google Scholar] [CrossRef]
- Gao, Y.; Huang, J.D.; Li, M.; Dai, Z.R.; Jiang, R.L.; Zhang, J.X. Chemical Modification of Combusted Coal Gangue for U(VI) Adsorption: Towards a Waste Control by Waste Strategy. Sustainability 2021, 13, 8421. [Google Scholar] [CrossRef]
- Ying, J.; Zhou, B.; Xiao, J. Pore Structure and Chloride Diffusivity of Recycled Aggregate Concrete with Nano-SiO2 and Nano-TiO2. Constr. Build. Mater. 2017, 150, 49–55. [Google Scholar] [CrossRef]
- Ardalan, R.B.; Jamshidi, N.; Arabameri, H.; Joshaghani, A.; Mehrinejad, M.; Sharafi, P. Enhancing the Permeability and Abrasion Resistance of Concrete Using Colloidal Nano-SiO2 Oxide and Spraying Nanosilicon Practices. Constr. Build. Mater. 2017, 146, 128–135. [Google Scholar] [CrossRef]
- Sharkawi, A.M.; Abd-Elaty, M.A.; Khalifa, O.H. Synergistic Influence of Micro-Nano Silica Mixture on Durability Performance of Cementious Materials. Constr. Build. Mater. 2018, 164, 579–588. [Google Scholar] [CrossRef]
- Xu, J.; Kong, F.; Song, S.; Cao, Q.; Huang, T.; Cui, Y. Effect of Fenton Pre-Oxidation on Mobilization of Nutrients and Efficient Subsequent Bioremediation of Crude Oil-Contaminated Soil. Chemosphere 2017, 180, 1–10. [Google Scholar] [CrossRef]
- Zahiri, F.; Eskandari-Naddaf, H. Optimizing the Compressive Strength of Concrete Containing Micro-Silica, Nano-Silica, and Polypropylene Fibers Using Extreme Vertices Mixture Design. Front. Struct. Civ. Eng. 2019, 13, 821–830. [Google Scholar] [CrossRef]
- Mohammed, B.S.; Liew, M.S.; Alaloul, W.S.; Khed, V.C.; Hoong, C.Y.; Adamu, M. Properties of Nano-Silica Modified Pervious Concrete. Case Stud. Constr. Mater. 2018, 8, 409–422. [Google Scholar] [CrossRef]
- Norhasri, M.S.M.; Hamidah, M.S.; Fadzil, A.M. Applications of Using Nano Material in Concrete: A Review. Constr. Build. Mater. 2017, 133, 91–97. [Google Scholar] [CrossRef]
- Zhang, H.; Chang, Q.; Li, S.; Huang, J.D. Determining the Efficiency of the Sponge City Construction Pilots in China Based on the DEA-Malmquist Model. Int. J. Environ. Res. Public. Health 2022, 19, 11195. [Google Scholar] [CrossRef] [PubMed]
- Massana, J.; Reyes, E.; Bernal, J.; León, N.; Sánchez-Espinosa, E. Influence of Nano-and Micro-Silica Additions on the Durability of a High-Performance Self-Compacting Concrete. Constr. Build. Mater. 2018, 165, 93–103. [Google Scholar] [CrossRef]
- Tian, Q.; Su, Z.L.; Fiorentini, N.; Zhou, J.; Luo, H.; Lu, Y.J.; Xu, X.Q.; Chen, C.P.; Huang, J.D. Ensemble Learning Models to Predict the Compressive Strength of Geopolymer Concrete: A Comparative Study for Geopolymer Composition Design. Multiscale Multidiscip. Model. Exp. Des. 2023. [Google Scholar] [CrossRef]
- Mahapatra, C.K.; Barai, S.V. Temperature Impact on Residual Properties of Self-Compacting Based Hybrid Fiber Reinforced Concrete with Fly Ash and Colloidal Nano Silica. Constr. Build. Mater. 2019, 198, 120–132. [Google Scholar] [CrossRef]
- Erdem, S.; Hanbay, S.; Güler, Z. Micromechanical Damage Analysis and Engineering Performance of Concrete with Colloidal Nano-Silica and Demolished Concrete Aggregates. Constr. Build. Mater. 2018, 171, 634–642. [Google Scholar] [CrossRef]
- Zareei, S.A.; Ameri, F.; Bahrami, N.; Shoaei, P.; Moosaei, H.R.; Salemi, N. Performance of Sustainable High Strength Concrete with Basic Oxygen Steel-Making (BOS) Slag and Nano-Silica. J. Build. Eng. 2019, 25, 100791. [Google Scholar] [CrossRef]
- Fang, Y.; Wang, J.; Ma, H.; Wang, L.; Qian, X.; Qiao, P. Performance Enhancement of Silica Fume Blended Mortars Using Bio-Functionalized Nano-Silica. Constr. Build. Mater. 2021, 312, 125467. [Google Scholar] [CrossRef]
- Reches, Y. Nanoparticles as Concrete Additives: Review and Perspectives. Constr. Build. Mater. 2018, 175, 483–495. [Google Scholar] [CrossRef]
- Zhou, J.; Su, Z.; Hosseini, S.; Tian, Q.; Lu, Y.; Luo, H.; Xu, X.; Chen, C.; Huang, J. Decision Tree Models for the Estimation of Geo-Polymer Concrete Compressive Strength. Math. Biosci. Eng. 2024, 21, 1413–1444. [Google Scholar] [CrossRef]
- Wang, Q.-A.; Zhang, J.; Huang, J. Simulation of the Compressive Strength of Cemented Tailing Backfill through the Use of Firefly Algorithm and Random Forest Model. Shock Vib. 2021, 2021, 5536998. [Google Scholar] [CrossRef]
- Huang, J.; Zhou, M.; Sabri, M.M.S.; Yuan, H. A Novel Neural Computing Model Applied to Estimate the Dynamic Modulus (Dm) of Asphalt Mixtures by the Improved Beetle Antennae Search. Sustainability 2022, 14, 5938. [Google Scholar] [CrossRef]
- Huang, J.; Kumar, G.S.; Ren, J.; Zhang, J.; Sun, Y. Accurately Predicting Dynamic Modulus of Asphalt Mixtures in Low-Temperature Regions Using Hybrid Artificial Intelligence Model. Constr. Build. Mater. 2021, 297, 123655. [Google Scholar] [CrossRef]
- Niewiadomski, P.; Stefaniuk, D.; Hoła, J. Microstructural Analysis of Self-Compacting Concrete Modified with the Addition of Nanoparticles. Procedia Eng. 2017, 172, 776–783. [Google Scholar] [CrossRef]
- Ren, J.; Lai, Y.; Gao, J. Exploring the Influence of SiO2 and TiO2 Nanoparticles on the Mechanical Properties of Concrete. Constr. Build. Mater. 2018, 175, 277–285. [Google Scholar] [CrossRef]
- Zhang, B.; Ahmad, W.; Ahmad, A.; Aslam, F.; Joyklad, P. A Scientometric Analysis Approach to Analyze the Present Research on Recycled Aggregate Concrete. J. Build. Eng. 2022, 46, 103679. [Google Scholar] [CrossRef]
- Singh, N.; Kumar, P.; Goyal, P. Reviewing the Behaviour of High Volume Fly Ash Based Self Compacting Concrete. J. Build. Eng. 2019, 26, 100882. [Google Scholar] [CrossRef]
- Sadrmomtazi, A.; Sobhani, J.; Mirgozar, M.A. Modeling Compressive Strength of EPS Lightweight Concrete Using Regression, Neural Network and ANFIS. Constr. Build. Mater. 2013, 42, 205–216. [Google Scholar] [CrossRef]
- Nafees, A.; Amin, M.N.; Khan, K.; Nazir, K.; Ali, M.; Javed, M.F.; Aslam, F.; Musarat, M.A.; Vatin, N.I. Modeling of Mechanical Properties of Silica Fume-Based Green Concrete Using Machine Learning Techniques. Polymers 2022, 14, 30. [Google Scholar] [CrossRef]
- Nafees, A.; Javed, M.F.; Khan, S.; Nazir, K.; Farooq, F.; Aslam, F.; Musarat, M.A.; Vatin, N.I. Predictive Modeling of Mechanical Properties of Silica Fume-Based Green Concrete Using Artificial Intelligence Approaches: MLPNN, ANFIS, and GEP. Materials 2021, 14, 7531. [Google Scholar] [CrossRef]
- Ni, H.G.; Wang, J.Z. Prediction of Compressive Strength of Concrete by Neural Networks. Cem. Concr. Res. 2000, 30, 1245–1250. [Google Scholar] [CrossRef]
- Sobhani, J.; Najimi, M.; Pourkhorshidi, A.R.; Parhizkar, T. Prediction of the Compressive Strength of No-Slump Concrete: A Comparative Study of Regression, Neural Network and ANFIS Models. Constr. Build. Mater. 2010, 24, 709–718. [Google Scholar] [CrossRef]
- Huang, J.; Zhang, J.; Gao, Y. Evaluating the Clogging Behavior of Pervious Concrete (PC) Using the Machine Learning Techniques. CMES-Comput. Model. Eng. Sci. 2022, 130, 805–821. [Google Scholar] [CrossRef]
- Huang, J.; Zhou, M.; Yuan, H.; Sabri, M.M.S.; Li, X. Prediction of the Compressive Strength for Cement-Based Materials with Metakaolin Based on the Hybrid Machine Learning Method. Materials 2022, 15, 3500. [Google Scholar] [CrossRef]
- Awoyera, P.O.; Kirgiz, M.S.; Viloria, A.; Ovallos-Gazabon, D. Estimating Strength Properties of Geopolymer Self-Compacting Concrete Using Machine Learning Techniques. J. Mater. Res. Technol. 2020, 9, 9016–9028. [Google Scholar] [CrossRef]
- Hodhod, O.A.; Ahmed, H.I. Modeling the Corrosion Initiation Time of Slag Concrete Using the Artificial Neural Network. HBRC J. 2014, 10, 231–234. [Google Scholar] [CrossRef]
- Bal, L.; Buyle-Bodin, F. Artificial Neural Network for Predicting Drying Shrinkage of Concrete. Constr. Build. Mater. 2013, 38, 248–254. [Google Scholar] [CrossRef]
- Ben Chaabene, W.; Flah, M.; Nehdi, M.L. Machine Learning Prediction of Mechanical Properties of Concrete: Critical Review. Constr. Build. Mater. 2020, 260, 119889. [Google Scholar] [CrossRef]
- Huang, J.; Sabri, M.M.S.; Ulrikh, D.V.; Ahmad, M.; Alsaffar, K.A.M. Predicting the Compressive Strength of the Cement-Fly Ash–Slag Ternary Concrete Using the Firefly Algorithm (Fa) and Random Forest (Rf) Hybrid Machine-Learning Method. Materials 2022, 15, 4193. [Google Scholar] [CrossRef]
- Sonebi, M.; Cevik, A.; Grünewald, S.; Walraven, J. Modelling the Fresh Properties of Self-Compacting Concrete Using Support Vector Machine Approach. Constr. Build. Mater. 2016, 106, 55–64. [Google Scholar] [CrossRef]
- Kalman Šipoš, T.; Miličević, I.; Siddique, R. Model for Mix Design of Brick Aggregate Concrete Based on Neural Network Modelling. Constr. Build. Mater. 2017, 148, 757–769. [Google Scholar] [CrossRef]
- Chou, J.S.; Tsai, C.F.; Pham, A.D.; Lu, Y.H. Machine Learning in Concrete Strength Simulations: Multi-Nation Data Analytics. Constr. Build. Mater. 2014, 73, 771–780. [Google Scholar] [CrossRef]
- Huang, J.; Leandri, P.; Cuciniello, G.; Losa, M. Mix Design and Laboratory Characterisation of Rubberised Mixture Used as Damping Layer in Pavements. Int. J. Pavement Eng. 2022, 23, 2746–2760. [Google Scholar] [CrossRef]
- Huang, J.; Duan, T.; Sun, Y.; Wang, L.; Lei, Y. Finite Element (Fe) Modeling of Indirect Tension to Cylindrical (It-Cy) Specimen Test for Damping Asphalt Mixtures (Dams). Adv. Civ. Eng. 2020, 2020, 6694180. [Google Scholar] [CrossRef]
- Behnood, A.; Behnood, V.; Modiri Gharehveran, M.; Alyamac, K.E. Prediction of the Compressive Strength of Normal and High-Performance Concretes Using M5P Model Tree Algorithm. Constr. Build. Mater. 2017, 142, 199–207. [Google Scholar] [CrossRef]
- Awoyera, P.O. Nonlinear Finite Element Analysis of Steel Fibre-Reinforced Concrete Beam under Static Loading. J. Eng. Sci. Technol. 2016, 11, 1669–1677. [Google Scholar]
- Nafees, A.; Khan, S.; Javed, M.F.; Alrowais, R.; Mohamed, A.M.; Mohamed, A.; Vatin, N.I. Forecasting the Mechanical Properties of Plastic Concrete Employing Experimental Data Using Machine Learning Algorithms: DT, MLPNN, SVM, and RF. Polymers 2022, 14, 1583. [Google Scholar] [CrossRef] [PubMed]
- Ilyas, I.; Zafar, A.; Afzal, M.T.; Javed, M.F.; Alrowais, R.; Althoey, F.; Mohamed, A.M.; Mohamed, A.; Vatin, N.I. Advanced Machine Learning Modeling Approach for Prediction of Compressive Strength of FRP Confined Concrete Using Multiphysics Genetic Expression Programming. Polymers 2022, 14, 1789. [Google Scholar] [CrossRef]
- Cavaleri, L.; Barkhordari, M.S.; Repapis, C.C.; Armaghani, D.J.; Ulrikh, D.V.; Asteris, P.G. Convolution-Based Ensemble Learning Algorithms to Estimate the Bond Strength of the Corroded Reinforced Concrete. Constr. Build. Mater. 2022, 359, 129504. [Google Scholar] [CrossRef]
- Barkhordari, M.S.; Armaghani, D.J.; Sabri, M.M.S.; Ulrikh, D.V.; Ahmad, M. The Efficiency of Hybrid Intelligent Models in Predicting Fiber-Reinforced Polymer Concrete Interfacial-Bond Strength. Materials 2022, 15, 3019. [Google Scholar] [CrossRef] [PubMed]
- Asteris, P.G.; Lourenço, P.B.; Roussis, P.C.; Adami, C.E.; Armaghani, D.J.; Cavaleri, L.; Chalioris, C.E.; Hajihassani, M.; Lemonis, M.E.; Mohammed, A.S. Revealing the Nature of Metakaolin-Based Concrete Materials Using Artificial Intelligence Techniques. Constr. Build. Mater. 2022, 322, 126500. [Google Scholar] [CrossRef]
- Barkhordari, M.S.; Armaghani, D.J.; Mohammed, A.S.; Ulrikh, D.V. Data-Driven Compressive Strength Prediction of Fly Ash Concrete Using Ensemble Learner Algorithms. Buildings 2022, 12, 132. [Google Scholar] [CrossRef]
- Liao, J.; Asteris, P.G.; Cavaleri, L.; Mohammed, A.S.; Lemonis, M.E.; Tsoukalas, M.Z.; Skentou, A.D.; Maraveas, C.; Koopialipoor, M.; Armaghani, D.J. Novel Fuzzy-Based Optimization Approaches for the Prediction of Ultimate Axial Load of Circular Concrete-Filled Steel Tubes. Buildings 2021, 11, 629. [Google Scholar] [CrossRef]
- Shahmansouri, A.A.; Akbarzadeh Bengar, H.; Ghanbari, S. Compressive Strength Prediction of Eco-Efficient GGBS-Based Geopolymer Concrete Using GEP Method. J. Build. Eng. 2020, 31, 101326. [Google Scholar] [CrossRef]
- Apostolopoulou, M.; Asteris, P.G.; Armaghani, D.J.; Douvika, M.G.; Lourenço, P.B.; Cavaleri, L.; Bakolas, A.; Moropoulou, A. Mapping and Holistic Design of Natural Hydraulic Lime Mortars. Cem. Concr. Res. 2020, 136, 106167. [Google Scholar] [CrossRef]
- Asteris, P.G.; Armaghani, D.J.; Hatzigeorgiou, G.D.; Karayannis, C.G.; Pilakoutas, K. Predicting the Shear Strength of Reinforced Concrete Beams Using Artificial Neural Networks. Comput. Concr. 2019, 24, 469–488. [Google Scholar] [CrossRef]
- Koopialipoor, M.; Asteris, P.G.; Salih Mohammed, A.; Alexakis, D.E.; Mamou, A.; Armaghani, D.J. Introducing Stacking Machine Learning Approaches for the Prediction of Rock Deformation. Transp. Geotech. 2022, 34, 100756. [Google Scholar] [CrossRef]
- Armaghani, D.J.; Asteris, P.G. A Comparative Study of ANN and ANFIS Models for the Prediction of Cement-Based Mortar Materials Compressive Strength. Neural Comput. Appl. 2021, 33, 4501–4532. [Google Scholar] [CrossRef]
- Öztaş, A.; Pala, M.; Özbay, E.; Kanca, E.; Çaǧlar, N.; Bhatti, M.A. Predicting the Compressive Strength and Slump of High Strength Concrete Using Neural Network. Constr. Build. Mater. 2006, 20, 769–775. [Google Scholar] [CrossRef]
- Saridemir, M. Predicting the Compressive Strength of Mortars Containing Metakaolin by Artificial Neural Networks and Fuzzy Logic. Adv. Eng. Softw. 2009, 40, 920–927. [Google Scholar] [CrossRef]
- Shafabakhsh, G.H.; Ani, O.J.; Talebsafa, M. Artificial Neural Network Modeling (ANN) for Predicting Rutting Performance of Nano-Modified Hot-Mix Asphalt Mixtures Containing Steel Slag Aggregates. Constr. Build. Mater. 2015, 85, 136–143. [Google Scholar] [CrossRef]
- Kiani, B.; Gandomi, A.H.; Sajedi, S.; Liang, R.Y. New Formulation of Compressive Strength of Preformed-Foam Cellular Concrete: An Evolutionary Approach. J. Mater. Civ. Eng. 2016, 28, 04016092. [Google Scholar] [CrossRef]
- Gholampour, A.; Mansouri, I.; Kisi, O.; Ozbakkaloglu, T. Evaluation of Mechanical Properties of Concretes Containing Coarse Recycled Concrete Aggregates Using Multivariate Adaptive Regression Splines (MARS), M5 Model Tree (M5Tree), and Least Squares Support Vector Regression (LSSVR) Models. Neural Comput. Appl. 2020, 32, 295–308. [Google Scholar] [CrossRef]
- Young, B.A.; Hall, A.; Pilon, L.; Gupta, P.; Sant, G. Can the Compressive Strength of Concrete Be Estimated from Knowledge of the Mixture Proportions? New Insights from Statistical Analysis and Machine Learning Methods. Cem. Concr. Res. 2019, 115, 379–388. [Google Scholar] [CrossRef]
- Duan, Z.H.; Kou, S.C.; Poon, C.S. Prediction of Compressive Strength of Recycled Aggregate Concrete Using Artificial Neural Networks. Constr. Build. Mater. 2013, 40, 1200–1206. [Google Scholar] [CrossRef]
- Veloso de Melo, V.; Banzhaf, W. Improving the Prediction of Material Properties of Concrete Using Kaizen Programming with Simulated Annealing. Neurocomputing 2017, 246, 25–44. [Google Scholar] [CrossRef]
- Yeh, I.C.; Lien, L.C. Knowledge Discovery of Concrete Material Using Genetic Operation Trees. Expert Syst. Appl. 2009, 36, 5807–5812. [Google Scholar] [CrossRef]
- Tran, V.T.; Le, M.H.; Vo, M.T.; Le, Q.T.; Hoang, V.H.; Tran, N.-T.; Nguyen, V.-T.; Nguyen, T.-A.-T.; Nguyen, H.N.; Nguyen, V.T.T. Optimization Design for Die-Sinking EDM Process Parameters Employing Effective Intelligent Method. Cogent Eng. 2023, 10, 2264060. [Google Scholar] [CrossRef]
- Huynh, N.-T.; Nguyen, T.V.T.; Tam, N.T.; Nguyen, Q.-M. Optimizing Magnification Ratio for the Flexible Hinge Displacement Amplifier Mechanism Design. In Proceedings of the 2nd Annual International Conference on Material, Machines and Methods for Sustainable Development (MMMS2020), Nha Trang, Vietnam, 12–15 November 2020; pp. 769–778. [Google Scholar]
- Liaw, A.; Wiener, M. Classification and Regression by RandomForest. R News 2002, 2, 18–22. [Google Scholar]
- Huang, J.; Sun, Y. Viscoelastic Analysis of the Damping Asphalt Mixtures (DAMs) Made with a High Content of Asphalt Rubber (AR). Adv. Civ. Eng. 2020, 2020, 8826926. [Google Scholar] [CrossRef]
- Huang, J.; Duan, T.; Lei, Y.; Hasanipanah, M. Finite Element Modeling for the Antivibration Pavement Used to Improve the Slope Stability of the Open-Pit Mine. Shock Vib. 2020, 2020, 6650780. [Google Scholar] [CrossRef]
- Huang, J.; Zhang, J.; Li, X.; Qiao, Y.; Zhang, R.; Kumar, G.S. Investigating the Effects of Ensemble and Weight Optimization Approaches on Neural Networks’ Performance to Estimate the Dynamic Modulus of Asphalt Concrete. Road Mater. Pavement Des. 2022, 24, 1939–1959. [Google Scholar] [CrossRef]
- Schapire, R.E. Explaining Adaboost. In Empirical Inference: Festschrift in Honor of Vladimir N. Vapnik; Springer: Berlin/Heidelberg, Germany, 2013; pp. 37–52. [Google Scholar]
- Yan, D.; Zhou, Q.; Wang, J.; Zhang, N. Bayesian Regularisation Neural Network Based on Artificial Intelligence Optimisation. Int. J. Prod. Res. 2017, 55, 2266–2287. [Google Scholar] [CrossRef]
- Ampomah, E.K.; Qin, Z.; Nyame, G. Evaluation of Tree-Based Ensemble Machine Learning Models in Predicting Stock Price Direction of Movement. Information 2020, 11, 332. [Google Scholar] [CrossRef]
- Huang, J.; Losa, M.; Leandri, P.; Kumar, S.G.; Zhang, J.; Sun, Y. Potential Anti-Vibration Pavements with Damping Layer: Finite Element (FE) Modeling, Validation, and Parametrical Studies. Constr. Build. Mater. 2021, 281, 122550. [Google Scholar] [CrossRef]
- Huang, J.; Li, X.; Zhang, J.; Sun, Y.; Ren, J. Determining the Rayleigh Damping Parameters of Flexible Pavements for Finite Element Modeling. J. Vib. Control 2022, 28, 3181–3194. [Google Scholar] [CrossRef]
- Dorogush, A.V.; Ershov, V.; Gulin, A. CatBoost: Gradient Boosting with Categorical Features Support. arXiv 2018, arXiv:1810.11363. [Google Scholar]
- Zhu, F.; Wu, X.; Zhou, M.; Sabri, M.M.S.; Huang, J. Intelligent Design of Building Materials: Development of an Ai-Based Method for Cement-Slag Concrete Design. Materials 2022, 15, 3833. [Google Scholar] [CrossRef]
- Huang, J.; Zhou, M.; Yuan, H.; Sabri, M.M.S.; Li, X. Towards Sustainable Construction Materials: A Comparative Study of Prediction Models for Green Concrete with Metakaolin. Buildings 2022, 12, 772. [Google Scholar] [CrossRef]
- Patel, J.; Shah, S.; Thakkar, P.; Kotecha, K. Predicting Stock and Stock Price Index Movement Using Trend Deterministic Data Preparation and Machine Learning Techniques. Expert Syst. Appl. 2015, 42, 259–268. [Google Scholar] [CrossRef]
- Huang, J.; Sun, Y. Effect of Modifiers on the Rutting, Moisture-Induced Damage, and Workability Properties of Hot Mix Asphalt Mixtures. Appl. Sci. 2020, 10, 7145. [Google Scholar] [CrossRef]
- Huang, J.; Suhatril, M.; Baharom, S.; Alaskar, A.; Assilzadeh, H. Influence of Porosity and Cement Grade on Concrete Mechanical Properties. Adv. Concr. Constr. 2020, 10, 393–402. [Google Scholar]
- Huang, J.; Li, X.; Kumar, G.S.; Deng, Y.; Gong, M.; Dong, N. Rheological Properties of Bituminous Binder Modified with Recycled Waste Toner. J. Clean. Prod. 2021, 317, 128415. [Google Scholar] [CrossRef]
- Huang, J.; Xue, J. Optimization of Svr Functions for Flyrock Evaluation in Mine Blasting Operations. Environ. Earth Sci. 2022, 81, 434. [Google Scholar] [CrossRef]
- Mirjalili, S.; Mirjalili, S.M.; Lewis, A. Grey Wolf Optimizer. Adv. Eng. Softw. 2014, 69, 46–61. [Google Scholar] [CrossRef]
- Hosseini, S.; Mousavi, A.; Monjezi, M.; Khandelwal, M. Mine-to-Crusher Policy: Planning of Mine Blasting Patterns for Environmentally Friendly and Optimum Fragmentation Using Monte Carlo Simulation-Based Multi-Objective Grey Wolf Optimization Approach. Resour. Policy 2022, 79, 103087. [Google Scholar] [CrossRef]
- Chantar, H.; Mafarja, M.; Alsawalqah, H.; Heidari, A.A.; Aljarah, I.; Faris, H. Feature Selection Using Binary Grey Wolf Optimizer with Elite-Based Crossover for Arabic Text Classification. Neural Comput. Appl. 2020, 32, 12201–12220. [Google Scholar] [CrossRef]
- Yang, B.; Zhang, X.; Yu, T.; Shu, H.; Fang, Z. Grouped Grey Wolf Optimizer for Maximum Power Point Tracking of Doubly-Fed Induction Generator Based Wind Turbine. Energy Convers. Manag. 2017, 133, 427–443. [Google Scholar] [CrossRef]
- Anjum, M.; Khan, K.; Ahmad, W.; Ahmad, A.; Amin, M.N.; Nafees, A. Application of Ensemble Machine Learning Methods to Estimate the Compressive Strength of Fiber-Reinforced Nano-Silica Modified Concrete. Polymers 2022, 14, 3906. [Google Scholar] [CrossRef]
- Ashrafian, A.; Amiri, M.J.T.; Rezaie-Balf, M.; Ozbakkaloglu, T.; Lotfi-Omran, O. Prediction of Compressive Strength and Ultrasonic Pulse Velocity of Fiber Reinforced Concrete Incorporating Nano Silica Using Heuristic Regression Methods. Constr. Build. Mater. 2018, 190, 479–494. [Google Scholar] [CrossRef]
- Salemi, N.; Behfarnia, K. Effect of Nano-Particles on Durability of Fiber-Reinforced Concrete Pavement. Constr. Build. Mater. 2013, 48, 934–941. [Google Scholar] [CrossRef]
- Fallah, S.; Nematzadeh, M. Mechanical Properties and Durability of High-Strength Concrete Containing Macro-Polymeric and Polypropylene Fibers with Nano-Silica and Silica Fume. Constr. Build. Mater. 2017, 132, 170–187. [Google Scholar] [CrossRef]
- Sadrmomtazi, A.; Fasihi, A. Influence of Polypropylene Fibers on the Performance of Nano-SiO2-Incorporated Mortar. 2010. Available online: https://journals.shirazu.ac.ir/article_690.html (accessed on 28 December 2023).
- Wang, X.; Hosseini, S.; Jahed Armaghani, D.; Tonnizam Mohamad, E. Data-Driven Optimized Artificial Neural Network Technique for Prediction of Flyrock Induced by Boulder Blasting. Mathematics 2023, 11, 2358. [Google Scholar] [CrossRef]
- Bakhtavar, E.; Hosseini, S.; Hewage, K.; Sadiq, R. Air Pollution Risk Assessment Using a Hybrid Fuzzy Intelligent Probability-Based Approach: Mine Blasting Dust Impacts. Nat. Resour. Res. 2021, 30, 2607–2627. [Google Scholar] [CrossRef]
- Hosseini, S.; Mousavi, A.; Monjezi, M. Prediction of Blast-Induced Dust Emissions in Surface Mines Using Integration of Dimensional Analysis and Multivariate Regression Analysis. Arab. J. Geosci. 2022, 15, 163. [Google Scholar] [CrossRef]
- Bakhtavar, E.; Hosseini, S.; Hewage, K.; Sadiq, R. Green Blasting Policy: Simultaneous Forecast of Vertical and Horizontal Distribution of Dust Emissions Using Artificial Causality-Weighted Neural Network. J. Clean. Prod. 2021, 283, 124562. [Google Scholar] [CrossRef]
- Hosseini, S.; Monjezi, M.; Bakhtavar, E.; Mousavi, A. Prediction of Dust Emission Due to Open Pit Mine Blasting Using a Hybrid Artificial Neural Network. Nat. Resour. Res. 2021, 30, 4773–4788. [Google Scholar] [CrossRef]
- Hosseini, S.; Monjezi, M.; Bakhtavar, E. Minimization of Blast-Induced Dust Emission Using Gene-Expression Programming and Grasshopper Optimization Algorithm: A Smart Mining Solution Based on Blasting Plan Optimization. Clean. Technol. Environ. Policy 2022, 24, 2313–2328. [Google Scholar] [CrossRef]
- Hosseini, S.; Poormirzaee, R.; Hajihassani, M.; Kalatehjari, R. An ANN-Fuzzy Cognitive Map-Based Z-Number Theory to Predict Flyrock Induced by Blasting in Open-Pit Mines. Rock. Mech. Rock. Eng. 2022, 55, 4373–4390. [Google Scholar] [CrossRef]
- Huang, J.; Zhou, M.; Zhang, J.; Ren, J.; Vatin, N.I.; Sabri, M.M.S. Development of a New Stacking Model to Evaluate the Strength Parameters of Concrete Samples in Laboratory. Iran. J. Sci. Technol. Trans. Civ. Eng. 2022, 46, 4355–4370. [Google Scholar] [CrossRef]
- Huang, J.; Zhou, M.; Zhang, J.; Ren, J.; Vatin, N.I.; Sabri, M.M.S. The Use of GA and PSO in Evaluating the Shear Strength of Steel Fiber Reinforced Concrete Beams. KSCE J. Civ. Eng. 2022, 26, 3918–3931. [Google Scholar] [CrossRef]
- Zhang, R.; Chen, H.; Guo, H.; Zhou, M.; Jiandong, H. Development of a Prior Model to Predict the Cracking Performance of Asphalt Mixture in General for Asphalt Material Selection and Mix Design. Int. J. Pavement Eng. 2023, 24, 2251080. [Google Scholar] [CrossRef]
- Zhao, J.; Hosseini, S.; Chen, Q.; Armaghani, D.J. Super Learner Ensemble Model: A Novel Approach for Predicting Monthly Copper Price in Future. Resour. Policy 2023, 85, 103903. [Google Scholar] [CrossRef]
- Hosseini, S.; Khatti, J.; Taiwo, B.O.; Fissha, Y.; Grover, K.S.; Ikeda, H.; Pushkarna, M.; Berhanu, M.; Ali, M. Assessment of the Ground Vibration during Blasting in Mining Projects Using Different Computational Approaches. Sci. Rep. 2023, 13, 18582. [Google Scholar] [CrossRef]
- Hosseini, S.; Poormirzaee, R.; Gilani, S.-O.; Jiskani, I.M. A Reliability-Based Rock Engineering System for Clean Blasting: Risk Analysis and Dust Emissions Forecasting. Clean Technol. Environ. Policy 2023, 25, 1903–1920. [Google Scholar] [CrossRef]
- Hosseini, S.; Pourmirzaee, R.; Armaghani, D.J.; Sabri Sabri, M.M. Prediction of Ground Vibration Due to Mine Blasting in a Surface Lead–Zinc Mine Using Machine Learning Ensemble Techniques. Sci. Rep. 2023, 13, 6591. [Google Scholar] [CrossRef]
- Lawal, A.I.; Hosseini, S.; Kim, M.; Ogunsola, N.O.; Kwon, S. Prediction of Factor of Safety of Slopes Using Stochastically Modified ANN and Classical Methods: A Rigorous Statistical Model Selection Approach. Nat. Hazards 2023, 1–22. [Google Scholar] [CrossRef]
- Wang, Q.; Qi, J.; Hosseini, S.; Rasekh, H.; Huang, J. ICA-LightGBM Algorithm for Predicting Compressive Strength of Geo-Polymer Concrete. Buildings 2023, 13, 2278. [Google Scholar] [CrossRef]
- Hosseini, S.; Poormirzaee, R.; Hajihassani, M. Application of Reliability-Based Back-Propagation Causality-Weighted Neural Networks to Estimate Air-Overpressure Due to Mine Blasting. Eng. Appl. Artif. Intell. 2022, 115, 105281. [Google Scholar] [CrossRef]
- Hosseini, S.; Pourmirzaee, R. Green Policy for Managing Blasting Induced Dust Dispersion in Open-Pit Mines Using Probability-Based Deep Learning Algorithm. Expert. Syst. Appl. 2023, 240, 122469. [Google Scholar] [CrossRef]
- Hosseini, S.; Javanshir, S.; Sabeti, H.; Tahmasebizadeh, P. Mathematical-Based Gene Expression Programming (GEP): A Novel Model to Predict Zinc Separation from a Bench-Scale Bioleaching Process. J. Sustain. Metall. 2023, 9, 1601–1619. [Google Scholar] [CrossRef]
- Bolón-Canedo, V.; Remeseiro, B. Feature Selection in Image Analysis: A Survey. Artif. Intell. Rev. 2020, 53, 2905–2931. [Google Scholar] [CrossRef]
- Kabir, H.; Garg, N. Machine Learning Enabled Orthogonal Camera Goniometry for Accurate and Robust Contact Angle Measurements. Sci. Rep. 2023, 13, 1497. [Google Scholar] [CrossRef]
- Hosseini, S.; Poormirzaee, R.; Hajihassani, M. An Uncertainty Hybrid Model for Risk Assessment and Prediction of Blast-Induced Rock Mass Fragmentation. Int. J. Rock Mech. Min. Sci. 2022, 160, 105250. [Google Scholar] [CrossRef]


| Variable | Unit | Notation | Min | Ave | Max | StD | Skewness | Kurtosis | |
|---|---|---|---|---|---|---|---|---|---|
| Input | Fiber volume | % | FV | 0 | 0.198 | 0.9 | 0.185 | 1.974 | 5.204 |
| CA/FA | - | CF | 0.874 | 0.906 | 1.135 | 0.060 | 2.382 | 6.035 | |
| w/b | - | w/b | 0.31 | 0.408 | 0.48 | 0.041 | 0.509 | 0.236 | |
| Nano-silica | kg/m3 | NS | 0 | 21.214 | 49.6 | 17.303 | 0.317 | −1.084 | |
| SP/B | - | SP/B | 0.005 | 0.017 | 0.025 | 0.006 | −1.176 | −0.396 | |
| Age | day | Age | 7 | 41.651 | 120 | 38.252 | 0.785 | −0.930 | |
| Output | Compressive strength of fiber-reinforced nano-silica concrete | MPa | CSFrRNSC | 19.1 | 66.483 | 91.2 | 17.829 | −0.838 | −0.243 |
| Training Set | ||||||
| Parameter | Min | Ave | Max | StD | Kurtosis | Skewness |
| FV | 0 | 0.2 | 0.5 | 0.129 | 0.566 | 0.723 |
| CF | 0.874 | 0.882 | 0.973 | 0.026 | 7.457 | 3.051 |
| w/b | 0.39 | 0.398 | 0.48 | 0.025 | 7.323 | 3.035 |
| NS | 0 | 23.710 | 49.6 | 18.282 | −1.318 | 0.110 |
| SP/B | 0.005 | 0.019 | 0.02 | 0.004 | 7.323 | −3.035 |
| Age | 7 | 38.756 | 90 | 35.202 | −1.349 | 0.663 |
| CSFrRNSC | 42.1 | 74.114 | 91.2 | 11.111 | 0.129 | −0.838 |
| Testing Set | ||||||
| Parameter | Min | Ave | Max | StD | Kurtosis | Skewness |
| FV | 0 | 0.9 | 0.193 | 0.295 | 2.140 | 1.876 |
| CF | 0.905 | 1.135 | 0.977 | 0.074 | 0.778 | 1.334 |
| w/b | 0.31 | 0.48 | 0.439 | 0.061 | 0.718 | −1.452 |
| NS | 0 | 31.5 | 13.784 | 11.209 | −1.256 | 0.128 |
| SP/B | 0.005 | 0.025 | 0.010 | 0.008 | −0.645 | 1.009 |
| Age | 7 | 120 | 50.273 | 45.528 | −1.169 | 0.755 |
| CSFrRNSC | 19.1 | 69.1 | 43.764 | 14.404 | −1.148 | 0.232 |
| Technique | Optimizer | Hyperparameter | Optimum Values |
|---|---|---|---|
| LightGBM | GWO | learning_rate, n_estimators, max_depth, and reg_alpha | learning_rate = 0.005 n_estimators = 170 max_depth = 9 reg_alpha = 0.45 |
| XGBoost | GWO | n_estimators, learning_rate, gamma, max_depth, min_child_weight, and reg_alpha | n_estimators = 100 learning_rate = 0.25 gamma = 0.6 max_depth = 2 min_child_weight = 5 reg_alpha = 1 |
| CatBoost | GWO | learning_rate and n_estimators | learning_rate = 0.003 n_estimators = 300 |
| AdaBoost | GWO | learning_rate and n_estimators | learning_rate = 0.001 n_estimators = 500 |
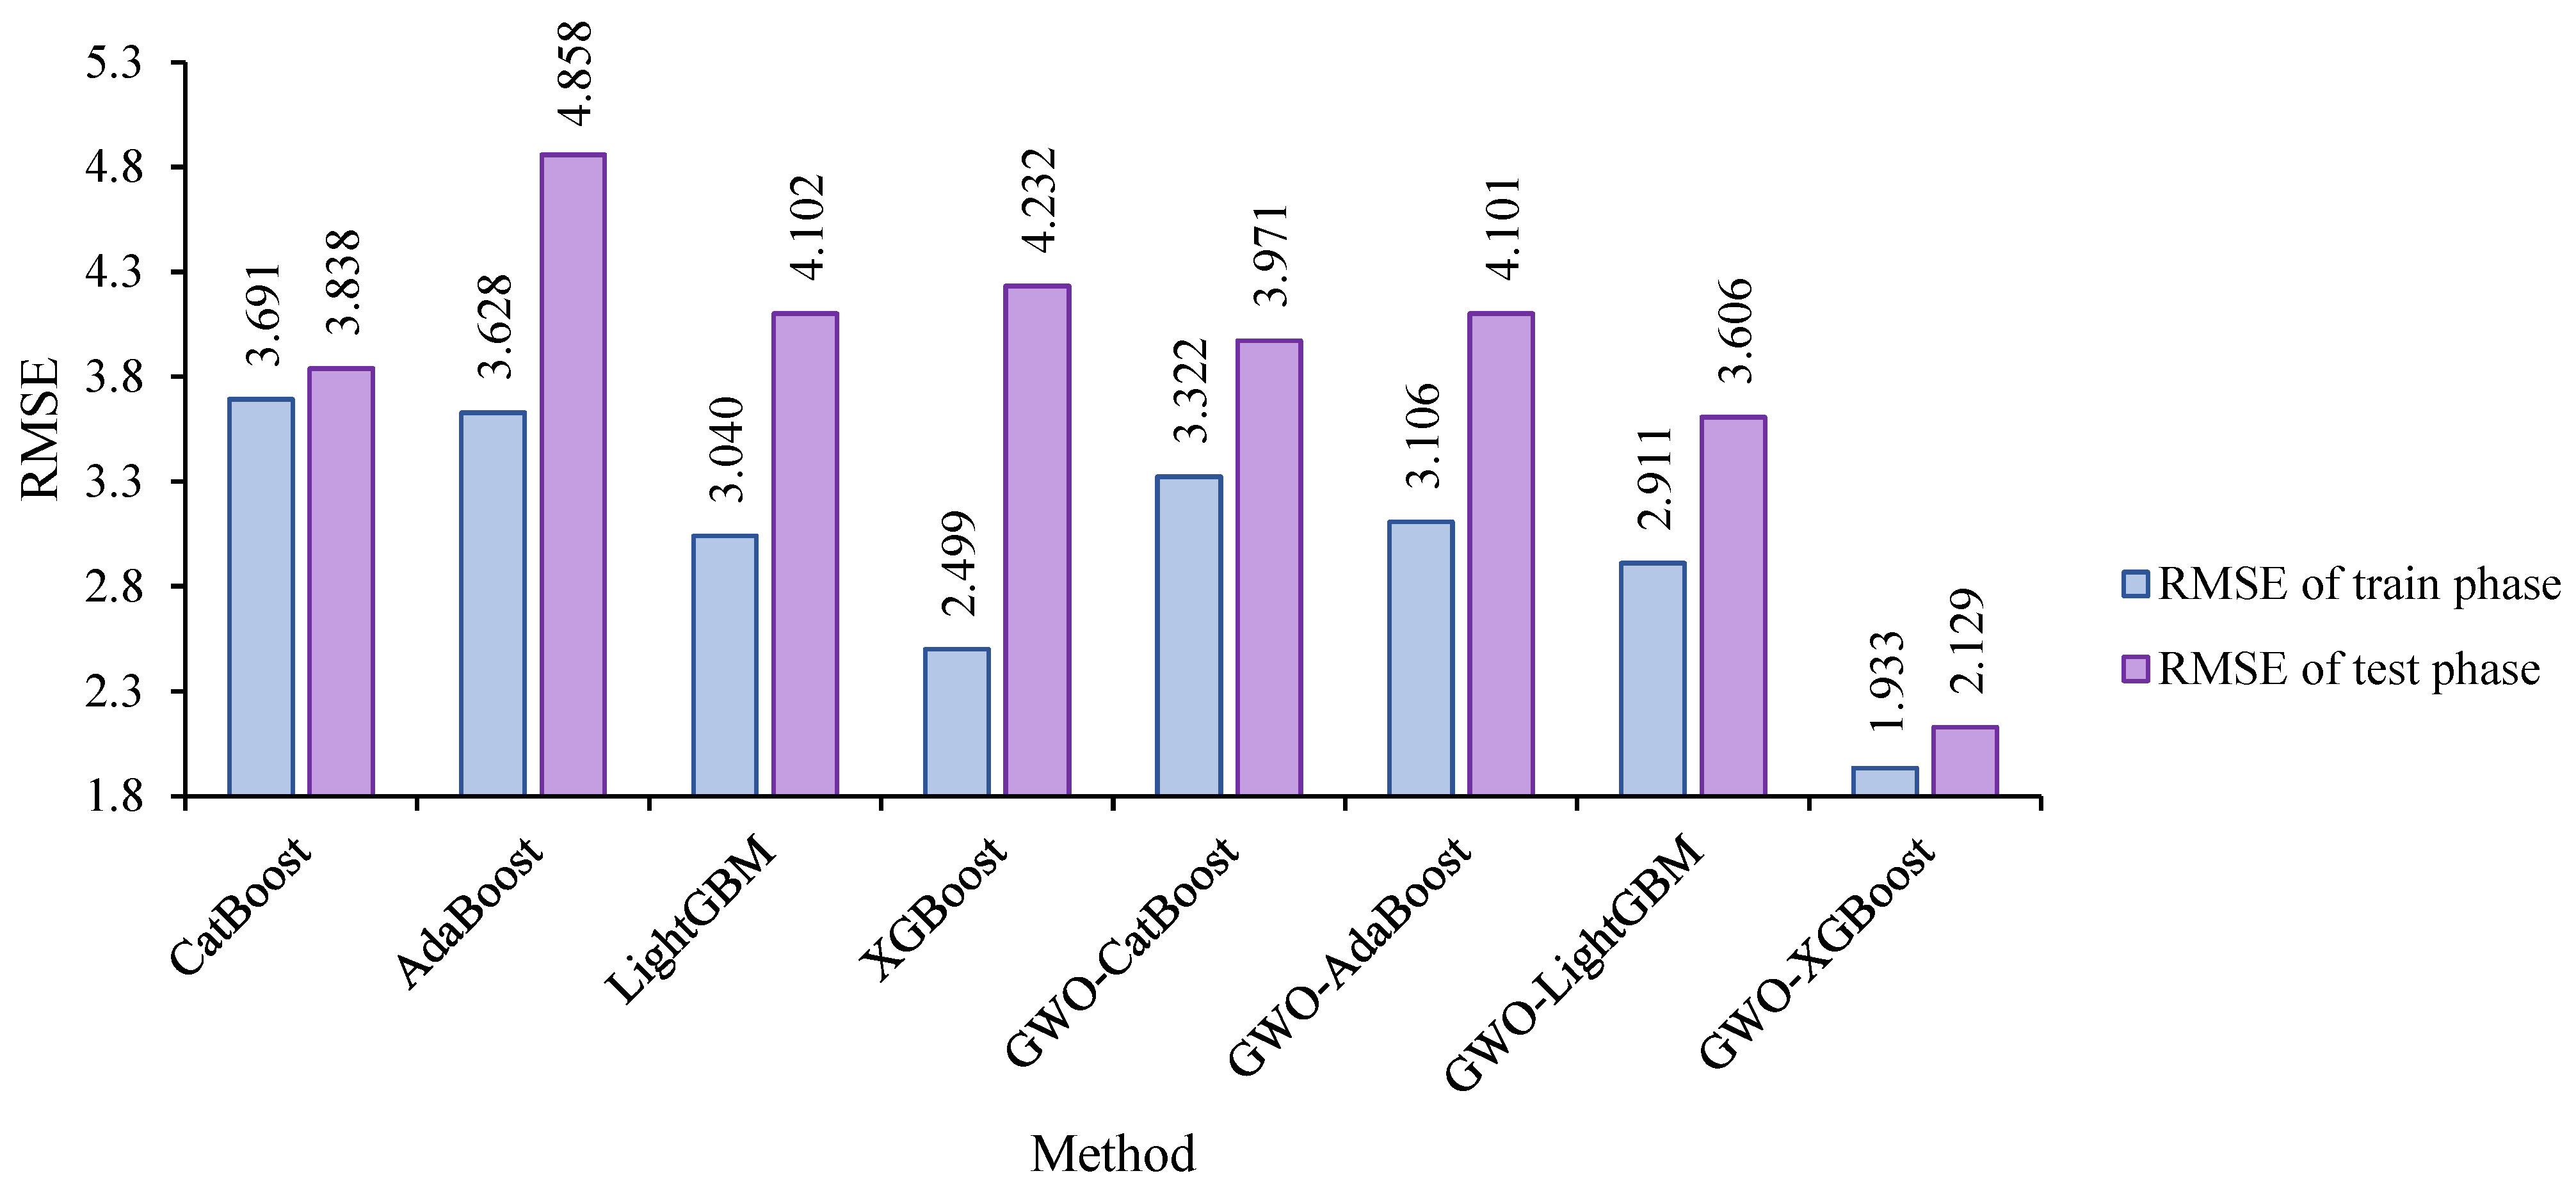
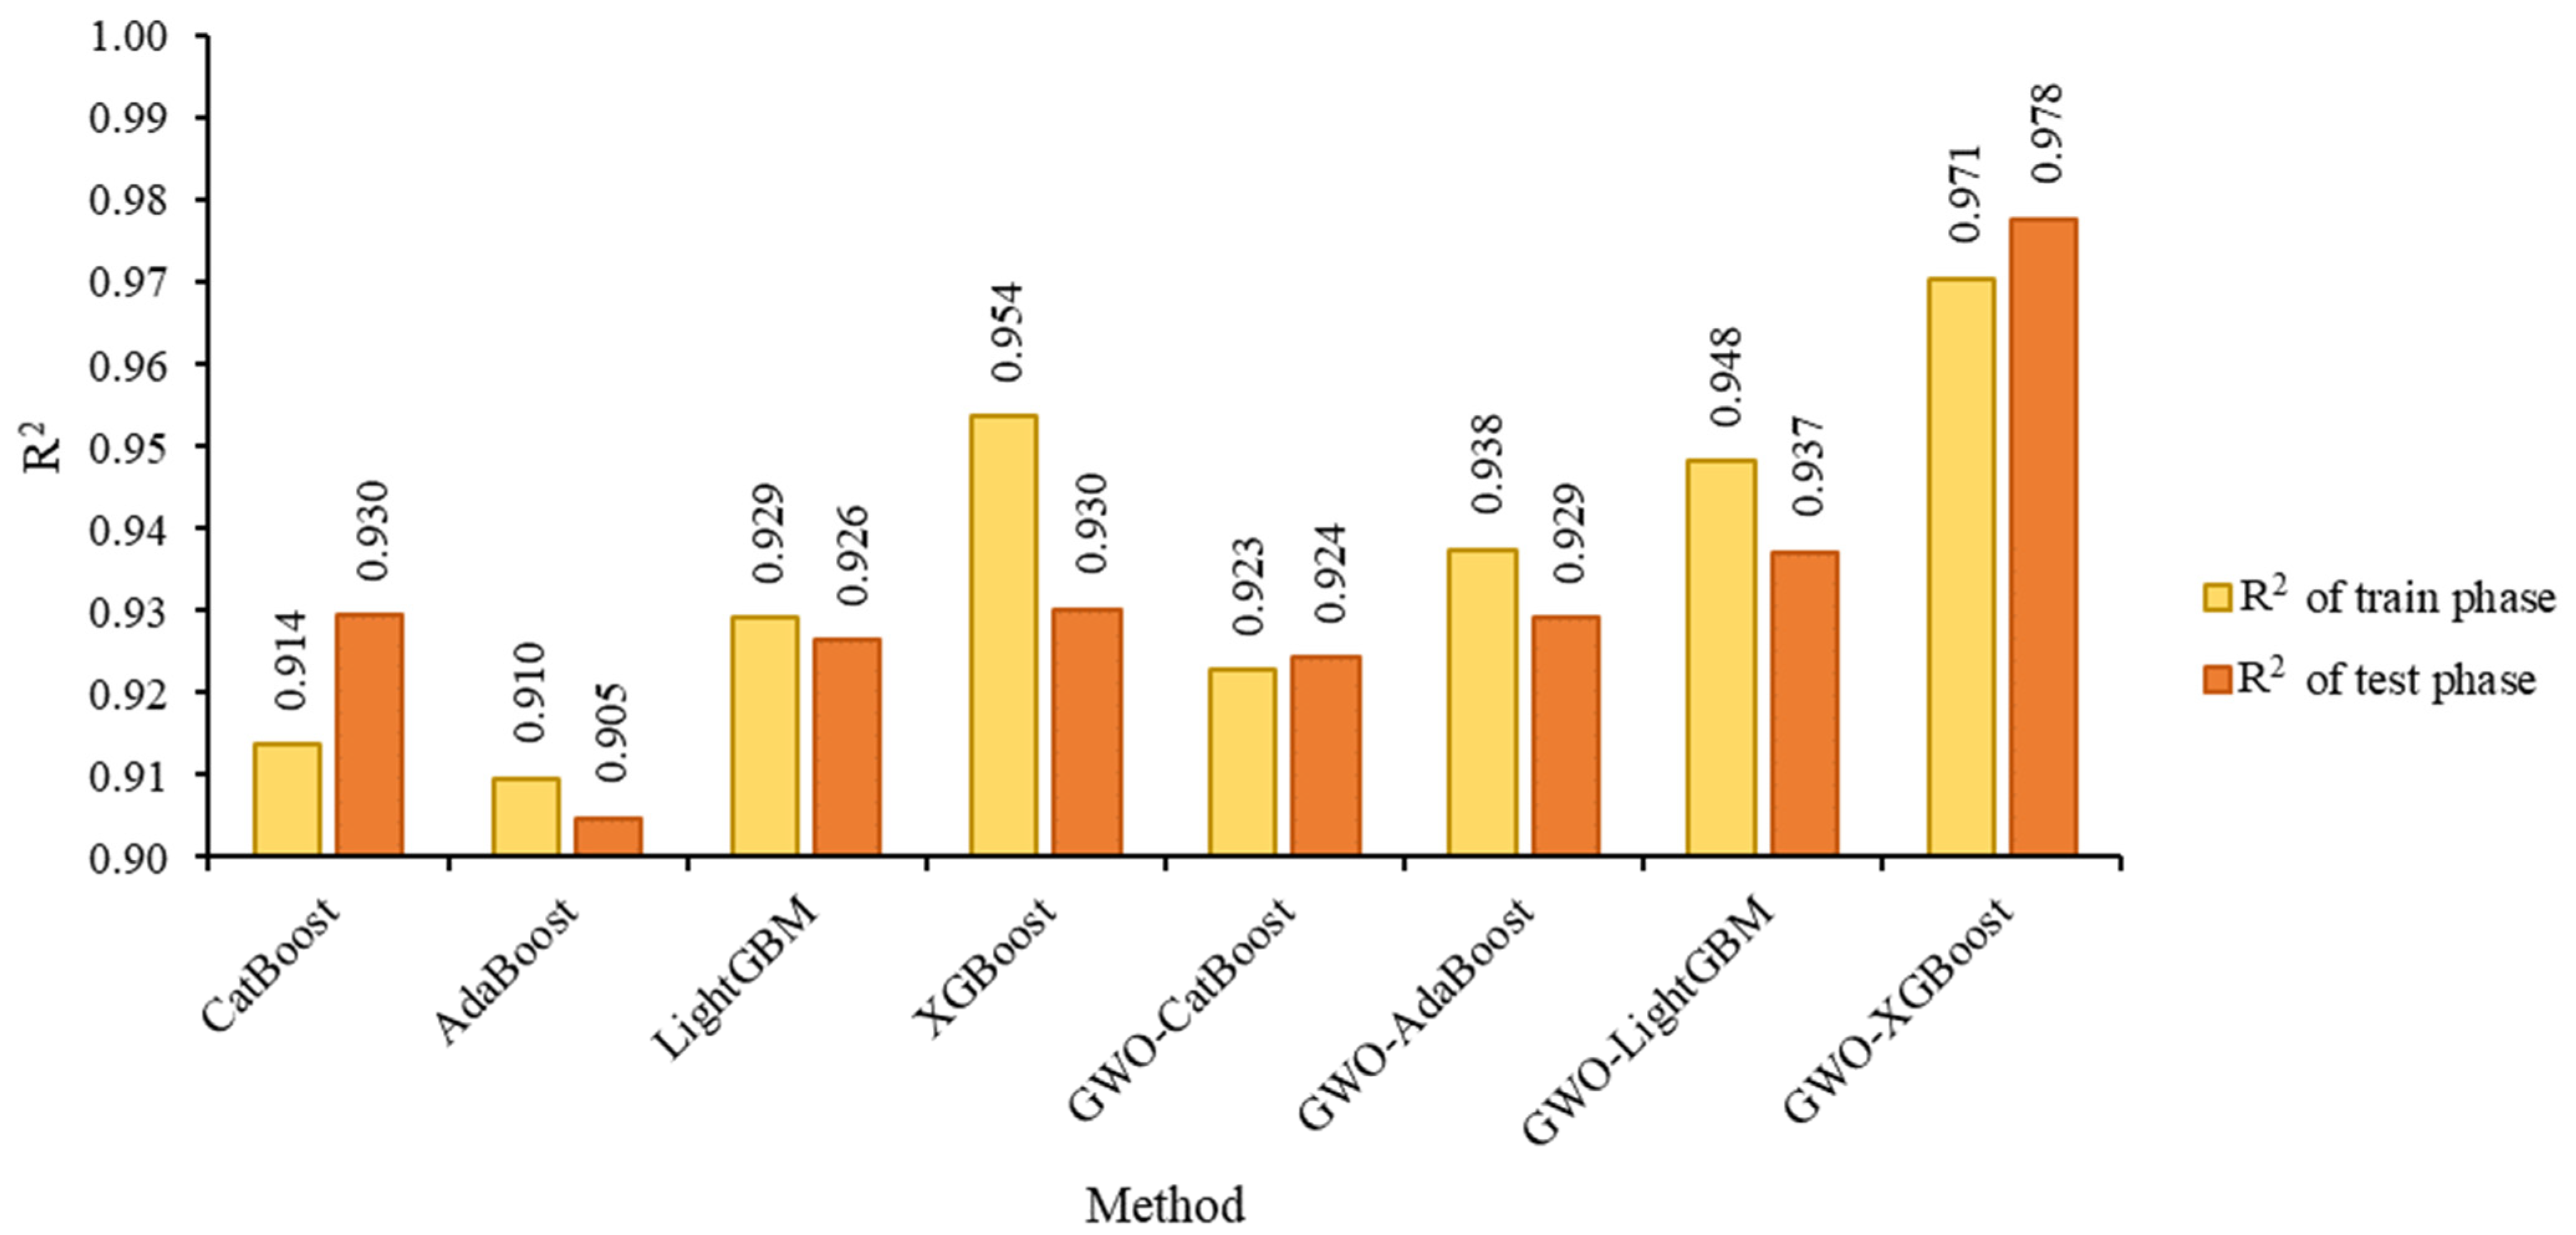
| Technique | Train Phase | Test Phase | ||||||||
|---|---|---|---|---|---|---|---|---|---|---|
| MAE | R2 | RMSE | VAF | Bias | MAE | R2 | RMSE | VAF | Bias | |
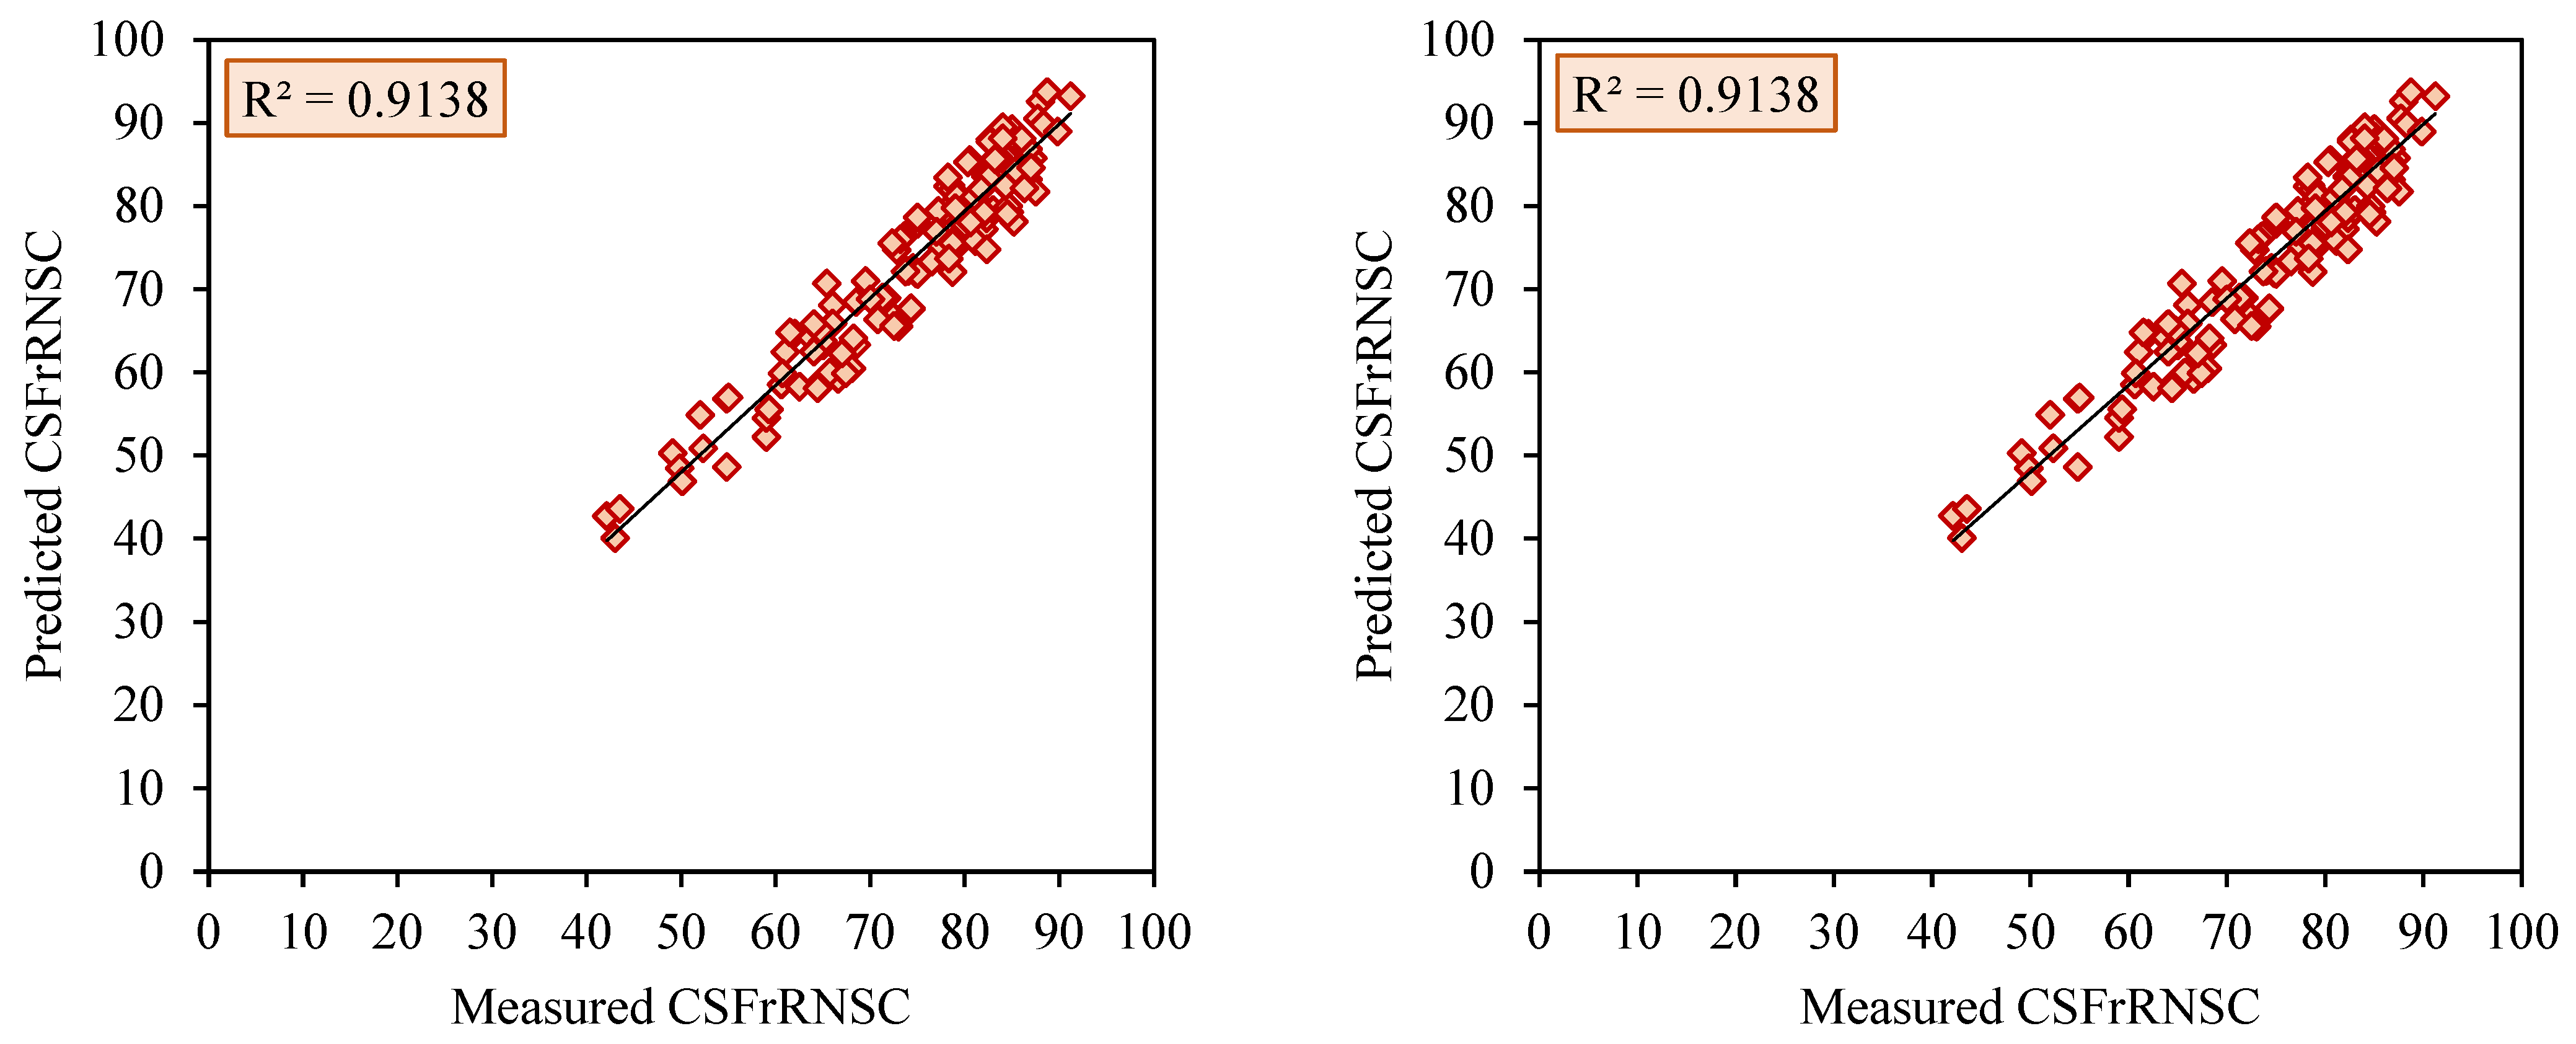
| CatBoost | 3.107 | 0.914 | 3.691 | 89.484 | 3.107 | 3.184 | 0.930 | 3.838 | 92.782 | 3.184 |
| AdaBoost | 3.164 | 0.910 | 3.628 | 89.632 | 3.164 | 4.294 | 0.905 | 4.858 | 88.709 | 4.294 |
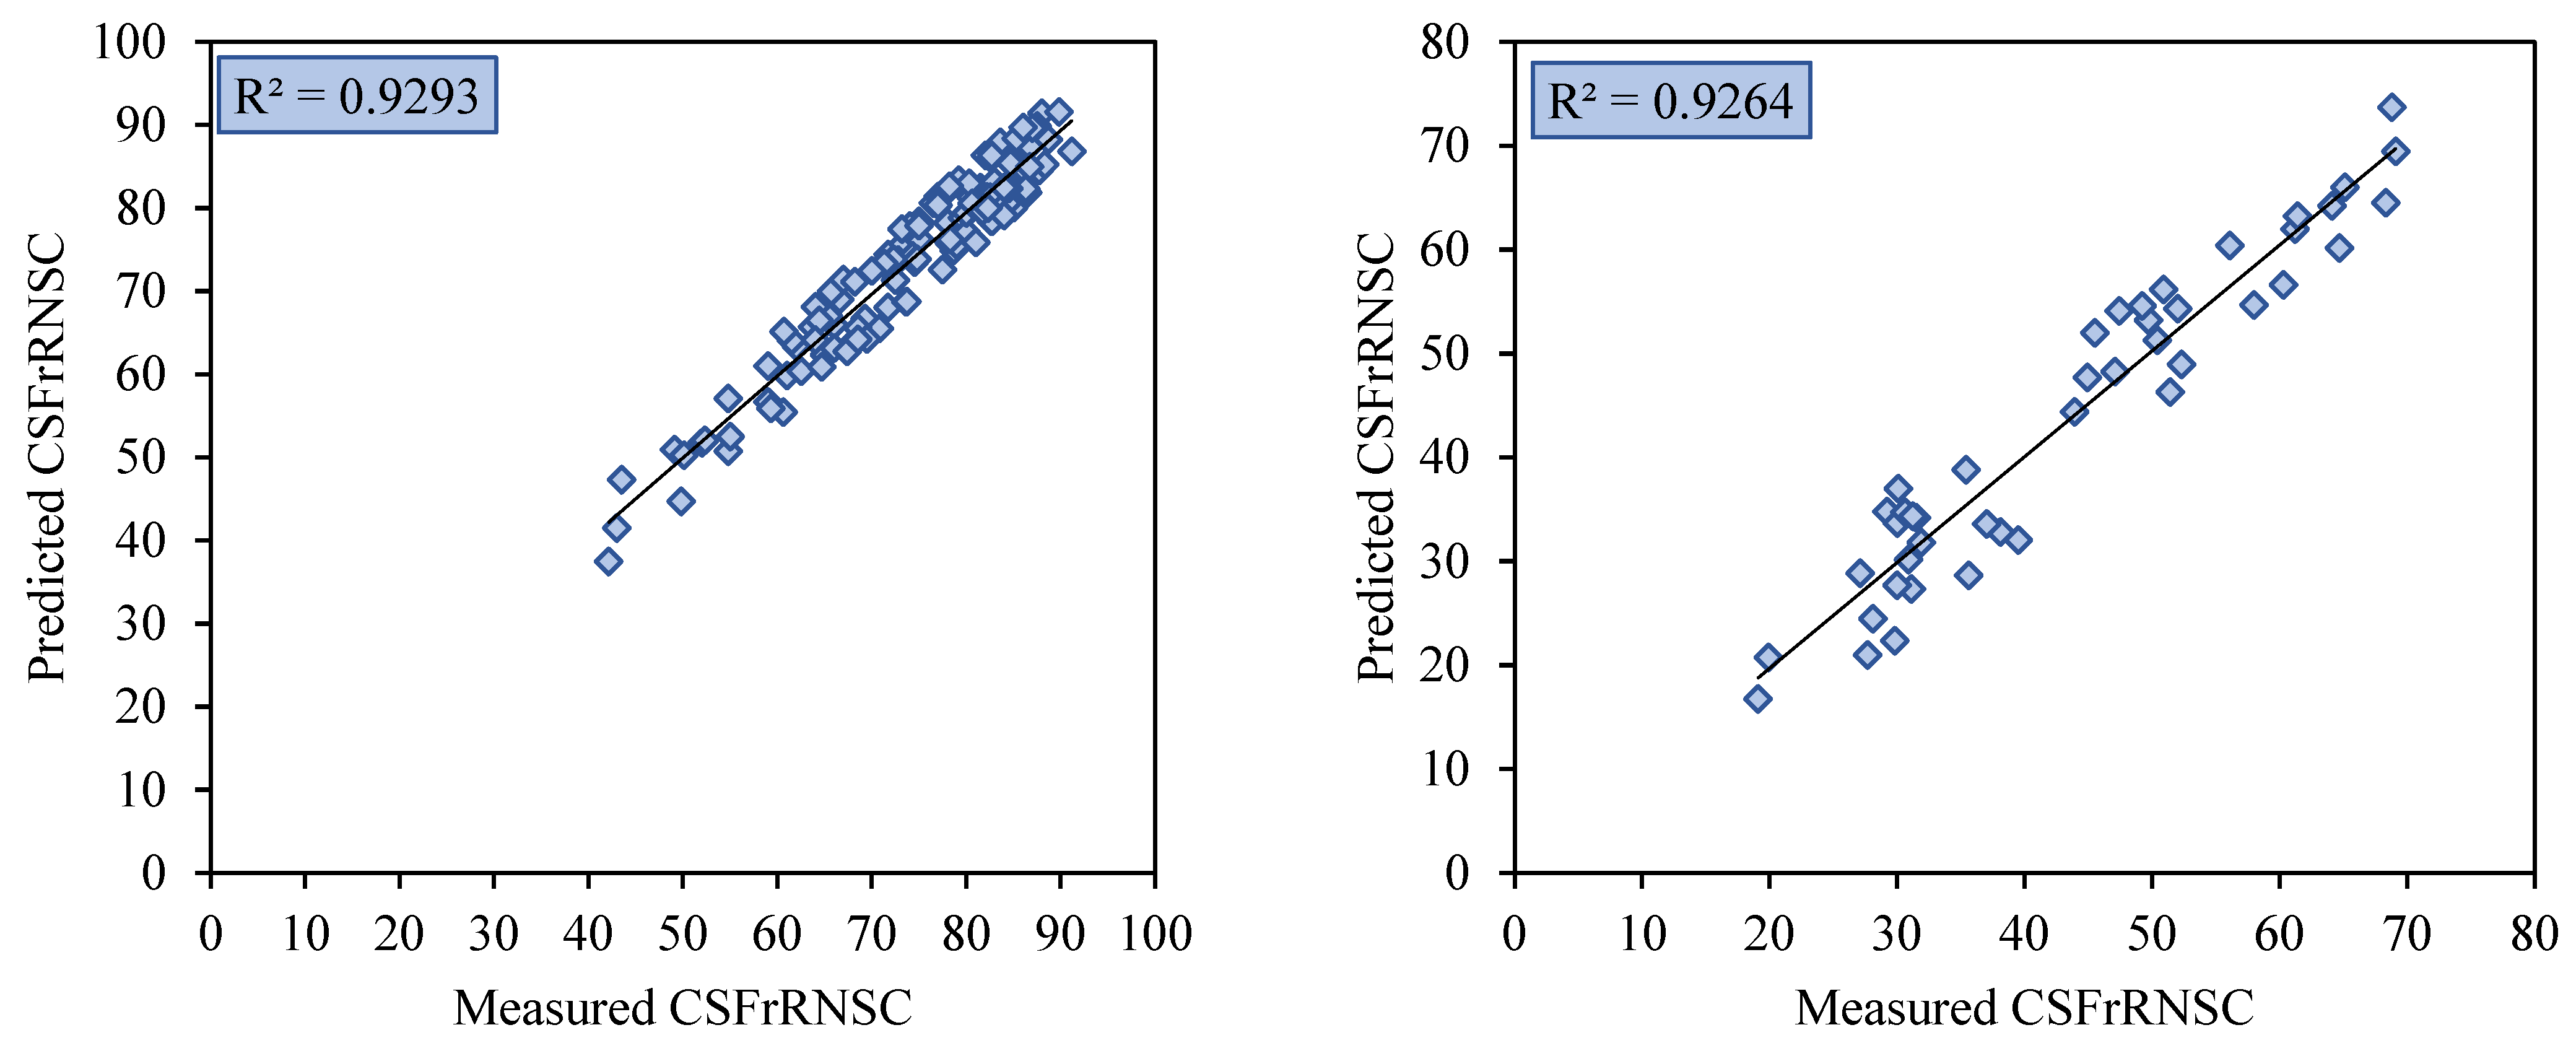
| LightGBM | 2.674 | 0.929 | 3.040 | 92.593 | 2.674 | 3.506 | 0.926 | 4.102 | 91.715 | 3.506 |
| XGBoost | 2.129 | 0.954 | 2.499 | 94.987 | 2.129 | 3.746 | 0.930 | 4.232 | 91.387 | 3.746 |
| GWO-CatBoost | 2.880 | 0.923 | 3.322 | 91.114 | 2.880 | 3.273 | 0.924 | 3.971 | 92.325 | 3.273 |
| GWO-AdaBoost | 2.669 | 0.938 | 3.106 | 93.090 | 2.669 | 3.569 | 0.929 | 4.101 | 91.789 | 3.569 |
| GWO-LightGBM | 2.455 | 0.948 | 2.911 | 94.499 | 2.455 | 3.036 | 0.937 | 3.606 | 93.600 | 3.036 |
| GWO-XGBoost | 1.653 | 0.971 | 1.933 | 96.960 | 1.653 | 1.802 | 0.978 | 2.129 | 97.774 | 1.802 |
| Technique | Train Phase | Test Phase | Total Rate | Rank | ||||||||
|---|---|---|---|---|---|---|---|---|---|---|---|---|
| MAE | R2 | RMSE | VAF | Bias | MAE | R2 | RMSE | VAF | Bias | |||
| CatBoost | 2 | 2 | 1 | 1 | 2 | 6 | 5 | 6 | 6 | 6 | 37 | 6 |
| AdaBoost | 1 | 1 | 2 | 2 | 1 | 1 | 1 | 1 | 1 | 1 | 12 | 8 |
| LightGBM | 4 | 4 | 5 | 4 | 4 | 4 | 3 | 3 | 3 | 4 | 38 | 5 |
| XGBoost | 7 | 7 | 7 | 7 | 7 | 2 | 6 | 2 | 2 | 2 | 49 | 3 |
| GWO-CatBoost | 3 | 3 | 3 | 3 | 3 | 5 | 2 | 5 | 5 | 5 | 37 | 6 |
| GWO-AdaBoost | 5 | 5 | 4 | 5 | 5 | 3 | 4 | 4 | 4 | 3 | 42 | 4 |
| GWO-LightGBM | 6 | 6 | 6 | 6 | 6 | 7 | 7 | 7 | 7 | 7 | 65 | 2 |
| GWO-XGBoost | 8 | 8 | 8 | 8 | 8 | 8 | 8 | 8 | 8 | 8 | 80 | 1 |
Disclaimer/Publisher’s Note: The statements, opinions and data contained in all publications are solely those of the individual author(s) and contributor(s) and not of MDPI and/or the editor(s). MDPI and/or the editor(s) disclaim responsibility for any injury to people or property resulting from any ideas, methods, instructions or products referred to in the content. |
© 2024 by the authors. Licensee MDPI, Basel, Switzerland. This article is an open access article distributed under the terms and conditions of the Creative Commons Attribution (CC BY) license (https://creativecommons.org/licenses/by/4.0/).
Share and Cite
Wang, R.; Zhang, J.; Lu, Y.; Huang, J. Towards Designing Durable Sculptural Elements: Ensemble Learning in Predicting Compressive Strength of Fiber-Reinforced Nano-Silica Modified Concrete. Buildings 2024, 14, 396. https://0-doi-org.brum.beds.ac.uk/10.3390/buildings14020396
Wang R, Zhang J, Lu Y, Huang J. Towards Designing Durable Sculptural Elements: Ensemble Learning in Predicting Compressive Strength of Fiber-Reinforced Nano-Silica Modified Concrete. Buildings. 2024; 14(2):396. https://0-doi-org.brum.beds.ac.uk/10.3390/buildings14020396
Chicago/Turabian StyleWang, Ranran, Jun Zhang, Yijun Lu, and Jiandong Huang. 2024. "Towards Designing Durable Sculptural Elements: Ensemble Learning in Predicting Compressive Strength of Fiber-Reinforced Nano-Silica Modified Concrete" Buildings 14, no. 2: 396. https://0-doi-org.brum.beds.ac.uk/10.3390/buildings14020396