Review

Decoding BIM Adoption: A Meta-Analysis of 10 Years of Research—Exploring the Influence of Sample Size, Economic Level, and National Culture

by
Kaiyang Wang
1,2,*,
Min Guo
3,
Luigi Di Sarno
2 and
Yao Sun
4,5,*
1
Department of Construction Management, College of Civil Engineering, Nanjing Forestry University, Nanjing 210037, China
2
Department of Civil and Environmental Engineering, University of Liverpool, Liverpool L69 3BX, UK
3
Department of Civil Engineering, Xi’an Jiaotong-Liverpool University, Suzhou 215000, China
4
College of Civil Engineering, Hunan University, Changsha 410012, China
5
Key Laboratory for Green & Advanced Civil Engineering Materials and Application Technology of Hunan Province, Hunan University, Changsha 410012, China
*
Authors to whom correspondence should be addressed.
Submission received: 5 February 2024 / Revised: 20 March 2024 / Accepted: 25 March 2024 / Published: 27 March 2024
(This article belongs to the Section Construction Management, and Computers & Digitization)

Abstract

:
In recent years, some studies have explored the determinants of Building Information Modeling (BIM) adoption. However, the findings of these studies are varied and sometimes contradicting. Consequently, this study undertakes an in-depth exploration of the relationship between influencing factors and behavioral intention. This analysis is achieved through a synthesis of findings from prior empirical studies, considering the nuanced impacts of specific contextual factors, including sample size, national culture, and economic level, on these relationships. In total, this meta-analysis encompasses 57 articles, and as of 31 December 2023, incorporates 63 datasets comprising a collective sample size of 13,301. An extended Unified Theory of Acceptance and Use of Technology (UTAUT) model was developed based on the most frequently studied constructs relevant to BIM adoption. The analysis reveals that BIM adoption is primarily affected by performance expectancy, social influence, facilitating conditions, effort expectancy, and perceived value. The moderator analysis indicates that sample size statistically significantly moderates the relationships between facilitating conditions and use behavior. Moreover, the extent of individualism in each national culture significantly moderates the associations between facilitating conditions and user behavior. The research serves to enrich the existing body of literature on BIM acceptance by addressing contradictory and mixed results found in empirical studies. It represents one of the first attempts to explore the influence of sample size, economic level, and Hofstede’s six cultural dimensions as moderators in the field of BIM utilizing meta-analytic techniques.

Graphical Abstract

1. Introduction

The construction industry has been widely acknowledged as a key driver of economic growth in numerous countries. However, the industry’s traditional reliance on manual processes and labor-intensive activities has resulted in inefficiencies and errors, often caused by fatigue and human factors [1,2]. The advent of advanced information technology solutions, most notably Building Information Modeling (BIM), has significantly altered the execution of construction projects in recent years [3,4]. BIM pertains to a computerized replica of a building’s physical and functional attributes, which allows stakeholders to plan, design, construct, and operate buildings throughout their entire lifecycle [4]. Implementing BIM has been shown to offer numerous benefits, including enhanced collaboration, greater productivity, improved visualization, and informed decision-making [5].
Moreover, BIM adoption can enable efficient building construction processes with reduced resource consumption and risks compared to traditional paper-based methods [6]. As such, BIM presents a promising opportunity for companies to achieve positive returns on their investment by reducing project costs. Adopting and integrating BIM into construction workflows can thus lead to improved construction project outcomes and sustained economic growth [7,8].
While BIM offers many advantages, realizing these benefits hinges upon its widespread adoption within the construction ecosystem [9]. In practical terms, large-scale, highly qualified firms may incorporate BIM into specific aspects of their project delivery processes, while others predominantly remain at preliminary stages with limited BIM adoption [10]. As posited by Xue et al. [10], the diffusion of BIM necessitates a comprehensive examination from both organizational and user standpoints. The decision regarding BIM adoption within an organization or project rests with managerial personnel. Subsequent to such decisions, which may be motivated by internal efficiency imperatives or external isomorphic pressures, it falls upon individual project participants—the ultimate technology users—to effectively integrate BIM into their design and construction processes, thereby enhancing project performance [11]. Notably, user resistance and behavior represent significant factors in implementing BIM, mirroring the challenges encountered in assimilating complex emerging technologies in other sectors. The introduction of BIM into construction projects entails intricate organizational adjustments and the redistribution of individual responsibilities, often accompanied by pronounced individual resistance. Moreover, user behavior, as a multifaceted phenomenon, not only diverges from adoption decisions primarily formulated by organizational management but also conceptually differs from non-acceptance, underpinned by distinctive decision-making mechanisms [12]. From the vantage point of technology diffusion, the acceptance of BIM is substantially influenced by practitioners’ perceptions. Acceptance, being a psychologically rooted individual act, is intrinsically derived from personal perceptions [13].
In extant scholarly discourse, a range of challenges pertaining to the adoption of BIM has received attention. However, a notable research gap persists in the examination of factors influencing the behavioral intentions of practitioners toward BIM adoption, offering the potential for valuable insights [10,11,14]. Presently, numerous studies have explored the drivers, impediments, and influencers shaping the acceptance of BIM among professionals in the construction domain. Scholars have leveraged diverse models and theories, encompassing Task-Technology Fit (TTF), the Technology Acceptance Model (TAM), the Theory of Planned Behavior (TPB), the Technology-Organization-Environment (TOE) framework, and Unified Theory of Acceptance and Use of Technology (UTAUT), to analyze and predict practitioners’ attitudes toward BIM adoption. Cumulatively, these investigations have substantially enriched both the theoretical underpinnings and practical dimensions of our comprehension of BIM acceptance dynamics while also producing some inconsistent findings. Furthermore, most of the previous studies have concentrated on studying the influence of specific factors on BIM adoption. Those factors usually vary from one research to the other depending on the context and participants.
Given the diverse outcomes in existing literature, conclusive explanations regarding BIM adoption and its outcomes remain elusive. We assert that this constitutes a critical knowledge gap, warranting an integrative review of various aspects of BIM adoption among construction professionals through meta-analysis. Consequently, there is a need for a systematic review of pertinent factors to develop a general model for BIM adoption and quantitatively integrate findings from prior research. Meta-analytic models are typically formulated based on theory, specific research objectives, or a combination of both, encompassing theory-driven main effects and goal-oriented integration of moderators [15]. In light of this context, the primary objective of this research is to employ a meta-analysis approach to comprehensively examine findings from previous BIM adoption studies. Such an analysis facilitates the clarification of theoretical model controversies, identification of potential moderating factors, consolidation of prior research outcomes, and elucidation of factors influencing BIM adoption [15]. Subsequently, the authors posit that research inconsistencies may arise from moderating factors such as sample size, economic level, and national culture. A meta-analysis aids in pinpointing these moderators within variables, thereby explaining disparities observed in prior studies. These insights can contribute to refining theories such as the TAM or UTAUT by incorporating potential moderators. Thus, the secondary objective of this meta-analytical study is to unveil the moderators responsible for empirical result heterogeneity, providing valuable insights to scholars and global BIM practitioners. From a theoretical perspective, this study enriches the BIM adoption literature by identifying and analyzing the important conceptual drivers of BIM acceptance (main effects) and their contingencies (moderation effects).
To achieve the objectives stated above, the authors specifically aim to answer the following three research questions (RQs):
RQ1. Can prevailing theories offer a nuanced understanding of the intentions guiding construction practitioners in their adoption of BIM?
RQ2. What factors significantly influence BIM acceptance, contributing to a deeper understanding of its importance in construction practice?
RQ3. How do sample size, economic status, and national culture moderate the antecedents of behavior in BIM adoption, enhancing the comprehension of this phenomenon?
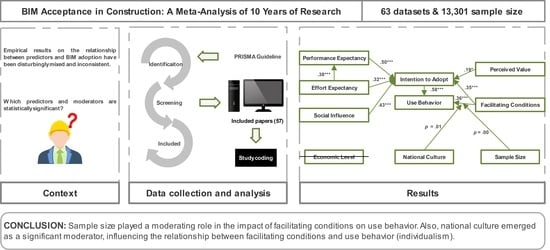
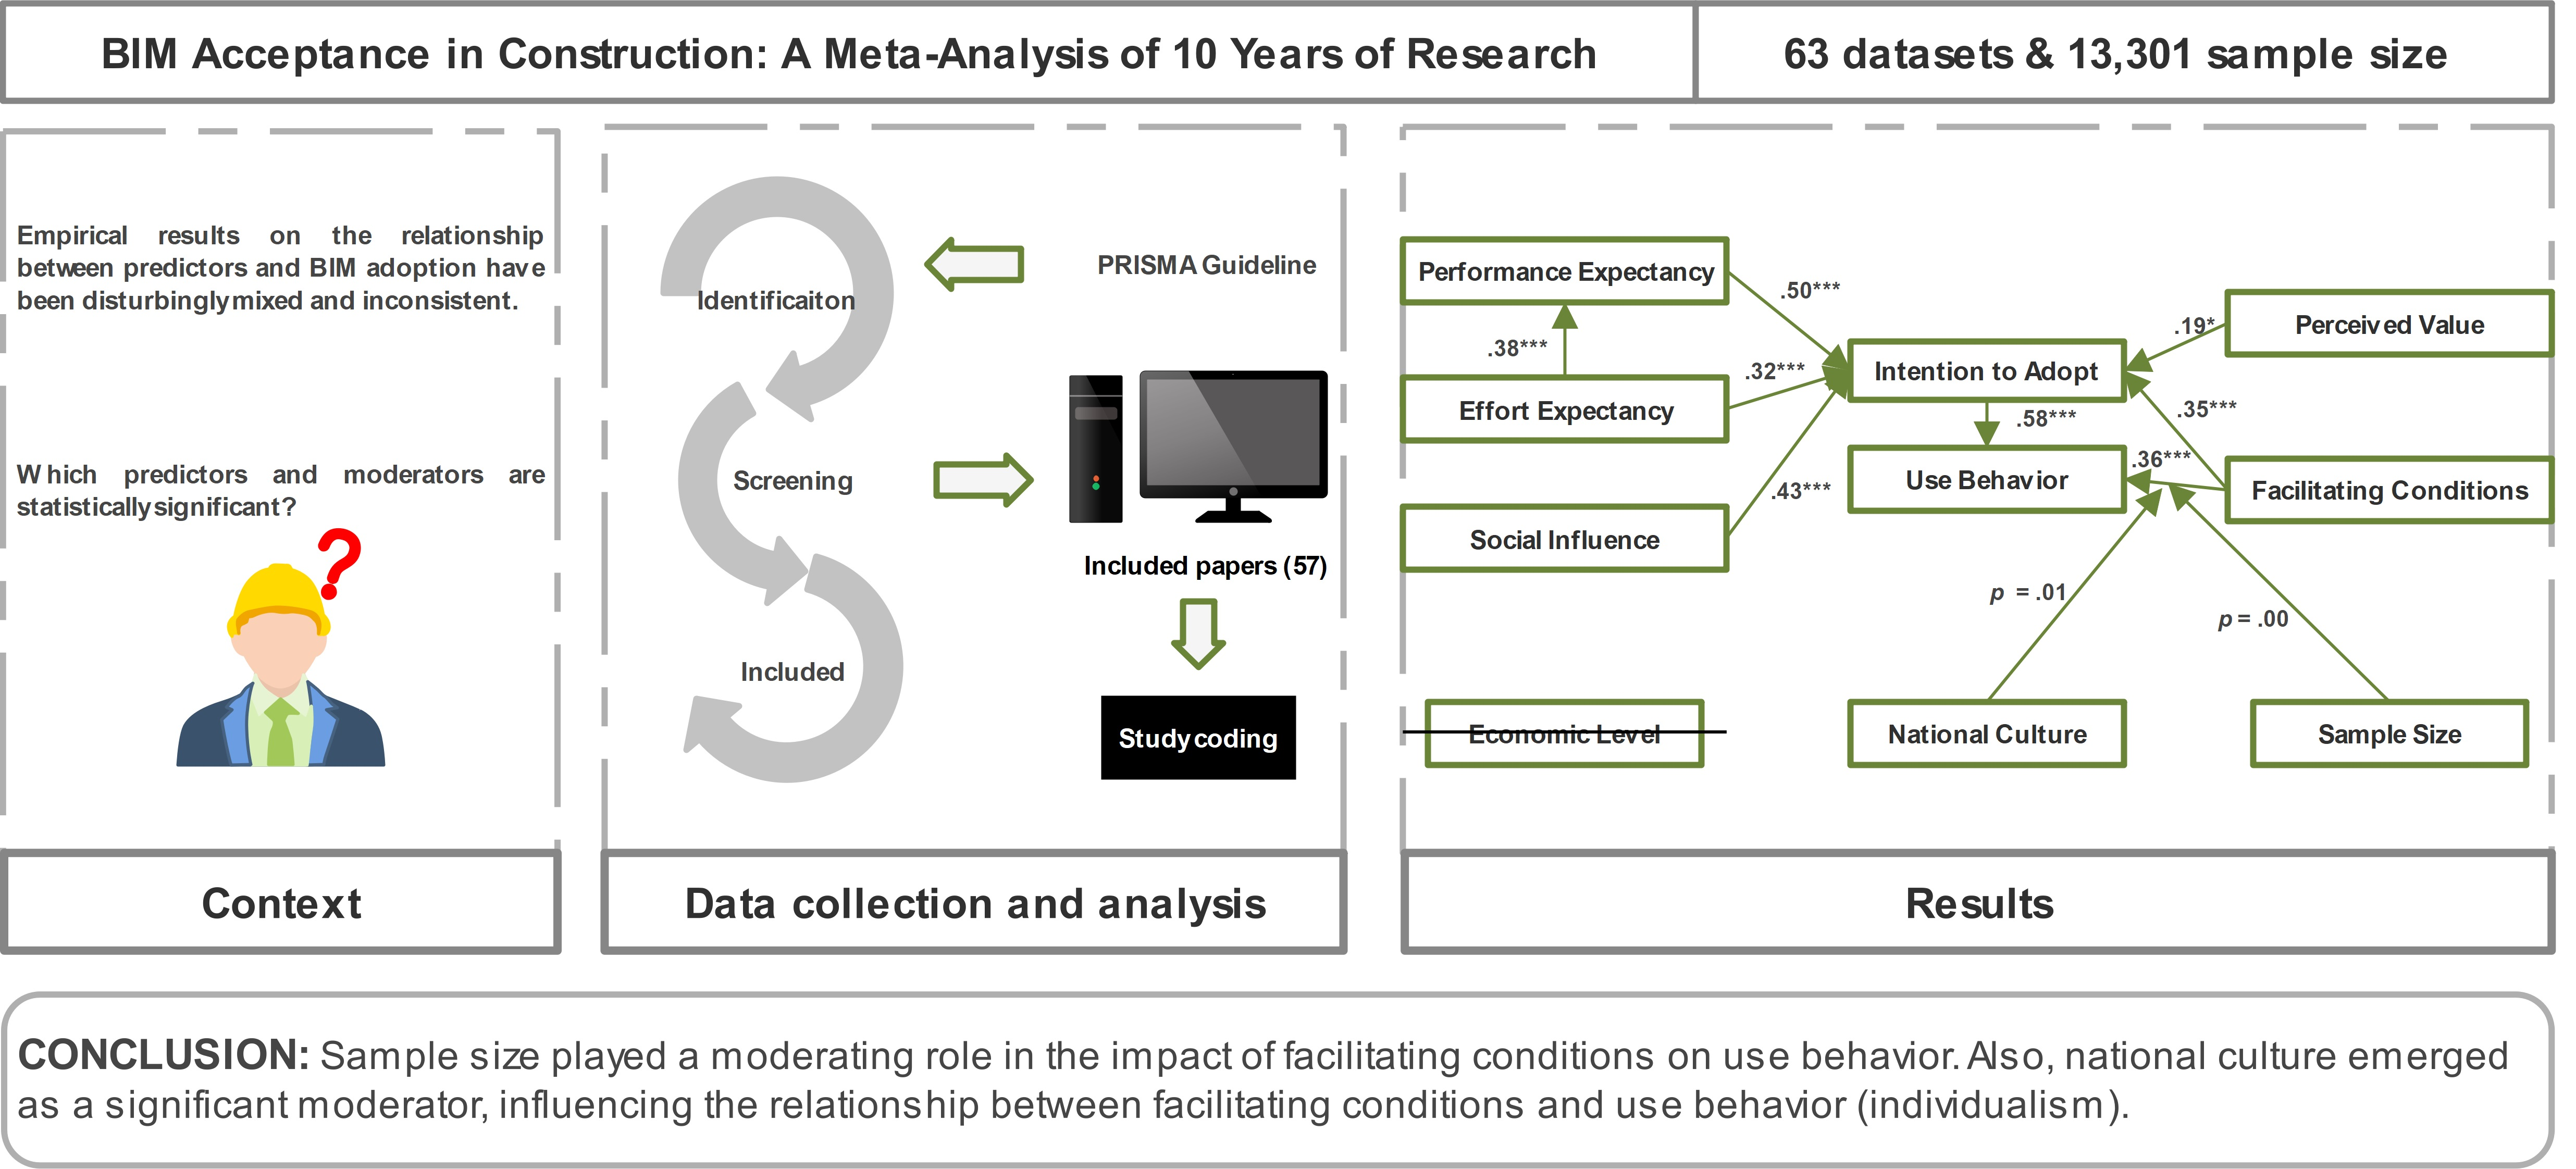
To the best of the authors’ knowledge, this study presents the first meta-analysis on BIM acceptance, yielding diverse outcomes. By addressing these questions, the results of this study have the potential to offer a clearer and more cohesive understanding of the subject matter. This research aims to advance the literature by constructing a meta-analytic model comprising five factors associated with intention. Drawing on data from 218 effect sizes collected from 57 empirical studies conducted in 14 countries, the analysis clarifies the most influential factors influencing practitioners’ behavioral intention to adopt BIM. Additionally, this study contributes theoretically through a moderator analysis, providing practitioners with a comprehensive view of underlying theories such as UTAUT and Hofstede’s cultural framework. The selection of these theories and models is motivated by their prominence in assessing individuals’ behavioral intentions and their frequent use across the BIM adoption literature. Furthermore, guided by Hofstede’s cultural framework, this meta-analysis represents one of the first studies aiming to elucidate the moderating roles of the six dimensions of national culture in the BIM domain.
Section 2 reviews the literature on BIM adoption, technology acceptance theories, and meta-analysis. The research hypotheses are developed in Section 3. In Section 4, the authors detail the research methods. In Section 5 and Section 6, the findings of this study are outlined and discussed. The last section presents the conclusions.

2. Literature Review

2.1. Research Gap in BIM Adoption Literature

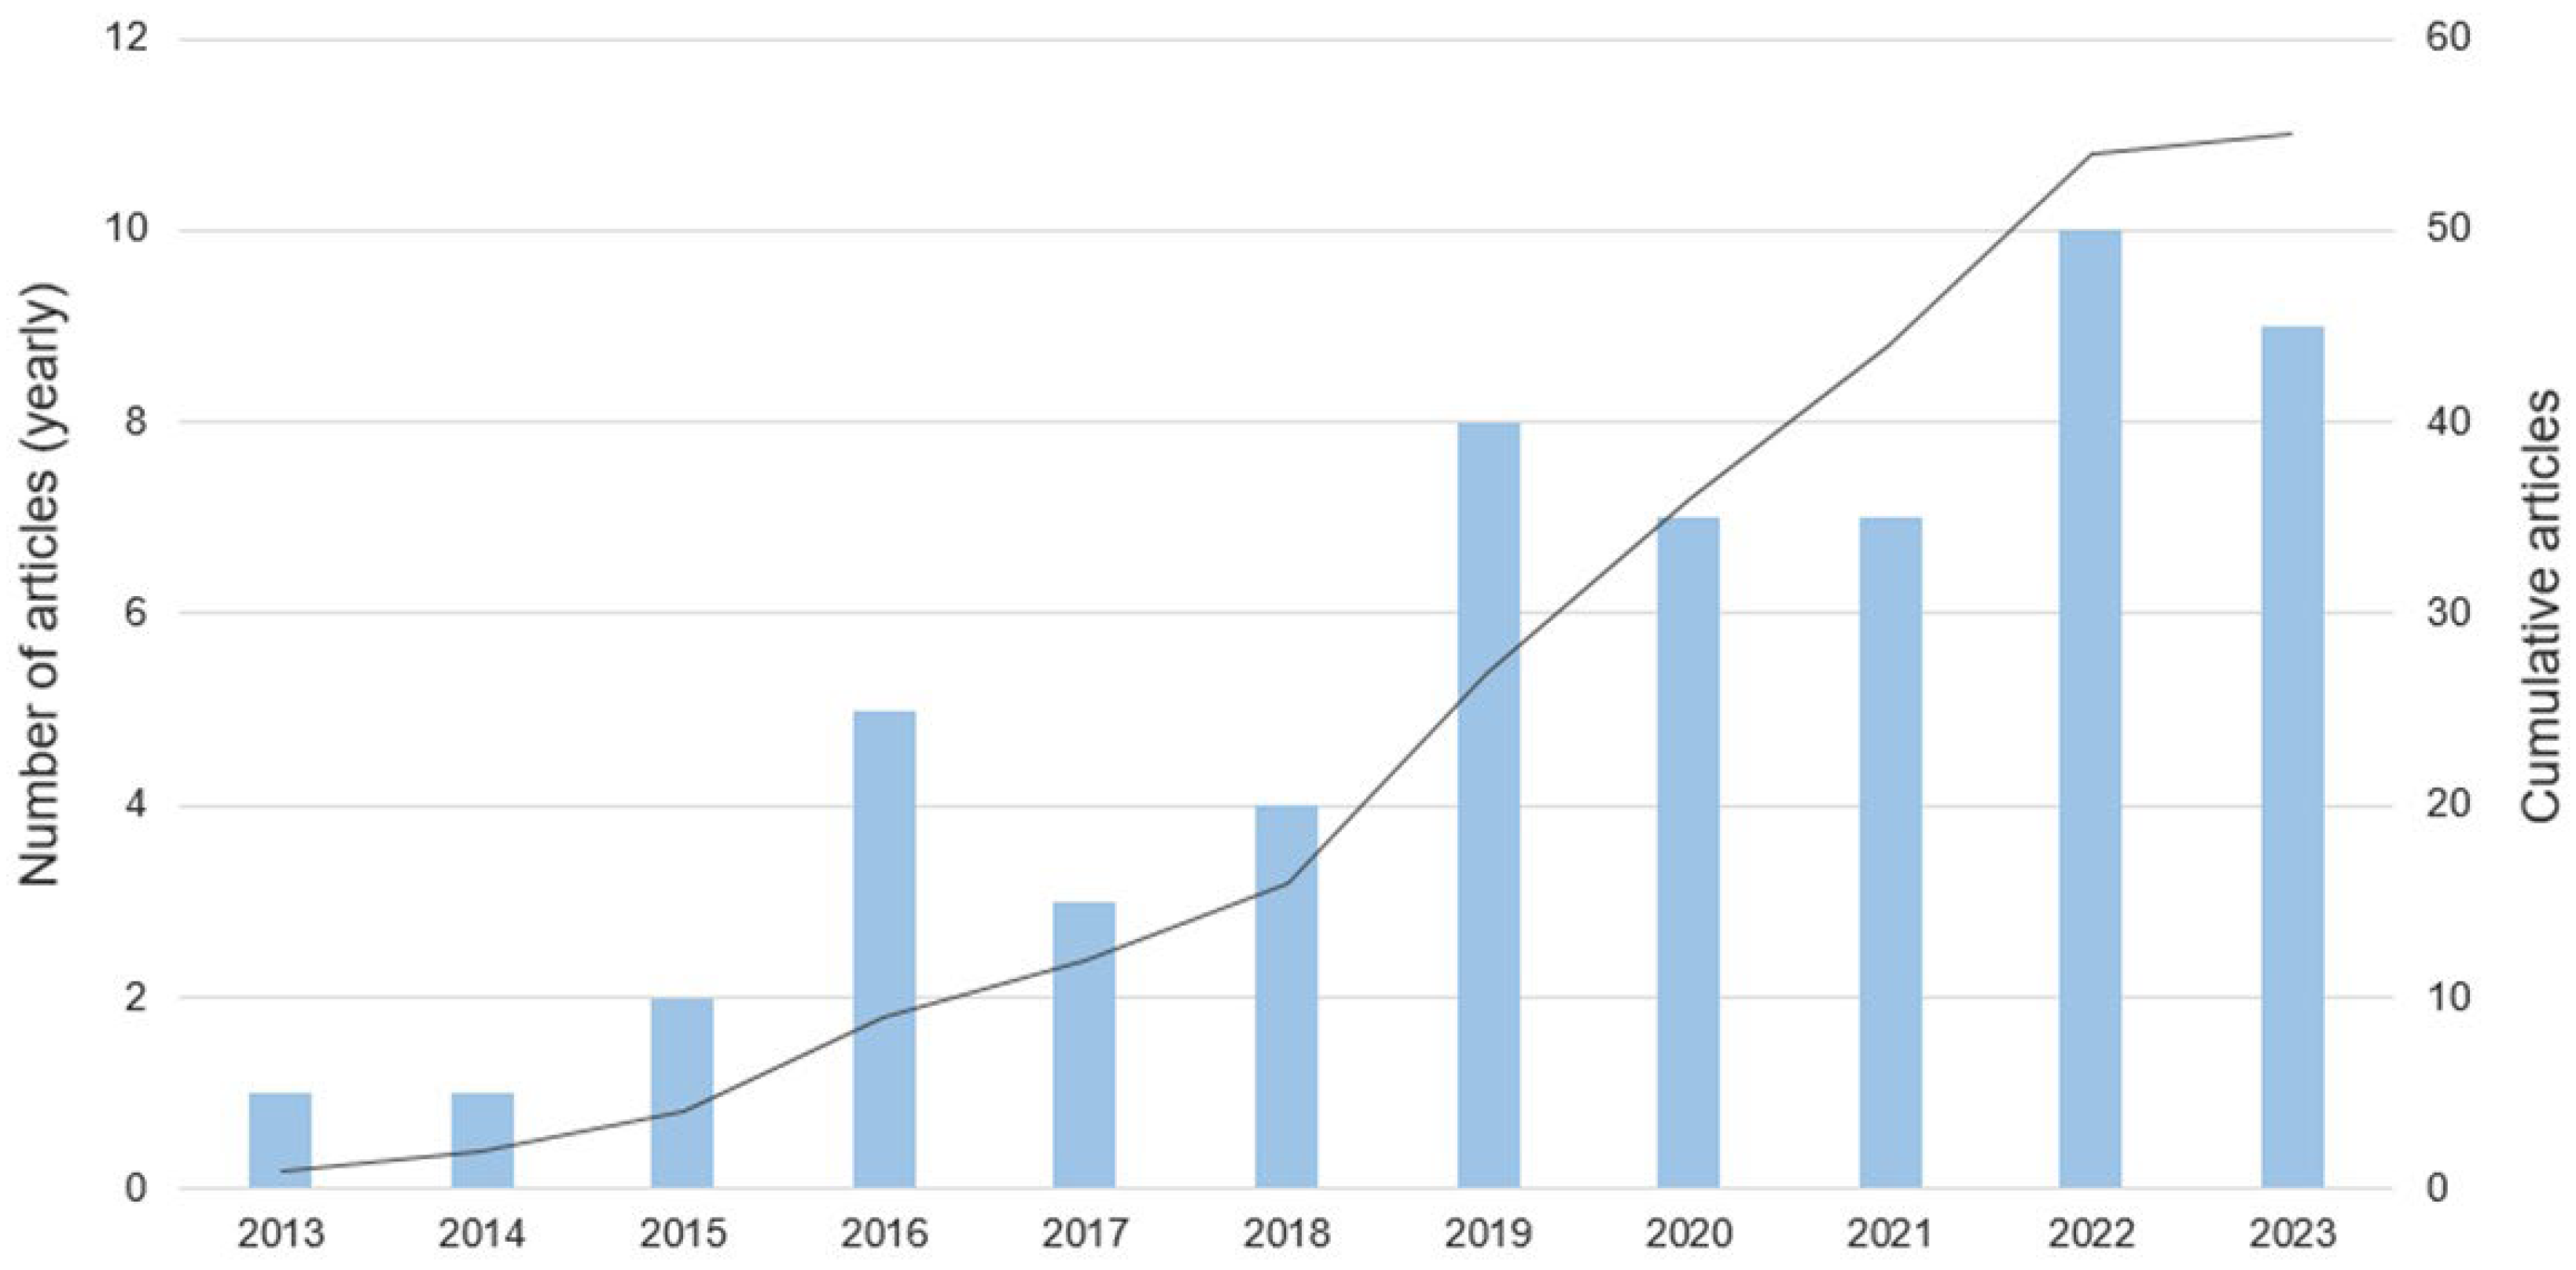
Over the last few years, there has been a significant increase in the number of empirical studies that have delved into identifying factors that can predict the adoption of BIM. These investigations have yielded significant support for theories related to technology adoption, as well as psychological and behavioral factors influencing BIM adoption, as evidenced by studies such as those conducted by Hong et al. [16], Murguia et al. [17], and Zhao et al. [18]. Despite these advancements in the literature, four key limitations remain that require further scholarly attention.
Firstly, the literature on BIM adoption has produced inconsistent findings regarding several vital relationships that influence BIM adoption intentions. For example, while some studies [10,19,20] have found performance expectancy to be a significant predictor of adoption intention, others [18,21] have reported it as non-significant. Similarly, Murguia et al. [22] have identified effort expectancy as a significant predictor of BIM adoption intention, while Xue et al. [10] have reported a non-significant relationship. These divergent findings in the literature impede scholars’ ability to draw general conclusions regarding the impact of these antecedents on BIM adoption intention. Consequently, it is necessary to conduct additional research to explicate these associations and gain a more comprehensive understanding of the factors influencing BIM adoption.
Secondly, the relationships investigated for BIM adoption exhibit considerable variation, with significant differences in the reported effect sizes of these relationships. For instance, the effect size of the relationship between performance expectancy and behavioral intention has been reported to vary from −0.049 to 0.843, despite the significant nature of this relationship [18,23]. Similarly, the relationship between social influence and behavioral intention has been found to vary from 0.018 to 0.807 [24,25]. These wide-ranging variations raise questions about the explanatory power of these relationships. Accordingly, the present study addresses the conflicting results in the existing literature through a meta-analysis, to establish generalizability among the antecedents of intention to adopt BIM.
Thirdly, prior studies have utilized technology acceptance theories (e.g., TAM, TPB, TOE, and UTAUT) to explore the factors affecting BIM acceptance. However, the effectiveness of these theories in explaining the variance in adoption behavior has varied considerably. For instance, Nguyen et al. [20] applied an integrated TPB–TAM model that explained 72% of the variance in behavioral intention to use BIM, while Addy et al. [21] utilized the UTAUT model that accounted for 75% of the total variance. In contrast, Acquah et al. [26] employed the TAM model that explained only 35% of the variance. It is worth noting that previous research has indicated that UTAUT offers a superior explanation of the variance in behavioral intention to adopt technology [27]. Accordingly, the authors systematically review the BIM acceptance literature to investigate which theories can be used to better explain construction practitioners’ intention to adopt BIM.
Finally, the literature has overlooked the impact of contextual factors on BIM adoption. Previous studies have primarily omitted moderators from their research models (e.g., [16,23,28,29]), failing to consider the role of national BIM policies and the effect of economy and culture on BIM acceptance. As many countries are implementing or developing such policies to foster BIM adoption, the dearth of studies and methodologies assessing and comparing existing BIM adoption literature in terms of these contextual factors is problematic. Therefore, the authors conducted a meta-analysis to systematically investigate the impacts of contextual factors (i.e., sample size, national culture, and economic level) on practitioners’ intention to adopt BIM.

2.2. Technology Acceptance Models/Theories

In a social system, innovation adoption or rejection decisions can be categorized into three primary types [30]—(i) optional decisions, where individuals independently choose to adopt or reject an innovation; (ii) collective decisions, where consensus among system members guides adoption or rejection; and (iii) authority decisions, where a select group of influential or technically competent individuals make the choices. The adoption of BIM in construction projects typically aligns with authority decisions, originating from project management or design or construction team leaders. In such adoption processes, individual project members may respond differently to the implemented innovations, often manifesting resistance in various dimensions, including behavior, cognition, and emotion. Among these dimensions, behavioral resistance, as the primary one [11], is defined in the innovation management and information system (IS) literature as behaviors that oppose changes associated with the introduction of innovative technologies like BIM.
In the realm of IS literature, various research streams have sought to investigate the factors influencing individuals’ adoption of new technology. While BIM adoption research is still in its infancy, scholars have employed multiple theoretical approaches to study its adoption [6,14,18,31]. Notwithstanding, most of these methodologies are conceptually associated, with the bulk of them originating in Fishbein’s [32] Theory of Reasoned Action (TRA). The TRA, initially proposed by Fishbein [32] and subsequently enhanced by Fishbein and Ajzen [33], is a research technique utilized to ascertain behavioral intention by estimating two factors—attitude toward the behavior and subjective norms. It has been extensively utilized to evaluate the behavioral intention of individuals toward adopting novel technology and can be recognized as the fundamental concept for succeeding models developed to comprehend behavioral intentions and the ensuing behaviors [27].
The TPB, developed by Ajzen [34], is a theoretical extension of the TRA. TPB integrates an additional predictor variable into the TRA framework, named perceived behavioral control. The perception of behavioral control refers to “an individual’s apprehension of their ability to perform a behavior or utilize a specific product or amenity” [34]. Essentially, individuals are more likely to exert greater control over a particular behavior if they perceive an abundance of resources and opportunities to carry it out. Aligned with the TRA and TPB, Davis’s [35] TAM is another extensively utilized theoretical framework for investigating technologies or products’ adoption beliefs. The TAM explores perceived ease of use and perceived usefulness as two fundamental determinants of behavioral intention. Additionally, several other models build upon the fundamental structure of the TRA, such as the Decomposed Theory of Planned Behavior (DTPB), a combination of the TAM and TPB (c-TAM-TPB); the Motivational Model (MM); Social Cognitive Theory (SCT); the Model of PC Utilization (MCPU); and Innovation Diffusion Theory (IDT), among others [36].
UTAUT, an important theoretical model in the IS acceptance field, exemplifies the incremental building process. Venkatesh and colleagues [27] reviewed the literature and compared eight existing theoretical models, including the TRA, TAM, TPB, C-TAM-TPB, MM, SCT, MPCU, and IDT, leading to the development of UTAUT. The UTAUT model focuses on the dependent variables of an IS’s behavioral intention and use behavior, positing four independent predictors—performance expectancy, effort expectancy, social influence, and facilitating conditions—that influence behavioral intention to use a given technology. Venkatesh et al. [37] have demonstrated that UTAUT outperforms the individual models that it encompasses, using data collected in multiple workplace settings and across several periods on the adoption of various technologies.
In the BIM acceptance literature, numerous scholars have frequently utilized established models such as the TAM, the TOE framework, and UTAUT to investigate factors influencing BIM adoption decisions [10,18]. For example, Lai and Lee [38] adapted the TAM to develop a conceptual model, assessing the factors affecting BIM usage among 63 construction practitioners in Malaysia. Similarly, Semaan et al. [6] employed the original TAM as a foundation to examine the impact of constructs on the willingness of 73 construction practitioners in the UK to adopt BIM. TOE principles were applied by Ahuja et al. [39] in their study of BIM utilization decisions among 184 construction practitioners in India. Additionally, UTAUT was employed by Addy et al. [21] to investigate the influence of performance expectancy, effort expectancy, social influence, and facilitating conditions on users’ intention to adopt BIM in Ghana. Le et al. [40] adopted UTAUT and empirically assessed the four UTAUT constructs in relation to the inclination of 453 Chinese construction practitioners toward BIM adoption. Finally, Dowelani and Ozumba [25] utilized the UTAUT model to validate the primary antecedents of BIM use behavior in South Africa.
Collectively, these studies have provided valuable insights into the factors influencing BIM adoption behavior. Nonetheless, there exists a divergence in their findings, particularly concerning constructs like behavioral intention and use. In an effort to address these disparities and enhance comprehension within the field of BIM adoption, this study employs a meta-analysis approach to consolidate and clarify the empirical outcomes of BIM research. Additionally, the authors aim to discern the influence of moderating variables on each of these constructs.

2.3. Meta-Analysis in Technology Adoption

To address the research questions of this study, a quantitative approach called meta-analysis was followed in surveying the literature. This approach was inspired by Chong et al. [41], who tried to analyze the factors of the TAM and UTAUT to build a general model for healthcare information technologies. As a tool for understanding existing research literature, meta-analysis enables results from multiple studies [42,43,44] to be accumulated for estimates of the true effect sizes of relationships. Previous research has demonstrated the utility of meta-analysis as a valuable tool for hypothesis testing synthesis within the technology acceptance literature [45,46,47]. It effectively addresses common issues such as sampling and measurement errors encountered in research studies [43] and allows for the integration of non-significant or inconsistent findings [48]. Essentially, it offers a more robust method for assessing hypotheses of BIM acceptance through systematic comparisons of a comprehensive body of empirical generalizations involving larger, more diverse samples across various national cultures.
The rationale behind implementing this statistical approach in the context of BIM acceptance is multifaceted. Firstly, it addresses inconsistencies by integrating and synthesizing mixed findings in terms of strength and direction. Additionally, it facilitates the examination of the significance level of relationships, enabling hypothesis testing and generalization of results [25]. Secondly, prior research exhibits that this comprehensive approach is exceptionally beneficial in hypothesis testing and moderator analysis [15]. It is an opportunity to conduct moderator analysis by using meta-analysis since it is difficult to investigate the moderating effects on direct paths by surveying data (e.g., the moderating role of economic level and national culture). Thirdly, there is no attempt to conduct a meta-analysis to investigate the factors associated with BIM acceptance. Lastly, it fortifies and substantiates present outcomes while shedding light on empirical substantiation deficiencies, suggesting encouraging avenues for subsequent research investigations.
As the significance of meta-analysis has been increasingly recognized, scholars have been using it for various types of analyses in various fields. For instance, Dwivedi et al. [49] conducted a critical review of the original UTAUT model and introduced an alternative theoretical model that highlights the importance of explicitly theorizing individual characteristics through meta-analysis. Tao et al. [47] employed meta-analysis to synthesize existing studies on user acceptance of consumer-oriented health information technologies. Similarly, Fan et al. [50] developed a meta-analytical framework to identify the core attributes and the general theoretical operating mechanism of AR/VR technologies in enhancing the tourism experience.
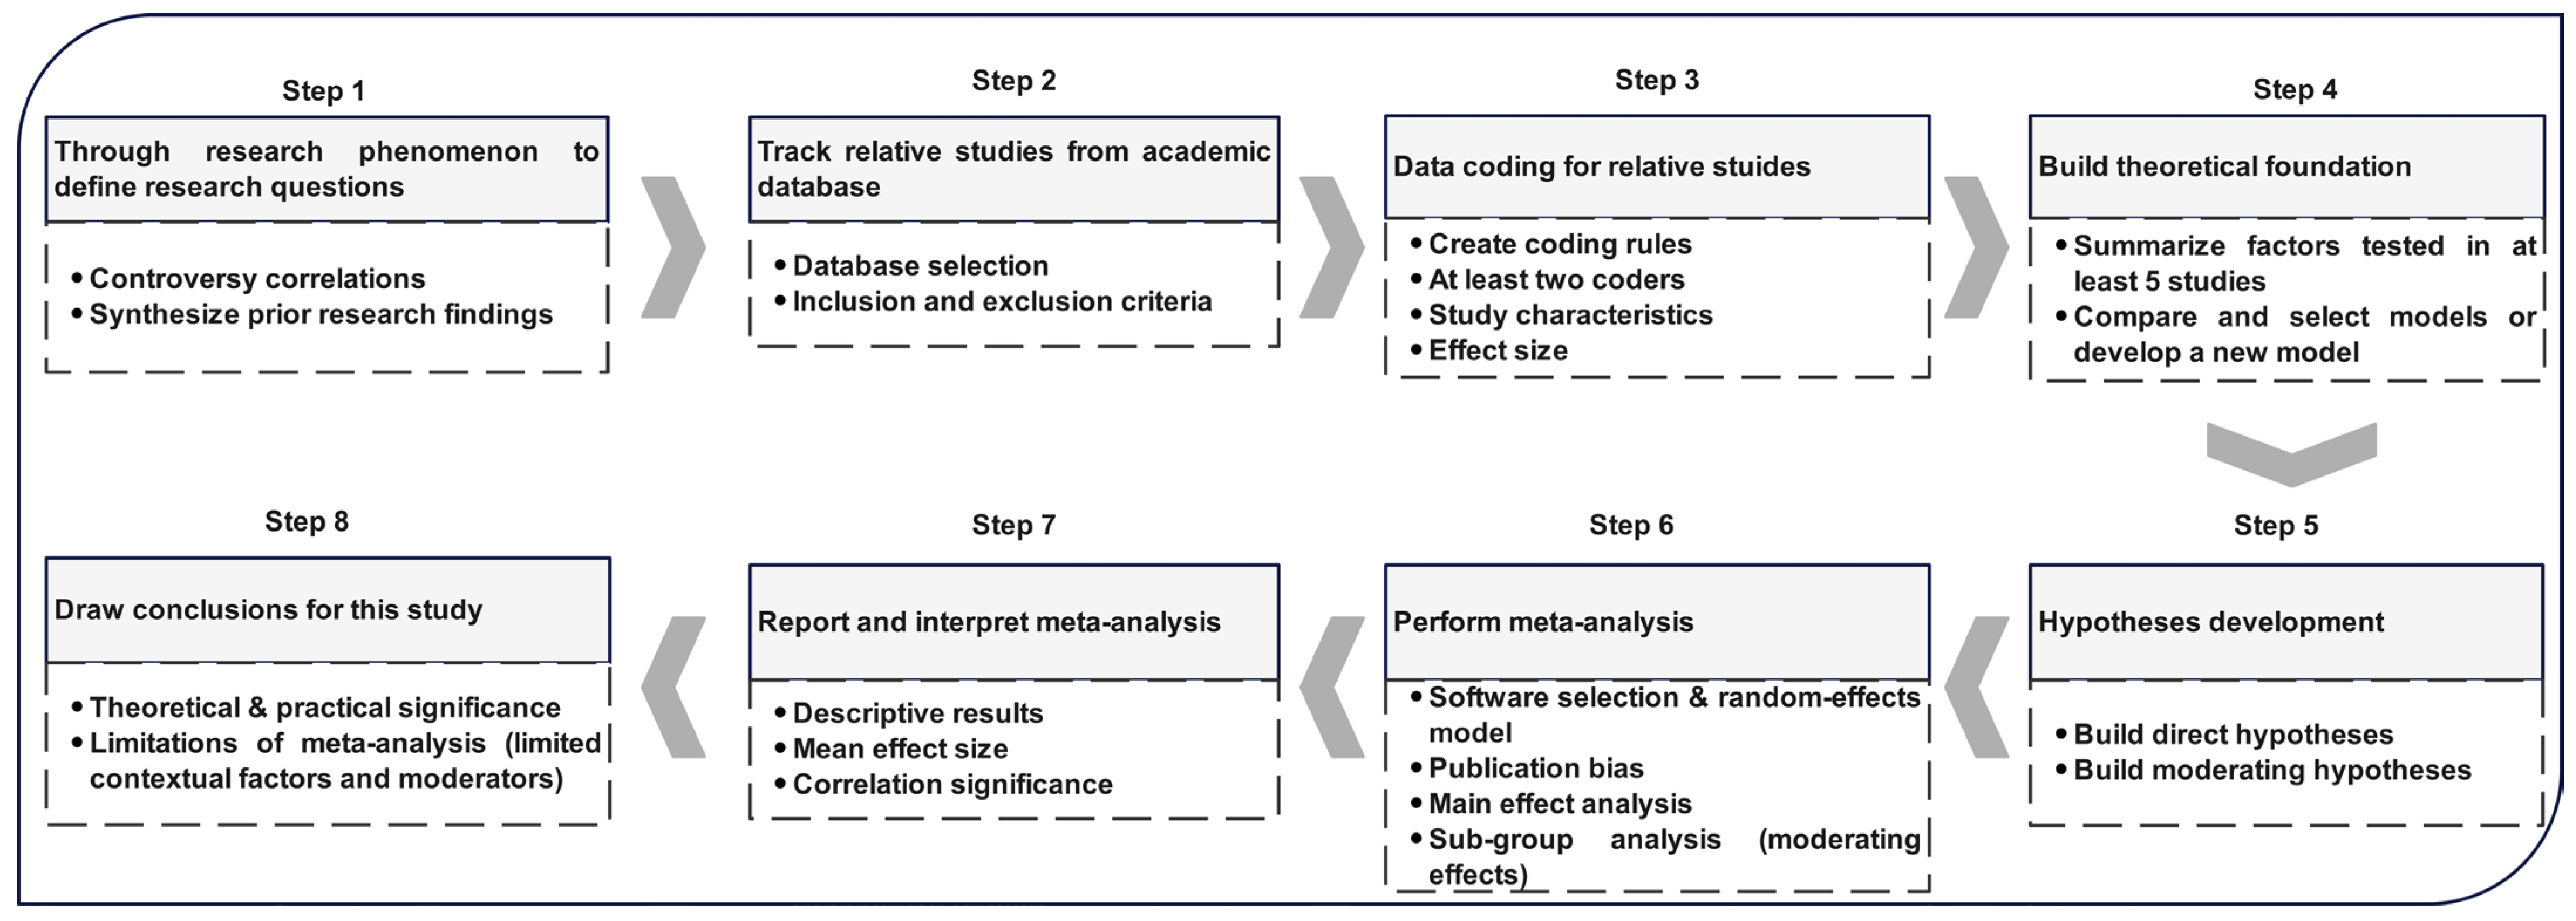
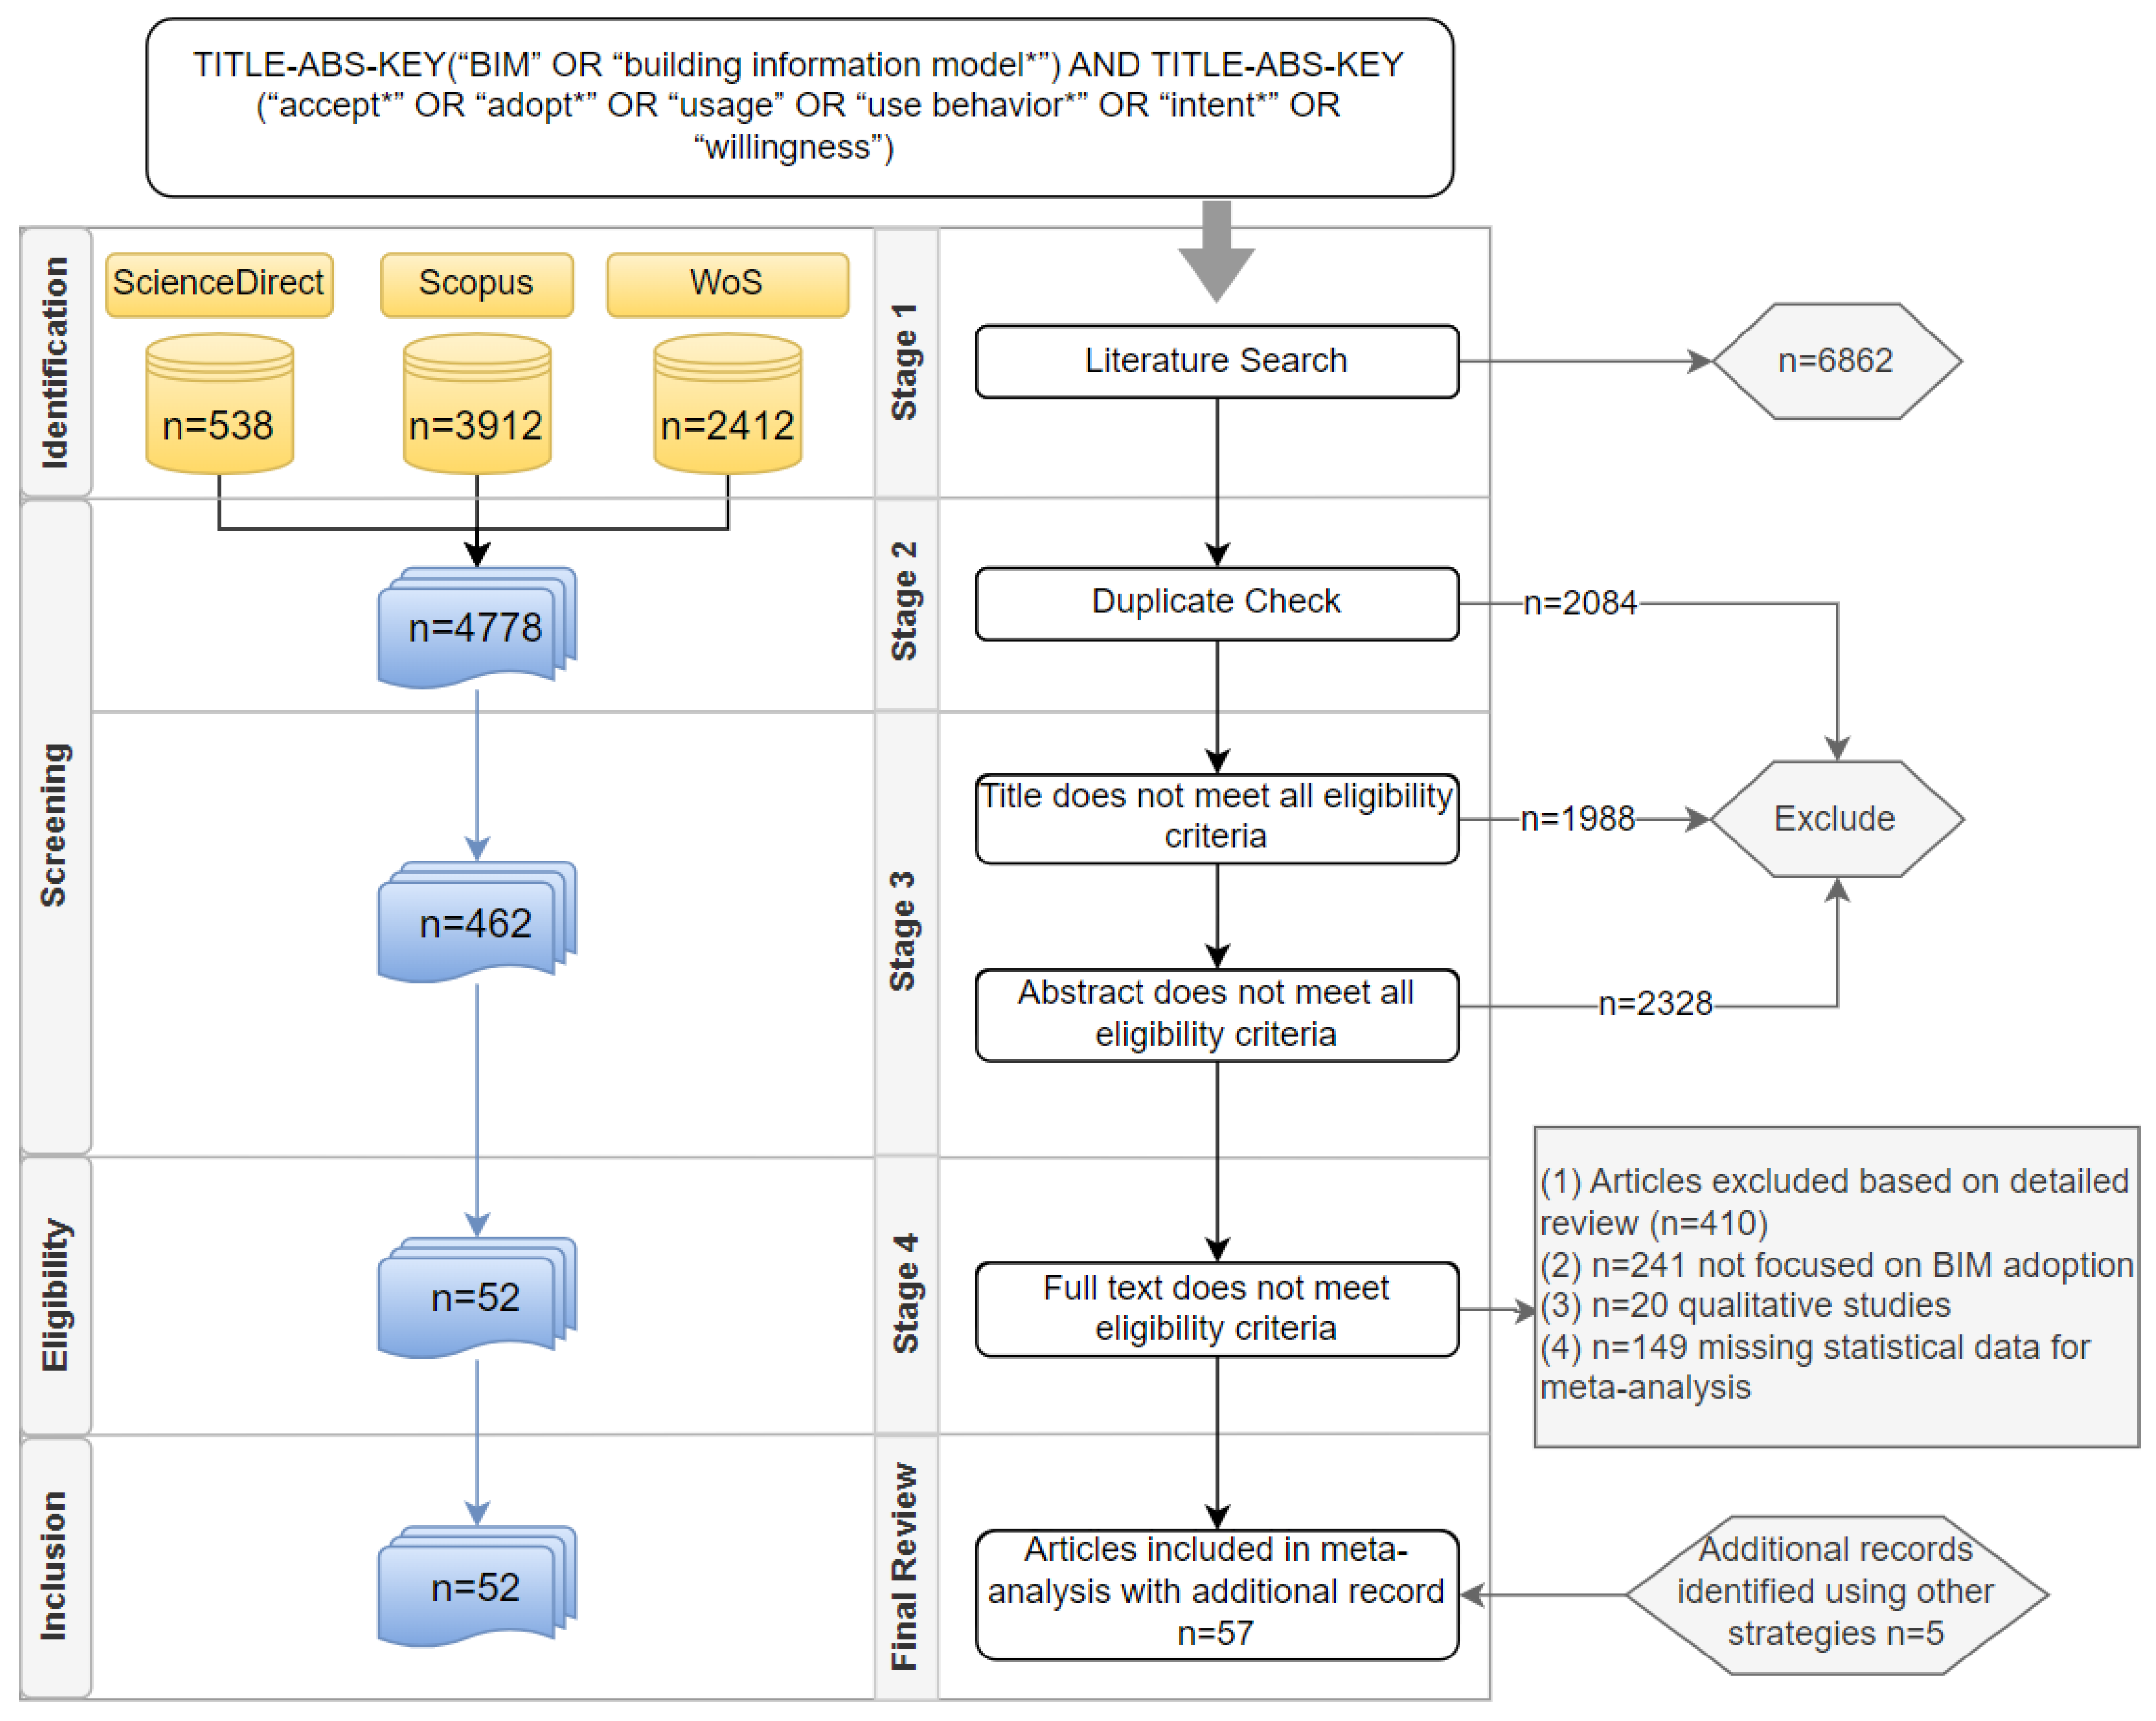
Drawing upon prior meta-analysis studies [15,46,47,51], the authors devised an eight-stage methodology, as depicted in Figure 1. These steps include (1) refining research questions, (2) identifying relevant studies from academic databases, (3) coding the selected studies, (4) constructing a conceptual model based on the most frequently tested factors, (5) formulating hypotheses, (6) executing the meta-analysis, (7) reporting and interpreting the results of the meta-analysis and moderator analysis, and (8) signifying the research significance and addressing methodological limitations. The detailed selection process will be expounded upon in Section 4.
Subsequently, 63 eligible studies were identified (see Table A1). To ensure data analysis consistency, the following criteria were rigorously adhered to for article selection:
  • The studies must have investigated BIM adoption or usage.
  • They must have tested at least one construct with obtainable effect sizes.
  • Full reporting of study findings was required.
  • The articles had to be written in English.
  • Only full-text articles were included.
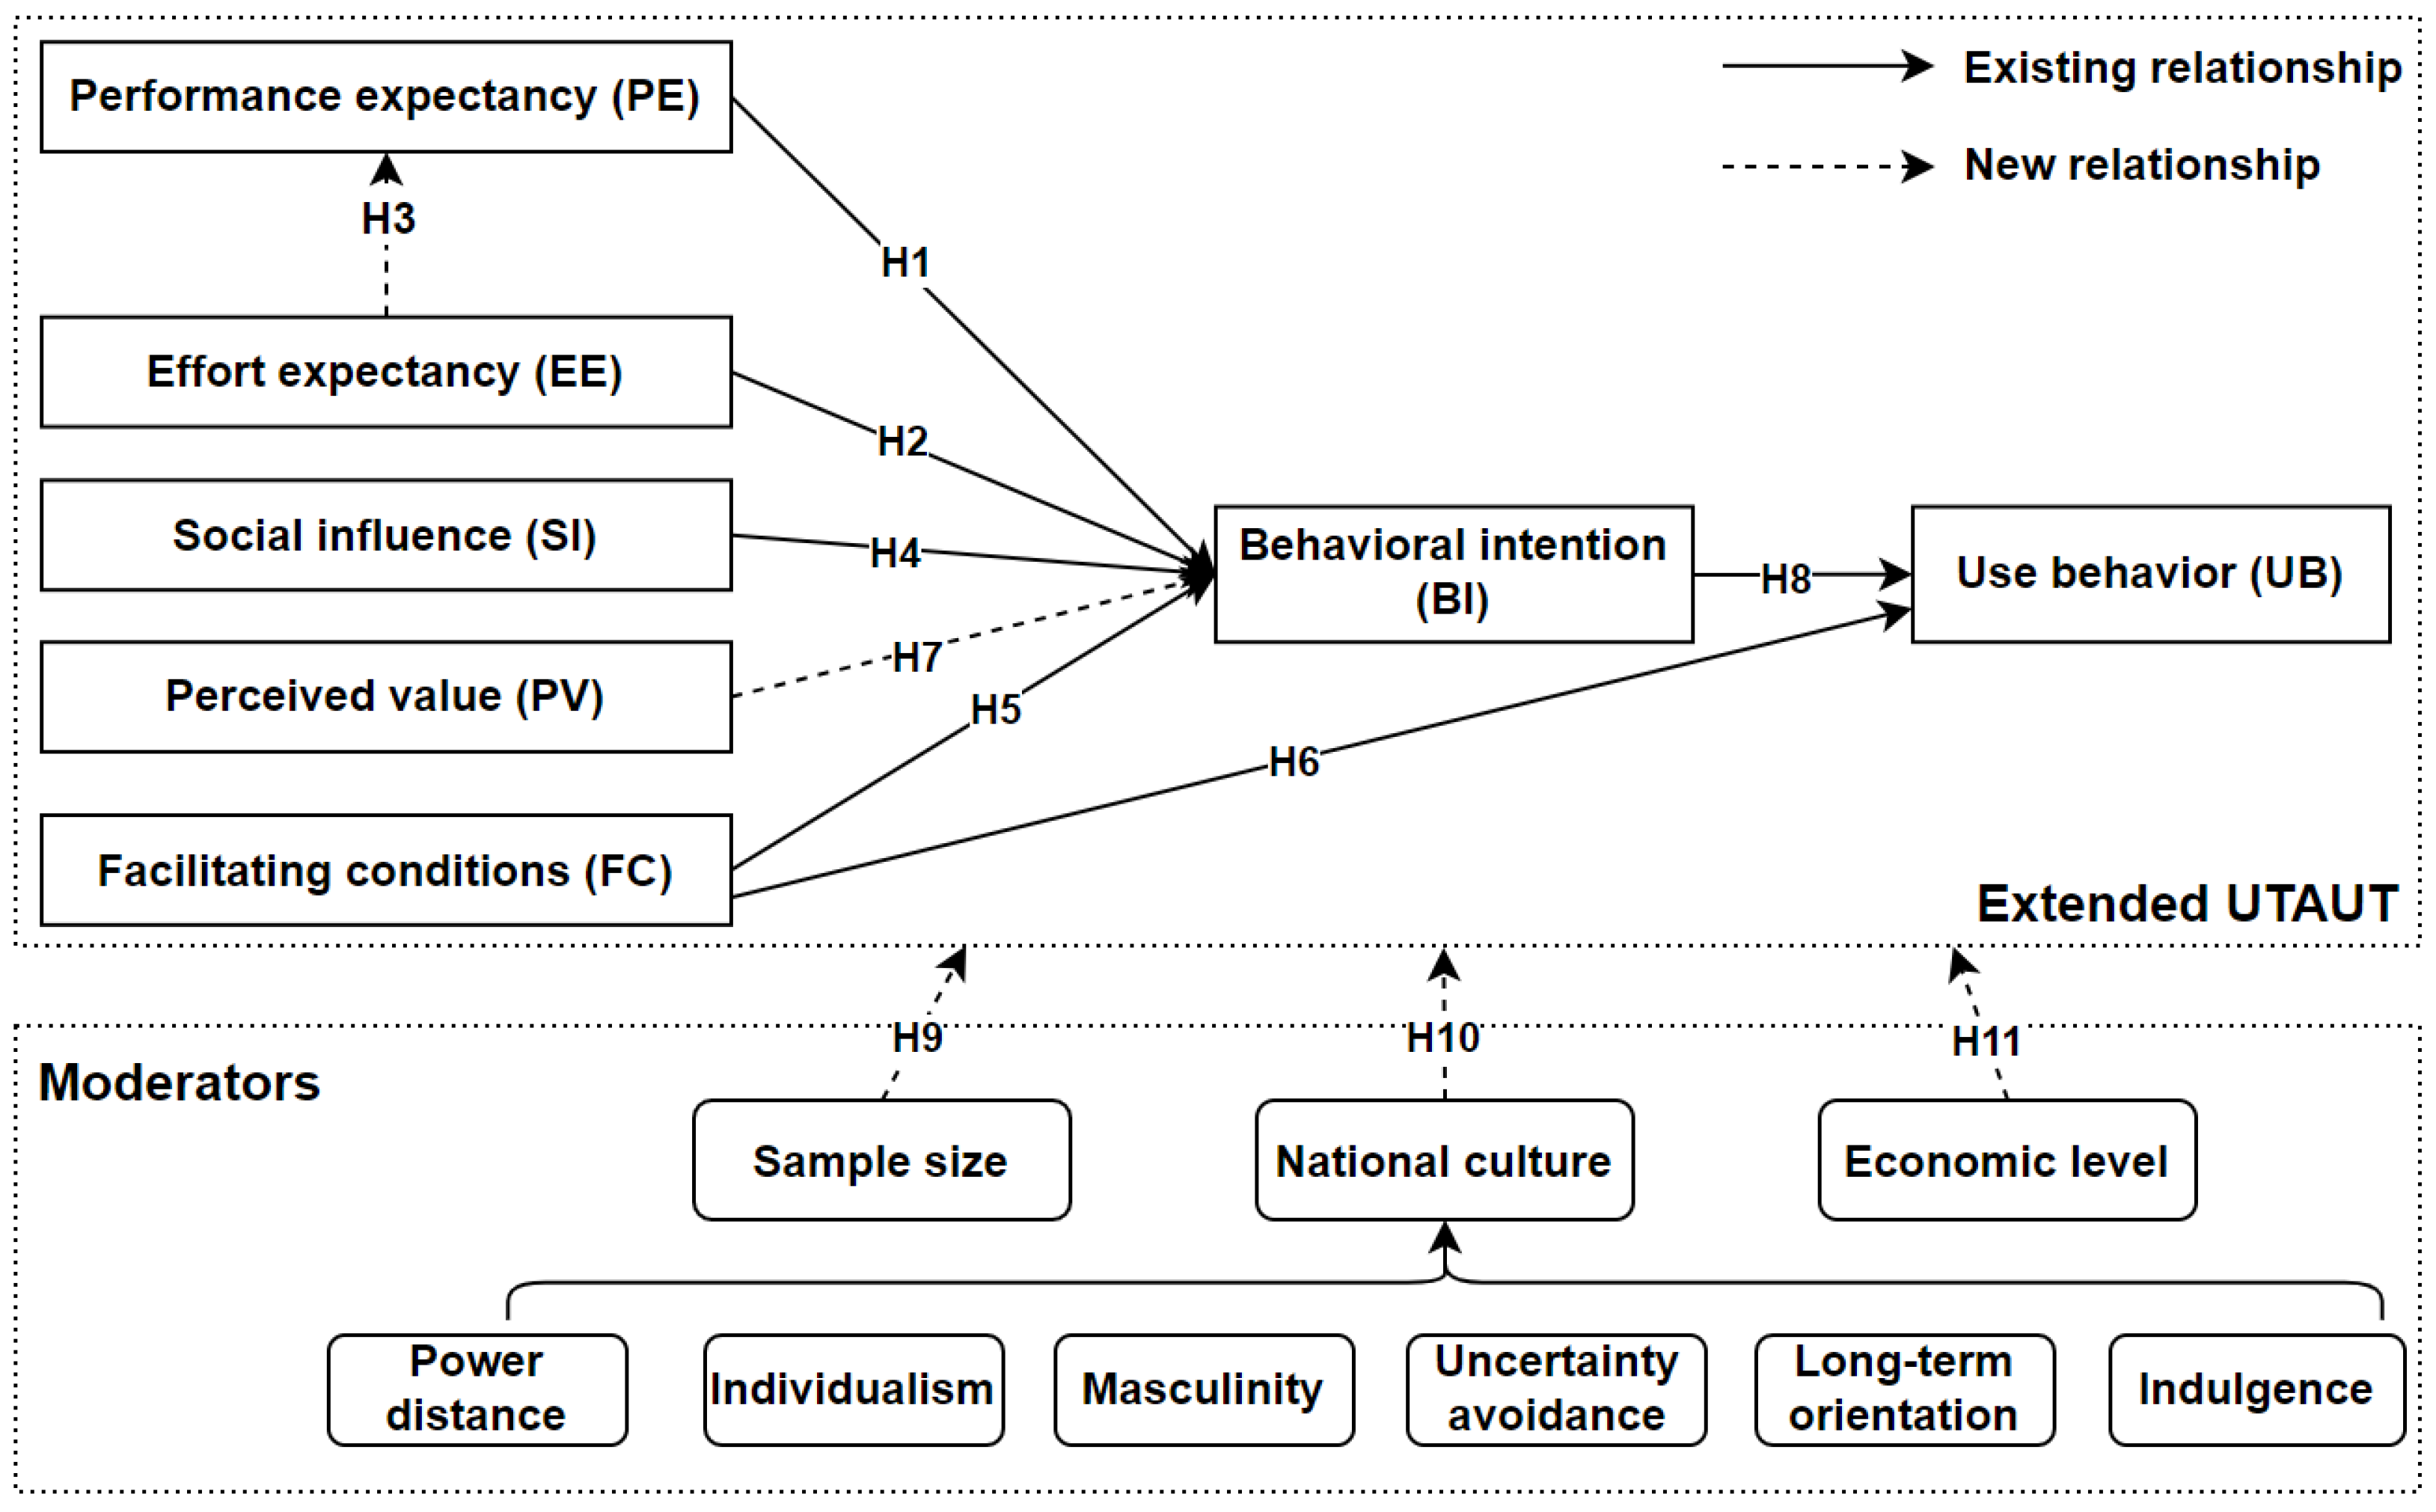
Following the identification of valid studies, the authors conducted a factor analysis to identify the most frequently occurring factors associated with significant outcomes. To ensure the robustness of the relationship between these factors and behavioral intention, a criterion that required a minimum of five studies to have tested this relationship was employed. In total, 27 factors across the 63 studies were examined. Among them, only five factors—performance expectancy, effort expectancy, social influence, facilitating conditions, and perceived value—demonstrated a significant relationship with behavioral intention in at least five studies. Since the majority of these identified factors are related to UTAUT, this study aims to propose an extended UTAUT model for BIM adoption by incorporating these significant factors.
Moderators play a crucial role in shedding light on the contextual factors impacting the technologies under study. While some moderators, such as user age, technology experience, and voluntariness of usage, have received attention in technology acceptance literature, others have been relatively neglected. Notably, moderators comparing different technologies across countries are often challenging to test in primary studies, despite indications of country and technology differences in the literature. Meta-analysis, by aggregating data from diverse countries and contexts, offers the opportunity to examine these less-explored moderators and contribute to theory development. In this meta-analysis, the authors propose three significant groups of moderators that enhance our understanding of BIM acceptance in the construction industry: (1) sample size, (2) economic level, and (3) national culture.
Overall, this meta-analysis contributes to the existing literature by: (a) synthesizing the UTAUT for construction practitioner samples, (b) clarifying some inconsistent findings regarding certain effects within the UTAUT, (c) quantifying and expanding variation in the UTAUT structural parameters to identify possible determinants that may require further, perhaps experimental studies, (d) identifying moderating variables of UTAUT relations not yet examined in detail, and ultimately, (e) indicating future research directions. Despite the variety of constructs in the existing literature, we focused on a common set of core constructs, irrespective of whether studies included additional constructs. Our primary aim was to synthesize evidence surrounding the structural relations among the core constructs and the impacts of potential moderators.

3. Research Model and Hypotheses Development

An extensive literature review identified performance expectancy, effort expectancy, social influence, facilitating conditions, and perceived value as the primary factors influencing BIM adoption. The study posits that BIM users’ behavioral intention is influenced by these identified factors and formulates hypotheses. The study also explores the impact of moderators such as sample size, economic level, and national culture. The proposed conceptual model is presented in Figure 2. The subsequent section on hypothesis development establishes the relationships among all variables in the proposed model, providing context for the examination of BIM adoption among construction practitioners.

3.1. Main Effects

Performance expectancy (PE) refers to “an individual’s belief that using a particular system or technology will enhance their job performance” [27]. Within the context of BIM adoption, performance expectancy is associated with the anticipated benefits derived from BIM usage, such as improved collaboration, better visualization, and increased efficiency [2]. Previous research conducted in the field of BIM adoption has consistently demonstrated a positive relationship between performance expectancy and behavioral intention, as evidenced by studies conducted by Nguyen et al. [20] and Xue et al. [10] among others. This construct pertains to extrinsic motivation, as it emphasizes the utilitarian value that BIM can offer. Practitioners tend to rationally assess the advantages and amenities offered by BIM before embracing it, and they are more prone to adopt it if it is deemed as convenient and constructive and improves performance. Therefore, practitioners’ intentions to use BIM are anticipated to be elevated when they perceive a higher degree of performance expectancy.
Hypothesis 1 (H1).
Performance expectancy has a positive impact on the intention to use BIM.
Effort expectancy (EE) of a system is defined as “the degree of ease of technology adoption, and it pertains to the level of simplicity involved in its use” [27]. If technology is user-friendly, it diminishes individuals’ anxiety linked to technological intricacy, thereby rendering them more likely to utilize it extensively. In the context of BIM adoption, construction practitioners usually weigh the cognitive exchange between the advantages provided by BIM and the exertion required to use it. Previous empirical investigations provide evidence for the substantial influence of effort expectancy on the disposition to utilize BIM, as exemplified in studies executed by Bataresh et al. [52] and Wang et al. [53]. Practitioners’ intention to utilize BIM is more likely to increase when they believe it requires less effort to use BIM. Additionally, consistent with the UTAUT, effort expectancy directly impacts performance expectancy [27]. This relationship suggests that the perceived benefits of a technology increase when it is easier to use. Previous studies have explored this relationship and demonstrated the influence of the ease of BIM adoption on practitioners’ perception of its usefulness and benefits.
Hypothesis 2 (H2).
Effort expectancy has a positive impact on the intention to use BIM.
Hypothesis 3 (H3).
Effort expectancy has a positive impact on the performance expectancy.
In the context of adopting BIM, social influence (SI) is conceptualized as “the perception of an individual’s companions, such as colleagues, peers, and friends, where they believe that an individual should use BIM” [27]. The perspectives of others might leave an enormous impact on an individual’s decision-making process, mainly when confronted with uncertainty, risk, and anxiety linked to new technology use. Prior research recognized the significant influence of social influence on the intention to utilize technology [54,55]. In the context of BIM adoption, social influence can be defined as the extent to which practitioners value the opinions of others regarding the adoption of BIM. Consequently, a positive impact on practitioners’ intention to use BIM is anticipated due to the influence of social factors.
Hypothesis 4 (H4).
Social influence has a positive impact on the intention to use BIM.
Facilitating conditions (FC) pertain to “an individual’s perception of the sufficiency and accessibility of organizational and technical infrastructures to support system use” [27]. In this study, facilitating conditions exemplify the presence of resources and infrastructures to utilize BIM, including hardware and software, dependable connectivity, internet access, and adept personnel. Researchers recognize that access to technical resources, tools, and support is pivotal in stimulating technology adoption. Previous studies have demonstrated a positive impact of facilitating conditions on practitioners’ intention to adopt technology [25,52,56]. Furthermore, as observed by Hooda et al. [55], use behavior may be less probable to occur if there are obstacles beyond intentions. Therefore, facilitating conditions may be critical in prompting practitioners to use BIM by ensuring a suitable environment and necessary resources.
Hypothesis 5 (H5).
Facilitating conditions has a positive impact on the intention to use BIM.
Hypothesis 6 (H6).
Facilitating conditions has a positive impact on BIM use behavior.
Incorporating the new component, perceived value (PV), into the UTAUT framework in this study is motivated by the need to evaluate the trade-off between perceived benefits and the associated monetary costs of using a technology. Perceived value, as defined by Venkatesh et al. [57], involves an individual’s cognitive assessment of this trade-off, encompassing factors such as staff and space requirements, training, and hardware and software costs [58]. Aiginger and Vogel [59] emphasize the significant roles played by both actual costs and intangible efforts in influencing the acceptance of newly introduced technologies and systems. The theoretical foundation of perceived value revolves around comparing the total ownership cost of a new technology with that of an existing system. When the perceived benefits of using new technological innovations outweigh the costs, perceived value positively impacts behavioral intention [57]. In the context of BIM adoption, practitioners typically conduct a thorough assessment by comparing various attributes of BIM with the costs associated with their previous tools. When practitioners perceive the value of transitioning to BIM as high, they are more inclined to adopt it and exhibit lower resistance, as suggested by Samuelson and Zeckhauser [60].
Hypothesis 7 (H7).
Perceived value has a positive effect on the intention to use BIM.
Furthermore, the use behavior is considered as the ultimate outcome in both the TAM and UTAUT. Intention to use represents an individual’s cognitive state immediately prior to adopting the technology of interest. It is broadly acknowledged that an individual’s intention to perform a specific behavior affects the probability of its actual execution. In the context of BIM usage, the intention to use indicates the extent to which a practitioner has purposefully intended to adopt BIM. The correlation between behavioral intention and technology use behavior has been substantiated in earlier studies in various technological domains [18,40], and it is anticipated to persist in the context of BIM.
Hypothesis 8 (H8).
Intention to use BIM has a positive effect on BIM use behavior.

3.2. Moderating Effects

In the literature on BIM adoption, some prior studies [61,62,63] employed relatively small sample sizes (e.g., n = 63–102), while others [3,29,40] used large sample sizes (e.g., n = 453–818). Hence, it is imperative to explore whether methodological attributes, such as sample size, could affect the causal relationships investigated in these empirical studies. Jadil et al. [46] conducted a meta-analysis that bifurcated the involved studies into two sub-groups according to sample size and investigated whether sample size, as a methodological feature, had any impact on the suggested relationships in their proposed model. Their findings highlight that facilitating conditions had a less pronounced effect on behavioral intention in studies with large sample sizes. Against this backdrop, the current study strives to scrutinize the moderating impact of sample size on the relationships in the BIM adoption literature.
Hypothesis 9 (H9).
Sample size moderates the relationship between antecedents and consequences of BIM adoption.
National culture could significantly influence practitioners’ intention to adopt BIM and should thus be considered an important contextual factor. National culture refers to collective mental programming that distinguishes people of different nationalities from one another. The cultural values framework, established by Hofstede and colleagues [64], is considered a leading approach for understanding cross-cultural research on managerial and organizational issues and has been widely employed in research over the past few decades. According to Hofstede et al. [64], national culture shapes behavior, beliefs, and technology adoption levels. Empirical evidence from the IS adoption literature extensively employs Hofstede’s cultural framework. For instance, Khan [65] utilized Hofstede’s framework to assess the moderating role of five cultural dimensions on the relationship between customers’ intentions and usage behavior in digital banking. Similarly, a meta-analysis by Vos and Boonstra [66] examined the moderating effects of five dimensions of national culture on enterprise system adoption. However, a dearth of studies has considered cultural values in the construction sector when investigating technology acceptance. In an effort to bridge this disparity, the present study delves into the influence of cultural values on the acceptance of BIM among construction practitioners.
In the model proposed by Hofstede et al. [64], national culture can be analyzed based on six dimensions. The first dimension—power distance—reflects the extent to which individuals in a society tolerate inequality. Individuals with high power distance tend to comply with their superiors and do not voice disagreement. The second dimension—individualism versus collectivism—defines the correlation between an individual and the collective in a community. Individuals who rank low on individualism tend to prioritize group decisions and have a strong sense of belonging. The third dimension—femininity versus masculinity—highlights gender differences in society, with masculine societies being driven by competition and achievement, while feminine cultures value caring and quality of life. The fourth dimension—uncertainty avoidance—reflects a society’s tolerance for ambiguity, with high scores indicating a preference for avoiding uncertainty. The fifth dimension—short-term versus long-term orientation—reflects the values and beliefs of society about the past, present, and future. Societies with a low score prioritize long-lasting and traditional values, whereas those with high score embrace new changes. Finally, the sixth dimension—indulgence-oriented versus restraint-oriented culture—describes the importance placed on personal happiness, well-being, freedom, and leisure time in indulgent cultures. In contrast, restrained cultures tend not to express positive emotions and do not prioritize freedom and leisure time. Cultural factors are believed to reflect individual values that shape behavior and may notably influence individuals’ intentions to adopt BIM.
Hypothesis 10 (H10).
National culture moderates the relationship between antecedents and consequences of BIM adoption.
In addition to national culture, the level of the economy can also influence the adoption of BIM. Prior research on BIM acceptance has been conducted in both developed economies [6,13,67], such as Australia, and developing economies [21,68,69], such as Malaysia. The level of economic development in a country can promote different levels of innovative practices, which could impact technology acceptance differently. A comparative analysis was conducted by Malaquias and Hwang [70] to test the factors that determine the acceptance of mobile banking among participants from Brazil and the United States. According to the study findings, social influence proves to be a statistically significant factor in Brazil, whereas such influence lacks statistical significance among participants from the United States. Despite prior research efforts, the impact of the economic level on mobile banking adoption remains underexplored. Thus, the authors aimed to investigate the potential role of economic status in explaining the inconsistencies observed in prior empirical research. Overall, the study offers valuable insights into the factors that shape mobile banking adoption and underscores the need to factor in country-specific disparities in mobile banking services’ design. Therefore, the current study hypothesize that the economic level may have moderating impacts on the relationships in the BIM adoption literature.
Hypothesis 11 (H11).
Economic level moderates the relationship between antecedents and consequences of BIM adoption.

4. Materials and Methods

4.1. Study Retrieval and Selection

Following the steps outlined in Figure 1, the selection process involved identifying relevant search terms to efficiently retrieve empirical studies related to BIM adoption. To ensure comprehensive coverage and minimize the risk of overlooking relevant research, the authors adopted a broad search strategy that combined keywords and controlled vocabulary. Specifically, the search strategy comprised two sets of terms, one related to BIM (e.g., 3D modeling, building information modelling, building information modeling) and the other to technology adoption (e.g., acceptance, adoption, behavior, intention, willingness). The authors used the advanced search function with all search terms as mandatory in the ‘Title, Abstract, or Keywords’ field to comprehensively identify potential studies across three databases (Science Direct, Scopus, and Web of Science). There were no restrictions on publication dates or types. The search was conducted on 31 December 2023.
In the subsequent stage, relevant articles were extracted through consultation with previous systematic reviews. Concomitantly, the authors manually searched prominent journals within the domain, namely the Journal of Management in Engineering, Automation in Construction, Engineering Construction and Architectural Management, International Journal of Project Management, and Journal of Construction Engineering and Management. To identify any overlooked papers, a snowball search was conducted whereby the authors conducted a review of the reference lists of the chosen articles.
The study selection process adheres to the Preferred Reporting Items for Systematic Reviews and Meta-Analysis (PRISMA) guidelines, which are illustrated in Figure 3. The comprehensive search across all potential databases generated a total of 6862 records. After eliminating duplicates, 4778 unique records remained. The titles and abstracts of these records were screened to ensure that they met the primary criterion of focusing on BIM adoption. At this stage, 4316 records were deemed ineligible and excluded. The full text of the remaining 462 records was meticulously assessed using four inclusion criteria. Firstly, studies were required to empirically investigate the behavioral intention of construction practitioners toward BIM acceptance, with other contexts, such as BIM learning behavioral for students, being excluded (e.g., [71]). Secondly, only studies that investigated at least one bivariate relationship between the antecedents and consequences of BIM adoption, predominantly focusing on UTAUT constructs or related variables, were eligible for inclusion in the meta-analysis. Thirdly, the studies were required to report sample size and statistical information, which could be utilized to calculate the effect size. Lastly, the studies were restricted to peer-reviewed scientific articles that were written in English.
Additionally, certain studies were excluded from the meta-analysis to ensure data independence and prevent duplication, including those conducted by Lee et al. [72]. Furthermore, if an article included the results of multiple independent studies, each study was treated as a separate entity for analysis purposes. For instance, Lee and Yu [23] presented independent findings on BIM adoption from two distinct countries (Korea and the United States), which were analyzed as separate studies. Following a meticulous application of the inclusion and exclusion criteria, the authors identified 57 articles, comprising 63 studies that satisfied the final inclusion criteria and underwent rigorous coding and data extraction procedures.

4.2. Study Coding

To extract meaningful insights from the studies, the authors performed coding for descriptive details. The general information extracted included author names, publication year, sample size, mean age, gender distribution, BIM experience, geographical location, and employed theories (see Table A1). Subsequently, the focus was directed exclusively toward empirical studies, with correlations serving as the primary effect size measure for this meta-analysis. The correlation coefficient, being scale-independent and unaffected by other variables, was utilized. In instances where correlation coefficients were unavailable, the authors coded data that could be employed to compute these coefficients, such as beta coefficients, t-values, and standardized regression coefficients [42,44]. Following the recommendation by Schmidt and Oh [73], only bivariate relationships that have been examined in five or more studies were included in the meta-analysis. In this vein, antecedents and consequences that were supported by fewer than five relevant studies were excluded from the analysis to mitigate the possibility of sampling errors. Moreover, some attributes are defined differently in some studies with similar conceptualizations and definitions for the proposed variables, combined into a single factor, as demonstrated in Table 1. For example, perceived usefulness, benefits, and relative advantage were considered performance expectancy [22]. Similarly, subjective norm, social factors, social norms, and normative influence were categorized as social influence [10].
In relation to the potential moderators, the authors classified them into distinct subgroups. The sample size was divided into large versus small studies, drawing from the classification system used by Jadil et al. [46]. The economic level was categorized into developed and developing economies based on the United Nations’ [74] classification system. Furthermore, the six dimensions of Hofstede et al.’s [64] national culture framework, which encompass small power distance versus large power distance, individualism versus collectivism, masculinity versus femininity, weak uncertainty avoidance versus high uncertainty avoidance, short-term orientation versus long-term orientation, and indulgence versus restraint, were encoded according to the regions from which the data were sourced in selected studies. Cultural scores for the 14 countries analyzed were obtained from either www.geerthofstede.com or www.hofstede-insights.com (accessed on 1 February 2024). Mean values for each cultural dimension were calculated, and a threshold value closest to the mean was identified (see Table 2). Due to insufficient sample size, several interested moderators could not be involved in this meta-analysis, for example, age, BIM experience, gender, position, and company size. Future research on BIM acceptance is encouraged to consider the above-mentioned moderators.
In applying the above coding processes, when the authors experienced any disagreements, discussions were held until a consensus was reached, rendering the results of the meta-analysis more accurate [75]. Table 2 provides details of the moderator classification.

4.3. Meta-Analysis

Employing the standard meta-analysis procedure, the present study aimed to synthesize the effect sizes found in 63 studies on BIM acceptance literature. The Comprehensive Meta-Analysis (CMA) 4.0 program was utilized for this purpose.
In the literature on meta-analysis, two major statistical models, namely the fixed-effect model and the random-effects model, are widely employed to assess the summary effect. The former model assumes a uniform effect size for all empirical research studies included in the meta-analysis, while the latter model estimates the mean of the effect size distribution by positing that the true effect size varies across studies. Given the heterogeneity of BIM adoption studies with respect to diverse regions and varying sample sizes, the current study has employed a random-effects model.
According to Lipsey and Wilson [76], meta-analysis follows the calculation principle, where the effect size is standardized using the Fisher z-transformation formula—see Equation (1), where ri represents the observed correlation for the ith study. As the sample sizes of the included studies vary, the random-effects model was preferred to prevent the dominance of large studies in the statistical analysis.
Fisher   transformation   ( T ) = 0.5 × ln 1 + r i 1 r i
Subsequently, to derive an adjusted T value, the Fisher transformation value is weighted by the sample size of each study, which is calculated from Equation (2):
T ( adjusted ) = i = 1 k N i 3 T i = 1 k N i
where Ni is the sample size of the ith study, and T is the Fisher z-transformation.
Finally, the overall effect size (r) is calculated from Equation (3):
r = e 2 T ( adjusted ) 1 e 2 T ( adjusted ) + 1
To assess the presence of heterogeneity among the correlations derived from the selected studies, we conducted a homogeneity test using Cochran’s Q statistics and the I2 estimate. Significance of all Q statistics and I2 estimates exceeding 75% suggests rejection of the homogeneity hypothesis for the studies [73]. Heterogeneity was deemed significant for a p-value of the Q statistic < 0.10 and I2 > 50% [73]. The I2 statistic represents the percentage of variation attributed to heterogeneity and offers straightforward interpretation. A value of 25–50% indicates low heterogeneity, 50–75% denotes moderate heterogeneity, and ≥75% indicates high heterogeneity. The Q statistics and I2 estimate can be calculated as per Equations (4)–(6):
Q = i = 1 k N i T 2 i = 1 k N i T 2 i = 1 k N i
I 2 = Q d f Q
d f = k 1
where df represents the degrees of freedom and k is the number of studies.
If there was heterogeneity, we performed sensitivity analysis to evaluate whether it substantially impacted the results of the meta-analysis. This involved excluding each study one by one and then recalculating the pooled estimates for the remaining studies to ensure minimal alteration of the results.
Furthermore, this study conducted a robustness check to evaluate the presence of publication bias, a potential source of bias in meta-analysis. Publication bias may occur when studies with significant results or larger effect sizes are more likely to be published compared to those reporting non-significant findings. Two methods were employed to assess publication bias. Firstly, Rosenthal’s fail-safe N (Nfs) value was calculated to determine the number of non-significant or unpublished studies required to diminish the average effect size to a negligible level. It was considered essential for the Nfs value to exceed 5k + 10 to ensure the robustness of the findings [15,43,77]. Secondly, publication bias was evaluated using funnel plot analysis and Egger’s test of asymmetry [46,73]. The shapes of the funnel plots did not indicate obvious evidence of asymmetry, and all p values from Egger’s tests were above 0.05, providing statistical evidence of funnel plot symmetry.
Moderator analysis was carried out in this study to investigate the potential variables that may lead to heterogeneity in the results. This analysis was performed following the systematic methodology set forth by Griffeth et al. [78] in two stages. In the initial stage, the presence of moderating variables was verified by utilizing Q and I2 statistics. In the subsequent stage, a subgroup analysis was conducted to explore the potential moderating effects of sample size, economic level, and national culture on each of the eight causal paths in the conceptual model. Only bivariate relationships that were investigated in at least two studies by both groups were included in the examination, in line with the guidelines of Hunter and Schmidt [43]. The existence of a moderator was confirmed by a statistically significant between-group homogeneity statistic (QB), which delineated the proportion of variance in effect size ascribed to heterogeneity among studies.

4.4. Ethical Consideration

Since the study relied solely on collecting secondary data from previously published studies, ethical clearance was not required for the present study.

5. Results

5.1. Decriptive Statistics

This meta-analysis comprised 57 articles, covering 63 studies, all of which were published in the English language between the time frame of 2013 to 2023. As illustrated in Figure 4, the body of literature on BIM adoption by construction practitioners has demonstrated a gradual rise over the years. The sample sizes ranged from 30 to 818 participants, and the pooled sample size was 13,301. Table 3 depicts the summary statistics pertaining to the relationships between the antecedents of behavioral intention to adopt BIM. A considerable range of correlation coefficients for the same relationship was observed, indicating significant heterogeneity. For example, the correlation coefficients for the relationship between effort expectancy and performance expectancy varied from −0.551 to 0.917, and for perceived value and behavioral intention, they ranged from −0.080 to 0.638.
Furthermore, individual studies’ focus on specific relationships was not consistent. The performance expectancy and behavioral intention relationship were evaluated in 49 of 63 studies, the effort expectancy and behavioral intention link in 45, and the effort expectancy and performance expectancy link in 36. On the other hand, only 12 studies examined the facilitating conditions and use behavior relationship, and 10 tested the perceived value and behavioral intention association, out of 63 BIM adoption studies. The present study thoroughly examined all the relationships more than five times, indicating that the antecedents and consequences of the proposed model are widely used constructs in the literature on BIM adoption [79]. Thus, the reliability and validity of the proposed model are evaluated in investigating the determinants that influence the acceptance of BIM.
To ascertain the significance of each causal relationship, a weight analysis was performed by dividing the number of significant relationships by the total number of observations for each relationship. Such an approach allowed for a collective inference drawn for both significant and non-significant (conflicting) relationships. Relationships that exhibited a significance rate of less than 80% were regarded as inconsistent, based on the methodological guidance provided by Jeyaraj et al. [79]. In the study, the relationship between behavioral intention and use behavior (17 studies) and between facilitating conditions and use behavior (12 studies) were the dominant relationships, with significances of 88.24% and 83.33%, respectively. Of the 49 investigations, performance expectancy was a significant predictor of behavioral intention in 42 studies (87.76%). Additionally, 80.00% of studies confirmed a significant impact of social influence on behavior intention. With a weight larger than 0.80, these four constructs (i.e., behavioral intention, facilitating conditions, performance expectancy, and social influence) were identified as the best predictors for the developed model. However, the weight analysis also revealed inconsistent findings for the remaining four relationships. These inconsistencies were carefully considered in the meta-analysis.

5.2. Main Effect Analysis

The comprehensive outcomes of the meta-analysis encompassed Q statistics and their corresponding significance levels, I2 statistics, 95% confidence intervals (CIs), combined effect size, Z-values and their significance levels, and Nfs at p = 0.01 (Nfs.01). As no heterogeneity was observed among studies reporting theoretical scores, sensitivity analysis was not conducted. We utilized CMA 4.0 to generate a funnel plot, depicted in Figure 5. The absence of an inverted pyramid in the funnel plot and the relatively symmetrical distribution of studies suggest that publication bias is not a significant concern. Additionally, we calculated Nfs.01, representing the number of studies with non-significant results needed to overturn the corrected correlation effect size. Most relationships in our model displayed high Nfs.01 values (refer to Table 4), indicating that publication bias is unlikely to be a significant concern.
The findings validate all the associations in the research model (see Figure 6). The most dominant antecedent of BIM adoption intention is performance expectancy (H1: r = 0.504; p < 0.001), followed by social influence (H4: r = 0.429; p < 0.001), facilitating conditions (H5: r = 0.351; p < 0.001), effort expectancy (H2: r = 0.321; p < 0.001), and perceived value (H7: r = 0.191; p < 0.05). Furthermore, effort expectancy (H3: r = 0.381; p < 0.001) significantly influences performance expectancy. In terms of the drivers of use behavior in the BIM context, behavioral intention (H8: r = 0.575; p < 0.001) is identified as the most crucial antecedent of BIM adoption, followed by facilitating conditions (H6: r = 0.364; p < 0.001). The combined effect size reflects the potency of bivariate relationships between the constructs, explicated in line with the methodological benchmarks formulated by Cohen et al. [80]. According to their guidelines, a value ranging between 0.1 and 0.3 indicates a small effect, 0.3–0.5 denotes a moderate effect, and 0.5 confirms a large difference effect. Although some relationships exhibit small effects (H7), they remain significant at p = 0.05. Most significant relationships show moderate impacts (H2–H6), while H1 and H8 exhibit strong impacts.
The present study utilized the Q-test to determine the statistical significance of all relationships, which was corroborated by the heterogeneity analysis. I2 values exceeding the threshold of 75% indicated a high degree of heterogeneity across the conjectured relationships, ultimately resulting in adopting a random-effects model for main effect analysis. This finding corroborates the null hypothesis dismissal concerning homogeneity and the potential presence of moderating variables within BIM adoption studies, as specified in Schmidt and Hunter [73]. The authors also assessed publication bias to ensure the robustness of the meta-analysis findings. The results of the Nfs test demonstrated that all pairs of relationships passed the test at p = 0.01, providing further support for the reliability of the study’s conclusions.

5.3. Moderator Analysis

Table A2, Table A3, Table A4, Table A5, Table A6, Table A7, Table A8 and Table A9 reveal the results of subgroup analyses performed to identify potential moderating variables. Out of the tested variables, only two moderating effects were statistically significant (indicated in bold). Table A2 presents a significant QB statistic pertaining to the moderating impact of sample size on the relationship between facilitating conditions and use behavior (QB = 14.270; p < 0.001). This outcome implies that the linkage between facilitating conditions and use behavior is moderated by sample size. More specifically, the relationship demonstrates greater strength in studies characterized by small sample sizes (r = 0.512; p < 0.001) as opposed to those characterized by larger sample sizes (r = 0.218; p < 0.01).
While the economic level did not significantly moderate the hypothesized relationships, Table A3 reveals that the composite effect size in the subgroup of developing economies was higher than that in the subgroup of developed economies with respect to the correlations of PE-BI, SI-BI, PV-BI, FC-BI, and EE-PE. Conversely, the combined effect size in the subgroup of developed economies was greater than that in the subgroup of developing economies for the correlations of EE-BI, FC-UB, and BI-UB. As for national culture, the results show a stronger relationship between facilitating conditions and use behavior in individualistic cultures (r = 0.597; p < 0.001) compared to collectivist cultures (r = 0.306; p < 0.001).

6. Discussion and Implications

6.1. Key Findings

This study presents a comprehensive exploration of the complexities surrounding the antecedents of BIM adoption within the construction industry. This field has been characterized by a wide array of outcomes, often resulting in inconsistent findings. This inconsistency can be attributed to several factors, including the application of various theoretical perspectives, mixed results for the same relationships, and substantial variability in the degree of associations reported across different studies within the field of BIM adoption. As an illustrative example, consider the relationship between effort expectancy and behavioral intention concerning BIM adoption. Within the dataset comprising a total of 45 relationships, a heterogeneous pattern emerged: 27 relationships reported significant and positive relationships (60%), 2 exhibited significant and negative relationships (4%), 11 demonstrated non-significant but positive relationships (24%), and the remaining 5 showed non-significant and negative results (12%). This research aims to reconcile these inconsistencies systematically, offering a clarified perspective while assessing the relative significance of the underlying links between the antecedents of behavioral intention in the context of BIM adoption. This endeavor serves as a valuable contribution, not only advancing the IS theory but also enriching practical knowledge in the ongoing digital transformation era.
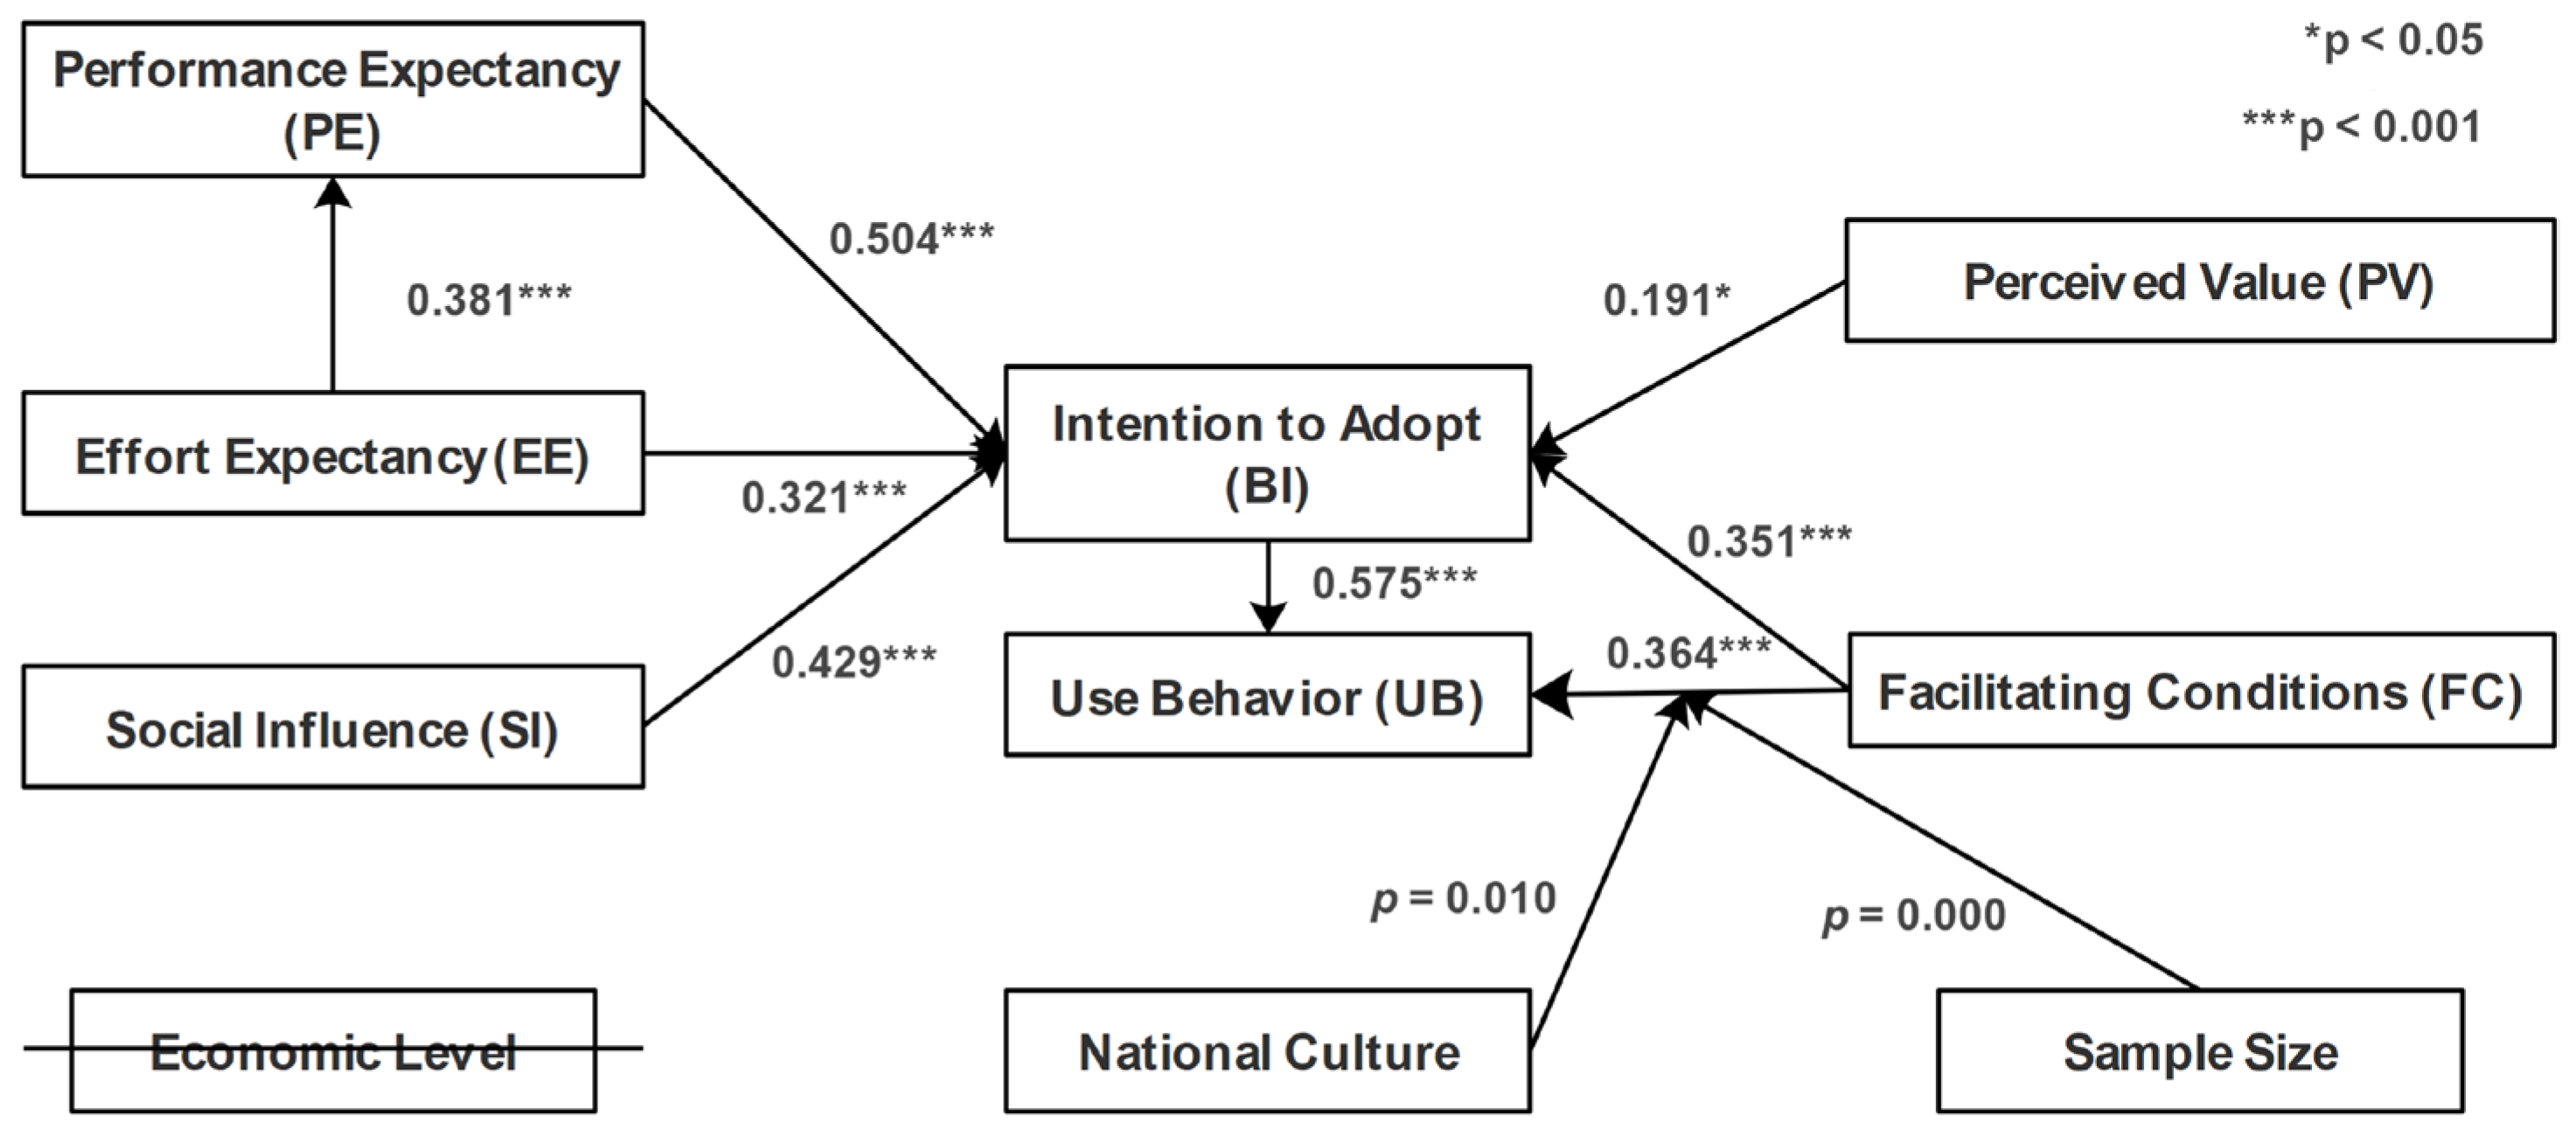
Crucially, the findings of this study corroborate the hypothesized relationships, providing a clearer understanding of the dynamics of BIM adoption within the construction industry. The research underscores the significant impact of performance expectancy on the behavioral intention to adopt BIM (H1). This implies that construction practitioners are more inclined to adopt BIM when they perceive it as advantageous for their operational needs. This discovery aligns with previous investigations by Xue et al. [10], who found a substantial correlation between performance expectancy and the intention to use BIM. The study establishes that effort expectancy plays a pivotal role in predicting behavioral intention concerning BIM adoption (H2). These results indicate that the simpler BIM is to learn and use for construction tasks, the higher the intention to engage with the technology. This conclusion resonates with the findings of Murguia et al. [17], which have emphasized the critical role of effort expectancy as a precursor to the intention to adopt BIM. Furthermore, the results suggest a favorable impact of effort expectancy on performance expectancy (H3). When BIM is user-friendly, practitioners can allocate more time and energy to accomplish their tasks, leading to heightened productivity. In addition, the investigation evinced that social influence constitutes a critical aspect in reinforcing behavioral intention (H4). More specifically, if an individual perceives that their acquaintances or colleagues consider it necessary to embrace BIM, the possibility of adoption intention is significantly amplified. This result aligns with prior studies by Belay et al. [24], Howard et al. [13], and Murguia et al. [22], who have established social influence’s primary role in determining BIM adoption.
The results reveal that facilitating conditions are a key driver of behavioral intention toward BIM adoption (H5). This finding is corroborated by prior research, which has highlighted that the intention to use BIM is strongly affected by the presence of facilitating conditions, including technical and organizational infrastructure [52,56,81]. Hence, practitioners who perceive that their organizations provide the necessary support for BIM usage are likely to exhibit a high level of intention to adopt the technology. In addition, the study highlights that facilitating conditions significantly shape BIM use behavior (H6), consistent with the claims of Gong et al. [82], who stated that the presence of facilitating conditions influences the decision to adopt BIM. Thus, as practitioners perceive greater support from BIM, their inclination to adopt the technology strengthens. The study additionally discloses that perceived value considerably affects the behavioral intention concerning BIM adoption (H7). Practitioners’ perception of the benefits of BIM motivates them to adopt the technology and influences their decision-making process. This is consistent with UTAUT2 [57] and other studies [22,83]. Finally, the study confirms a strong positive association between behavioral intention and use behavior (H8), indicating that behavioral intention is a critical factor in shaping practitioners’ use of BIM. This finding is in line with previous studies [40,84,85], suggesting that behavioral intention is a necessary precursor to practitioners’ use behavior toward BIM.
Furthermore, the comprehensive analysis conducted in this study has unveiled a significant degree of variability in effect sizes across a spectrum of research efforts dedicated to investigating BIM adoption. This variation becomes notably apparent when exploring the wide-ranging correlation coefficients observed, particularly within the domains of perceived value (ranging from −0.080 to 0.638) and the relationship between performance expectancy and behavioral intention (spanning from −0.105 to 0.852). These divergences underscore the imperative need to meticulously explore potential moderating factors that could clarify the observed disparities among these correlation coefficients. Consequently, this research embarked on a detailed examination of how factors such as sample size, national culture, and economic context exert influence over the direct relationships outlined within the research model.
The examination of these moderating variables has yielded valuable insights, shedding light on the intricate dynamics of BIM adoption. Firstly, the impact of sample size emerged as a significant moderating factor, particularly in the context of the relationship between facilitating conditions and usage behavior. Interestingly, this relationship exhibited greater robustness in studies characterized by smaller sample sizes when compared to those with larger samples. This compelling revelation aligns seamlessly with the findings of Jadil et al. [46], whose meta-analysis similarly identified more pronounced path relationships in studies characterized by smaller sample sizes. This reinforces the significance of accounting for sample size variations when examining the complexities of BIM adoption.
Secondly, the study explored the moderation exerted by national culture, revealing insightful patterns. Specifically, it was discerned that in cultures marked by lower power distance, effort expectancy emerged as a more influential predictor of behavioral intention concerning BIM adoption. In lower power distance culture, where individuals are more inclined to express their opinions and challenge existing norms, emphasizing the user-friendliness and ease of use of BIM tools can be an effective strategy to encourage adoption. However, it is important to note that the moderating effects of power distance on the relationships between effort expectancy and behavioral intention did not achieve statistical significance in studies conducted by Zhang et al. [86] and Cavalcanti et al. [45]. These findings emphasize the complex interplay between cultural dimensions and the dynamics of BIM adoption, underlining the necessity for a context-specific understanding of these relationships.
Furthermore, the investigation uncovered a robust and statistically significant relationship between facilitating conditions and usage behavior within individualistic cultures, aligning seamlessly with prior research conducted by Cavalcanti et al. [45]. In individualistic societies, individuals are more likely to make decisions independently and are often motivated by personal goals and preferences. Therefore, when they perceive that the necessary conditions, both technical and organizational, are in place to support the use of a technology like BIM, they are more inclined to engage with it actively. Nevertheless, it is noteworthy that the examination of the path relationships within the research model did not yield significant differences in terms of economic moderation. This outcome challenges the assumption put forth by Santini et al. [87] that an increase in economic development would inherently amplify the cumulative path coefficient of specific direct relationships. Instead, these findings are in line with the results of the meta-analytic study in Jadil et al. [46], which indicated non-significant moderating effects of economic level. Thus, they highlighted the intricate nature of the relationship between economic factors and BIM adoption, suggesting that other unexplored moderators may play pivotal roles in influencing these dynamics, which needs further efforts in BIM acceptance research.

6.2. Theoretical Implications

While recent years have witnessed increasing efforts to empirically investigate individual intentions and behaviors related to BIM adoption or acceptance, this study represents an exploratory effort to synthesize the factors leading to behaviors to BIM implementation in construction.
Performing a systematic review of existing empirical studies on BIM adoption, the present study identified the preeminent constructs, structured a comprehensive conceptual model founded on UTAUT, and assessed potential moderators and the research model according to meta-analytic principles. The BIM literature benefited from several prominent theoretical advancements resulting from the study.
Firstly, this study serves as a pioneering effort by providing the first comprehensive meta-analysis of the literature on BIM adoption. Given that the adoption of BIM is a relatively recent phenomenon, the lack of a systematic aggregation of empirical findings has been a notable gap in the literature. By quantitatively synthesizing the existing research, this study addresses this gap and offers a valuable resource for scholars and practitioners seeking a holistic understanding of the factors influencing BIM adoption. It offers a robustness test for existing findings and yields generalizable conclusions.
Secondly, through the systematic synthesis of empirical literature, this study identifies the most frequently studied antecedents related to practitioners’ intention to adopt BIM. This identification not only serves as a valuable reference for future researchers but also highlights the key determinants that deserve particular attention in the context of BIM adoption. Scholars can use this insight to inform the design of targeted interventions and strategies aimed at promoting BIM adoption within the construction industry.
Thirdly, based on the identified critical factors, this study extends the UTAUT model with perceived value and three moderators to encompass the most frequently studied constructs relevant to BIM adoption. This extension provides scholars with a comprehensive framework that aligns with the specific nuances of BIM adoption. By doing so, it facilitates a more tailored examination of the factors influencing BIM adoption, thereby enhancing the applicability of the model within the construction domain.
Fourthly, this study addresses the issue of inconsistent findings in the BIM adoption literature by explaining how various factors influence practitioners’ intentions to adopt and use BIM. One notable example of inconsistent findings in BIM adoption research pertains to the relationship between “effort expectancy” and “intention to adopt BIM.” While the theoretical underpinning suggests that an easier-to-use BIM system should lead to a higher intention to adopt, empirical studies have produced mixed results. Through a meta-analytic path analysis, the research identifies critical factors and their relative importance, shedding light on the complexity of the BIM adoption process. This deeper understanding enables scholars and practitioners to navigate the nuances of BIM adoption more effectively.
Lastly, in recognition of the variations in findings across studies, the study explores the moderating effects of sample size, national culture, and economic level. The impact of sample size emerged as a significant moderating factor, particularly in the context of the relationship between “facilitating conditions” and “use behavior.” Interestingly, this relationship exhibited greater robustness in studies characterized by smaller sample sizes when compared to those with larger samples. Scholars should be mindful of the sample size when interpreting the strength of this relationship. Also, power distance reflects the extent to which individuals in a society tolerate inequality and hierarchical structures. In cultures characterized by lower power distance, effort expectancy emerged as a more influential predictor of behavioral intention concerning BIM adoption. The study uncovered a robust and statistically significant relationship between “facilitating conditions” and “usage behavior” within individualistic cultures. In individualistic cultures, practitioners may perceive the support of their organizations as a crucial factor in making the transition to BIM. These moderators help explain the contextual nuances that contribute to inconsistencies in the literature. By considering these moderating factors, the study offers insights into why certain relationships between antecedents, intention to adopt BIM, and BIM use behavior may vary under different circumstances.

6.3. Practical Implications

This study offers practical insights for policymakers and organizations aiming to advance BIM adoption within the construction industry. It underscores the central role of behavioral intention in driving BIM acceptance, with performance expectancy emerging as the most influential factor. To enhance behavioral intention, organizations should emphasize the tangible benefits of BIM, such as increased project efficiency, reduced errors, and significant cost savings. This can be achieved through a multifaceted approach involving workshops, training sessions, and comprehensive awareness campaigns designed to educate practitioners about the specific advantages that BIM offers within their respective roles. Furthermore, presenting real-world examples and success stories that showcase how BIM has positively impacted similar projects can be particularly persuasive.
Effective communication of BIM’s merits is paramount. Organizations can consider establishing mentorship programs where experienced BIM users guide their peers through the adoption process. Sharing testimonials and comprehensive case studies within the organization can help reinforce the practical benefits of BIM. Additionally, the creation of an internal knowledge-sharing platform can facilitate peer-to-peer learning, allowing practitioners to exchange experiences and insights related to BIM.
Furthermore, this study underlines the role of social influence in strengthening BIM adoption. Practitioners are more likely to embrace BIM when they perceive that their colleagues value it. Cultivating a culture of innovation and embracing new technologies is essential. To this end, organizations should promote continuous learning by offering training opportunities related to BIM. Recognizing and rewarding innovative ideas can provide a powerful incentive for employees to explore and adopt new technologies like BIM. Open communication channels, such as forums or feedback mechanisms, can further facilitate knowledge exchange and collaboration. In cultures characterized by individualism, organizations can encourage practitioners to take ownership of their BIM journey by providing them with the necessary resources and support, thereby aligning with the values of self-reliance and autonomy.
Facilitating conditions significantly influence intentions and actual use of BIM. Practitioners are more motivated when they have access to the requisite resources, infrastructure, and support for effective BIM utilization. Organizations should consider investing in the infrastructure required for BIM, ensuring that practitioners have seamless access to the necessary tools and technology. Collaborating with software vendors to make BIM tools user-friendly and compatible with existing workflows can alleviate concerns and simplify the adoption process. Furthermore, providing ongoing technical support and readily available training resources can further promote the wider use of BIM.
Moreover, this meta-analysis aids practitioners in identifying moderators (e.g., sample size and cultural factors) that may explain differences in intervention effects. We found that these effects are moderated by one measurement factor (sample size) and one sample characteristic (national culture). Due to sample size limitations, bias may occur in individual studies that typically use questionnaires for BIM acceptance measurement. However, meta-analysis moves discussion beyond individual studies to provide a more precise estimate of relationship strength [42,50,75]. Therefore, meta-analysis offers a comprehensive understanding for construction organizations aiming to improve BIM use.
Specifically, organizations should recognize that intervention effects of the same factor may vary when considering contextualized facilitating conditions measures and different cultures (individualism vs. collectivism). In individualistic cultures, managers may emphasize personal skill development and career advancement opportunities associated with BIM adoption, ensuring individuals have access to BIM tools and technologies. In collectivistic cultures, managers may organize team-building exercises or social events to foster interpersonal relationships among construction teams, providing infrastructure support such as dedicated workstations and collaboration software to facilitate effective teamwork. Our research bridges construction technology and culture literature, prompting managers to consider cultural differences’ potential interference in demonstrating BIM adoption behavior among construction practitioners, particularly in the international construction industry’s dynamic and complex cultural environment.

6.4. Limitations and Avenues for Future Research

As with any individual-level meta-analysis, this research has inherent limitations that must be considered when interpreting the results and conclusions. One limitation is the availability of data and variables, as only those that were measured in past studies could be included in the analysis. In this study, quantitative articles in English that reported correlation coefficients and sample sizes were selected, which limited the insights gained to quantitative data. Additionally, only antecedents of behavioral intention investigated at least five times in the literature were included, leaving some potential predictors untested. For instance, competitive pressure [3,24], trust [39], client requirements [39,88,89], and perceived risks [56,90] were identified as underexplored factors that could impact behavioral intention toward BIM.
Another limitation is the possibility that other moderating variables could not be examined in the present study owing to inadequate sample sizes and different categories, which may justify the variation among the effect sizes in empirical BIM research. For example, organization type (e.g., public vs. private), firm size (e.g., small and medium-sized enterprises vs. large enterprises), sampling approach (e.g., random vs. purposive), and individual characteristics (e.g., age, gender, positions, and BIM experience) were not examined in this study. Scholars are encouraged to provide the participants’ profiles in their study. As shown in Table A1, most studies had not reported information about gender, age, and BIM experience. Future research could investigate these moderating variables to gain additional insights into the determinants influencing the intention to adopt BIM.
Additionally, the economic level was assessed using a macro-level approach, categorized into developed and developing economies based on the United Nations’ classification system in this meta-analysis. Evaluating the influence of specific economic factors (e.g., infrastructure investment, construction activity) on BIM adoption across different countries is essential. To classify countries as high or low in each cultural dimension, mean scores were calculated based on available scores of 104 countries. However, subgrouping of studies may be imprecise due to the absence of cultural data for the remaining 89 United Nations members. Therefore, efforts should be made to gather cultural scores for these countries for a more precise moderator analysis of culture in the future. Furthermore, this study exclusively utilized quantitative studies for meta-analyses and excluded qualitative studies. However, future studies could incorporate both qualitative and quantitative approaches for meta-analysis.

7. Conclusions

In recent years, there has been a significant increase in empirical research focusing on BIM adoption. However, despite this growth, the literature has presented contradictory and fragmented results concerning the effect sizes of critical antecedents on behavioral intention and use behavior. This study aimed to address this knowledge gap by conducting a meta-analysis of 63 studies from the BIM adoption literature. We utilized an extended UTAUT model, incorporating performance expectancy, effort expectancy, social influence, perceived value, and facilitating conditions, to provide a comprehensive understanding of the strength of the relationships between antecedents and usage behavior. Our findings indicate that BIM adoption is moderated by sample size and national culture (individualism vs. collectivism).
The significance and novelty of this study lie in its clarification of the conflicting relationships regarding BIM adoption through meta-analysis. The theoretical model validated in this study will guide researchers in selecting constructs for future research on BIM adoption. Insights from the moderator analysis on culture can assist practitioners in strategy formulation and contribute to multinational collaboration in BIM-enabled projects.

Author Contributions

Conceptualization, K.W.; methodology, K.W. and Y.S.; software, K.W. and M.G.; validation, K.W., M.G., L.D.S. and Y.S.; formal analysis, K.W. and M.G.; investigation, K.W., M.G., L.D.S. and Y.S.; resources, K.W. and Y.S.; data curation, K.W. and M.G.; writing—original draft preparation, K.W.; writing—review and editing, K.W., M.G., L.D.S. and Y.S.; visualization, K.W. All authors have read and agreed to the published version of the manuscript.

Funding

This research received no external funding.

Data Availability Statement

The data presented in this research are available upon request from the corresponding authors.

Acknowledgments

The authors would like to thank Fangyu Guo for proofreading the initial draft and Yuan Wang for data coding verification.

Conflicts of Interest

The authors declare no conflicts of interests.

Appendix A

Table A1. Profile of the papers used in meta-analysis.
No.AuthorArticle TypesSample SizeCountry of SampleInnovation IndexGender (% Males)Mean Age (Years)Mean BIM Experience (Years) Theories
1Zhao et al. [18]JA327China55.356.4836.285.69TAM & TOE
2Vigneshwar et al. [61]JA63India36.6n.r.n.r.n.r.TAM
3Xue et al. [10]JA153China55.358.82n.r.n.r.UTAUT
4Ahmed et al. [3]JA505Malaysia38.765.1029.97n.r.TOE
5Acquah et al. [26]JA125Ghana20.8n.r.n.r.n.r.TAM
6Addy et al. [21]JA73Ghana20.8n.r.33.69n.r.UTAUT2
7Ismail et al. [83]CP202Malaysia38.7n.r.n.r.n.r.IDT
8Ahmed and Kassem [67]JA177United Kingdom59.7n.r.n.r.n.r.IDT & TAM & INT
9Ahmed and Suliman [91]JA272Bahrain28.0n.r.n.r.n.r.None
10Ahuja et al. [39]JA184India36.6n.r.n.r.n.r.TOE
11Baharuddin et al. [28]CP204Malaysia38.7n.r.n.r.n.r.TAM
12Belay et al. [24]JA 1108; 93Ethiopia16.3n.r.n.r.n.r.TOE
13Chen et al. [88]JA321China55.3n.r.n.r.n.r.TOE
14Wang et al. [11]JA175China55.370.8630.292.49TAM & Equity theory
15Cui et al. [14]JA207China55.354.1135.98n.r.TAM & ECT
16Ding et al. [68]JA181China55.3n.r.n.r.n.r.None
17Hong et al. [16]JA111Korea57.8n.r.n.r.3.50TAM
18Hong et al. [56]JA1100; 100China55.3n.r.n.r.n.r.None
19Lin et al. [62]JA102China55.3n.r.n.r.n.r.TAM
20Ma et al. [69]JA151China55.378.1029.684.69ECT
21Murguia et al. [17]JA171Peru29.1n.r.n.r.n.r.UTAUT
22Murguia et al. [22]JA133Peru29.1n.r.n.r.1.86UTAUT
23Ngowtanasawan [92]JA278Thailand34.9n.r.n.r.n.r.None
24Nguyen et al. [20]JA154Vietnam34.2n.r.n.r.n.r.TAM & TPB
25Park et al. [29]JA818Korea57.892.7032.50n.r.TAM
26Sanchís-Pedregosa et al. [84]JA73Peru29.1n.r.n.r.n.r.TAM
27Semaan et al. [6]JA73United Kingdom59.7n.r.n.r.n.r.TAM
28Son et al. [93]JA162Korea 57.869.8032.81n.r.TAM & UTAUT
29Wang et al. [53]JA475China55.361.3031.751.61EST & IDT
30Yuan et al. [85]JA188China55.364.9026.643.03TAM & TOE
31Wu et al. [94]JA206China55.3n.r.n.r.n.r.TPB
32Zhang et al. [95]JA353China55.365.0038.906.61TAM
33Wen et al. [63]JA74China55.3n.r.n.r.n.r.TAM3
34Lai and Lee [38]JA63Malaysia38.753.97n.r.n.r.TAM
35Qin et al. [96]JA 1120; 204China; Malaysia55.3; 38.7n.r.n.r.n.r.TAM & TOE
36Hong et al. [97]CP40Australia47.1n.r.n.r.1.36None
37Howard et al. [13]JA84United Kingdom59.7n.r.n.r.n.r.UTAUT
38Kim et al. [98]JA303Korea57.8n.r.n.r.n.r.TAM & IDT
39Lee [99]JA46Korea57.8n.r.n.r.n.r.TAM
40Lee and Yu [100]JA109Korea57.8n.r.n.r.n.r.TAM
41Le et al. [40]CP453China55.3n.r.n.r.n.r.UTAUT
42Lee and Yu [23]JA 1114; 50Korea; United States57.8; 61.8n.r.n.r.n.r.TAM
43Hong et al. [90]JA80Australia47.1n.r.n.r.n.r.None
44Xu et al. [58]JA98China55.3n.r.n.r.n.r.TAM & IDT
45Wang and Song [101]JA118China55.375.4031.402.51TAM
46Ahmad et al. [102]CP30India36.6n.r.n.r.n.r.n.r.
47Bataresh et al. [52]CP177Australia47.1n.r.n.r.5.76UTAUT
48Murguia et al. [103]JA 1303; 171Peru29.1n.r.n.r.0.68; 1.16TAM
49Gong et al. [82]JA81China55.360.4930.28n.r.TAM & TPB
50Zhai and Pang [104]JA192China55.3n.r.n.r.n.r.TAM
51Li et al. [19]JA192China55.381.25n.r.1.74None
52Davies and Harty [105]JA762United Kingdom59.7n.r.n.r.n.r.UTAUT
53Kassem and Ahmed [7]JA177United Kingdom59.7n.r.n.r.n.r.IDT & TAM & INT
54Dowelani and Ozumba [25]CB30South Africa29.8n.r.n.r.n.r.UTAUT
55Hong et al. [81]JA 1103; 80China; Australia55.3; 47.1n.r.n.r.n.r.None
56Wang et al. [106]JA164China55.368.29n.r.6.70TAM & TPB
57Taib et al. [107]JA168China55.3n.r.n.r.n.r.UTAUT
1 Studies with two subsamples; JA—Journal articles; CB—Chapter book; CP—Conference proceeding; Innovation index was obtained from WIPO [108]; n.r.: not reported.
Table A2. Results of moderator analysis (large sample size vs. small sample size).
RelationshipsSample Size CategoryNo. of OccurrencesSample SizeCombined Effect Size95% CIBetween Groups Tests (QB)p-Value
BI-UBLarge1025250.5260.357–0.6621.0830.298
Small76270.6440.463–0.773
FC-UBLarge615800.2180.106–0.32414.2700.000
Small65540.5120.404–0.606
PE-BILarge2154120.5190.417–0.6080.1720.678
Small2825170.4910.396–0.575
EE-BILarge1850110.4130.287–0.5263.6570.056
Small2723660.2490.130–0.361
SI-BILarge1226580.4020.287–0.5060.6690.413
Small86780.4750.330–0.598
PV-BILarge722490.197−0.013–0.3900.0120.913
Small32730.175−0.160–0.474
FC-BILarge1334180.3370.209–0.4540.0980.754
Small1613930.3640.243–0.474
EE-PELarge1647850.3790.176–0.5510.0010.973
Small2017660.3830.199–0.541
Table A3. Results of moderator analysis (developing economy vs. developed economy).
RelationshipsEconomic Level CategoryNo. of OccurrencesSample SizeCombined Effect Size95% CIBetween Groups Tests (QB)p-Value
BI-UBDeveloping1527950.5620.431–0.6690.4640.496
Developed23570.6730.316–0.863
FC-UBDeveloping1018740.3230.216–0.4233.2350.072
Developed22570.5470.322–0.714
PE-BIDeveloping4272480.5130.440–0.5790.4700.493
Developed76810.4440.237–0.613
EE-BIDeveloping3968730.3110.214–0.4020.3290.566
Developed65040.3860.133–0.592
SI-BIDeveloping1526450.4370.332–0.5310.0800.777
Developed56880.4070.215–0.569
PV-BIDeveloping822710.2060.006–0.3910.1260.723
Developed22510.125−0.283–0.494
FC-BIDeveloping2139160.3600.258–0.4540.1140.735
Developed88950.3270.152–0.482
EE-PEDeveloping3356660.4010.304–0.4892.7310.098
Developed38850.099−0.264–0.437
Table A4. Results of moderator analysis (large power distance vs. small power distance).
RelationshipsCulture CategoryNo. of OccurrencesSample SizeCombined Effect Size95% CIBetween Groups Tests (QB)p-Value
BI-UBLarge 1022850.5420.371–0.6770.4890.484
Small 78670.6230.432–0.760
FC-UBLarge 612690.2980.115–0.4622.8670.238
Small 58700.4600.301–0.593
PE-BILarge 2947040.4750.383–0.5581.0100.315
Small 2032250.5430.439–0.634
EE-BILarge 2643290.2560.140–0.3643.2130.073
Small 1930480.4070.282–0.518
SI-BILarge 1018770.3580.222–0.4813.3430.188
Small 914560.5170.389–0.625
PV-BILarge 713560.206−0.021–0.4130.0570.811
Small 311660.157−0.185–0.465
FC-BILarge 1627180.3250.206–0.4340.4900.484
Small 1320930.3850.255–0.502
EE-PELarge 2132930.3690.191–0.5230.0530.817
Small 1532580.3990.190–0.573
Table A5. Results of moderator analysis (individualism vs. collectivism).
RelationshipsCulture CategoryNo. of OccurrencesSample SizeCombined Effect Size95% CIBetween Groups Tests (QB)p-Value
BI-UBIndividualism31870.6880.409–0.8490.9670.325
Collectivism 1429650.5510.415–0.663
FC-UBIndividualism31870.5970.421–0.7298.6800.013
Collectivism 819470.3060.191–0.413
PE-BIIndividualism97410.4810.302–0.6270.0900.764
Collectivism 4071880.5080.433–0.576
EE-BIIndividualism97480.4110.207–0.5811.0060.316
Collectivism 3666290.2990.198–0.394
SI-BIIndividualism67180.4750.299–0.6200.5580.757
Collectivism 1326150.4180.299–0.524
PV-BIIndividualism23610.056−0.341–0.4360.5350.465
Collectivism 821610.2240.021–0.409
FC-BIIndividualism99250.4540.293–0.5902.2180.136
Collectivism 2038860.3130.209–0.410
EE-PEIndividualism610080.4110.137–0.6260.0710.789
Collectivism 3055430.3730.259–0.478
Table A6. Results of moderator analysis (masculinity vs. femininity).
RelationshipsCulture CategoryNo. of OccurrencesSample SizeCombined Effect Size95% CIBetween Groups Tests (QB)p-Value
BI-UBMasculinity 1324720.5760.434–0.6910.0010.982
Femininity 46800.5730.298–0.760
FC-UBMasculinity 1016150.4080.263–0.5351.2310.540
Femininity 26830.3300.086–0.537
PE-BIMasculinity 3043900.4750.383–0.5571.0960.295
Femininity 1935390.5460.440–0.636
EE-BIMasculinity 3045110.3010.192–0.4020.4180.518
Femininity 1528860.3590.211–0.491
SI-BIMasculinity 1426400.4020.286–0.5061.3480.510
Femininity 56930.5000.343–0.630
PV-BIMasculinity 714600.219−0.005–0.4220.2100.647
Femininity 310620.124−0.219–0.441
FC-BIMasculinity 2233350.3910.284–0.4771.7780.182
Femininity 714760.2430.046–0.421
EE-PEMasculinity 2341000.3760.211–0.5190.0140.905
Femininity 1324510.3910.172–0.573
Table A7. Results of moderator analysis (high uncertainty avoidance vs. weak uncertainty avoidance).
RelationshipsCulture CategoryNo. of OccurrencesSample SizeCombined Effect Size95% CIBetween Groups Tests (QB)p-Value
BI-UBHigh 46800.5730.298–0.7600.0010.982
Weak1324720.5760.434–0.691
FC-UBHigh 24110.3300.086–0.5371.2310.540
Weak 917230.4080.263–0.535
PE-BIHigh 1427120.5360.409–0.6420.3970.529
Weak 3552170.4900.407–0.565
EE-BIHigh 1425410.3520.197–0.4900.2510.616
Weak 3148360.3060.199–0.406
SI-BIHigh 45390.5430.387–0.6692.9720.226
Weak 1527940.3910.284–0.488
PV-BIHigh 310620.124−0.219–0.4410.2100.647
Weak 714600.219−0.005–0.422
FC-BIHigh 613220.2380.024–0.4311.5670.211
Weak 2334890.3800.281–0.471
EE-PEHigh 1224680.3850.155–0.5760.0020.963
Weak 2440830.3790.218–0.520
Table A8. Results of moderator analysis (long-term orientation vs. short-term orientation).
RelationshipsCulture CategoryNo. of OccurrencesSample SizeCombined Effect Size95% CIBetween Groups Tests (QB)p-Value
BI-UBLong-term1224420.5650.415–0.6850.0860.770
Short-term57100.6020.363–0.766
FC-UBLong-term814210.3690.212–0.5081.0350.596
Short-term37130.4170.206–0.590
PE-BILong-term3156290.5250.442–0.5990.7660.381
Short-term1823000.4640.344–0.569
EE-BILong-term2747740.3080.191–0.4160.1290.720
Short-term1826030.3400.197–0.469
SI-BILong-term1225480.4090.280–0.5240.6850.710
Short-term77850.4720.323–0.598
PV-BILong-term615710.129−0.109–0.3520.6870.407
Short-term49510.281−0.003–0.524
FC-BILong-term1938350.3190.213–0.4171.3660.243
Short-term109760.4270.272–0.560
EE-PELong-term2651950.3290.167–0.4741.6700.196
Short-term1013560.5080.271–0.686
Table A9. Results of moderator analysis (indulgence vs. restraint).
RelationshipsCulture CategoryNo. of OccurrencesSample SizeCombined Effect Size95% CIBetween Groups Tests (QB)p-Value
BI-UBIndulgence78670.6230.432–0.7600.4890.484
Restraint1022850.5420.371–0.677
FC-UBIndulgence58700.4600.301–0.5932.8670.238
Restraint612640.2980.115–0.462
PE-BIIndulgence1415820.4590.319–0.5800.6400.424
Restraint3563470.5200.441–0.590
EE-BIIndulgence1317080.3590.190–0.5070.2960.586
Restraint3256590.3060.199–0.405
SI-BIIndulgence77180.4710.320–0.5990.6490.723
Restraint1226150.4100.280–0.525
PV-BIIndulgence49570.281−0.003–0.5240.6870.407
Restraint615650.129−0.109–0.352
FC-BIIndulgence1112020.4280.283–0.5551.6880.194
Restraint1836090.3120.202–0.413
EE-PEIndulgence815110.4870.229–0.6820.9460.331
Restraint2850400.3490.203–0.480

References

  1. Acheng, P.O.; Kibwami, N.; Mukasa, T.J.; Odongkara, B.B.; Birungi, R.; Semanda, J.; Manga, M. Building information modelling adoption in Uganda’s construction industry. Int. J. Constr. Manag. 2023, 23, 2185–2208. [Google Scholar] [CrossRef]
  2. Zheng, Z.; Zhang, Z.; Pan, W. Virtual prototyping-and transfer learning-enabled module detection for modular integrated construction. Autom. Constr. 2020, 120, 103387. [Google Scholar] [CrossRef]
  3. Ahmed, Y.A.; Shehzad, H.M.F.; Khurshid, M.M.; Abbas Hassan, O.H.; Abdalla, S.A.; Alrefai, N. Examining the effect of interoperability factors on building information modelling (BIM) adoption in Malaysia. Constr. Innov. 2022, 24, 606–642. [Google Scholar] [CrossRef]
  4. Luo, H.; Ling, L.; Chen, K.; Fordjour, A.A.M.; Chen, L. Digital technology for quality management in construction: A review and future research directions. Dev. Built Environ. 2022, 12, 100087. [Google Scholar] [CrossRef]
  5. Parsamehr, M.; Perera, U.S.; Dodanwala, T.C.; Perera, P.; Ruparathna, R. A review of construction management challenges and BIM-based solutions: Perspectives from the schedule, cost, quality, and safety management. Asian J. Civ. Eng. 2023, 24, 353–389. [Google Scholar] [CrossRef]
  6. Semaan, J.; Underwood, J.; Hyde, J. An investigation of work-based education and training needs for effective BIM adoption and implementation: An organisational upskilling model. Appl. Sci. 2021, 11, 8646. [Google Scholar] [CrossRef]
  7. Kassem, M.; Ahmed, A.L. Digital transformation through Building Information Modelling: Spanning the macro-micro divide. Technol. Forecast. Soc. Chang. 2022, 184, 122006. [Google Scholar] [CrossRef]
  8. Sacks, R.; Girolami, M.; Brilakis, I. Building information modelling, artificial intelligence and construction tech. Dev. Built Environ. 2020, 4, 100011. [Google Scholar] [CrossRef]
  9. Olanrewaju, O.I.; Kineber, A.F.; Chileshe, N.; Edwards, D.J. Modelling the relationship between Building Information Modelling (BIM) implementation barriers, usage and awareness on building project lifecycle. Build. Environ. 2022, 207, 108556. [Google Scholar] [CrossRef]
  10. Xue, X.; Sun, X.; Xue, W.; Wang, Y.; Liao, L. Investigating building information modeling acceptance in the Chinese AECO industry. Eng. Constr. Archit. 2022, 30, 4253–4270. [Google Scholar] [CrossRef]
  11. Wang, G.; Wang, P.; Cao, D.; Luo, X. Predicting behavioural resistance to BIM implementation in construction projects: An empirical study integrating technology acceptance model and equity theory. J. Civ. Eng. Manag. 2020, 26, 651–665. [Google Scholar] [CrossRef]
  12. Oreg, S.; Bartunek, J.M.; Lee, G.; Do, B. An affect-based model of recipients’ responses to organizational change events. Acad. Manag. Rev. 2018, 43, 65–86. [Google Scholar] [CrossRef]
  13. Howard, R.; Restrepo, L.; Chang, C.Y. Addressing individual perceptions: An application of the unified theory of acceptance and use of technology to building information modelling. Int. J. Proj. Manag. 2017, 35, 107–120. [Google Scholar] [CrossRef]
  14. Cui, Q.; Hu, X.; Liu, X.; Zhao, L.; Wang, G. Understanding architectural designers’ continuous use intention regarding BIM technology: A China case. Buildings 2021, 11, 448. [Google Scholar] [CrossRef]
  15. Mou, J.; Benyoucef, M. Consumer behavior in social commerce: Results from a meta-analysis. Technol. Forecast. Soc. Chang. 2021, 167, 120734. [Google Scholar] [CrossRef]
  16. Hong, S.H.; Lee, S.K.; Kim, I.H.; Yu, J.H. Acceptance model for mobile building information modeling (BIM). Appl. Sci. 2019, 9, 3668. [Google Scholar] [CrossRef]
  17. Murguia, D.; Demian, P.; Soetanto, R. The role of the industry’s cultural-cognitive elements on actors’ intention to adopt BIM: An empirical study in Peru. Eng. Constr. Archit. 2021, 30, 1183–1200. [Google Scholar] [CrossRef]
  18. Zhao, Y.; Sun, Y.; Zhou, Q.; Cui, C.; Liu, Y. How A/E/C professionals accept BIM technologies in China: A technology acceptance model perspective. Eng. Constr. Archit. 2022, 30, 4569–4589. [Google Scholar] [CrossRef]
  19. Li, R.; Niu, Z.; Liu, C.; Wu, B. The co-movement effect of managers’ psychological factors on the BIM adoption decision in SMEs: A study based on fsQCA. Eng. Constr. Archit. 2022. [Google Scholar] [CrossRef]
  20. Nguyen, T.T.N.; Anh Nguyen, T.; Tien Do, S.; Nguyen, V.T. Assessing stakeholder behavioural intentions of BIM uses in Vietnam’s construction projects. Int. J. Constr. Manag. 2022, 23, 2279–2287. [Google Scholar] [CrossRef]
  21. Addy, M.; Adinyira, E.; Ayarkwa, J. Antecedents of building information modelling adoption among quantity surveyors in Ghana: An application of a technology acceptance model. J. Eng. Des. Technol. 2018, 16, 313–326. [Google Scholar] [CrossRef]
  22. Murguia, D.; Demian, P.; Soetanto, R. Systemic BIM adoption: A multilevel perspective. J. Constr. Eng. 2021, 147, 04021014. [Google Scholar] [CrossRef]
  23. Lee, S.; Yu, J. Comparative study of BIM acceptance between Korea and the United States. J. Constr. Eng. 2016, 142, 05015016. [Google Scholar] [CrossRef]
  24. Belay, S.; Goedert, J.; Woldesenbet, A.; Rokooei, S. Comparison of BIM adoption models between public and private sectors through empirical investigation. Adv. Civ. Eng. 2021, 2021, 5577654. [Google Scholar] [CrossRef]
  25. Dowelani, F.; Ozumba, O. Determinants of BIM Adoption in Facilities Management in South Africa: An Application of the UTAUT Model. HF-SE 2022, 61, 88. [Google Scholar] [CrossRef]
  26. Acquah, R.; Eyiah, A.K.; Oteng, D. Acceptance of Building Information Modelling: A survey of professionals in the construction industry in Ghana. J. Inf. Technol. Constr. 2018, 23, 75–91. [Google Scholar]
  27. Venkatesh, V.; Morris, M.G.; Davis, G.B.; Davis, F.D. User acceptance of information technology: Toward a unified view. MIS Q. 2003, 27, 425–478. [Google Scholar] [CrossRef]
  28. Baharuddin, H.E.A.; Othman, A.F.; Adnan, H.; Ismail, N.A.A. Evaluating the influence of training on attitudes to building information modelling (BIM) adoption in Malaysian construction industry by using extended technology acceptance model (TAM). In Collaboration and Integration in Construction, Engineering, Management and Technology: Proceedings of the 11th International Conference on Construction in the 21st Century, London, UK, 9–11 September 2019; Springer International Publishing: Berlin/Heidelberg, Germany, 2021; pp. 577–582. [Google Scholar]
  29. Park, E.; Kwon, S.J.; Han, J. Antecedents of the adoption of building information modeling technology in Korea. Eng. Constr. Archit. 2019, 26, 1735–1749. [Google Scholar] [CrossRef]
  30. Rogers, E.M.; Singhal, A.; Quinlan, M.M. Diffusion of innovations. In An Integrated Approach to Communication Theory and Research; Routledge: London, UK, 2014. [Google Scholar]
  31. Ao, Y.; Peng, P.; Li, J.; Li, M.; Bahmani, H.; Wang, T. What Determines BIM Competition Results of Undergraduate Students in the Architecture, Engineering and Construction Industry? Behav. Sci. 2022, 12, 360. [Google Scholar] [CrossRef]
  32. Fishbein, M.E. Readings in Attitude Theory and Measurement; Wiley: New York, NY, USA, 1967. [Google Scholar]
  33. Fishbein, M.; Ajzen, I. Belief, attitude, intention, and behavior: An introduction to theory and research. Philos. Rhetor. 1977, 6, 244–245. [Google Scholar]
  34. Ajzen, I. The theory of planned behavior. Organ. Behav. Hum. Decis. Process. 1991, 50, 179–211. [Google Scholar] [CrossRef]
  35. Davis, F.D. Perceived usefulness, perceived ease of use, and user acceptance of information technology. MIS Q. 1989, 13, 319–340. [Google Scholar] [CrossRef]
  36. Taherdoost, H. A review of technology acceptance and adoption models and theories. Procedia Manuf. 2018, 22, 960–967. [Google Scholar] [CrossRef]
  37. Venkatesh, V.; Thong, J.Y.; Chan, F.K.; Hu, P.J.H.; Brown, S.A. Extending the two-stage information systems continuance model: Incorporating UTAUT predictors and the role of context. Inf. Syst. J. 2011, 21, 527–555. [Google Scholar] [CrossRef]
  38. Lai, Y.L.; Lee, J. Integration of technology readiness index (TRI) into the technology acceptance model (TAM) for explaining behavior in adoption of BIM. Asian Educ. Stud. 2020, 5, 10. [Google Scholar] [CrossRef]
  39. Ahuja, R.; Jain, M.; Sawhney, A.; Arif, M. Adoption of BIM by architectural firms in India: Technology–organization–environment perspective. Archit. Eng. Des. Manag. 2016, 12, 311–330. [Google Scholar] [CrossRef]
  40. Le, Y.; Zhang, X.; Liu, M. Study on influencing factors of BIM adoption in China’s construction industry based on FA-SEM model. In International Conference on Construction and Real Estate Management 2019; American Society of Civil Engineers: Reston, VA, USA, 2019; pp. 93–100. [Google Scholar]
  41. Chong, A.Y.L.; Blut, M.; Zheng, S. Factors influencing the acceptance of healthcare information technologies: A meta-analysis. Inf. Manag. 2022, 59, 103604. [Google Scholar] [CrossRef]
  42. Geng, R.; Mansouri, S.A.; Aktas, E. The relationship between green supply chain management and performance: A meta-analysis of empirical evidences in Asian emerging economies. Int. J. Prod. Econ. 2017, 183, 245–258. [Google Scholar] [CrossRef]
  43. Hunter, J.E.; Schmidt, F.L. Methods of Meta-Analysis: Correcting Error and Bias in Research Findings, 2nd ed.; Sage Publications: Thousand Oaks, CA, USA, 2004. [Google Scholar]
  44. Peterson, R.A.; Brown, S.P. On the use of beta coefficients in meta-analysis. J. Appl. Psychol. 2005, 90, 175–181. [Google Scholar] [CrossRef]
  45. Cavalcanti, D.R.; Oliveira, T.; de Oliveira Santini, F. Drivers of digital transformation adoption: A weight and meta-analysis. Heliyon 2022, 8, e08911. [Google Scholar] [CrossRef]
  46. Jadil, Y.; Rana, N.P.; Dwivedi, Y.K. A meta-analysis of the UTAUT model in the mobile banking literature: The moderating role of sample size and culture. J. Bus. Res. 2021, 132, 354–372. [Google Scholar] [CrossRef]
  47. Tao, D.; Wang, T.; Wang, T.; Zhang, T.; Zhang, X.; Qu, X. A systematic review and meta-analysis of user acceptance of consumer-oriented health information technologies. Comput. Hum. Behav. 2020, 104, 106147. [Google Scholar] [CrossRef]
  48. Sabherwal, R.; Jeyaraj, A.; Chowa, C. Information system success: Individual and organizational determinants. Manag. Sci. 2006, 52, 1849–1864. [Google Scholar] [CrossRef]
  49. Dwivedi, Y.K.; Rana, N.P.; Jeyaraj, A.; Clement, M.; Williams, M.D. Re-examining the unified theory of acceptance and use of technology (UTAUT): Towards a revised theoretical model. Inf. Syst. Front. 2019, 21, 719–734. [Google Scholar] [CrossRef]
  50. Fan, X.; Jiang, X.; Deng, N. Immersive technology: A meta-analysis of augmented/virtual reality applications and their impact on tourism experience. Tour. Manag. 2022, 91, 104534. [Google Scholar] [CrossRef]
  51. Afsay, A.; Tahriri, A.; Rezaee, Z. A meta-analysis of factors affecting acceptance of information technology in auditing. Int. J. Account. Inf. 2023, 49, 100608. [Google Scholar] [CrossRef]
  52. Bataresh, S.; Kamardeen, I.; Mojtahedi, M. Extrinsic and intrinsic drivers of BIM adoption in the Australian AEC industry. In Proceedings of the 43rd Australasian Universities Building Education Association Conference, Noosa, QLD, Australia, 6–8 November 2019; pp. 684–693. [Google Scholar]
  53. Wang, W.; Gao, S.; Mi, L.; Xing, J.; Shang, K.; Qiao, Y.; Fu, Y.; Ni, G.; Xu, N. Exploring the adoption of BIM amidst the COVID-19 crisis in China. Build. Res. Inf. 2021, 49, 930–947. [Google Scholar] [CrossRef]
  54. Alalwan, A.A. Mobile food ordering apps: An empirical study of the factors affecting customer e-satisfaction continued intention to reuse. Int. J. Inf. Manag. 2020, 50, 28–44. [Google Scholar] [CrossRef]
  55. Hooda, A.; Gupta, P.; Jeyaraj, A.; Giannakis, M.; Dwivedi, Y.K. The effects of trust on behavioral intention and use behavior within e-government contexts. Int. J. Inf. Manag. 2022, 67, 102553. [Google Scholar] [CrossRef]
  56. Hong, Y.; Hammad, A.W.; Akbarnezhad, A. Impact of organization size and project type on BIM adoption in the Chinese construction market. Constr. Manag. Econ. 2019, 37, 675–691. [Google Scholar] [CrossRef]
  57. Venkatesh, V.; Thong, J.Y.; Xu, X. Consumer acceptance and use of information technology: Extending the unified theory of acceptance and use of technology. MIS Q. 2012, 36, 157–178. [Google Scholar] [CrossRef]
  58. Xu, H.; Feng, J.; Li, S. Users-orientated evaluation of building information model in the Chinese construction industry. Autom. Constr. 2014, 39, 32–46. [Google Scholar] [CrossRef]
  59. Aiginger, K.; Vogel, J. Competitiveness: From a misleading concept to a strategy supporting Beyond GDP goals. Compet. Rev. 2015, 25, 497–523. [Google Scholar] [CrossRef]
  60. Samuelson, W.; Zeckhauser, R. Status quo bias in decision making. J. Risk Uncertain. 1988, 1, 7–59. [Google Scholar] [CrossRef]
  61. Vigneshwar, R.V.K.; Shanmugapriya, S.; Sindhu Vaardini, U. Analyzing the driving factors of BIM adoption based on the perception of the practitioners in Indian construction projects. Iran. J. Sci. Technol. Trans. Civ. Eng. 2022, 46, 2637–2648. [Google Scholar] [CrossRef]
  62. Lin, C.H.; Chih, Y.Y.; Tsay, Y.S. Determinants of the adoption of green building simulation technologies in architectural design practices in Taiwan. J. Constr. Eng. 2022, 148, 04021190. [Google Scholar] [CrossRef]
  63. Wen, M.H.; Chen, C.M.; Hsu, I.T. An integrated BIM and cost estimating blended learning model–acceptance differences between experts and novice. Eurasia J. Math. Sci. Technol. Educ. 2016, 12, 1347–1363. [Google Scholar]
  64. Hofstede, G.; Hofstede, G.J.; Minkov, M. Cultures and Organizations: Software of the Mind; Mcgraw-Hill: New York, NY, USA, 2005; Volume 2. [Google Scholar]
  65. Khan, I.U. How does culture influence digital banking? A comparative study based on the unified model. Technol. Soc. 2022, 68, 101822. [Google Scholar] [CrossRef]
  66. Vos, J.F.; Boonstra, A. The influence of cultural values on Enterprise System adoption, towards a culture–Enterprise System alignment theory. Int. J. Inf. Manag. 2022, 63, 102453. [Google Scholar] [CrossRef]
  67. Ahmed, A.L.; Kassem, M. A unified BIM adoption taxonomy: Conceptual development, empirical validation and application. Autom. Constr. 2018, 96, 103–127. [Google Scholar] [CrossRef]
  68. Ding, Z.; Zuo, J.; Wu, J.; Wang, J.Y. Key factors for the BIM adoption by architects: A China study. Eng. Constr. Archit. 2015, 26, 1878–1898. [Google Scholar] [CrossRef]
  69. Ma, P.; Zhang, S.; Hua, Y.; Zhang, J. Behavioral perspective on BIM postadoption in construction organizations. J. Manag. Eng. 2020, 36, 04019036. [Google Scholar] [CrossRef]
  70. Malaquias, R.F.; Hwang, Y. Mobile banking use: A comparative study with Brazilian and US participants. Int. J. Inf. Manag. 2019, 44, 132–140. [Google Scholar] [CrossRef]
  71. Peng, P.; Ao, Y.; Li, M.; Wang, Y.; Wang, T.; Bahmani, H. Building Information Modeling Learning Behavior of AEC Undergraduate Students in China. Behav. Sci. 2022, 12, 269. [Google Scholar] [CrossRef] [PubMed]
  72. Lee, S.; Yu, J.; Jeong, D. BIM acceptance model in construction organizations. J. Manag. Eng. 2015, 31, 04014048. [Google Scholar] [CrossRef]
  73. Schmidt, F.L.; Hunter, J.E. Methods of Meta-Analysis: Correcting Error and Bias in Research Findings, 3rd ed.; Sage Publications: New York, NY, USA, 2015. [Google Scholar]
  74. United Nations. World Economic Situation and Prospects (WESP). 2022. Available online: https://www.un.org/development/desa/dpad/wp-content/uploads/sites/45/WESP2022_ANNEX.pdf (accessed on 1 February 2024).
  75. Zhang, L.; Zhu, J.; Liu, Q. A meta-analysis of mobile commerce adoption and the moderating effect of culture. Comput. Hum. Behav. 2012, 28, 1902–1911. [Google Scholar] [CrossRef]
  76. Lipsey, M.W.; Wilson, D.B. Practical Meta-Analysis; SAGE Publications, Inc.: New York, NY, USA, 2001. [Google Scholar]
  77. Rosenthal, R. Meta-Analytic Procedures for Social Research; Sage Publications: New York, NY, USA, 1991. [Google Scholar]
  78. Griffeth, R.W.; Hom, P.W.; Gaertner, S. A meta-analysis of antecedents and correlates of employee turnover: Update, moderator tests, and research implications for the next millennium. J. Manag. 2000, 26, 463–488. [Google Scholar] [CrossRef]
  79. Jeyaraj, A.; Rottman, J.W.; Lacity, M.C. A review of the predictors, linkages, and biases in IT innovation adoption research. J. Inf. Technol. 2006, 21, 1–23. [Google Scholar] [CrossRef]
  80. Cohen, J. Statistical Power Analysis for the Behavioral Sciences; Routledge: London, UK, 2013. [Google Scholar]
  81. Hong, Y.; Hammad, A.; Zhong, X.; Wang, B.; Akbarnezhad, A. Comparative modeling approach to capture the differences in BIM adoption decision-making process in Australia and China. J. Constr. Eng. 2020, 146, 04019099. [Google Scholar] [CrossRef]
  82. Gong, P.; Zeng, N.; Ye, K.; König, M. An empirical study on the acceptance of 4D BIM in EPC projects in China. Sustainability 2019, 11, 1316. [Google Scholar] [CrossRef]
  83. Ismail, N.A.A.; Maisham, M.; Zaki, Z.A.M.; Rooshdi, R.R.R.M.; Sahamir, S.R. The mediating effects of cost estimates reliability on BIM adoption: SEM model analysis. In IOP Conference Series: Earth and Environmental Science; IOP Publishing: Bristol, UK, 2019; Volume 385, p. 012070. [Google Scholar]
  84. Sanchís Pedregosa, C.; Vizcarra Aparicio, J.M.; Leal Rodríguez, A.L. BIM: A technology acceptance model in Peru. J. Inf. Technol. Constr. 2020, 25, 99–108. [Google Scholar] [CrossRef]
  85. Yuan, H.; Yang, Y.; Xue, X. Promoting owners’ BIM adoption behaviors to achieve sustainable project management. Sustainability 2019, 11, 3905. [Google Scholar] [CrossRef]
  86. Zhang, Y.; Weng, Q.; Zhu, N. The relationships between electronic banking adoption and its antecedents: A meta-analytic study of the role of national culture. Int. J. Inf. Manag. 2018, 40, 76–87. [Google Scholar] [CrossRef]
  87. Santini, F.D.O.; Ladeira, W.J.; Sampaio, C.H.; Perin, M.G.; Dolci, P.C. A meta-analytical study of technological acceptance in banking contexts. Int. J. Bank Mark. 2019, 37, 755–774. [Google Scholar] [CrossRef]
  88. Chen, Y.; Yin, Y.; Browne, G.J.; Li, D. Adoption of building information modeling in Chinese construction industry: The technology-organization-environment framework. Eng. Constr. Archit. 2019, 26, 1878–1898. [Google Scholar] [CrossRef]
  89. Okakpu, A.; GhaffarianHoseini, A.; Tookey, J.; Haar, J.; Ghaffarianhoseini, A. Exploring the environmental influence on BIM adoption for refurbishment project using structural equation modelling. Archit. Eng. Des. Manag. 2020, 16, 41–57. [Google Scholar] [CrossRef]
  90. Hong, Y.; Hammad, A.W.; Sepasgozar, S.; Akbarnezhad, A. BIM adoption model for small and medium construction organisations in Australia. Eng. Constr. Archit. 2019, 26, 154–183. [Google Scholar] [CrossRef]
  91. Ahmed, S.H.; Suliman, S.M. A structure equation model of indicators driving BIM adoption in the Bahraini construction industry. Constr. Innov. 2020, 20, 61–78. [Google Scholar] [CrossRef]
  92. Ngowtanasawan, G. A causal model of BIM adoption in the Thai architectural and engineering design industry. Procedia Eng. 2017, 180, 793–803. [Google Scholar] [CrossRef]
  93. Son, H.; Lee, S.; Kim, C. What drives the adoption of building information modeling in design organizations? An empirical investigation of the antecedents affecting architects’ behavioral intentions. Autom. Constr. 2015, 49, 92–99. [Google Scholar] [CrossRef]
  94. Wu, Z.; Jiang, M.; Li, H.; Luo, X.; Li, X. Investigating the critical factors of professionals’ BIM adoption behavior based on the theory of planned behavior. Int. J. Environ. Res. Public Health 2021, 18, 3022. [Google Scholar] [CrossRef]
  95. Zhang, L.; Chu, Z.; Song, H. Understanding the relation between BIM application behavior and sustainable construction: A case study in China. Sustainability 2019, 12, 306. [Google Scholar] [CrossRef]
  96. Qin, X.; Shi, Y.; Lyu, K.; Mo, Y. Using a TAM-TOE model to explore factors of Building Information Modelling (BIM) adoption in the construction industry. J. Civ. Eng. Manag. 2020, 26, 259–277. [Google Scholar] [CrossRef]
  97. Hong, Y.; Sepasgozar, S.M.; Ahmadian, A.F.F.; Akbarnezhad, A. Factors influencing BIM adoption in small and medium sized construction organizations. In ISARC. Proceedings of the International Symposium on Automation and Robotics in Construction; IAARC Publications: Auburn, AL, USA, 2016; Volume 33, p. 1. [Google Scholar]
  98. Kim, S.; Park, C.H.; Chin, S. Assessment of BIM acceptance degree of Korean AEC participants. KSCE J. Civ. Eng. 2016, 20, 1163–1177. [Google Scholar] [CrossRef]
  99. Lee, J. Environmental factors of acceptance organization affecting intention to accept bim. Int. J. Manag. 2020, 11, 188–200. [Google Scholar]
  100. Lee, S.; Yu, J. Longitudinal study on construction organization’s BIM acceptance. Appl. Sci. 2020, 10, 5358. [Google Scholar] [CrossRef]
  101. Wang, G.; Song, J. The relation of perceived benefits and organizational supports to user satisfaction with building information model (BIM). Comput. Hum. Behav. 2017, 68, 493–500. [Google Scholar] [CrossRef]
  102. Ahmad, J.; Ahir, C.; Arora, K.; Kathpal, J. A critical analysis of technology acceptance model (TAM) towards adopting BIM by architects in India. ECS Trans. 2022, 107, 6209. [Google Scholar] [CrossRef]
  103. Murguia, D.; Vasquez, C.; Demian, P.; Soetanto, R. BIM Adoption among Contractors: ALongitudinal Study in Peru. J. Constr. Eng. 2023, 149, 04022140. [Google Scholar] [CrossRef]
  104. Zhai, D.; Pang, Y. Original Paper Research on the Influencing Factors of the Adoption of BIM Technology. World 2018, 5, 82. [Google Scholar] [CrossRef]
  105. Davies, R.; Harty, C. Measurement and exploration of individual beliefs about the consequences of building information modelling use. Constr. Manag. Econ. 2013, 31, 1110–1127. [Google Scholar] [CrossRef]
  106. Wang, J.; Li, C.; Wu, J.; Zhou, G. Research on the Adoption Behavior Mechanism of BIM from the Perspective of Owners: An Integrated Model of TPB and TAM. Buildings 2023, 13, 1745. [Google Scholar] [CrossRef]
  107. Taib, M.; Quanhua, H.; Taib, N. Building Information Modelling (BIM) Adoption for Cost Engineering Consultant; Case Study of Southern China. J. Adv. Res. Appl. Sci. Eng. Technol. 2023, 29, 21–36. [Google Scholar]
  108. WIPO Global Innovation Index. 2022. Available online: https://www.wipo.int/global_innovation_index/en/2022/ (accessed on 30 December 2023).
Figure 1. Meta-analysis study process.
Buildings 14 00920 g001
Figure 2. Research model and hypothesis.
Buildings 14 00920 g002
Figure 3. Study selection process.
Buildings 14 00920 g003
Figure 4. BIM adoption studies over time.
Buildings 14 00920 g004
Figure 5. Funnel plot of the included studies (PE-BI).
Buildings 14 00920 g005
Figure 6. Main-analytic outcomes of the research model.
Buildings 14 00920 g006
Table 1. Coding variables and sources.
VariablesDefinitionOther Names Based on the ContextSources
Performance expectancy (PE)“The extent to which technology can offer advantages to users during the execution of specific tasks”Perceived usefulness, usefulness, perceived benefits[27]
Effort expectancy (EE)“The level of perceived effortlessness in utilizing the technology”Ease of use, perceived ease of use[27]
Social influence (SI)“The extent to which the user perceives social pressure from significant others to use the technology”Subjective norm, social norms[33]
Perceived value (PV)“The individuals’ cognitive evaluation of the perceived advantages of utilizing the technology weighed against its monetary expenses”Perceived costs, price value, price evaluation [57]
Facilitating conditions (FC)“The user’s perceptions of the availability of resources and support required to execute a behavior”Perceived behavioral control, resources[27]
Behavioral intention (BI)“The degree of an individual’s determination to engage in a particular behavior”Behavioral intention to use, intention to use, intention, adoption intention, use intention[33]
Use behavior (UB)“The extent to which individuals actually use a technology in a specific context of technology acceptance”Actual behavior, actual use, actual usage[35]
Table 2. An overview of the three categorical moderating variables.
ModeratorsCategoryDescription
Sample size Large vs. SmallThe categorization of subgroups was achieved by using the median sample size of the studies included in the meta-analysis, which was determined to be 153. Studies with sample sizes larger than 153 were classified as “large studies,” whereas those with smaller sample sizes were categorized as “small studies.”
Culture *Large power distance vs. Small power distanceUsing the data from Hofstede et al. [64], the mean score (= 64.59) for the power distance dimension across 104 countries was calculated. Samples with scores above the mean score were classified as having large power distance, while samples with scores below the mean score were classified as having small power distance.
Individualism vs. CollectivismUsing the data from Hofstede et al. [64], the mean score (=38.62) for the individualism dimension across 104 countries was calculated. Samples with scores above the mean score were classified as having individualism, while samples with scores below the mean score were classified as having collectivism.
Masculinity vs. FemininityUsing the data from Hofstede et al. [64], the mean score (=47.58) for the masculinity dimension across 104 countries was calculated. Samples with scores above 50 were classified as having masculinity, while samples with scores below 50 were classified as having femininity.
High uncertainty avoidance vs. Weak uncertainty avoidanceUsing the data from Hofstede et al. [64], the mean score (=64.11) for the uncertainty avoidance dimension across 104 countries was calculated. Samples with scores above the mean score were classified as having high uncertainty avoidance, while samples with scores below the mean score were classified as having weak uncertainty avoidance.
Long-term orientation vs. Short-term orientationUsing the data from Hofstede et al. [64], the mean score (=42.93) for the orientation dimension across 104 countries was calculated. Samples with scores above the mean score were classified as having long-term orientation, while samples with scores below the mean score were classified as having short-term orientation.
Indulgence vs. RestrainedUsing the data from Hofstede et al. [64], the mean score (=47.99) for the indulgence dimension across 104 countries was calculated. Samples with scores above the mean score were classified as having indulgence, while samples with scores below the mean score were classified as having restrained.
Economic level Developing economy vs. Developed economyIn accordance with the United Nations’ latest report on the world economic situation [74], the countries where research on BIM adoption has been conducted were classified into two categories, namely developing and developed economies.
* Since Bahrain was not included in the Hofstede’s cultural dimensions, the study conducted in Bahrain was removed in this stage.
Table 3. Descriptive statistics.
RelationshipsNo.RangeWeight AnalysisCumulative Sample SizeAverage Sample Size
LowerUpperPositive
Sig
Positive Non-SigNegative SigNegative Non-SigSignificant (%)Inconsistency
BI-UB170.1700.8801520088.24%No3152185
FC-UB120.0840.7291020083.33%No2134177
PE-BI49−0.0490.8434251187.76%No7929161
EE-BI45−0.1050.85227112564.44%Yes7377163
SI-BI200.0180.8071442080.00%No3333166
PV-BI10−0.0800.638611270.00%Yes2522252
FC-BI290.0300.93217102065.52%Yes4811165
EE-PE36−0.5510.9172771177.78%Yes6551181
Table 4. Meta-analytic results of pairwise relationships.
RelationshipsNo. of OccurrencesHeterogeneityCombined Effect Size95% CIZ-ValueNfs.01
Q-ValueI2
BI-UB17325.952 ***95.0910.5750.456–0.6747.899 ***2864
FC-UB1276.389 ***85.6000.3640.258–0.4626.343 ***393
PE-BI49700.824 ***93.1510.5040.436–0.56612.486 ***4577
EE-BI45738.401 ***94.4010.3210.231–0.4056.728 ***5954
SI-BI20165.234 ***88.5010.4290.341–0.5108.653 ***1795
PV-BI10159.259 ***94.3490.1910.018–0.3522.428 *68
FC-BI29286.924 ***90.2410.3510.265–0.4317.581 ***2292
EE-PE361206.048 ***97.0980.3810.249–0.4995.362 ***3999
* for p < 0.05, *** for p < 0.001.
Disclaimer/Publisher’s Note: The statements, opinions and data contained in all publications are solely those of the individual author(s) and contributor(s) and not of MDPI and/or the editor(s). MDPI and/or the editor(s) disclaim responsibility for any injury to people or property resulting from any ideas, methods, instructions or products referred to in the content.

