Article

Impacts of Photovoltaic Façades on the Urban Thermal Microclimate and Outdoor Thermal Comfort: Simulation-Based Analysis

Chair of Building Technology and Climate Responsive Design, School of Engineering and Design, Technical University of Munich, 80333 Munich, Germany
*
Author to whom correspondence should be addressed.
Submission received: 22 February 2024 / Revised: 12 March 2024 / Accepted: 26 March 2024 / Published: 28 March 2024
(This article belongs to the Section Building Energy, Physics, Environment, and Systems)

Abstract

:
Cities face the consequences of climate change, specifically the urban heat island (UHI) effect, which detrimentally affects human health. In this regard, deploying PV modules in urban locales prompts inquiry into the impact of energy-active building components on the adjacent thermal microclimate and human thermal comfort. A twofold simulation-based methodology addresses this subject: First, the implications of façade-integrated photovoltaics on the urban thermal microclimate are investigated using a case study in Munich, Germany. Secondly, a parameter study allows us to gain further insights into the relevance of several parameters on the microthermal impact. The simulation results show a daytime heating effect of photovoltaics on the mean radiant temperature of up to +5.47 K in summer and +6.72 K in winter. The increased mean radiant temperature leads to an elevation of the Universal Thermal Climate Index of up to +1.46 K in summer and +2.21 K in winter. During night-time, no increase in both metrics is identified—hence, nocturnal recovery as a key element for human health is not affected. Despite extended human exposure to thermal heat stress in summer, PV façades improve the annual outdoor thermal comfort autonomy by 0.91% due to lower cold stress in winter. The higher PV efficiencies and lower albedo of the reference building surface lower the heating effect. However, with the current efficiencies, PV façades consistently lead to heating of the surrounding thermal microclimate in summer and lower the outdoor thermal comfort.

1. Introduction

Increasing global temperatures amplify the necessity for climate protection strategies and the utilization of renewable energies to meet climate protection objectives and minimize the impact of global warming. In urban areas, solar energy represents the most abundant renewable energy source, which can be flexibly harnessed by incorporating photovoltaic panels into building surfaces.
At the same time, cities face the consequences of climate change, specifically the urban heat island (UHI) effect, which refers to the disparity in the ambient air temperature between urban and rural areas. The growth of metropolitan populations is expected to exacerbate the UHI, resulting in adverse effects on human health: Heatwaves lead to higher mortality rates and increased health issues, especially among the elderly population. Additionally, reduced night-time cooling impairs sleep quality and reduces overall performance [1,2].
At the local scale, the thermal microclimate is particularly influenced by the surrounding surfaces, materials, and physical characteristics. Intelligently controlled, the installation of photovoltaics is a common strategy to reduce the carbon emissions and improve the dynamic emission balance of a building energy system [3,4]. Adding photovoltaic modules—driven by climate protection efforts—raises questions about how this new construction material interacts with the surrounding thermal microclimate [5,6].
The significance of this topic has only recently gained importance in urban planning practices and research. A limited number of experimental and simulation-based studies has been conducted thus far with diverging results: Some studies indicate that photovoltaic panels elevate the surrounding ambient air temperature [7,8,9,10], whereas further studies suggest a phenomenon of ‘solar cooling’ due to the conversion of absorbed solar radiation into electricity [11,12,13,14,15,16]. The differing results between different simulation-based studies can be primarily traced back to simplifications in modeling the photovoltaic cell temperatures. For instance, in [12,13], a photovoltaic model computes the module temperature by adding the ambient air temperature to the irradiance at the module level, multiplied by a constant factor. Consequently, this approach does not consider the impact of wind speed, wind direction, and module efficiency on photovoltaic temperatures. The effective albedo approach employed in [11,14] also involves significant simplifications and assumptions, which have not yet undergone validation. In [17], longwave and diffuse radiation are excluded from the energy balance calculations, which are only performed when the Sun is at its zenith. Further studies assume that the albedo of the surrounding building surfaces is equivalent to the albedo of the photovoltaic modules [11,16]. In [13], it is assumed that each building has mechanical air conditioning, and the waste heat generated is released into the environment as sensible heat. Consequently, the observed reduction in ambient air temperature primarily stems from the decreased demand for cooling energy, leading to a decrease in anthropogenic heat emissions.
Moreover, these studies mainly investigate rooftop photovoltaic installations and focus on ambient air and surface temperatures. Although they directly influence human well-being, façade-integrated photovoltaics are rarely analyzed, and only one study has considered the mean radiant temperature and metrics describing human thermal comfort [18]. However, enhancing the albedo of surfaces can result in a decrease in outdoor thermal comfort [19]. Therefore, failing to account for outdoor thermal comfort aspects, including the mean radiant temperature, leads to an incomplete characterization of the impacts on the thermal microclimate when comparing façade-integrated photovoltaics to conventional building surfaces.
Hence, the extent to which and the specific circumstances under which implementing photovoltaics in building façades impacts the local microclimate, particularly in terms of the ambient air temperature and mean radiant temperature, as well as outdoor thermal comfort, remain to be determined. It is also uncertain whether PV applications lead to overall warming of the urban climate within a city or district context or rather provide urban solar cooling, potentially making them a viable climate adaptation measure.
This research gap leads to the questions, how do façade-integrated photovoltaic installations impact the surrounding urban thermal microclimate and human outdoor thermal comfort? What parameters influence this impact of photovoltaics on its surroundings?
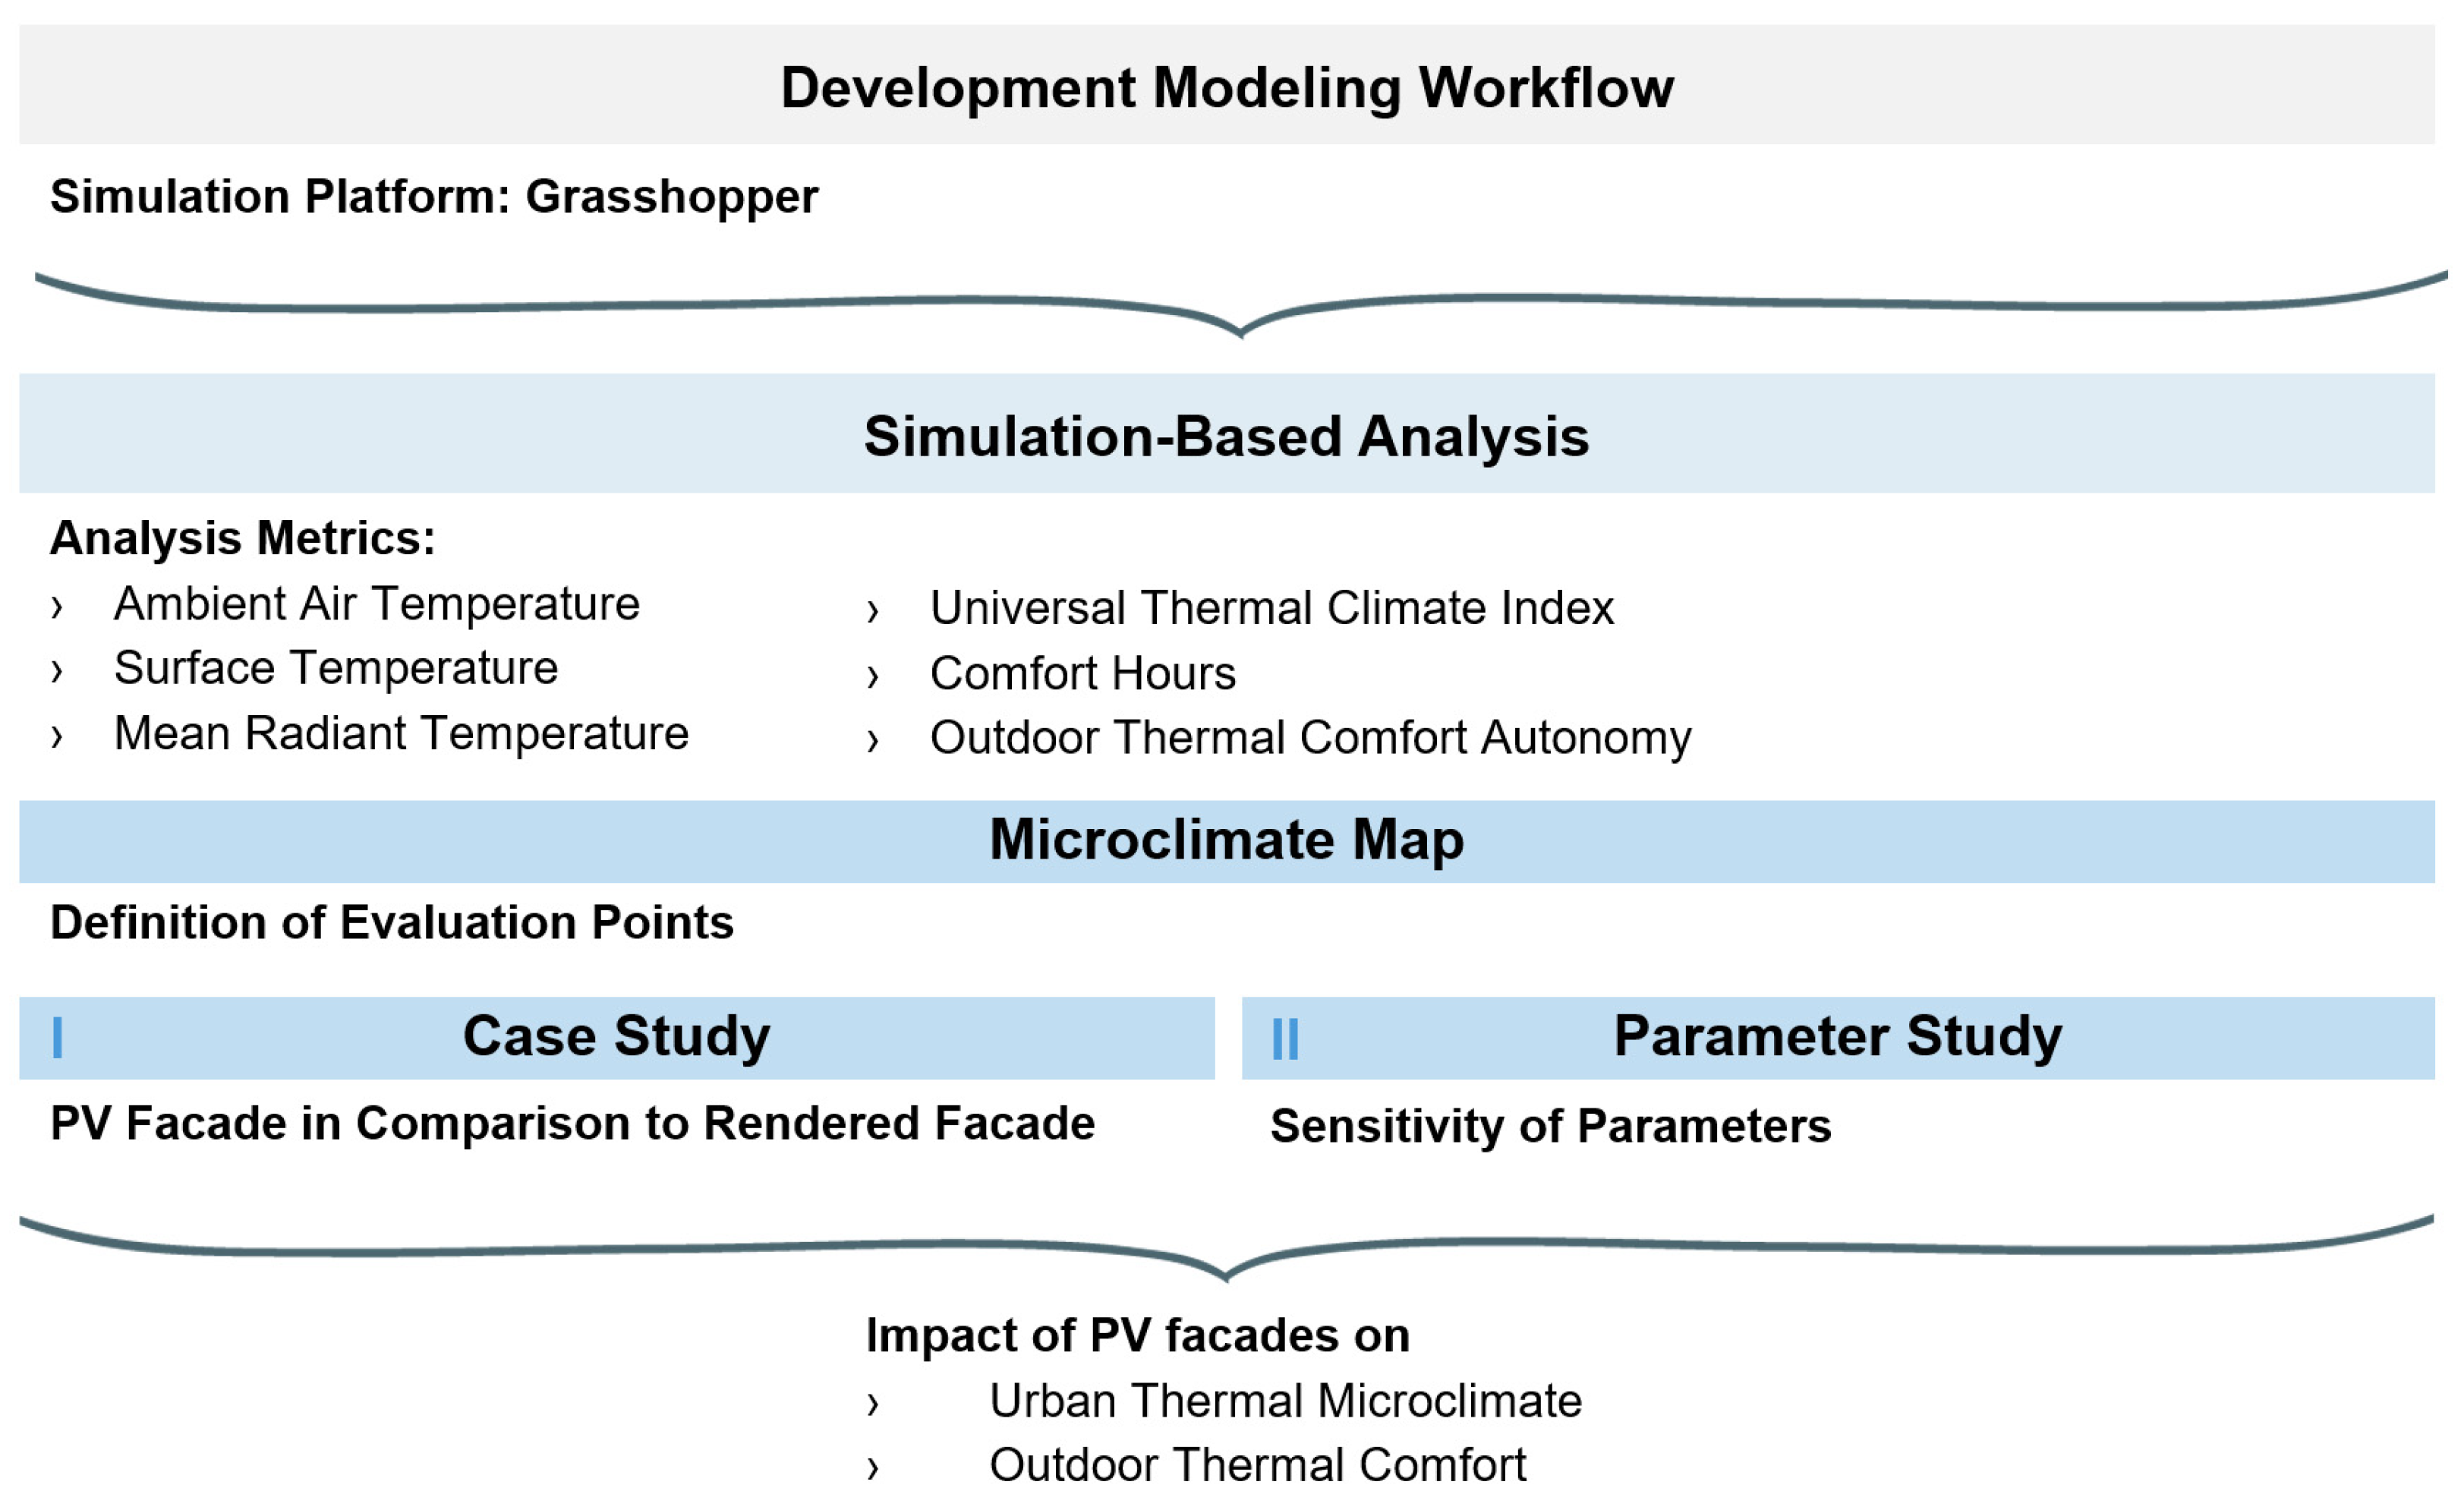
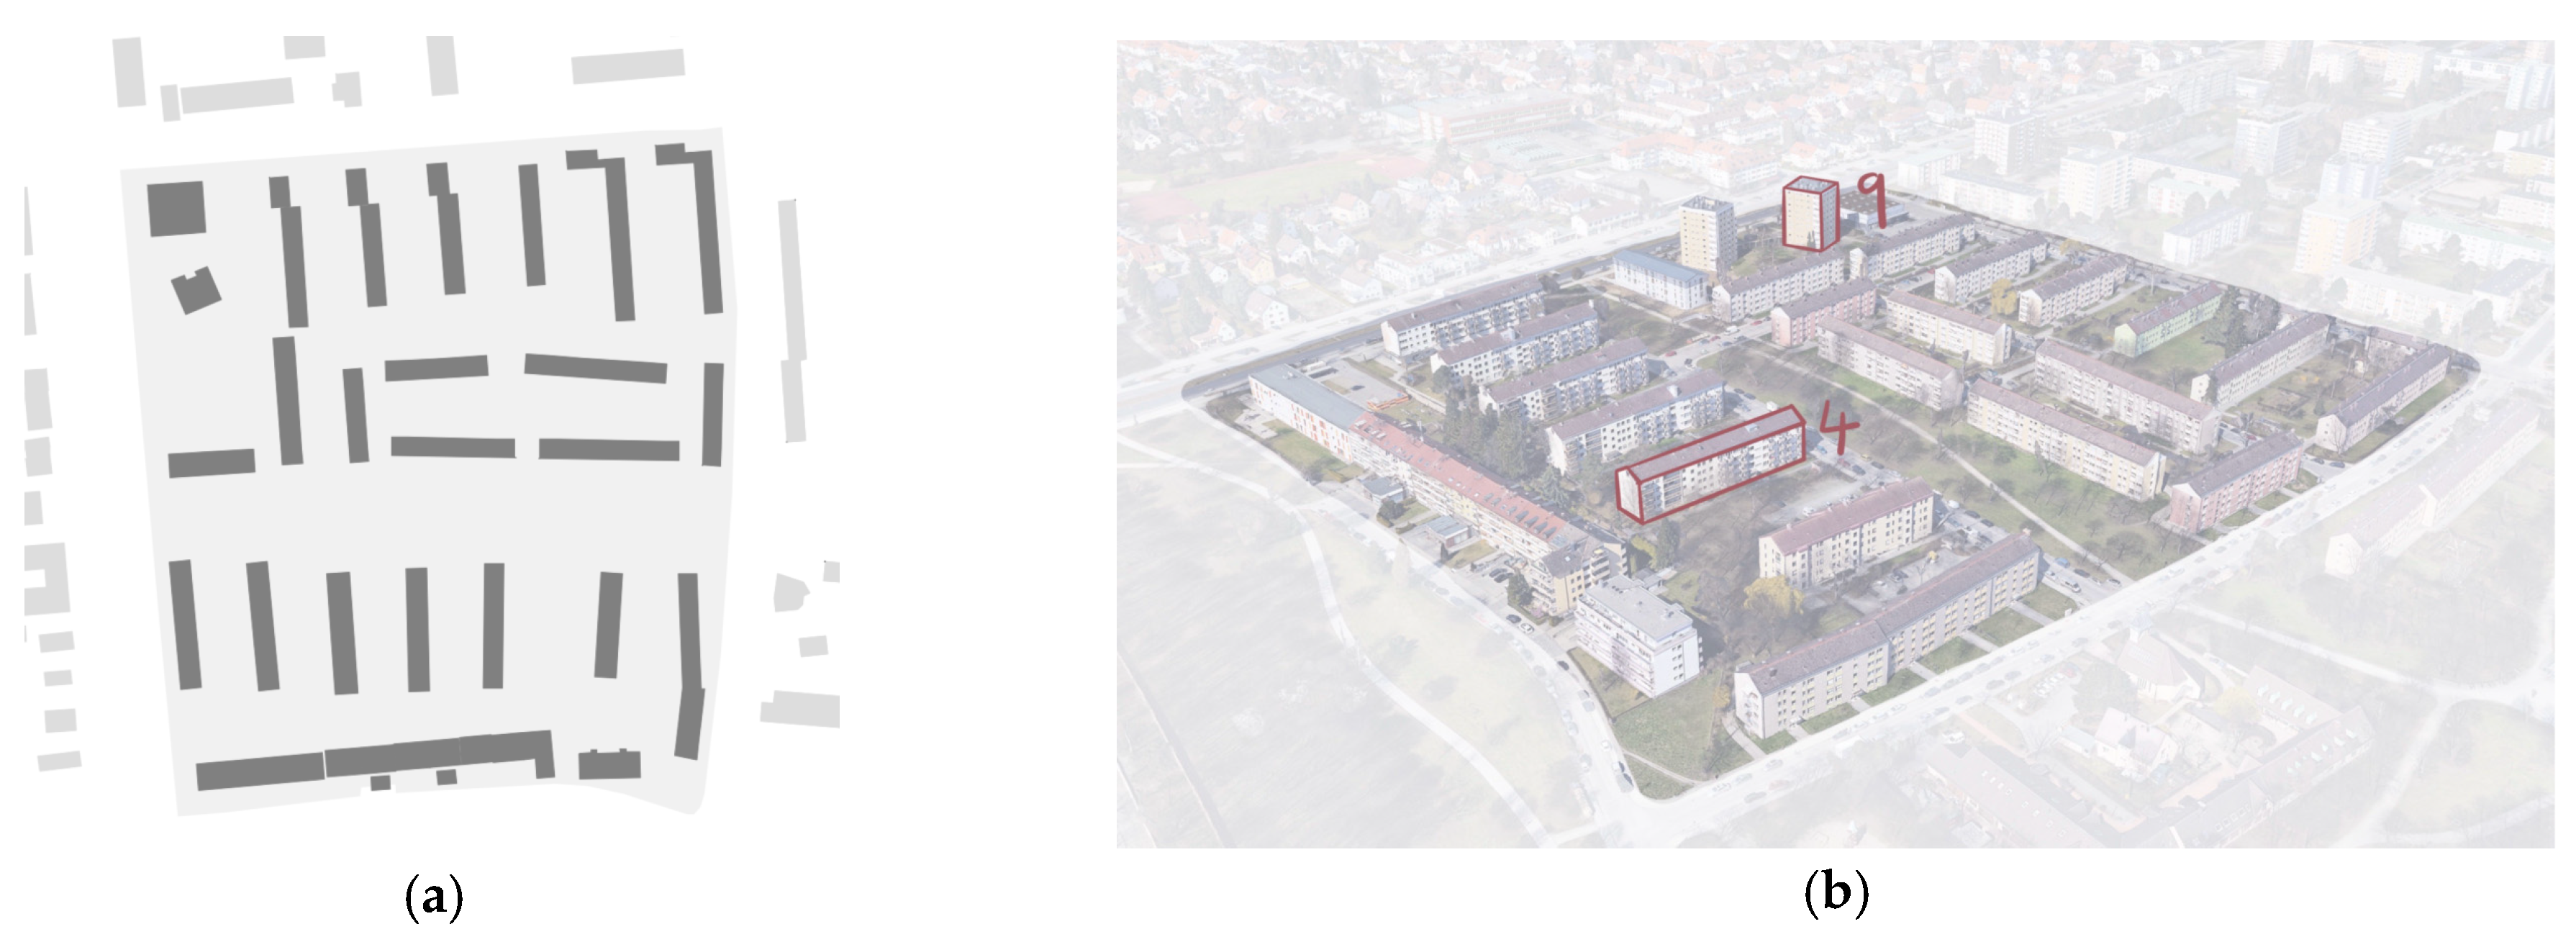
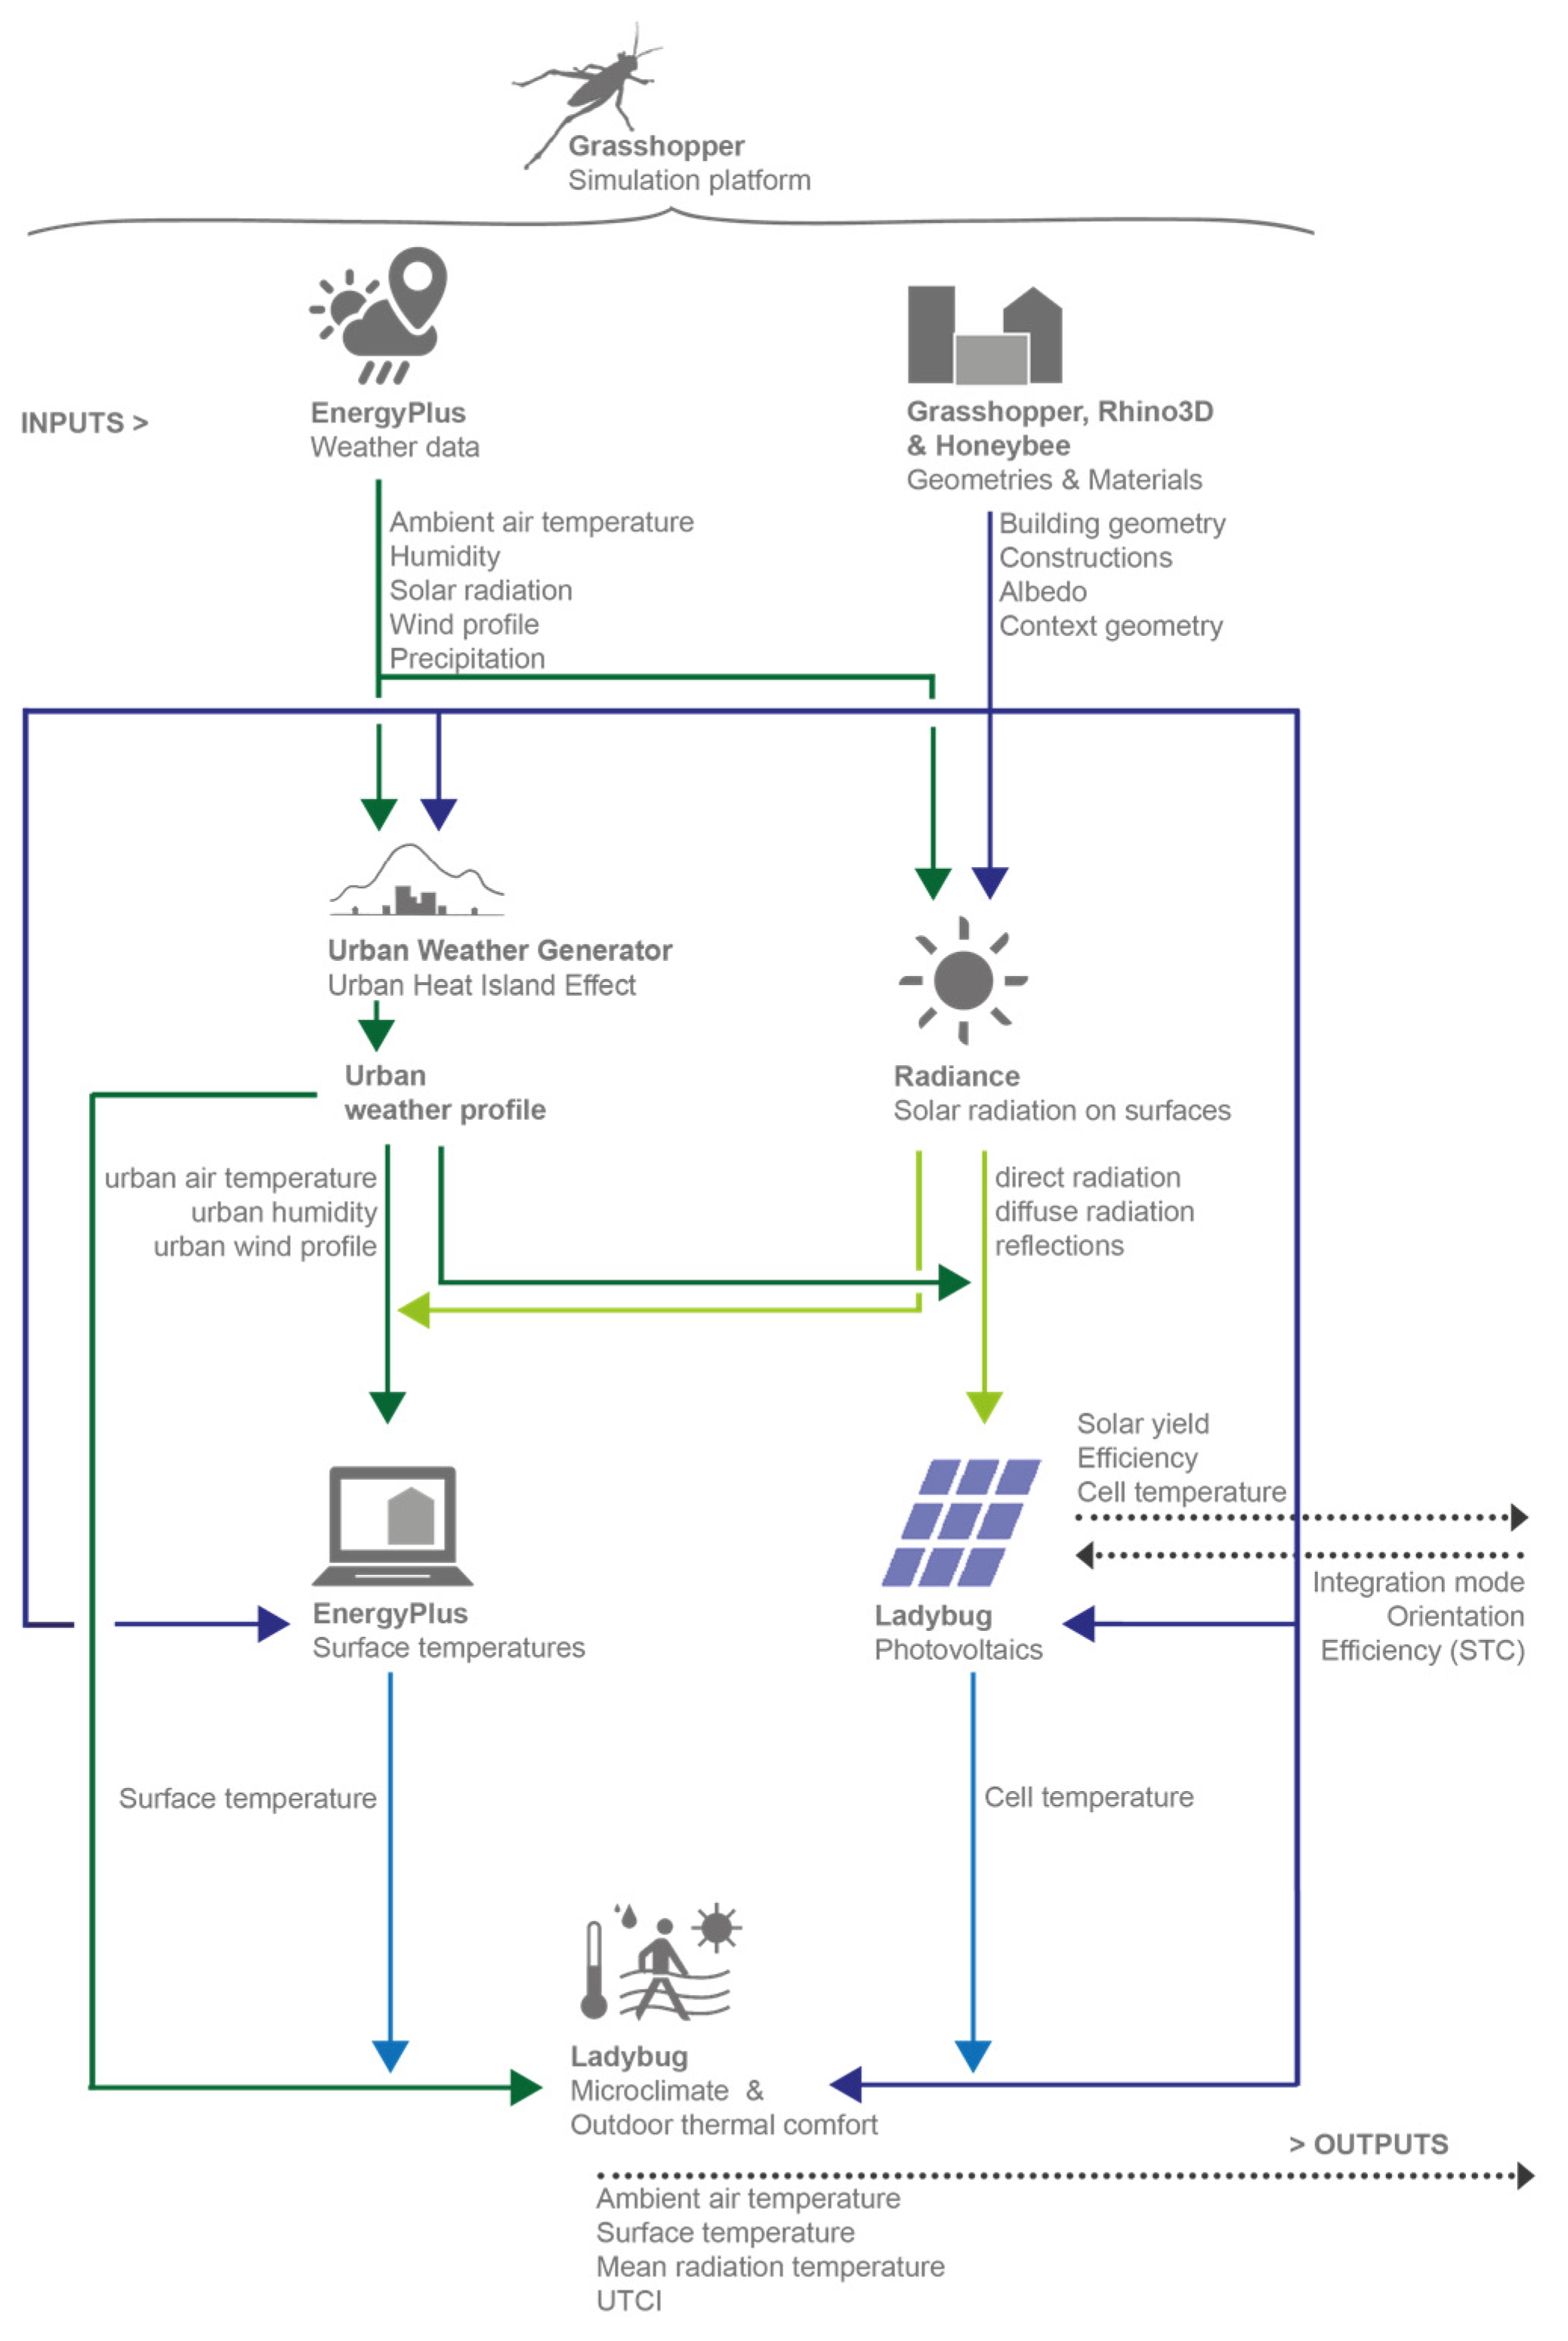
A twofold simulation-based methodology has been developed to comprehensively answer the research questions: First, the impacts of façade-integrated photovoltaics on the urban thermal microclimate are investigated using a case study in Munich, Germany. The simulation results for the PV or reference façade temperature, urban ambient air temperature, mean radiant temperature, and outdoor thermal comfort for a retrofitted district with PV installations are compared to those for a district with conventional building materials. A subsequent parameter study allows us to gain further insights into the relevance of several parameters to the microthermal impact. This study focuses on the outdoor thermal microclimate. Hence, investigations into the effect of photovoltaics on the indoor climate and building energy consumption, as investigated in [12,13,20], are excluded from the present research.

2. Materials and Methods

Microclimate simulations carried out on the simulation platform Grasshopper (see Section 3) provide the data for evaluating the temperatures and outdoor thermal comfort indices and hence for assessing the impacts of building-related photovoltaics on the urban thermal microclimate and human thermal comfort through comparison with a reference case (see Section 4). The simulation approach follows a twofold methodology: First, a case study in Munich provides the first insights into the topic. Then, a parameter study investigates the sensitivity of the simulation results to several parameters and helps identify critical parameters and thresholds. In conclusion, evaluating the simulation results answers the research questions (see Section 6). The methodological approach is shown in Figure 1.

2.1. Analysis Site

The analysis site is located within a residential settlement in northern Munich, Germany. The settlement has a ground area of 300 × 340 m, and its urban geometry consists of linear buildings with a building height of four stories. Two nine-story high-rise buildings complete the building structure (see Figure 2). The neighborhood represents a typical German post-war residential settlement, classified as Urban Structural Type 3 according to [21]. This settlement type is the most recurrent one in Germany [22], and the building density of 19% and the extensive areas between the buildings provide large solar potentials for applying photovoltaics to the building surfaces.

2.2. Analysis Metrics

To evaluate the impacts of photovoltaics on the urban thermal microclimate and outdoor thermal comfort, we analyze the following metrics:

2.2.1. Ambient Air Temperature

The first metric to be evaluated is the ambient air temperature Tair, the most common metric describing the thermal microclimate.

2.2.2. Surface Temperature

Due to their impact on the mean radiant temperature and outdoor thermal comfort, the surface temperatures Tsurf,REF of the reference building are investigated. In the applied modeling workflow (see Section 3.1), Tsurf,REF is calculated based on heat balances according to Equation (1) [23].
q l w =   ε σ [ F s k y ( T s k y 4 T s u r f 4 ) + F a i r ( T a i r 4 T s u r f 4 ) + F s 1 ( T s 1 4 T s u r f 4 ) + F s 2 ( T s 2 4 T s u r f 4 ) + + F s n ( T s n 4 T s u r f 4 ) + F s i ( T g 4 T s u r f 4 ) ]
where qlw is the longwave radiative flux between the building surface and surroundings in W/m2, ε is the longwave emittance of the surface, σ is the Stefan–Boltzmann constant (5.667 × 10⁻⁸ W/m2K4), Tsurf,REF is the surface temperature in °C, Tsky is the sky temperature in °C, Fsky is the view factor of the surface to the sky, Tair is the ambient air temperature in °C, Fair is the view factor of the surface to the air, Tsi is the temperature of the surrounding surface i in °C, Fsi is the view factor of the surrounding surface i, Tg is the temperature of the ground in °C, and Fg is the view factor of the ground.
In the case of photovoltaic modules replacing the conventional building surface materials, the cell temperatures Tcell are analyzed. The difference in temperature between the cell and the front surface of the module is minimal. Therefore, we assume Tcell = TPV,front. In the applied modeling workflow (see Section 3.1), the NOCT cell temperature model calculates the photovoltaic cell temperatures. The nominal operating cell temperature (NOCT) is the cell temperature reached at a solar radiation G = 800 W/m2, a wind velocity v = 1 m/s, an ambient air temperature Tair = 20 °C, and no-load operations. For solar radiation G > 0 W/m2, Equation (2) is used to calculate the cell temperature; for solar radiation G = 0 W/m2, Equation (3)is applied [24,25,26].
T c e l l = T a i r + G 800 ( T n o c t , a d j 20 ) ( 1 η r e f τ α ) 9.5 5.7 + 3.8 v a d j
T c e l l = T a i r + G 800 ( T n o c t , a d j 20 ) 9.5 5.7 + 3.8 v a d j
where EPOA is the solar irradiance on the module (W/m2), Tnoct, adj is the module’s nominal operating cell temperature adjusted for mounting stand-off (°C), ƞref is the module efficiency at standard test conditions, πα is a combined coefficient representing transmittance and absorptance effects, and vadj is the wind velocity adjusted for the height above ground (s/m).
vadj is calculated based on the wind velocity v according to Equation (4) [25]:
v a d j = { 0.51 v       o n e   s t o r y   o r   l o w e r 0.61 v   t w o   s t o r i e s   o r   h i g h e r
Tnoct, adj is calculated based on the module’s nominal operating cell temperature Tnoct, which is adjusted according to the mounting stand-off height in inches (see Table 1).

2.2.3. Mean Radiant Temperature

The mean radiant temperature TMRT is an artificial metric used to express the degree of exposure to radiation, summarizing all the shortwave and longwave radiation fluxes reaching the human body. Hence, it has a significant impact on outdoor thermal comfort. According to ANSI/ASHRAE standard 55 [27], TMRT is defined as ‘the uniform surface temperature of an imaginary black enclosure in which an occupant would exchange the same amount of radiant heat as in the actual nonuniform space’. During the daytime, solar shortwave and terrestrial longwave radiation affect the mean radiant temperature, while only longwave radiation impacts TMRT during night-time. It is affected by the surrounding surfaces and their radiative properties, such as the albedo, and in an urban context, the urban configuration, such as the street canyon’s width, height, and orientation. The determination of TMRT is complex, particularly in urban contexts, due to superimposing radiative fluxes [28,29,30,31,32].
In the applied modeling workflow (see Section 3.1), TMRT (in °C) is calculated as follows: First, the longwave mean radiant temperature TMRT,lw is determined according to Equation (5) [33]:
T M R T ,   l w = [ i = 1 N F s u r f , i × T s u r f , i 4 ] 1 / 4
The longwave sky temperature (Tsky in °C) is calculated according to Equation (6) based on the Man–Environment Heat Exchange Model (MENEX) [34,35]:
T s k y = q l w ( ε p × σ ) 1 4
where qlw is the downwelling longwave radiation from the sky in W/m2, ε p is the emissivity of the human body (assumed to be 0.95), and σ is the Stefan–Boltzmann constant (5.667 × 10⁻⁸ W/m2K4).
Subsequently, the longwave mean radiant temperature is complemented to account for the shortwave radiation impinging on the human body. According to the SolarCal model, first, an effective radiant field (ERFsolar in W/m2) describing the radiative fluxes to and from the human body is calculated (see Equation (4)), which is then converted into a TMRT delta according to Equation (8) [35,36,37,38].
ERF s o l a r = ( 0.5 × f e f f × f s v f × ( I d i f f × I T H × R f l o o r ) + A p × f b e s × I d i r A D ) × ( a s w a l w )    
ERF s o l a r = f e f f × h r ( T M R T T M R T ,   l w )  
where feff is the fractional of the body that can radiate heat (0.725 for a standing person), fsvf is the sky view factor, fbes is a value computed by tracing the Sun vector indicating whether direct radiation is falling on the human body, Idiff is the diffuse sky radiation (W/m2), TTH is the global horizontal radiation (W/m2), Ap and AD are the geometry coefficients of the human body calculated based on the Sun’s altitude and azimuth, Rfloor is the reflectivity of the ground, αsw and αlw refer to the reflectivity of the person’s clothing, and hr is the radiative heat transfer coefficient (W/m2).
The contribution of the shortwave radiation to TMRT can be added to the longwave TMRT,,lw using ERFsolar according to Equation (9), resulting in the combined long- and shortwave Tmrt.
T M R T = T M R T , l w + ( E R F s o l a r h r × f e f f )  

2.2.4. Universal Thermal Climate Index

The outdoor thermal comfort is evaluated using the Universal Thermal Climate Index (UTCI). The UTCI considers all the thermophysiological parameters of heat exchange between human beings and their environment and is valid for all climate zones, seasons, and temporal and spatial variations. The calculation of the dynamic physiological response of the human body to the meteorological input is based on the Fiala model [39], which was extended using a model of behaviorally adapted clothing. The UTCI is expressed as the equivalent air temperature of a reference environment that elicits the same thermophysiological response from a reference person as the current environment. The reference environment is characterized by a relative humidity of 50%, negligible air velocity, and a TMRT equal to the air temperature [40,41,42,43,44,45]. Mathematically, this correlation can be expressed using Equation (10) [44]:
U T C I =   f ( T a i r ; T M R T ; v ; v p )  
where v is the wind velocity (m/s), and vp is the humidity expressed as water vapor pressure or relative humidity.
The equivalent temperature of the UTCI can then be converted into a scale according to Table 2, which assesses thermal comfort on ten levels from ‘Extreme cold stress’ to ‘Extreme heat stress’ [44,46].

2.2.5. Comfort Hours and Outdoor Thermal Comfort Autonomy

Based on the UTCI calculations, the comfort hours—that is, the hours not under thermal stress, 9 °C to 26 °C according to the UTCI scale in Table 2—can be determined. From the comfort hours, the outdoor thermal comfort autonomy (OTCA) can be deduced as a metric describing the percentage of occupied hours an outdoor space lies within the defined thermal comfort range (see Equation (11)) [47,48].
OTCA = 1 N 1 n k = 1 N h r = h i h f U T C I
where N is the total number of analysis days, hi and hf denote the initial and final hours of occupation per day, and n is the total number of hours (n = hf − hi).

2.3. Case Study

The case study investigates the impacts of photovoltaic façades on the urban thermal microclimate and outdoor thermal comfort compared to conventional building façades. The analysis metrics described in Section 2.2 are graphically and numerically analyzed to evaluate the simulation results.
First, a microclimate map for the entire analysis site (see Section 2.1) is simulated. The maps help to define neuralgic points within the settlement, where the subsequent analysis is conducted. Then, the cell temperatures of the photovoltaic modules are compared to the surface temperatures of the conventional building façade. The conventional building wall is a brick wall with 4 cm of insulation and a rendered surface. For the PV case, the insulation thickness is increased to 14 cm, and the PV modules are added to the exterior building surface as ventilated façade cladding. The temperature differences between the respective surfaces and the ambient air temperature are analyzed to gain insights into the heat exchange phenomena between the building surface and its surroundings. Furthermore, the hourly ambient air temperature, mean radiant temperature, universal thermal climate index, and difference temperatures are examined for the cases with and without photovoltaic installations. To investigate the periods most critical to human health, the analysis periods are the hottest and coldest weeks of the year, and the data are hourly averaged for one day. Finally, a yearly analysis determines the yearly comfort hours and outdoor thermal comfort autonomy for the PV and non-PV cases. Table 3 details the input parameters for the simulation.

2.4. Parameter Study

The subsequent parameter study helps identify the parameters to which the analysis metrics are sensitive (see Section 2.2). The following parameters are investigated: The albedo of the reference façade, the photovoltaic efficiency, and the photovoltaic mounting situation (see Table 4). The analysis period is the hottest week (19–25 July), and the simulation results are weekly averaged and analyzed at noon. The analysis is graphically displayed using the Design Explorer tool [50].

3. Modeling Workflow

The modeling workflow is based on the simulation platform Grasshopper. Grasshopper is a visual programming interface for the CAD program Rhino 3D. The use of Grasshopper allows the creation of generative geometrics and parametric designs. Using various plug-ins summarized in Ladybug Tools, validated simulation programs such as EnergyPlus and Radiance are linked to Grasshopper and Rhino 3D for various environmental and building-related analyses. These are open-source, dynamic simulation programs in which many parameters can be freely defined. Grasshopper thus provides an interface between different simulation software and an integrative, flexible platform for environmentally conscious design and thus enables the combined modeling of photovoltaics and the microclimate [51].
Figure 3 shows the developed modeling workflow and the data flows between the single simulation engines.

3.1. Grasshopper, Rhino3D, and Honeybee: Definition of the Geometry

The building geometries are parametrically created using Grasshopper and displayed in Rhino 3D (version 7). Afterward, they are assigned names, usages, materials, and constructions with specific properties via the plug-in Honeybee. The surfaces covered with photovoltaics are denoted, and the component properties are adapted accordingly. In addition, an analysis grid at a height of 1.6 m above the ground is created, a height relevant to human comfort.

3.2. Urban Weather Generator 4.1 (UWG): Modeling of the UHI

The weather data from Munich Airport (2007–2021) in the EnergyPlus Weather Format (EPW) provide the climatic basis for the modeling [52]. The UWG (version 4.1), integrated into Grasshopper via the plug-in Dragonfly, adapts the weather data to account for the urban heat island effect by using site-specific information on urban geometry, building density, greening, sealing, and traffic. The calculations of the UWG are based on the Town Energy Balance model [53]. First, the ambient air temperature above the urban layer is determined. The urban air temperature and humidity are calculated based on these radiation data and precipitation data and the air temperature, wind velocity, and humidity measured at the airport weather station. The result is a spatially constant air temperature and humidity for the entire metropolitan area, stored in an urban weather data set in EPW format. This urban weather data set replaces the airport weather data in the later work of the simulation model. However, the UWG does not capture microclimatic effects for specific locations within the city, requiring more concise microclimate modeling in the following modeling workflow [54,55,56].

3.3. Radiance 5.4: Radiation Aanalysis

The Radiance software (version 5.4) determines the incident solar radiation on urban surfaces. Radiance is a validated program for radiation analysis with an error of +/− 10% based on the ‘backward raytracing’ method, meaning that the solar rays are traced from the point of incidence back to the light source. Raytracing is based on physical principles and the most accurate radiation analysis method. In addition to direct and diffuse solar radiation, Radiance also considers reflections, which can be freely defined [57,58,59,60,61]. Three reflections are taken into account in this study to achieve an appropriate compromise between accuracy and the simulation time [62]. The results of the radiation analysis serve as input for the simulation of surface temperatures, cell temperatures, and the urban thermal microclimate.

3.4. EnergyPlus 23.2.0: Calculation of Surface Temperatures

EnergyPlus is software for thermal building simulation. In the present workflow, EnergyPlus (version 23.2.0) calculates the building surface temperatures based on the heat balances (see Section 2.2), assigned room programs, internal loads, and constructions.

3.5. Ladybug Tools 1.7: Integration of Photovoltaicse

For façades with building-integrated photovoltaics, the building surface temperatures are replaced with the cell temperatures of the photovoltaic modules. The calculation of the module temperatures is explained in detail in Section 2.2.

3.6. Ladybug Legacy 0.66 and 0.69: Calculation of TMRT, Ta, and the UTCI

In addition to integrating photovoltaics into the simulation, Ladybug is also used to calculate TMRT, Ta, and the UTCI according to Equations (1)–(10) explained in Section 2.2.

4. Results

4.1. Case Study

4.1.1. Comfort Map

Figure 4 shows a comfort map of the analyzed district without photovoltaic installations, expressed using the Universal Thermal Climate Index (values weekly averaged for the hottest week (19–25 July)). The areas in front of the east and west façades show lower UTCI values during summertime and provide higher thermal comfort. The open spaces in front of the south façades reach up to 2.0 K higher UTCI values—hence, they are prone to overheating and the provision of thermal discomfort. Thus, further analysis is conducted 0.5 m in front of the south façade to analyze the most critical areas within the district, as shown in Figure 4.

4.1.2. Surface Temperatures

Figure 5a,b show the cell temperature of the façade-integrated PV modules and the surface temperature of the conventionally rendered façade for the hottest (19–25 July) and coldest weeks (13–19 December), respectively. Despite converting solar radiation into electricity instead of heat, the PV cell temperatures are higher than the building surface temperatures. In summer, the differences reach a maximum of up to +8.60 K during the day (1 p.m.), while both temperatures converge at night with an absolute maximum of +2.41 K at 9 p.m. In winter, the temperature differences during daytime are higher, with a maximum difference of +13.75 K at 2 p.m. At night-time, both temperatures are nearly identical, with a maximum difference of +0.56 K at 8 p.m. The temperature differences are due to the lower albedo of the PV modules (0.1) [63] compared to the reference façade (0.3), leading to a higher solar absorption during daytime.
As shown in Figure 5c, the difference between the daytime temperature of the cell and the ambient air temperature reaches up to +9.99 K at 1 p.m. in summer. During night-time, the Tcell is slightly lower than the Tair, with a maximum temperature difference of −0.94 K at 10 p.m. The building surface temperature only exceeds the surrounding ambient air temperature between 12 a.m. and 4 p.m., with a maximum temperature difference of +1.39 K at 1 p.m. During night-time, the Tsurf is up to −3.66 K lower than the Tair. As the convective heat exchange is proportional to the temperature difference [5], the convective heat fluxes from the PV façade to its surroundings are higher than those from the conventional façade to its surroundings.

4.1.3. Ambient Air Temperature, Mean Radiant Temperature, and the Universal Thermal Climate Index

While installing PV modules on the building façades does not affect the adjacent ambient air temperature (see Figure 6a), it impacts the mean radiant temperature and the Universal Thermal Climate Index. In the summertime, TMRT,PV is higher than TMRT,REF, particularly during the daytime (see Figure 6b). The differences reach an absolute maximum of +5.47 K (daytime, 2 p.m.) and +1.07 K (night-time, 9 p.m.). The higher TMRT,PV is primarily induced by the higher longwave radiative fluxes caused by higher daytime cell temperatures (see Figure 5), while the shortwave radiative fluxes remain similar. Figure 6c shows the impact of photovoltaic façades on human thermal comfort, expressed using the Universal Thermal Climate Index. As the UTCI is affected by both Tair and TMRT (see Equation (10)), the UTCI of both façades has a smaller disparity than TMRT. During the daytime, the UTCI in front of the PV façade is slightly higher, reaching a maximum difference of +1.47 K at 2 p.m. During night-time, the UTCI of both façades is nearly identical, with a maximum difference of +0.31 K at 9 p.m. In both cases, the UTCI exceeds the threshold of 26 °C, indicating human exposure to thermal heat stress (see Table 2) on the hottest day for several hours.
The installation of PV modules on the building façades does not affect the adjacent ambient air temperature during wintertime either (see Figure 7a). Still, it impacts TMRT (see Figure 7b). During the daytime, the mean radiant temperature in front of the PV façade is up to +6.27 K higher when compared to the TMRT,REF in front of the reference façade. During the night-time, the mean radiant temperatures converge, and the temperature in front of the conventional façade is slightly higher, with a maximum difference of up to +0.27 K at 3 a.m. As the shortwave solar irradiation is low in winter, the TMRT in front of both the PV and the reference façade is almost solely affected by longwave radiative fluxes. Hence, the TMRT is nearly equal to the TMRT,lw (see Figure 7b). As shown in Figure 7c, installing PV façades does not affect human thermal comfort during night-time. During the daytime, the higher PV cell temperatures and hence the higher TMRT,PV induce a higher UTCI in front of the PV façade, with a maximum difference of +2.21 K at 3 p.m. In both cases, the UTCI stays continuously below the threshold of 9 °C, indicating human exposure to thermal cold stress (see Table 2).
Figure 8a shows the hourly mean radiant temperature weekly averaged for the hottest week at different distances from the building façade. During the daytime, with solar irradiation impinging on the façade, the TMRT,PV 0.1 m in front of the PV façade is up to 1.64 K higher (at 2 p.m.) than the TMRT,PV at a distance of 2.5 m from the façade. During night-time, TMRT,PV remains constant, regardless of the distance from the façade. For the conventionally rendered façade, the differences in the TMRT,REF with an increasing distance from the façade are not as pronounced. During the daytime, TMRT,REF even increases with a larger distance from the façade by up to +0.56 K at noon (see Figure 8b). Still, even 2.5 m from the building, the mean radiant temperature in front of the PV façade is up to +3.72 K (at 2 p.m.) higher compared to the TMRT in front of the conventional façade.
The results show that the higher daytime longwave radiative heat transfer of the PV façade due to a lower albedo; hence, higher solar absorption and higher surface temperatures (see Figure 5) still affect TMRT,PV with an increasing distance from the façade. Thus, pedestrians perceive the radiative impact even at a distance of a few meters from the building. As the view factor of the façade decreases with a growing distance, the warming impact is weakened. For the reference case, the increasing distance from the façade heightens the view factors to further surrounding surfaces with a higher longwave radiative heat transfer and to the sky with shortwave radiative impacts. Hence, the TMRT,REF slightly increases with a distance larger than 2.5 m from the façade.
The UTCI values show a similar trend: with an increasing distance from the PV façade, the UTCIPV slightly decreases, although only by up to −0.44 K at 2 p.m. (see Figure 8c). The decline in the UTCI is lower than in that in the TMRT because, alongside the radiative heat fluxes, Tair impacts the UTCI.

4.1.4. Comfort Hours and Outdoor Thermal Comfort Autonomy

The yearly analysis summarized in Table 5 shows that installing photovoltaics onto building façades increases the overall comfort hours by 80 compared to the reference case. The hours with a UTCI above 26 °C, indicating heat stress (see Table 2), are increased by 86 h, while those with a UTCI below 9 °C, indicating cold stress (see Table 2), are decreased by 176 h. This results in an outdoor thermal comfort autonomy of 44.20% for the PV and 43.29% for the reference case.

4.2. Parameter Study

Figure 9 displays the results of the parameter study for the cell and building surface temperatures. Photovoltaic modules with a high efficiency of up to 30% (STC) lead to cell temperatures up to −8.73 K lower than those of a PV module not producing energy. Besides the efficiency, the mounting type affects the cell temperature. An installation of the PV modules without rear insulation increases the Tcell by up to +3.78 K compared to an installation with ample rear ventilation. Similarly, differences in the albedo of the reference building façade lead to changes in the Tsurf,REF: Albedo values of 0.7—and hence 30% solar absorption—lead to building surface temperatures of +25.64 °C, while a lower albedo of 0.1—and thus a solar absorption of 90%—increases the Tsurf,REF by +11.81 K. Even with an efficiency of 30%, an installation with rear ventilation, and an albedo of the reference building façade of 0.1, the Tcell remains +1.74 K higher than the Tsurf,REF. Hence, at the current efficiencies, PV modules consistently show higher temperatures at noon.
Figure 10 displays the results of the parameter study for the mean radiant temperature of the PV and the reference case. Lower cell temperatures due to higher efficiencies and ample rear ventilation (see Figure 9) reduce the TMRT,PV by up to −4.11 K. The higher albedo values of the reference building surface reduce the TMRT,REF by up to −1.04 K. All the simulation cases considered the TMRT,PV was between +3.14 K and +8.22 K higher than the TMRT,REF. Hence, with perspective top efficiencies of up to 30%, the PV façades consistently lead to a higher mean radiant temperature at noon.
In comparison to the surface temperatures (see Figure 9) and mean radiant temperature (see Figure 10), the Universal Thermal Climate Index reacts less sensitively to changes in the input parameters (see Figure 11). The higher PV efficiencies and ample rear ventilation of the PV modules lower the UTCIPV by up to −0.93 K. The higher albedo values of the reference building surface reduce the UTCIREF by up to −0.12 K. All the simulation cases considered, the UTCIPV is between +0.79 K and +1.96 K higher than the UTCI,REF. Hence, at the current efficiencies, PV façades consistently lead to a higher Universal Thermal Climate Index at noon.

5. Discussion

The present study investigates the impact of photovoltaic façades on the urban thermal microclimate and outdoor thermal comfort with the following key results:
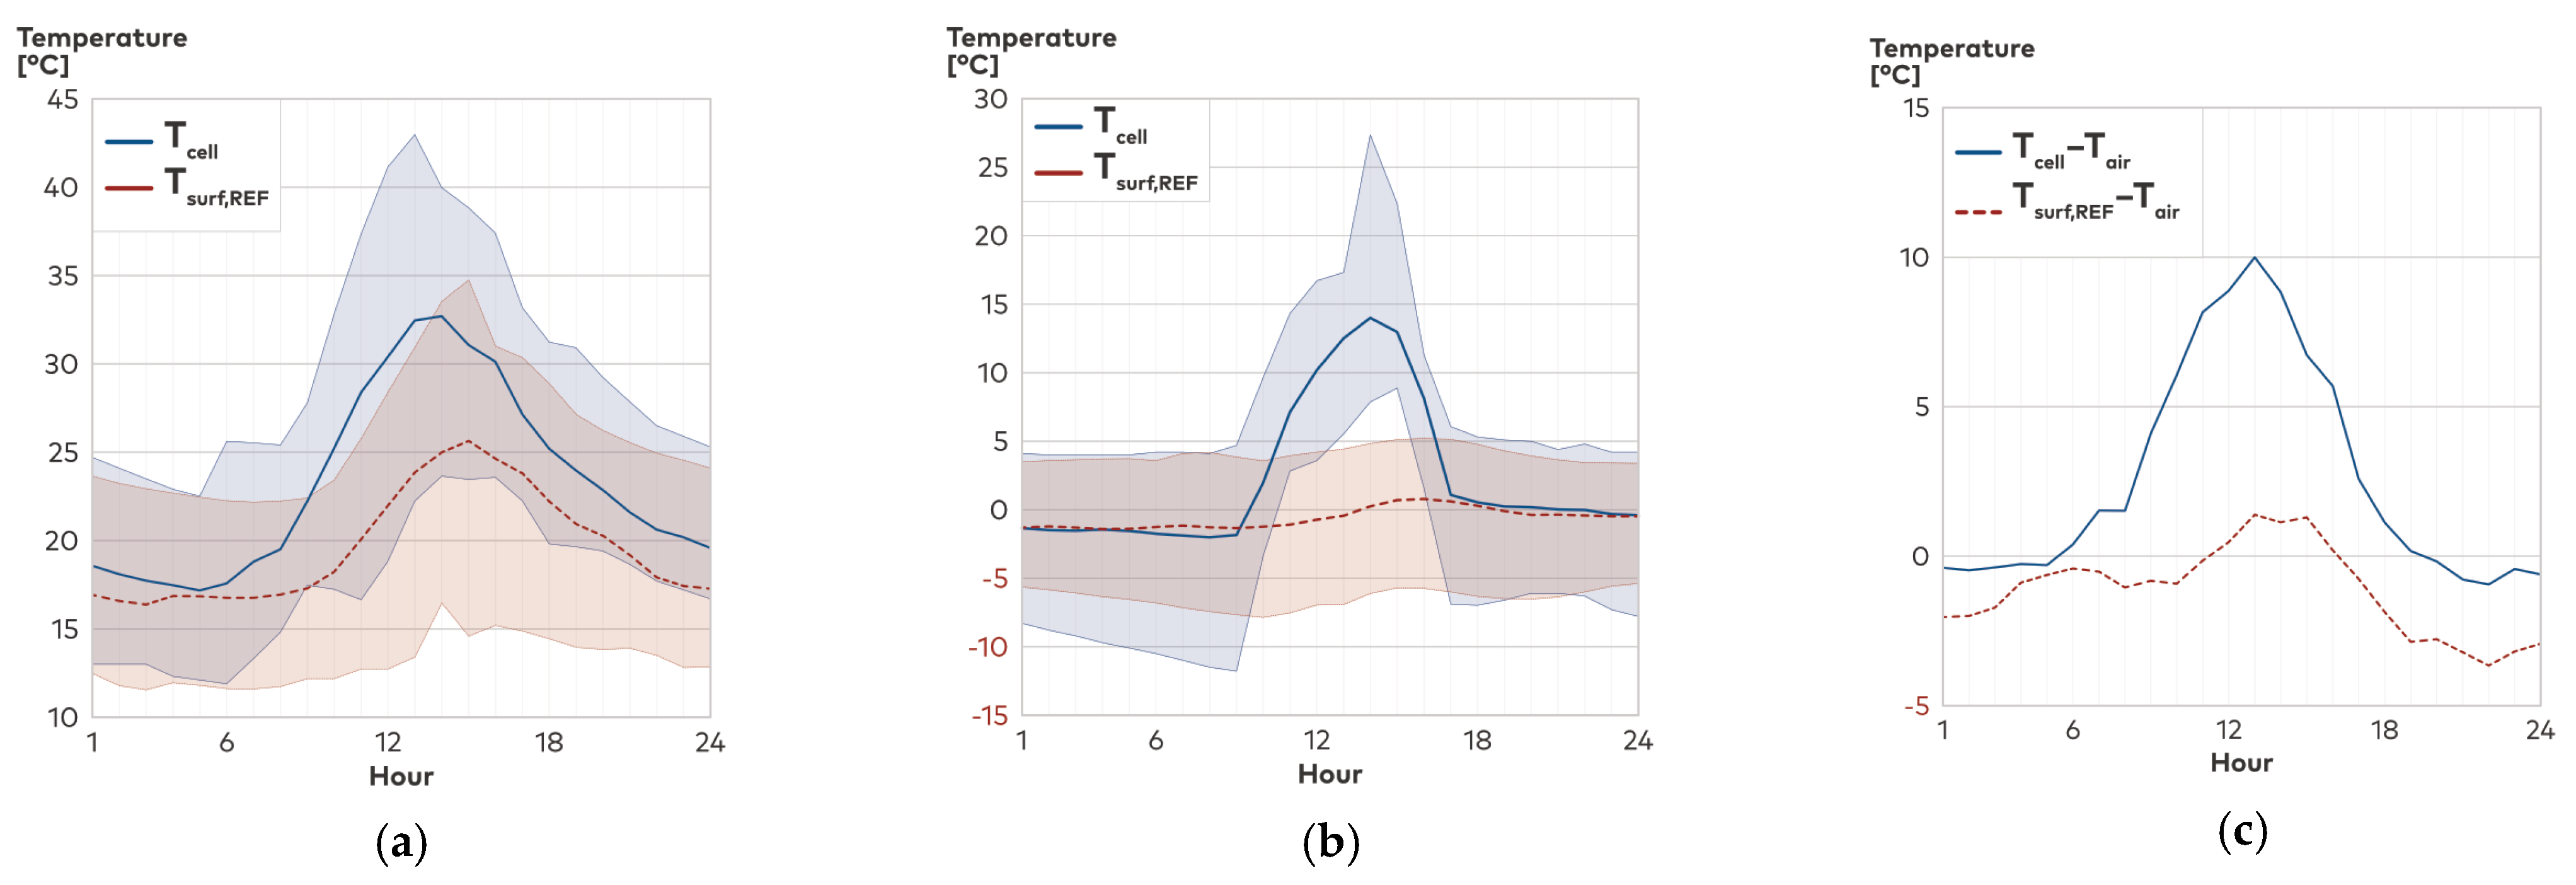
The PV modules replacing a ventilated façade cladding reach higher cell temperatures than the surface temperature of a rendered façade, particularly during the daytime. In summer, the temperature difference reaches up to +8.60 K; in winter, the cell temperature is up to +13.75 K warmer. Hence, converting solar radiation into electricity instead of heat can only partly compensate for the higher solar absorption. The daytime results correlate with the findings of Cortes et al. [16]. However—contrary to our results—they identified the cell temperatures to be lower than the conventional building surface temperatures during night-time. In contrast, Tian et al. [13] simulated a perpetual surface temperature reduction by installing PV modules. This result, however, is due to the assumption of a low albedo of the reference façade of 0.1, leading to high surface temperatures. Analyzing the temperature difference between the ambient air temperature and cell or surface temperature, respectively, provides insights into the convective heat fluxes between the building façade and the surrounding air. As the temperature difference between the cell and ambient air temperature, reaching a maximum of +9.99 K, is higher than the difference between the building surface and ambient air temperature, with a maximum difference of +1.39 K, the convective heat fluxes from the PV modules to their surroundings are considerably higher. These results correlate with the findings of Brown et al. [64], Scherba et al. [65], Pham et al. [66], and Fassbender et al. [6,67].
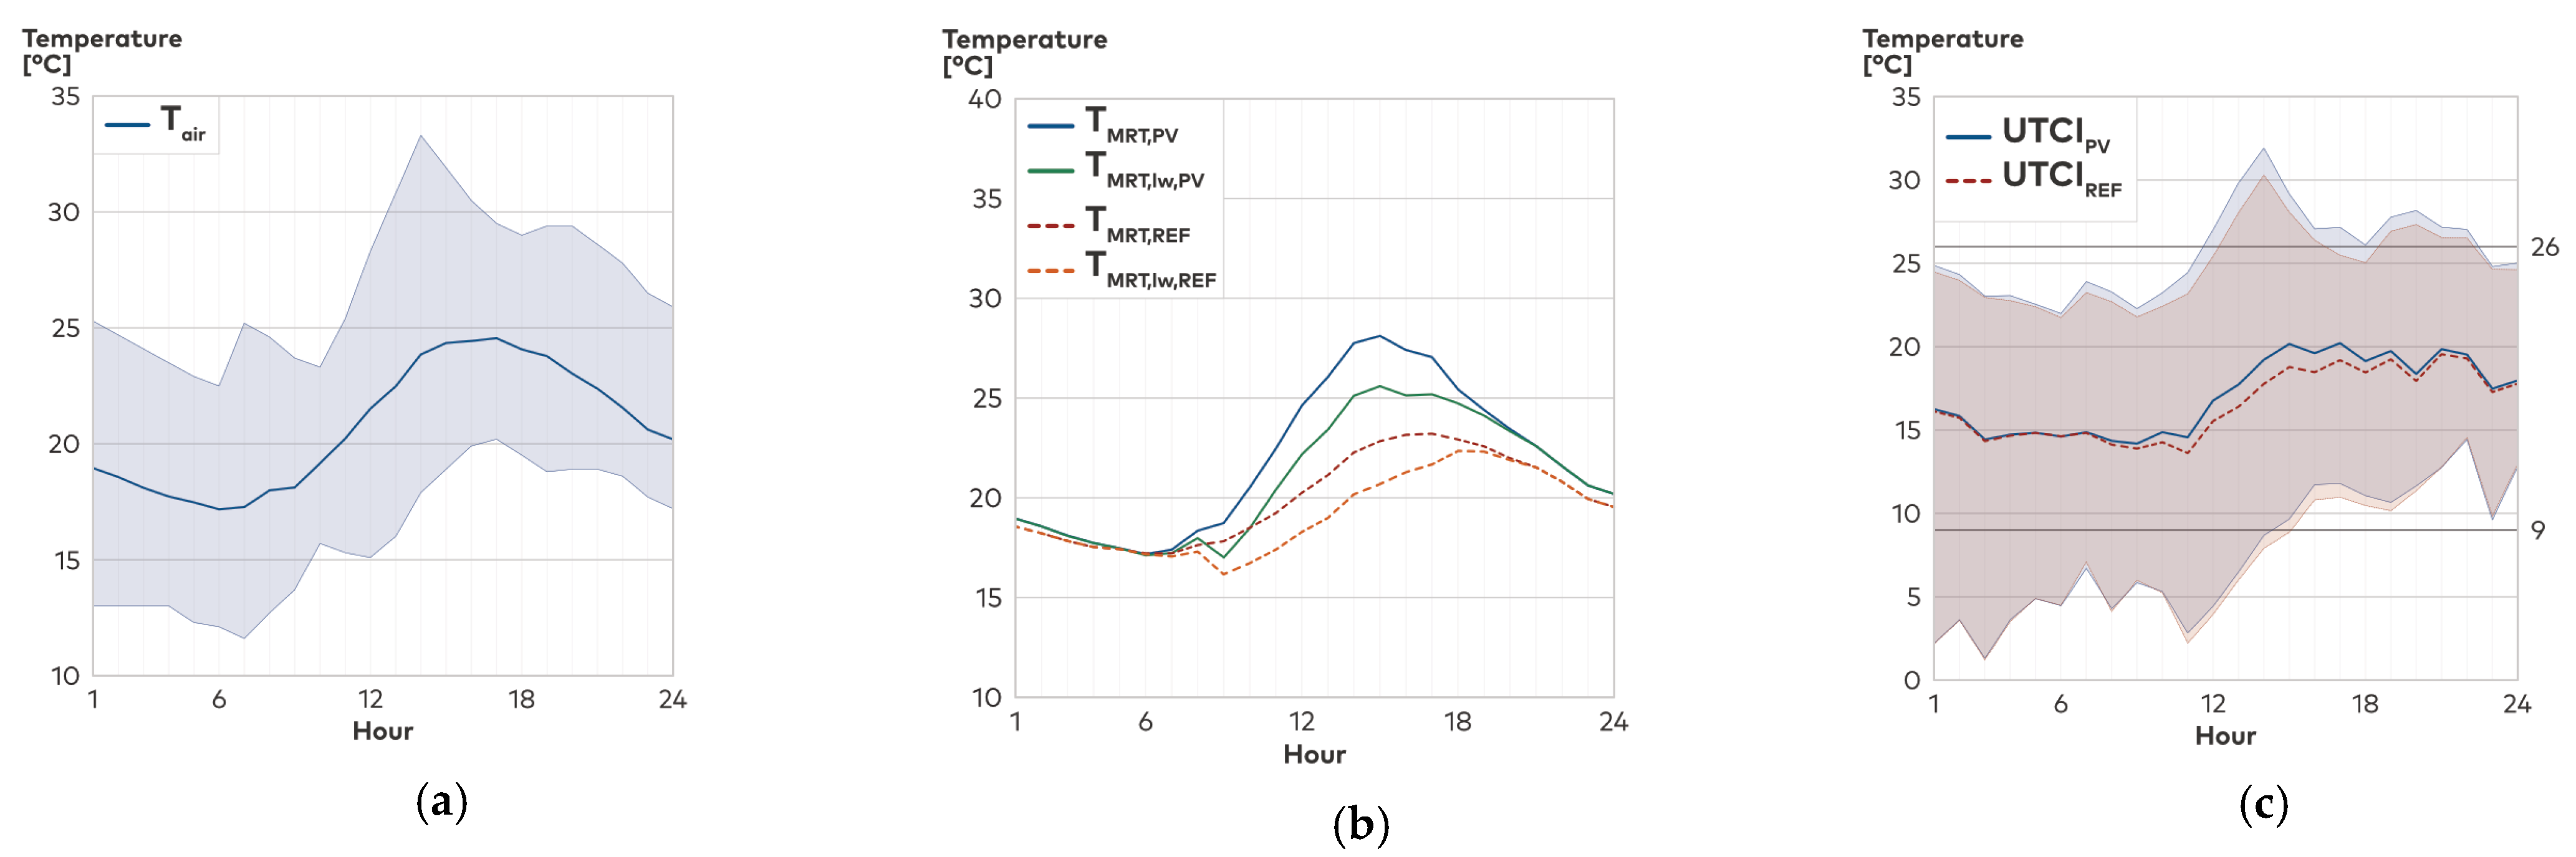
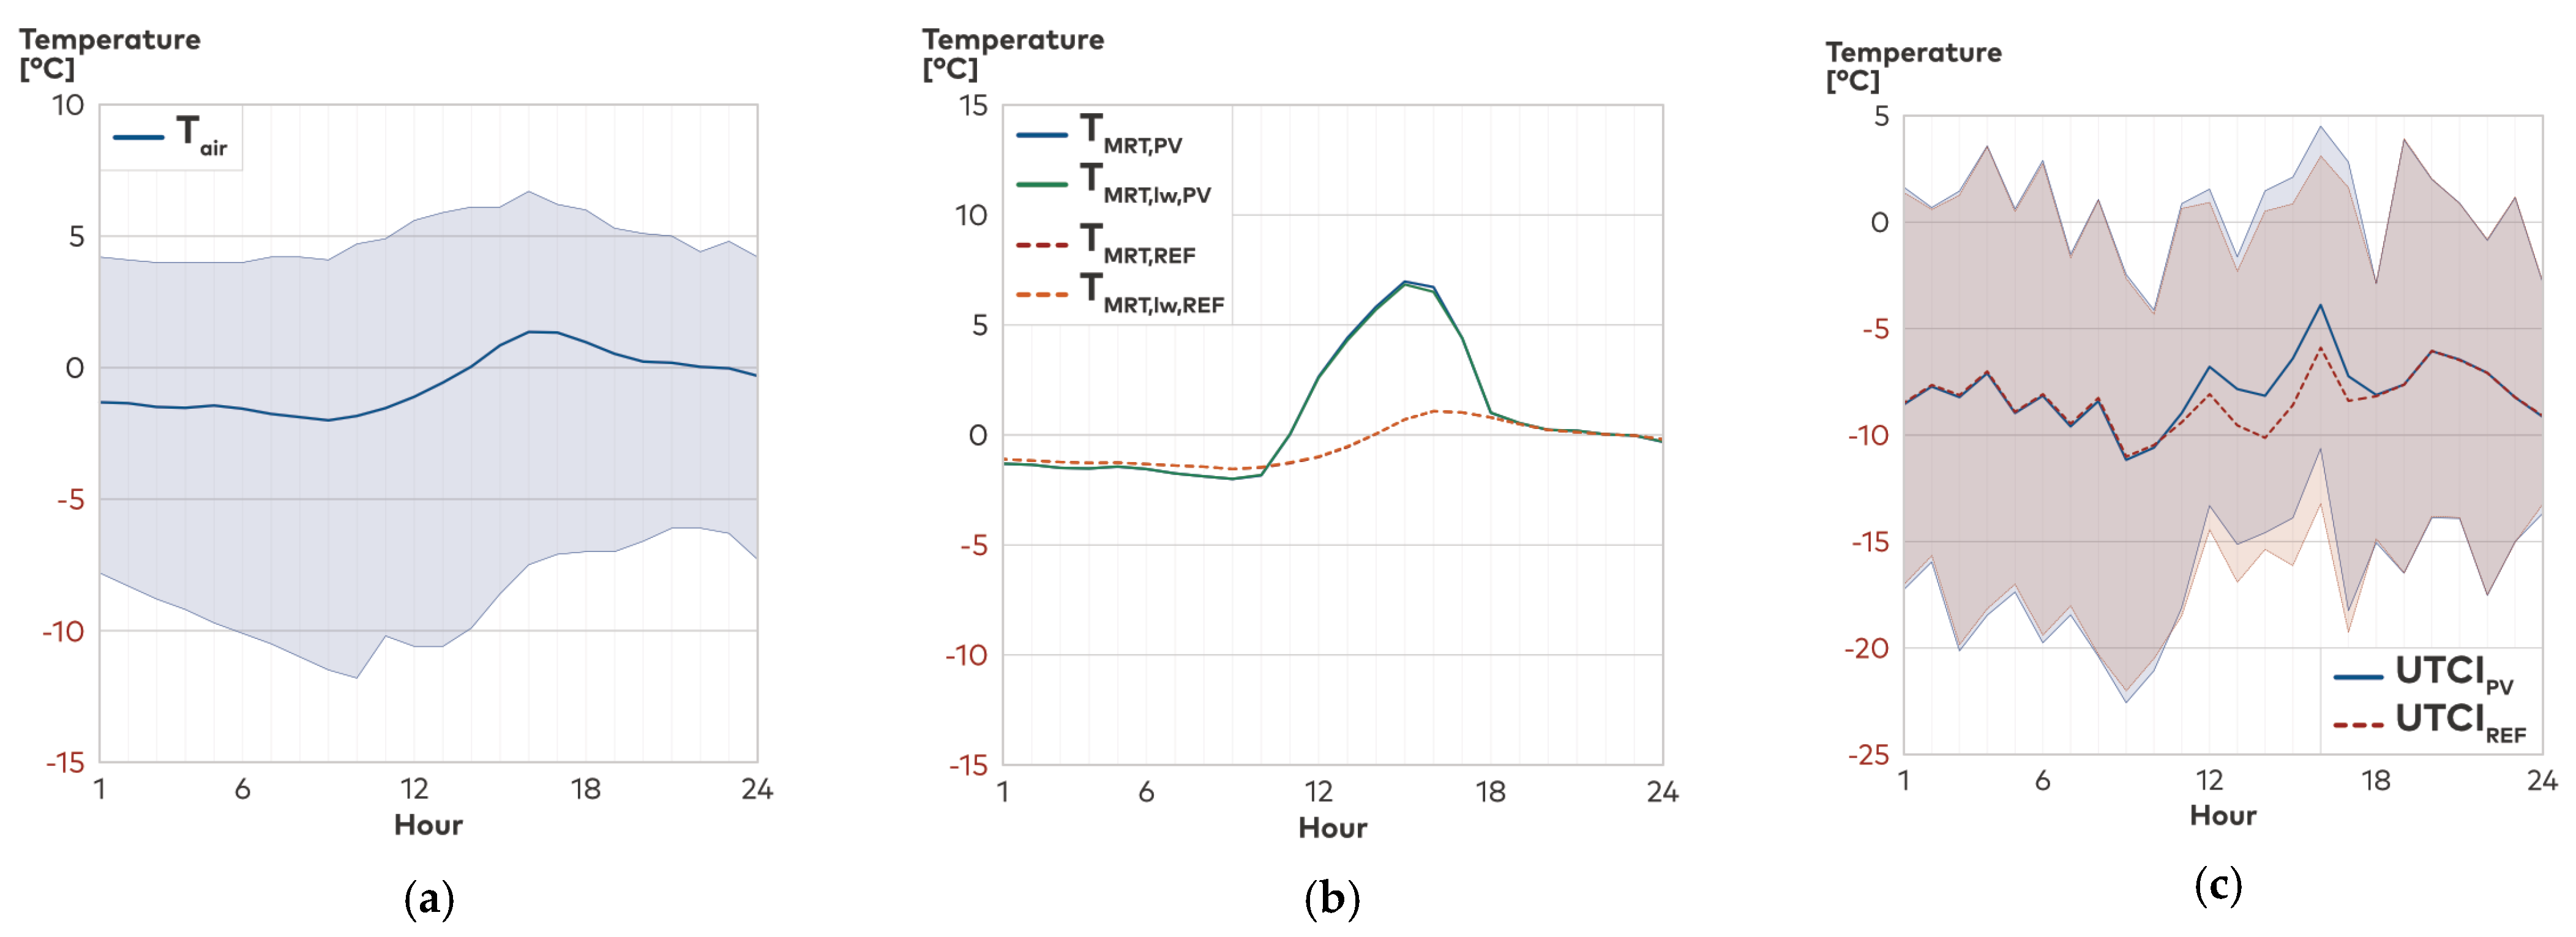
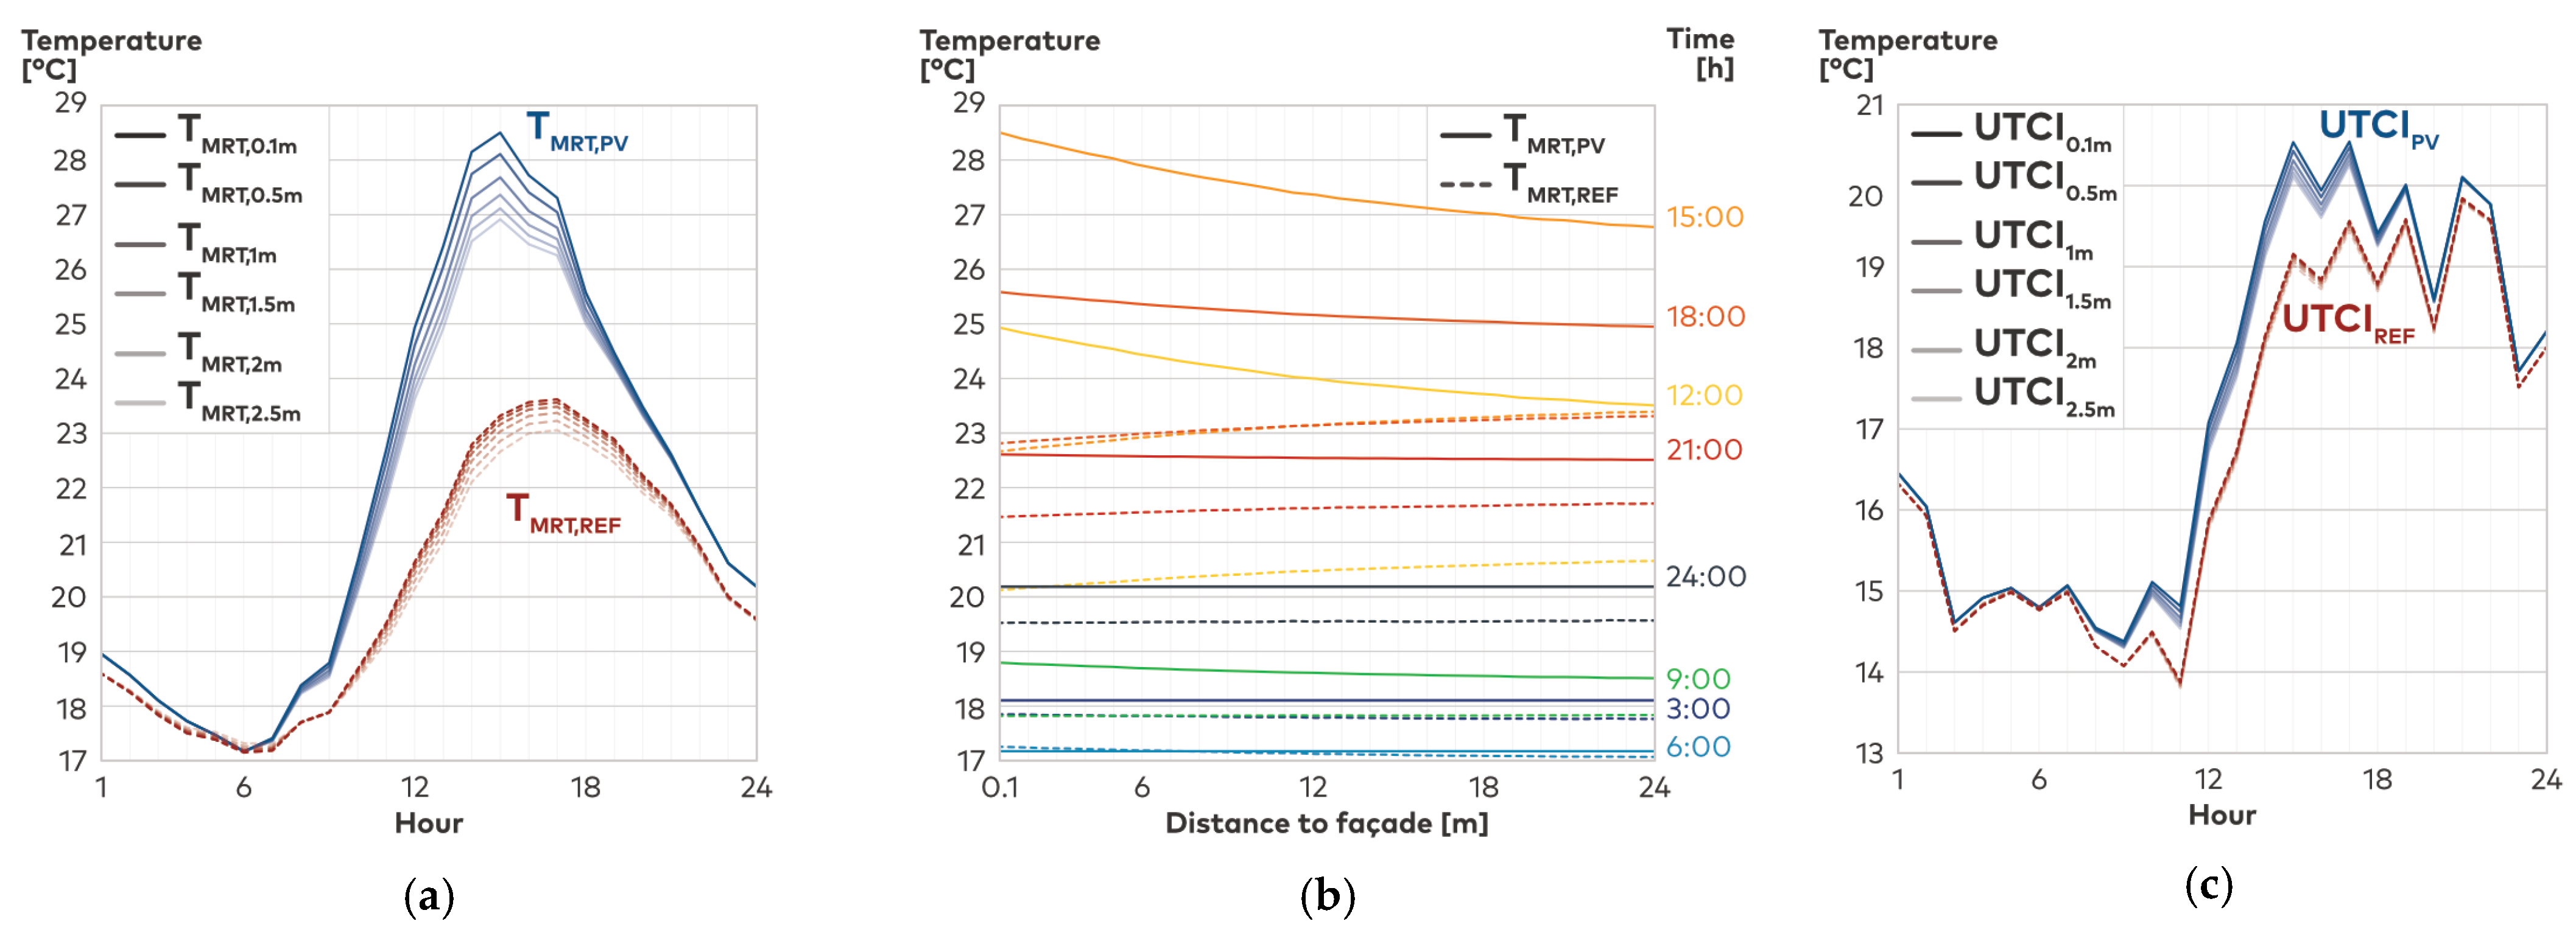
The higher temperature of the outer building layer leads to an elevated mean radiant temperature in front of the building with a PV installation compared to the reference case, reaching a maximum difference of +5.47 K in summer and +6.27 K in winter at a distance of 0.5 m from the façade. While the daytime warming effect is most pronounced directly in front of the façade, the elevated mean radiant temperature is still perceptible by up to +3.72 K at a distance of 2.5 m from the building façade, due to the relevance of longwave radiative heat fluxes to the determination of the TMRT. Hence, the PV-induced increased mean radiant temperature is perceptible to pedestrians directly in front of the façade and to passersby in the urban canyon. The simulation results correlate with the studies of Herrmann and Matzarakis [31] and Evola et al. [38]; however, the simulated mean radiant temperature in our study is considerably lower than in other studies [14,19]. The discrepancies between the studies rely on the complexity of calculating the mean radiant temperature due to the superimposed radiant flux densities, particularly in complex urban configurations [28,33,37]. The algorithm applied using Ladybug, and hence applied in our simulations, is known to underestimate the mean radiant temperature [29].
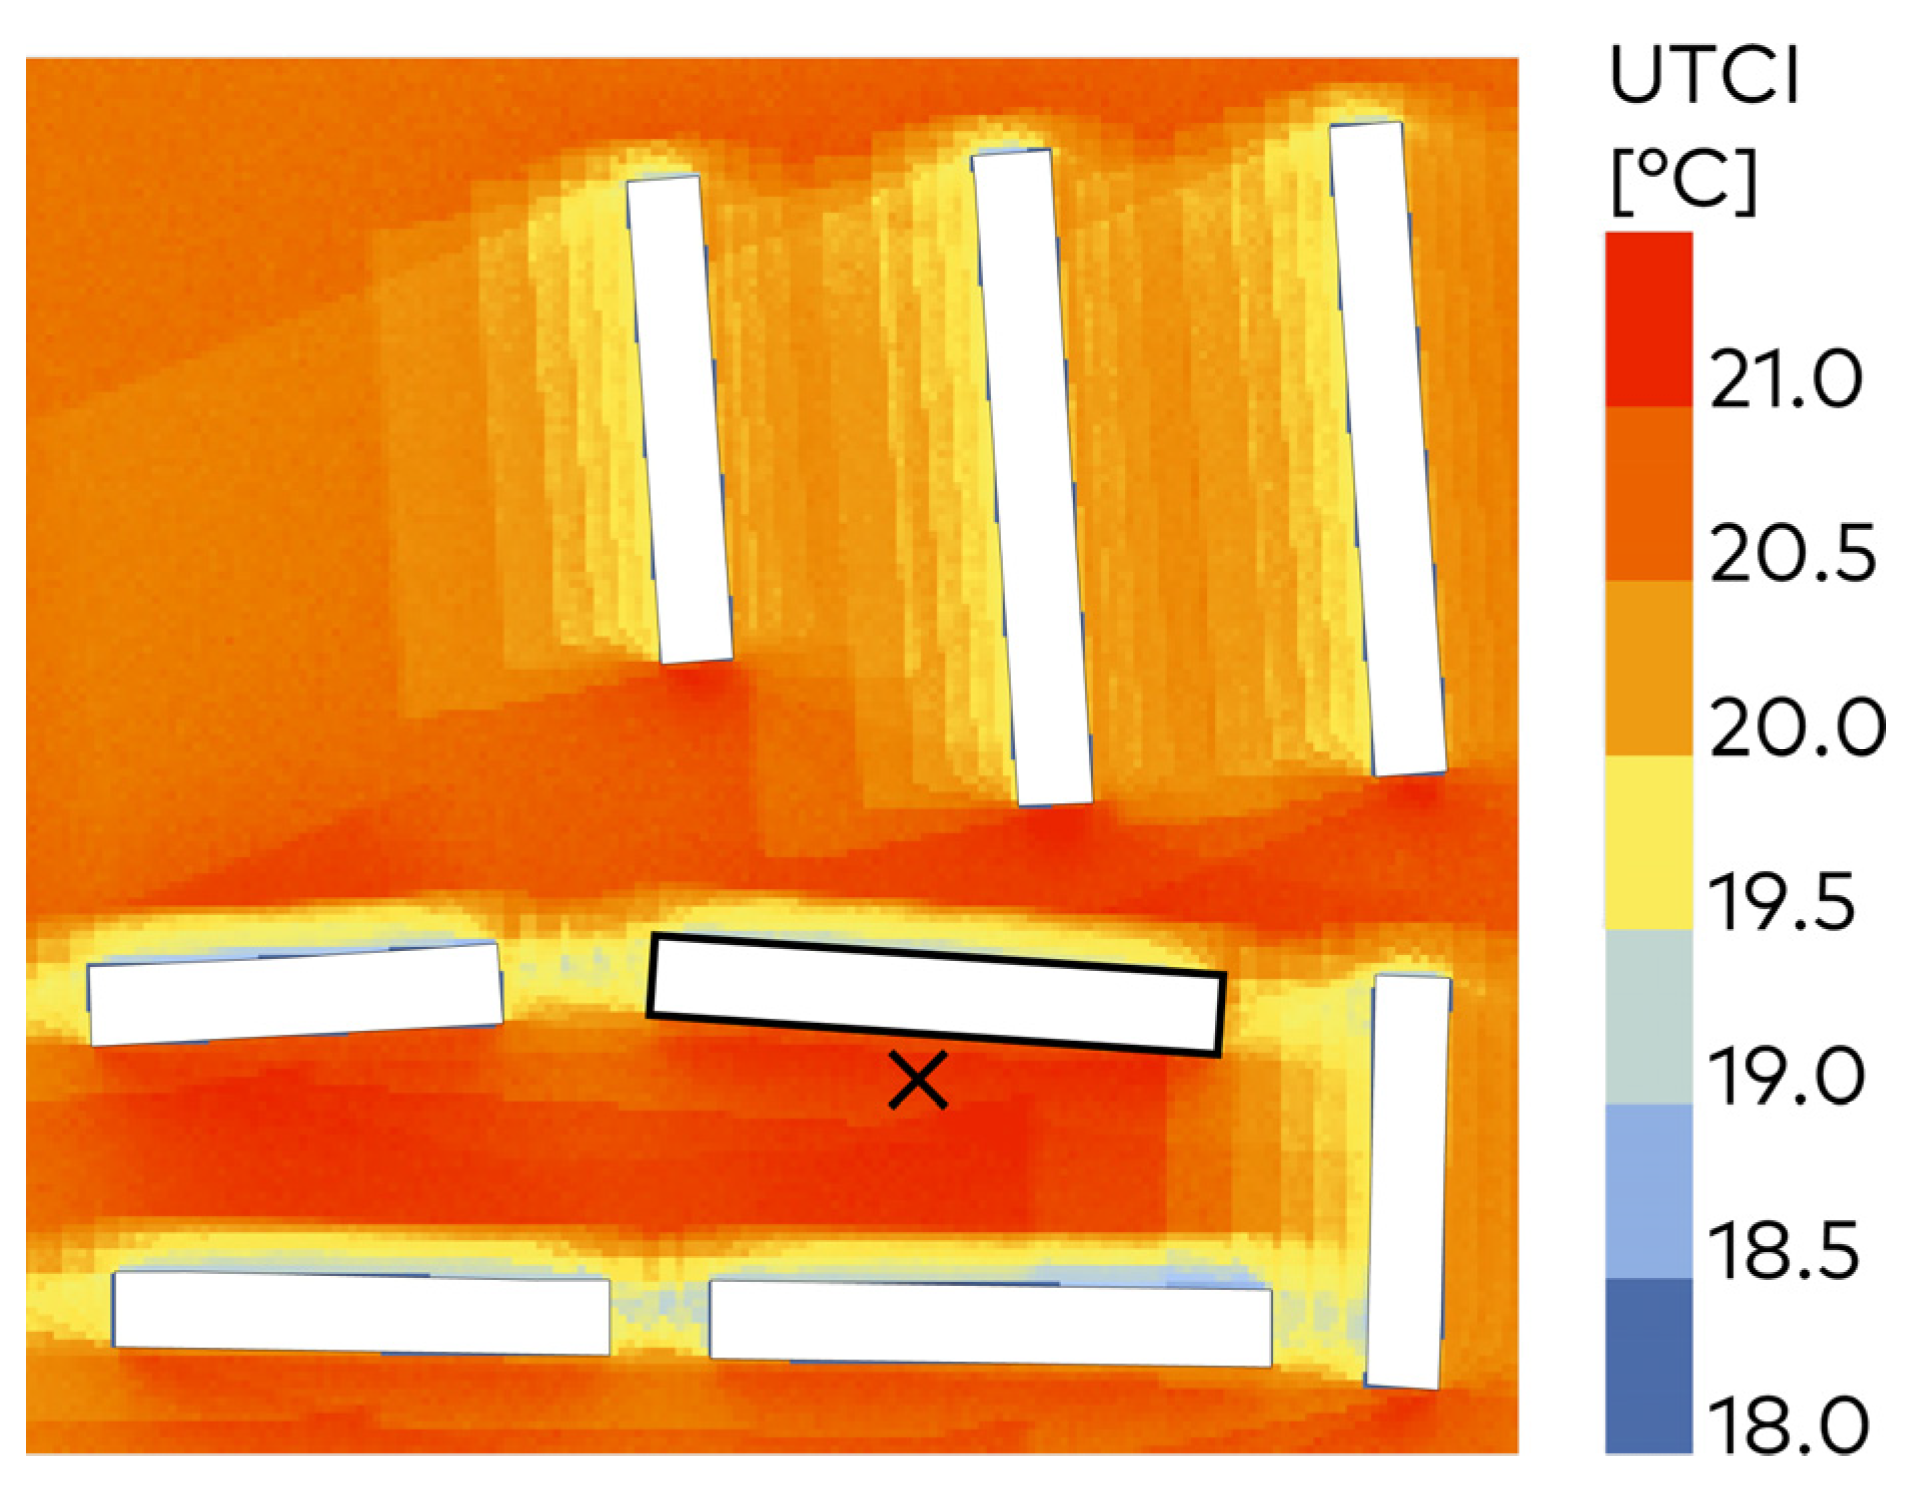
The higher daytime surface temperature and hence the higher mean radiant temperature in the PV case also impacts human outdoor thermal comfort, expressed using the Universal Thermal Climate Index. As the UTCI is affected by several factors (ambient air temperature, wind velocity, humidity, and mean radiant temperature), the PV warming effect is less pronounced in the UTCI than in the TMRT, reaching a difference of up to +1.46 K in summer and +2.21 K in winter. Hence, the PV installation affects the UTCI negatively in summer and positively in winter but to a lesser extent than the mean radiant temperature. The higher UTCI values in winter lead to lower cold stress, hence resulting in a higher annual outdoor thermal comfort autonomy in the PV case by 0.91%. In summer, when thermal stress can negatively affect human health, installing PV modules on the building façades increases the hours of heat stress by 86. However, the higher UTCI values solely occur during the daytime, while the temperature during the night-time hours relevant to human recovery remains identical.
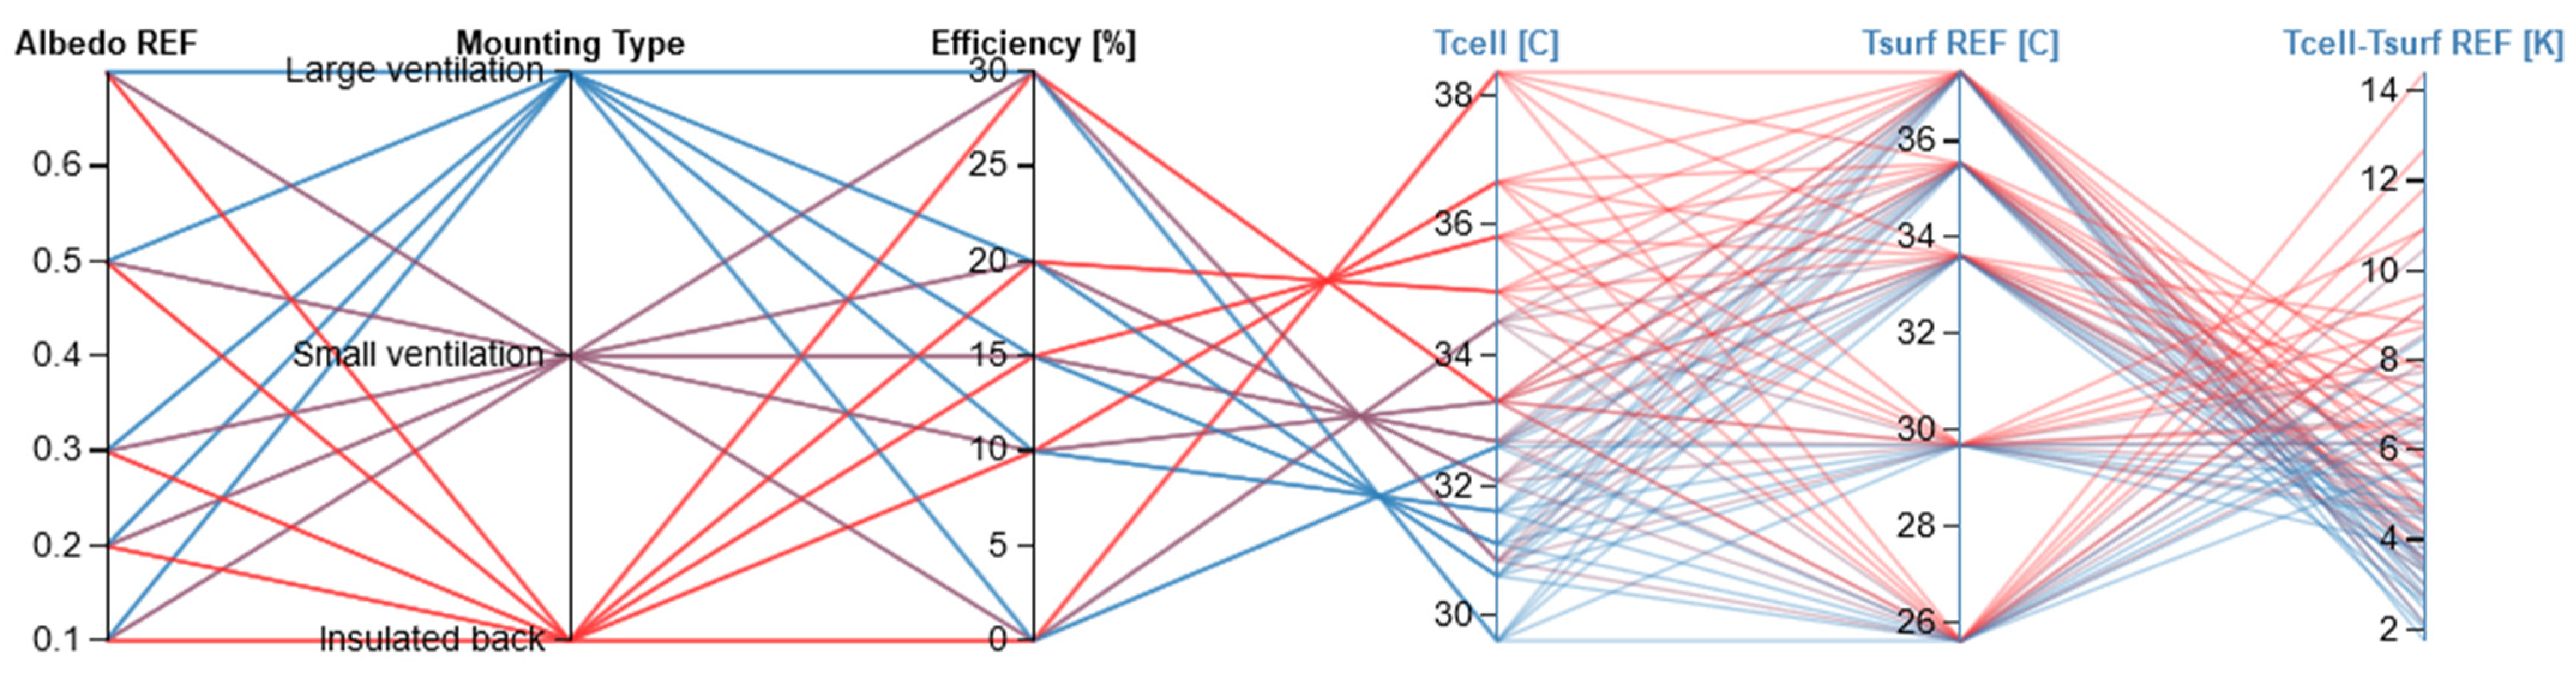
The parameter study reveals that the Tcell reacts more sensitively to changes I then PV efficiency (up to +/− 8.73 K) than to changes in the mounting situation of the PV modules (up to +/− 3.78 K). The surface temperatures of the reference façade vary by up to +/− 11.81 K depending on its solar absorption. In accordance with the case study results, the variations in the cell and surface temperature are significant, while they are less pronounced for the T
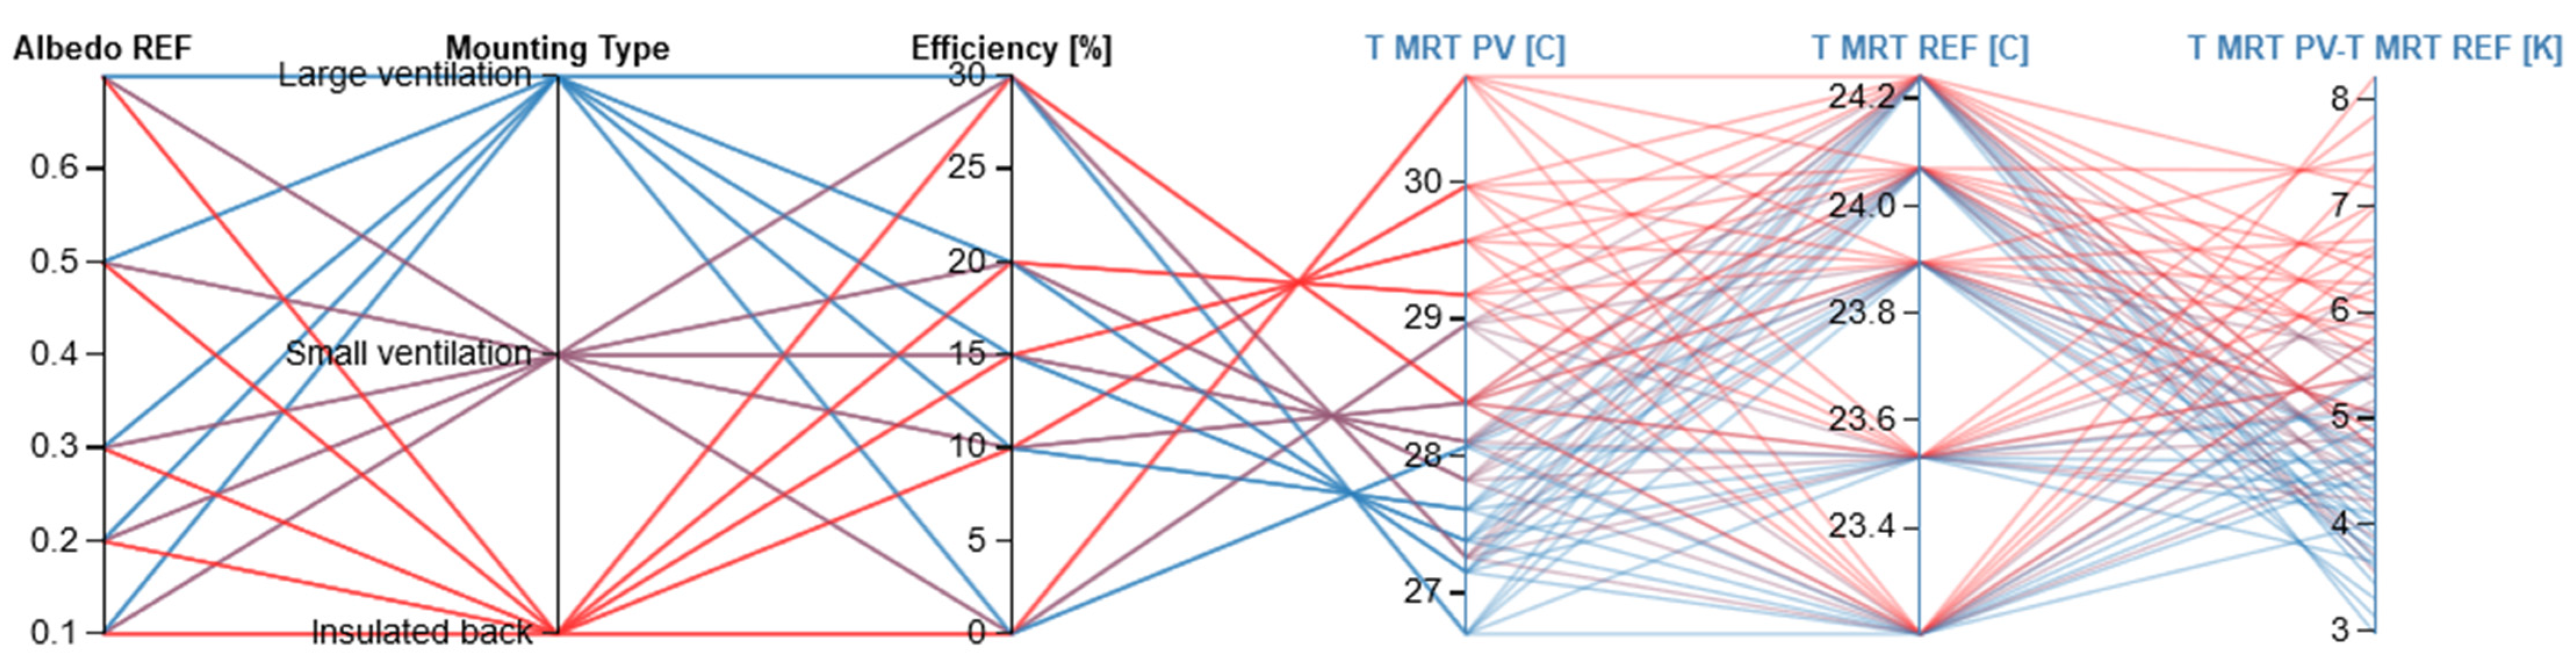
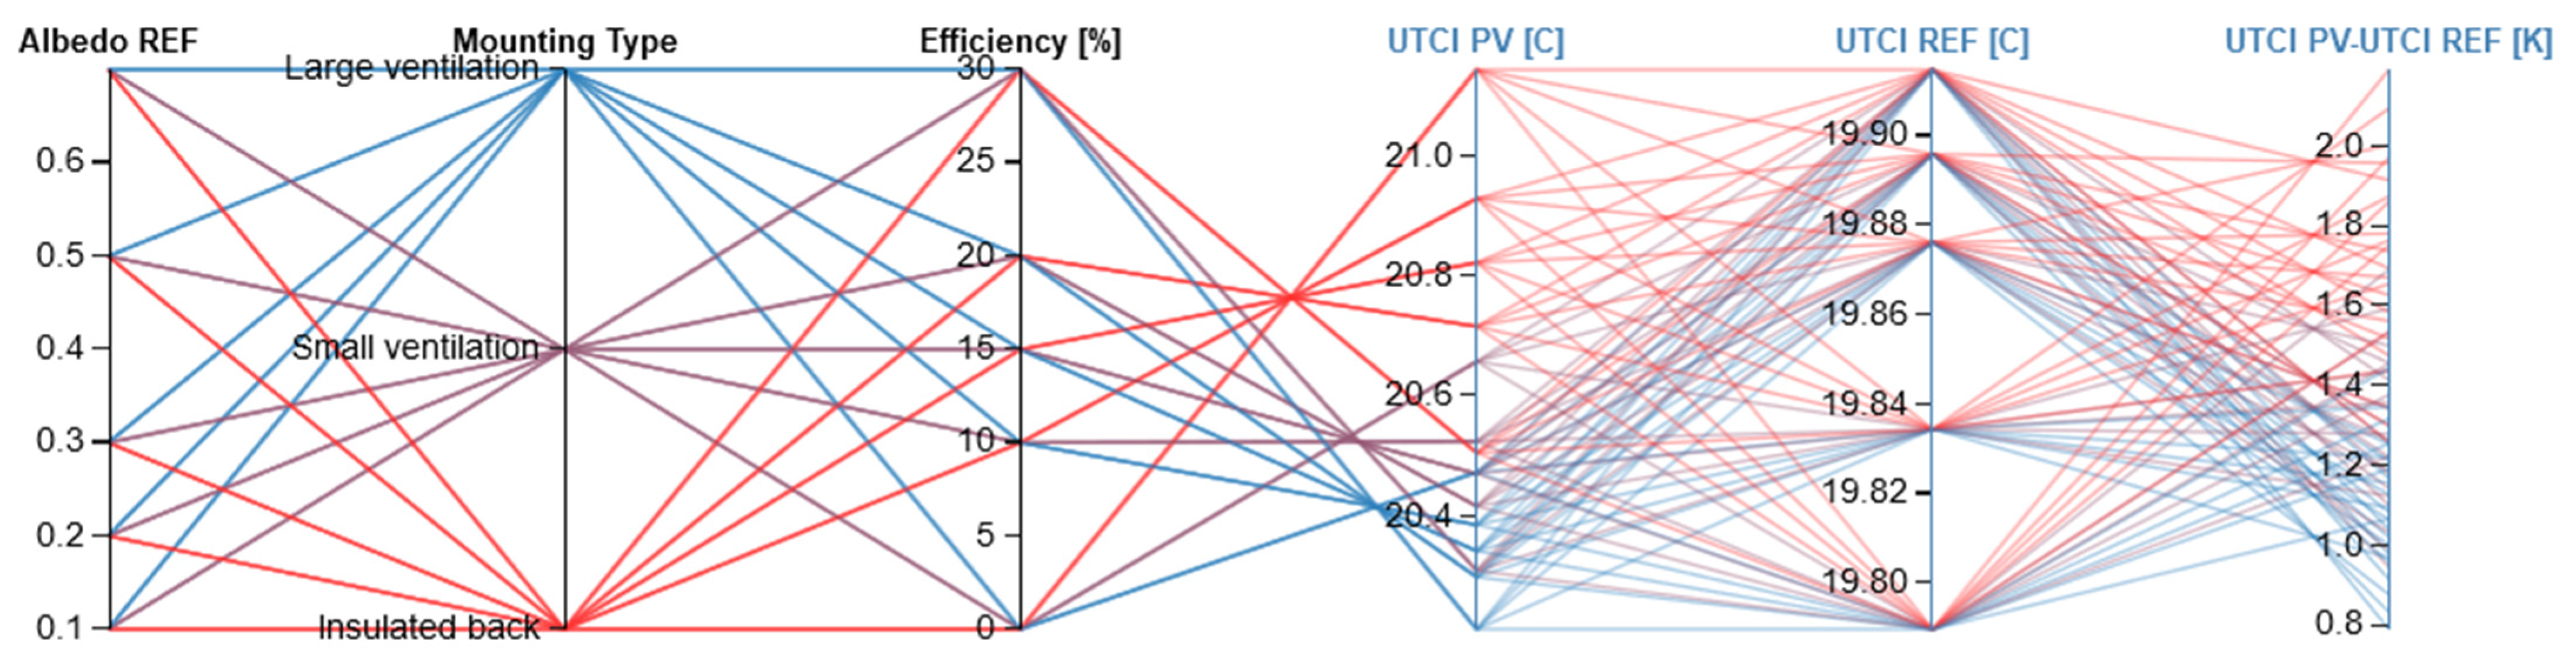
MRT and even less for the UTCI. All the simulation cases considered, the PV façades consistently lead to higher surface temperatures (+1.74 K to 14.44 K), mean radiant temperatures (+3.14 K to +8.22 K), and a higher Universal Thermal Comfort Index (+0.79 K to +1.96 K) during the hottest week at noon. Thus, even with PV efficiencies of 30%, the energy removal due to electricity production could not entirely compensate for the higher solar absorption. Within the next ten years, PV efficiencies are expected to stay below 30% on average [68]—hence, a leap in innovation is required (e.g., through silicon-perovskite tandem cells) to achieve a solar cooling effect by replacing low-albedo façade materials with highly efficient PV modules. As a limitation, it needs to be mentioned that the parameter study only investigates the daytime temperatures but neglects the night-time effects.
To summarize, we see a daytime heating impact of the PV modules on the surface and mean radiant temperatures, as well as on the UTCI. In contrast, the temperatures are in the same order of magnitude during night-time. While the simulation results are in accordance with several metrological studies on the impact of PV on the thermal microclimate [9,10,65,67], they contradict most simulation-based studies identifying PV cooling effects [11,12,13,14,16,69]. The discrepancies primarily rely on simplifications, particularly concerning calculating the PV cell temperatures in the existing simulation-based studies. For instance, Masson et al. [12] and Salamanca et al. [13] utilize a photovoltaic model that estimates the module temperature by adding ambient air temperature to irradiance at the module level and then multiplying by a constant factor. Consequently, the impact of wind speed and module efficiency on the photovoltaic temperatures is disregarded. Similarly, the effective albedo method employed by Taha [11] and Berardi and Graham [14] involves notable simplifications and assumptions that have not undergone validation. The applied the NOCT cell temperature model to calculating PV cell temperatures, accounting for the ambient air temperature, the plane of array irradiance, the module’s nominal operating cell temperature, the mounting situation, the module efficiency, transmittance and absorptance effects, and wind speed. However, it must be mentioned that the NOCT cell temperature model was initially conceived for rooftop or freestanding PV. Hence, the cell temperatures might be slightly underestimated due to the restricted rear ventilation in the case of PV façades compared to rooftop photovoltaics. Moreover, the present simulations using EnergyPlus might underestimate the thermal mass of the building façade, resulting in lower surface temperatures of the reference building during night-time. Consideration of a higher thermal storage capacity whereas might induce a nocturnal cooling effect in PV façades.

6. Conclusions

The first research question, ‘how do façade-integrated photovoltaic installations impact the surrounding urban thermal microclimate and human outdoor thermal comfort?’, can be answered twofold for day- and night-time and winter and summer periods, respectively.
During the day, PV façades reach higher surface temperatures, warming the adjacent mean radiant temperature and increasing, to a lesser extent, the Universal Thermal Climate Index. With an increasing distance from the building façade, the warming effect is attenuated, but even with a distance of 2.5 m from the building, it is still perceptible as an up to +3.72 K higher mean radiant temperature and an up to +1.38 K higher UTCI. We see no directly quantifiable impact on the adjacent ambient air temperature. For night-time periods, we need to distinguish between summer and winter: In summer, PV installations lead to a moderate warming effect (<1 K) on the mean radiant temperature. This effect, however, might be due to an underestimation of the buildings’ thermal mass in the simulation. In winter, the mean radiant temperature in front of the PV façade is slightly lower than in front of the reference façade. In neither case do the PV modules affect the UTCI at night. Despite extended human exposure to thermal heat stress in summer, PV façades improve the annual outdoor thermal comfort autonomy by 0.91% due to lower cold stress in winter.
The parameter study answers the second research question, ‘What parameters influence the impact of photovoltaics on its surroundings?’: The most critical parameters affecting the impact of PV modules on the surrounding microclimate are the albedo of the reference building surface—due to the sensitivity of the surface temperatures to changes in solar absorption—and the efficiency of the PV modules—due to a higher amount of energy conversion with higher efficiencies. While the cell and building surface temperatures react sensitively to changes in the input parameters, this effect is attenuated for the mean radiant temperature and even more for the Universal Thermal Climate Index. In all the simulated cases, we identify the heating effect caused by installing PV modules.
The present study contributes to closing the research gap between metrological and simulation-based studies. While PV façades have a warming impact on the surrounding mean radiant temperature and reduce human thermal comfort, these effects are restricted to the daytime. At night, the effects are marginal. Hence, nocturnal recovery, as a key element for human health, is not affected. As technological advancements continue and the photovoltaic efficiencies improve, more energy will be extracted from the system as electricity. Consequently, this will mitigate or even eliminate the heating effect caused by elevated module temperatures and subsequently increase the convective and radiative heat transfer. Thus, photovoltaics in an urban context should still be considered a vital measure for the decentralized supply of renewable energy and hence for achieving climate protection goals. However, the microthermal impact must be considered when planning urban PV installations. Therefore, further research analyzing the installation of PV in different urban contexts and various climate zones is vital to provide deeper insights into the effects of photovoltaics on the urban thermal microclimate and outdoor thermal comfort. Moreover, implementing a temperature model conceived for building-integrated photovoltaics while considering the PV efficiency for estimating PV cell temperatures is required for even more precise results.

Author Contributions

Conceptualization, E.F.; methodology, E.F.; software, E.F. and J.R.; validation, E.F. and J.R.; formal analysis, E.F.; investigation, E.F. and J.R.; resources, E.F.; data curation, J.R.; writing—original draft preparation, E.F.; writing—review and editing, E.F. and C.H.; visualization, J.R.; supervision, C.H.; project administration, E.F.; funding acquisition, C.H. All authors have read and agreed to the published version of the manuscript.

Funding

This project was funded by the Bavarian Ministry of Science and the Arts in the context of the Bavarian Climate Research Network (bayklif).

Data Availability Statement

The data presented in this study are available on request from the corresponding author.

Conflicts of Interest

The authors declare no conflicts of interest.

Nomenclature

αswvalue referring to the absorptivity/reflectivity of a person’s clothing-
αlwvalue referring to the absorptivity/reflectivity of a person’s clothing-
Apgeometry coefficient of the human body-
ADgeometry coefficient of the human body-
CADComputater-Aided Design-
CFDComputational Fluid Dynamics-
EPOAplane of array irradianceW/m2
EPWEnergyPlus weather format
εlongwave emissivity-
εplongwave emissivity of the human body-
Fview factor-
Fairview factor of rgw surface to the air-
Fgview factor of the ground-
Fsiview factor of the surrounding surfaces-
Fskyview factor of the sky-
fbesa value indicating whether direct radiation is falling on a person-
fefffractional of the body that can radiate heat-
fsvfsky view factor-
hiinitial hour of occupation per day-
hffinal hour of occupation per day-
Idiffdiffuse sky radiationW/m2
Idirdirect radiationW/m2
Ntotal number of analysis days-
NOCTnominal operating cell temperature°C
ntotal number of occupied hours-
Ƞrefmodule efficiency under standard test conditions (STC)
TTHglobal horizontal radiationW/m2
OTCAoutdoor thermal comfort autonomy%
PVphotovoltaic-
qlwlongwave radiationW/m2
σ Stefan–Boltzmann constant (5.667 × 10⁻⁸)W/m2K4
Rfloorreflectivity of the ground-
REFreference case-
STCstandard test conditions-
Tairambient air temperature°C
Tcellcell temperature°C
Tgtemperature of the ground°C
TMRTmean radiant temperature°C
TMRT,lwlongwave mean radiant temperature°C
Tmphotovoltaic module temperature°C
Tnoctmodule’s nominal operating cell temperature°C
Tnoct,adjTnoct adjusted for mounting stand-off°C
Tsitemperature of the surrounding surface°C
Tskylongwave sky temperature°C
Tsurfsurface temperature°C
παcoefficient representing transmittance and absorptance effects-
UHIurban heat island-
UWGUrban Weather Generator-
UTCIUniversal Thermal Climate Index°C
vwind velocitym/s
vphumidity-
Vadjwind velocity, adjusted for height above groundm/s

References

  1. Kuttler, W. Klimawandel im urbanen Bereich: Teil 1, Wirkungen. Environ. Sci. Eur. SpringerOpen J. 2011. [Google Scholar] [CrossRef]
  2. Hulley, M.E. The urban heat island effect: Causes and potential solutions. In Metropolitan Sustainability; Elsevier: Amsterdam, The Netherlands, 2012; pp. 79–98. ISBN 9780857090461. [Google Scholar]
  3. Hepf, C.; Bausch, K.; Lauss, L.; Koth, S.C.; Auer, T. Impact of Dynamic Emission Factors of the German Electricity Mix on the Greenhouse Gas Balance in Building Operation. Buildings 2022, 12, 2215. [Google Scholar] [CrossRef]
  4. Hepf, C.; Gottkehaskamp, B.; Miller, C.; Auer, T. International Comparison of Weather and Emission Predictive Building Control. Buildings 2024, 14, 288. [Google Scholar] [CrossRef]
  5. Sailor, D.J.; Anand, J.; King, R.R. Photovoltaics in the built environment: A critical review. Energy Build. 2021, 253, 111479. [Google Scholar] [CrossRef]
  6. Fassbender, E.; Hemmerle, C. Interdependencies Between Photovoltaics and Thermal Microclimate. In Advanced Materials in Smart Building Skins for Sustainability; Wang, J., Shi, D., Song, Y., Eds.; Springer International Publishing: Cham, Switzerland, 2023; ISBN 978-3-031-09694-5. [Google Scholar]
  7. Barron-Gafford, G.A.; Minor, R.L.; Allen, N.A.; Cronin, A.D.; Brooks, A.E.; Pavao-Zuckerman, M.A. The Photovoltaic Heat Island Effect: Larger solar power plants increase local temperatures. Sci. Rep. 2016, 6, 35070. [Google Scholar] [CrossRef] [PubMed]
  8. Broadbent, A.M.; Krayenhoff, E.S.; Georgescu, M.; Sailor, D.J. The Observed Effects of Utility-Scale Photovoltaics on Near-Surface Air Temperature and Energy Balance. J. Appl. Meteorol. Climatol. 2019, 58, 989–1006. [Google Scholar] [CrossRef]
  9. Jiang, J.; Gao, X.; Lv, Q.; Li, Z.; Li, P. Observed impacts of utility-scale photovoltaic plant on local air temperature and energy partitioning in the barren areas. Renew. Energy 2021, 174, 157–169. [Google Scholar] [CrossRef]
  10. Wu, W.; Yue, S.; Zhou, X.; Guo, M.; Wang, J.; Ren, L.; Yuan, B. Observational Study on the Impact of Large-Scale Photovoltaic Development in Deserts on Local Air Temperature and Humidity. Sustainability 2020, 12, 3403. [Google Scholar] [CrossRef]
  11. Taha, H. The potential for air-temperature impact from large-scale deployment of solar photovoltaic arrays in urban areas. Sol. Energy 2013, 91, 358–367. [Google Scholar] [CrossRef]
  12. Masson, V.; Bonhomme, M.; Salagnac, J.-L.; Briottet, X.; Lemonsu, A. Solar panels reduce both global warming and urban heat island. Front. Environ. Sci. 2014, 2, 14. [Google Scholar] [CrossRef]
  13. Salamanca, F.; Georgescu, M.; Mahalov, A.; Moustaoui, M.; Martilli, A. Citywide Impacts of Cool Roof and Rooftop Solar Photovoltaic Deployment on Near-Surface Air Temperature and Cooling Energy Demand. Bound. Layer Meteorol 2016, 161, 203–221. [Google Scholar] [CrossRef]
  14. Berardi, U.; Graham, J. Investigation of the impacts of microclimate on PV energy efficiency and outdoor thermal comfort. Sustain. Cities Soc. 2020, 62, 102402. [Google Scholar] [CrossRef]
  15. Tian, W.; Wang, Y.; Xie, Y.; Wu, D.; Zhu, L.; Ren, J. Effect of building integrated photovoltaics on microclimate of urban canopy layer. Build. Environ. 2007, 42, 1891–1901. [Google Scholar] [CrossRef]
  16. Cortes, A.; Murashita, Y.; Matsuo, T.; Kondo, A.; Shimadera, H.; Inoue, Y. Numerical evaluation of the effect of photovoltaic cell installation on urban thermal environment. Sustain. Cities Soc. 2015, 19, 250–258. [Google Scholar] [CrossRef]
  17. Brito, M.C. Assessing the Impact of Photovoltaics on Rooftops and Facades in the Urban Micro-Climate. Energies 2020, 13, 2717. [Google Scholar] [CrossRef]
  18. Weihs, P.; Zamini, S.; Krispel, S.; Oswald, S.; Peyerl, M.; Revesz, M.; Schneider, A.; Trimmel, H. Optimierung Reflektierender Materialien und Photovoltaik im Stadtraum Bezüglich Strahlungsbilanz und Bioklimatik: PVOPTI-Ray. 2018. Available online: https://nachhaltigwirtschaften.at/resources/sdz_pdf/schriftenreihe_2018-18_pvoptiray.pdf (accessed on 21 February 2024).
  19. Chokhachian, A.; Perini, K.; Dong, M.S.; Auer, T. How Material Performance of Building Facade affect Urban Microclimate. In Proceedings of the PowerSkin Conference 2017, Munich, Germany, 9 January 2017; pp. 83–95. [Google Scholar]
  20. Dang, H.A.; Nguyen, T.K. Impacts of Roof-top Solar Photovoltaic Modules on Building Energy Performance: Case Study of a Residence in HCM City, Vietnam. IOP Conf. Ser. Earth Environ. Sci. 2020, 505, 12014. [Google Scholar] [CrossRef]
  21. Hegger, M.; Dettmar, J.; Martin, A. UrbanReNet: EnEFF:Stadt—Verbundprojekt Netzoptimierung—Teilprojekt: Vernetzte Regenerative Energiekonzepte im Siedlungs- und Landschaftsraum; Technische Universität Darmstadt: Darmstadt, Germany, 2012. [Google Scholar]
  22. Jochem, E.; Radgen, P.; Schmid, C.; Mannsbart, W.; Dötsch, C.; Fahlenkamp, H.; Hölder, D. Strategien und Technologien einer pluralistischen Fern- und Nahwärmeversorgung in einem liberalisierten Energiemarkt unter besonderer Berücksichtigung der Kraft-Wärme-Kopplung und regenerativer Energien. AGFW-Hauptstudie—Erster Bearbeitungsschritt. Band 2; AGFW: Frankfurt am Main, Germany, 2001. [Google Scholar] [CrossRef]
  23. Luo, X.; Hong, T. Modeling the Thermal Interactions between Buildings at an Urban Scale. In Proceedings of Building Simulation 2019: 16th Conference of IBPSA, Building Simulation 2019, Rome, Italy, 2–4 September 2019; Corrado, V., Fabrizio, E., Gasparella, A., Patuzzi, F., Eds.; IBPS: Rome, Italy, 2020; pp. 336–342. [Google Scholar]
  24. Duffie, J.A. Solar Engineering of Thermal Processes, 4th ed.; Wiley: Hoboken, NJ, USA, 2013; ISBN 978-0-470-87366-3. [Google Scholar]
  25. Gilman, P.; Dobos, A.; DiOrio, N.; Freeman, J.; Janzou, S.; Ryberg, D. SAM Photovoltaic Model Technical Reference Update: National Renewable Energy Laboratory Report NREL/TP-6A20-67399; National Renewable Energy Lab: Golden, CO, USA, 2018.
  26. Sandia National Libraries. Modeling Guide: NOCT Cell Temperature. Available online: https://pvpmc.sandia.gov/modeling-guide/2-dc-module-iv/cell-temperature/noct-cell-temperature/ (accessed on 24 January 2024).
  27. American Society of Heating, Refrigerating and Air-Conditioning Engineers. Thermal Environmental Conditions for Human Occupancy; ANSI/ASHRAE Standard 55; ASHRAE: Peachtree Corners, GA, USA, 2023. [Google Scholar]
  28. Kántor, N.; Unger, J. The most problematic variable in the course of human-biometeorological comfort assessment—The mean radiant temperature. Open Geosci. 2011, 3, 90–100. [Google Scholar] [CrossRef]
  29. Naboni, E.; Meloni, M.; Coccolo, S.; Kaempf, J.; Scartezzini, J.-L. An overview of simulation tools for predicting the mean radiant temperature in an outdoor space. Energy Procedia 2017, 122, 1111–1116. [Google Scholar] [CrossRef]
  30. Verein Deutscher Ingenieure. Environmental Meteorology—Methods for the Human Biometeorological Evaluation of Climate and Air Quality for Urban and Regional Planning at Regional Level, Part I: Climate; Beuth: Berlin, Germany, 2021. [Google Scholar]
  31. Herrmann, J.; Matzarakis, A. Influence of mean radiant temperature on thermal comfort of humans in idealized urban environments. In Proceedings of the 7th Conference on Biometeorology, Berlin, Germany, 12–14 April 2010; pp. 522–527. [Google Scholar]
  32. Ali-Toudert, F.; Mayer, H. Effects of asymmetry, galleries, overhanging façades and vegetation on thermal comfort in urban street canyons. Sol. Energy 2007, 81, 742–754. [Google Scholar] [CrossRef]
  33. Thorsson, S.; Lindberg, F.; Eliasson, I.; Holmer, B. Different methods for estimating the mean radiant temperature in an outdoor urban setting. Intl. J. Climatol. 2007, 27, 1983–1993. [Google Scholar] [CrossRef]
  34. Blazejczyk, K. MENEX: Man-Environment Heat Exchange Model and its Applications in Bioclimatology. In Proceedings of the 5th International Conference on Environmental Ergonomics; TNO-Intstitute of Perception: Soesterberg, The Netherlands; 1992. [Google Scholar]
  35. Mackey, C.; Galanos, T.; Norford, L.; Sadeghipour Roudsari, M. Wind, Sun, Surface Temperature, and Heat Island: Critical Variables for High-Resolution Outdoor Thermal Comfort. In Proceedings of the Building Simulation 2017: 15th Conference of IBPSA. 2017 Building Simulation Conference, San Francisco, CA, USA, 7 August 2017; IBPSA: Rome, Italy, 2017. [Google Scholar]
  36. Arens, E.; Hoyt, T.; Zhou, X.; Huang, L.; Zhang, H.; Schiavon, S. Modeling the comfort effects of short-wave solar radiation indoors. Build. Environ. 2015, 88, 3–9. [Google Scholar] [CrossRef]
  37. Naboni, E.; Meloni, M.; Mackey, C.; Kaempf, J. The Simulation of Mean Radiant Temperature in Outdoor Conditions: A review of Software Tools Capabilities. In Proceedings of Building Simulation 2019: 16th Conference of IBPSA. Building Simulation 2019, Rome, Italy, 2–4 September 2019; Corrado, V., Fabrizio, E., Gasparella, A., Patuzzi, F., Eds.; IBPSA: Rome, Italy, 2020; pp. 3234–3241. [Google Scholar]
  38. Evola, G.; Naboni, E.; Margani, G.; Magri, C. Modeling Outdoor Thermal Comfort in Urban Canyons: Presentation and Validation of a Novel Comprehensive Workflow. In Proceedings of Building Simulation 2019: 16th Conference of IBPSA. Building Simulation 2019, Rome, Italy, 2–4 September 2019; Corrado, V., Fabrizio, E., Gasparella, A., Patuzzi, F., Eds.; IBPSA: Rome, Italy, 2020; pp. 3288–3295. [Google Scholar]
  39. Fiala, D.; Lomas, K.J.; Stohrer, M. A computer model of human thermoregulation for a wide range of environmental conditions: The passive system. J. Appl. Physiol. 1999, 87, 1957–1972. [Google Scholar] [CrossRef] [PubMed]
  40. Blazejczyk, K.; Epstein, Y.; Jendritzky, G.; Staiger, H.; Tinz, B. Comparison of UTCI to selected thermal indices. Int. J. Biometeorol. 2012, 56, 515–535. [Google Scholar] [CrossRef] [PubMed]
  41. Coccolo, S.; Kaempf, J.; Scartezzini, J.-L.; Pearlmutter, D. Outdoor human comfort and thermal stress: A comprehensive review on models and standards. Urban Clim. 2016, 18, 33–57. [Google Scholar] [CrossRef]
  42. Zare, S.; Hasheminejad, N.; Shirvan, H.E.; Hemmatjo, R.; Sarebanzadeh, K.; Ahmadi, S. Comparing Universal Thermal Climate Index (UTCI) with selected thermal indices/environmental parameters during 12 months of the year. Weather Clim. Extrem. 2018, 19, 49–57. [Google Scholar] [CrossRef]
  43. Jendritzky, G.; de Dear, R.; Havenith, G. UTCI—Why another thermal index? Int. J. Biometeorol. 2012, 56, 421–428. [Google Scholar] [CrossRef]
  44. Błażejczyk, K.; Jendritzky, G.; Bröde, P.; Fiala, D.; Havenith, G.; Epstein, Y.; Psikuta, A.; Kampmann, B. An introduction to the Universal Thermal Climate Index (UTCI). Geogr. Pol. 2013, 86, 5–10. [Google Scholar] [CrossRef]
  45. Setaih, K.; Hamza, N.; Townshend, T. Assessment of Outdoor Thermal Comfort in Urban Microclimate In Hot Arid Areas. In Proceedings of the Building Simulation 2013, Chambery, France, 25–28 August 2013. [Google Scholar]
  46. Jendritzky, G.; de Dear, R. Adaptation and Thermal Environment. In Biometeorology for Adaptation to Climate Variability and Change; Ebi, K.L., Burton, I., McGregor, G.R., Eds.; Springer Netherlands: Dordrecht, The Netherlands, 2009; pp. 9–32. ISBN 978-1-4020-8920-6. [Google Scholar]
  47. Nazarian, N.; Acero, J.A.; Norford, L. Outdoor thermal comfort autonomy: Performance metrics for climate-conscious urban design. Build. Environ. 2019, 155, 145–160. [Google Scholar] [CrossRef]
  48. Natanian, J. Beyond Zero Energy Districts: A Holistic Energy and Environmental Quality Evaluation Workflow for Dense Urban Contexts in Hot Climates. Ph.D. Thesis, Technische Universität München, München, Germany, 2020. [Google Scholar]
  49. Brasche, J.; Hausladen, G.; Maderspacher, J.; Schelle, R.; Zölch, T.; Zentrum Stadtnatur und Klimaanpassung: Teilprojekt 1: Klimaschutz und grüne Infrastruktur in der Stadt. Abschlussbericht. 2017. Available online: https://www.zsk.tum.de/fileadmin/w00bqp/www/PDFs/Berichte/ZSK_TP1_Schlussbericht_20170731_mitUnterschriften_aktJan18.pdf (accessed on 21 February 2024).
  50. Howes, B.; Mans, D. Design Explorer; Thornton Thomasetti: New York, NY, USA, 2019. [Google Scholar]
  51. Roudsari, M.S.; Pak, M. Ladybug: A parametric environmental plugin for grasshopper to help designers. In Proceedings of the BS2013: 13th Conference of International Building Performance Simulation Association, Chambéry, France, 26–28 August 2013.
  52. Climate.OneBuilding.Org. Repository of Free Climate Data for Building Performance Simulation. Available online: https://climate.onebuilding.org/ (accessed on 31 January 2024).
  53. Masson, V. A Physically-Based Scheme For The Urban Energy Budget In Atmospheric Models. Bound. Layer Meteorol. 2000, 94, 357–397. [Google Scholar] [CrossRef]
  54. Bueno, B.; Nakano, A.; Norford, L. Urban weather generator: A method to predict Urban weather generator: A method to predict neighborhood-specific urban temperatures for use in building energy simulations. In Proceedings of the CUC9-9th International Conference on Urban Climate Jointly with 12th Symposium on the Urban Environment, Toulouse, France, 20–24 July 2015. [Google Scholar]
  55. Salvati, A.; Coch Roura, H.; Cecere, C. Urban heat island prediction in the mediterranean context: An evaluation of the urban weather generator model. ACE Archit. City Environ. 2016, 11, 135–156. [Google Scholar] [CrossRef]
  56. Bueno, B.; Nakano, A.; Norford, L.K.; Reinhart, C.F. Urban Weather Generator—A Novel Workflow for Integrating Urban Heat Island Effect Within Urban Design Process. In Proceedings of the 14th Conference of International Building Performance Simulation Association, BS2015, Hyderabad, India, 7–9 December 2015. [Google Scholar] [CrossRef]
  57. Freitas, S.; Catita, C.; Redweik, P.; Brito, M.C. Modelling solar potential in the urban environment: State-of-the-art review. Renew. Sustain. Energy Rev. 2015, 41, 915–931. [Google Scholar] [CrossRef]
  58. Larson, G.W.; Shakespeare, R. Rendering with Radiance: The Art and Science of Lighting Visualization; Morgan Kaufmann: San Francisco, CA, USA, 1998; ISBN 1558604995. [Google Scholar]
  59. Ward, G.J. The RADIANCE lighting simulation and rendering system. In Proceedings of the 21st Annual Conference on Computer Graphics and Interactive Techniques—SIGGRAPH ’94. the 21st Annual Conference, Orlando, FL, USA, 24–29 July 1994; Schweitzer, D., Glassner, A., Keeler, M., Eds.; ACM Press: New York, NY, USA, 1994; pp. 459–472, ISBN 0897916670. [Google Scholar]
  60. Jakica, N. State-of-the-art review of solar design tools and methods for assessing daylighting and solar potential for building-integrated photovoltaics. Renew. Sustain. Energy Rev. 2018, 81, 1296–1328. [Google Scholar] [CrossRef]
  61. Shirley, P. Physically Based Lighting Calculations for Computer Graphics: A Modern Perspective. In Photorealism in Computer Graphics; Bouatouch, K., Bouville, C., Eds.; Springer: Berlin/Heidelberg, Germany, 1992; pp. 73–83. ISBN 978-3-642-08112-5. [Google Scholar]
  62. Fath, K. Technical and Economic Potential for Photovoltaic Systems on Buildings; Karlsruher Institut für Technologie: Karlsruhe, Germany, 2017. [Google Scholar]
  63. Wirth, H. Aktuelle Fakten zur Photovoltaik in Deutschland. 2024. Available online: https://www.ise.fraunhofer.de/content/dam/ise/de/documents/publications/studies/aktuelle-fakten-zur-photovoltaik-in-deutschland.pdf (accessed on 21 February 2024).
  64. Brown, K.E.; Baniassadi, A.; Pham, J.V.; Sailor, D.J.; Phelan, P.E. Effects of Rooftop Photovoltaics on Building Cooling Demand and Sensible Heat Flux into the Environment for an Installation on a White Roof. J. Eng. Sustain. Build. Cities 2020, 1, 021001. [Google Scholar] [CrossRef]
  65. Scherba, A. Modeling the Impact of Roof Reflectivity, Integrated Photovoltaic Panels and Green Roof Systems on the Summertime Heat Island. Master Thesis, Portland State University, Portland, OR, USA, 2011. [Google Scholar]
  66. Pham, J.V.; Baniassadi, A.; Brown, K.E.; Heusinger, J.; Sailor, D.J. Comparing photovoltaic and reflective shade surfaces in the urban environment: Effects on surface sensible heat flux and pedestrian thermal comfort. Urban Clim. 2019, 29, 100500. [Google Scholar] [CrossRef]
  67. Fassbender, E.; Pytlik, S.; Rott, J.; Hemmerle, C. Impacts of Rooftop Photovoltaics on the Urban Thermal Microclimate: Metrological Investigations. Buildings 2023, 13, 2339. [Google Scholar] [CrossRef]
  68. Fischer, M.; Woodhouse, M.; Baliozian, P.; Trube, J. International Technology Roadmap for Photovoltaic (ITRPV): 2022 Results, 14th edition. 2023. Available online: https://www.vdma.org/international-technology-roadmap-photovoltaic (accessed on 26 February 2024).
  69. Genchi, Y.; Ishisaki, M.; Ohashi, Y.; Takahashi, H.; Inaba, A. Impacts of large-scale photovoltaic panel installation on the heat island effect in Tokyo. In Proceedings of the Fifth Conference on the Urban Climate, Łódź, Poland, 1–5 September 2003. [Google Scholar]
Figure 1. Methodological approach to analyzing the impacts of photovoltaics on the urban thermal microclimate and outdoor thermal comfort.
Buildings 14 00923 g001
Figure 2. (a) Floor plan of the analysis district; (b) three-dimensional view of the analysis district with building heights (4 m and 9 m building height).
Buildings 14 00923 g002
Figure 3. Modeling workflow for simulating the impacts of photovoltaics on the urban thermal microclimate and outdoor thermal comfort based on the simulation platform Grasshopper, with green arrows symbolizing data flows of environmental parameters and blue arrows symbolizing data flows related to building geometries and materials.
Buildings 14 00923 g003
Figure 4. Comfort map of a section of the analysis district for identifying a neuralgic point marked with an ×, weekly averaged for the hottest week (19–25 July).
Buildings 14 00923 g004
Figure 5. Surface temperature (Tsurf,REF), visualized in red, and cell temperature (Tcell), visualized in blue, at a height of 1.6 m, weekly averaged, and minimum/maximum values. (a) For the hottest week (19–25 July); (b) for the coldest week (13–19 December); (c) temperature differences between cell temperature (Tcell) and ambient air temperature (Tair) and surface temperature (Tsurf,REF) and ambient air temperature (Tair) during the hottest week (19–25 July).
Buildings 14 00923 g005
Figure 6. Hourly simulation results weekly averaged for the hottest week (19–25 July) and minimum/maximum values with and without PV installation. (a) Ambient air temperature (Tair); (b) mean radiant temperature (TMRT) with the reference case visualized in red/orange and the PV case visualized in blue/green; (c) Universal Thermal Climate Index (UTCI) with the reference case visualized in red and the PV case visualized in blue.
Buildings 14 00923 g006
Figure 7. Hourly simulation results weekly averaged for the coldest week (13–19 December) and minimum/maximum values with and without PV installation. (a) Ambient air temperature (Tair); (b) mean radiant temperature (TMRT); (c) Universal Thermal Climate Index (UTCI) with the reference case visualized in red and the PV case visualized in blue.
Buildings 14 00923 g007
Figure 8. Simulation results weekly averaged for the hottest week (19–25 July) with increasing distance from the building façade. (a) Hourly mean radiant temperature (TMRT); (b) mean radiant temperature (TMRT) with increasing distance from the building façade; (c) hourly Universal Thermal Climate Index (UTCI).
Buildings 14 00923 g008
Figure 9. Results of the parameter study, displayed using Design Explorer [50], blue symbolizing simulation cases with low albedo values of the reference façade and red symbolizing simulation cases with high albedo values of the reference facade. Surface temperatures.
Buildings 14 00923 g009
Figure 10. Results of the parameter study, displayed using Design Explorer [50], blue symbolizing simulation cases with low albedo values of the reference façade and red symbolizing simulation cases with high albedo values of the reference facade. Mean radiant temperatures.
Buildings 14 00923 g010
Figure 11. Results of the parameter study, displayed using Design Explorer [50], blue symbolizing simulation cases with low albedo values of the reference façade and red symbolizing simulation cases with high albedo values of the reference facade. Universal Thermal Climate Index.
Buildings 14 00923 g011
Table 1. Module’s nominal operating cell temperature adjusted for mounting stand-off (according to [25]).
Mounting Stand-Off Height (in)Tnoct,adj
Open rackTnoct
2.5–3.5Tnoct + 2
1.5–2.5Tnoct + 6
0.5–1.5Tnoct + 11
0.0–0.5Tnoct + 18
Table 2. UTCI equivalent temperature is categorized in terms of thermal stress (according to [44]).
UTCI Range (°C)Stress Category
Above +46Extreme heat stress
+38 to +46Very strong heat stress
+32 to +38Strong heat stress
+26 to +32Moderate heat stress
+9 to +26No thermal stress
0 to +9Slight cold stress
−13 to 0Moderate cold stress
−27 to −13Strong cold stress
−40 to −27Very strong cold stress
Below −40Extreme cold stress
Table 3. Input parameters for the simulation (case study).
ParameterValue
Weather dataMunich Airport: 2007–2021
Albedo reference façade0.3 [49]
PV efficiency (STC)15%
Mounting situationRear ventilated
Simulation period: summer19–25 July
Simulation period: winter13–19 December
Table 4. Input parameters for the simulation (parameter study).
ParameterValues
Albedo building surface0.1, 0.2, 0.3, 0.5, 0.7
PV efficiency (STC)0%, 10%, 15%, 20%, 30%
Mounting situationopen rack, rear ventilated, back insulated
Table 5. Yearly comfort hours and OTCA of the reference scenario in comparison to the PV scenario.
Comfort HoursOTCA
Heat StressCold StressComfortable[%]
Reference1054863379243.29
PV1914697387244.20
Disclaimer/Publisher’s Note: The statements, opinions and data contained in all publications are solely those of the individual author(s) and contributor(s) and not of MDPI and/or the editor(s). MDPI and/or the editor(s) disclaim responsibility for any injury to people or property resulting from any ideas, methods, instructions or products referred to in the content.

