
Evolution of Project-Based Collaborative Networks for Implementing Prefabricated Construction Technology: Case Study in Shanghai
1
School of Economics and Management, Shanghai Polytechnic University, Shanghai 201209, China
2
School of Economics and Management, Tongji University, Shanghai 200092, China
*
Author to whom correspondence should be addressed.
Buildings 2024, 14(4), 925; https://0-doi-org.brum.beds.ac.uk/10.3390/buildings14040925
Submission received: 24 February 2024
/
Revised: 14 March 2024
/
Accepted: 21 March 2024
/
Published: 28 March 2024
(This article belongs to the Section Construction Management, and Computers & Digitization)
Abstract
:Prefabricated construction (PC) is considered to be a low-carbon construction method. Implementing prefabricated construction projects (PCPs) requires multiple industry organizations to participate and collaborate. As different PCPs are initiated and implemented, industry organizations will gradually gather into a complex and evolving collaborative network at the industry level based on specific collaboration relationships with different project backgrounds. The evolution of the collaborative network is related to how industry organizations interact with each other, and how PC-related knowledge and innovation has spread among organizations in the long term. However, the laws of network evolution and the micro effects that drive network evolution are still unknown. This study analyzes 236 prefabricated construction projects (PCPs) in Shanghai during 2015–2023, using the stochastic actor-oriented models (SAOM) method to explore how the macro structure of project-based inter-organizational collaborative networks for prefabricated construction (PC) technology implementation evolves over time, and how micro effects jointly support the evolution of the networks. The macro-level descriptive analysis of the network indicates that the collaborative network has become increasingly dense over time and continues to show a core–peripheral structure, with a small number of super-connected organizations. The micro-level SAOM analysis further reveals that the evolution of the collaborative network structure is driven by structure-based preferential attachment and geographic proximity effects, as well as attribute-based ownership similarity effect. This exploratory effort applies a network dynamics model to investigate the micro mechanism of the evolution of inter-organizational collaboration. The research results provide theoretical guidance and decision-making references for PC industry organizations to develop efficient network action strategies. In addition, it can help industry managers to formulate appropriate network management strategies.
1. Introduction
Prefabricated construction (PC) technology is an innovative construction technology that involves the transfer of on-site construction work from the site to the factory [1,2]. PC technology is a resource-saving and environment-friendly construction technology that addresses many important problems, such as construction noise, waste pollution, and resource waste [3,4]. Over the past three decades, PC technology has received increasing attention worldwide, and the adoption of PC technology has made considerable progress [5,6]. For example, in early 1996, the prefabrication levels in Germany, the Netherlands, Denmark, and Sweden rose by 31%, 40%, 43%, and 80%, respectively [7]. The size of the UK’s PC industry increased from £2.2 billion in 2004 to £6 billion in 2006 [8]. In Asia, Singapore is the first country to formulate industry codes and regulatory frameworks for prefabricated construction projects (PCPs) [9].
The development of PC in developed countries shows that PC is an effective driving force for the growth of the construction industry [10,11]. The positive effects of PC are manifested in improving construction quality and safety, reducing labor demand, shortening construction periods, and improving environmental performance [12,13]. Although these advantages largely meet the requirements of urbanization, housing needs, and sustainability in developing countries, PC is not widespread and mature, for instance in China [8]. Compared with most Western countries, China’s PC industry is still in its infancy [14]. In 2022, China’s total construction area reached 4.3 billion square meters, while the prefabricated construction area was 1.08 billion square meters, accounting for only 25% of China’s total construction area. This ratio is far less than that in other developed countries, such as the United States (90%), France (85%), Sweden (80%), and Denmark (80%). The Chinese government is very concerned about unsustainable practices in construction activities, and expects to heavily promote the implementation of PC through policies and regulations [15].
PC is a cross-organizational innovation [16,17]. Implementing PC in projects requires multiple industry organizations (e.g., owners, contractors, designers, suppliers) to participate and collaborate [18,19]. As different prefabricated construction projects are initiated and implemented, industry organizations will gradually gather into a complex and evolving collaborative relationship network at the industry level based on specific collaboration relationships with different project backgrounds [20,21]. This industry-level, evolving collaboration network is an important channel for PC technology’s diffusion [22,23]. Investigating the evolution of industry-level collaborative networks for PC technology implementation can reveal how industry organizations interact with each other in PCP implementation practices and how PC technology diffuses among industry organizations through project-based collaborative ties. This provides theoretical guidance for PC industry organizations to develop efficient collaboration strategies, as well as a decision-making reference for government agencies to formulate appropriate industry incentive strategies, thereby contributing to the development of the PC industry.
Studies over the past decades have focused on theoretical or empirical research concerning problems related to PC technology in practice and the specific project network of PC technology implementation. Specifically, these studies focused on: (1) identifying the potential network of risk factors related to PCP stakeholders [16,19]; (2) investigating the constraints and interactions between different tasks in PCP implementation [12,20]; and (3) exploring the macro structural characteristics of the patent collaboration network in the PC field [18]. However, the study of the evolution of the industry-level collaboration network for PC technology implementation is lacking. This study applied the stochastic actor-oriented models (SAOM) method and used a longitudinal data set of PCPs in Shanghai, China from 2015–2023, with the following goals: (1) explore how macro structure of the project-based collaboration network for PC technology implementation evolves over time; and (2) determine how corresponding micro effects drive the evolution of the macro network structure. As an exploratory effort of using network dynamics models to investigate the self-organizing mechanisms of the evolution of inter-organizational collaboration networks in the PCP field, this study contributes to the complex adaptive system theory, the growing literature on PCPs, and the existing knowledge body of collaborative networks in the construction domain. The results are expected to help PC industry organizations to formulate collaboration strategies and government agencies to develop incentive strategies for the PC industry.
2. Theoretical Background and Hypotheses Development
2.1. Dynamic Network Perspective in Construction Industry
The network perspective is a theoretical construct that focuses on the broad relationship structure embedded by actors (individuals or organizations). It has been used since the 1930s to explain different social factors, such as economic, political, and sociological phenomena [24]. This perspective notes that the relationship networks in which actors are embedded significantly impact actors’ behavior and performance [23]. The network perspective offers a strong explanatory ability and has been widely used in construction management research in the past 20 years. Table 1 provides examples of these applications.
The networks investigated in these studies include project networks, which focus on interpersonal or inter-organizational relationships within single construction project (e.g., Chinowsky et al. [26]; Liao et al. [30]; Ruan et al. [28]; Son and Rojas [27]), and project-based inter-enterprise collaboration networks, which focus on industry-level collaboration relationships to explore how different enterprises interact with each other across projects (e.g., Li et al. [33]; Park et al. [41]; Qiang et al. [21]; Tang et al. [23]). Construction projects are temporary, so new project-based ties constantly form among industry organizations as new projects are implemented. These industry-level project-based, inter-organizational networks are usually more dynamic than intra-project networks, which focus on interpersonal or inter-organizational relationships within a single project. Therefore, more researchers have focused on industry-level network-related research in the construction field.
Over the past decade, many studies have investigated the industry-level, inter-organizational collaboration networks in the construction industry. Most studies have applied a static network perspective (Liu et al. [42]; Park et al. [41]; Xue et al. [32]), or have described the structural characteristics of collaborative networks in a specific market, period, or region (Mignone et al. [43]; Wang et al. [35]; Zhou et al. [44]). These industry-level network surveys in the construction field have expanded our understanding of the static structure of inter-organizational collaboration networks in specific contexts and the impact of the network structure on organizational output (e.g., organizational performance, organizational competitiveness, project success). However, few studies have investigated the micro mechanisms involved in the evolution of inter-organizational collaboration network structures over time from a dynamic network perspective. In particular, the evolution of collaborative relationship networks between industry organizations has not been explored in the PCP field.
Network dynamic studies highlight that social networks are complex adaptive systems, and evolutionary characteristics of the networks’ macro structures are closely related to a series of micro-level effects [45,46]. These effects include exogenous effects related to network structure, and endogenous effects related to network node attributes. Exogenous effects characterize how changes in network ties are determined by the network structure. Endogenous effects characterize how changes in network ties are determined by the attributes of nodes. Based on the extant studies on network dynamics models, and taking into account the characteristics of project-based collaborative networks for PC technology implementation in the construction industry, this study investigates the following five effects: preferential attachment effect and geographic proximity effect (exogenous effects); and ownership similarity effect, experience similarity effect, and size similarity effect (endogenous effects). These effects reflect how project owners select prime contractors, designers, and suppliers as partners in industry-level collaboration networks for PC technology implementation. Studying these effects can reveal the micro mechanisms of the evolution of industry-level collaboration networks for PC technology implementation. This assists PC industry organizations in developing effective collaboration strategies, as well as assisting government agencies in developing appropriate PC industry’s incentive strategies.
2.2. Preferential Attachment Effect and Collaborative Ties
The preferential attachment effect means that participants with many ties in a network are more likely to obtain new ties and become more central over time, compared to participants with fewer connections [47]. This effect essentially indicates that “the rich get richer”. The preferential attachment effect is a network structure-related mechanism, and is also called the cumulative advantage effect or the Matthew effect [48,49]. The effect has been empirically observed in several network environments in other industries, and is an important mechanism for network dynamics in both natural and social domains [50]. In the context of the project-based collaboration network for PC technology implementation, the preferential attachment effect may also play an important role in driving the network’s evolution. PC technology is a relatively complex, innovative construction technology, and implementing it requires significant changes to tasks and processes compared to traditional construction projects, placing high demands on the technical capabilities of project participants [18]. Construction industry organizations rely heavily on project-based learning to broaden their abilities [22]. Prime contractors, suppliers, and designers who have participated in many PC implementation practices generally have good technical capabilities, organizational capabilities, management capabilities, and operational efficiencies. These organizations generally have prominent network positions in industry-level collaborative networks (i.e., having high centrality in the network), creating a prism and signal with respect to market position and PC technology capabilities. This makes these designers, prime contractors, and suppliers more likely to be selected as partners in new PCPs (i.e., obtaining new project-based collaboration ties). These organizations can then build their reputation in the industry more widely through their diversified network ties, helping them win more project contracts, enhance their centrality in the network, and strengthen their influence and market position. This analysis leads to the following hypothesis:
H1:
In the collaboration network for PC technology implementation, designers, prime contractors, and suppliers with prominent network positions are more favored by the owners of new PCPs. This makes these organizations more likely to obtain new project-based collaboration relationships over time.
2.3. Ownership, Experience, Size Similarity Effects and Collaborative Ties
The similarity effect, also known as the homogeneity effect, refers to the tendency of individuals or organizations to establish social ties with other individuals or organizations having similar attributes [51]. This effect is considered to be a basic potential effect that advances the evolution of different social networks. It is manifested by frequent collaboration between individuals or organizations with similar attributes [33]. The attributes leading to similarity effects include a series of personal or organizational characteristics, such as age, experience, cognition, and organizational size [21]. Empirical studies in other fields have confirmed the influence of this effect on the evolution of relationship networks [52,53,54]. In the context of PCPs, an important organizational attribute related to this effect is the type of organizational ownership: state-owned or non-state-owned.
State-owned enterprises and non-state-owned enterprises in China’s construction industry generally differ in organizational culture and organizational management style [55]. China’s state-owned organizations generally have a more environment-friendly culture and have a management style that focuses more on the management of interpersonal relationships. Differences in culture and management styles between state and non-state organizations may impact the potential collaboration, such as adding inter-organizational communication and coordination costs [21]. This may increase the possibility that owners choose designers, prime contractors, and suppliers with similar organizational ownership as project partners. Furthermore, state-owned enterprises and non-state-owned enterprises play different roles in responding to and assuming social responsibilities. China’s state-owned organizations are generally more willing to assume social responsibilities and may hold different attitudes during the diffusion stage of innovative construction technology (e.g., PC technology). Specifically, state-owned organizations may be more willing to participate in PCP implementations that promote cleaner production and reduce noise and waste pollution. This may also lead to homogeneity with respect to organizational ownership when considering the collaborative network for PC technology implementation.
Similar to organizational ownership, organizational experience is also an important organizational attribute, and may be closely related to the other effects driving the evolution of the collaborative network of PCPs. Despite the rapid development of PC technology in China, there are limited numbers of designers, prime contractors, and suppliers with rich PC experience in the construction industry [56]. PC experience is closely related to the success of PCPs. As such, these experienced designers, prime contractors, and suppliers are likely to be popular in the market and are likely to be successfully pursued by owners offering advantages, such as rich PCP experience [33]. This may lead to a trend of homogeneity related to organizational experience in the project-based collaboration network for PC technology implementation. Similar to organizational experience, organizational size may also lead to size-related homogeneity in the network. Organizational size is often related to an organization’s culture and management style, which may affect the collaborative relationships between organizations [23]. Organizational size also relates to the organizational ability and risk management ability of construction industry organizations [41]. In general, larger industry organizations have stronger organizational capabilities and risk management capabilities. Therefore, large owners tend to collaborate with large-size prime contractors, designers, and suppliers with strong organizational capabilities and risk management capabilities. This may lead to a homogeneity related to organizational size in the collaborative network of PCPs. This analysis leads to three study hypotheses:
H2:
In the collaboration network for PC technology implementation, owners and designers, prime contractors, and suppliers with similar organizational ownership are more likely to establish new project-based collaborative relationships.
H3:
In the collaboration network for PC technology implementation, owners and designers, prime contractors, and suppliers with similar PCP experience are more likely to establish new project-based collaborative relationships.
H4:
In the collaboration network for PC technology implementation, owners and designers, prime contractors, and suppliers with similar organizational size are more likely to establish new project-based collaborative relationships.
2.4. Geographic Proximity and Collaborative Ties
Empirical studies have shown that geographic proximity has an important impact on inter-organizational interaction and inter-organizational collaboration [57]. Compared with traditional construction projects, many innovative technologies and new construction processes have been applied to PCPs [18]. This increases project complexity and may lead to additional expenditures (e.g., transportation costs for specific building components). Therefore, reducing costs is key to gaining competitive advantage in the PC market. Minimizing the distance required for communication and transportation between organizations can help with these problems. A smaller distance between organizations corresponds with lower transportation costs between them [23]. Geographical proximity also facilitates face-to-face communication between organizations, especially when facing the challenges of highly complex PCPs. Frequent and effective communication can help resolve task-related and process-related divergences between organizations during project implementation; this communication focuses organization attention on project tasks, rather than on inter-organizational relationships. Face-to-face communication and interaction can also increase an understanding of each organization’s tasks and interests, helps establish mutual trust between organizations, and can reduce inter-organizational relationship-oriented conflicts [15]. Organizations that are geographically close can also address sudden problems and emergency situations during PCP implementation through efficient face-to-face communication, promoting smooth project implementation. Finally, it is easier for organizations with a close geographical distance to gather information about each other’s resources, professional capabilities, organizational capabilities, and risk management capabilities [21]. This helps reduce the cost of information in the partner search and selection phase, and reduces the risk of a poor selection, reducing subsequent coordination costs in project implementation. Therefore, geographic proximity is likely to affect network dynamics. This analysis leads to the following hypothesis:
H5:
In the collaboration network for PC technology implementation, owners and prime contractors, designers, and suppliers that are geographically close are more likely to establish new project-based collaborative relationships.
3. Research Method
3.1. Data Source
This study uses longitudinal data for construction projects using PC technology in Shanghai from 2015 to 2023 to investigate the evolution of the project-based collaboration network for PC technology implementation over time and to assess the proposed hypotheses. Shanghai is China’s largest city, with a construction output value of 139.605 billion dollars in 2023; it is one of the first regions in China to promote the application of PC technology. The Shanghai Housing and Urban-rural Construction Administration Commission issued the “Development Plan of Shanghai Prefabricated Buildings” in 2016, stating that by 2025, PC should be one of the main construction modes in Shanghai to increase environmental benefits.
The PCP data for this study come from the Shanghai Construction Trade Association (SCTA). The data include the project name, project scale, project type, project start year, project location, owner, prime contractor, supplier, and designer. Specifically, PCP data include data for 236 projects involving 316 organizations for the time period from 2015 to 2023. The year 2015 serves as the first observation time point, because the official statistics related to Shanghai PCPs are incomplete before 2015. Incomplete data would result in insufficient and unrepresentative network data, hindering a meaningful network analysis. Table 2 provides the demographic information of these projects and related organizations.
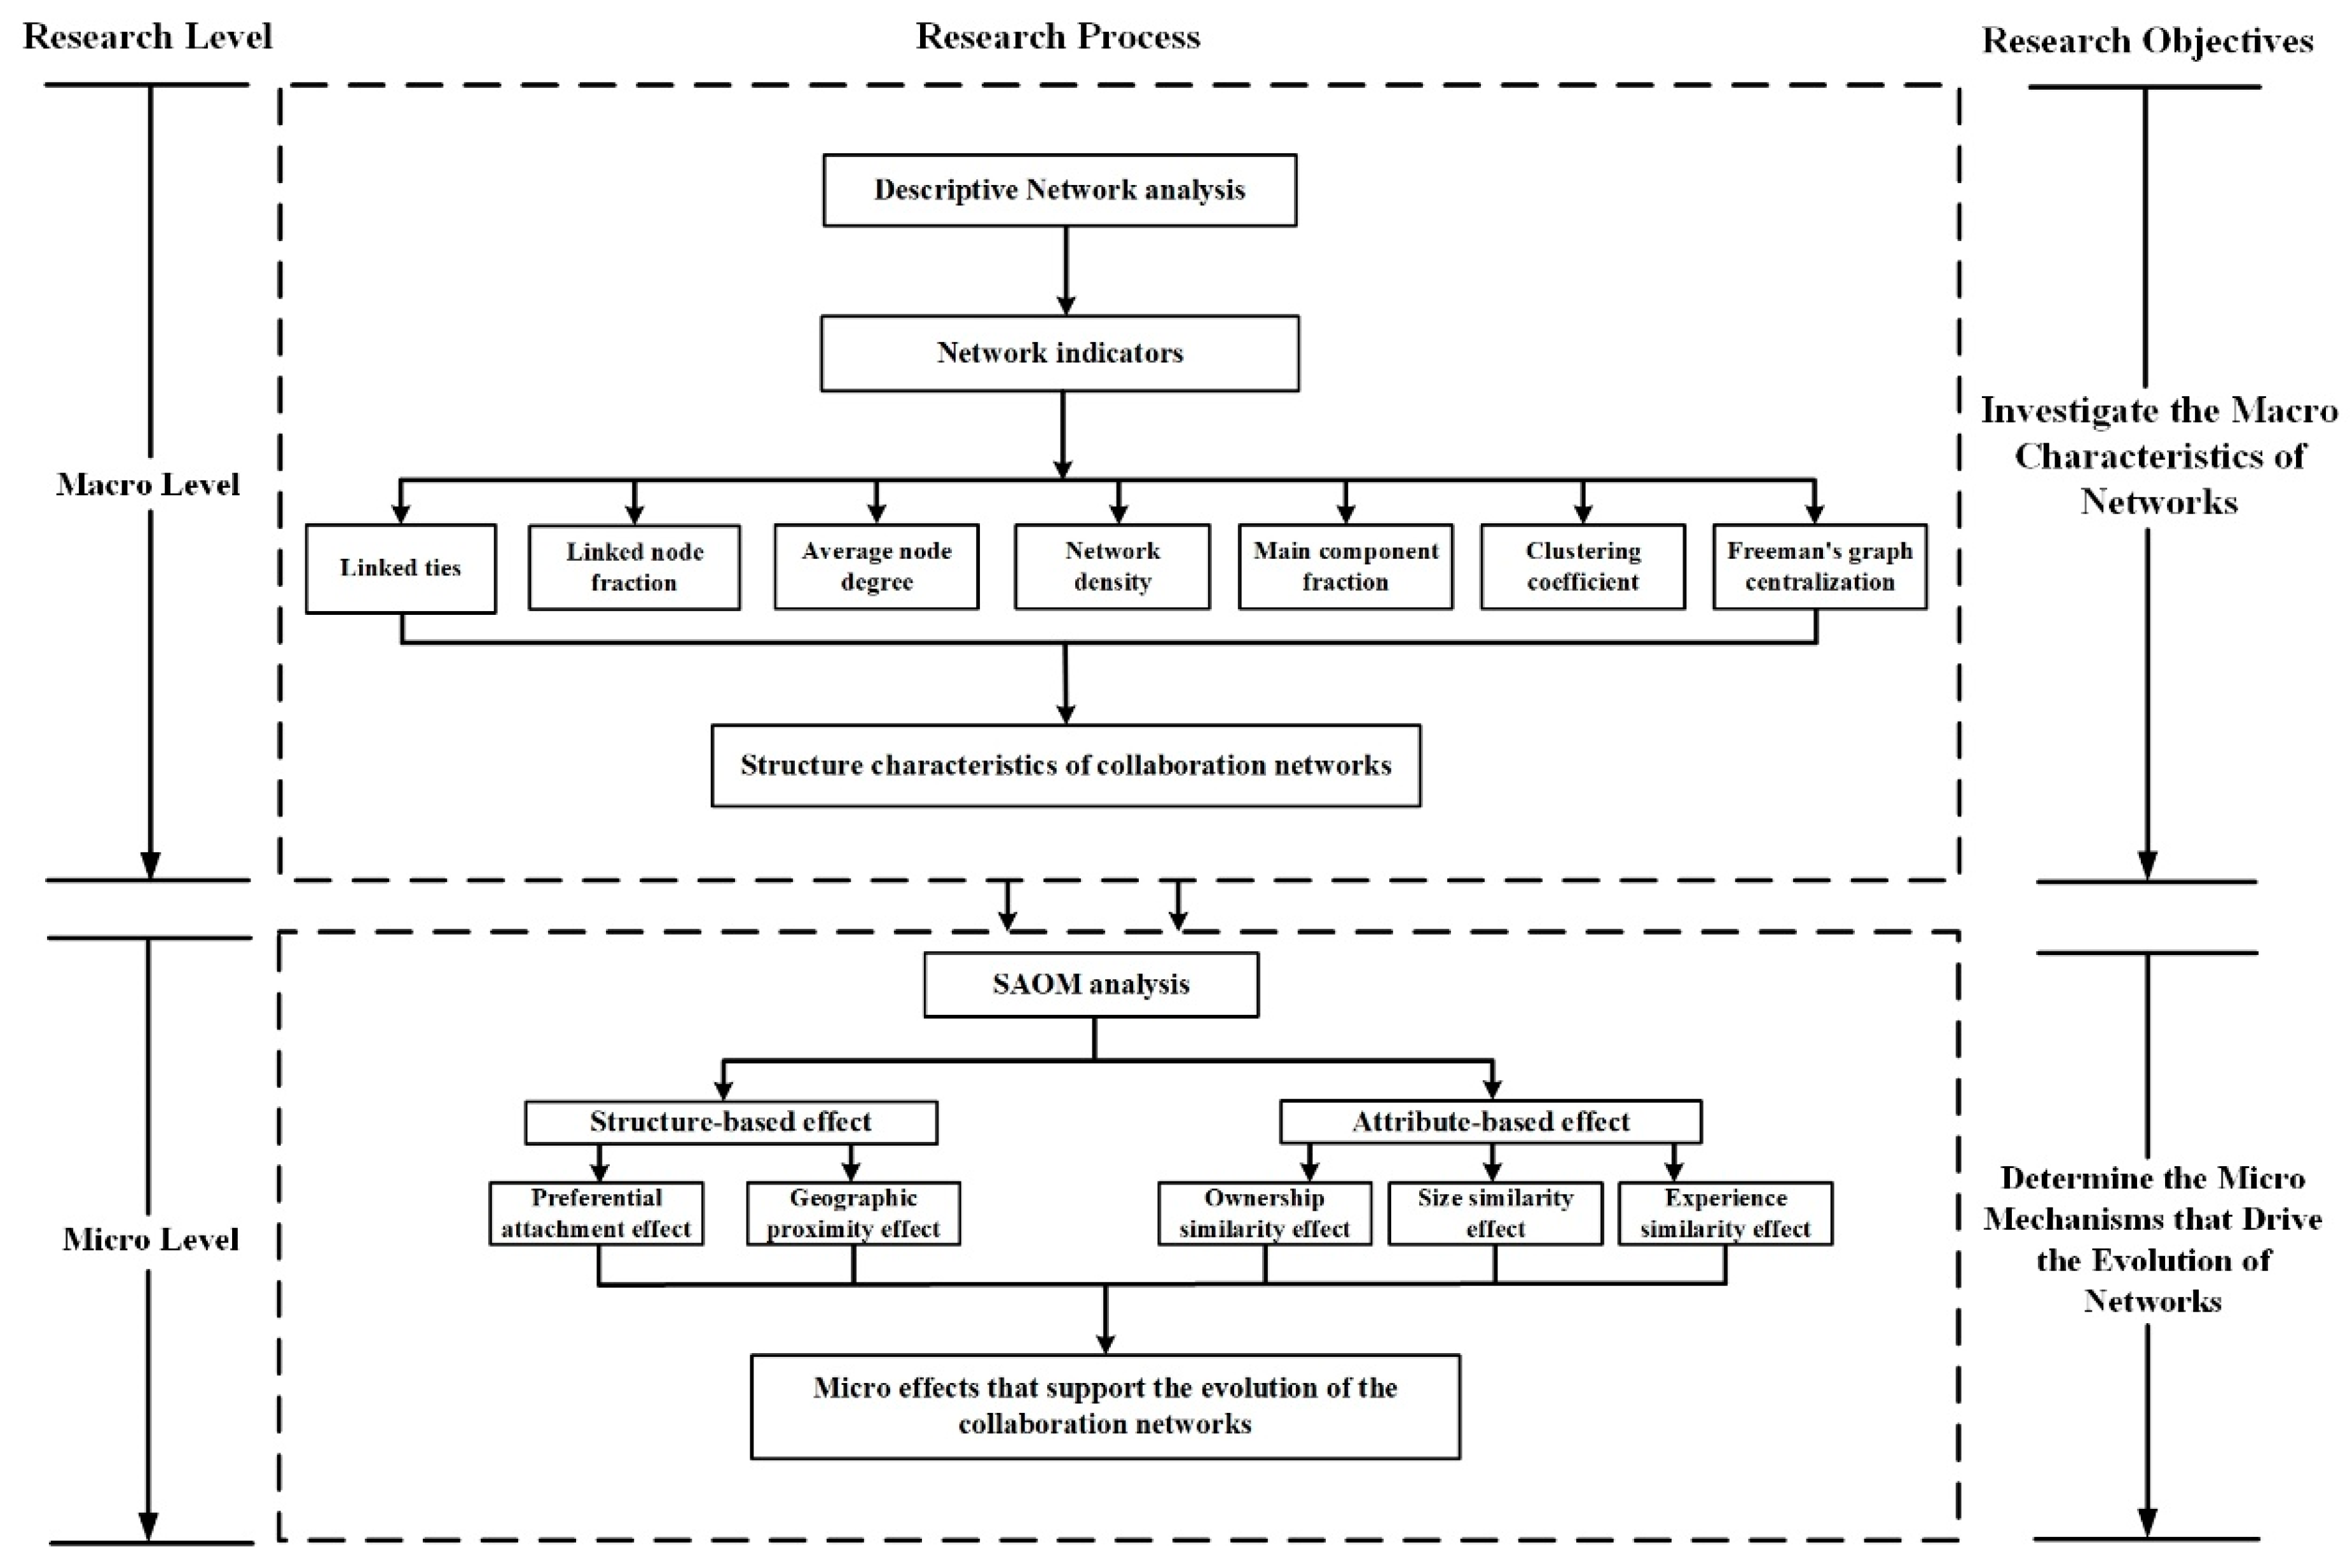
Table 2 shows that the 236 PCPs differ with respect to project type, project size, and project starting year. A total of 316 organizations are reported to have been part of these projects, including 173 owners, 56 designers, 48 prime contractors, and 39 suppliers. These organizations are used for subsequent network analysis (i.e., descriptive analysis and SAOM analysis). In descriptive analysis, this study uses nine year-long time windows (2015, 2016, 2017, 2018, 2019, 2020, 2021, 2022, and 2023) to analyze the changes in the collaboration relationship from the perspective of the network. In SAOM analysis, this study investigates preferential attachment effect, geographic proximity effect, ownership similarity effect, experience similarity effect, and size similarity effect. Figure 1 shows the specific research process.
Owner choice drives the establishment of collaborative relationships between organizations. The ties between different nodes in the network reflect the collaborative relationship between different organizations. This study uses a one-mode network (i.e., using organizations as network nodes) to describe the inter-organizational collaboration networks. The study data are represented in a one-mode matrix. This matrix is represented by mij, where i and j represent two different organizations. Each year-long window corresponds to a matrix, and each cell mij in the matrix represents the number of collaborations between two organizations. The matrices also describe the direction of collaboration ties between organizations. Specifically, cell mij describes that organization i has a directional tie to organization j; in other words, organization i is the sender of the collaboration tie, and organization j is the receiver of the collaboration tie. The formation of the collaborative relationships between owners, designers, prime contractors, and suppliers depends on how owners choose the other partners. As such, the study matrices only describe directional ties from owners to designers, prime contractors, and suppliers. Therefore, the network structure is asymmetric: there are no two-way ties between network nodes. In addition, the subsequent data processing in SAOM analysis also follows the setting of the one-mode network mode.
3.2. Descriptive Analysis
To begin the analysis, the macro structure of the collaboration network under different time windows is described. This is followed by the SAOM analysis, testing the hypotheses related to the potential mechanism of the network evolution (i.e., quantifying the micro mechanism of network evolution). Based on previous studies on inter-organizational collaboration in the construction field [21,23], 9 network indicators are used to describe the characteristics of the collaboration network structure under different time windows (see Table 3).
3.3. Stochastic Actor-Oriented Models Analysis
SAOM is used to analyze the evolution of collaborative networks. It allows for the simultaneous analysis of different mechanisms driving the evolution of the network, and is considered an effective method for processing longitudinal network data [45,58]. As a role-based modeling method, SAOM applies the following assumptions. First, the evolution of the network structure takes the form of a Markov chain, meaning that the network state at time t is determined by the network state at time t − 1, and not the network state at time t − 2 or t − 3. Second, the potential time parameter t is continuous, and the observable change (i.e., wave in SAOM) of the network structure from one time point to the next is completed through a large number of micro-level probabilistic and continuous small steps. In each small step, the network actor can change only one outgoing tie. Third, SAOM analyzes directional ties. Based on these assumptions, a computer is used to simulate the statistical process of the network changes. The first task in the simulation is to determine the actors allowed to make changes in each small step. These actors make choices, which include changing an outgoing tie or not making changes to the outgoing ties. The probability of making choices is modeled as an objective function, representing the possibility that the actor changes outgoing ties. The objective function in SAOM is modeled as a set of linear combinations of network structure-based effects and node attribute-based effects.
In this expression, indicates that the value of the objective function of the actor depends on the state of the network; indicates the effect that affects the change of the network connection; and indicates the statistical parameter of each effect. includes network structure-based effects related to state of the network and actor attribute-based effects. An iterative Markov chain Monte Carlo algorithm is used to evaluate the weight of . If , the corresponding effect has no influence on the network dynamics. A value of indicates a greater probability that the network evolves in the direction of a higher corresponding effect. A value of indicates a smaller probability that the network evolves in the direction of a higher corresponding effect.
4. Results
4.1. Results of Descriptive Analysis
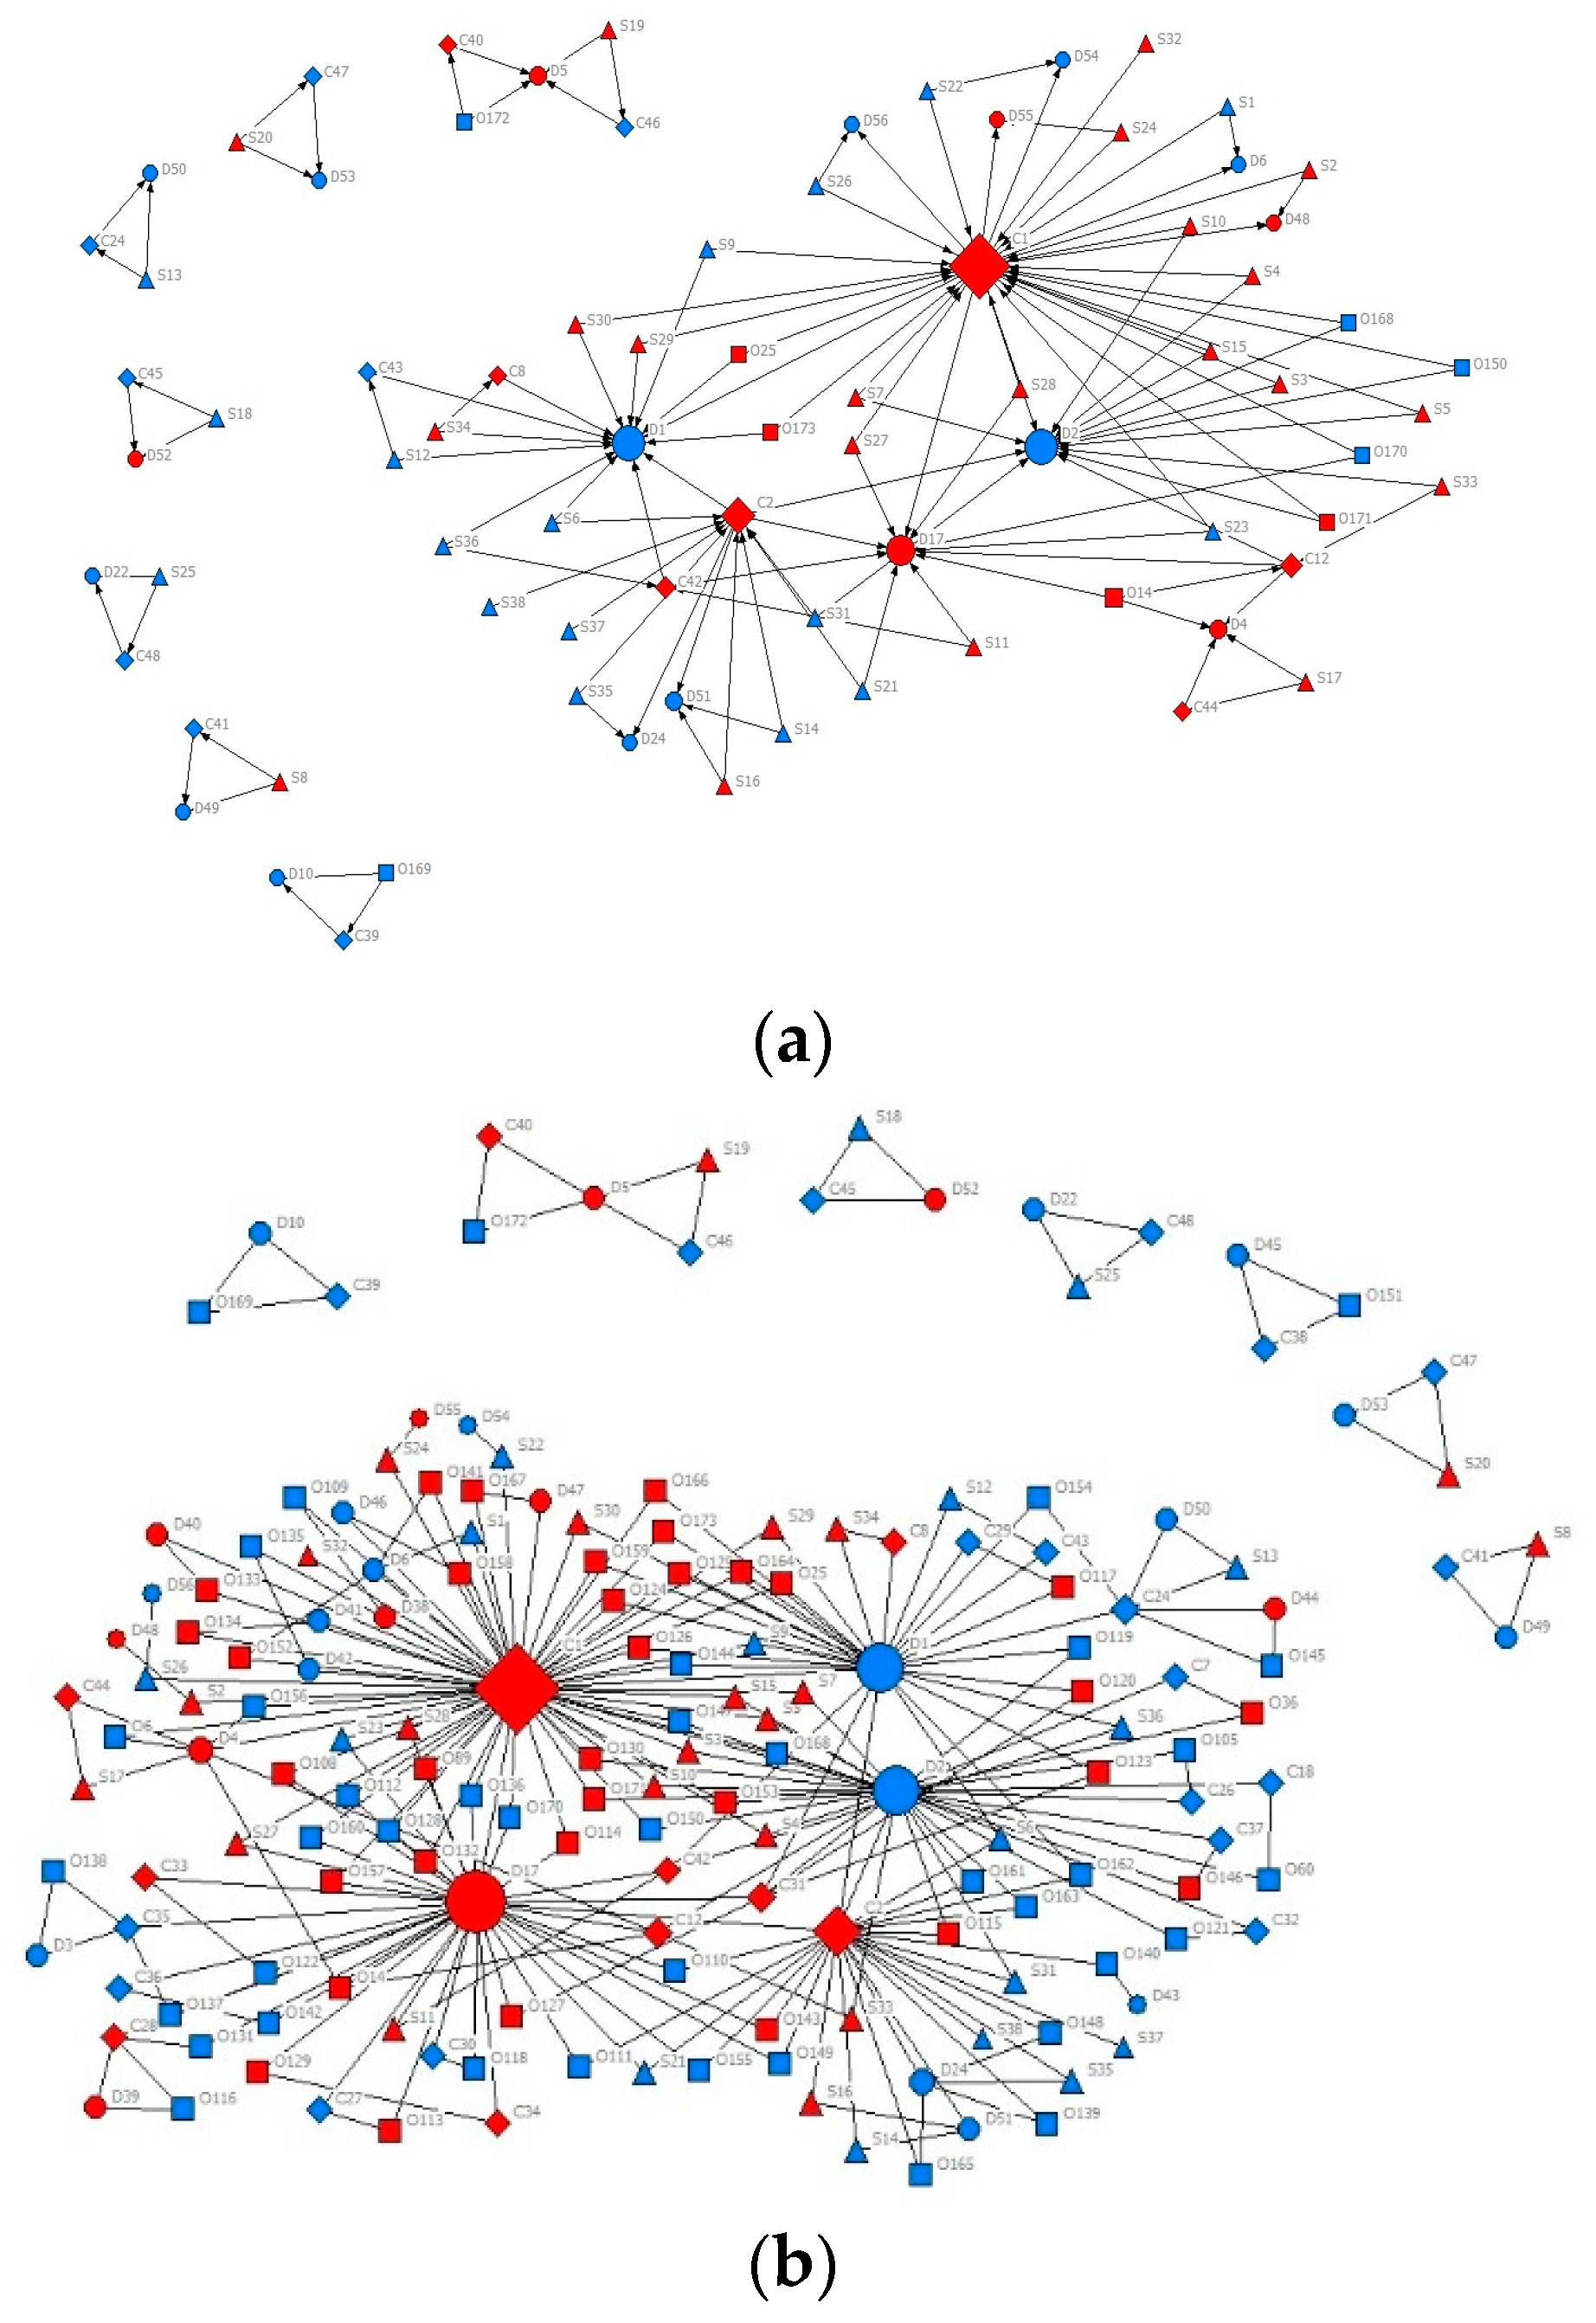
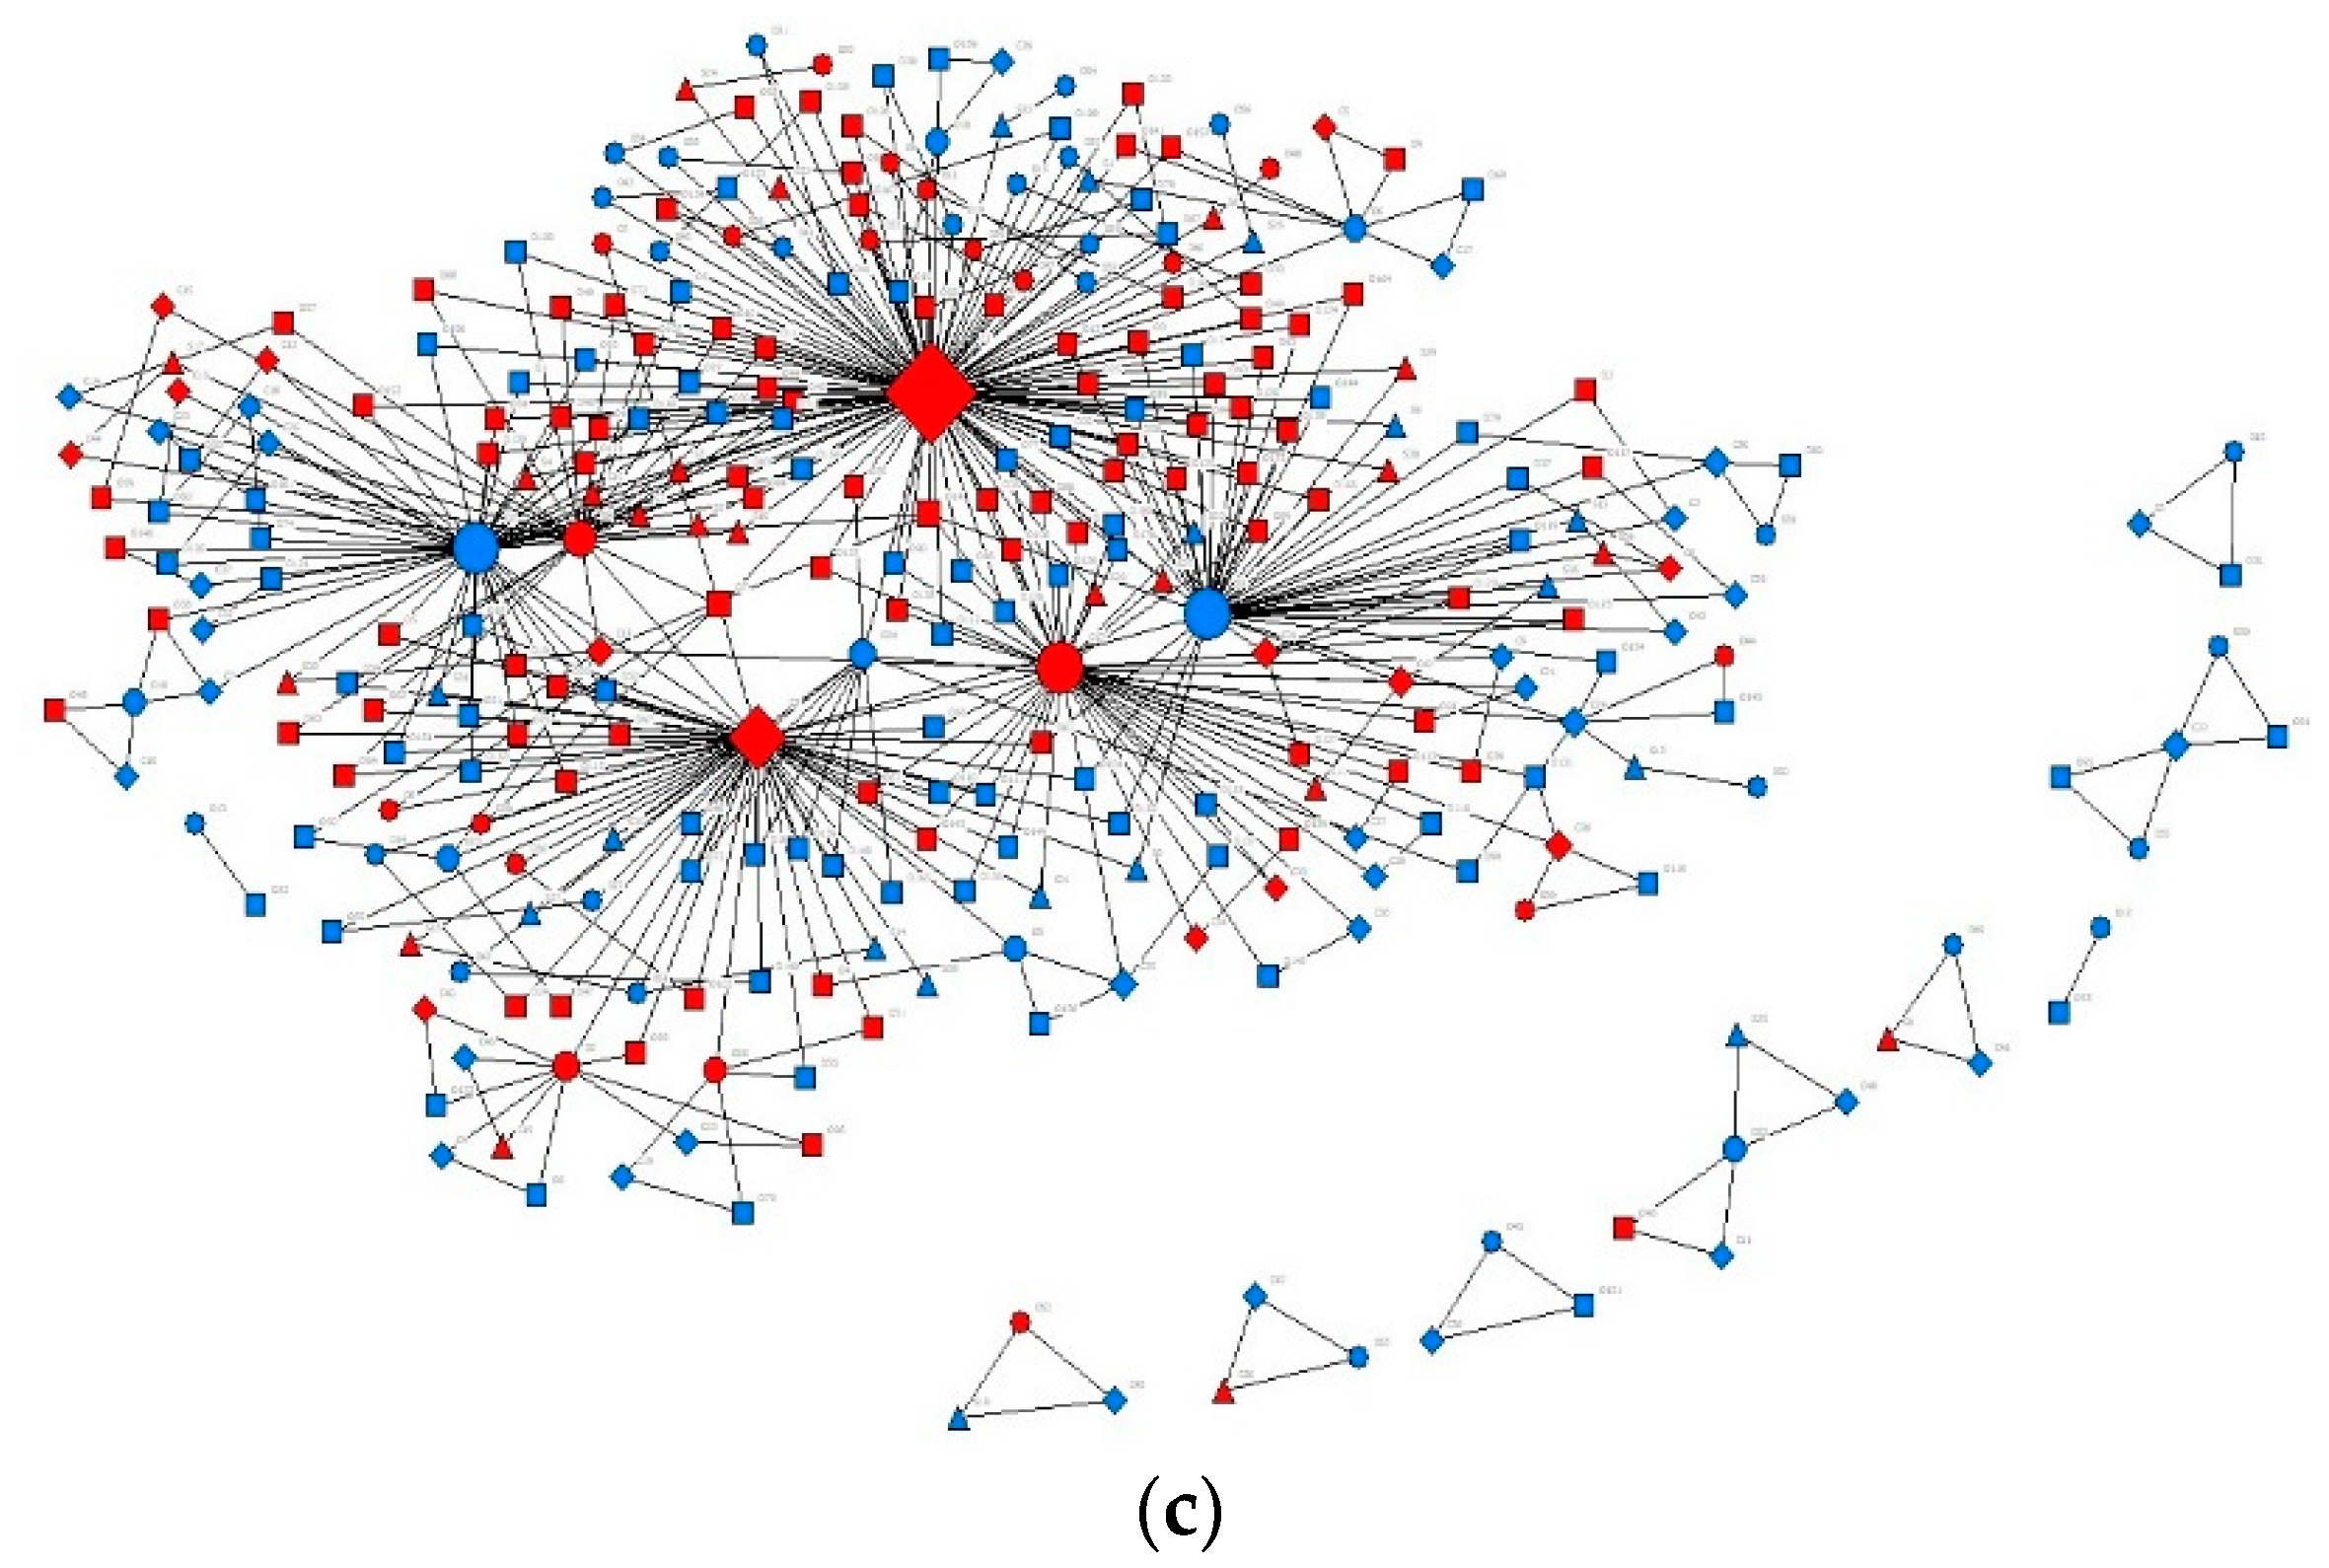
The program UCINET 6 and the embedded network visualization package NetDraw are used to depict the collaborative networks through different time windows (2015–2023) [59]. Each network covers the inter-organizational collaboration relationship in the observed year and previous years. Figure 2 visualizes the collaboration networks at three representative time points (i.e., 2015, 2019, 2023). The shape of the node is used to indicate the type of organization participating in projects; this distinguishes the nodes where different organizations are located and the node attributes. A square represents the owner, a circle represents the designer, a diamond represents the prime contractor, and a triangle represents the supplier. The color of the node indicates the type of ownership of the organization: red indicates a state-owned organization and blue indicates a non-state-owned organization. The node size represents the number of ties connected to the node. Figure 2 shows an uneven distribution in the collaborative relationships in the networks. The nodes with many ties (i.e., collaborative relationships) in the central position of the network are mainly state-owned organizations, and are state-owned designers and prime contractors. The network structure changes significantly at different time points. There is a clear trend in the network, i.e., the ties in the network become tighter over time (2015–2023).
To quantitatively evaluate the changes in the network structure over time, network indicators for the collaboration network are calculated for different time windows (see Table 4). Table 4 shows that from 2015 to 2023, the number of linked ties and the value of the linked node fraction gradually increase. The increase in the linked node fraction is associated with a gradual increase in the average node degree and network density from 2015 to 2023. This shows that from 2015 to 2023, there is an increase in the total number of collaborative relationships in the network, an increase in the average number of collaborative relationships for a single organization, and an increase in the density of the network. This indicates that over the study period, PC technology spreads quickly in the regional construction industry, and more industry organizations participate in PCP implementation.
From 2015 to 2023, the average value of the main component faction reaches a high level of 0.991. This reflects the high proportion of main organizations participating in the collaboration network. The average value of the average distance among main component nodes is very small, at 1.726. Furthermore, the average distance among main component nodes in each observation year (2015–2023) is significantly smaller compared to random graphs with the same number of connected nodes. The average distance values of the random graphs with the same number of connected nodes in 2015, 2017, 2019, 2021, and 2023 are 3.822, 4.202, 4.435, 4.581, and 4.701, respectively. This shows that an organization in the main component can reach any other organization in the main component through a path that is less than 2 steps long. This means that from 2015 to 2023, the collaboration efficiency among the main organizations is high. The clustering coefficient value decreases from 2015 to 2023, however, its value remains significantly larger compared to random graphs with the same number of connected nodes. The high clustering coefficient is due to the tetrad structure of the collaboration relationships between owner, designer, supplier, and prime contractor. This increases the clustering coefficient.
Table 4 shows that the network density increases from 2015 to 2023; however, the value of the Freeman’s graph centralization does not correspondingly decrease. This shows that during the research period, the network structure has a tendency to develop around certain central organizations. This is also seen in Figure 1. To further explore this result, we conduct a core–periphery structure analysis to examine the network structure under different time windows. The results (see Table 5) indicate a good fit [60]. Therefore, the network continues to exhibit a core–periphery structure from 2015 to 2023. These results highlight an unbalanced distribution of collaborative relationships between industry organizations throughout the study period.
4.2. Results of SAOM Analysis
Table 6 summarizes the SAOM evaluation results. Hypothesis 1 assesses the preferential attachment effect. The unstandardized coefficient of this effect is positive and highly significant. Therefore, the results support Hypothesis 1; in the collaboration network for PC technology implementation, owners favor designers, prime contractors, and suppliers with prominent network positions for new projects. As time passes, these organizations are more likely to obtain new project-based collaboration ties. Hypotheses 2–4 assess the similarity effect (i.e., similarity effect of organizational ownership, organizational experience, and organizational size). The results show that the similarity effect of organizational ownership is positive and highly significant. In contrast, the similarity effects of organizational experience and organizational size are not statistically significant. Therefore, the results support Hypothesis 2, but do not support Hypothesis 3 and Hypothesis 4. Therefore, organizational ownership is an important factor in promoting the network’s evolution. H5 assesses the influence of geographical proximity on the dynamics of inter-organizational collaboration. The results show that the geographical proximity effect is positive and highly significant. This result supports H5. This means that in the project-based collaboration network for PC technology implementation, it is easier for owners and designers/prime contractors/suppliers who are geographically close to each other to form new project-based partnerships.
5. Discussion
This study descriptively analyzes how the macro structure of the collaboration network for PC technology implementation evolves over time, and investigates how related micro mechanisms jointly support the evolution of the network. The results show that the collaboration network becomes denser over time, and continues to show a core–peripheral structure with a small number of super-connected nodes. In terms of the micro mechanism, the experience similarity effect and the size similarity effect are not significant. This differs from the conclusions of Li et al. [33] and Tang et al. [23]. The results indicate that the tendency of owners and designers/prime contractors/suppliers with similar organizational size/organizational experience to form new project-based partnerships is not significant. This may be because the PCP experience held by the owners is not an important factor impacting whether prime contractors, designers, and suppliers participate in project bidding. In contrast, these prime contractors, designers, and suppliers may be more concerned about other factors, such as the owner’s reputation and influence, contract value, and the social impact of the project [22]. Similarity in organization size is not a key factor impacting the owner’s choice of partners. Instead, the owner may focus more on the professional ability, management ability, organizational ability, and operational efficiency of prime contractors, designers, and suppliers [21]. Collaboration between organizations of different sizes can help integrate complementary resources. Large organizations obtain three key benefits by collaborating with medium and small-sized organizations: (1) accessing partners’ professional areas and technologies; (2) increasing project flexibility; and (3) sharing risks associated with PCPs [41]. Medium- and small-sized organizations can obtain two key benefits by collaborating with large organizations: (1) mitigating a lack of experience with risk management; and (2) forming long-term collaborative relationships with each other, such as strategic alliances [46]. These may improve the overall competitiveness of industry organizations and their performance.
The significant preferential attachment effect occurs because owners tend to select prime contractors, designers, and suppliers with prominent network position as partners (i.e., having high influence); this reduces the burden of project risks and encourages smooth PCP implementation. Highly influential partners build confidence for the owners and are easier for the owners to trust. Meanwhile, partners with prominent network positions usually have good professional capabilities, reputation, and contract success, increasing the chance of a smooth project delivery [61]. The explanation for the significant similarity effect with respect to organizational ownership is that PCPs require more innovative knowledge and technical input than traditional projects. While it may seem counter-intuitive that more homogenous ownership models may increase innovation, it is important to understand the state-owned organization framework in China. State-owned organizations benefit from the support of state funds, are more willing to focus on learning and technological innovation, and are generally more willing to take risks. Previous studies have also found that the technological innovation investment of state-owned enterprises is an important factor in encouraging the implementation of emerging technologies [21]. Furthermore, state-owned organizations in China are generally willing to take on more social responsibilities than non-state-owned organizations. Specifically, they are willing to develop new technologies (e.g., PC technology) that save resources and reduce the negative impact of construction projects on society and the environment [55]. Further, Chinese law stipulates that state-owned enterprises cannot become general partners with unlimited liability, while non-state-owned enterprises need to assume unlimited liability. Therefore, there are differences between China’s state-owned enterprises and non-state-owned enterprises with respect to innovation, risk preference, assumed liability, and the assumption of social responsibility. These factors somewhat limit their collaboration.
The result with respect to the significant geographic proximity effect is similar to the conclusion of Tang et al. [23]. In construction projects, having a closer geographic distance encourages the formation of inter-organizational collaboration relationships. First, geographical proximity can reduce transportation costs (e.g., the closer the geographical distance between contractors and suppliers, the lower the transportation cost of building components). Second, geographical proximity facilitates face-to-face communication between organizations. This helps resolve conflicts between the organizations and focuses the attention of the organization personnel on project tasks. It can also increase each organization’s understanding of the other’s work content and difficulties, building mutual trust between organizations. Third, geographically close organizations generally have more information about each other (e.g., reputation, organizational capabilities, management capabilities). This reduces the cost of information in the partner selection phases, the risk of a poor selection, and the subsequent coordination costs in project implementation. Fourth, geographically close organizations can also facilitate the smooth project implementations by jointly addressing emergencies that arise during PCP implementation. In summary, this study’s findings clarify the evolutionary rules impacting the PCP collaboration network structure, and confirm how related micro mechanisms collectively drive the evolution of the network.
6. Theoretical Implications
This research has the following theoretical implications. First, by using the network perspective to analyze the collaboration relationships with respect to PCP implementation, this research helps deepen understanding of how industry organizations interact with each other across PCPs to form project-based, inter-organizational collaboration networks. This contribution is important because previous research on PCPs mainly focused on analyzing problems related to PCP practices and specific project networks constructed for PC technology implementation. However, PC technology practices have not been studied at the industry level. This study identified an increase in the density of the PCP collaboration network and a continuous core–peripheral structure of the network; this indicates that the distribution of inter-organizational collaboration relationships is continuously uneven. There are super-connected organizations in the network, with many collaboration relationships with other industry organizations. These network characteristics may accelerate the diffusion of PC technology-related knowledge and innovations, but may also lead to continuous unbalanced inter-organizational collaboration relationship. In the long term, this may hinder the diffusion of PC technology among organizations and the industry-level development of inter-organizational collaboration networks for PC technology implementation. This also helps explain why the popularization of PC technology still faces challenges, despite being vigorously promoted by the government.
Second, previous studies of the industry-level inter-organizational collaboration networks in the construction industry have expanded an understanding of the static structure of the collaboration network in specific periods and a regional context [62,63]. However, the dynamic evolution process of collaboration network and the micro mechanisms that support the network evolution have remained unclear. In contrast, this research explores using a network dynamics model to quantitatively explore how micro mechanisms drive the evolution of project-based collaboration networks. The study provides evidence that the evolution of the collaboration network relates to the preferential attachment effect, the geographic proximity effect, and the organizational ownership similarity effect. This research helps deepen an understanding of the micro foundation of the evolution of inter-organizational collaboration relationships, and emphasizes the need to consider the collaboration network as a complex adaptive system. The dynamics of this system are closely related to a set of self-organization effects (i.e., similarity effects, attachment effects).
7. Managerial Implications
This research has the following managerial implications. First, in the collaboration network for PC technology implementation, the preference attachment effect is an important mechanism; this effect impacts the network position of organizations and the evolution of collaboration network. Therefore, industry organizations facing technological innovation or market changes, including designers, prime contractors, and suppliers, can exercise first-mover strategies to occupy favorable network positions in the industry, increasing organizational influence and competition force [23].
Second, the structural characteristics and evolutionary laws of the project-based collaboration network for PC technology implementation are closely related to the diffusion of PC-related knowledge and innovation in the construction industry. Policy-setting agencies need to understand these characteristics and evolutionary laws when designing policy to manage industry organizations and encourage the innovation of PC technology and the diffusion of PC-related knowledge. This research provides evidence that collaborative networks usually develop around super-connected organizations. This leads to an uneven distribution of collaboration relationships between industry organizations. As such, intervention policies could be developed for these star organizations, such as appropriately limiting the number of these organizations participating in PCPs each year. Incentive policies could be developed for other industry organizations, such as reducing taxes on PCPs and providing subsidies for those who create more balanced inter-organizational collaboration networks [22].
Third, the ownership similarity effect found in this study indicates that the tendency toward homogeneity may cause the separation of organizations with different ownership models (i.e., state-owned organizations, non-state-owned organizations), discouraging industry resource integration. Therefore, policy-setting agencies can take measures to ease this situation and promote collaboration between organizations with different ownership models. Incentive policies that would encourage collaboration between industry organizations with different ownership models could include providing project rewards to diverse teams, increasing the effective diffusion of PC technology-related knowledge and innovation in the industry. The significant geographic proximity effect also has implications for policy-setting agencies; as such, the government could provide subsidies for geographically-diverse projects and establish long-distance communication channels, including PC technology-related forums or training, to promote communication and collaboration.
8. Conclusions
This study uses the descriptive analysis method and network dynamics modeling method to investigate the evolution of the collaboration network of PCPs in Shanghai. The descriptive analysis results show that the network becomes denser over time, but continues to show a core–peripheral structure. The network also has a tendency to develop around a small number of super-connected nodes. The analysis of network dynamics modeling indicates that these macro-level network evolution characteristics are related to a set of self-organization effects. This research provides a network perspective on how industry organizations interact with each other across PCPs, and further demonstrates that the evolution of the collaboration network of PCPs is jointly driven by a series of self-organization effects operating at the micro-level.
9. Limitations and Future Work
This study has two limitations to address in future studies. First, the study was conducted within the specific market context of Shanghai, China. This may somewhat limit the applicability of the research results in other market settings. Future research should further expand the research and explore the dynamics of collaboration networks for PC technology implementation in different market contexts. Second, based on data availability, this study focused on the relationship between owners, designers, prime contractors, and suppliers. Future research should cover more organizations, including consultants. This would expand the understanding of the collaboration network of PCPs.
Author Contributions
Conceptualization, H.Z. and J.C.; Methodology, C.L. and H.Z.; Software, C.L. and J.C.; Validation, H.Z. and J.C.; Formal Analysis, C.L.; Investigation, H.Z.; Resources, J.C.; Data Curation, H.Z.; Writing—original draft preparation, C.L.; Writing—review and editing, H.Z.; Visualization, C.L.; Supervision, J.C.; Project Administration, H.Z.; Funding Acquisition, J.C. All authors have read and agreed to the published version of the manuscript.
Funding
This study is supported by the National Natural Science Foundation of China (No. 71561009 and No. 71972018).
Data Availability Statement
The data presented in this study are available on request from the corresponding author.
Conflicts of Interest
The authors declare no conflict of interest.
References
- Jiang, W.; Hua, Y.; Yuan, M.; Martek, I. Pricing Models under Three-Echelon Prefabricated Construction Supply Chains with Consumer Preferences. Sustainability 2024, 16, 727. [Google Scholar] [CrossRef]
- Wang, J.; Qin, Y.; Zhou, J. Incentive policies for prefabrication implementation of real estate enterprises: An evolutionary game theory-based analysis. Energy Policy 2021, 156, 112434. [Google Scholar] [CrossRef]
- Hao, J.L.; Cheng, B.; Lu, W.; Xu, J.; Wang, J.; Bu, W.; Guo, Z. Carbon emission reduction in prefabrication construction during materialization stage: A BIM-based life-cycle assessment approach. Sci. Total Environ. 2020, 723, 137870. [Google Scholar] [CrossRef] [PubMed]
- Zhang, C.; He, K.; Zhang, W.; Ao, Y. Game evolution analysis of BIM application willingness of prefabricated construction parties. Eng. Constr. Archit. Manag. 2024; ahead-of-print. [Google Scholar] [CrossRef]
- Lu, W.; Lee, W.M.; Xue, F.; Xu, J. Revisiting the effects of prefabrication on construction waste minimization: A quantitative study using bigger data. Resour. Conserv. Recycl. 2021, 170, 105579. [Google Scholar] [CrossRef]
- Zhang, H.; Yu, L. Dynamic transportation planning for prefabricated component supply chain. Eng. Constr. Archit. Manag. 2020, 27, 2553–2576. [Google Scholar] [CrossRef]
- Jaillon, L. The Evolution of the Use of Prefabrication Techniques in Hong Kong Construction Industry. Ph.D. Thesis, Hong Kong Polytechnic University, Hong Kong, China, 2009. [Google Scholar]
- Mao, C.; Shen, Q.; Pan, W.; Ye, K. Major barriers to off-site construction: The developer’s perspective in China. J. Manag. Eng. 2015, 31, 04014043. [Google Scholar] [CrossRef]
- Chiang, Y.H.; Chan, E.H.W.; Lok, L.K.L. Prefabrication and barriers to entry—A case study of public housing and institutional buildings in Hong Kong. Habitat. Int. 2006, 30, 482–499. [Google Scholar] [CrossRef]
- Gutiérrez, N.; Negrão, J.; Dias, A.; Guindos, P. Bibliometric Review of Prefabricated and Modular Timber Construction from 1990 to 2023: Evolution, Trends, and Current Challenges. Sustainability 2024, 16, 2134. [Google Scholar] [CrossRef]
- Mostafa, S.; Kim, K.P.; Tam, V.W.; Rahnamayiezekavat, P. Exploring the status, benefits, barriers and opportunities of using BIM for advancing prefabrication practice. Int. J. Constr. Manag. 2020, 20, 146–156. [Google Scholar] [CrossRef]
- Gong, P.; Teng, Y.; Li, X.; Luo, L. Modeling constraints for the on-site assembly process of prefabrication housing production: A social network analysis. Sustainability 2019, 11, 1387. [Google Scholar] [CrossRef]
- Lu, Y.; Liu, B.; Li, Y. Collaboration Networks and Bidding Competitiveness in Megaprojects. J. Manag. Eng. 2021, 37, 04021064. [Google Scholar] [CrossRef]
- Hong, J.; Shen, G.Q.; Li, Z.; Zhang, B.; Zhang, W. Barriers to promoting prefabricated construction in China: A cost–benefit analysis. J. Clean. Prod. 2018, 172, 649–660. [Google Scholar] [CrossRef]
- Nguyen, D.C.; Jeon, C.H.; Roh, G.; Shim, C.S. BIM-based preassembly analysis for design for manufacturing and assembly of prefabricated bridges. Autom. Constr. 2024, 160, 105338. [Google Scholar] [CrossRef]
- Li, C.Z.; Hong, J.; Xue, F.; Shen, G.Q.; Xu, X.; Mok, M.K. Schedule risks in prefabrication housing production in Hong Kong: A social network analysis. J. Clean. Prod. 2016, 134, 482–494. [Google Scholar] [CrossRef]
- Wong, P.S.; Zwar, C.; Gharaie, E. Examining the drivers and states of organizational change for greater use of prefabrication in construction projects. J. Constr. Eng. Manag. 2017, 143, 04017020. [Google Scholar] [CrossRef]
- Dou, Y.; Xue, X.; Wu, C.; Luo, X.; Wang, Y. Interorganizational diffusion of prefabricated construction technology: Two-stage evolution framework. J. Constr. Eng. Manag. 2020, 146, 04020114. [Google Scholar] [CrossRef]
- Luo, L.; Qiping Shen, G.; Xu, G.; Liu, Y.; Wang, Y. Stakeholder-associated supply chain risks and their interactions in a prefabricated building project in Hong Kong. J. Manag. Eng. 2019, 35, 05018015. [Google Scholar] [CrossRef]
- Li, X.; Li, H.; Cao, D.; Tang, Y.; Luo, X.; Wang, G. Modeling dynamics of project-based collaborative networks for BIM implementation in the construction industry: Empirical study in Hong Kong. J. Constr. Eng. Manag. 2019, 145, 05019013. [Google Scholar] [CrossRef]
- Qiang, G.; Cao, D.; Wu, G.; Zhao, X.; Zuo, J. Dynamics of collaborative networks for green building projects: Case study of Shanghai. J. Manag. Eng. 2021, 37, 05021001. [Google Scholar] [CrossRef]
- Cao, D.; Li, H.; Wang, G.; Luo, X.; Yang, X.; Tan, D. Dynamics of project-based collaborative networks for BIM implementation: Analysis based on stochastic actor-oriented models. J. Manag. Eng. 2017, 33, 04016055. [Google Scholar] [CrossRef]
- Tang, Y.; Wang, G.; Li, H.; Cao, D. Dynamics of collaborative networks between contractors and subcontractors in the construction industry: Evidence from national quality award projects in China. J. Constr. Eng. Manag. 2018, 144, 05018009. [Google Scholar] [CrossRef]
- Brass, D.J.; Butterfield, K.D.; Skaggs, B.C. Relationships and unethical behavior: A social network perspective. Acad. Manag. Rev. 1998, 23, 14–31. [Google Scholar] [CrossRef]
- Cheng, E.W.; Li, H.; Love, P.E.; Irani, Z. Network communication in the construction industry. Corp. Commun. 2001, 6, 61–70. [Google Scholar] [CrossRef]
- Chinowsky, P.; Diekmann, J.; Galotti, V. Social network model of construction. J. Constr. Eng. Manag. 2008, 134, 804–812. [Google Scholar] [CrossRef]
- Son, J.; Rojas, E.M. Evolution of collaboration in temporary project teams: An agent-based modeling and simulation approach. J. Constr. Eng. Manag. 2011, 137, 619–628. [Google Scholar] [CrossRef]
- Ruan, X.; Ochieng, E.G.; Price, A.D.; Egbu, C.O. Knowledge integration process in construction projects: A social network analysis approach to compare competitive and collaborative working. Constr. Manag. Econ. 2012, 30, 5–19. [Google Scholar] [CrossRef]
- Alsamadani, R.; Hallowell, M.R.; Javernick-Will, A.; Cabello, J. Relationships among language proficiency, communication patterns, and safety performance in small work crews in the United States. J. Constr. Eng. Manag. 2013, 139, 1125–1134. [Google Scholar] [CrossRef]
- Liao, P.C.; Lei, G.; Fang, D.; Liu, W. The relationship between communication and construction safety climate in China. KSCE J. Civ. Eng. 2014, 18, 887–897. [Google Scholar] [CrossRef]
- Xu, X.; Li, C.Z.; Wang, J.; Huang, W. Collaboration between designers and contractors to improve building energy performance. J. Clean. Prod. 2019, 219, 20–32. [Google Scholar] [CrossRef]
- Xue, H.; Zhang, S.; Su, Y.; Wu, Z.; Yang, R.J. Effect of stakeholder collaborative management on off-site construction cost performance. J. Clean. Prod. 2018, 184, 490–502. [Google Scholar] [CrossRef]
- Li, X.; Wu, C.; Wu, P.; Xiang, L.; Shen, G.Q.; Vick, S.; Li, C.Z. SWP-enabled constraints modeling for on-site assembly process of prefabrication housing production. J. Clean. Prod. 2019, 239, 117991. [Google Scholar] [CrossRef]
- Wang, Y.; Thangasamy, V.K.; Hou, Z.; Tiong, R.L.; Zhang, L. Collaborative relationship discovery in BIM project delivery: A social network analysis approach. Autom. Constr. 2020, 114, 103147. [Google Scholar] [CrossRef]
- Wang, G.; Li, Y.; Zuo, J.; Hu, W.; Nie, Q.; Lei, H. Who drives green innovations? Characteristics and policy implications for green building collaborative innovation networks in China. Renew. Sustain. Energ. Rev. 2021, 143, 110875. [Google Scholar] [CrossRef]
- Zeng, H.; Cao, J.; Fu, Q. Unpacking the “Black Box”: Understanding the Effect of Strength of Ties on Inter-Team Conflict and Project Success in Megaprojects. Buildings 2022, 12, 1906. [Google Scholar] [CrossRef]
- Wang, X.; Yin, Y.; Deng, J.; Xu, Z. Influence of trust networks on the cooperation efficiency of PPP projects: Moderating effect of opportunistic behavior. J. Asian Archit. Build. Eng. 2023, 22, 2275–2290. [Google Scholar] [CrossRef]
- Wehbe, F.; Al Hattab, M.; Hamzeh, F. Exploring associations between resilience and construction safety performance in safety networks. Saf. Sci. 2016, 82, 338–351. [Google Scholar] [CrossRef]
- Yang, R.J.; Zou, P.X.W.; Wang, J. Modelling stakeholder associated risk networks in green building projects. Int. J. Proj. Manag. 2016, 34, 66–81. [Google Scholar] [CrossRef]
- Zhang, R.; Wang, Z.; Tang, Y.; Zhang, Y. Collaborative innovation for sustainable construction: The case of an industrial construction project network. IEEE Access. 2020, 8, 41403–41417. [Google Scholar] [CrossRef]
- Park, H.; Han, S.H.; Rojas, E.M.; Son, J.; Jung, W. Social network analysis of collaborative ventures for overseas construction projects. J. Constr. Eng. Manag. 2011, 137, 344–355. [Google Scholar] [CrossRef]
- Liu, L.; Han, C.; Xu, W. Evolutionary analysis of the collaboration networks within National Quality Award Projects of China. Int. J. Proj. Manag. 2015, 33, 599–609. [Google Scholar] [CrossRef]
- Mignone, G.; Hosseini, M.R.; Chileshe, N.; Arashpour, M. Enhancing collaboration in BIM-based construction networks through organisational discontinuity theory: A case study of the new Royal Adelaide Hospital. Archit. Eng. Des. Manag. 2016, 12, 333–352. [Google Scholar] [CrossRef]
- Zhou, Z.; Irizarry, J.; Li, Q. Using network theory to explore the complexity of subway construction accident network (SCAN) for promoting safety management. Saf. Sci. 2014, 64, 127–136. [Google Scholar] [CrossRef]
- Snijders, T.A.B.; Steglich, C.E.G.; van de Bunt, G.G. Introduction to actor-based models for network dynamics. Soc. Netw. 2010, 32, 44–60. [Google Scholar] [CrossRef]
- Son, J.; Han, S.H.; Rojas, E.M. Embeddedness and collaborative venture networks among Korean construction firms for overseas construction projects. J. Civ. Eng. Manag. 2015, 21, 478–491. [Google Scholar] [CrossRef]
- Newman, M.E. Clustering and preferential attachment in growing networks. Phys. Rev. E. 2001, 64, 025102. [Google Scholar] [CrossRef] [PubMed]
- Allison, P.D.; Long, J.S.; Krauze, T.K. Cumulative advantage and inequality in science. Am. Sociol. Rev. 1982, 47, 615–625. [Google Scholar] [CrossRef]
- Bonitz, M.; Bruckner, E.; Scharnhorst, A. Characteristics and impact of the Matthew effect for countries. Scientometrics 1997, 40, 407–422. [Google Scholar] [CrossRef]
- Vinciguerra, S.; Frenken, K.; Valente, M. The geography of internet infrastructure: An evolutionary simulation approach based on preferential attachment. Urban Stud. 2010, 47, 1969–1984. [Google Scholar] [CrossRef]
- Lin, T.R.; Dobbins, G.H.; Farh, J.L. A field study of race and age similarity effects on interview ratings in conventional and situational interviews. J. Appl. Psychol. 1992, 77, 363–371. [Google Scholar] [CrossRef]
- Basah, N.H.; Ng, S.I.; Ho, J.A.; Yusof, R.N.R. Cultural similarity effect on the relationship quality between exporters and intermediaries and export performance of SMEs. Int. J. Bus. Soc. 2020, 21, 399–418. [Google Scholar] [CrossRef]
- Fu, S.; Yan, Q.; Feng, G.C. Who will attract you? Similarity effect among users on online purchase intention of movie tickets in the social shopping context. Int. J. Inf. Manag. 2018, 40, 88–102. [Google Scholar] [CrossRef]
- Xie, J.; Shi, Y.; Ma, H. Relationship between similarity in work-family centrality and marital satisfaction among dual-earner couples. Pers. Individ. Differ. 2017, 113, 103–108. [Google Scholar] [CrossRef]
- Dai, X.; Cheng, L. Public selection and research and development effort of manufacturing enterprises in China: State owned enterprises versus non-state owned enterprises. Innovation 2015, 17, 182–195. [Google Scholar] [CrossRef]
- Zhu, H.; Hong, J.; Shen, G.Q.; Mao, C.; Zhang, H.; Li, Z. The exploration of the life-cycle energy saving potential for using prefabrication in residential buildings in China. Energy Build. 2018, 166, 561–570. [Google Scholar] [CrossRef]
- Ganesan, S.; Malter, A.J.; Rindfleisch, A. Does distance still matter? Geographic proximity and new product development. J. Mark. 2005, 69, 44–60. [Google Scholar] [CrossRef]
- Brandes, U.; Indlekofer, N.; Mader, M. Visualization methods for longitudinal social networks and stochastic actor-oriented modeling. Soc. Netw. 2012, 34, 291–308. [Google Scholar] [CrossRef]
- Postles, D. Reviewing social networks: Using Ucinet. Hist. Comput. 1994, 6, 1–11. [Google Scholar] [CrossRef]
- Borgatti, S.P.; Everett, M.G. Models of core/periphery structures. Soc. Netw. 2000, 21, 375–395. [Google Scholar] [CrossRef]
- Han, Y.; Li, Y.; Taylor, J.E.; Zhong, J. Characteristics and evolution of innovative collaboration networks in architecture, engineering, and construction: Study of national prize-winning projects in China. J. Constr. Eng. Manag. 2018, 144, 04018038. [Google Scholar] [CrossRef]
- Herrera, R.F.; Mourgues, C.; Alarcón, L.F.; Pellicer, E. Understanding interactions between design team members of construction projects using social network analysis. J. Constr. Eng. Manag. 2020, 146, 4020053. [Google Scholar] [CrossRef]
- Wu, H.; Qian, Q.K.; Straub, A.; Visscher, H. Stakeholder perceptions of transaction costs in prefabricated housing projects in China. J. Constr. Eng. Manag. 2021, 147, 04020145. [Google Scholar] [CrossRef]
Figure 1.
Research process.

Figure 2.
Network structure: (a) network structure in 2015; (b) network structure in 2019; (c) network structure in 2023.
Figure 2.
Network structure: (a) network structure in 2015; (b) network structure in 2019; (c) network structure in 2023.


Table 1.
Examples of applications of network perspective in the construction field.
| Authors | Examples of Applications of Network Perspective |
|---|---|
| Cheng et al. [25]; Chinowsky et al. [26]; Son and Rojas [27] | Interpersonal communication network, information exchange network, and collaborative relationship network of construction projects |
| Ruan et al. [28]; Alsamadani et al. [29]; Liao et al. [30] | Inter-organizational communication network, knowledge exchange network, and contract relationship network of construction projects |
| Xu et al. [31]; Xue et al. [32] | Stakeholder networks related to project performance |
| Li et al. [33]; Wang et al. [34] | Inter-organizational collaboration networks for building information modeling (BIM) practice |
| Qiang et al. [21]; Wang et al. [2] | Collaborative networks between organizations involved in green building projects |
| Wang et al. [35]; Zeng et al. [36] | Megaproject and green building projects networks |
| Wang et al. [37]; Wehbe et al. [38] | Public–private partnership (PPP) project networks |
| Yang et al. [39]; Zhang et al. [40] | Inter-organizational collaboration network of construction projects |
Table 2.
Demographic information.
| Variable | Category | Number | % |
|---|---|---|---|
| Project size | <¥50 million | 4 | 1.62 |
| ¥50–¥200 million | 14 | 6.14 | |
| ¥200–¥1 billion | 103 | 43.45 | |
| >¥1 billion | 115 | 48.79 | |
| Project type | Residential | 53 | 22.46 |
| Commercial | 67 | 28.21 | |
| Cultural | 36 | 15.23 | |
| Hospital | 23 | 9.86 | |
| Industrial | 57 | 24.24 | |
| Role of organizations | Owner | 173 | 54.75 |
| Designer | 56 | 17.72 | |
| Prime contractor | 48 | 15.19 | |
| Supplier | 39 | 12.34 | |
| Size of organizations | <500 | 42 | 13.27 |
| 500–1000 | 69 | 21.76 | |
| 1000–2000 | 118 | 37.28 | |
| 2000–10,000 | 62 | 19.57 | |
| >10,000 | 25 | 8.12 | |
| Ownership type of owners | State-owned | 90 | 52.02 |
| Non-state-owned | 83 | 47.98 | |
| Ownership type of designers | State-owned | 20 | 35.71 |
| Non-state-owned | 36 | 64.29 | |
| Ownership type of prime contractors | State-owned | 15 | 31.25 |
| Non-state-owned | 33 | 68.75 | |
| Ownership type of suppliers | State-owned | 21 | 53.85 |
| Non-state-owned | 18 | 46.15 | |
| Geographic location of organizations | Local | 283 | 89.56 |
| Non-local | 33 | 10.44 |
Table 3.
Definition of network indicators.
| Indicators | Definition | Explanation |
|---|---|---|
| Linked ties | The number of all ties in a network | This indicator reflects the number of collaborative relationships in the network |
| Linked node fraction | The ratio of the number of connected nodes to all nodes in a network | This indicator reflects the changes of collaborative relationships in the network |
| Average node degree | The average ties number of per node in the network | This indicator reflects the closeness of the network |
| Network density | The ratio of the actual number of ties in the network to the theoretical maximum number of possible ties | The value range of this indicator is 0–1. The closer the value is to 1, the stronger the connectivity between organizations in the network is |
| Main component fraction | The proportion of nodes in the main component (i.e., the component with the largest number of connected nodes) | This indicator reflects the proportion of major organizations participating in the network |
| Average distance among main component nodes | The length of average geodesic distances between nodes in the main component | This indicator reflects the efficiency of collaboration among major organizations participating in the network |
| Clustering coefficient | The average density of neighbors of all nodes in the network | This indicator reflects the degree to which nodes are embedded in the local cluster |
| Freeman’s graph centralization | The degree of variance in a network as a proportion of that in a perfect star network of the same size | The value of this indicator ranges from 0 to 1. The closer the value is to 1, the higher the centrality of the node is |
Table 4.
Network Structure Statistics.
| Indicators | 2015 | 2017 | 2019 | 2021 | 2023 |
|---|---|---|---|---|---|
| Linked node fraction | 0.253 | 0.291 | 0.538 | 0.813 | 0.997 |
| Average node degree | 1.513 | 1.424 | 1.600 | 1.661 | 1.673 |
| Linked ties | 121 | 132 | 272 | 427 | 527 |
| Network density | 0.0015 | 0.0017 | 0.0033 | 0.0056 | 0.0070 |
| Main component fraction | 0.998 | 0.997 | 0.994 | 0.986 | 0.978 |
| Average distance among main component nodes | 1.632 | 1.616 | 1.702 | 1.815 | 1.863 |
| Clustering coefficient | 0.141 | 0.138 | 0.087 | 0.085 | 0.084 |
| Freeman’s graph centralization | 0.001 | 0.001 | 0.002 | 0.006 | 0.011 |
Table 5.
Core–Periphery Structure Analysis.
| Time Points | Density of Linkages | Number of Super-Connected Nodes in the Core | Goodness-of-Fit Value | |
|---|---|---|---|---|
| Core | Periphery | |||
| 2015 | ||||
| Core | 0.320 | 0.013 | 13 | 1.020 |
| Periphery | 0.013 | 0.002 | ||
| 2017 | ||||
| Core | 0.213 | 0.021 | 17 | 1.003 |
| Periphery | 0.010 | 0.002 | ||
| 2019 | ||||
| Core | 0.336 | 0.031 | 21 | 1.005 |
| Periphery | 0.011 | 0.004 | ||
| 2021 | ||||
| Core | 0.257 | 0.020 | 23 | 1.005 |
| Periphery | 0.021 | 0.003 | ||
| 2023 | ||||
| Core | 0.379 | 0.023 | 28 | 1.074 |
| Periphery | 0.018 | 0.002 | ||
Table 6.
Results of SAOM Analysis.
| Independent Variables | Estimate | Standard Error | t-Value | Decision |
|---|---|---|---|---|
| Rate parameters | ||||
| Period 1 (2015–2017) | 0.042 | 0.013 | 3.231 | — |
| Period 2 (2017–2019) | 0.846 | 0.108 | 7.833 | — |
| Period 3 (2019–2021) | 0.528 | 0.043 | 12.279 | — |
| Period 4 (2021–2023) | 0.374 | 0.038 | 9.842 | — |
| Structure-based effect | ||||
| Preferential attachment | 7.647 *** | 0.939 | 8.144 | H1: Support |
| Geographic proximity | 2.197 ** | 0.761 | 2.887 | H5: Support |
| Attribute-based effect | ||||
| Ownership similarity | 3.628 *** | 0.226 | 16.053 | H2: Support |
| Size similarity | 10.256 | 13.261 | 0.773 | H3: Not Support |
| Experience similarity | 4.825 | 5.276 | 0.915 | H4: Not Support |
Note: *** p < 0.001. ** p < 0.01.
Disclaimer/Publisher’s Note: The statements, opinions and data contained in all publications are solely those of the individual author(s) and contributor(s) and not of MDPI and/or the editor(s). MDPI and/or the editor(s) disclaim responsibility for any injury to people or property resulting from any ideas, methods, instructions or products referred to in the content. |
© 2024 by the authors. Licensee MDPI, Basel, Switzerland. This article is an open access article distributed under the terms and conditions of the Creative Commons Attribution (CC BY) license (https://creativecommons.org/licenses/by/4.0/).
Share and Cite
MDPI and ACS Style
Liu, C.; Zeng, H.; Cao, J. Evolution of Project-Based Collaborative Networks for Implementing Prefabricated Construction Technology: Case Study in Shanghai. Buildings 2024, 14, 925. https://0-doi-org.brum.beds.ac.uk/10.3390/buildings14040925
AMA Style
Liu C, Zeng H, Cao J. Evolution of Project-Based Collaborative Networks for Implementing Prefabricated Construction Technology: Case Study in Shanghai. Buildings. 2024; 14(4):925. https://0-doi-org.brum.beds.ac.uk/10.3390/buildings14040925
Chicago/Turabian StyleLiu, Cong, Hui Zeng, and Jiming Cao. 2024. "Evolution of Project-Based Collaborative Networks for Implementing Prefabricated Construction Technology: Case Study in Shanghai" Buildings 14, no. 4: 925. https://0-doi-org.brum.beds.ac.uk/10.3390/buildings14040925
Note that from the first issue of 2016, this journal uses article numbers instead of page numbers. See further details here.