
Analysis of Non-Marital Fertility in Nigeria and Implications for Intervention and Future Research


Department of Sociology and Criminology & Law, University of Florida, Gainesville, FL 32611, USA
Soc. Sci. 2021, 10(7), 256; https://0-doi-org.brum.beds.ac.uk/10.3390/socsci10070256
Submission received: 31 May 2021
/
Revised: 24 June 2021
/
Accepted: 30 June 2021
/
Published: 6 July 2021
(This article belongs to the Section Family Studies)
Abstract
:Fertility and marriage are inextricably linked in sub-Saharan Africa, but recent changes, such as the rise in non-marital fertility, signals a weakening link, and the second demographic transition offers some explanations. Non-marital fertility comes with disadvantages, but it has not been adequately studied in Nigeria. Hence, this study examined the levels, patterns, and correlates of non-marital fertility, and offers implications for interventions and future research. Using data from the Nigeria Demographic and Survey 2008–2018, with a pooled weighted sample size of 11,925 unmarried women, percentage distribution was employed and a two-part model for count data was fitted, with the result showing that the level of non-marital fertility is 29%, and it is common among younger, rural dwelling, and uneducated unmarried women. The correlates of non-marital fertility include age, region of residence, level of education, religion, household wealth index, relationship status, ethnicity, work status, and age at sexual debut. Interventions to arrest rise of non-martial fertility due to its obvious disadvantages, should strengthen sexual and reproductive health programs for unmarried rural-dwelling young women, and revitalize welfare efforts for children born outside wedlock, for poor women, while future research should explore an in-depth understanding of non-marital births.
1. Introduction
Many countries around the world have either experienced, or are currently experiencing, fertility transition, including Nigeria (Feyisetan and Bankole 2000; National Population Commission—NPC, and ICF 2019). This transition in fertility patterns is impacted by numerous factors, but a notable one is the reduction in the proportion of married people, since fertility and marriage have always been inextricably linked, especially in sub-Saharan Africa (Bongaarts 1987; Palamuleni and Makiwane 2007; Majumder and Ram 2015; Alaba et al. 2017). In the past, marriage was considered important for the onset of fertility, but recent evidence shows otherwise, as marriage is rapidly losing its grip on fertility due to the rising number of births occurring outside of formal marital unions, as either teenage births, premarital fertility, or non-marital/out-of-wedlock fertility—all emerging fertility patterns (Chimere-Dan 1997; Heuveline et al. 2003; Perelli-Harris and Gerber 2011; Madhavan et al. 2013; M. E. Palamuleni and Adebowale 2014; Maluleke 2017; Nyarko and Potter 2021). Some of the factors that have contributed to marriage losing its grip on fertility include the rising age at first marriage, reduction in the proportion of the married population, early sexual debut, contraception revolution, as well as increasing women empowerment and emancipation, resulting in a shift of births to single women (Heuveline et al. 2003; Lesthaeghe 2010).
These emerging fertility patterns, especially non-marital fertility, come with several consequences for the mother, child, and the society at large. Some of these consequences manifest in the form of socioeconomic, household, and life course disadvantages for the mother and child, while, for the larger society, it could result in a strain on social welfare facilities and safety nets in places where such facilities are available (Akerlof et al. 1996; Garenne and Zwang 2006; Crosnoe and Wildsmith 2011; Madhavan et al. 2013; Kim et al. 2017). In some cases, non-marital fertility could have health consequences for the child, such as child mortality or poor cognitive ability (Crosnoe and Wildsmith 2011; Clark and Hamplová 2013). In addition, life course research has also provided evidence that individuals born and raised in two parent household fare better than those born to single mothers (Cherlin 1999; Heuveline et al. 2003; Crosnoe and Wildsmith 2011; Clark and Hamplová 2013; Smith-Greenaway 2016; Clark et al. 2017; Smith-Greenaway and Clark 2018). Despite these identified consequences of non-marital fertility, there is paltry scholarly evidence on this phenomenon in the context of Nigeria, to develop programs and policies to tackle its consequences. In places where it has been studied, especially those that are similar the sub-Saharan African context, such as Kenya, Ghana, Namibia and South Africa, there are evidence pointing to a rising number of non-marital fertility, and many of these studies have come to the consensus that a range of socioeconomic and demographic factors predict non-marital fertility (Chimere-Dan 1997; Musau et al. 2012; Pazvakawambwa et al. 2014; Nyarko and Potter 2021).
Considering this limited evidence in the literature on non-marital fertility in Nigeria, this study was designed in alignment with the pocket of evidence on the prevalence, pattern, and correlates of non-marital fertility in similar context in SSA and contend that similar evidence will be found in Nigeria, with no significant differences expected. In the same vein, I also align with Pazvakawambwa et al. (2014) that methdologically, the study of non-marital fertility can be taken beyond just exploring the factors that determine the occurrence of non-marital fertility in a population, by modelling it as a binary variable, but the number of children born to unmarried women can be modelled as count data, which has been a major setback for the numerous works on non-marital fertility in SSA. The findings from this study are significant for interventions that aim to address the rise in unintended births, which has great consequences for both mothers and children. Hence, this study examined the level, patterns, and correlates of non-marital fertility in Nigeria, through the lens of the second demographic transition by analyzing secondary data from the Nigerian demographic and health survey. Moreover, this study presented evidence to show that non-marital fertility is low in Nigeria, and the correlates are situated in the socioeconomic and demographic spectrum, and, at the same time, it provides some insights for future research into the issue and offered recommendations for interventions.
2. Literature Review
A review of literature on the phenomenon of non-marital fertility in sub-Saharan Africa shows that many of the studies have a consensus on age as an important correlate of non-marital fertility, with older unmarried women having a higher likelihood of having non-marital births compared to younger women (Pazvakawambwa et al. 2014; Maluleke 2017; Nyarko and Potter 2021). Education is also one of the identified correlates of non-marital fertility, and these studies submitted that the higher the level of education of a woman, the less likely she is to have a child outside of marriage. Specifically, a Namibian study reported that education has an inverse relationship with non-marital fertility (Upchurch et al. 2002; Perelli-Harris and Gerber 2011; Pazvakawambwa et al. 2014; Nyarko and Potter 2021), but other evidence, also from Namibia, shows that the relationship is not strong, although the focus of this other study was among teenagers (Chimere-Dan 1997). Further evidence also shows that the place of residence (rural/urban) is a correlate of non-marital fertility; it has been submitted that non-marital fertility is more likely to occur among unmarried women residing in rural areas compared to women in urban areas (Nyarko and Potter 2021). Scholarly evidence on religion and non-marital fertility has been reported in a study of the spatial variations in non-marital fertility, and it has been reported that in places with significant religious traditions, women show higher propensities to have low levels of non-marital fertility (Klüsener 2015).
Furthermore, household wealth index has been identified as one of the key correlates of non-marital fertility; studies have submitted that richer individuals are statistically less likely to have non-marital fertility compared to poor unmarried women, and the explanation for this is that that poorer women are bedeviled by unmet need for contraceptives that can help them avoid unintended pregnancies, whereas richer women are not to be faced with such issues and can easily avoid non-marital births, except if they decide to go for it by choice (Maluleke 2017; Nyarko and Potter 2021). Studies have also established the predictive power of employment status on non-marital fertility; it has been stated that employed unmarried women are more likely to experience these unconventional types of childbirth—non-marital fertility (Guzzo 2014; Pazvakawambwa et al. 2014; Kim et al. 2017; Nyarko and Potter 2021). Two notable studies of non-marital fertility in sub-Saharan Africa have both reported a significant relationship between marital status and non-martial fertility, and non-martial births are higher and more likely to happen amongst cohabiting women compared to single or never-married women. This comes with evidence to support that cohabitation or living with a partner is playing an increasing role in the family system across the world, and even in several sub-Saharan African countries. In this kind of arrangement, which is not regular marriage, people have started bearing children as much as married couples, without the due marital rites (Musick 2007; Pazvakawambwa et al. 2014; Nyarko and Potter 2021). Lastly, a few other factors have been identified as correlates of non-marital fertility; ethnicity is one of such, and it has been reported to significantly predict non-marital fertility and its differentials. One of the recent evidence on non-marital fertility in Ghana reported ethnicity as one of the correlates of non-marital fertility, and this is in tandem with what has been found in the United States, where women of a certain racial/ethnic group have increased non-marital fertility relative to women from other groups, as well as another study in South Africa that reported differing risks of non-marital fertility among various population groups (Wildsmith and Raley 2006; Maluleke 2017; Nyarko and Potter 2021).
3. Theoretical Framework
The Second Demographic Transition
The second demographic transition (SDT), which is an offshoot of the classic or first demographic transition theory, is used to underpin the present study. It refers to the historical declines in mortality and fertility, as witnessed in the 18th century and beyond in several European countries and continuing until this present day in many developing countries (Lesthaeghe 2010). The precursor to the SDT is the classic or first demographic transition (FDT), which is characterized by a lowered age at first marriage and an increase in the proportion of those married; fertility was also confined to marriages and contraception only mattered to stop fertility at older ages, or when the desired fertility had been achieved. Basically, the product of the FDT is an older stationary population, characterized by a corresponding replacement level of fertility (TFR = 2.1), zero population growth, and higher life expectancies, as well as other observed social and demographic changes (Kirk 1996).
The observed demographic pattern in FDT was not seen as the end but a rise in new demographic and societal trends were envisioned and these new demographic developments were referred to as second demographic transition (SDT) that ultimately decouple fertility from marriage (Lesthaeghe and van de Kaa 1986). A few other changes in the demographic characteristics of the population also occurred, all of which were fueled by the rise in the following ‘higher order’ needs: individual autonomy, expressive work and socialization values, self-actualization, grass roots democracy, recognition, second secularization wave, sexual revolution, refusal of authority, political ‘depillarization’, rising symmetry in sex roles, rising educational levels, greater female economic autonomy, flexible life course organization, and multiple lifestyles (Lesthaeghe and Neidert 2006; Lesthaeghe 2014, 2020).
Key tenets of the SDT encompass a disconnection between marriage and fertility, and they include the following: reversed nuptiality trends, reversed purpose and timing of fertility, and social contrasts. Reversed nuptiality trends are evident in the fall in the proportion of those married, the rising ages of first marriage, increase in cohabitation—both pre- and post-marital, rise in number of divorces, and decline in marriage rates, with people opting for a different arrangement, such as living apart together (LAT). For fertility, different patterns of fertility show up, characterized by fertility postponement, increasing mean age at parenthood, structural sub-replacement fertility, efficient contraception, rising non-marital fertility, parenthood outside of marriage (among cohabiting couples andsingle mothers), and rising definitive childlessness among women ever in union. In summary, it is characterized by the low fertility and diversity of union and family types (Perelli-Harris and Gerber 2011; Lesthaeghe 2014; Zaidi and Morgan 2017). SDT offers a good theoretical underpinning for this study. Although many of the elements and important tenets of the SDT are not fully observable in SSA, evidence shows that demographic trends, reminiscent of the key tenets of SDT, have started showing up in many parts of Africa (Teitelbaum 1975; Lesthaeghe 2010). Some of these include changing patterns of marriage and union formation, rising age at first marriage, reduction in the proportion of those getting married, and delayed fertility in several sub-Saharan Africa countries (Feyisetan and Bankole 2000; Budlender et al. 2004; Pazvakawambwa et al. 2013; National Population Commission—NPC, and ICF 2019). Why have these trends emerged in sub-Saharan Africa? Factors such as rising women education and emancipation have been identified. Several interventions have focused on increasing women empowerment, and the contraceptive revolution has taken a strong hold in many parts of sub-Saharan Africa, including Nigeria, and this explains the manifestation and rise in reverse fertility trends, such as non-marital fertility, which is the focus of the current study (Musau et al. 2012; Pazvakawambwa et al. 2013; Maluleke 2017; Nyarko and Potter 2021).
4. Data & Methods
Data from the last three installments of the Nigeria demographic and health survey (NDHS) were used in this study; these were 2008, 2013, and 2018. NDHS is a survey conducted by the National Population Commission in Nigeria with technical assistance from DHS Program through ICF Macro to provide demographic and health data for planning, research and policy making. NDHS provides data on the full birth history of women of reproductive age (15–49) in the country, employing a multistage (two-stage) sample design based on the sampling frame of the 2006 Nigerian population Census. The two-stage sampling procedure involved a random selection of clusters during the first stage and systematically sampled households from the clusters in the second stage (National Population Commission—NPC/Nigeria, and ICF International 2009, 2014; National Population Commission—NPC, and ICF 2019). The data were obtained from the DHS program with permission from the DHS program team through their website, available at: The DHS Program—Data. In this study, the unit of analysis is women who were not in formal/legal marital union at the time of the survey, i.e., women who were either cohabiting or never married and, thus, any childbearing that occurs among them was considered as non-marital birth (Nyarko and Potter 2021). This resulted in the following sample sizes for each survey year: 2008 (n = 4147), 2013 (n = 4308) and 2018 (n = 3470), and a pooled weighted sample size of 11,925 for the years 2008–2018.
4.1. Study Variables
The variables in this study including dependent and all independent variables have been selected based on important literature on non-marital fertility in sub-Saharan Africa.
The dependent variable in this study is non-marital fertility defined as the number of children ever born to unmarried women measured as count variable. This dependent variable was derived from a question in the survey that asked about the number of children ever born to a woman, and I extracted the children ever born (reported as specific numbers) to unmarried or cohabiting women to have non-marital fertility and this number of children ever born is a count variable, i.e., the exact count of children that have been to a woman who self-reported that she is not legally married. The independent variables of interest in the study are individual-level socioeconomic and demographic characteristics of the unmarried women including age at last birthday coded as [15–19 (0), 20–24 (1), 25–29 (2), 30–34 (3), 35–39(4), 40–44 (5) and 45–49 (6)], region of residence was also considered and it was presented as used in the survey [north central (0), north east (1), north west (2), south east (3), south south (4) and south west (5)]] and, type of place of residence [urban (0) and rural (1)]. I also considered respondents’ highest level of education coded as no education (0), primary (1), secondary (2) and higher (3), religion [Catholic (0), Christian (1), Islam (2) and traditional/others (3)], household wealth index [poorest (0), poorer (1), middle (2), richer (3) and richest (4)], current relationship status [never married (0) and living together/cohabiting (1)], ethnicity [other ethnic groups outside the major ones (0), Hausa/Fulani (1), Igbo (2) and Yoruba (3)],current work status [not working (0) and working (1)] and lastly, age at sexual debut [less than 20 years (0) and 20 years plus (1)], and all these variables have been selected based on important literatures that underpinned the design of this study (Musau et al. 2012; Pazvakawambwa et al. 2013; Maluleke 2017; Nyarko and Potter 2021).
4.2. Analytical Procedure
The data were analyzed using Microsoft Excel and Stata 15 at three levels of univariate, bivariate and multivariate. The univariate analysis involved presenting frequency, bar charts and a histogram of all variables in the study. The level of non-martial fertility per survey year was presented as bar charts while the total count of non-marital births from the pooled data was presented using a histogram. In the next level, a bivariate analysis was done to show the distribution of non-marital fertility by the selected independent variables, after non-marital fertility was categorized into yes (had non-marital fertility) and no (no non-marital fertility), this was done to be able to ascertain the pattern of non-marital fertility in Nigeria. For the multivariate analysis, the count of children ever born to unmarried women was used as the outcome variable. To model count variable, there are various options available, but determining the model that best fits the data requires setting some criteria (Winkelmann 2008). One of the key conditions to be met in a Poisson distribution is that the mean must be equal to the variance, but in the case of the study data, the variance was found to be higher than the mean, which portend overdispersion in our data and the overdispersion is obvious in the high count of zeros in the data (Karazsia and van Dulmen 2008). For this, I fitted series of count models including Poisson regression, negative binomial regression, zero-inflated Poisson (zip) regression and zero-inflated binomial regression for the data and applied selection criteria to decide on the model that best fits the data.
In this stance, I employed both the Akaike information criterion (AIC) and the Bayesian information criterion (BIC), also known as the Scharwz criterion to determine the level of fit (quantified in terms of the log likelihood) with model complexity (a penalty for using the sample data to estimate the model parameters) (Karazsia and van Dulmen 2008; O’Malley and Neelon 2014). It is popularly accepted that the model with the lowest AIC or BIC best fits the data we intend to model. Based on this, I selected the zero-inflated Poisson regression to fit the count model for the number of non-marital fertilities (non-marital fertility intensity) in this study. The model selection Stata output has been presented below in Table 1.
4.3. Model Specification
Suppose that for each observation, there are two possible outcomes. Suppose that if case 1 occurs, the count is zero. However, if case 2 occurs, counts (including zeros) are generated according to a Poisson model. Suppose that case 1 occurs with probability and case 2 occurs with probability 1 − . Therefore, the probability distribution of ZIP random variable yi can be written as follows:
where 𝜋i is the logistic link function defined below.
The Poisson component can include an exposure time t and a set of k regressor variables (the x’s). The expression relating these quantities is as follows:
Often, 1, in which case β1 is called the Intercept. The regression coefficients β1, β2 … βk are unknown parameters that are estimated from a set of data. Their estimates are symbolized as b1, b2 …, bk.
This logistic link function 1 is given by the following:
where
The logistic component includes an exposure time t and a set of m regressor variables (the z’s). Note that the z’s and the x’s may or may not include terms in common with one another. The component Pr refers to the fertility propensity, and the count (Poisson) component refers to the fertility intensity of the woman. The set of regressors z’s refer to the set of predictor variables selected for the study based on literature, age, region of residence, level of education, religion, household wealth index, current relationship status, ethnicity, occupation, and age at sexual debut.
5. Results
This section presents the results of the data analysis, at the univariate, bivariate and multivariate levels. At first, I show the level of non-marital fertility across the various survey years, as well as a combination of all the years, and a distribution of the respondents’ characteristics is presented in Table 2. The pattern of non-marital fertility is presented in Table 3, and after that I have presented a histogram of the number of total numbers of non-marital children, and finally, Table 4 shows the regression estimates from the zero-inflated Poisson regression model that was utilized in this study.
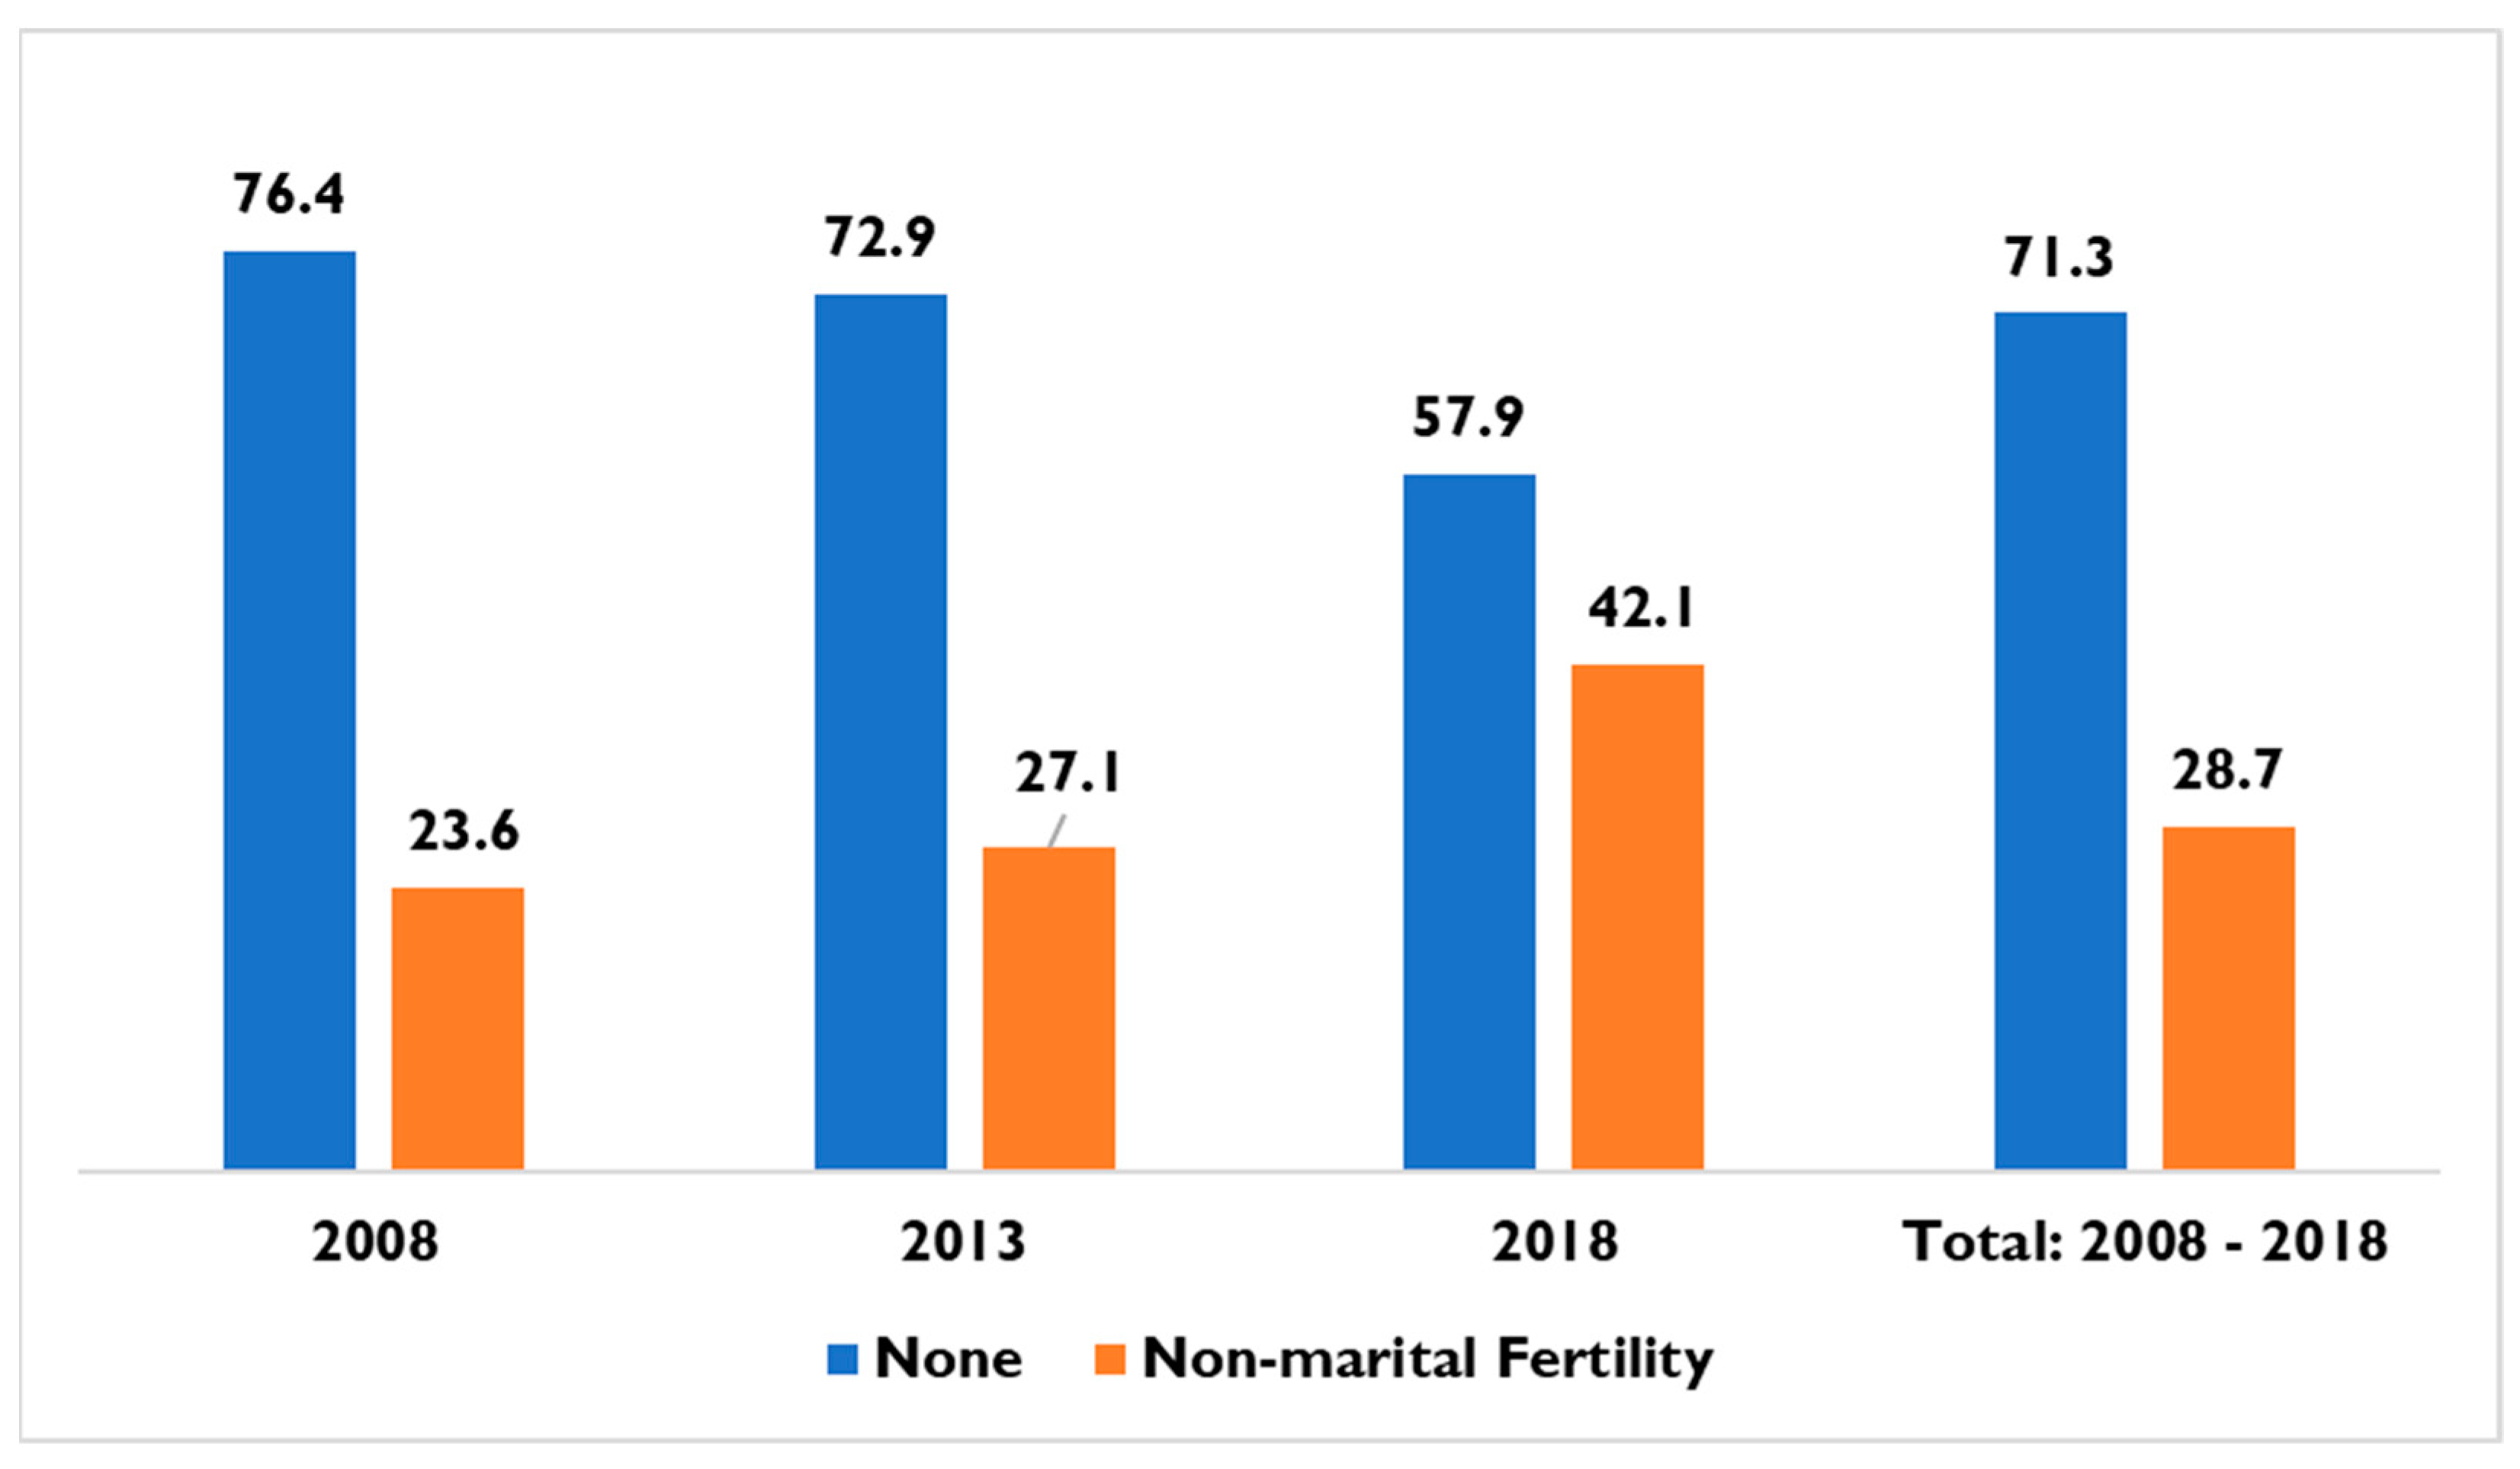
Figure 1 above shows the level of non-marital fertility in Nigeria for the last decade. The level of non-marital fertility in Nigeria has been experiencing a steady increase over the years. The observed level in 2008 was 23.6%, but this increased to 27.1% five years later, in 2008; this increase continued until 2018, as the level of non-marital fertility increased to 42.1%. The analysis of the pooled data shows that, in the last decade, the level of non-marital fertility in Nigeria stands at 29%.
In Table 2, 35% of the women are in the age group 20–24, less than 2% of the women are aged 45–49, and about 24% of the unmarried women are teenagers (15–19). More than one-third of the unmarried women are residing in the south–south region of the country (35%), and the least percentage of unmarried women are from the northwest, with about 3.5%. For place of residence, the study found that more than half (54.1%) of the unmarried women reside in urban areas. The percentage of unmarried women who have secondary education as their highest level of education is about 65%, while the percentage of unmarried women with no education is just 3.9%. There are also more Protestants than other religious groups, with 70.1%, followed by Catholic, with 17.4%, while adherents of the traditional and other religions are less than 1% (0.8%). Unmarried women in richer households constitute 30.4% and 35.1%, respectively, even as the poorest unmarried women are 4.4% of the total sample of respondents. For relationship status, more than three-quarters of the sample of respondents have never been married (84.4%), while 15.6% are living together or cohabiting. It was also found that the Igbo ethnic group constitute more than one-fourth of the total sample (25.5%), other ethnic groups outside Hausa/Fulani, Yoruba and Igbo are more than half of the sample of respondents (51.3%). Further, 66.4% of the sample of unmarried women are currently working to earn a living. Finally, 72.2% of the unmarried women had their sexual debut when they were younger than 20 years of age, while the remaining 27.8% had their first sexual experience at age 20 or over.
Table 3 reveals the pattern of non-marital fertility by the demographic and socioeconomic characteristics of the respondents in the study. Non-marital fertility is highest among unmarried women in the more advanced reproductive age groups; 40–44 (68.7%), 45–49 (76.7%), while it is at the lowest among younger women; 15–19 (14.3%). The regional pattern shows that non-marital fertility is the highest in the south–south region of the country (36.8%), and this is closely followed by the northeast, with 36.4%; the region with the lowest percentage is north central with 18%. Non-marital fertility was also found to be higher in rural areas than in urban areas (34.7% vs. 23.6%). Non-marital fertility has also been found to be the highest among women with no education (62.9%), while it is the lowest among women with higher education (10.7%). Adherents of traditional and other religions have the highest prevalence of non-marital fertility (43.0%), and this is followed by Protestants, with 31.5%, and non-marital birth is the lowest among Catholics (19.1%).
Furthermore, non-marital fertility is the lowest among the richest unmarried women (18.6%), while it is the highest among unmarried women in the poorest households (48.6%). Also, cohabiting women have the highest prevalence of non-marital fertility, with 84.8%, compared to single women. It was also found that non-marital fertility is the highest among women from other ethnic groups (33.3%) outside the most popular Hausa/Fulani, Yoruba, and Igbo. It was also found that there is a higher percentage of non-marital fertility among unmarried working women (34.4%) compared to unmarried women who are not working (17.2%). Lastly, it can be reported that unmarried women who made their sexual debut while they were younger than 20 years of age have a higher percentage of non-marital fertility (32.8%) compared to unmarried women who had their first sexual experience while they were aged 20 years or more, who account for 17.9% non-marital fertility. It is important to state that these observed patterns of non-marital fertility were obtained across all the survey years, as well as the pooled data.
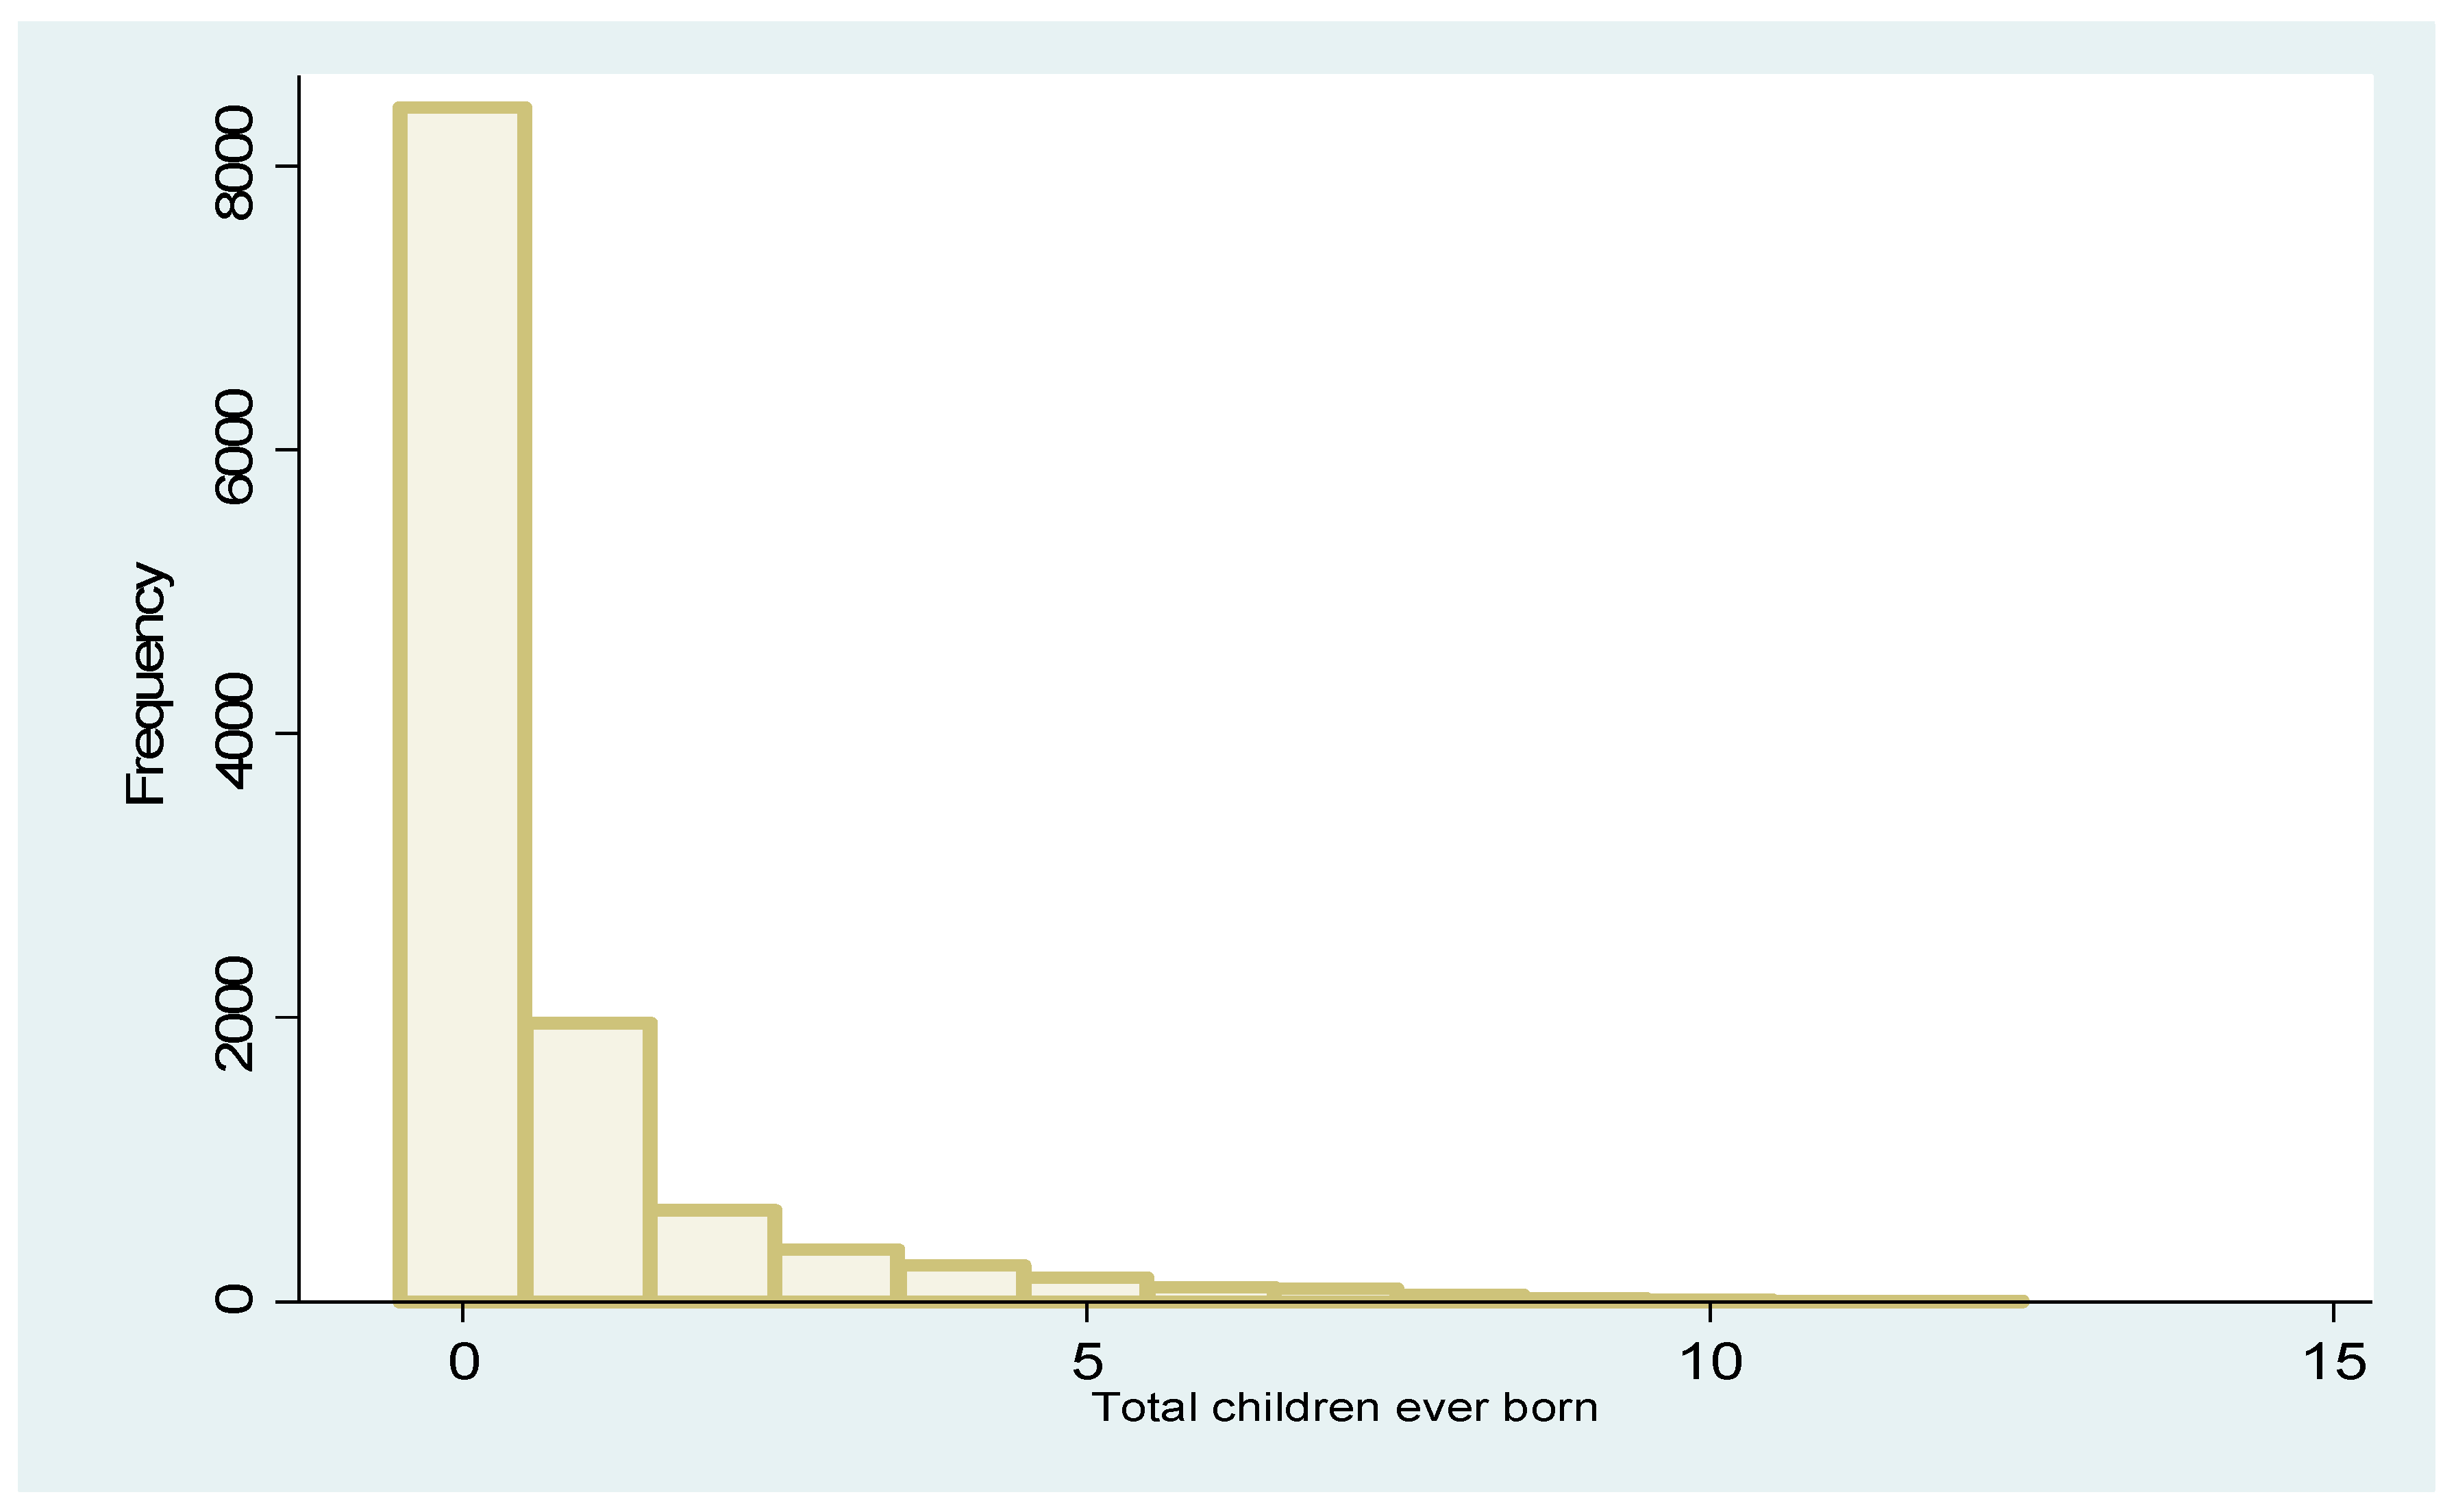
Figure 2 shows the histogram of the total number of children born to unmarried women. The graph alludes a high frequency of zeros and a long right tail, implying an overdispersion of the data.. The mean number of non-marital fertility is 0.68, while the variance was 2.1, implying that they are unequal and the variance is higher than the mean, implying an overdispersion in the data, and this allowed for an exploration of various count models to identify the count model that best fits the data. Table 4 below shows that regression estimates from the zero-inflated Poisson regression model for non-marital fertility in Nigeria.
The presence of non-marital fertility in the population was found to be significantly predicted by all the socioeconomic and demographic factors considered in the study, apart from the place of residence. The results of the regression analysis in Table 4 above showed that the likelihood of non-marital fertility reduces with age, as older women are less likely than younger women to have non-marital births. Women aged 45–49 years are 38% less likely to have non-marital birth compared to teenagers (OR = 0.62; 95% CI: 0.32–1.22), women aged 40–44 are 52% significantly less likely to have non-marital birth compared to unmarried teenage women (OR = 0.48; 95% CI: 0.26–0.89). The likelihood of non-marital fertility among women in the age group of 35–39 is 34% less than women aged 15–19 (OR = 0.66; 95% CI: 0.38–1.15). The analysis also revealed that women in the age groups 30–34, 25–29 or 20–24 are 21% (OR = 0.79; 95% CI: 0.48–1.28), 20% (OR = 0.80; 95% CI: 0.51–1.26), or 16% (OR = 0.84; 95% CI: 0.54–1.31) less likely to have non-marital fertility compared teenagers, respectively. The study also found that women residing in the northeast region of the country have the highest likelihood of non-marital fertility compared to women in the north central region of the country (OR = 1.46; 95% CI: 0.73–2.93). Women residing in the southeast, south–south, and southwest are 22% (OR = 0.88; 95% CI: 0.52–1.51), 38% (OR = 0.62; 95% CI: 0.43–0.91), and 20% (OR = 0.80; 95% CI: 0.51–1.26) less likely to have non-marital fertility compared to unmarried women in the north central region of the country, respectively. For place of residence, the study found that women residing in rural areas are 14% more likely to have non-marital fertility compared to women living in urban areas (OR = 1.14; 95% CI: 0.91–1.43). Non-marital fertility demonstrated a dose relationship with level of education, i.e., the higher the level of education, the higher the likelihood of having a non-marital birth; it was found that women with a higher education are significantly, 400%, more likely to have non-marital fertility compared to those without any formal education (OR = 5.00; 95% CI: 2.51–9.98). Women with secondary and primary levels of education are 127% (OR = 2.27; 95% CI: 1.19–4.30) and 11% (OR = 1.11; 95% CI: 0.56–2.20) more likely to have non-marital fertility compared to women with no formal education, respectively.
Regarding wealth index, the study found that there is also a dose relationship between wealth index and the likelihood of non-marital fertility, i.e., the higher the wealth index category of a woman’s household, the higher the likelihood of having a non-marital fertility. Household wealth index also significantly predicts non-marital fertility, as the richest women have the highest likelihood of having non-marital fertility compared to women from other households (OR = 11.21; 95% CI: 3.53–35.58). The study also found that cohabiting women in Nigeria are significantly, 97%, less likely to have non-marital fertility compared to never-married or non-cohabiting women (OR = 0.03; 95% CI: 0.02–0.06). The odds of non-marital fertility is also found to be more than 100% higher for Igbo women compared to unmarried women from other ethnic groups (OR = 2.04; 95% CI: 1.31–3.18), and Hausa/Fulani women were found to be 90% more likely to have non-marital fertility compared to women of other ethnic groups, outside Igbo and Yoruba (OR = 1.90; 95% CI: 0.75–4.81), and Yoruba women present the least likely to have non-marital fertility (OR = 0.84; 95% CI: 0.53–1.32). Looking at the predictive ability of work status, it was found that working women are significantly, 24%, less likely to have non-marital fertility compared to non-working women (OR = 0.76; 95% CI: 0.59–0.99). For age at first sexual experience, it was found that women who had their sexual debut at exactly or after 20 years of age had a higher chance of non-marital fertility compared to those who had their sexual debut at younger than 20 years (OR = 2.70; 95% CI: 2.14–3.40).
The results from the second part of the model showed that the number of non-marital fertilities in Nigeria increased with the age of the women, with women aged 45–49 (RR = 9.80, 95% CI: 8.32–11.56), women aged 40–44 (RR = 8.08, 95% CI: 6.86–9.50), women aged 35–39 (RR = 7.31, 95% CI: 6.24–8.58), women aged 30–34 (RR = 5.62, 95% CI: 4.80–6.58), and those aged 25–29 (RR = 3.66, 95% CI: 3.14–4.27) likely to have higher number of non-marital births compared to those women in the 15–19 age group. Just as it was for the probability of non-marital fertility, this study found that women’s region of residence is a significant correlate of the number of children born to unmarried women, with women from all other regions more likely to have a higher number of non-marital children compared to women from the north central region of the country; northeast (RR = 1.15, 95% CI: 1.00–1.33), northwest (RR = 1.56, 95% CI: 1.20–2.02), southeast (RR = 1.30, 95% CI: 1.09–1.56), south–south (RR = 1.19, 95% CI: 1.07–1.33) and southwest (RR = 1.15, 95% CI: 1.05–1.32). Women from the northwest region of the country are the most likely to have the highest number of non-marital births, as seen from the test statistic presented. It was also found that the place of residence had no significant effect on the number of children born to never-married woman, although unmarried rural women were likely to have more children compared to their urban counterparts (RR = 1.05, 95% CI: 0.99–1.12). The regression analysis further revealed that the number of non-marital fertilities significantly reduced as a woman’s level of education increased. Women with primary education (RR = 1.06, 95% CI: 0.98–1.15), secondary education (RR = 0.85, 95% CI: 0.78–0.92), and those women with a higher education level (RR = 0.53, 95% CI: 0.46–0.63) were likely to have fewer non-marital births compared to those with no formal education.
Furthermore, it was found that adherents of traditional/other religion are more likely to have a higher number of non-marital fertilities (RR = 1.31, 95% CI: 1.08–1.60) compared to Catholic women. Protestant women (RR = 1.03, 95% CI: 0.94–1.13) and Islamic women (RR = 1.03, 95% CI: 0.94–1.22) are more likely to have a higher number of non-marital fertilities compared to Catholic women. With respect to the economic status of the women, it was found that fertility intensity seemed to significantly diminish from the poorest women to the richest women. Women in the middle wealth index status (RR = 0.90, 95% CI: 0.81–1.00), richer women (RR = 0.86, 95% CI: 0.77–0.97), and the richest women (RR = 0.69, 95% CI: 0.61–0.79) had fewer number of non-marital fertilities compared to the poorest women. For the relationship between relationship status and non-marital fertility, it was found that cohabiting women were significantly more likely to have an increased number of non-marital births compared to their never-married counterparts (RR = 2.34, 95% CI: 2.19–2.50).
The employment status of women was also found to have a significant relationship with the number of non-marital fertilities; working women have a significantly higher number of non-marital fertilities compared to those who are not working (RR = 1.11, 95% CI: 1.02–1.21). Just as was found for the probability of non-marital fertility, this study also found a significant relationship between ethnicity and the number of non-marital fertilities. Specifically, women from Hausa/Fulani (RR = 1.29, 95% CI: 1.02–1.63), Igbo (RR = 1.01, 95% CI: 0.88–1.15) and Yoruba (RR = 1.03, 95% CI: 0.92–1.15) ethnic groups have a significantly higher number of non-marital fertilities compared to women from all other ethnic groups in the country. Finally, this study found that a statistically significant relationship exists between age at sexual debut and the number of non-marital fertilities in Nigeria; women who had their first sexual experience at age 20 or older have a significantly lower number of non-martial fertilities compared to those who made their sexual debut at younger than 20 years of age (RR = 0.74, 95% CI: 0.68–0.79).
6. Discussion
This study analyzed the level, patterns, and correlates of non-marital fertility using the 2008, 2013 and 2018 Nigeria demographic and health survey data. It was found that non-marital fertility is low in Nigeria compared to other countries in sub-Saharan Africa, where evidence is available, but the level has been experiencing a steady rise in the last decade, from 23.6% in 2008 to 27.1% in 2013, and, finally, to 42.1% in 2018. The findings of the current study align with what has been found in other parts of the continent, such as in Ghana, where it has been reported that the level of non-marital fertility has been on the rise (24.0%, 33.0%, and 40.0% for 2003, 2008, and 2014, respectively), as well as other places, where it has been reported to be on the rise in the last past decades (Pazvakawambwa et al. 2014; Clark et al. 2017; Maluleke 2017; Nyarko and Potter 2021). A conceivable explanation for the observed rising level of non-martial fertility is the changing pattern of family formations and the transition that has been observed in recent years, which seems to be having a strain on the inextricable relationship between childbearing and marriage. The recent study on non-marital fertility in Ghana found that non-marital fertility is the most common amongst older unmarried women, women with no education, working class unmarried women, as well as women who made their sexual debut at younger than 20 years of age, and this represents some of the patterns that play out in Nigeria; similar evidence has also been reported in a study that examined non-marital fertility in South Africa, apart from a few differences (Nyarko and Potter 2021). Several explanations can be offered for these patterns, especially for education. Women with little or no education usually have low access to contraceptive services, while, at the same time, women who made their sexual debut at a very young age might have poor information or knowledge of the contraceptive services used to avoid unwanted pregnancies. These are established facts in fertility and contraceptive studies, where it is established that education is an important determinant of contraceptive utilization. For the pattern of non-marital fertility, it is noteworthy that non-marital fertility for Catholics and Protestants experienced a great increase between 2013 and 2018. As stated earlier in this study, civilization, emancipation, and desire for individuality has eroded a lot of conventional views about marriage and fertility, which could be the case for Catholic and Protestant woman alike. This same explanation can be offered for the observed surge in the non-marital fertility figure between the three survey periods for Muslims. At the same time, we need to understand that the views of Catholics in Nigeria on contraception is different from that of other denominations and religions, and reproductive health interventions are always wary of this in development of family planning programs.
Furthermore, correlates of non-marital fertility in Nigeria have also been identified from the zero-inflated Poisson regression two-part model (logit and count models) that helps to explore both the presence and number (intensity) of non-martial fertilities, and the result suggests that this analytical technique offers a better insight into non-marital fertility in Nigeria compared to what has been used elsewhere (Chimere-Dan 1997; Maluleke 2017; Nyarko and Potter 2021). It was found that the presence of non-marital fertility in Nigeria has a myriad of correlates sitting in the socioeconomic and demographic spectrum. Age, for one, significantly predicts non-marital fertility, both for the presence and intensity in the population; age is an important correlate that my study identified, which expressly aligns with what scholarly research in other places has found (Palamuleni and Adebowale 2014; Pazvakawambwa et al. 2014; Nyarko and Potter 2021). This present study found an inverse relationship between age and non-marital fertility, which can be explained by the fact that older women might have a better understanding of how to protect against unwanted pregnancies, and they are usually more occupied with economic activities, as explained by the increasing emancipation of women. One of the important correlates that has been identified is education, both for the presence and intensity of non-marital fertility; highly educated women are more likely to have non-marital fertility, but the number of out-of-wedlock births reduces with how highly educated a woman is. This finding does not agree with what has been found in other studies of non-marital fertility across sub-Saharan Africa, where they have reported that a higher level of education means a lower likelihood of having non-marital fertility (Perelli-Harris and Gerber 2011; Maluleke 2017), but my findings on the role of education on non-marital fertility find support in other studies, where it has been reported that the risk of non-marital fertility increases after leaving school (Upchurch et al. 2002). One plausible explanation could be that highly educated women might have the desire to have a child out of wedlock but are not willing to have more children out of wedlock compared to less-educated women, who might not have the information and resources required to avoid an increasing number of unwanted pregnancies, which leads to more non-marital births.
In this study, religious affiliation has also been found to significantly predict non-marital fertility and the number of non-marital fertility. Surprisingly, Muslims have been found to be at a higher risk of non-marital fertility compared to other religious groups. This is surprising because Muslims, who dominate the northern region of the country, experience one of the highest rates of child brides, and the religion discourages sex outside of marriage. This might have started waning in our contemporary society of today, but for the intensity of non-martial fertility, adherents of traditional and other religions stand the chance of having a higher number of children out of wedlock. This finding does not find support in the literature, because other studies of non-marital fertility in sub-Saharan Africa have not considered the role of religion in non-marital fertility. For household wealth index, this research found that unmarried women from richer households have the highest risk of non-marital fertility, but a lower number of non-marital births compared to women from the poorer households. This finding does not align with what has been reported in other studies, which found that women from richer households are less likely to have non-marital birth, and a study in Namibia particularly emphasized that richer unmarried women have a fewer number of non-marital births. Similar results appeared for the influence of work status on non-marital fertility; working unmarried women are less likely to have non-martial fertility, but a higher number of non-marital births, and this finds support in other studies, where it has been reported that employed women have a lower risk of having non-marital births compared to unemployed women (Nyarko and Potter 2021). A pivotal study in South Africa, which provides evidence on non-martial fertility in sub-Saharan Africa, found that unemployed and discouraged work seekers have higher odds of having non-martial births compared to women who are actively employed (Maluleke 2017).
7. Conclusions
Non-marital fertility has been identified to come with several consequences for both the mother and the children born out of wedlock, but scant evidence exists on the topic in the context of sub-Saharan Africa, and in the case of Nigeria, no known study can be identified after an extensive literature search. In view of this, this study was designed to analyze the prevalence, pattern, and correlates of non-martial fertility in Nigeria, while aligning this with the limited evidence on the analysis of non-marital fertility around sub-Saharan Africa, and this study found similar findings in Nigeria. One of the key significances of the present study is the fact that it aligned, methodologically, with Pazvakawambwa et al. (2014), who found that the study of non-marital fertility can be taken beyond just exploring the factors that determine the occurrence of non-marital fertility in a population, using logistic regression by modelling non-martial births as count data, which is a major setback for many other studies of non-marital fertility in this SSA context. Based on the findings from this study, I conclude that non-martial fertility is not high in Nigeria compared to what has been found in other countries in sub-Saharan Africa. The pattern bears resemblance to what has also been found in other sub-Saharan African countries, as younger women, women with at least secondary education, rural dwellers, Protestants, richer and working women all have recorded a higher number of non-martial births in the last decade. In conclusion, the correlates of non-marital fertility (presence and intensity) are the age of the woman, region of residence, highest level of education attained, household wealth index, relationship status, ethnic group, work status, and age at sexual debut, but place of residence is the only characteristic that has not been found to significantly predict non-marital fertility in Nigeria.
8. Implications for Intervention and Future Research
Non-marital fertility has been found to be low in Nigeria compared to other sub-Saharan African countries, but the trend appears to be rising in recent years, and the determinants of non-marital fertility have been found to be situated in the socioeconomic and demographic spectrum. These findings have provided evidence that is important to develop social and health programs that can help mitigate the rising trend of non-martial fertility in Nigeria, as well as reduce the effects that it could have on the lives and wellbeing of the mothers and children born outside of marriages; this is from a backdrop of the fact that non-martial births come with great disadvantage for both the mother and the children born out of wedlock. In this study, age has been identified as one of the key correlates of non-martial fertility, and younger women, especially teenagers, have a higher likelihood of giving birth outside of wedlock. In fact, the pattern revealed that nearly 24% of the non-martial births between 2008 and 2018 occurred among women between the ages of 15 and 19; this pattern is said to start in the teenage years and once these teenagers have had their first child outside of marriage, in many cases they fall into cohabitation, and many go on to have additional children out of wedlock at older ages. This particularly offers the sexual and reproductive health programs the chance to intensify the efforts to meet the sexual health and contraceptive needs of young unmarried women, especially teenagers, to avoid unintended pregnancies, thereby childbearing at early ages when these teenagers are emotionally and financially incapable to mother a child.
It is important for program managers to focus their attention on these young women, because teenage childbearing can be very costly, costing the government a lot of money to provide child health services for the children of these women, who are in many cases unable to fully provide for their children; this is because research has found that children of teen mothers face far greater disadvantages and challenges compared to those born to older mothers (Clark and Hamplová 2013; Kim et al. 2017). Some of the disadvantages include low birth weight, infant morbidity, amidst several health problems. In the long run, these children are also more likely to perform poorly in schools, suffer abuse and neglect, and end up in foster care. All these factors have the potential of putting strains on the societal and government resources, whereas effective social and health policies and interventions could help avoid such undesired situations. For the mothers, policies that aim to ensure that they do not get caught up in shotgun marriages that perpetuate and foster gender inequalities in the society would be perfect. This is because such occurrences to teenage women jeopardize their education, as they miss school due to pregnancy and childbirth, are unable to complete empowerment skills acquisition programs, and this ultimately impact their life chances, rendering them unable to have the economic resources to be empowered to make important life decisions when they eventually have more children or get married.
Another important finding from the current study, which has great implications for social policy and intervention, is the fact that non-marital fertility is higher in rural areas. Numerous evidence exists on the rural–urban inequalities in sexual and reproductive health services in many low- and middle-income countries (Agha and Do 2009; Chakraborty and Sprockett 2018). This could explain the reason for the higher rate of out-of-wedlock births among women in rural areas. There have been years of intervention efforts to address this, but it appears that these efforts have not really achieved the desired goals, and such programs would need to be more innovative in their approach to addressing teenage unintended pregnancies via innovative adolescent and youth sexual and reproductive intervention programs, especially in the rural areas.
One of the key drivers of non-marital fertility and single-parent families is separation or divorces, which has started to be on the increase in Nigeria in recent years (Ntoimo and Akokuwebe 2014), and this could be contributing a great deal to the number of women having children outside of marriage, with partners they are not legally married to. Some important questions to ask include whether women can limit their fertility, especially outside marriages, if they are adequately empowered financially and economically to be able to provide their basic needs and not be dependent on men? If this is possible, then it would be highly appropriate for government and program managers to attempt to develop women empowerment and poverty alleviation programs for the purpose of giving women the decision-making autonomy and power to make fertility decisions on their own, and not having to depend on any man they are not legally married to.
Finally, the analysis of non-marital fertility in the present study has implications for future research into non-marital fertility in Nigeria. Future scholarly endeavors and efforts should be geared towards an in-depth understanding of the decision of older women and richer women to have children outside of marriage, probably using a qualitative research design, which will also help to investigate how the key tenets of the second demographic transition play a role in the rising number of non-martial births in Nigeria. It will also help to deeply understand the attitude towards non-marital fertility amongst older and richer women, given that the research has reported them to have better access to contraception and other sexual and reproductive health services that can help them avoid unintended pregnancies, but the question of why the data shows a higher pattern of such unconventional births among them remains. Lastly, future research can enquire into the fertility trajectory of women after their first non-martial births, i.e., why some women decide to keep having more non-marital births after the first one, to understand their intention and attitude.
Funding
This research received no external funding.
Institutional Review Board Statement
Not Applicable.
Informed Consent Statement
Not Applicable.
Data Availability Statement
The Nigerian demographic and health survey data analyzed in this study is available via DHS Program website at The DHS Program—Data.
Conflicts of Interest
The author declares no conflict of interest.
References
- Agha, Sohail, and Mai Do. 2009. The Quality of Family Planning Services and Client Satisfaction in the Public and Private Sectors in Kenya. International Journal for Quality in Health Care: Journal of the International Society for Quality in Health Care 21: 87–96. [Google Scholar] [CrossRef] [PubMed]
- Akerlof, George, Janet L. Yellen, and Michael Katz. 1996. An Analysis of Out-of-Wedlock Childbearing in the United States. The Quarterly Journal of Economics 111: 277–317. [Google Scholar] [CrossRef] [Green Version]
- Alaba, Oluwayemisi O., Olusanya E. Olubusoye, and Jo Olaomi. 2017. Spatial Patterns and Determinants of Fertility Levels among Women of Childbearing Age in Nigeria. South African Family Practice 59: 143–47. [Google Scholar] [CrossRef] [Green Version]
- Bongaarts, John. 1987. A Framework for Analyzing the Proximate Determinants of Fertility. Population Research and Policy Review 4: 105–32. [Google Scholar] [CrossRef]
- Budlender, Debbie, Ntebaleng Chobokoane, and Sandile Simelane. 2004. Marriage Patterns in South Africa: Methodological and Substantive Issues. Southern African Journal of Demography 9: 1–25. [Google Scholar]
- Chakraborty, Nirali M., and Andrea Sprockett. 2018. Use of Family Planning and Child Health Services in the Private Sector: An Equity Analysis of 12 DHS Surveys. International Journal for Equity in Health 17: 50. [Google Scholar] [CrossRef] [Green Version]
- Cherlin, Andrew J. 1999. Going to Extremes: Family Structure, Children’s Well-Being, and Social Science. Demography 36: 421–28. [Google Scholar] [CrossRef]
- Chimere-Dan, Orieji. 1997. Non-Marital Teenage Childbearing in Southern Africa: The Case of Namibia. African Population Studies 12: 87–95. [Google Scholar]
- Clark, Shelley, Alissa Koski, and Emily Smith-Greenaway. 2017. Recent Trends in Premarital Fertility across Sub-Saharan Africa. Studies in Family Planning 48: 3–22. [Google Scholar] [CrossRef] [PubMed] [Green Version]
- Clark, Shelley, and Dana Hamplová. 2013. Single Motherhood and Child Mortality in Sub-Saharan Africa: A Life Course Perspective. Demography 50: 1521–49. [Google Scholar] [CrossRef] [PubMed]
- Crosnoe, Robert, and Elizabeth Wildsmith. 2011. Nonmarital Fertility, Family Structure, and the Early School Achievement of Young Children from Different Race/Ethnic and Immigration Groups. Applied Developmental Science 15: 156–70. [Google Scholar] [CrossRef] [PubMed]
- Feyisetan, Bamikale, and Akinrinola Bankole. 2000. Fertility Transition in Nigeria: Trends and Prospect. New York: UNDESA, Available online: https://www.un.org/en/development/desa/population/events/pdf/expert/4/bankole.pdf (accessed on 14 March 2021).
- Garenne, Michel, and Julien Zwang. 2006. Premarital Fertility in Namibia: Trends, Facors and Consequences. Journal of Biosocial Science 38: 145–67. [Google Scholar] [CrossRef] [PubMed]
- Guzzo, Karen Benjamin. 2014. New Partners, More Kids: Multiple-Partner Fertility in the United States. The ANNALS of the American Academy of Political and Social Science 654: 66–86. [Google Scholar] [CrossRef] [PubMed]
- Heuveline, Patrick, Jeffrey M. Timberlake, and Frank F. Furstenberg. 2003. Shifting Childrearing to Single Mothers: Results from 17 Western Countries. Population and Development Review 29: 47–71. [Google Scholar] [CrossRef] [PubMed] [Green Version]
- Karazsia, Bryan T., and Manfred H. M. van Dulmen. 2008. Regression Models for Count Data: Illustrations Using Longitudinal Predictors of Childhood Injury. Journal of Pediatric Psychology 33: 1076–84. [Google Scholar] [CrossRef] [Green Version]
- Kim, Yeongmin, Maria Cancian, and Daniel R. Meyer. 2017. Child Support and Subsequent Nonmarital Fertility With a New Partner. Journal of Family Issues 38: 151–76. [Google Scholar] [CrossRef]
- Kirk, Dudley. 1996. Demographic Transition Theory. Population Studies 50: 361–87. [Google Scholar] [CrossRef]
- Klüsener, Sebastian. 2015. Spatial Variation in Non-Marital Fertility across Europe in the Twentieth and Twenty-First Centuries: Recent Trends, Persistence of the Past, and Potential Future Pathways. The History of the Family 20: 593–628. [Google Scholar] [CrossRef]
- Lesthaeghe, Ron J., and Lisa Neidert. 2006. The Second Demographic Transition in the United States: Exception or Textbook Example? Population and Development Review 32: 669–98. [Google Scholar] [CrossRef]
- Lesthaeghe, Ron. 2010. The Unfolding Story of the Second Demographic Transition. Population and Development Review 36: 211–51. [Google Scholar] [CrossRef] [Green Version]
- Lesthaeghe, Ron. 2014. The Second Demographic Transition: A Concise Overview of Its Development. Proceedings of the National Academy of Sciences 111: 18112–15. [Google Scholar] [CrossRef] [Green Version]
- Lesthaeghe, Ron. 2020. The Second Demographic Transition, 1986–2020: Sub-Replacement Fertility and Rising Cohabitation—A Global Update. Genus 76: 10. [Google Scholar] [CrossRef]
- Lesthaeghe, Ron, and Dick van de Kaa. 1986. ‘Twee demografische transities?’. In Bevolking: Groei en Krimp. Edited by R. Lesthaeghe and D. van de Kaa. Deventer: Mens enMaatschappij, pp. 9–24. [Google Scholar]
- Madhavan, Sangeetha, Abigail Harrison, and Christie Sennott. 2013. Management of Non-Marital Fertility in Two South African Communities. Culture, Health & Sexuality 15: 614–28. [Google Scholar] [CrossRef] [Green Version]
- Majumder, Nabanita, and Faujdar Ram. 2015. Explaining the Role of Proximate Determinants on Fertility Decline among Poor and Non-Poor in Asian Countries. PLoS ONE 10: e0115441. [Google Scholar] [CrossRef] [Green Version]
- Maluleke, Nyiko. 2017. Examining Non-Marital Fertility in South Africa Using 1996, 2001 and 2011 Census Data. Cape Town: Statistics South Africa. [Google Scholar]
- Musau, Jackson M., Leonard M. Kisovi, and Warkach K. Tonui. 2012. The Demographic, Socio-Economic and Cultural Factors Inluencing Non-Marital Fertility in Makueni District in Kenya. Journal of Environment 1: 126–35. [Google Scholar]
- Musick, Kelly. 2007. Cohabitation, Nonmarital Childbearing, and the Marriage Process. Demographic Research 16: 249–86. [Google Scholar] [CrossRef]
- National Population Commission—NPC, and ICF. 2019. Nigeria Demographic and Health Survey 2018—Final Report. Abuja: NPC and ICF, Available online: http://dhsprogram.com/pubs/pdf/FR359/FR359.pdf (accessed on 14 March 2021).
- National Population Commission—NPC/Nigeria, and ICF International. 2009. Nigeria Demographic and Health Survey 2008. Abuja: NPC/Nigeria and ICF International, Available online: https://www.dhsprogram.com/pubs/pdf/FR222/FR222.pdf (accessed on 14 March 2021).
- National Population Commission—NPC/Nigeria, and ICF International. 2014. Nigeria Demographic and Health Survey 2013. Abuja: NPC/Nigeria and ICF International, Available online: https://dhsprogram.com/pubs/pdf/FR293/FR293.pdf (accessed on 14 March 2021).
- Ntoimo, Lorretta Favour C., and Monica Ewomazino Akokuwebe. 2014. Prevalence and Patterns of Marital Dissolution in Nigeria. The Nigerian Journal of Sociology and Anthropology 12. Available online: https://www.academia.edu/11422909/Prevalence_and_Patterns_of_Marital_Dissolution_in_Nigeria (accessed on 14 March 2021). [CrossRef]
- Nyarko, Samuel H., and Lloyd Potter. 2021. Levels and Socioeconomic Correlates of Nonmarital Fertility in Ghana. PLoS ONE 16: e0247189. [Google Scholar] [CrossRef]
- O’Malley, A. James., and Neelon H. Benjamin. 2014. Latent Factor and Latent Class Models to Accommodate Heterogeneity, Using Structural Equation. In Encyclopedia of Health Economics. Edited by Anthony J. Culyer. San Diego: Elsevier, pp. 131–40. [Google Scholar] [CrossRef]
- Palamuleni, Martin E., and Adeyemi S. Adebowale. 2014. Patterns of Premarital Childbearing among Unmarried Female Youths in Sub-Saharan Africa: Evidence from Demographic Health Survey. Scientific Research and Essays 9: 421–30. [Google Scholar] [CrossRef] [Green Version]
- Palamuleni, Martin, and Monde Makiwane. 2007. Fertility and Childbearing in South Africa. Available online: https://www.academia.edu/30857111/Fertility_and_childbearing_in_South_Africa (accessed on 14 March 2021).
- Pazvakawambwa, Lillian, Nelago Indongo, and Lawrence N. Kazembe. 2013. Explaining Marital Patterns and Trends in Namibia: A Regression Analysis of 1992, 2000 and 2006 Demographic and Survey Data. PLoS ONE 8: e70394. [Google Scholar] [CrossRef]
- Pazvakawambwa, Lillian, Nelago Indongo, and Lawrence Kazembe. 2014. A Hurdle Negative Binomial Regression Model for Non-Marital Fertility in Namibia. Journal of Mathematics and System Science 4: 498–508. [Google Scholar] [CrossRef]
- Perelli-Harris, Brienna, and Theodore Gerber. 2011. Nonmarital Childbearing in Russia: Second Demographic Transition or Pattern of Disadvantage? Demography 48: 317–42. [Google Scholar] [CrossRef] [PubMed]
- Smith-Greenaway, Emily. 2016. Premarital Childbearing in Sub-Saharan Africa: Can Investing in Women’s Education Offset Disadvantages for Children? SSM—Population Health 2. [Google Scholar] [CrossRef] [Green Version]
- Smith-Greenaway, Emily, and Shelley Clark. 2018. Women’s Marriage Behavior Following a Premarital Birth in Sub-Saharan Africa. Journal of Marriage and Family 80: 256–70. [Google Scholar] [CrossRef]
- Teitelbaum, Michael S. 1975. Relevance of Demographic Transition Theory for Developing Countries. Science 188: 420–25. [Google Scholar] [CrossRef] [PubMed]
- Upchurch, Dawn M., Lee A. Lillard, and Constantijn W. A. Panis. 2002. Nonmarital Childbearing: Influences of Education, Marriage, and Fertility. Demography 39: 311–29. [Google Scholar] [CrossRef]
- Wildsmith, Elizabeth, and R. Kelly Raley. 2006. Race-Ethnic Differences in Nonmarital Fertility: A Focus on Mexican American Women. Journal of Marriage and Family 68: 491–508. [Google Scholar] [CrossRef]
- Winkelmann, Rainer. 2008. Econometric Analysis of Count Data, 5th ed. Berlin and Heidelberg: Springer. [Google Scholar] [CrossRef]
- Zaidi, Batool, and S. Philip Morgan. 2017. The Second Demographic Transition Theory: A Review and Appraisal. Annual Review of Sociology 43: 473–92. [Google Scholar] [CrossRef] [PubMed] [Green Version]
Figure 1.
Level of non-marital fertility.

Figure 2.
Histogram of the total count of children born.


Table 1.
Model comparison based on Akaike’s information and Bayesian information criterion.
| Models. | Null | Model | Df | AIC | BIC |
|---|---|---|---|---|---|
| Poisson Regression | −16,579.52 | −9533.47 | 29 | 19,124.94 | 19,339.46 |
| Negative Binomial Regression | −12,974.59 | −9478.69 | 30 | 19,017.37 | 19,239.29 |
| Zero-Inflated Poisson Regression | −11,349.40 | −9171.45 | 56 | 18,459.02 | 18,888.05 |
| Zero-Inflated Negative Binomial Regression | −10,940.78 | −9171.52 | 58 | 18,459.04 | 18,888.07 |
Table 2.
Distribution of background characteristics of the respondents.
| Respondents Characteristics. | 2008 | 2013 | 2018 | (2008–2018) |
|---|---|---|---|---|
| n = 4147 (%) | n = 4308 (%) | n = 3470 (%) | n = 11,925 (%) | |
| Age group | ||||
| 15–19 | 1129 (27.2) | 1143 (26.5) | 558 (16.1) | 2830 (23.7) |
| 20–24 | 1616 (39.0) | 1524 (35.4) | 1058 (30.5) | 4198 (35.2) |
| 25–29 | 903 (21.8) | 961 (22.3) | 786 (22.6) | 2649 (22.2) |
| 30–34 | 290 (7.0) | 395 (9.2) | 482 (13.9) | 1167 (9.8) |
| 35–39 | 110 (2.6) | 172 (4.0) | 297 (8.6) | 579 (4.9) |
| 40–44 | 61 (1.5) | 78 (1.8) | 169 (4.9) | 308 (2.6) |
| 45–49 | 38 (0.9) | 35 (0.8) | 120 (3.5) | 193 (1.6) |
| Region of Residence | ||||
| North Central | 414 (10.0) | 473 (11.0) | 467 (13.5) | 1355 (11.4) |
| North East | 142 (3.4) | 179 (4.2) | 266 (7.7) | 587 (4.9) |
| North West | 74 (1.8) | 263 (6.1) | 75 (2.2) | 412 (3.5) |
| South East | 755 (18.2) | 927 (21.5) | 589 (17.0) | 2270 (19.0) |
| South South | 1710 (41.2) | 1486 (34.5) | 1000 (28.8) | 4196 (35.2) |
| South West | 1053 (25.4) | 980 (22.8) | 1073 (30.9) | 3106 (26.1) |
| Type of place of residence | ||||
| Urban | 1972 (47.6) | 2521 (58.5) | 1961 (56.5) | 6454 (54.1) |
| Rural | 2175 (52.5) | 1786 (41.5) | 1509 (43.5) | 5470 (45.9) |
| Highest Level of Education | ||||
| No Education | 103 (2.5) | 107 (2.5) | 250 (7.2) | 460 (3.9) |
| Primary | 465 (11.2) | 438 (10.2) | 380 (11.0) | 1283 (10.8) |
| Secondary | 2734 (65.9) | 2778 (64.5) | 2176 (62.7) | 7689 (64.5) |
| Higher | 844 (20.4) | 985 (22.9) | 664 (19.1) | 2492 (20.9) |
| Religion | ||||
| Catholic | 708 (17.1) | 845 (19.6) | 523 (15.1) | 2073 (17.4) |
| Protestants | 2972 (71.9) | 2951 (68.5) | 2426 (69.9) | 8347 (70.1) |
| Islam | 428 (10.3) | 471 (10.9) | 501 (14.5) | 1399 (11.7) |
| Traditional/Others | 38 (0.6) | 42 (1.0) | 19 (0.6) | 93 (0.8) |
| Wealth Index | ||||
| poorest | 233 (5.6) | 79 (1.8) | 210 (6.0) | 522 (4.4) |
| poorer | 407 (9.8) | 400 (9.3) | 423 (12.2) | 1230 (10.3) |
| Middle | 790 (19.1) | 878 (20.4) | 690 (19.9) | 2358 (19.8) |
| richer | 1320 (31.8) | 1256 (29.2) | 1053 (30.4) | 3629 (30.4) |
| richest | 1397 (33.7) | 1694 (39.3) | 1095 (31.6) | 4186 (35.1) |
| Current relationship status | ||||
| Never Married | 3686 (88.9) | 3715 (86.2) | 2665 (76.8) | 10,066 (84.4) |
| Living Together | 461 (11.1) | 593 (13.8) | 804 (23.2) | 1858 (15.6) |
| Ethnicity | ||||
| Others | 2168 (52.3) | 2262 (52.5) | 1688 (48.7) | 6118 (51.3) |
| Hausa/Fulani | 30 (0.7) | 50 (1.2) | 53 (1.5) | 134 (1.1) |
| Igbo | 1019 (24.6) | 1168 (27.1) | 855 (24.6) | 3041 (25.5) |
| Yoruba | 930 (22.4) | 828 (19.2) | 874 (25.2) | 2631 (22.1) |
| Occupation | ||||
| Not working | 2053 (49.5) | 1939 (45.0) | 14 (0.4) | 4006 (33.6) |
| Working | 2094 (50.5) | 2369 (55.0) | 3455 (99.6) | 7918 (66.4) |
| Age at sexual debut | ||||
| <20 | 3014 (72.7) | 3061 (71.1) | 2539 (73.2) | 8614 (72.2) |
| 20+ | 1133 (27.3) | 1247 (29.0) | 2539 (26.8) | 3311 (27.8) |
Table 3.
Pattern of non-marital fertility by background characteristics.
| 2008 | 2013 | 2018 | (2008–2018) | |
|---|---|---|---|---|
| Age group | p = 0.000 | p = 0.000 | p = 0.000 | p = 0.000 |
| 15–19 | 158 (14.0) | 168 (14.7) | 79 (14.1) | 406 (14.3) |
| 20–24 | 297 (18.4) | 369 (24.2) | 304 (28.8) | 970 (23.1) |
| 25–29 | 226 (25.0) | 284 (29.5) | 315 (40.1) | 825 (31.1) |
| 30–34 | 116 (40.0) | 145 (36.8) | 260 (53.9) | 521 (44.6) |
| 35–39 | 53 (48.4) | 85 (49.3) | 198 (66.7) | 336 (58.0) |
| 40–44 | 39 (63.3) | 40 (51.4) | 133 (78.5) | 211 (68.7) |
| 45–49 | 25 (66.3) | 23 (65.7) | 100 (83.3) | 148 (76.7) |
| Region of Residence | p = 0.000 | p = 0.000 | p = 0.000 | p = 0.000 |
| North Central | 75 (18.0) | 69 (14.6) | 100 (21.5) | 244 (18.0) |
| North East | 50 (35.5) | 50 (27.8) | 114 (42.6) | 213 (36.4) |
| North West | 13 (18.1) | 45 (17.0) | 21 (28.3) | 79 (19.3) |
| South East | 108 (14.3) | 158 (17.0) | 162 (27.6) | 428 (18.9) |
| South South | 504 (29.5) | 549 (37.0) | 491 (49.1) | 1544 (36.8) |
| South West | 164 (15.6) | 244 (24.9) | 501 (46.7) | 909 (29.3) |
| Type of place of residence | p = 0.000 | p = 0.000 | p = 0.000 | p = 0.000 |
| Urban | 313 (15.9) | 516 (20.5) | 692 (35.3) | 1521 (23.6) |
| Rural | 601 (27.6) | 598 (33.5) | 696 (46.2) | 1896 (34.7) |
| Highest Level of Education | p = 0.000 | p = 0.000 | p = 0.000 | p = 0.000 |
| No Education | 58 (56.2) | 53 (49.5) | 179 (71.3) | 289 (62.9) |
| Primary | 232 (49.9) | 218 (49.7) | 252 (66.3) | 702 (54.7) |
| Secondary | 554 (20.3) | 754 (27.1) | 851 (39.1) | 2160 (28.1) |
| Higher | 70 (8.3) | 90 (9.1)) | 107 (16.1) | 266 (10.7) |
| Religion | p = 0.000 | p = 0.000 | p = 0.000 | p = 0.000 |
| Catholic | 119 (16.9) | 130 (15.3) | 147 (28.1) | 396 (19.1) |
| Protestants | 728 (24.5) | 867 (29.4) | 1033 (42.6) | 2629 (31.5) |
| Islam | 48 (11.4) | 107 (22.8) | 197 (39.1) | 353 (25.2) |
| Traditional/Others | 18.7 (44.9) | 10 (24.4 | 11 (1.0) | 40 (43.0) |
| Wealth Index | p = 0.000 | p = 0.000 | p = 0.000 | p = 0.000 |
| Poorest | 102 (43.7) | 37 (46.4) | 115 (54.8) | 254 (48.6) |
| Poorer | 152 (37.3) | 141 (35.3) | 212 (50.2) | 505 (41.0) |
| Middle | 217 (27.5) | 294 (33.5) | 346 (50.2) | 857 (36.4) |
| Richer | 252 (19.1) | 338 (26.9) | 435 (41.3) | 1025 (28.2) |
| Richest | 191 (13.7) | 305 (18.0) | 281 (25.6) | 777 (18.6) |
| Relationship Status | p = 0.000 | p = 0.000 | p = 0.000 | p = 0.000 |
| Never Married | 566 (15.4) | 616 (16.6) | 660 (24.8) | 1842 (18.3) |
| Living Together | 349 (75.7) | 498 (84.0) | 728 (90.6) | 1575 (84.8) |
| Ethnicity | p = 0.000 | p = 0.000 | p = 0.000 | p = 0.000 |
| Others | 624 (28.8) | 711 (31.4) | 699 (41.4) | 2035 (33.3) |
| Hausa/Fulani | 5 (18.2) | 8 (15.6) | 25 (46.8) | 38 (28.7) |
| Igbo | 141 (13.8) | 201 (17.2) | 266 (31.1) | 607 (20.0) |
| Yoruba | 143 (15.4) | 195 (23.6) | 399 (45.6) | 736 (29.0) |
| Work Status | p = 0.000 | p = 0.000 | p = 0.000 | p = 0.000 |
| Not Working | 338 (16.5) | 351 (18.1) | 1 (27.2) | 689 (17.2) |
| Working | 571 (27.4) | 763 (32.2) | 1388 (40.2) | 2722 (34.4) |
| Age at Sexual Debut | p = 0.000 | p = 0.000 | p = 0.000 | p = 0.000 |
| <20 | 759 (25.2) | 904 (29.5) | 1160 (45.7) | 2823 (32.8) |
| 20+ | 156 (13.7%) | 210 (16.9) | 228 (24.5) | 594 (17.9) |
Table 4.
Regression estimates from the zero-inflated Poisson regression model.
| Independent Variables. | ZeroInflated Poisson Regression Models | |||
|---|---|---|---|---|
| Non-Marital Fertility Probability (Prescence of Children) | Non-Marital Fertility Intensity (Number of Children) | |||
| OR | [95% CI] | IRR | [95% CI] | |
| Constant | 0.08 ** | 0.02–0.35 | 0.25 ** | 0.20–0.31 |
| Age group | ||||
| 15–19 (RC) | 1 | 1 | ||
| 20–24 | 0.84 | 0.54–1.31 | 2.05 ** | 1.76–2.40 |
| 25–29 | 0.80 | 0.51–1.26 | 3.66 ** | 3.14–4.27 |
| 30–34 | 0.79 | 0.48–1.28 | 5.62 ** | 4.80–6.58 |
| 35–39 | 0.66 | 0.38–1.15 | 7.31 ** | 6.24–8.58 |
| 40–44 | 0.48 ** | 0.26–0.89 | 8.08 ** | 6.86–9.50 |
| 45–49 | 0.62 | 0.32–1.22 | 9.80 ** | 8.32–11.56 |
| Region of Residence | ||||
| North Central (RC) | 1 | 1 | ||
| North East | 0.77 | 0.42–1.41 | 1.15 | 1.00–1.33 |
| North West | 1.46 | 0.73–2.93 | 1.56 ** | 1.20–2.02 |
| South East | 0.88 | 0.52–1.51 | 1.30 ** | 1.09–1.56 |
| South-South | 0.62 ** | 0.43–0.91 | 1.19 ** | 1.07–1.33 |
| South West | 0.80 | 0.51–1.26 | 1.15 ** | 1.01–1.32 |
| Type of place of residence | ||||
| Urban (RC) | 1 | 1 | ||
| Rural | 1.14 | 0.91–1.43 | 1.05 | 0.99–1.12 |
| Highest Level of Education | ||||
| No Education (RC) | 1 | 1 | ||
| Primary | 1.11 | 0.56–2.20 | 1.06 | 0.98–1.15 |
| Secondary | 2.27 ** | 1.19–4.30 | 0.85 ** | 0.78–0.92 |
| Higher | 5.00 ** | 2.51–9.98 | 0.53 ** | 0.46–0.63 |
| Religion | ||||
| Catholic (RC) | 1 | 1 | ||
| Christian | 0.70 ** | 0.53–0.93 | 1.03 | 0.94–1.13 |
| Islam | 2.18 ** | 1.36–3.50 | 1.07 | 0.94–1.22 |
| Trad/Others | 0.90 | 0.38–2.11 | 1.31 ** | 1.08–1.60 |
| Wealth Index | ||||
| Poorest (RC) | 1 | 1 | ||
| Poorer | 3.15 | 1.01–9.78 | 0.95 | 0.86–1.06 |
| Middle | 4.51 ** | 1.46–13.92 | 0.90 | 0.81–1.00 |
| Richer | 8.67 ** | 2.79–26.94 | 0.86 ** | 0.77–0.97 |
| Richest | 11.21 ** | 3.53–35.58 | 0.69 ** | 0.61–0.79 |
| Relationship Status (RC) | ||||
| Never Married | 1 | 1 | ||
| Living together/Cohabiting | 0.03 ** | 0.02–0.06 | 2.34 ** | 2.19–2.50 |
| Ethnicity | ||||
| Others (RC) | 1 | 1 | ||
| Hausa/Fulani | 1.90 | 0.75–4.81 | 1.29 ** | 1.02–1.63 |
| Igbo | 2.04 ** | 1.31–3.18 | 1.01 | 0.88–1.15 |
| Yoruba | 0.84 | 0.53–1.32 | 1.03 | 0.92–1.15 |
| Work Status | ||||
| Not Working (RC) | 1 | 1 | ||
| Working | 0.76 ** | 0.59–0.99 | 1.11 ** | 1.02–1.21 |
| Age at Sexual Debut | ||||
| <20 (RC) | 1 | 1 | ||
| 20+ | 2.70 ** | 2.14–3.40 | 0.74 ** | 0.68–0.79 |
** Significant at 5% level, OR = odds ratio, IRR = incidence risk ratio, RC = reference category.
Publisher’s Note: MDPI stays neutral with regard to jurisdictional claims in published maps and institutional affiliations. |
© 2021 by the author. Licensee MDPI, Basel, Switzerland. This article is an open access article distributed under the terms and conditions of the Creative Commons Attribution (CC BY) license (https://creativecommons.org/licenses/by/4.0/).
Share and Cite
MDPI and ACS Style
Alawode, O.A. Analysis of Non-Marital Fertility in Nigeria and Implications for Intervention and Future Research. Soc. Sci. 2021, 10, 256. https://0-doi-org.brum.beds.ac.uk/10.3390/socsci10070256
AMA Style
Alawode OA. Analysis of Non-Marital Fertility in Nigeria and Implications for Intervention and Future Research. Social Sciences. 2021; 10(7):256. https://0-doi-org.brum.beds.ac.uk/10.3390/socsci10070256
Chicago/Turabian StyleAlawode, Oluwatobi Abel. 2021. "Analysis of Non-Marital Fertility in Nigeria and Implications for Intervention and Future Research" Social Sciences 10, no. 7: 256. https://0-doi-org.brum.beds.ac.uk/10.3390/socsci10070256
Note that from the first issue of 2016, this journal uses article numbers instead of page numbers. See further details here.