
Patterns and Persistence of Educational Mismatch: A Trajectory Approach Using Chilean Panel Data


1
Facultad de Educación, Departamento de Política y Desarrollo Escolar, Universidad Alberto Hurtado, Santiago 6500620, Chile
2
Fundación SUMMA, Pocuro 2058, Providencia, Santiago 8440698, Chile
3
Fundación I-Tek, Santiago 8440698, Chile
4
Warner School of Education, University of Rochester, Rochester, NY 14642, USA
*
Author to whom correspondence should be addressed.
Soc. Sci. 2021, 10(9), 333; https://0-doi-org.brum.beds.ac.uk/10.3390/socsci10090333
Submission received: 30 June 2021
/
Revised: 20 August 2021
/
Accepted: 30 August 2021
/
Published: 7 September 2021
(This article belongs to the Special Issue Social and Economic Implications of Skill and Educational Mismatch)
Abstract
:The misalignment between workers’ educational levels and the educational level typically required for their occupations, namely educational mismatch, has become widespread. However, despite its potential costs, there is little evidence of this situation in developing countries. Using longitudinal and retrospective data of employment histories between 2009 and 2019, this paper conducts sequence analysis to construct a typology of educational mismatch trajectories among Chilean workers. We demonstrate that mismatch is a prevalent and persistent phenomenon. Once people enter the labor market, either as undereducated or overeducated workers, they tend to stay in such positions for extended periods of time. Moreover, we find significant wage penalties for workers in a mismatch situation. Results indicate that females and young, less-educated men are more prone to follow trajectories with longer periods of mismatch or unemployment. New avenues for research and the need for public policies looking at these phenomena are required to avoid people’s dissatisfaction due to a possible false promise that more education can improve their life standards.
1. Introduction
In many countries, the improving learning efforts seem to not coincide with the creation of enough jobs in which people could apply their skill investments (CEDEFOP 2018; Quintini 2018). The consequences of this imbalance can be sufficiently severe so as to increase levels of unemployment and underemployment among educated workers, as well as accelerate the rate of skills obsolesce and hinder signals to the market. Though, for many researchers, rather than an inefficient educational investment in economic terms, overeducation—the position of a worker with higher levels of qualifications than required—is a new stratification mechanism that weakens the employment status of highly educated workers (Capsada-Munsech 2017; Horowitz 2018; Tsai 2010). Similarly, it is argued that undereducation—the position of a worker with lower levels of qualifications than required—while not a disadvantage or social problem for the individual employee, acts as a pathway to the intergenerational reproduction of earnings inequality (Wiedner and Schaeffer 2020).
Concern for educational mismatch is more prominent when it turns out to be a stable or frequently recurring state among particular groups of workers. Recently, Lu and Li (2021) provided important insights into the way in which highly educated minorities and immigrants are disproportionately channeled into mismatched jobs and subsequently consigned to such positions. Additionally, previous studies have demonstrated that entering the labor market as an overqualified worker negatively influences subsequent jobs, becoming a trap rather than a steppingstone to matched employment. (Baert et al. 2013; Dolton and Vignoles 2000; Scherer 2004; Meroni and Vera-Toscano 2017; Verhaest et al. 2015). However, most of this literature that emerges from longitudinal empirical studies refers to developed societies, predominantly European countries and the U.S. Knowledge concerning the extent to which, and for whom, qualifications mismatch is a permanent or recurrent stage, is somewhat limited in developing countries, due to the lack of suitable data and methodological approaches. While these countries face the massification of higher education, they usually also deal with fewer technological or high skill demanding jobs, having more space for mismatch among young workers.
Our research starts to close this knowledge gap by examining patterns and persistence of educational mismatch among Chilean workers. More specifically, drawing on longitudinal data from the Survey of Social Welfare and employing sequence analysis, we capture holistic educational mismatch trajectories between 2009 and 2019, group these trajectories into common patterns, and explore factors explaining why particular individuals enter a particular career path. Then, the relationship between common mismatch trajectories and wages is investigated. In doing so, we not only distinguish between mismatch and adequately matched positions, but integrate joblessness in the analysis, as their incidence and effects on subsequent jobs can be similar to entering the labor market through an underqualified position (Baert et al. 2013; Nunley et al. 2017). Thus, we extend the snapshot view that has dominated the scarce empirical research of mismatching in developing countries (Sevilla and Farías 2020; Castro Ramirez 2019).
Chile is a very interesting case for labour market mismatch research as it has experienced a rapid expansion of higher education in the last two decades (Altbach et al. 2017). In contrast, the demand for high skills in the workforce has been slow to emerge as the country fulfills the profile of developing countries concerning lower rates of investments in research, development, and innovation (UNESCO Institute for Statistics 2021). The high incentives to acquire more education levels and the scarcity of highly skilled jobs have led to a low relationship between those skills acquired in the educational system and those utilized in the labor market. Accordingly, recent evidence in this country shows that overeducation is increasing over time, affecting mainly female, younger, higher educated workers (Sevilla and Farías 2020). This paper starts by presenting the Chilean context in more detail, then provides an overview of educational mismatching theory and evidence. Next, data and methods used in the analysis are laid out, followed by the presentation of the the results of the descriptive and multivariate analyses. Finally, a discussion of the outcomes and broad conclusions are presented.
2. The Chilean Context
During the last three decades, educational indicators have substantially improved in Chile. Between 1990 and 2017, the schooling average of the population above 15 years old increased from 9 to 11.2 years. Additionally, during the same period in the group aged 14 to 17, the net enrolment rate in secondary education increased from 60.0% to 73.4%, while in higher education the increase was from 12.7% to 37.4% in the group aged 18 to 24. Notably, in 2017, at least 63% of the population older than 18 years old finished secondary education, 32% had access to higher education, and about 20% of the total graduated from it (Casen 2017a). As a result of the improvement of these educational indicators, the qualifications of the Chilean working population have significantly risen, mainly among younger workers. Between 1998 and 2015, the share of 25–44-year-old workers who completed at least secondary education level increased from about 65% to more than 80%, while those with higher education qualifications rose from 20% to almost 30% (Sevilla and Farías 2020).
Despite the surge in higher education, career decisions are weak and misinformed. In the Chilean education system, all students follow the same general curriculum up to 16 years old (10th grade), then the curriculum splits into academic and vocational upper secondary education. Conditional on high school completion, students from both tracks can access any type of higher education, unlike other educational systems wherein curriculum tracking limits feasible postsecondary trajectories. At the higher education level, the perception of a highly stratified system, where bachelor degree programs offered by universities have both higher quality and prestige than short-vocational programs, persists. The weak school and higher education counseling systems, the lack of information, and the strong presence of bias limit students´ informed career decisions and lead students to feeble transitions into the next educational level or into their first job (Farías 2013).
Regarding labor market tendencies, data reveals some improvements in terms of participation and employment, in tandem with some demographic changes. Between 1990 and 2017, the participation rate has increased from 52% to 59%, primarily due to an improvement in female participation which rose from 32% to 49%. Additionally, in the same period, the female employment rate increased from 29% to 45%, while for men, this rate slightly decreased from 68% to 66%. Nonetheless, women exhibit a higher unemployment rate than men (9% vs. 7% in 2017) (Casen 2017b). Moreover, there is evidence concerning an increasing trend of unsteady paths for women who combine work, care, and unemployment, mainly during their transition to motherhood (Cabello-Hutt 2020). Beyond sex differences, data also shows that the age in the working population has persistently increased over time. While in 1998, the 45 to 65-year-old age group represented 26% of the working-age population, in 2015, this share was 37% (Sevilla and Farías 2020).
As an emerging economy, Chile exhibits an expansion of its labor force but remains fairly low-tech and has low skill levels (Soto 2020). Large shares of its workers are in low-productivity sectors, staying permanently on the edge of unemployment (Cecchini and Martínez 2012). It is argued that the Chilean production matrix, based mainly on the export of natural resources, with an incipient strengthening of the service sector, limits investment and the adoption of technology that foster demand for high-skilled workers. (Lopez 2020; Ordoñez and Silva 2019). In this scenario, educational mismatch incidence is significant, as previous studies using Survey of Adult Skills (PIAAC) and Survey of Nacional Socioeconomic (CASEN) data have shown. Mainly, overeducation is a widespread phenomenon among younger workers (between 18% and 28%), depending on the method used. Additionally, the share of overeducated younger workers with university diplomas is higher among women than men (48% vs. 37%) (Sevilla and Farías 2020). In addition, there is evidence that, in this country, overqualified workers experience a larger wage penalty than in other OECD countries, earning 18% less than their well-matched peers with similar qualifications (Quintini 2018).
3. Educational Mismatch: Theory and Evidence
Educational mismatch, also referred to as qualification mismatch, arises when an attained education level of a worker is either higher or lower than that required for the job (Green and McIntosh 2007). The causes and effects of this phenomenon are similar to skill mismatch that emerges when workers’ skills are not fully utilized in their job (Mavromaras et al. 2013; Flisi et al. 2017), and have been extensively examined in a range of national contexts and over time (Freeman 1976; Duncan and Hoffman 1981; Oosterbeek 2000; Dolton and Vignoles 2000; Frenette 2004; Capsada-Munsech 2019a). Two labour market theories dominate the discussion of mismatch research. The human capital theory assumes education as an absolute good and productivity-enhancing: each additional year of schooling is an investment in skills that increases individual productivity and wages (Becker 1964). On the other hand, the job competition model (Thurow 1975) understands education as a positional good with relative value on the labor market depending on the distribution of educational attainment among applicants to a given job.
The potential causes of educational mismatch are various. Human capital theories stress those related to labor market imperfections: frictions in access, mobility barriers, and persistent asymmetric information between workers and firms about skill requirements. These reasons are more frequent when mismatch emerges early in the workers’ careers (Bender and Heywood 2011). In this framework, the mismatch can also emerge from structural changes in the economy, such as innovation and technological changes, typically skill-biased, increasing the demand for only a limited range of qualifications. In this instance, individuals lacking these skills tend to be unemployed or accept jobs that do not match their educational endowments (Acemoglu and Autor 2011). Conversely, the massification of higher education that elevates numbers of highly educated professionals can also cause educational mismatch, mainly from the job competition theory point of view. Indeed, in the absence of an increase in highly skilled jobs, individuals with higher levels of education crowd out lower educated workers. In this scenario, employers tend to simply hire workers with better qualifications and the minimum job requirements are inflated, triggering that still more individuals enroll in higher education (Hansson 2007).
Independently of causes, discrepancies between workers’ qualifications and those required in their jobs have numerous implications, including negative consequences for individual workers and the economy. Particularly, overeducation is correlated with wage penalties as workers holding this position regularly earn more than their job colleagues but less than correctly matched workers with similar education (Sattinger and Hartog 2013; Quintini 2011; Sharma and Sharma 2017). In addition, overeducation tends to generate more employee turnover, which can affect firms’ productivity (McGowan and Andrews 2017). In general, better matching between workers’ potential and their jobs is essential to reduce unemployment and to boost nations competitiveness. However, mismatch’s effects on workplaces go beyond the economic dimension, as it has been found that more effective qualification and skills use is linked to greater job satisfaction and employee well-being, with possible spill-over effect into life satisfaction and better health (Green and Zhu 2010; Quintini 2011).
Concerning the nature of mismatch, there is a theoretical debate whether it is a short-term phenomenon or represents a persistent state. For theories related to the human capital framework, such as matching theory (Jovanovic 1979; Pissarides 1994), overeducation is a temporary situation caused by imperfect information in the labor market that disappears with workers’ mobility at the beginning of their careers. Similarly, for career mobility theory (Sicherman and Galor 1990), overeducation is part of an insertion process in the marketplace as a “steppingstone” toward better jobs. Workers accept “under-qualified” jobs as they allow them to receive training and accumulate experience for future upward mobility either inside or outside the firm. Thus, overeducation should decline with age, and wage penalties linked to this condition would be compensated by better promotion prospects. However, in line with signaling theory, similar to the job competition theory in that education performs a mere signaling role (Spence 1973), when workers cannot clearly signal their skills to employers, overeducation becomes a persistent phenomenon. Furthermore, from the point of view of this theory, it is also argued that overeducation is, by itself, a strong signal of lower expected productivity for potential employers, and thereby a persistent state. The signaling effect arises as holding that position means that workers not only accumulate less additional human capital while on the job, but face the deterioration of this capital due to mismatch (Nunley et al. 2017; Pedulla 2018).
Descriptive studies using survey longitudinal data reveal that, overall, mismatch tends to persist over time. In the Flemish context, Verhaest et al. (2015) showed that only 7% of secondary graduates succeeded in entering an adequate position after being overeducated for a relatively long period. In contrast, around 40% remained overeducated for almost the entire seven years after labor market entry, while another 11% combined periods of overeducation with long periods of joblessness. More recently, Lu and Li (2021) noted that, even though a large share (68.5%) of highly educated workers continuously held positions that matched their educational level, only a small proportion of mismatched workers were able to transition out of such positions (2.2% in three years). Additionally, their results suggest that there are noteworthy differences in the incidence of mismatch patterns by race/ethnicity and national origin, as highly educated minorities and immigrants are more likely to persist in overeducated labor positions and face greater wage penalties as a result.
Research has also focused on providing insights into the extent to which overeducation increases the likelihood of staying longer in a similar situation (Baert et al. 2013; Acosta-Ballesteros et al. 2018; Nunley et al. 2017; Kalfa and Piracha 2018). Based on concepts of “simple persistence” as the extent of an individual being over-educated, and “state dependence” as the causal effect of being over-educated in the current period due to being in the same condition in the previous period (Mavromaras and McGuinness 2012), several studies lay out evidence of state dependence, indicating overeducation as a trap for recent graduates. For example, using data from the Spanish Labour Force Survey, Acosta-Ballesteros et al. (2018) found that young workers who were mismatched in their first job are 40.2 percentage points more likely to be overeducated in a later one than those who were not. Similarly, Nunley et al. (2017) found that college graduate applicants who previously accepted a job that did not require a bachelor’s degree were up to 30 percent less likely to have callback than those who were adequately employed. Conversely, they found no statistical evidence linking unemployment spells to employment opportunities. Based on their results, these studies have concluded that employers view overeducation as a strong signal of lower ability or expected productivity, challenging the thesis of career mobility theory.
Undereducation career trajectories have received considerably less attention than overeducation, despite a significant share of employees in developed countries having less formal training than is required by their job. However, in a recent study using panel data from the United Kingdom and Germany, Wiedner and Schaeffer (2020) found that, for people with a history of employment, the probabilities of advancing into undereducation are less than 4% in both countries. This finding suggests that most workers that have less formal schooling than is required by their job entered the labor market holding this mismatch position. The authors also provide evidence that (non-) cognitive skills that exceed formal education and parental socio-economic status are the most important predictors to enter undereducated employment or be promoted into it throughout the life course (Wiedner and Schaeffer 2020).
In addition, studies show that the occurrence of educational mismatch varies significantly by socio-demographic characteristics such as age, gender, and ethnicity, and some theoretical explanations support these findings. In line with career mobility theory (Sicherman and Galor 1990), youth are more likely to be overqualified, based on their lack of work experience. Indigenous and immigrants also tend to be in this position due to discrimination in the labor market, lack of language skills, and limited transferability of qualifications between countries, among other aspects (Quintini 2011). Concerning gender, it is observed that the share of overeducated workers among women is higher than among men. However, at the same time, studies reveal that the effect of gender on overeducation risk is insignificant in a multivariate setup (Boll et al. 2016).
To sum up, mismatch in the labor force is a concerning phenomenon that can be a symptom of more complex problems of individuals or the economy. While evidence in developed countries is outstanding, insight into mismatch is scarce in developing countries. In this paper, we contribute to the empirical literature by examining patterns and persistence of educational mismatch among Chilean workers in the last decade. For this, we selected age, gender, and educational level as the main independent variables in our analyses, given that previous empirical evidence in this country shows that overeducation is more widespread among young, female, high educated workers (Sevilla and Farías 2020).
4. Methods
4.1. Data and Sample
To examin patterns and persistence of educational mismatch, we use data from the Survey of Social Welfare—Encuesta de Protección Social—conducted by the Chilean Ministry of Social Development. The survey is the largest long-term panel study in Chile, and its results have been mainly utilized to inform for the design and reform processes of key public policies. The survey includes modules focused on educational background and retrospective work histories, requesting self-reported labor-force participation information, including periods of employment, unemployment, and inactivity. The data has been collected in seven waves, from 2002 to 2019. Samples from 2004 and onward are nationally representative of the adult population (ages 18 and above).
In this study, we take advantage of the two most recent waves of the Social Welfare Survey (2015 and 2019) to reconstruct the monthly work history of individuals from 2009 to 2019. The analytical sample included all individuals present in both waves who were active in the labor market for at least one month between this period (N = 4115). We dropped cases with missing data in the occupation variable for a period of 12 months or longer. For shorter gaps, the occupation of the formerly available month was imputed. In addition, we dropped cases with no schooling information1. About 47% of the sample (individuals 18 years and above) are female, 8% indigenous, while immigrants make up less than 1%. The portion of individuals with secondary education was 59% at the beginning of the examined period, followed by those with higher education qualifications, 22%, and those with only primary level or less, corresponding to 19%. One decade later, in 2019, individuals with higher education studies grew to 41%. In contrast, those holding only a high school or primary diploma fell to 42% and 16%, respectively. Lastly, between 2009 and 2019, unemployment decreased from 40% to 10%. The increase in the rates of higher education, in tandem with the decrease in unemployment rates suggests that a fraction of the individuals in the sample were studying at the beginning of the analyzed period. We describe the sample characteristics in more detail in Table A2 in the Appendix A.
4.2. Educational Mismatch Measures
As a first step, we obtained a monthly measure of the educational mismatch for each individual in our sample, using the Realized Match method (RM). This method was first proposed by Clogg and Shockey (1984), developed by Verdugo and Verdugo (1989), and later used by other scholars (Verhaest and Omey 2006; Flisi et al. 2017). This statistical approach provides objective indicators of the discrepancy between the attained education level of workers and those required for their job.
The RM relies on the distribution of workers’ years of education by occupation type defined according to the International Standard Classification of Occupations (ISCO). Specifically, following this approach, we compared the years of education of each individual with the average years of education of all the workers belonging to the same ISCO 2-digit occupation. Individuals were then classified as being under, well, or over educated according to this comparison. Workers were classified as undereducated/overeducated in a determined month if their years of education in said month were one standard deviation below/above the mean years of education of all workers in the same occupation. Similarly, workers were classified as a good match in a determined month if their years of education in this month were within one standard deviation from the mean years of education of all workers in the same occupation as the individual. Lastly, workers were classified as unemployed if, in a certain month, they declared not having a job. Thus, four possible states for an individual in a specific month were defined: Unemployment, Undereducation, Well matched, and Overeducation. To sum up, using this monthly measure, we captured the holistic mismatch trajectories for each individual for the entire examined period (2009–2019).
The central assumption of the RM method is that in each occupation type there is a core of matched workers, and undereducated/overeducated workers are considered concerning this benchmark. We used the RM method with fixed parameters in April 2009. This means that the benchmark—the average years of education of all workers by occupation—against which we compare the years of education of the individual, does not vary with time. It is fixed at the beginning of the analyzed period. This allowed us to capture the trends of younger cohorts entering the job market with higher qualifications than those who were already part of the workforce. One limitation of the RM method is that it assumes that all jobs with the same occupational code require the same level of qualification. Moreover, the calculation of the benchmark can be heavily affected by credential inflation if employers increase qualification requirements but not job tasks. Despite this limitation, the RM method has two major advantages. First, it easily adapts to skills upgrading due to technological change or new formal qualification requirements. This might ease comparisons across cohorts and time points. Second, it can be calculated using standard indicators of education and occupation that are readily available in most job market surveys. Accordingly, it is argued that RM is likely to provide more in-depth and detailed measurements in single-country studies, while worker’s self-reported indicators cope better with comparative studies (Capsada-Munsech 2019b).
4.3. Sequence and Cluster Analysis
After having a trajectory of the monthly educational mismatch for each individual, we applied Optimal Matching Sequence Analysis (OMA) (Abbott and Hrycak 1990) to generate an empirical typology of the mismatch trajectories present in the job market (Halpin and Chan 1998). OMA identifies how similar each pair of trajectories in the data are, taking into account the state in each time period, as well as the duration and order of the state in the trajectories. To compare trajectories, OMA calculates a dissimilarity measure between each pair of trajectories present in the data and generates a distance matrix that summarizes these trajectories’ differences. This method has been largely used in career trajectory studies across different populations, namely secondary education graduates (Verhaest et al. 2015), college graduates (Lu and Li 2021), and women during young adulthood (Madero-Cabib et al. 2019), and the transition to motherhood (Cabello-Hutt 2020).
The logic of OMA is to assess how different two sequences are, based on the number of operations—namely, substitution, insertion and/or deletion—required to transform one sequence into another. The distance between any pair of sequences is the sum of the costs associated with each operation performed to manage to transform one sequence into the other one (Abbott and Hrycak 1990). In OMA, the costs of substitution and insertion-deletion (“indel”) need to be predetermined. Previous studies commonly set substitution costs equal to 2 while indel costs equal 1 (half of the substitution cost). Other studies calculate transition rates between two states to implicitly calculate substitution costs as an implied formula from within the data (see Aisenbrey and Fasang 2017; Gabadinho et al. 2009; Macindoe and Abbott 2004). As in previous studies (see Aisenbrey and Fasang 2017; Cabello-Hutt 2020), in this paper we use OMA with optimal distances computed with a substitution cost of 2 and an indel cost of 1.
In the third step, we reduced the large number of sequences into a finite number of substantively distinct clusters, using the dissimilarity matrix obtained in the OMA. We conducted a hierarchical cluster analysis, with Ward’s linkage. This allowed us to generate an empirical typology of the mismatch trajectories present in the Chilean labor market during the 2009–2019 period. Based on empirical criteria (good fit with the data), such as examining the dendrogram of the cluster analysis performed and the total dissimilarity measure for cutoffs points between 2 and 10 clusters, we determined an optimal solution between 5 and 10 clusters. Then, we inspected the characteristics of the different cluster results concluding that the 8-cluster solution produced good, theoretically fit data, as well as an informative classification of the different trajectories. The sequence analysis and clustering was conducted in Stata using the SQ-Ados, a bundle of Stata programs implementing OMA (Brzinsky-Fay et al. 2006).
4.4. Multivariate Analysis
For the last step, we conducted two multivariate analyses. The first, to predict the membership in the educational mismatch trajectories, and the second, to examine the existence of wage rewards or penalties associated with specific mismatch trajectories. In both analyses, we controlled by individual-level characteristics, namely, age and age squared, gender, indigenous origin, immigrant status, level of education, and field of occupation. Age is measured in years, and we constructed a dummy variable for female, indigenous origin, and immigrant status. Level of education was grouped into three categories, specifically, primary education, secondary education, and higher education. The field of occupation was grouped into six categories, namely, manufacture, agriculture, or machinery; operator or elementary occupations; services; technical professionals or clerical support; managerial or professional; and not occupied. These variables are commonly used as controls in relation to outcomes in the labor market in Chile (see, for instance, Contreras and Plaza 2010; Cabello-Hutt 2020).
More specifically, we conducted a multinomial logistic regression model to examine predictors of the mismatch trajectories using the following specification:
where is the likelihood of an individual of following a specific mismatch trajectory cluster, using “good match career” as base category; and is a vector of individual-level characteristics previously detailed. Age, level of education, and field of occupation correspond to the data observed for the individual in 2009, i.e., at the beginning of the analyzed period.
To assess wage rewards or penalties associated with specific mismatch trajectories, we conducted a linear regression analysis using the following specifications:
where represents the monthly salary received by individual in their last observed job; is the same vector as in (2a); are dummy variables that indicate the year of the individual’s last observed job; and the key predictor, is a set of dummy variables, indicating the educational mismatch trajectory followed by individual (i.e., the trajectories found by the 8-cluster solution). In addition, using the specification in (2b), we tested differentiated effects of these educational mismatch trajectories by age, gender, and educational level, by adding interaction terms to the model (. We selected these three individual characteristics for interaction examination, given their demonstrated importance in the occurrence of educational mismatch in the Chilean context (Sevilla and Farías 2020).
5. Results
5.1. Patterns of Educational Mismatch Trajectories
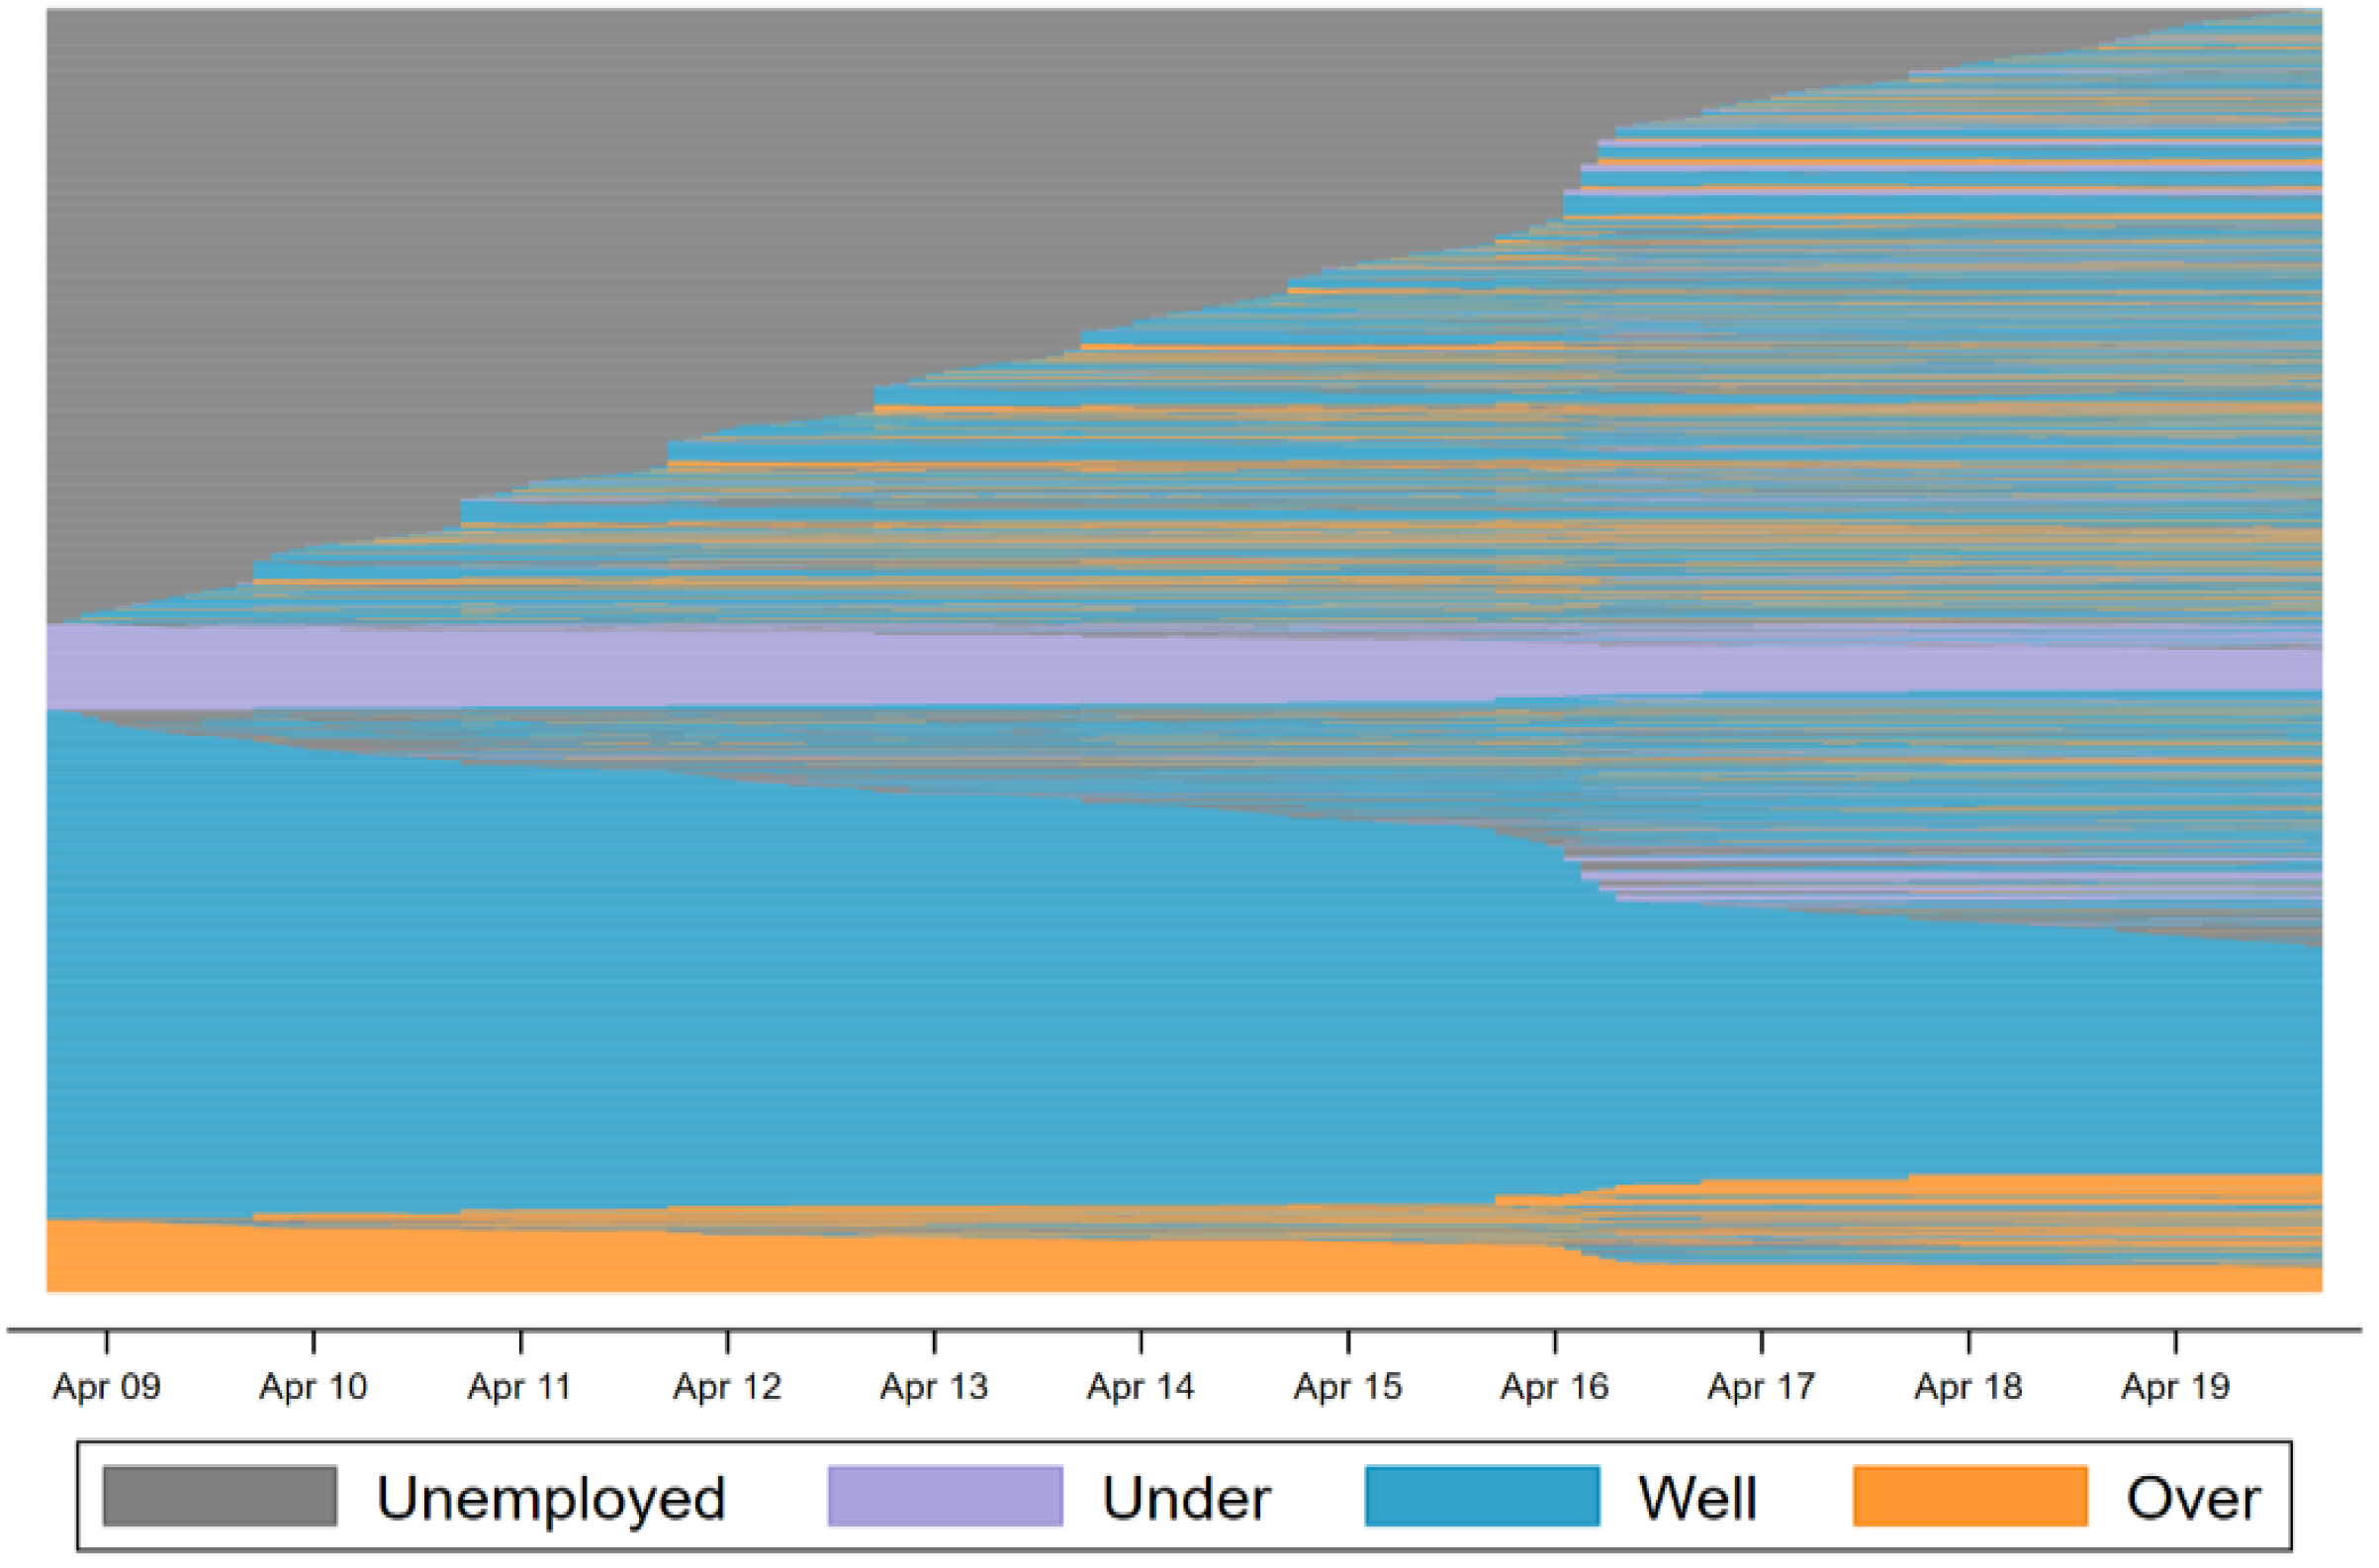
Figure 1 illustrates the monthly educational mismatch trajectory of individuals over the 2009–2019 period. Each horizontal line represents the educational mismatch trajectory of one individual. We observe several features. First, the incidence of joblessness decreased over time, following the sample inclusion criteria (individuals employed at least one month of the period examined). Second, once in a position, the individuals tend to remain in such positions over time (19% stays persistently as a good match, 3% as undereducated, and 2% as overeducated). Third, only a marginal proportion of mismatched workers (mainly overeducated) were able to transit out of such positions during the 11 years under study. Table A1 in the Appendix A sums up these trajectories in the 15 most frequent patterns. The four most frequently observed patterns (comprised around 45% of the sample) consist of one period of good match or a combination of good match and joblessness periods, either at the beginning or in the middle of the sequence.
The sequence analysis (OMA) considers not only the mismatch state in each period but also its length. Table A2 in the Appendix A details different cluster solutions based on OMA, including the optimal solution of 8 clusters. The 2-cluster solution groups individuals in two categories of similar sizes: well matched (49.6%), and inadequately matched career (50.4%). Further decomposition results in 4 clusters, braking down the inadequate matched career cluster into 3 subgroups (unemployment, overeducation, and/or undereducation). The 6-cluster solution advances in refining the unemployment career, splitting this group into 2 subgroups: the first dominated by periods of unemployment, and the second is characterized by several periods of unemployment at the beginning, followed by a few periods of good match. We label this subgroup as “slow transition to good match”. Additionally, the 6-cluster solution refines the “good match career” group, identifying 2 subgroups: the first comprises individuals with a trajectory of good match but with periods of mismatch, while the second involves individuals with a good match trajectory without many periods of mismatch.
Lastly, the optimal 8-cluster solution decomposes two groups of the 6-cluster solution. The first is the “joblessness” group splitting into 2 subgroups: those whose trajectory is mostly joblessness and those whose trajectories are dominated by a long period of joblessness initially but then transit to the overeducation state. The second group is the “good match with mismatch periods” splitting into 2 subgroups: one characterized by a good match state initially, followed by joblessness or a mismatch (under or overeducation); the other starts with unemployment for a few months, followed by a good match period until the end. We label this last subgroup as “fast transition to good match.” To strengthen the understanding of this optimal solution, Figure 2 provides a graphical representation of each cluster’s monthly educational mismatch trajectories in terms of index and distribution. In addition, Table 1 fully describes these 8 clusters by their trajectory and demographic features, job market indicators, and the average entropy2.
5.2. Predictors of the Educational Mismatch Trajectories
Table A4 in the Appendix A presents the results from the multinomial logistic regression analysis performed for predicting the membership in the educational mismatch trajectories. As the coefficients of this model are not directly interpretable, we plot the average marginal effects of selected independent variable in the probability of being in a specific mismatch trajectory cluster. These variables are gender, educational level, and age.
Gender plays an important role in determining membership to different educational mismatch trajectories. Figure 3 shows the predicted probabilities of following each trajectory by sex. According to this, women are significantly more likely than men to follow a trajectory that has long periods of unemployment, such as the joblessness career and the slow transition to good match career. These are also the most precarious trajectories. Men, on the other hand, are significantly more likely than women to follow more steady trajectories, such as the overeducation, undereducation, and good match career.
The predicted probabilities of following each trajectory by educational level are presented in Figure 4. As may be expected, having only primary education significantly increases the likelihood of following the joblessness trajectory. This result aligns with the human capital theory which asserts that education provides skills that are valued in the job market. Consequently, individuals with lower levels of education tend to face higher rates of unemployment. In the same vein, individuals with only primary education are more likely to follow the undereducation trajectory than more educated individuals. Having secondary education significantly increases the likelihood of following a trajectory involving several periods of good match, namely, the slow transition to good match, fast transition to good match, good match to joblessness/mismatch, and good match trajectory. Lastly, individuals with higher education are more likely to follow trajectories involving several periods of overeducation, that is, the slow transition to overeducation and the overeducation trajectory. Overall, these results, together with the persistence of the undereducation and overeducation states (see Figure 3), suggest that the labor market is not responding as fast as the economic theory may have predicted to accommodate workers with lower or higher levels of education.
Figure 5 illustrates the predicted probabilities of following each trajectory by age. The left panel shows that the likelihood of following the slow transition to a good match and the good match trajectory significantly increases with age. This result suggests that, independent of educational level, older individuals are more likely to be part of these two groups than younger individuals, and therefore, to achieve a state of a good match. The left panel also shows that the likelihood of following the undereducation trajectory positively correlates with age (although in a lower magnitude). This means that each year of age progressively increases the likelihood of having an undereducation trajectory. Additionally, it can be observed that age does not significantly predict overeducation trajectory after controlling for sex, education, and occupation. This result could be providing us clues about the persistence of the overeducation phenomenon: it does not seem to be exclusively related to younger people in the labor market. In other words, people who enter the labor market as overeducated tend to stay in that state for long periods of time. The right panel shows that the likelihood of following the joblessness, the good match to joblessness, and the slow transition to overeducation trajectory significantly decrease with age. In other words, the probability of following trajectories that involve many periods of unemployment tends to decrease with age. On the other hand, age is not a significant predictor of the fast transition to a good match trajectory, suggesting that a rapid adaptation to the labor market has more to do with other factors aside from age, such as education level and occupation type.
5.3. Wage Penalty in the Educational Mismatch Trajectories
Lastly, we examine the effects of the different educational mismatch trajectories on monthly salaries and test whether these effects vary by gender, educational level, or age. First, we describe the results in Table 2, without interaction effects in model 1, then we add the interaction effects in model 2. For brevity, we will only display results for gender as they were the only significant ones.
Model 1 shows that, even after controlling for individual-level characteristics, there is still a wage penalty associated with following a trajectory different than the good match career. This penalty is statistically significant for all the trajectories except for the fast transition to good match and the undereducation trajectory (reference category is “good match”). Model 2 shows similar results, but the cluster good match to joblessness/mismatch turned not significant when predicting monthly salaries. In addition, the model suggests that the wage penalty of following the undereducation career or the good match to joblessness/mismatch career (compared to a good match career) is significantly higher for females compared to males. The rest of the trajectories do not show wage penalties differentiated by gender.
6. Discussion and Conclusions
This article, using the case of Chile, provides one of the first systematic studies of the patterns and persistence of educational mismatch in the workforce in developing countries. It extends previous research in this country by capturing holistic educational mismatch trajectories over a period of more than ten years (2009–2019) and exploring common mismatch trajectory determinants and wage penalties. Mainly, we offer evidence that mismatch is a prevalent and persistent phenomenon. Once people enter the labor market either as undereducated or overeducated workers, they tend to stay in such positions for extended periods of time. Additionally, we confirm that there are noteworthy differences by sex, age, and education level in the incidence of mismatch patterns and a wage penalty associated with following a trajectory different from the good match career.
By demonstrating the stability and persistence of the overeducation and undereducation trajectories for individuals, our study is in line with previous international evidence that challenges human capital postulates and derived frameworks such as matching theory and career mobility thesis (Baert et al. 2013; Acosta-Ballesteros et al. 2018; Nunley et al. 2017; Kalfa and Piracha 2018; Mavromaras and McGuinness 2012). Most of this empirical literature has focused on proving that starting in overeducation is not really a steppingstone but rather a trap, mainly among college graduates. Our study, however, did not test this hypothesis as no causal analysis was conducted. Instead, we provided evidence that one of the common trajectories among higher educated Chilean workers is holding an overeducation position for a prolonged period of time. Additionally, we found that workers following this trajectory are associated with lower wages than those in a well-matched trajectory. As recent evidence in this country suggests that overeducation is increasing over time (Sevilla and Farías 2020), the negative effects of this mismatch highlighted by the literature, such as dissatisfaction (Green and Zhu 2010; Wiedner and Schaeffer 2020), need to be taken into account. This dissatisfaction could be increased due to the massification of higher education and the economy’s slowdown due to the pandemic. This is a complex situation, as education is widely seen as a path to social mobility and may not respond to this expectation.
Another common and worrisome trajectory regarding dissatisfaction and social risk is workers in a jobless career. Mostly, women holding a primary or secondary diploma, young, and indigenous populations present long periods without work or instabilities throughout the period. The majority tend to remain in unstable trajectories or move to an overeducation situation. There is evidence that conversely of overeducation, unemployment does not adversely affect employment prospects (Nunley et al. 2017). However, in our study, due to the precariousness as its greater wage penalties with respect to the well-matched workers suggest, we believe this group is probably the one that requires the most attention from public policies. Here, avenues for more research are open to understanding the barriers they face or the transitions they are making.
Concerning the group of workers following an undereducation career (men, mid-career, mostly only with primary education), the sequence analysis suggests that holding this mismatch position tends to be a stable condition with few transitions to other types of situations. In other words, once workers achieve a better position than the typical for their educational level (usually a low level of education), they tend to hold that position continuously. The low increases in this group’s schooling, which contrast with almost all other groups, suggests that workers are comfortable with this work situation. Previous research suggests that undereducated workers have higher salaries than workers with similar educational level and it is argued that their progression could be based on other skills not captured by the educational level (Wiedner and Schaeffer 2020). However, our wages estimations did not provide evidence in that direction. More research is needed to elucidate the economic effects of this mismatch condition.
Furthermore, our results suggest that women are more disadvantaged than men in their career trajectories as previous studies suggested (Verhaest et al. 2015). They were significantly more likely to follow some of the so-called underemployment trajectories, clearly linked to wages penalties. Thus, it is possible to argue that wage gender gaps largely stem from the fact that women face a higher risk of being channeled into mismatch or unemployment trajectories in the first place. This situation may suggest that women address a more hostile labor market, urging to review the barriers that women are facing. The literature rises some explanations, such as the effects of maternity (Cabello-Hutt 2020) and machismo or conservative values (Contreras and Plaza 2010). These findings highlighted the need for a deeper understanding of the female situation to create strategies that reinforce and promote their inclusion in the labor market.
The characterization of the patterns and incidence of mismatch educational trajectories helps understand and even visualize dynamics in the labor market. The risks associated subgroups mentioned above suggest they require special attention and possible public policies to addresses their status. In this respect, more efforts need to be made to understand workers’ situations and implications better. More research could shed light on why overeducated workers are not moving to good match positions; how to change slow into fast transitions, or whether there are differences among workers holding vocational and university higher education diplomas or graduated from institutions with different quality levels.
The international evidence suggests the importance of first steps in the labor market. Therefore, efforts should be undertaken in order to improve the match during the first steps in the labor market. At educational or training level, policies that improve first career decisions and then labor market decisions, improving awareness of new opportunities, skills for gathering information or career management, can improve first incursions into the labor market, generating long-term improvements (Farías 2013). This kind of strategy could also help reduce the education inflation. At governmental level, policies that improve information about career decisions, the situation in the labor market, jobs required, and policies that ease transitions into the labor market can also help in this direction. Finally, policies that help in monitoring the mismatch situation could peovide awareness of these implications.
Several limitations of this study also warrant discussion. First, estimations may suffer from endogeneity due to omitted variables. Under our methodology, estimated returns to overeducation may be reflecting differences among individuals in terms of unobserved variables, such as ability or self-motivation (Leuven and Oosterbeek 2011). For this reason, our results cannot claim to be causal. Second, the analyses were based on educational mismatch estimations which are highly sensitive to the methodology used (Flisi et al. 2017). Specifically, the RM method leaves out heterogeneity within occupations (Perry et al. 2014). A similar situation occurs with the methodology used to determine the trajectory clusters. In addition, research has raised the need to be careful in interpreting education mismatch results as the labor market could be more sensitive to specific skills not included in formal educational certificates. Moreover, the methodology used to gather the information produced some missing data, which forced us to reduce the sample, raising a note of caution regarding the external validity of our results. Lastly, measurement error could be present due to the fact that the data used is self-reported by the individuals who reconstruct their own educational and working past trajectories. Notwithstanding these limitations, our results underscore the need to incorporate the trajectory approach into studies of educational mismatch and wage penalties linked to different mismatch positions.
Author Contributions
Conceptualization, M.P.S. and M.F.; methodology, D.L.-A.; software, D.L.-A.; validation, M.P.S. and M.F.; formal analysis, D.L.-A.; investigation, M.P.S. and M.F.; writing—original draft preparation, M.P.S., M.F., and D.L.-A.; writing—review and editing, M.P.S. and M.F.; project administration, M.P.S. All authors have read and agreed to the published version of the manuscript.
Funding
This research received no external funding.
Institutional Review Board Statement
Not applicable.
Data Availability Statement
Publicly available datasets were analyzed in this study. This data can be found here: https://www.previsionsocial.gob.cl/sps/biblioteca/encuesta-de-proteccion-social/bases-de-datos-eps/ (accessed on 10 March 2021).
Conflicts of Interest
The authors declare no conflict of interest.
Appendix A

Table A1.
List of the 15 most frequent patterns of educational mismatch trajectories.
| Trajectory Pattern | % | Cummulative % of Sample |
|---|---|---|
| 2 | 18.69 | 18.69 |
| 0 2 | 14.75 | 33.44 |
| 2 0 2 | 5.56 | 39.00 |
| 0 2 0 2 | 5.22 | 44.22 |
| 0 3 | 3.72 | 47.94 |
| 1 | 3.16 | 51.10 |
| 0 1 | 2.94 | 54.05 |
| 2 0 | 2.43 | 56.48 |
| 0 2 0 | 2.28 | 58.76 |
| 2 3 | 2.02 | 60.78 |
| 3 | 1.99 | 62.77 |
| 2 1 | 1.66 | 64.42 |
| 2 0 2 0 2 | 1.36 | 65.78 |
| 0 2 0 2 0 2 | 1.21 | 67.00 |
| 0 3 0 3 | 1.10 | 68.10 |
| Total number of trajectories = 1272 | ||
Note: Possible states: 0 = unemployment, 1 = undereducation, 2 = good-match, and 3 = overeducation. Similar sequences have been grouped together using “same order similarity” criteria, i.e., trajectories where the elements appear in the same order are treated the same. (e.g., The trajectory 0 0 2 0 would be treated identical to 0 2 2 0, as the elements 0 and 2 appear in the same order in both (first 0, then 2, and then 0 again)).
Table A2.
Educational mismatch trajectory clusters. Optimal sequence matching solutions with 2, 4, 6, and 8 clusters.
Table A2.
Educational mismatch trajectory clusters. Optimal sequence matching solutions with 2, 4, 6, and 8 clusters.
| 2 Clusters | 4 Clusters | 6 Clusters | 8 Clusters | Most Frequent Trajectory Patterns | Distribution (%) |
|---|---|---|---|---|---|
| Mismatch career (50.4%) | Joblessness career (36.27%) | Joblessness (23.21%) | Joblessness | 0 1, 0 2, 0 3 | 17.51 |
| Slow transition to overeducation | 0 3 | 5.70 | |||
| Slow transition to good match (13.06%) | Slow transition to good match | 0 2 | 13.06 | ||
| Overeducation career (7.54%) | Overeducation (7.54%) | Overeducation | 3 | 7.54 | |
| Undereducation career (6.59%) | Undereducation (6.59%) | Undereducation | 1 | 6.59 | |
| Good match career (49.6%) | Good match career (49.6%) | Good match with mismatch periods (23.44%) | Good match to joblessness/mismatch | 2 1, 2 3, 2 0 | 14.68 |
| Fast transition to good match | 0 2 | 8.76 | |||
| Good match (26.16%) | Good match | 2 | 26.16 |
Note: Possible states: 0 = unemployment, 1 = undereducation, 2 = good-match, and 3 = overeducation. In the “Most frequent tranjectory patterns” column, similar trajectories were grouped together using “same order similarity” criteria, i.e., trajectories where the elements appear in the same order are treated the same. (e.g., the trajectory 0 0 2 would be treated identical to 0 2 2 in the pattern 0 2, as the elements 0 and 2 appear in the same order in both (first 0, then 2)).
Table A3.
Descriptive statistics of the sample and by educational mismatch trajectory.
| Joblessness Career | Slow Transition to Overeducation | Slow Transition to Good Match | Overeducation Career | Undereducation Career | Good Match to Joblessness/Mismatch | Fast Transition to Good Match | Good Match Career | Total | |
|---|---|---|---|---|---|---|---|---|---|
| Demographics | |||||||||
| Female (%) | 65.97 | 49.03 | 63.1 | 34.63 | 27.93 | 45.61 | 52.52 | 33.19 | 47.02 |
| Age 2009 (years) | 24.27 (11.57) | 22.21 (9.33) | 27.11 (13.11) | 31.31 (12.09) | 46.27 (12.41) | 31.93 (12.73) | 25.14 (10.50) | 39.42 (11.84) | 31.67 (13.88) |
| Indigenous (%) | 10.29 | 9.68 | 7.61 | 8.29 | 8.94 | 9.52 | 9.24 | 6.05 | 8.35 |
| Foreign (%) | 0.42 | 1.29 | 1.13 | 1.95 | 0.00 | 0.75 | 3.36 | 0.00 | 0.85 |
| Education at the begining of period (2009) | |||||||||
| Some Primary (%) | 18.07 | 0.00 | 10.99 | 0.00 | 88.83 | 16.29 | 10.08 | 20.39 | 19.06 |
| Some High School (%) | 65.34 | 53.55 | 71.83 | 17.07 | 10.06 | 62.41 | 71.01 | 67.23 | 58.79 |
| Some Higher Educacion (%) | 16.60 | 46.45 | 17.18 | 82.93 | 1.12 | 21.30 | 18.91 | 12.38 | 22.15 |
| Education at the end of period (2019) | |||||||||
| Some Primary (%) | 15.13 | 0.00 | 9.01 | 0.00 | 80.45 | 14.29 | 7.98 | 17.16 | 16.41 |
| Some High School (%) | 31.93 | 0.00 | 46.48 | 6.83 | 15.64 | 45.11 | 57.56 | 66.39 | 42.24 |
| Some Higher Educacion (%) | 52.94 | 100.00 | 44.51 | 93.17 | 3.91 | 40.60 | 34.45 | 16.46 | 41.35 |
| Occupation at the begining of period (2009) | |||||||||
| No occupation (%) | 82.98 | 74.84 | 72.68 | 21.95 | 5.03 | 20.55 | 69.33 | 1.97 | 39.88 |
| Manuf/agricul/machine op./elementary (%) | 3.57 | 5.81 | 8.17 | 39.51 | 78.77 | 47.62 | 10.92 | 72.57 | 37.12 |
| Services (%) | 12.18 | 11.61 | 14.65 | 1.95 | 2.79 | 2.51 | 11.34 | 0.28 | 6.48 |
| Tech. professionales/Clerical support (%) | 0.84 | 2.58 | 2.54 | 29.76 | 11.17 | 22.81 | 5.88 | 19.69 | 12.62 |
| Managerial/Professional (%) | 0.42 | 5.16 | 1.97 | 6.83 | 2.23 | 6.52 | 2.52 | 5.49 | 3.90 |
| Occupation at the end of period (2019) | |||||||||
| No occupation (%) | 19.12 | 5.16 | 6.48 | 6.34 | 8.38 | 15.54 | 6.30 | 6.05 | 9.93 |
| Manuf/agricul/machine op./elementary (%) | 36.55 | 26.45 | 45.35 | 34.63 | 82.12 | 44.61 | 47.48 | 68.78 | 50.55 |
| Services (%) | 4.41 | 0.00 | 0.00 | 1.95 | 0.00 | 4.51 | 2.52 | 0.70 | 1.99 |
| Tech. professionales/Clerical support (%) | 18.28 | 54.84 | 23.10 | 35.12 | 6.70 | 27.57 | 25.63 | 17.58 | 23.33 |
| Managerial/Professional (%) | 21.64 | 13.55 | 25.07 | 21.95 | 2.79 | 7.77 | 18.07 | 6.89 | 14.20 |
| Monthly salary begining of period (2009) | 244,636 (142,640) | 410,658 (456,429) | 295,952 (164,225) | 509,753 (454,807) | 293,755 (165,930) | 401,844 (584,586) | 316,407 (289,055) | 406,071 (345,280) | 386,004 (395,132) |
| Monthly salary end of period (2019) | 403,142 (308,843) | 566,935 (369,547) | 477,866 (393,482) | 636,562 (509,878) | 370,875 (217,473) | 483,163 (379,973) | 514,123 (481,239) | 479,208 (297,027) | 479,050 (368,491) |
| Number of jobs 2009–2019 | 3.70 (2.61) | 4.28 (3.41) | 3.59 (2.38) | 4.15 (2.64) | 3.76 (3.06) | 4.60 (3.18) | 4.66 (2.67) | 3.35 (2.26) | 3.88 (2.72) |
| Length of time at a job 2009–2019 (years) | 1.34 (1.07) | 2.68 (1.25) | 2.80 (1.22) | 2.47 (1.32) | 2.85 (1.24) | 2.02 (1.28) | 2.86 (1.20) | 3.04 (1.07) | 2.47 (1.33) |
| Average entropy 2009–2019 | 0.54 (0.42) | 0.52 (0.28) | 0.38 (0.26) | 0.70 (0.36) | 0.42 (0.24) | 0.82 (0.39) | 0.52 (0.24) | 0.12 (0.09) | 1.13 (0.04) |
| Number of observations | 476 | 155 | 355 | 205 | 179 | 399 | 238 | 711 | 2718 |
Note: Standard deviation in parentheses for continuous measures. Salary is measured in Chilean pesos of 2019. Entropy is a measure of within group heterogeneity of the states (unemployment, under, good-match, and overeducation) that occurs in each point in time; where a value of 0 means that all sequences within a group are identical.
Table A4.
Multinomial logistic model (marginal effects) of individual characteristics on mismatch career trajectories.
Table A4.
Multinomial logistic model (marginal effects) of individual characteristics on mismatch career trajectories.
| Joblessness Career | Slow Transition to Overeducation | Slow Transition to Good Match | Overeducation Career | Undereducation Career | Good Match to Joblessness/Mismatch | Fast Transition to Good Match | Good Match Career | |
|---|---|---|---|---|---|---|---|---|
| Female | 0.057 *** | −0.016 * | 0.030 ** | −0.031 *** | −0.020 ** | 0.017 | −0.010 | −0.028 * |
| (0.013) | (0.009) | (0.013) | (0.009) | (0.008) | (0.014) | (0.011) | (0.015) | |
| Age | −0.001 ** | −0.002 *** | 0.002*** | 0.000 | 0.001 *** | −0.003 *** | 0.000 | 0.003 *** |
| (0.001) | (0.001) | (0.001) | (0.000) | (0.000) | (0.001) | (0.001) | (0.001) | |
| Indigenous | 0.004 | 0.007 | −0.025 | 0.032 * | −0.005 | 0.031 | 0.003 | −0.046 * |
| (0.022) | (0.016) | (0.020) | (0.019) | (0.013) | (0.026) | (0.019) | (0.025) | |
| Foreign | −0.114 *** | −0.015 | 0.023 | 0.037 | −0.066 *** | 0.184 * | 0.214 ** | −0.262 *** |
| (0.042) | (0.029) | (0.069) | (0.052) | (0.004) | (0.108) | (0.095) | (0.007) | |
| Education (ref = Some primary or less) | ||||||||
| Some high school | −0.100 *** | 0.045 *** | 0.062 *** | 0.022 *** | −0.271 *** | 0.045 ** | 0.029 * | 0.167 *** |
| (0.022) | (0.005) | (0.017) | (0.004) | (0.019) | (0.018) | (0.016) | (0.017) | |
| Some higher education | −0.135 | 0.116 *** | 0.012 | 0.365 *** | −0.286 *** | −0.018 | −0.002 | −0.051 ** |
| (0.024) | (0.013) | (0.019) | (0.022) | (0.019) | (0.020) | (0.017) | (0.020) | |
| Occupation (ref = No occupation) | ||||||||
| Manufacture/agriculture/machine operator/elementary occupations | −0.319 *** | −0.067 *** | −0.232 *** | 0.112 *** | 0.052 *** | 0.150 *** | −0.114 *** | 0.418 *** |
| (0.019) | (0.012) | (0.019) | (0.015) | (0.008) | (0.019) | (0.016) | (0.018) | |
| Services | −0.031 | 0.024 | 0.012 | −0.025 * | 0.030 | −0.014 | 0.010 | −0.006 |
| (0.038) | (0.025) | (0.037) | (0.013) | (0.019) | (0.020) | (0.030) | (0.010) | |
| Technical profesional/Clerical support | −0.330 *** | −0.076 *** | −0.244 *** | 0.042 *** | 0.160 *** | 0.198 *** | −0.106 *** | 0.356 *** |
| (0.019) | (0.011) | (0.019) | (0.013) | (0.020) | (0.027) | (0.018) | (0.027) | |
| Managerial/Professional | −0.327 *** | −0.043 ** | −0.224 *** | −0.011 | 0.233 *** | 0.153 *** | −0.100 *** | 0.318 *** |
| (0.021) | (0.019) | (0.025) | (0.013) | (0.051) | (0.045) | (0.025) | (0.051) |
Note: Model estimated with 2718 individuals. *: p < 0.10. **: p < 0.05. ***: p < 0.01. Standard errors in parentheses.
| 1 | Around one third of the 4115 individuals did not have occupation or education information in the 2019 wave. It is worth mentioning that the fieldwork of the most recent wave of the Social Welfare Survey was planned for the second semester of 2019. However, due to Chile’s protests and social movements, this fieldwork could not be concluded and was postponed for the first semester of 2020. Then, the pandemic forced a large part of this last wave (40%) to be collected by phone. The phone questionnaire was shorter and less specific than the in-person questionnaire. Thus, we concurred in a considerable loss in sample size, especially due to the fact that we could not identify the educational attainment in the 2019 wave for a large part of the individuals surveyed by phone. Despite this cost, we preferred to include the 2019 wave in order to expand the time-horizon of the analysis (including the 2015 to 2019 period) and to take advantage of the most updated data regarding the Chilean job market. |
| 2 | The average entropy is measure by Shannon H index. This entropy measure quantifies the uncertainty (entropy or level of surprise) inherent in randomly selecting an observation and guessing its state. The entropy is, then, a measure of within group heterogeneity of the states (unemployment, under, good, and overeducation) that is calculated in each point in time. A value of 0 represents no uncertainty, meaning that all sequences within a group are identical (Gabadinho et al. 2009). |
References
- Altbach, Philip, Liz Reisberg, and Hans de Wit, eds. 2017. Responding to Massification: Differentiation in Postsecondary Education Worldwide. Rotterdam: Sense Publishers. [Google Scholar]
- Abbott, Andrew, and Alexandra Hrycak. 1990. Measuring Resemblance in Sequence Data: An Optimal Matching Analysis of Musicians’ Careers. American Journal of Sociology 96: 144–85. [Google Scholar] [CrossRef]
- Acemoglu, Daron, and David Autor. 2011. Skills, Tasks and Technologies: Implications for Employment and Earnings. In Handbook of Labor Economics. Amsterdam: Elsevier, vol. 4, pp. 1043–171. [Google Scholar]
- Acosta-Ballesteros, Juan, María del Pilar Osorno-del Rosal, and Olga María Rodríguez-Rodríguez. 2018. Overeducation of Young Workers in Spain: How Much Does the First Job Matter? Social Indicators Research 138: 109–39. [Google Scholar] [CrossRef]
- Aisenbrey, Silke, and Anette Fasang. 2017. The interplay of work and family trajectories over the life course: Germany and the United States in comparison. American Journal of Sociology 122: 1448–84. [Google Scholar] [CrossRef]
- Baert, Stijn, Bart Cockx, and Dieter Verhaest. 2013. Overeducation at the Start of the Career: Stepping Stone or Trap? Labour Economics 25: 123–40. [Google Scholar] [CrossRef] [Green Version]
- Becker, Gary. 1964. Human Capital: A Theoretical and Empirical Analysis, with Special Reference to Education. London: University of Chicago Press. [Google Scholar]
- Bender, Keith A., and John S. Heywood. 2011. Educational Mismatch and the Careers of Scientists. Education Economics 19: 253–74. [Google Scholar] [CrossRef] [Green Version]
- Boll, Christina, Julian Sebastian Leppin, Anja Rossen, and André Wolf. 2016. Overeducation-New Evidence for 25 European Countries (No. 173). HWWI Research Paper. Nuremberg: Institute for Employment Research. [Google Scholar]
- Brzinsky-Fay, Christian, Ulrich Kohler, and Magdalena Luniak. 2006. Sequence analysis with Stata. The Stata Journal 6: 435–60. [Google Scholar] [CrossRef] [Green Version]
- Cabello-Hutt, Tania. 2020. Changes in Work and Care Trajectories during the Transition to Motherhood. Social Science Research 90: 102439. [Google Scholar] [CrossRef]
- Capsada-Munsech, Queralt. 2017. Overeducation: Concept, Theories, and Empirical Evidence. Sociology Compass 11: 1–17. [Google Scholar] [CrossRef]
- Capsada-Munsech, Queralt. 2019a. Measuring Overeducation: Incidence, Correlation and Overlaps Across Indicators and Countries. Social Indicators Research 145: 279–301. [Google Scholar] [CrossRef] [Green Version]
- Capsada-Munsech, Queralt. 2019b. Overeducation, Skills and Social Background: The Influence of Parental Education on Overeducation in Spain. Compare 50: 216–36. [Google Scholar] [CrossRef]
- Casen. 2017a. Resultados Educación Casen 2017. Santiago de Chile: Ministerio de Desarrollo Social y Familia. [Google Scholar]
- Casen. 2017b. Resultados Trabajo Casen 2017. Santiago de Chile: Ministerio de Desarrollo Social y Familia. [Google Scholar]
- Castro Ramirez, Daniel J. 2019. Sobreeducacion En El Mercado Laboral Chileno. Revista de Análisis Económico 34: 51–83. [Google Scholar] [CrossRef] [Green Version]
- Cecchini, Simone, and Rodrigo Martínez. 2012. Inclusive Social Protection in Latin America: A Comprehensive, Rights-Based Approach. SSRN Electronic Journal 111. [Google Scholar] [CrossRef] [Green Version]
- CEDEFOP. 2018. Insights Into Skill Shortages and Skill Mismatch: Learning from Cedefop’s European Skills and Jobs Survey. Luxembourg: Publications Office, vol. 106. [Google Scholar]
- Clogg, Clifford, and James Shockey. 1984. Mismatch between occupation and schooling: A prevalence measure, recent trends and demographic analysis. Demography 21: 235–57. [Google Scholar] [CrossRef] [PubMed]
- Contreras, Dante, and Gonzalo Plaza. 2010. Cultural factors in women’s labor force participation in Chile. Feminist Economics 16: 27–46. [Google Scholar] [CrossRef]
- Dolton, Peter, and Anna Vignoles. 2000. The Incidence and Effects of Overeducation in the U.K. Graduate Labour Market. Economics of Education Review 19: 179–98. [Google Scholar] [CrossRef]
- Duncan, Greg, and Saul. D. Hoffman. 1981. The incidence and wage effects of overeducation. Economics of Education Review 1: 75–86. [Google Scholar] [CrossRef]
- Farías, Mauricio. 2013. Effects of Early Career Decisions on Future Opportunities: The Case of Vocational Education in Chile. Doctoral Dissertation, Stanford University, Stanford, CA, USA, February. [Google Scholar]
- Flisi, Sara, Valentina Goglio, Elena Claudia Meroni, Margarida Rodrigues, and Esperanza Vera-Toscano. 2017. Measuring Occupational Mismatch: Overeducation and Overskill in Europe—Evidence from PIAAC. Social Indicators Research 131: 1211–49. [Google Scholar] [CrossRef] [Green Version]
- Freeman, Richard. 1976. The Overeducated American. New York: Academic Press. [Google Scholar]
- Frenette, Marc. 2004. The Overqualified Canadian Graduate: The Role of the Academic Program in the Incidence, Persistence, and Economic Returns to Overqualification. Economics of Education Review 23: 29–45. [Google Scholar] [CrossRef]
- Gabadinho, Alexis, Gilbert Ritschard, Matthias Studer, and Nicolas S. Müller. 2009. Mining Sequence Data in R with the TraMineR Package: A User’s Guide. Geneva: Department of Econometrics and Laboratory of Demography, University of Geneva. [Google Scholar]
- Green, Francis, and Steven McIntosh. 2007. Is there a genuine under-utilization of skills amongst the over-qualified? Applied Economics 39: 427–39. [Google Scholar] [CrossRef] [Green Version]
- Green, Francis, and Yu Zhu. 2010. Overqualification, job dissatisfaction, and increasing dispersion in the returns to graduate education. Oxford Economic Papers 62: 740–63. [Google Scholar] [CrossRef]
- Halpin, Brendan, and Tak Wing Chan. 1998. Class careers as sequences: An optimal matching analysis of work-life histories. European Sociological Review 14: 111–30. [Google Scholar] [CrossRef]
- Hansson, Bo. 2007. Effects of Tertiary Expansion: Crowding-Out Effects and Labour Market Matches for the Higher Educated. OECD Education Working Papers 10. Paris: OECD Publishing. [Google Scholar]
- Horowitz, Jonathan. 2018. Relative Education and the Advantage of a College Degree. American Sociological Review 83: 771–801. [Google Scholar] [CrossRef] [PubMed]
- Jovanovic, Boyan. 1979. Job matching and the theory of turnover. The Journal of Political Economy 87: 972–90. [Google Scholar] [CrossRef]
- Kalfa, Eleni, and Matloob Piracha. 2018. Social Networks and the Labour Market Mismatch. Journal of Population Economics 31: 877–914. [Google Scholar] [CrossRef] [Green Version]
- Leuven, Edwin, and Hessel Oosterbeek. 2011. Overeducation and mismatch in the labor market. Handbook of the Economics of Education 4: 283–326. [Google Scholar]
- Lopez, Dorotea. 2020. State Neutrality, Business Elite and the Lack of Export Services Development in Chile: An Exploratory Qualitative Analysis. Organizations and Markets in Emerging Economies 11: 152–72. [Google Scholar] [CrossRef]
- Lu, Yao, and Xiaoguang Li. 2021. Vertical Education-Occupation Mismatch and Wage Inequality by Race/Ethnicity and Nativity among Highly Educated US Workers. Social Forces, soaa145. [Google Scholar] [CrossRef]
- Macindoe, Heather, and Andrew Abbott. 2004. Sequence analysis and optimal matching techniques for social science data. In Handbook of Data Analysis. London: SAGE Publications, pp. 386–406. [Google Scholar]
- Madero-Cabib, Ignacio, Rosario Undurraga, and Cristián Valenzuela. 2019. How Have Women’s Employment Patterns during Young Adulthood Changed in Chile? A Cohort Study. Longitudinal and Life Course Studies 10: 375–97. [Google Scholar] [CrossRef]
- Mavromaras, Kostas, and Seamus McGuinness. 2012. Overskilling dynamics and education pathways. Economics of Education Review 31: 619–28. [Google Scholar] [CrossRef] [Green Version]
- Mavromaras, Kostas, Seamus McGuinness, Nigel O’Leary, Peter Sloane, and Zhang Wei. 2013. Job mismatches and labour market outcomes: Panel evidence on university graduates. Economic Record 89: 382–95. [Google Scholar] [CrossRef]
- McGowan, Adalet, and Dan Andrews. 2017. Labor Market Mismatch and Labor Productivity: Evidence from PIAAC Data. Skill Mismatch in Labor Markets. Emerald Publishing Limited 45: 199–241. [Google Scholar]
- Meroni, Elena Claudia, and Esperanza Vera-Toscano. 2017. The persistence of overeducation among recent graduates. Labour Economics 48: 120–43. [Google Scholar] [CrossRef]
- Nunley, John, Adam Pugh, Nicholas Romero, and Alan Seals. 2017. The Effects of Unemployment and Underemployment on Employment Opportunities: Results from a Correspondence Audit of the Labor Market for College Graduates. Industrial and Labor Relations Review 70: 642–69. [Google Scholar] [CrossRef]
- Oosterbeek, Hessel. 2000. Introduction to special issue on overschooling. Economics of Education Review 19: 129–30. [Google Scholar] [CrossRef]
- Ordoñez, Felix, and Ignacio Silva. 2019. Estructura productiva y dificultades para el crecimiento de largo plazo en Chile. Revista Economía y Desafíos del Desarrollo. Available online: http://www.unsam.edu.ar/escuelas/economia/revistaedd/wp-content/uploads/2019/06/2_4.pdf (accessed on 11 March 2021).
- Pedulla, David S. 2018. How Race and Unemployment Shape Labor Market Opportunities: Additive, Amplified, or Muted Effects? Social Forces 96: 1477–506. [Google Scholar] [CrossRef]
- Perry, Anja, Simon Wiederhold, and Daniela Ackermann-Piek. 2014. How can skill mismatch be measured? New approaches with PIAAC. Methods, Data, Analyses: A Journal for Quantitative Methods and Survey Methodology 8: 137–74. [Google Scholar]
- Pissarides, Christhoper. 1994. Search unemployment with on-the-job search. The Review of the Economic Studies 61: 457–75. [Google Scholar] [CrossRef] [Green Version]
- Quintini, Glenda. 2011. Over-Qualified or Under-Skilled: A Review of Existing Literature. OECD Social, Employment, and Migration Working Papers 121. Paris: OECD Publishing. [Google Scholar]
- Quintini, Glenda. 2018. Getting Skills Right: Skills and Labour Market Disadvantage in Chile. Paris: OECD Publishing. [Google Scholar]
- Sattinger, Michael, and Joop Hartog. 2013. Nash Bargaining and the Wage Consequences of Educational Mismatches Labour. Economics 23: 50–56. [Google Scholar]
- Scherer, Stegfani. 2004. Stepping-stones or traps? The consequences of labor market entry positions on future careers in West Germany, Great Britain and Italy. Work, Employment and Society 18: 369–94. [Google Scholar] [CrossRef]
- Sevilla, María-Paola, and Mauricio Farías. 2020. Labour market mismatch in emerging countries: The case of Chile. Compare: A Journal of Comparative and International Education 50: 276–93. [Google Scholar] [CrossRef]
- Sharma, Swati, and Prateek Sharma. 2017. Educational mismatch and its impact on earnings: Evidence from Indian labour market. International Journal of Social Economics 44: 1778–95. [Google Scholar] [CrossRef]
- Sicherman, Nachim, and Oded Galor. 1990. A theory of career mobility. Journal of Political Economy 28: 169–92. [Google Scholar] [CrossRef]
- Spence, Michael. 1973. Job market signaling. Quarterly Journal of Economics 87: 355–74. [Google Scholar] [CrossRef]
- Soto, Daniel. 2020. Technology and the future of work in emerging economies: What is different? OECD Social, Employment and Migration Working Papers No. 236. Paris: Organisation for Economic Co-operation and Development. [Google Scholar]
- Thurow, Lester. 1975. Generating Inequality: Mechanisms of Distribution in the US Economy. New York: Basic Books. [Google Scholar]
- Tsai, Yuping. 2010. Returns to Overeducation: A Longitudinal Analysis of the U.S. Labor Market. Economics of Education Review 29: 606–17. [Google Scholar] [CrossRef]
- UNESCO Institute for Statistics. 2021. How Much Your Country Invest in R&D. Available online: http://uis.unesco.org/apps/visualisations/research-and-development-spending/ (accessed on 17 August 2021).
- Verdugo, Richard, and Naomi Turner Verdugo. 1989. The Impact of Surplus Schooling on Earnings: Some Additional Findings. The Journal of Human Resources 24: 629–43. [Google Scholar] [CrossRef]
- Verhaest, Dieter, and Eddy Omey. 2006. The impact of overeducation and its measurement. Social Indicators Research 77: 419–44. [Google Scholar] [CrossRef]
- Verhaest, Dieter, Tom Schatteman, and Walter Van Trier. 2015. Overeducation in the Early Career of Secondary Education Graduates. Young 23: 336–56. [Google Scholar] [CrossRef] [Green Version]
- Wiedner, Jonas, and Merlin Schaeffer. 2020. Career Trajectories into Undereducation. Which Skills and Resources Substitute Formal Education in the Intergenerational Transmission of Advantage? Research in Social Stratification and Mobility 68: 100526. Available online: https://0-www-sciencedirect-com.brum.beds.ac.uk/science/article/abs/pii/S0276562420300627?via%3Dihub (accessed on 11 March 2021). [CrossRef]
Figure 1.
Educational mismatch trajectories map, 2009–2019.

Figure 2.
Sequence index and distribution plot of educational mismatch trajectory clusters, 2009–2019.
Figure 2.
Sequence index and distribution plot of educational mismatch trajectory clusters, 2009–2019.

Figure 3.
Predicted probabilities by educational mismatch career trajectory and sex. Estimated from multinomial logistic regression model in Table A3 in the Appendix A; 95% confidence intervals are shown.
Figure 3.
Predicted probabilities by educational mismatch career trajectory and sex. Estimated from multinomial logistic regression model in Table A3 in the Appendix A; 95% confidence intervals are shown.

Figure 4.
Predicted probabilities by educational mismatch career trajectory and educational level. Estimated from multinomial logistic regression model in Table A3 in the Appendix A; 95% confidence intervals are shown.
Figure 4.
Predicted probabilities by educational mismatch career trajectory and educational level. Estimated from multinomial logistic regression model in Table A3 in the Appendix A; 95% confidence intervals are shown.

Figure 5.
Predicted probabilities by mismatch career trajectory and age (average marginal effects). Estimated from multinomial logistic regression model in Table A3 in the Appendix A.
Figure 5.
Predicted probabilities by mismatch career trajectory and age (average marginal effects). Estimated from multinomial logistic regression model in Table A3 in the Appendix A.

Table 1.
Description of educational mismatch trajectory patterns, 2009–2019.
| Group Name (Share of Population) | Description of Trajectory | People Characteristics | Job Market Indicators | Entropy |
|---|---|---|---|---|
| 1. Joblessness Career (17.5%) | Characterized by several periods of unemployment, showing the highest rate at the beginning of the period. | Women (66%), young (24 years old in average), and indigenous people (10%) are overrepresented in this group. Most individuals in this group achieved secondary education at the beginning of the period (2009) and higher education at the end (2019), suggesting that some individuals were students. | Presents the smallest indicator of average length of time at a job (1.34 years). | 0.54—The distribution plot suggests the group is relatively homogenous, particularly during the first half of the period. |
| 2. Slow Transition to Overeducation (5.7%) | Characterized by a large period of unemployment at the beginning, followed by overeducation at the end of the analyzed period. | Mostly comprised of young individuals (22 years old on average) that were studying. Consequently, the educational level of most individuals in this group correspond to secondary education at the beginning of the period (2009) and higher education at the end (2019). | It has one of the highest rates of unemployment at the beginning of the period but one of the lowest at the end. | 0.52—The distribution plot suggests a relatively homogenous group, particularly at the beginning and at the end of the period. In the middle, the entropy level is higher due to transitions from states of unemployment to overeducation. |
| 3. Slow transition to Good Match (13%) | Characterized by several years of unemployment at the beginning, followed by a good match at the end of the analyzed period. | Women are largely overrepresented in this group (63% vs. 47% in the sample). On average, individuals in this group are 27 years old, which is younger than the sample average (32 years old). The educational level of most individuals in this group is high school at the beginning and end of the analyzed period. | Unemployment is high at the beginning (72.7%) and low at the end (6.5%). | 0.38—relatively low. The distribution plot suggests a relatively homogenous group, particularly at the beginning and at the end of the period. In the middle, the entropy level is higher due to transitions from unemployment to good match. |
| 4. Overeducation (7.5%) | Dominated by the overeducation state during the entire period. | Women are underrepresented in this group (34.6%). Individuals in this group are, on average, 32 years old, the same as the sample average. The educational level of most individuals is higher education at the beginning and end of the analyzed period. Individuals in this group are overrepresented in both VET/clerical support and managerial/professional positions. | Unemployment moves from 22 to 6.3, one of the lowest rates. | 0.7—It is higher compared to other trajectory groups. This is due to the fact that around 1/3 of the individuals in this group follow a persistent trajectory, namely, they always stay in the overeducation state, whereas the rest have some periods of good match, undereducation, and/or unemployment. |
| 5. Undereducation (6.6%) | Dominated by the undereducation state during the entire period | Females are largely underrepresented in this group compared to the entire sample (27.93% vs. 47%). Individuals belonging to this group are, on average, 46 years old, largely higher than the sample average of 32 years old. The educational level of most individuals is primary education at the beginning and end of the analyzed period. Individuals in this group are overrepresented in manufacture, agriculture, machine operator, and elementary occupations. | Unemployment moves from 5 to 8.4%; in both cases lower than the average. | 0.42—relatively low. This is due to the fact that most individuals in this group maintain a persistent status—undereducation—over the entire period. |
| 6. Good Match to Joblessness/Mismatch (15%) | Characterized by several years of a good match at the beginning followed by a mismatch state, i.e., a period of joblessness, under or overeducation | The distribution of demographics resembles the entire sample. Most individuals achieve secondary education. However, the share of people with higher education goes from 21.3% at the beginning to 40.6% at the end of the period. This suggests that some individuals may have increased their educational qualification while staying in the same occupation, which resulted in overeducation. On the other hand, the percentage of individuals participating in more specialized type of occupations such as VET/clerical support and managerial/professionals increased by the end of the period. This may explain transitions from good match to undereducation of some individuals | About 15% of the individuals belonging to this group started with a good match trajectory but lost their jobs by the end of the period. | 0.82—the highest (ie. it is the most heterogenous group) |
| 7. Fast Transition to Good Match (9%) | Characterized by a few years of unemployment at the beginning followed by a good match at the end of the period. This group trajectory resembles group 3 but transitions occur earlier | Compared to group 3, there are slightly more women in this group (52.5%) and individuals are, on average, 2 years younger. Another noteworthy characteristic is that foreigners are overrepresented in this group (3.36% vs. 0.85% in the sample). The educational level of most individuals in this group is high school at the beginning and end of the analyzed period. | Similarly to group 3, unemployment is high at the beginning (69.33%) and low at the end (6.3%). | 0.52—The distribution plot suggests that the group is relatively homogenous, particularly at the end of the analyzed period. At the beginning, the entropy level is higher due to the transition from states of unemployment to good matches. |
| 8. Good Match (26%) | The trajectory of individuals in this group is dominated by the good match state | Women are underrepresented (33%). Individuals are, on average, 39 years old (8 years older than the sample average). The educational level of most individuals in this group is high school at the beginning and end of the period. | Unemployment moves from 2 to 6.1%. In both cases, it is the lowest rate. | 0.12—the lowest. Most individuals in this group have a persistent trajectory, with very few individuals having some short lags of unemployment. |
Table 2.
Estimation of the effect of educational mismatch career trajectories on monthly salary.
| Monthly Salary (Log Transformed) | ||||
|---|---|---|---|---|
| Model 1 | Model 2 | |||
| Educational mismatch trajectory (ref = good match career) | ||||
| Joblessness career | −0.278 *** | (0.040) | −0.313 *** | (0.057) |
| Slow transition to overeducation | −0.133 ** | (0.058) | −0.204 *** | (0.075) |
| Slow transition to good match | −0.154 *** | (0.041) | −0.227 *** | (0.059) |
| Overeducation career | −0.085 * | (0.051) | −0.128 ** | (0.061) |
| Undereducation career | −0.087 | (0.053) | −0.023 | (0.062) |
| Good match to joblessness/mismatch | −0.116 *** | (0.038) | −0.054 | (0.048) |
| Fast transition to good match | −0.026 | (0.046) | −0.037 | (0.063) |
| Educational mismatch trajectory × Female (ref = good match career and male) | ||||
| Joblessness career × Female | 0.054 | (0.073) | ||
| Slow transition to overeducation × Female | 0.138 | (0.103) | ||
| Slow transition to good match × Female | 0.117 | (0.079) | ||
| Overeducation career × Female | 0.109 | (0.097) | ||
| Undereducation career × Female | −0.222 ** | (0.106) | ||
| Good match to joblessness/mismatch × Female | −0.138 * | (0.074) | ||
| Fast transition to good match × Female | 0.022 | (0.088) | ||
| Female | −0.400 *** | (0.024) | −0.409 *** | (0.047) |
| Age | 0.033 *** | (0.006) | 0.033 *** | (0.006) |
| Age × Age | 0.000 *** | (0.000) | 0.000 *** | (0.000) |
| Indigenous | −0.100 ** | (0.040) | −0.103 *** | (0.040) |
| Foreign | −0.114 | (0.122) | −0.101 | (0.122) |
| Education (ref = Some primary or less) | ||||
| Some high school | 0.148 *** | (0.037) | 0.149 *** | (0.037) |
| Some higher education | 0.311 *** | (0.048) | 0.321 *** | (0.048) |
| Occupation (ref = No occupation) | ||||
| Manufacture/agriculture/machine operator/elementary occupations | −0.137 *** | (0.046) | −0.141 *** | (0.046) |
| Services | −0.271 *** | (0.089) | −0.276 *** | (0.089) |
| Technical professional, clerical support | 0.283 *** | (0.050) | 0.278 *** | (0.050) |
| Managerial/Professional | 0.531 *** | (0.056) | 0.524 *** | (0.056) |
| Number of observations | 2718 | 2718 | ||
Note: Regression models are based on last salary and occupation observed for each individual during the 2009–2019 period. Models include a dummy indicating the year of the last data observed for each individual. Salaries are adjusted by inflation to 2019 pesos. *: p < 0.10. **: p < 0.05. ***: p < 0.01. Standard errors in parentheses.
Publisher’s Note: MDPI stays neutral with regard to jurisdictional claims in published maps and institutional affiliations. |
© 2021 by the authors. Licensee MDPI, Basel, Switzerland. This article is an open access article distributed under the terms and conditions of the Creative Commons Attribution (CC BY) license (https://creativecommons.org/licenses/by/4.0/).
Share and Cite
MDPI and ACS Style
Sevilla, M.P.; Farías, M.; Luengo-Aravena, D. Patterns and Persistence of Educational Mismatch: A Trajectory Approach Using Chilean Panel Data. Soc. Sci. 2021, 10, 333. https://0-doi-org.brum.beds.ac.uk/10.3390/socsci10090333
AMA Style
Sevilla MP, Farías M, Luengo-Aravena D. Patterns and Persistence of Educational Mismatch: A Trajectory Approach Using Chilean Panel Data. Social Sciences. 2021; 10(9):333. https://0-doi-org.brum.beds.ac.uk/10.3390/socsci10090333
Chicago/Turabian StyleSevilla, María Paola, Mauricio Farías, and Daniela Luengo-Aravena. 2021. "Patterns and Persistence of Educational Mismatch: A Trajectory Approach Using Chilean Panel Data" Social Sciences 10, no. 9: 333. https://0-doi-org.brum.beds.ac.uk/10.3390/socsci10090333
Note that from the first issue of 2016, this journal uses article numbers instead of page numbers. See further details here.