Article

Tendency to Use Big Data in Education Based on Its Opportunities According to Andalusian Education Students

by
Antonio Matas-Terrón
1,
Juan José Leiva-Olivencia
2,* and
Cristina Negro-Martínez
1
1
Department of Theory and History of Education and Research & Diagnosis Methods in Education, University of Málaga, 29071 Málaga, Spain
2
Department of Didactic and Organization in School, University of Malaga, 29071 Málaga, Spain
*
Author to whom correspondence should be addressed.
Submission received: 9 July 2020 / Revised: 14 August 2020 / Accepted: 16 September 2020 / Published: 21 September 2020
(This article belongs to the Special Issue Big Data and Social Sciences)

Abstract

:
Big Data is configured as a technological element and of increasing educational interest. The need to advance the quality of academic inclusion has led to an unprecedented expansion of educational processes and features. Thus, collecting massive data on educational information is part of teachers’ daily lives and educational institutions themselves. There is an intense debate about the potential of Big Data in the educational context, especially through learning analytics that favor the appropriate, responsible, and inclusive use of the data collected. The main aim of this article is to analyze user profiles and the tendency to use Big Data and see what factors influence its applicability. This study employs an incidental sample of 265 students of Educational Sciences from Andalusian Universities, (Spain), using an ad-hoc survey. A cluster analysis was conducted together with ordinal regression analysis and decision tree. The results allow us to confirm the existence of two different student profiles, in terms of their perceptions and appraisal of Big Data and its implications in education. Consequently, a higher score is found for that profile that contemplates and positively conceives Big Data in terms of learning opportunities and improvement of educational quality. The research demonstrates the need to promote Big Data training within the context of university, aiding the acquisition of digital and transversal skills.

1. Introduction

In recent years, the increase in use of massive data in different contexts has been observed thanks to the evolution of technological devices. The term Big Data first appears in July 1989, in Harper’s Magazine in an article by Larson (1989) in which he talks about the possible origin of “junk mail”. In the 1990s, Big Data was defined by its capacity to work with large volumes of data, of different types and sources, quickly and agilely (Li et al. 2015). This ability to manage massive volumes of data was possible due to the advances in analysis of statistical data (Villegas et al. 2018). In turn, this has favored information processing in a more efficient and innovative way, which results in a better understanding of the reality that surrounds us and the decision-making process (Aghaei et al. 2020). Generally speaking, Big Data is defined by seven characteristics (Mayer-Schönberger and Cukier 2018): Visualization, value, variety, velocity, veracity, variability, and volume.
Although Big Data technology has developed in the business sector, in recent years, it has begun to be incorporated into the educational (Daniel 2019; Matas-Terrón et al. 2020a). One new source of data for teachers is the Learning Management Systems (LMS). Educators have access to information about how their students learn, and how they spend time in the online and offline systems (Arranz and Alonso 2013; Reyes 2015).
An efficient school is one where students develop all their potential being accepted as they are and recognizing their uniqueness. In this sense, the integration of Big Data in Education is turning into the main factor for the School of the future, as the Khan Academy has been showing educators for the last 15 years (see khanacademy.org). It has been said that the benefits of Big Data technology in Education would be linked to the improvement of education because it fosters personalized training, guiding students towards programs more and more fitted to their needs, linking students to the labor market, making educational funding more transparent, and improving the management of the educational system (Sheng et al. 2017). However, it is interesting to highlight that Big Data is the first new technology that involves the whole Educational system although it is not managed directly by teachers, students, or parents. That is because school becomes a source of data to Big Data (via tablets, LMS, Internet of Things, etc.), but the processing of data is taken on by data analysts, usually as external services to schools, sending results to school managers and stakeholders in order to make decisions (Soares 2013).
Using Big Data in educational settings greatly improves academic management, mainly the decision-making process (Molinari et al. 2014).
In the literature review, we found above all, essay studies on the role of Big Data in Education (e.g., Williamson 2016, 2017) as well as studies on technological and organizational aspects (e.g., Wallet and Fawcett 2013; Zablith 2015). However, no relevant studies have been found that analyze the personal or attitudinal position of teachers in relation to this new technology. This is a challenge as a reference is necessary in order to plan and develop any research. Nevertheless, it means a new line of educational research is available to be explored. In fact, very recently a new article was published related to Big Data in Education (Ruiz-Palmero et al. 2020). This study aims to find out the perception of the training advisors of teacher training centers in Andalusia on the application of Big Data in education. They conclude that Big Data is valued for its ability to personalize educational processes and the consequent improvement in academic results, which shows the need to increase the level of knowledge about this tool. Although that study focuses its effort on analyzing perceptions by advisors, it forgets, however, the new generation of educators that, eventually, will have to work into a Big Data set environment.
Nor has it been possible to find validated instruments that measure attitudes, opinions, or professional positioning towards Big Data in teachers specifically. However, there are studies and instruments that do analyze the assimilation of new technologies, models, and methodologies in education in general terms (Bednall et al. 2014; Belleflamme and Jacqmin 2016; Gámez and Guerra 2016). These studies show a positive trend towards the inclusion of new ideas, presenting the education sector on the path to optimizing its functions. Yet, these same studies find that the main problem with new technologies is privacy (Conway and O’Connor 2016). More recently, the VABIDAE questionnaire (Borrego et al. 2019) has been developed and used in a few studies (Ruiz-Palmero et al. 2020; Matas-Terrón et al. 2020b). It is a 31-item scale that gathers data regarding opinions, emotions, and perceptions of the presence of Big Data technology in the educational system and in classrooms.
Therefore, the general situation in Education can be summarized as follows: Big Data is being implanted in the educational system as a new emerging technology; and there are no specific studies on educators’ positioning, opinion, or perception of said technology. Additionally, no specific training on this technology has been found in the training of teachers in Spain. In fact, the authors of this study did not find any explicit reference to this technology in educational technology subjects in a review of the syllabi of future Teaching and Pedagogy students of Spanish public universities.
In light of the above, the idea emerges to include this topic as part of the training teachers receive at the university of Malaga and address this apparent deficit. In order to reach this final aim, three questions needed to be answered before starting the inclusion of this topic in the curriculum: Do students know what Big Data is? If so, or after learning it is, what is their opinion in terms of its potentialities and risks? Finally, do they have any intention to undertake said technology in their professional practice? Regarding the last question, it was considered interesting to know why a person would undertake or not Big Data in their future job as an educator too.
Taking all of this into account, two goals were proposed: To know if future educators know what Big Data is, and to know if they are willing to work with Big Data.
In order to reach both goals, two studies were conducted. The first analyzed the education students’ knowledge level on Big Data and the degree of predisposition to incorporate it into their work. Afterwards, a second study was developed to explore what factors would be involved in their willingness to use Big Data.
The general research procedure on which the two studies are based on is explained below. Subsequently, the first and second studies are presented. Finally, the article closes with a common discussion for all the research.

2. Material and Methods

2.1. Participants

A convenience sample of 265 people from three public universities in southern Spain was used: 57 people from the University of Jaen, 136 from the University of Malaga, and 72 from the University of Seville. All the participants were student teachers and students of Pedagogy. The average age was 22 (s.d. = 5.12) with 75.5% women and 24.5% men. All those surveyed were informed of the aims of the research, obtaining their informed consent prior to participating.

2.2. Material

To carry out the study, the only instrument used was the Big Data Scale Applied to Education (VABIDAE) by Borrego et al. (2019). This scale includes items on all aspects of interest in this study. This is a 31-item appreciation scale questionnaire that records information on opinion, state of mind, and how people face Big Data technologies in education, organizing it into three sections: (1) Assessment of Big Data positive aspects applied to education; (2) assessment of negative aspects and; (3) feelings and emotions induced by Big Data in the surveyed. VABIDAE uses a 5-point response scale that is explained on its website. This scale incorporates a short video on Big Data in Education initially (available online at https://es.euronews.com/2015/05/22/big-data-al-servicio-de-la-educacion). The VABIDAE authors specify that the video is used to reduce misunderstandings and errors about what the problem is, assuming that respondents may have no prior idea or have misconceptions about Big Data (more information on this topic on the VABIDAE website). As the authors say, this specific video was selected because it is from an official European media service, and because it focuses on the concept of Big Data in Education specifically. The instrument is completed with a series of socio-demographic questions (age, gender, residence, university, etc.) as well as two questions of interest for this research, the first of which asks about the respondents’ previous knowledge of Big Data, and the second about their willingness to use Big Data technology in their future professional practice. Both questions are also answered on a scale of 1 to 5. The VABIDAE construction process is described on the website https://vabidae.gitlab.io/vabidae/. Currently, the VABIDAE is under international validation, as reported on its website, which has prevented the incorporation of its psychometric characteristics in this article. In this sense, the first task will be to analyze its psychometric properties with our current sample because the validity of the conclusions will depend on the quality of the instrument. For this reason, part of the result epigraph and conclusions will be dedicated to explaining the validity of this scale.

2.3. Process

Initially, the study coordinator contacted several university professors and professors from participating universities. After reaching an agreement, the teachers informed their students, asking for their voluntary participation. The data were collected using the Google Form web application, during the months of March and November 2019. Once the data were obtained, the VABIDAE scale was validated. The structure obtained with the empirical validation allowed the development of the first study, and based on its results, the second study was conducted.

2.4. Analysis

To satisfy the objectives of the study, an Exploratory Factor Analysis was conducted with the intention of identifying the underlying structure of the dataset. It was verified that the sample size was sufficient, checking the proportion of five participants per item as well as having 150 cases or more (Pallant 2010). A factor extraction procedure with varimax rotation was applied. To establish the number of factors, three criteria were taken into account: Inflection point of the scree diagram, eigenvalue greater than 1.0, and variance greater than 10% (Costello and Osborne 2005). Loads below 0.40 were considered low (Stevens 1996; Hair et al. 1998) and were removed from the tables to facilitate reading. The reliability of the subscales was performed with Cronbach’s alpha (α) and McDonald’s omega (Ω).

3. Results

Using all the subjects in the sample, an Exploratory Factor Analysis (EFA) of the VABIDAE scores was performed. The Kaiser-Meyer-Olkin (KMO) index was 0.873, with a statistically significant Bartlett Test of Sphericity (χ2 (465) = 4278; p < 0.001). Figure 1 shows three factors, according to the criteria previously established. The RMSSA was equal to 0.078, along with a BIC value of −1107 and a Chi-square of 986 (g.l. = 375; p < 0.001).
The factor loads are shown in Table 1. The FOR elements from 1 to 9, except the FOR 5 element and the MOOD elements 1, 2, and 8, load in a first factor that expresses the opportunities and positive feelings and emotions and so was called positive aspects or opportunities (A +). Negative elements load in the second factor, which was called negative consequences (C-). The remaining MOOD elements load in a third factor that was called negative feelings emotions (E). The FOR_5 item was not been taken into account for the rest of the research since its weight was less than 0.400.
Regarding reliability, a Cronbach’s alpha of 0.880 was obtained, as well as a McDonald’s index of 0.882. Eliminating the FOR_5 and FOR_9 items increased the values only 1/1000 of a point in both indicators. No other change produced an improvement in reliability.
Table 2 shows the correlations between factors. Statistically significant relationships can be observed in all of them, although with generally low values.

3.1. Study 1

The aim of the first study was to analyze the level of Big Data knowledge education students have. In addition, the following secondary aims were intended:
  • Know to what degree they are willing to incorporate it into their work.
  • Explore different profiles among the participants regarding the dimensions of VABIDAE.
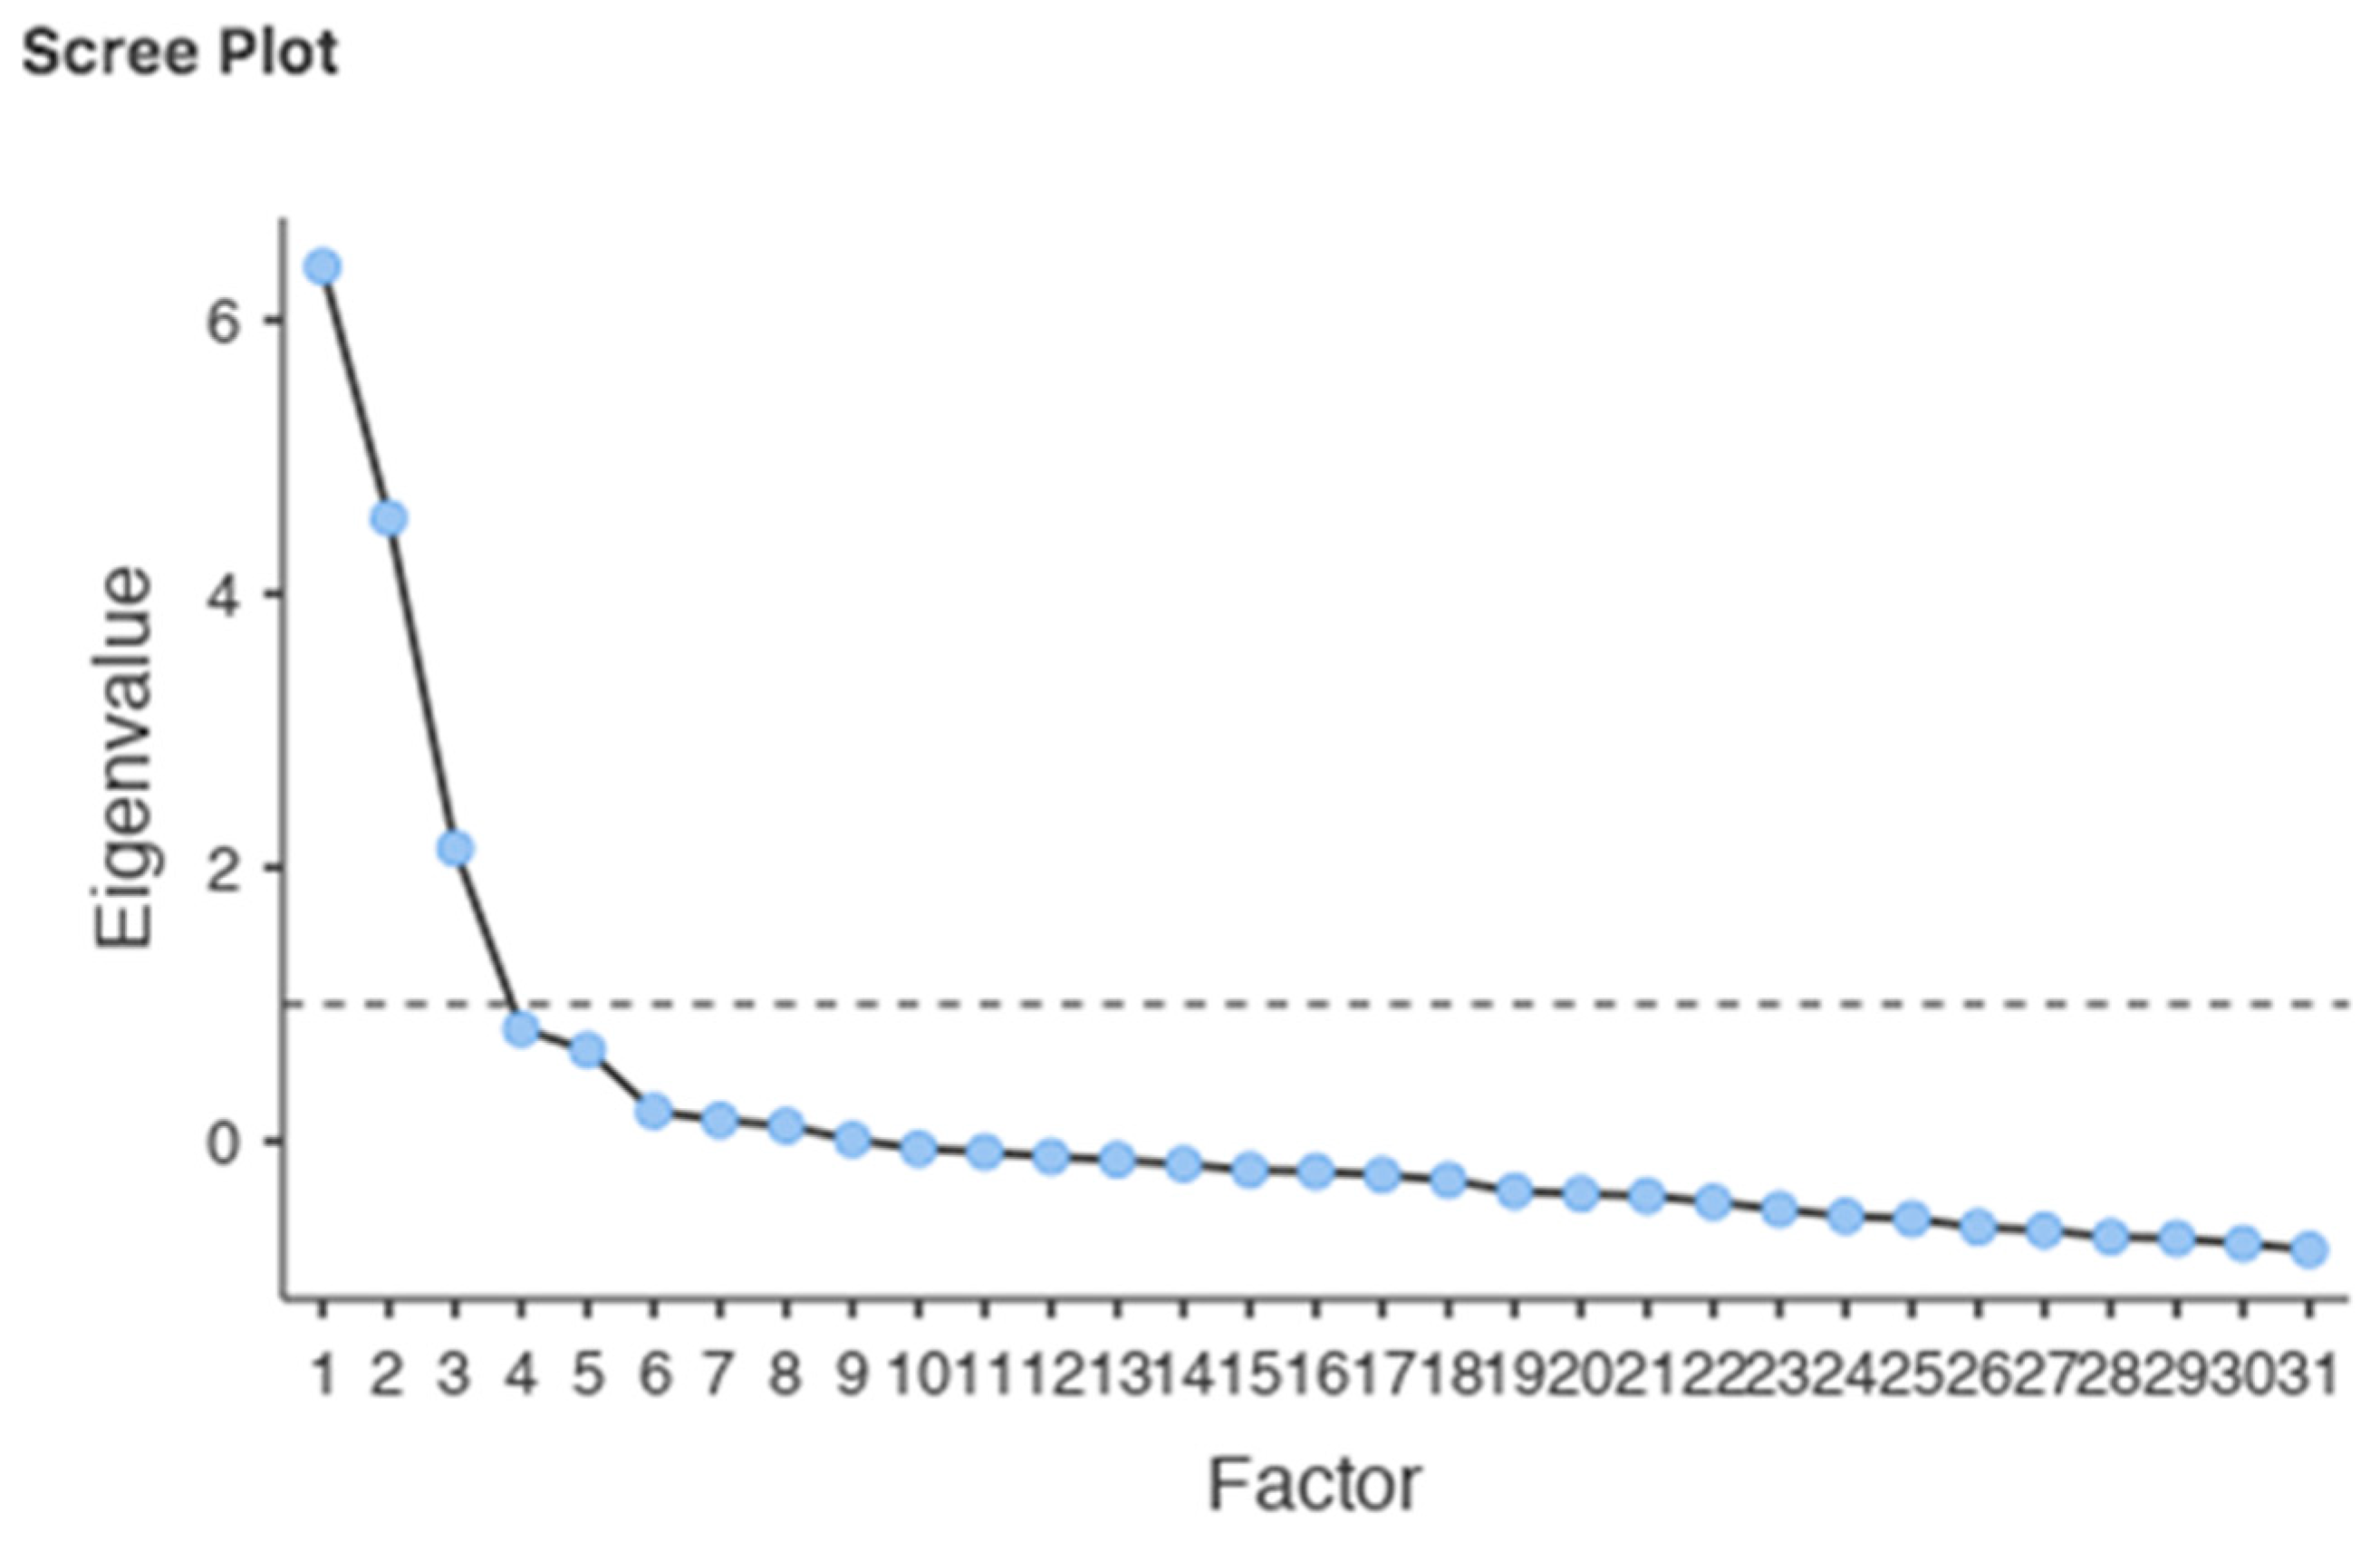
3.1.1. Analysis

The following questions were descriptively analyzed: “Before watching the video, did you know anything about Big Data?” and “Would you use Big Data in your work if possible?” Once the latent dimensions were obtained, the average score from each participant was calculated, establishing them on a scale of 1 to 5. Based on these scores, possible differences were analyzed based on the socio-demographic variables of interest, mainly gender and university of origin. For this, the relevant contrast tests were applied. Next, a cluster analysis was applied on the group of participants, with the intention of identifying possible groups taking all the dimensions of the VABIDAE into consideration. For the analysis, the SPSS version 24 program was used.

3.1.2. Results Study 1
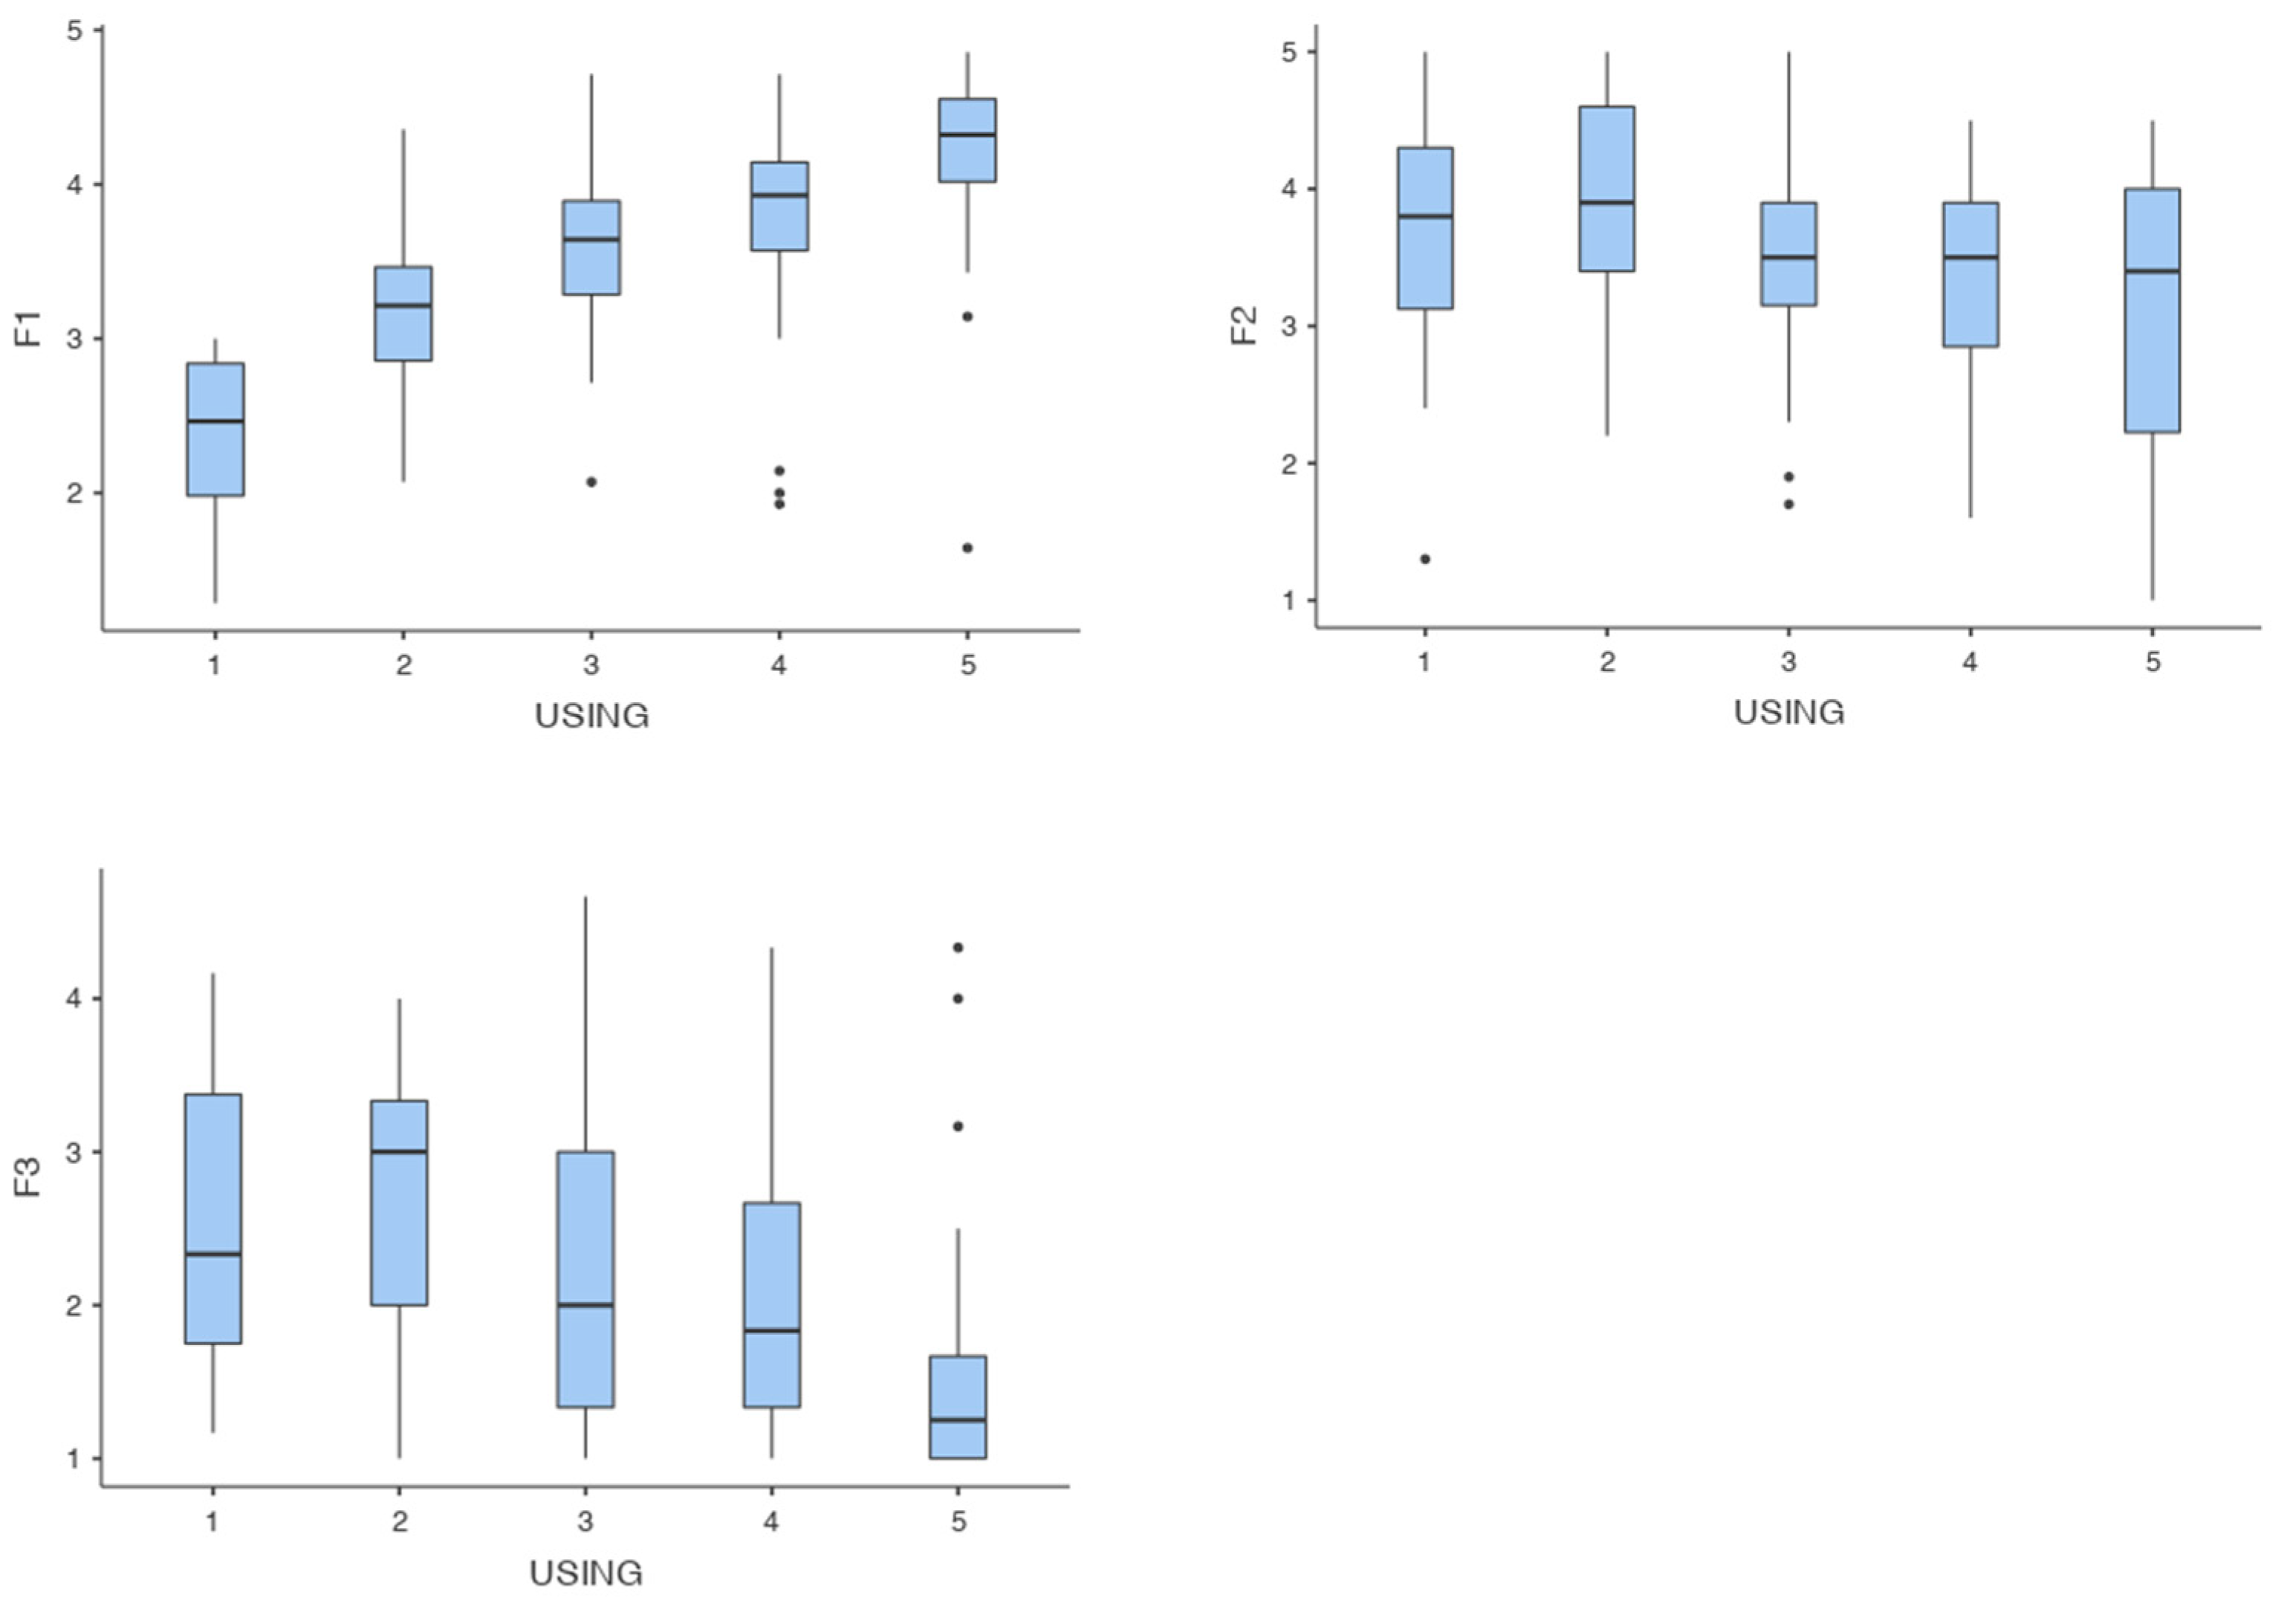
Regarding the question “Before watching the video, did you know anything about Big Data?” 67.9% said that nothing, 27.2% chose the option “knew something, but not much” and only 3.8% chose the option “yes, I did”. The result shows that 69.1% of the participants (183 people) knew nothing or almost nothing.
When asked “Would you use Big Data in your work if possible”, an average of 3.29 was obtained (d.t. = 0.977) and a median of 3 out of 5 points. Therefore, a slightly negative bias is observed (skewness = −0.308; E.T. = 0.15). The Shapiro–Wilk normality test was statistically significant at a confidence level of 0.001. On the response scale, 41.9% chose option 3, followed by option 4 with 31.3%. Third, the participants opted for score 2 (11.7%). The most extreme values obtained 9.8% (option 5) and 5.3% (option 1). The results show a slight general tendency to use this technology in the workplace, although intermediate stances predominate.
No statistically significant differences were obtained in the responses according to gender (t = 1.96; g.l. = 263; p = 0.051) nor from the university of origin (Chi-square = 3.93; g.l. = 2; p = 0.140).
Possible differences in the willingness to use BD depending on the factors of the BAVIDAE scale were also verified. The ANOVA test showed significant differences in factor 1 (F(4; 56.5) = 27.35; p < 0.001) and factor 3 (F(4; 57.8) = 7.33; p < 0.001). In factor 2, the differences were marginal (F(4; 55.2) = 3.58; p = 0.010). These results should be taken with caution because the assumption of normality was violated in the three contrasts, although the homoscedasticity test was met for the contrast in factor 1 (p = 0.587) and factor 3 (p = 0.750).
Due to the non-compliance with these assumptions, the Kruskal–Wallis (KW) test was applied, obtaining similar results: Differences in factor 1 (Chi-square (4) = 84.1; p<.001; ε2 = 0.318) and factor 3 (Chi-square(4) = 31.6; p< 0.001; ε2 = 0.119). Factor 2 showed differenc.okp.,.es at a higher level of significance (Chi-square (4) = 12.8; p = 0.012; ε2 = 0.048).
To accomplish the second aim of this first study, the possible differences according to gender in the factors of the scale were analyzed. The results of the Student’s t-test and the Mann-Whitney U test were not statistically significant in all the factors.
The same occurred when checking the university of origin; both the ANOVA test and the Mann-Whitney U test, which was applied when the assumption of normality was violated in the ANOVA, showed non-significant differences for all factors. Only factor 2 showed differences at a significance level of 0.05 (Chi-square (2) = 8.08; p = 0.018; ε2 = 0.030) with a very small effect size, rendering it negligible.
Another variable taken into account when analyzing the profile was the participants’ prior knowledge of BD. The ANOVA test was not viable as the assumption of normality was violated in the contrasts of each factor. For its part, the KW test showed statistically significant differences only for factor 1 and at a significance level of 0.05 (Chi-square (3) = 8.08; p = 0.044) with a very low effect size (ε2 = 0.03); therefore, said difference has not been considered.
Since statistically significant differences were found, a descriptive study of the participants was conducted, separating them according to the scale factors based on the tendency to use BD in their work.
Regarding factor 1, the group that opts for value 5 has a higher mean (4.19; d.t. = 0.655) with a median of 4.32. These are high scores, as is to be expected. For its part, this group is also the one with the highest bias (skewness = −2.59) compared to the other response options, as well as a greater kurtosis (8.77). Figure 2 graphically shows these results, where the differences both in means and dispersion in the different groups according to the option they selected can be seen.
In factor 2, the group with the highest mean is 2 (3.91; d.t. = 0.775) followed by 1 (mean = 3.69; d.t. = 1.02). In this case, the greatest bias occurs in group 1 (skewness = −0.901; kurtosis = 0.937). Finally, factor 3 has the highest mean in option 2 (2.72; d.t. = 0.776) followed by the group in option 1, with a mean of 2.56 (d.t. = 1.01). Noteworthy in this case is that the group with the greatest variability is 1 (d.t. = 1.01) and 5 (d.t. = 0.944). Regarding the form, group 5 presents a positive bias (skewness = 1.85) as well as the highest score (kurtosis = 2.73). As previously stated, the factor distributions in relation to the item “You would use Big Data in your work if possible” did not meet the normality assumption.
In general, the results show a contrary trend between factor 1 and factor 3. While in factor 1 the mean scores rise from the lowest to the highest group, in factor 3, the trend is inverse.
Finally, a cluster analysis was conducted to identify possible groups among the participants based on their results in the three factors of the VABIDAE.
The Ward method was applied, establishing a pruning on the fourth level. The results are shown in Figure 3.
To explore the differences between the two in the scale factors, a hypothesis test was applied for independent groups. Statistically significant differences were obtained in the three contrasts. Thus, in factor 1, the mean of cluster 1 was 4.04 (d.t. = 0.38) and that of cluster 2 was 3.37 (0.64). Student’s t-test was significant (t = 10,624; p < 0.001). In factor 2, a Student’s t of 4.397 (p < 0.001) was obtained with a mean in cluster 1 of 3.21 (dt = 0.73) and 3.62 (dt = 0.73) in cluster 2. Factor 3 also presented significant differences (t = 19,304; p < 0.001) with a mean of 1.30 (dt = 0.31) in cluster 1 and 2.60 (dt = 0.76) in cluster 2.
The results show that the group of participants in cluster 1 scores higher and more outstanding in factor 1 than in the other factors. For their part, participants in cluster 2 score above all in factor 2, although with close scores in factor 1 as can be seen in Figure 3.

3.2. Study 2

Based on their results, a second study was conducted to explore the extent to which the dimensions of VABIDAE are related to people’s commitment to use Big Data in their future careers if it is available (item: “You would use Big Data in your career if possible”).

3.2.1. Analysis

In order to address the aim of this second study, an ordinal regression analysis was conducted, taking as a dependent variable the participants’ commitment to use BD in their professional practice. A decision tree was applied with the same purpose. This analytical strategy allows a segmentation of the participants into subgroups based on their responses to the study variables, taking one of the variables as a criterion (Tourón et al. 2018); in this case, the criterion was the commitment of the participants. The CHAID (Chi-Squared Automatic Interaction Detector) procedure was selected for the study since the criterion or dependent variable was categorical.
For the analyses, this research used the R version R 3.6.1 program (R Core Team 2019) and the SPSS version 24.

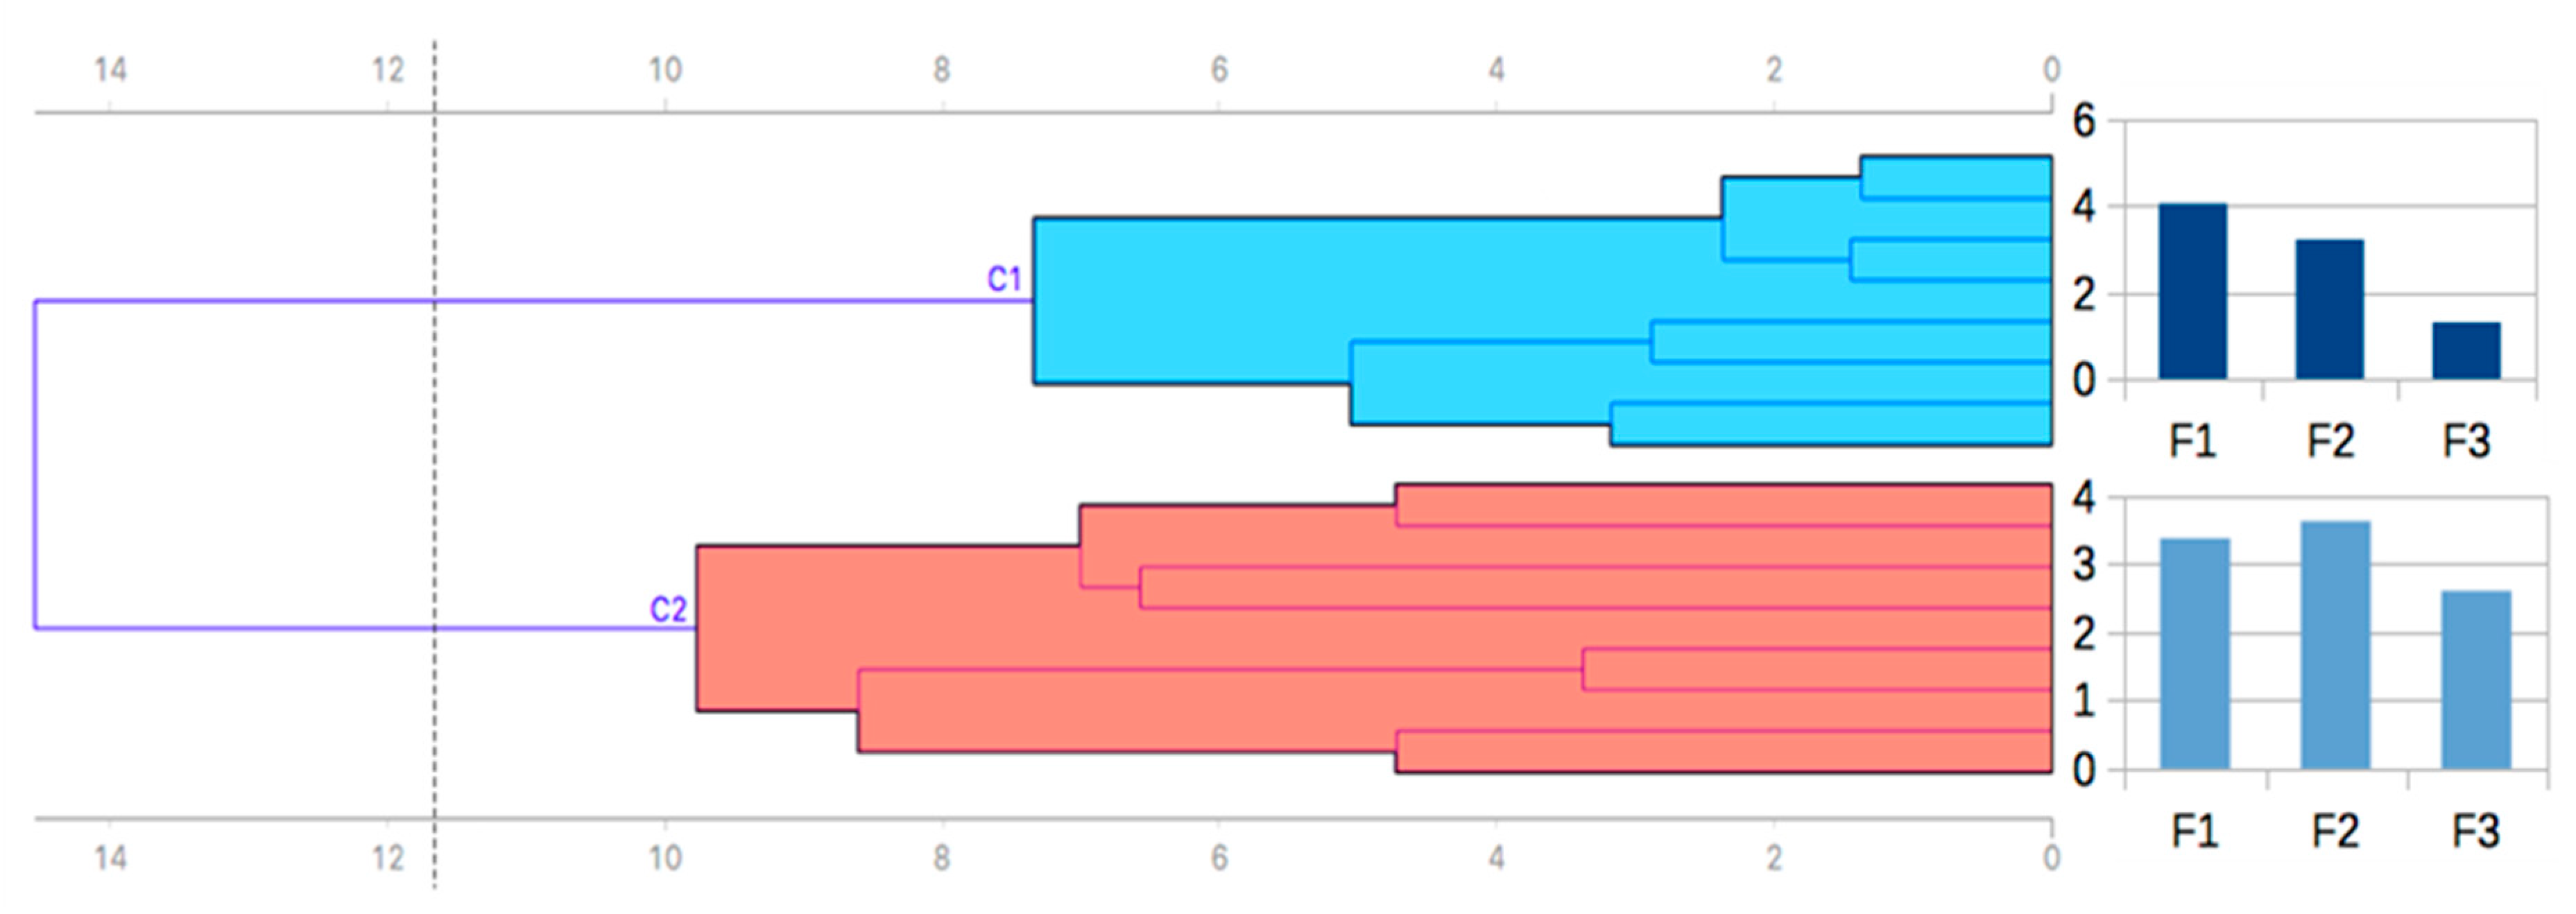
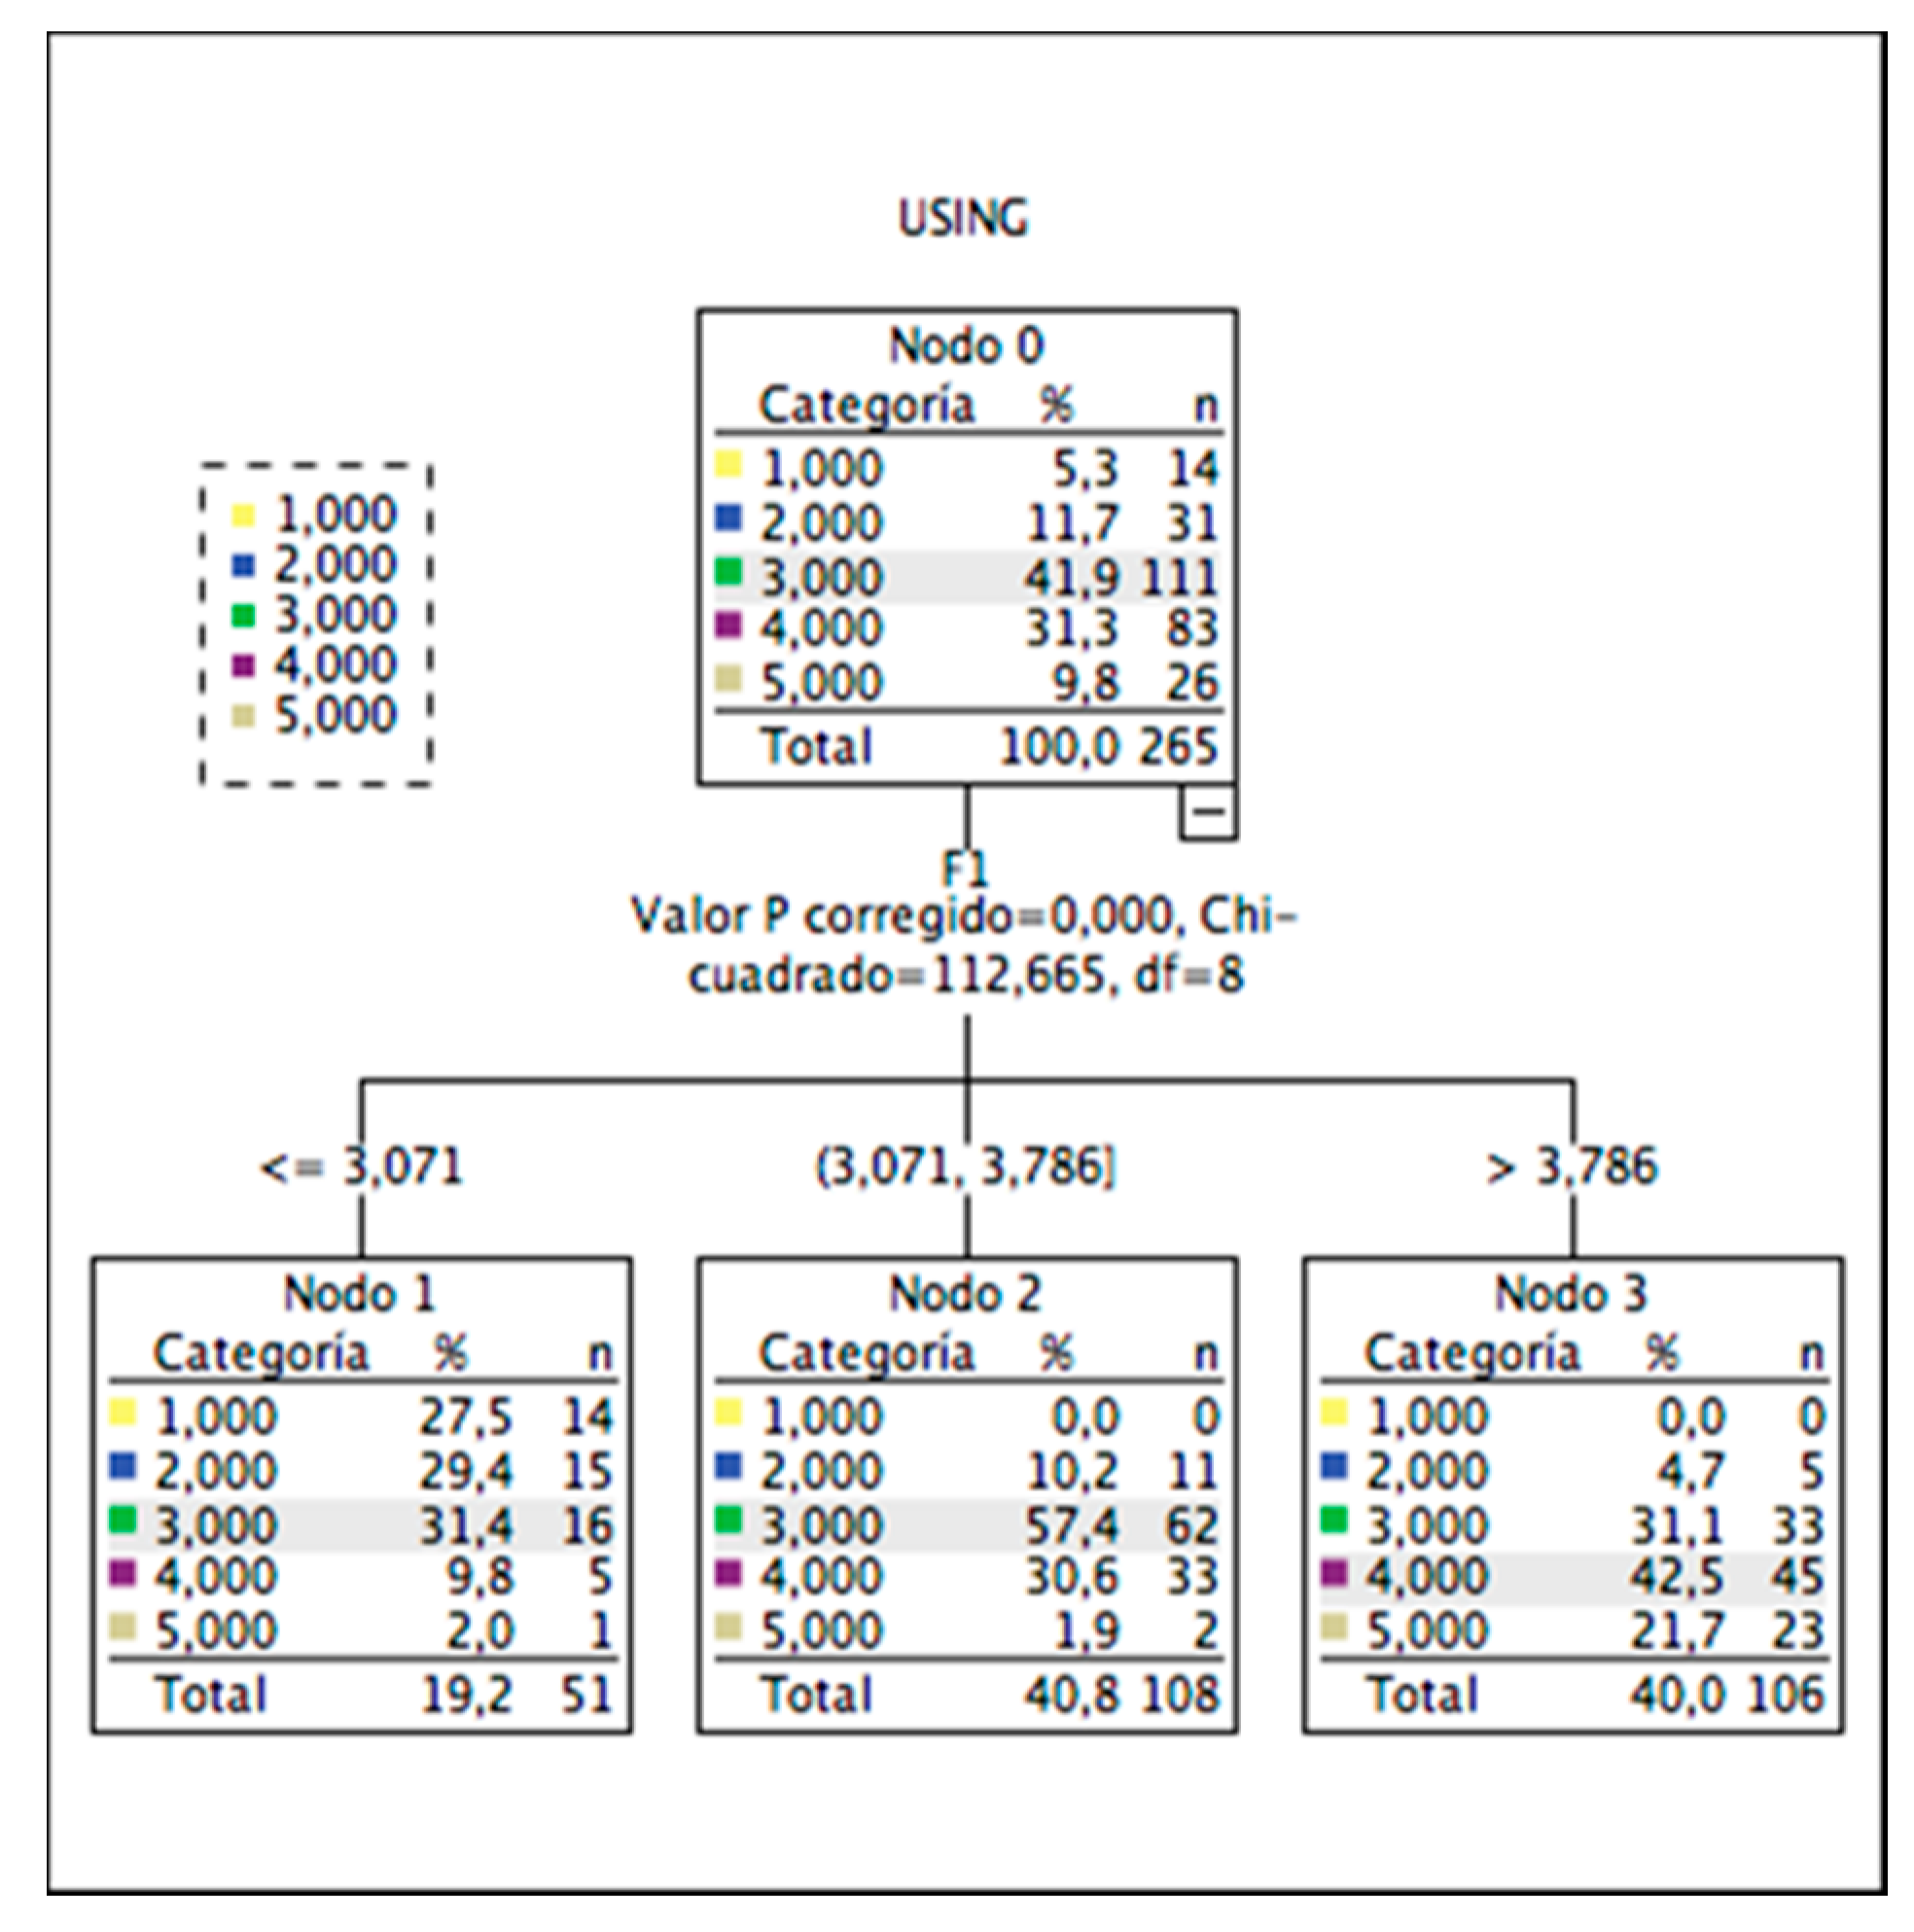
3.2.2. Results Study 2

An ordinal regression analysis was performed; although the interaction models were explored, only the main effects model met the proportional odds assumption (Chi-square (9) = 15.169; p = 0.086. However, the goodness-of-fit indicators question the usefulness of this model. Thus, a significant Pearson’s Chi-square was obtained (Chi-square = 1376.074; gl = 1037; p < 0.0001) although the deviation was not significant (Chi-square = 591.441; gl. = 1037; p = 1). For its part, the value of the Nagelkerke pseudo R-square was 0.402, along with a McFadden value of 0.173. Table 3 presents the estimated values of the parameters.
Although the ordinal regression models suggest that there is a significant weight of the factor 1 and factor 3 subscales in the commitment to use BD in professional practices, the results cannot be taken into account, mainly due to the lack of goodness-of-fit and the lack of compliance with the basic assumptions. For this reason, decision trees have been used as an alternative analytical strategy.
The CHAID algorithm of decision trees identified the factor that best discriminates between the participants who have a greater commitment and those who do not, to use BD in their work (Figure 4). In the left branch, you can see the group of participants that is least willing to use BD. It is made up of 19.2% of participants who usually choose option 3, 2, and 1 of the dependent variable. This group is made up of those who obtain a score equal to or less than 3071 on the VABIDAE factor 1 subscale.
Node 2 and node 3 identify groups that have a moderate tendency and a high tendency to use BD in their professional practice. The second group is made up of 40.8% of the participants who mainly choose option 3 of the dependent variable. This group is made up of those who obtain a score between 3071 and 3786 in the factor 1 subscale. Finally, the third group, with 40% of the cases, are those who score above 3786 in the factor 1 subscale. In this group, the tendency is option 4 of the dependent variable.
The global classification values are somewhat low (46.4%) as the risk estimate also indicates (0.536), although the model achieves a much higher level of success in category 3 of the dependent variable (60%). Therefore, the decision tree shows an interpretation consistent with the regression analysis, where factor 1 of the subscale would allow identifying the participants with a greater commitment to using BD. Thus, participants with a score lower than 3 points would be characterized by low commitment, compared to those with a score higher than 3.78 who would tend to use BD in their professional practice. However, the low levels of global correct classification suggest that the model should be improved.

4. Discussion

Generally, the results show the VABIDAE scale has acceptable psychometric properties, proving useful for the purposes of this research. Its three-dimension structure, based on positive, negative, and (negative) feelings and emotions, is consistent with previous studies on new technologies in Education in general (Belleflamme and Jacqmin 2016; Conway and O’Connor 2016). However, the possibility of conducting a new version of the scale should be studied, given the relatively low total variance explained.
In the first study, the high unawareness on the topic is remarkable. This result is reason enough to undertake training actions to correct the situation, since BD is a technology that will go hand in hand with teaching in the immediate future.
Despite this, the results show a slight general tendency to use this technology in the workplace, although intermediate stances predominate. This is consistent with the results of studies on new educational technologies in general, in which there is a trend towards the inclusion of new technologies (e.g., Belleflamme and Jacqmin 2016).
Regarding the participants’ profiles, the lack of significant differences according to gender or university of origin is striking. However, there are differences depending on the commitment or tendency to use this technology in their professional practice. In general, the results show a contrary trend between the opportunity factor and the factor 3 or negative feelings and emotions. While in the assessment of opportunities they are directly correlated with the level of commitment, the factor of negative feelings and emotions is a reverse trend, as would be expected.
Therefore, the results demonstrate that there are different profiles among the participants depending on the level of commitment to using BD and the VABIDAE scale is sensitive to this. These profiles have been defined in the cluster analysis, where two different groups can be observed, one of them with high scores in the opportunities dimension (factor 1) and another group, more homogeneous in their responses, which score a little more in the dimension of negative consequences.
In relation to the second study, the results show the importance of factor 1 (opportunities) as a subscale that discriminates between subjects with high and low degree of commitment to BD. However, both models should be taken with caution because they do not meet the assumptions (in the case of regression) or risk (in the case of the decision tree) requirements satisfactorily. Furthermore, one of the main limitations of the decision trees is a certain instability in the selection of the variables that segment, and the cut-points (Strobl et al. 2009). Therefore, in future studies, this question should be researched in more detail. In any case, participants with a score higher than 3.78 would tend to use BD in their professional practice.
It should also be noted that the results of the second study are consistent with the profiles found in the first study.

5. Conclusions

All told, the results suggest the following:
-
There are two stances taken by participants in relation to BD. One of them focused on opportunities, the second on negative issues.
-
The “opportunities” subscale (factor 1) is the variable or dimension of the scale that best predicts the tendency to use BD in professional practice.
From the results, it is evident that BD should be included as part of the teacher training, and that the two main profiles found in this study should be taken into account. In any case, new replication studies could research these profiles further and look for factors that might be involved, such as age, previous experience with new technologies, cultural environment, etc. In this sense, one way could be the use of different methodologies and approaches (qualitative research together with experimental research).
Likewise, it is essential to increase the visibility of this complex, dynamic, and constantly changing subject in the training of university teachers and students, given that BD is going to be key in the coming decades. The transformation of educational realities in terms of quality improvement, inclusion, and optimization of public and private investments requires a push of BD for a development that combines sustainability, respect, privacy, and scientificity.
In summary, BD can bring many elements of educational change and innovation, as long as it is approached from an interdisciplinary, constructive approach and with an unequivocal spirit of seeking total quality as a goal.
This study has provided key ideas regarding the expectations, ideas, concepts, lack of knowledge, and even emotions about Big Data in Education. The next stage is to give it coherency and incorporate it into a syllabus in order for Education students to acquire the basic competencies to take advantage of this technology while avoiding its risks.

Author Contributions

Conceptualization, A.M.-T.; methodology, A.M.-T. and C.N.-M. analysis, A.M.-T.; investigation, A.M.-T. and C.N.-M.; resources, J.J.L.-O.; data curation, A.M.-T. writing—original draft preparation, A.M.-T. and J.J.L.-O.; writing—review and editing, A.M.-T. and J.J.L.-O.; supervision, A.M.-T. All authors have read and agreed to the published version of the manuscript.

Funding

This research received no external funding.

Conflicts of Interest

The authors declare no conflict of interest.

References

  1. Aghaei, Sina, Andres Gomez, and Phebe Vayanos. 2020. Learning optimal classification trees: Strong max-flow formulations. Available online: https://arxiv.org/abs/2002.09142 (accessed on 21 September 2020).
  2. Arranz, Olga, and Vidal Alonso. 2013. Big Data & Learning Analytics: A Potential Way to Optimize eLearning Technological Tools. Available online: https://bit.ly/2VweSsw7 (accessed on 21 September 2019).
  3. Bednall, Timothy C., Sanders Karin, and Piety Runhaar. 2014. Stimulating informal learning activities through perceptions of performance appraisal quality and human resource management system strength: A two-wave study. Academy of Management Learning & Education 13: 45–61. [Google Scholar] [CrossRef]
  4. Belleflamme, Paul, and Julien Jacqmin. 2016. An economic appraisal of MOOC platforms: business models and impacts on higher education. CESifo Economic Studies 62: 148–69. [Google Scholar] [CrossRef] [Green Version]
  5. Borrego, Mariano, Guadeño Cristina, Jiménez Cristina, Montero Raquel, Negro Cristina, and Antonio Matas-Terron. 2019. VABIDAE 2019. Available online: https://vabidae.gitlab.io/vabidae/ (accessed on 2 January 2020).
  6. Conway, Mike, and Daniel O’Connor. 2016. Social media, big data, and mental health: current advances and ethical implications. Current Opinion in Psychology 9: 77–82. [Google Scholar] [CrossRef] [PubMed] [Green Version]
  7. Costello, Anna B., and Jason Osborne. 2005. Best practices in exploratory factor analysis: Four recommendations for getting the most from your analysis. Practical Assessment, Research, and Evaluation 10: 1–9. [Google Scholar]
  8. Daniel, Ben Kei. 2019. Big Data and data science: A critical review of issues for educational research. British Journal of Educational Technology 50: 101–13. [Google Scholar] [CrossRef] [Green Version]
  9. Gámez, David, and María Dolores Guerra. 2016. Aprendizaje inverso en formación profesional: opiniones de los estudiantes. Innoeduca International Journal of Technology and Educational Innovation 2: 29–37. [Google Scholar] [CrossRef] [Green Version]
  10. Hair, Joseph F., William C. Black, Barry J. Babin, Rolph E. Anderson, and Ronald L. Tatham. 1998. Multivariate Data Analysis, 5th ed. Upper Saddle River: Prentice Hall. [Google Scholar]
  11. Larson, Erik. 1989. What Sort of Car-rt-sort am I? Harper’s Magazine. Available online: https://harpers.org/archive/1989/07/what-sort-of-car-rt-sort-am-i-junk-mail-and-the-search-for-self/ (accessed on 4 March 2019).
  12. Li, Kuan-Ching, Hai Jiang, Laurence T. Yang, and Alfredo Cuzzocrea. 2015. Big Data: Algorithms, Analytics, and Applications. Boca Raton: CRC Press, ISBN 9781482240559. [Google Scholar]
  13. Matas-Terrón, Antonio, Juan José Leiva Olivencia, and Pablo D. Franco Caballer. 2020. Big Data irruption in education. Pixel-Bit: Revista de Medios y Educación 57: 59–90. [Google Scholar] [CrossRef]
  14. Matas-Terrón, Antonio, Juan José Leiva Olivencia, Pablo D. Franco-Caballero, and Francisco J. García-Aguilera. 2020. Validity of the “Big Data Tendency in Education” Scale as a Tool Helping to Reach Inclusive Social Development. Sustainability 12: 5470. [Google Scholar] [CrossRef]
  15. Mayer-Schönberger, Viktor, and Kenneth Cukier. 2018. Aprender con Big Data [Learn with Big Data]. Madrid: Turner, ISBN 9788417141516. [Google Scholar]
  16. Molinari, Andrea, Vincenzo Maltese, Lorenzino Vaccari, Andrea Almi, and Eleonora Bassi. 2014. Big data and open data for a smart city. IEEE-TN Smart Cities White Papers Trento, Italy 10–11: 1–8. [Google Scholar]
  17. Pallant, Julie. 2010. SPSS Survival Manual: A Step By Step Guide to Data Analysis Using SPSS. Maidenhead: Open University Press/McGraw-Hill, ISBN 9780335242399. [Google Scholar]
  18. R Core Team. 2019. R: A Language and Environment for Statistical Computing. Vienna: R Foundation for Statistical Computing, Available online: https://www.R-project.org/ (accessed on 3 January 2019).
  19. Reyes, Jacqueleen A. 2015. The skinny on big data in education: Learning analytics simplified. TechTrends 59: 75–80. [Google Scholar] [CrossRef]
  20. Ruiz-Palmero, Julio, Ernesto Colomo-Magaña, José Ríos-Ariza, and Melchor Gómez-García. 2020. Big Data in Education: Perception of Training Advisors on Its Use in the Educational System. Social Sciences 9: 53. [Google Scholar] [CrossRef] [Green Version]
  21. Sheng, Jie, Joseph Amankwah-Amoah, and Xiaojun Wang. 2017. A multidisciplinary perspective of big data in management research. International Journal of Production Economics 191: 97–112. [Google Scholar] [CrossRef]
  22. Soares, Sunil. 2013. Big Data Governance: An Emerging Imperative. Boise: MC Press. [Google Scholar]
  23. Stevens, James. 1996. Applied Multivariate Statistics for the Social Sciences, 3th ed. Mahwah: Lawrence Erlbaum Associates, ISBN 9780805837766. [Google Scholar]
  24. Strobl, Carolin, James Malley, and Gerhard Tutz. 2009. An introduction to recursive partitioning: rationale, application, and characteristics of classification and regression trees, bagging, and random forests. Psychological Methods 14: 323–48. [Google Scholar] [CrossRef] [PubMed] [Green Version]
  25. Tourón, Javier, Emelina López González, Luis Lizasoain, Enrique Navarro-Asencio, and María José García-San Pedro. 2018. Alumnado español de alto y bajo rendimiento en ciencias en PISA 2015: análisis del impacto de algunas variables de contexto. Revista de Educacion 380: 156–84. [Google Scholar] [CrossRef]
  26. Villegas, William, Sergio Luján-Mora, Diego Buenaño-Fernandez, and Xavier Palacios-Pacheco. 2018. Big data, the next step in the evolution of educational data analysis. Advances in Intelligent Systems and Computing 721: 138–47. Available online: https://www.academia.edu/download/60552546/SPRINGERLIBRO_pag._1094_Ecuador_Miguel_Orosa-comprimido20190910-50947-3np0nk.pdf#page=160 (accessed on 29 November 2019).
  27. Wallet, Matthew A., and Stanley E. Fawcett. 2013. Data science, predictive analytics, and big data: A revolution that will transform supply chain design and management. Journal of Business Logistics 34: 77–84. [Google Scholar] [CrossRef]
  28. Williamson, Ben. 2016. Digital education governance: data visualization, predictive analytics, and ‘real-time’ policy instruments. Journal of Education Policy 31: 123–41. [Google Scholar] [CrossRef]
  29. Williamson, Ben. 2017. Big Data in Education: The Digital Future of Learning, Policy and Practice. London: Sage, ISBN 9781473948006. [Google Scholar]
  30. Zablith, Fouad. 2015. Interconnecting and enriching higher education programs using linked data. Paper presented at the 24th International Conference on World Wide Web, Florence, Italy, May 18; pp. 711–16. [Google Scholar] [CrossRef]
Figure 1. Scree-plot and criteria eigenvalue level.
Socsci 09 00164 g001
Figure 2. Boxplots of the factors by response option to the tendency to use BD (using).
Socsci 09 00164 g002
Figure 3. Cluster applying Ward’s method and mean factor scores.
Socsci 09 00164 g003
Figure 4. Decision tree by Chi-Squared Automatic Interaction Detector (CHAID).
Socsci 09 00164 g004
Table 1. Factor loads.
Factor
F1 (A+)F2 (C−)F3 (E−)Uniqueness
Promote educational quality in general (FOR_10)0.823 0.306
Helps prevent school failure (FOR_11)0.716 0.483
Personalize Education (FOR_3)0.696 0.505
Better meet the needs of students (FOR_1)0.696 0.458
Improve the organization of schools (FOR_6)0.675 0.524
Produce educational resources adapted to students (FOR_8)0.667 0.530
Improve academic results (FOR_2)0.622 0.595
Improve teacher selection (FOR_7)0.605 0.625
Improve employability (FOR_4)0.597 0.636
It gives me hope (MOOD_2)0.592 0.542
It makes me proud (MOOD_3)0.510 0.670
The theme amuses me (MOOD_1)0.483 0.748
Facilitate decision-making at the political level (FOR_9)0.463 0.772
It brings me relief (MOOD_8)0.425 0.730
Avoid plagiarism (FOR_5) 0.843
Control of the educational system by the company (NEGATIVE_10) 0.812 0.334
Control of the education system by governments (NEGATIVE_9) 0.785 0.366
Produce educational resources adapted to students (NEGATIVE_8) 0.781 0.389
Increase in power of politicians (NEGATIVE_7) 0.713 0.472
Loss of privacy of students (NEGATIVE_1) 0.655 0.567
Increased power of center managers (NEGATIVE_6) 0.607 0.614
Computer attacks (NEGATIVE_4) 0.579 0.647
Loss of the school’s own socialization (NEGATIVE_3) 0.535 0.669
Loss of teacher privacy (NEGATIVE_2) 0.510 0.729
Loss of teacher functions (NEGATIVE_5) 0.503 0.717
I feel ashamed (MOOD_6) 0.9030.174
I feel guilty (MOOD_7) 0.8630.251
I feel powerless (MOOD_9) 0.7220.451
It makes me feel angry (MOOD_4) 0.6690.416
It causes me anxiety (MOOD_5) 0.6600.488
It bores me (MOOD_10) 0.5060.707
Variance explained18.3%15.6%11.5%45.3%
Note: ‘Maximum likelihood’ extraction method was used in combination with a ‘varimax’ rotation.
Table 2. Matrix of correlations between factors.
F1F2F3USING
F1Spearman’s rho-
p-value-
F2Spearman’s rho−0.084 -
p-value0.172 -
F3Spearman’s rho−0.239***0.316***-
p-value< 0.001 <0.001 -
USINGSpearman’s rho0.535***−0.190**−0.317***-
p-value< 0.001 0.002 <0.001 -
Note: ** p < 0.01, *** p < 0.001.
Table 3. Parameter estimates of the ordinal regression.
Model Coefficients—USING
PredictorEstimateSEWaldp
F12.0740.22287.043<0.001
F2−0.3980.1655.8320.016
F3−0.4650.14310.588<0.001

