
Pharmacokinetic/Pharmacodynamic Modeling of Spiramycin against Mycoplasma synoviae in Chickens

 ,
,  , and
, and
Abstract
:1. Introduction
2. Results
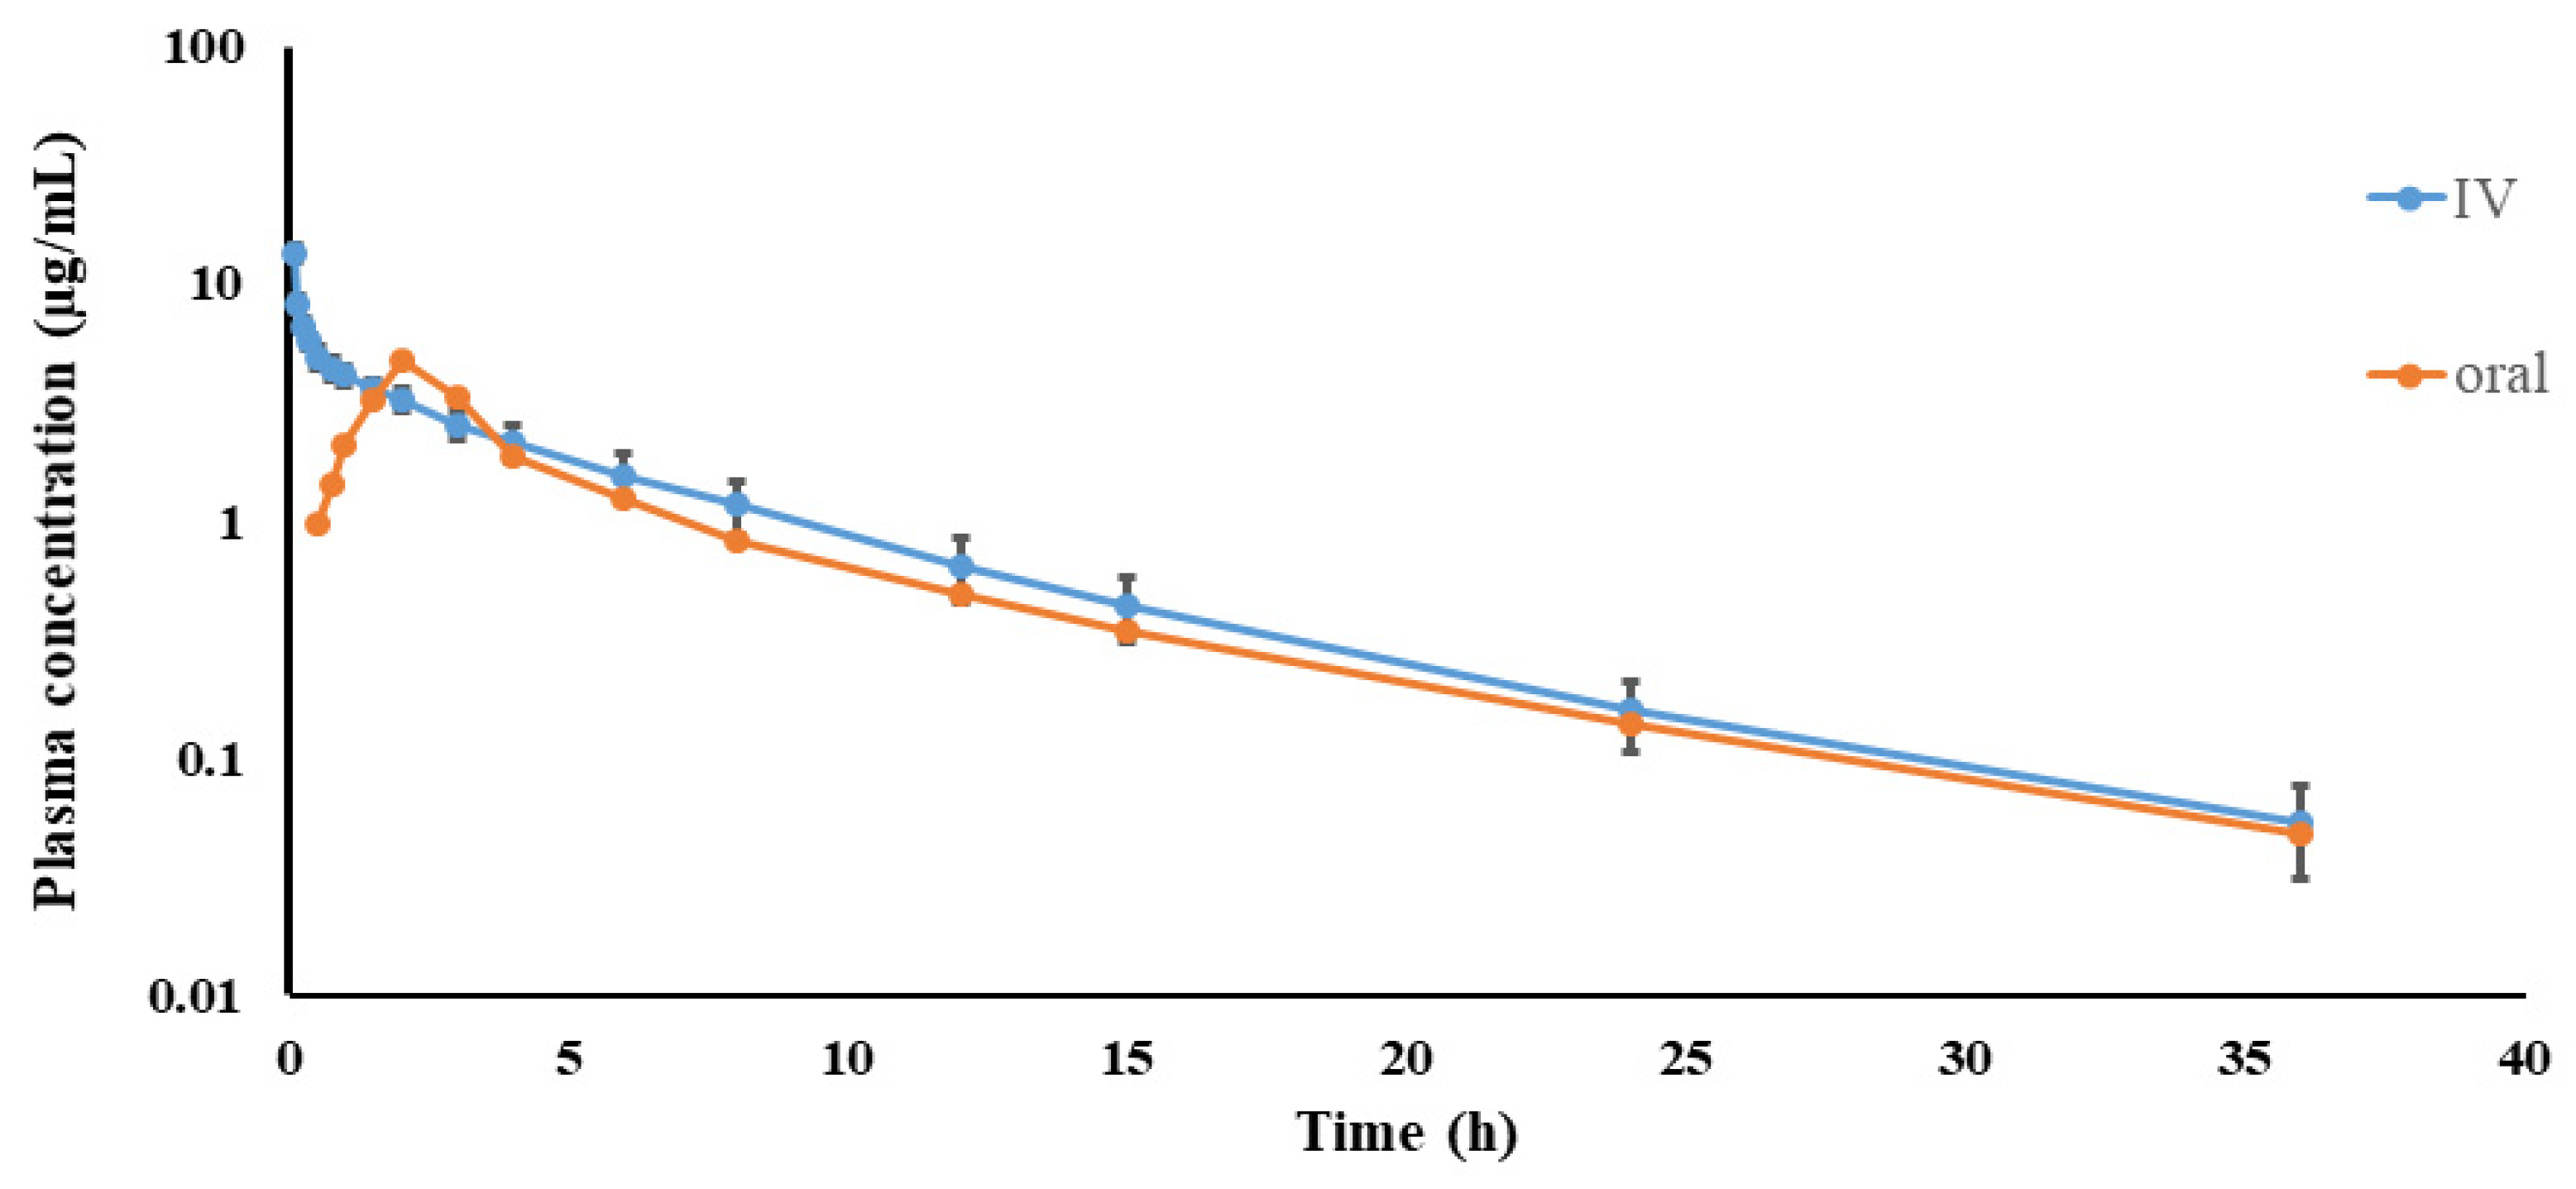
2.1. Spiramycin PK
2.2. Plasma Protein Binding
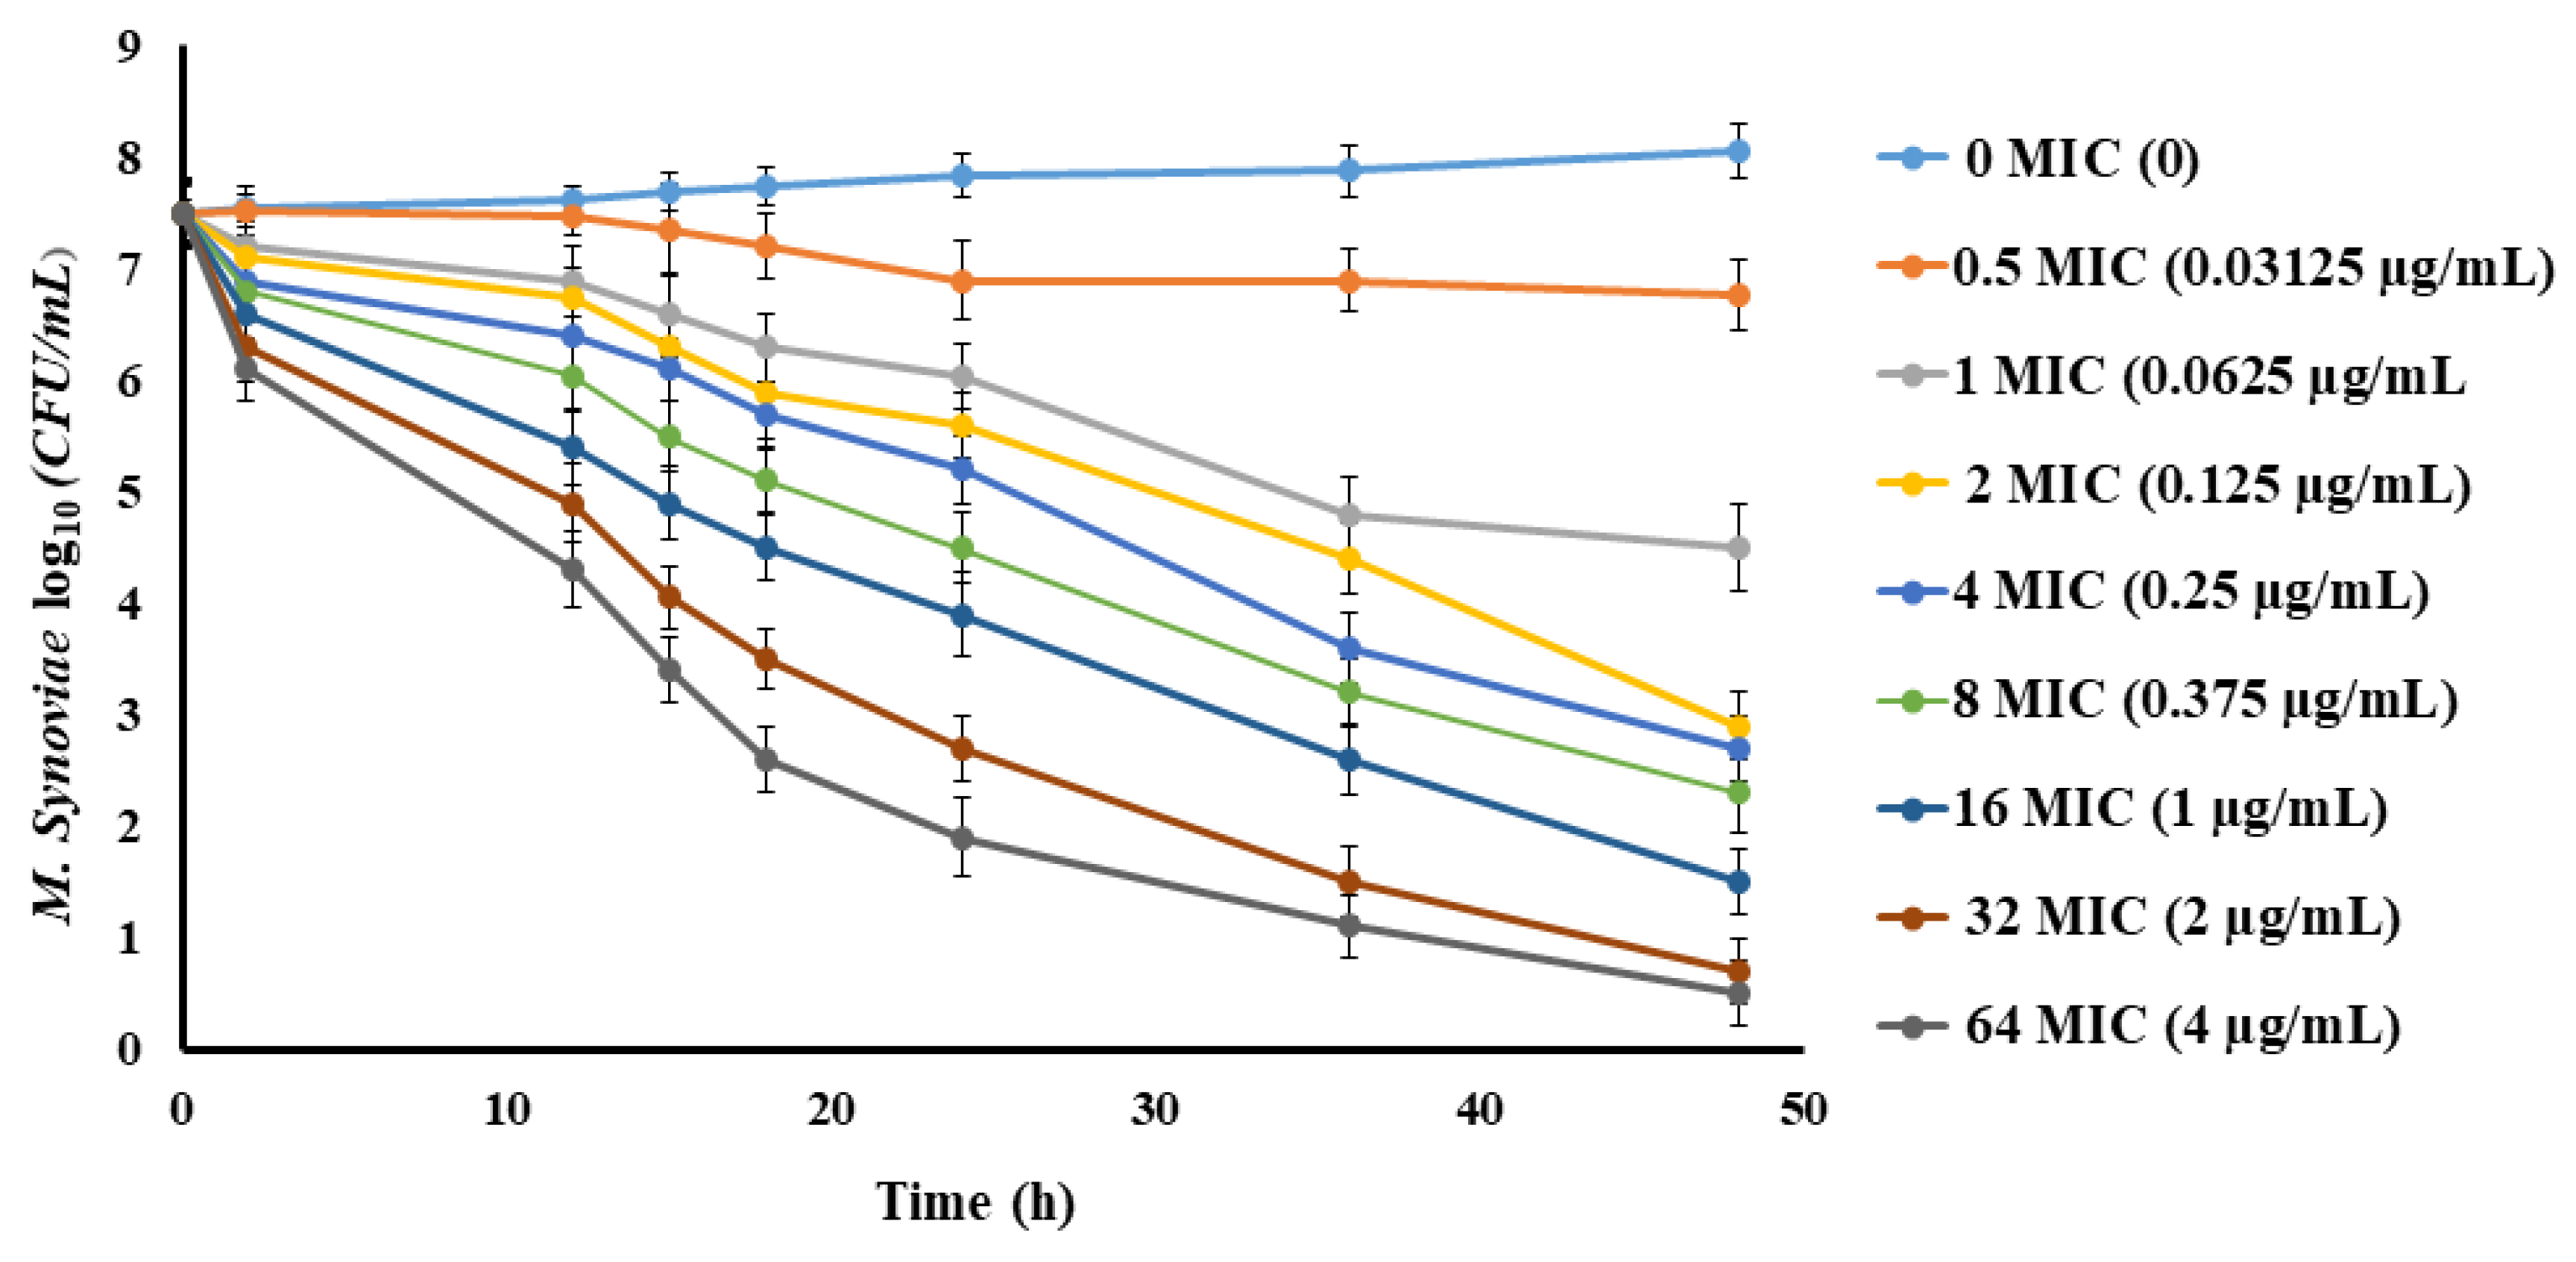
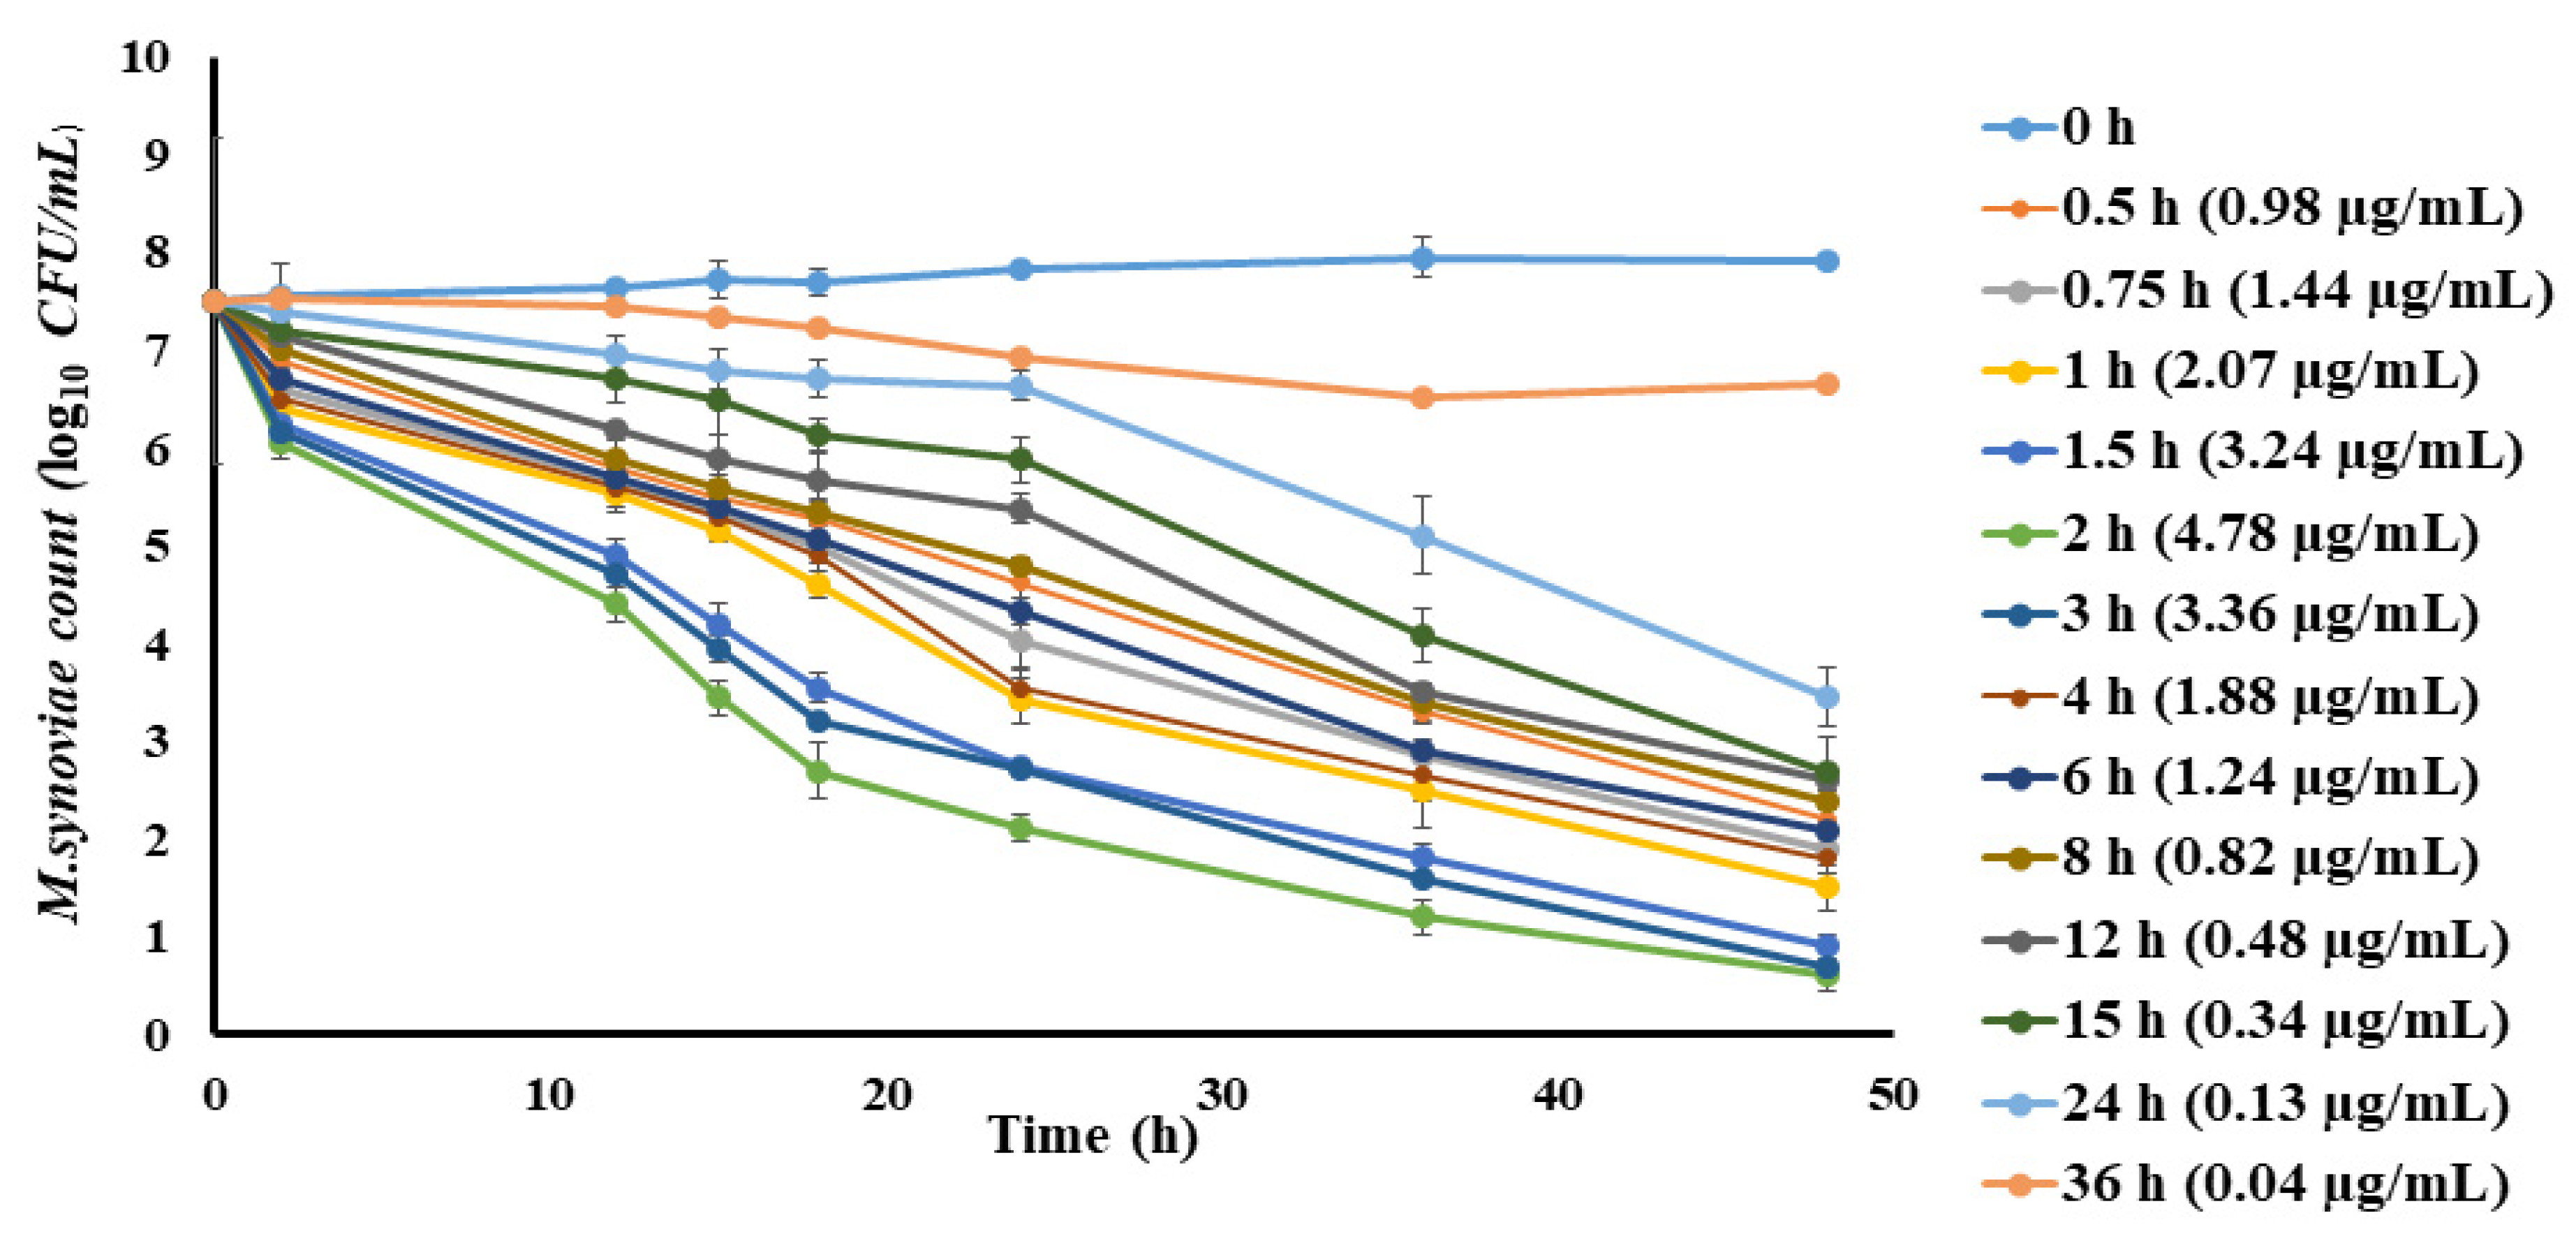
2.3. Spiramycin PD
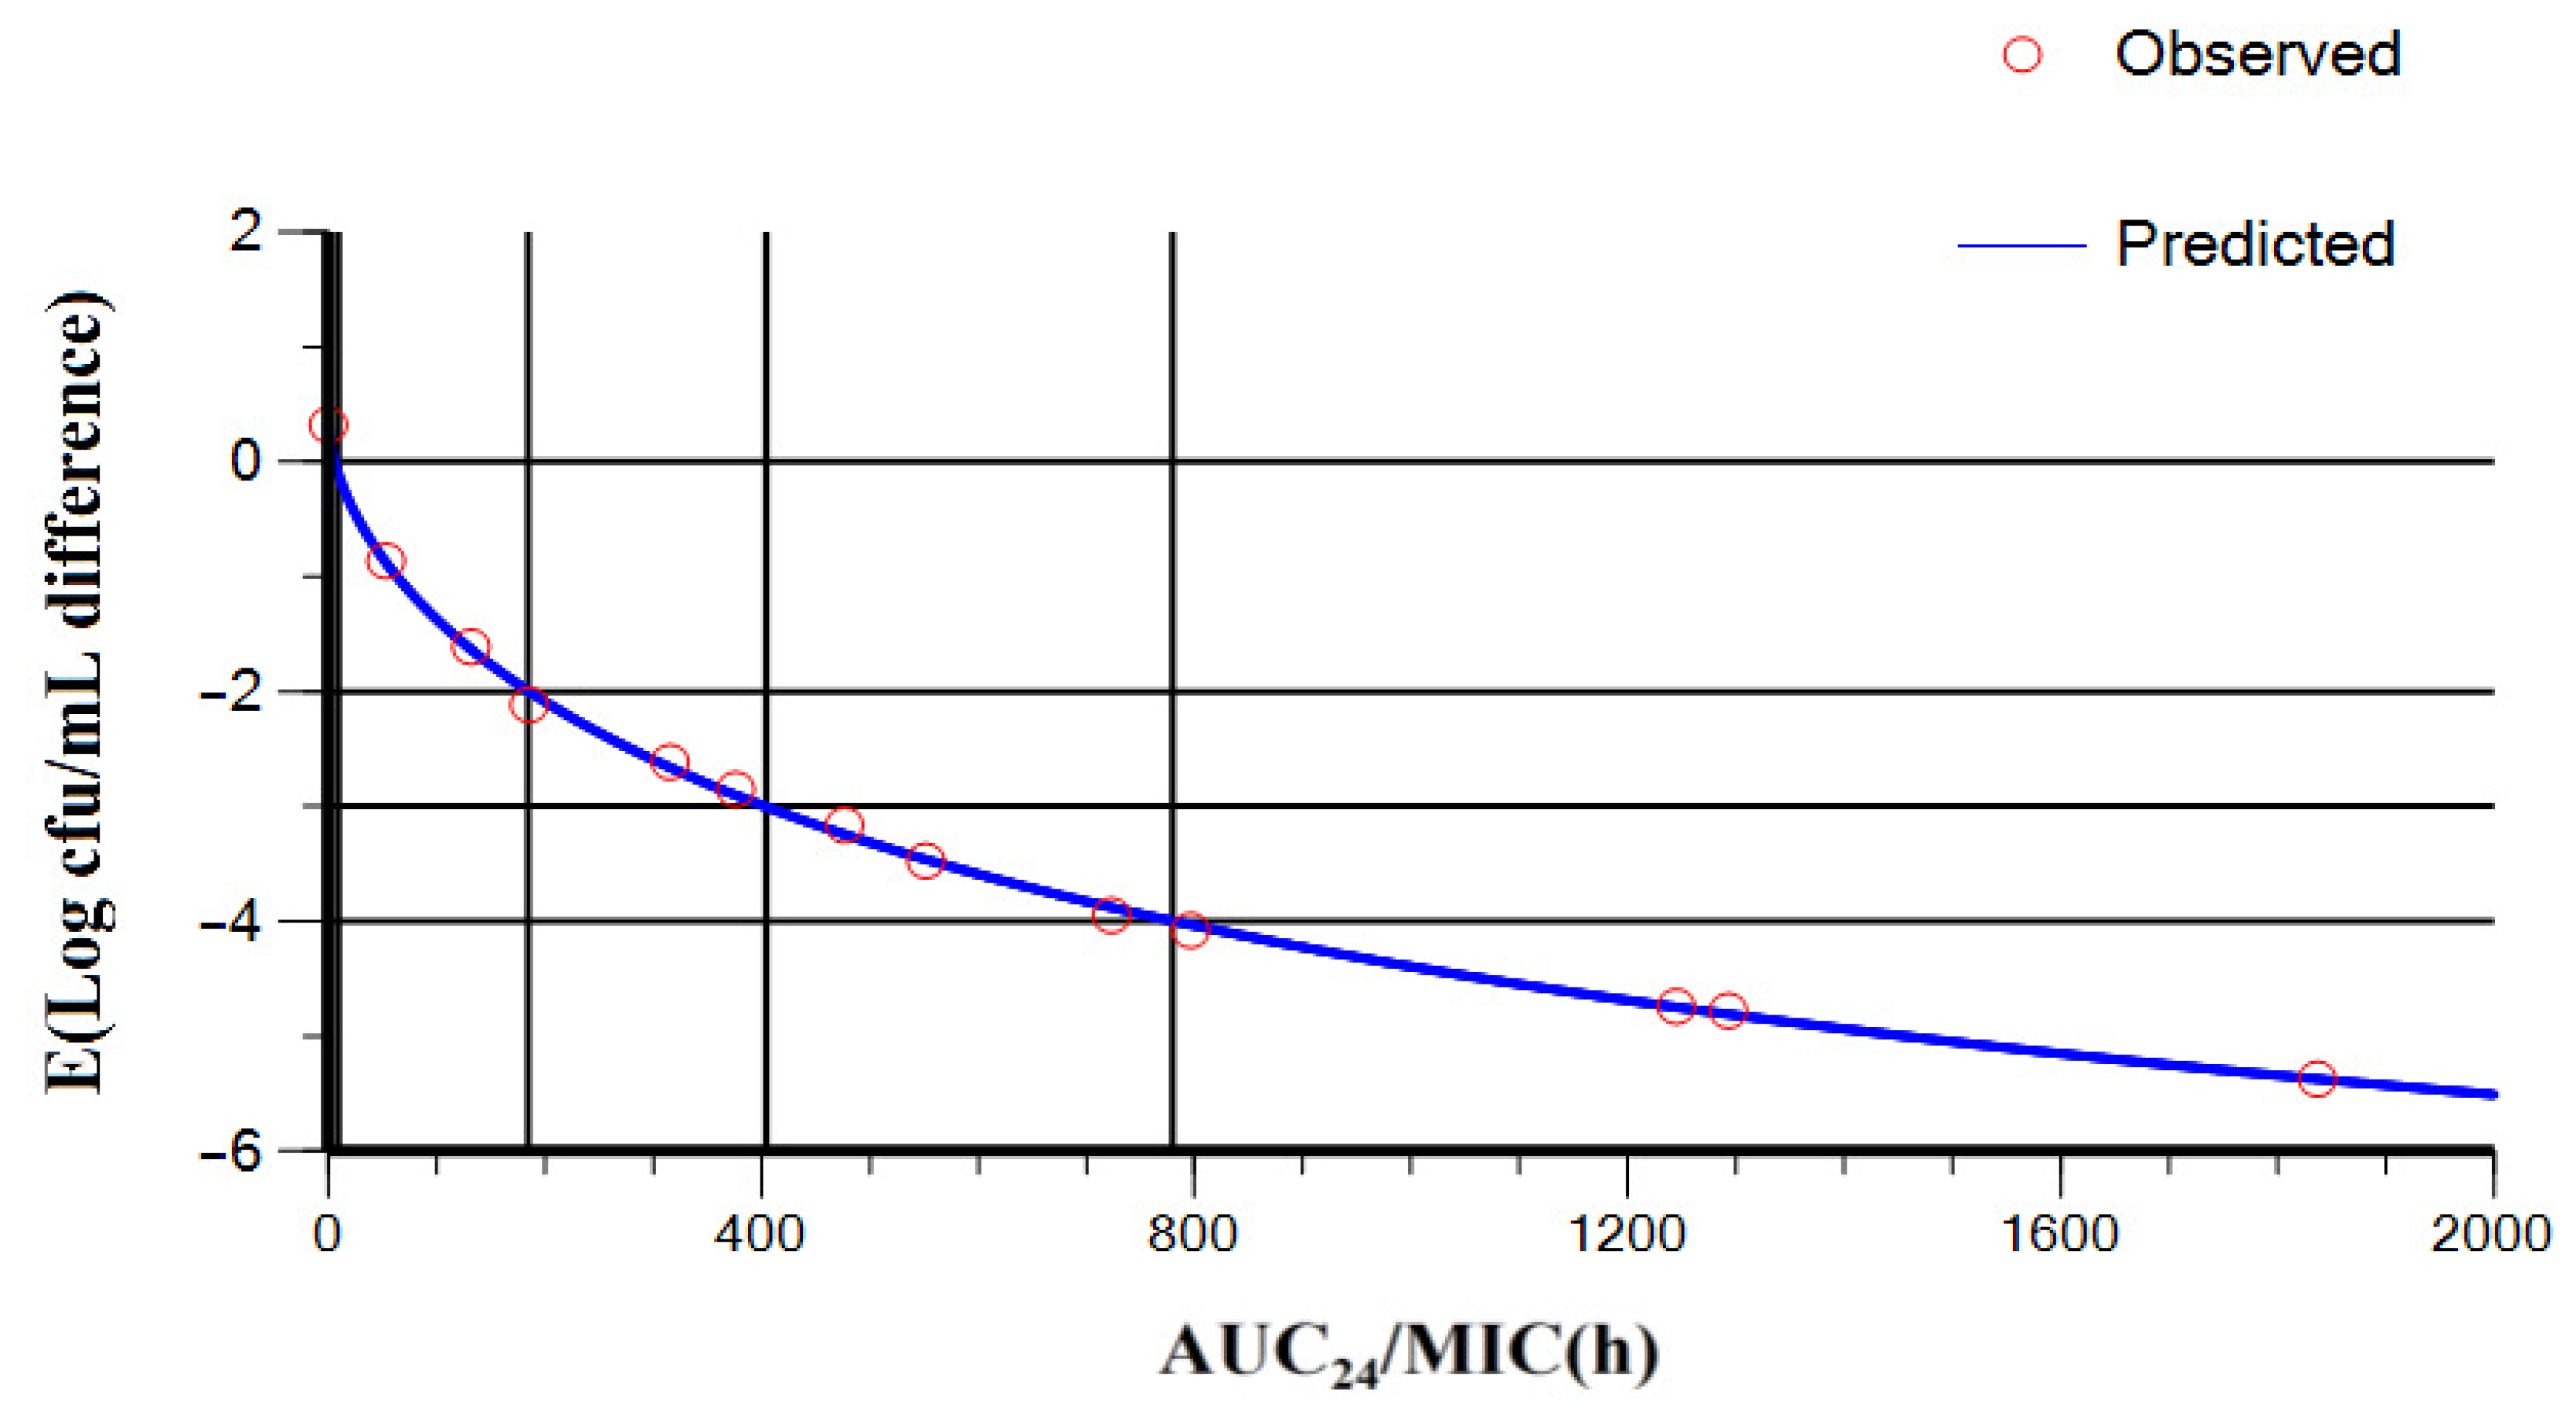
2.4. PK/PD Integration and Dose Estimation
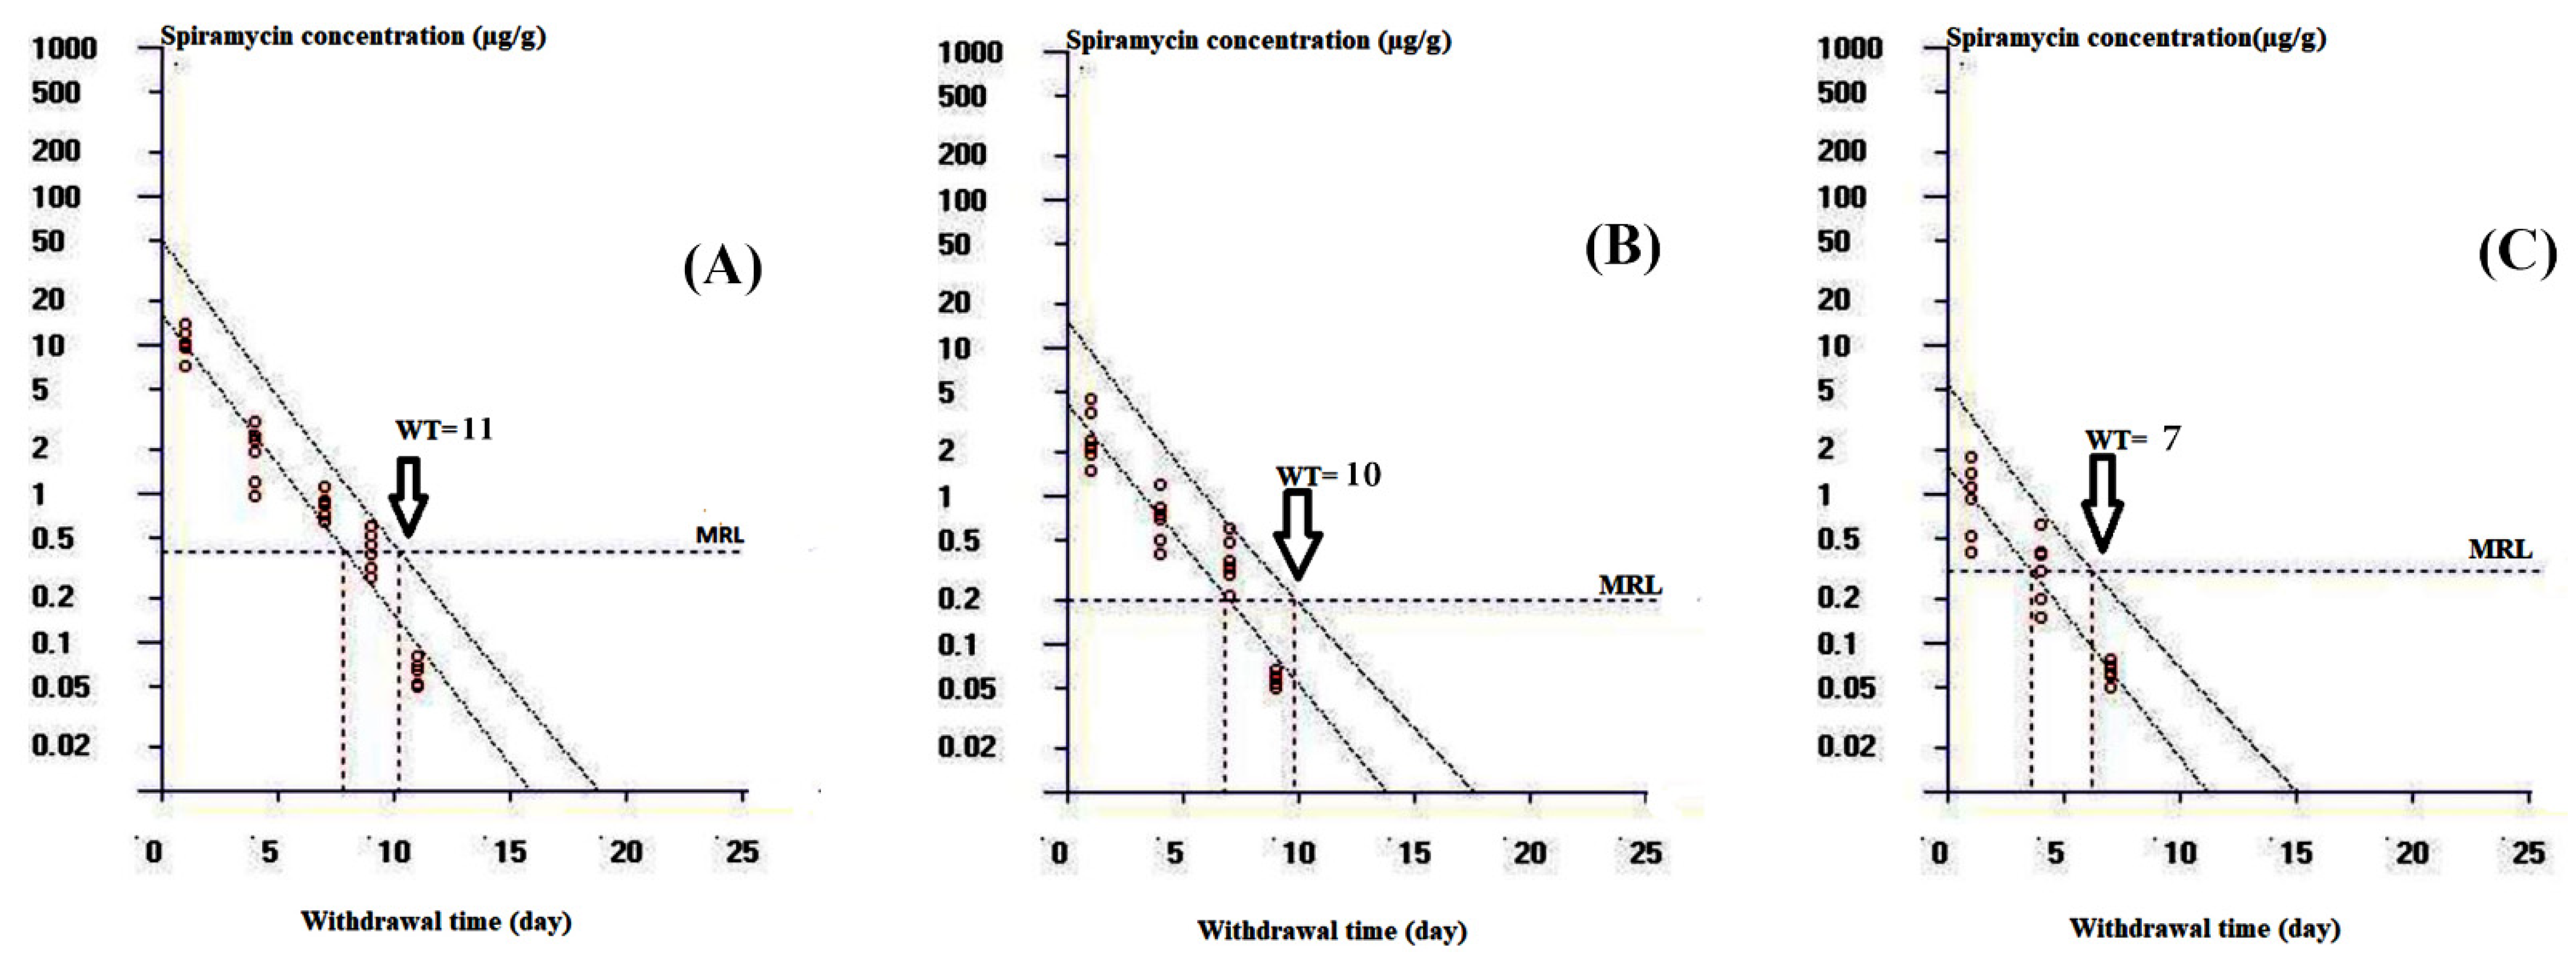
2.5. Tissue Residues and Withdrawal Periods of Spiramycin
3. Discussion
4. Materials and Methods
4.1. Materials
4.2. Experimental Animals
4.3. Experimental Design
4.4. Measurement of Spiramycin Concentrations in Plasma and Tissue Samples
4.4.1. Extraction of Plasma Samples
4.4.2. Extraction of Tissue Samples
4.4.3. Chromatographic Conditions
4.5. Plasma Protein Binding Determination
4.6. Determination of MIC of Spiramycin against M. synoviae
4.7. In Vitro Time-Killing Curve
4.8. Ex Vivo Time-Killing Curve Determination
4.9. Assessment of PK Properties and Withdrawal Time Determination
4.10. PK/PD Integration and Dose Computation
4.11. Statistical Analysis
Author Contributions
Funding
Institutional Review Board Statement
Data Availability Statement
Acknowledgments
Conflicts of Interest
References
- Pinnert-Sindico, S.; Ninet, L.; Preu d Homme, J.; Cosan, C. A new antibiotic-spiramycin. Antibiot. Annu. 1955, 1954, 724–727. [Google Scholar]
- Ōmura, S.; Sano, H.; Sunazuka, T. Structure activity relationships of spiramycins. J. Antimicrob. Chemother. 1985, 16, 1–11. [Google Scholar] [CrossRef] [Green Version]
- Moffat, A.C.; Osselton, M.D.; Widdop, B. Clarke’s Analysis of Drugs and Poisons, 3rd ed.; Pharmaceutical Press: London, UK, 2004; Volume 2. [Google Scholar]
- Kernbaum, S. La spiramycine. Utilisation en therapeutique humaine. Sem. Hopit Paris 1982, 58, 289–297. [Google Scholar]
- Kavi, J.; Webberley, J.M.; Andrews, J.M.; Wise, R. A comparison of the pharmacokinetics and tissue penetration of spiramycin and erythromycin. J. Antimicrob. Chemother. 1988, 22, 105–110. [Google Scholar] [CrossRef]
- Rubinstein, E.; Keller, N. Spiramycin renaissance. J. Antimicrob. Chemother. 1998, 42, 572–576. [Google Scholar] [CrossRef] [Green Version]
- Sanders, P.; Moulin, G.; Guillot, P.; Dacorn, M.; Perjant, P.; Delepine, B.; Mourot, D. Pharmacokinetics of spiramycin after intravenous, intramuscular and subcutaneous administration in lactating cows. J. Vet. Pharmacol. Ther. 1992, 15, 53–61. [Google Scholar] [CrossRef] [PubMed]
- Arzey, G.G.; Arzey, K.E. Successful treatment of mycoplasmosis in layer chickens with single dose therapy. Aust. Vet. J. 1992, 69, 126–128. [Google Scholar] [CrossRef]
- Brook, I. Pharmacodynamics and PK of spiramycin and their clinical significance. Clin. Pharmacokinet. 1998, 34, 303–310. [Google Scholar] [CrossRef] [PubMed]
- Sanders, P.; Guillot, P.; Dagorn, M.; Moulin, G.; Delépine, B.; Mourot, D. Of spiramycin in cattle after intramuscular administration of multiple doses. Am. J. Vet. Res. 1994, 55, 358–362. [Google Scholar] [PubMed]
- Nielsen, P.; Gyrd-Hansen, N. Bioavailability of spiramycin and lincomycin after oral administration to fed and fasted pigs. J. Vet. Pharmacol. Ther. 1998, 21, 251–256. [Google Scholar] [CrossRef]
- Cester, C.C.; Laurentie, M.P.; Garcia-Villar, R.; Toutain, P.L. Spiramycin concentrations in plasma and genital-tract secretions after intravenous administration in the ewe. J. Vet. Pharmacol. Ther. 1990, 13, 7–14. [Google Scholar] [CrossRef]
- Schoondermark-Van De Ven, E.; Galama, J.; Camps, W.; Vree, T.; Russel, F.; Meuwissen, J.; Melchers, W. Pharmacokinetics of spiramycin in the rhesus monkey: Transplacental passage and distribution in tissue in the fetus. Antimicrob. Agents Chemother. 1994, 38, 1922–1929. [Google Scholar] [CrossRef] [PubMed] [Green Version]
- Morrow, C.J.; Bell, I.G.; Walker, S.B.; Markham, P.F.; Thorp, B.H.; Whithear, K.G. Isolation of Mycoplasma synoviae from infectious synovitis of chickens. Aus. Vet. J. 1990, 67, 121–124. [Google Scholar] [CrossRef]
- Kleven, S.H. Mycoplasma Synoviae Infection. Diseases of Poultry, 10th ed.; Calnek, B.W., Barnes, H.J., Beard, C.W., McDougal, L.R., Saif, Y.M., Eds.; Iowa State University Press: Ames, IA, USA, 1997; pp. 220–228. [Google Scholar]
- Landman, W.J.M.; Feberwee, A. Longitudinal field study on the occurrence of Mycoplasma synoviae in Dutch Turkey flocks with lameness and experimental induction of the condition. Avian Pathol. 2012, 41, 141–149. [Google Scholar] [CrossRef]
- Amer, M.M.; Mekky, H.M.; Fedawy, H.S. Molecular identification of Mycoplasma synoviae from breeder chicken flock showing arthritis in Egypt. Vet. World 2019, 12, 535–541. [Google Scholar] [CrossRef] [Green Version]
- Stanley, W.A.; Hofacre, C.L.; Speksnijder, G.; Kleven, S.H.; Aggrey, S.E. Monitoring Mycoplasma gallisepticum and Mycoplasma synoviae infection in breeder chickens after treatment with enrofloxacin. Avian Dis. 2001, 45, 534–539. [Google Scholar] [CrossRef] [PubMed]
- Mallinson, E.T. MS erodes profit margins. Poult. Dig. 1985, 44, 204–207. [Google Scholar]
- Yilmaz, F.; Timurkaan, N.; Kilic, A.; Kalender, H.; Kilinc, U. Detection of Mycoplasma synoviae and Mycoplasma gallisepticum in chickens by immunohistochemical PCR and culture methods. Rev. Med. Vet. 2011, 162, 79–86. [Google Scholar]
- Toutain, P.L.; Del Castillo, J.R.E.; Bousquet-Melou, A. The pharmacokinetic-pharmacodynamic approach to a rational dosage regimen for antibiotics. Res. Vet. Sci. 2002, 73, 105–114. [Google Scholar] [CrossRef]
- Nielsen, E.I.; Friberg, L.E. Pharmacokinetic-pharmacodynamic modeling of antibacterial drugs. Pharmacol. Rev. 2013, 65, 1053–1090. [Google Scholar] [CrossRef] [Green Version]
- Periti, P.; Mazzei, T.; Mini, E.; Novelli, A. Adverse effects of macrolide antibacterials. Drug Saf. 1993, 9, 346–364. [Google Scholar] [CrossRef]
- Nisha, A.R. Antibiotic residues—A global health hazard. Vet. World 2008, 1, 375–377. [Google Scholar] [CrossRef]
- Saleh, H.; Elhenawee, M.; Hussien, E.M.; Ahmed, N.; Ibrahim, A.E. Validation of hplc-uv multi-residue method for the simultaneous determination of tetracycline, oxytetracycline, spiramycin and neospiramycin in raw milk. Food Anal. Methods 2021, 14, 36–43. [Google Scholar] [CrossRef]
- Draisci, R.; Palleschi, L.; Ferretti, E.; Achene, L.; Cecilia, A. Confirmatory method for macrolide residues in bovine tissues by micro-liquid chromatography-tandem mass spectrometry. J. Chromatogr. A 2001, 926, 97–104. [Google Scholar] [CrossRef]
- Prats, C.; El Korchi, G.; Francesch, R.; Arboix, M.; Perez, B. Tylosin depletion from edible pig tissues. Res. Vet. Sci. 2002, 73, 323–325. [Google Scholar] [CrossRef]
- Beyene, T. Veterinary drug residues in food-animal products: Its risk factors and potential effects on public health. J. Vet. Sci. Technol. 2016, 7, 285. [Google Scholar] [CrossRef]
- CVMP. Spiramycin (Extension to Pig); Summary Report (3), EMEA/MRL/618/99—Final. London, UK, 1999; European Agency for the Evaluation of Medicinal Products: Amsterdam, The Netherlands, 1999. [Google Scholar]
- Ahmed, M.B.M.; Sree, Y.H.A.; Abdel-Fattah, S.M.; Hassan, N.S.; Saad, M.M.E.D. Determination of tylosin, spiramycin, and erythromycin residues in Egyptian buffaloes’ meat by thin-layer chromatography-bioautography. JPC J. Planar. Chroma. Modern TLC 2013, 26, 409–416. [Google Scholar] [CrossRef]
- Lee, T.S.; Lee, H.J.; Jo, M.R.; Byun, H.S.; Son, K.T.; Park, M.J.; Yi, Y.H. Analysis of spiramycin in fish using high performance liquid chromatography. J. Fish Aquat. Sci. 2006, 39, 78–84. [Google Scholar] [CrossRef]
- Al Safi, S.; Kafi, L. Comparative Study of residues of Levofloxacin and Spiramycin in normal and infected tissues of chicken by HPLC. Kufa J. Vet. Sci. 2017, 8, 45–55. [Google Scholar]
- Riviere, J.E. Absorption, distribution, metabolism and elimina-tion. In Veterinary Pharmacology and Therapeutics, 9th ed.; Papich, M.G., Ed.; Wiley-Blackwell: Ames, IA, USA, 2009; pp. 47–74. [Google Scholar]
- Friis, C.; Erhardsen, E.; Madsen, E.B.; Nielsen, P.; Raun, K. Respiratory tract distribution and bioavailability of spiramycin in calves. Am. J. Vet. Res. 1991, 52, 1269–1273. [Google Scholar]
- Sanders, P.; Guillot, P.; Dagorn, M.; Delepine, B.; Mourot, D. Pharmacokinetics of spiramycin in cattle. Acta Vet. Scand. 1991, 87, 138–140. [Google Scholar]
- Clarke, A.; Rothery, P.; Isaac, N.J. Scaling of basal metabolic rate with body mass and temperature in mammals. J. Anim. Ecol. 2010, 79, 610–619. [Google Scholar] [CrossRef] [PubMed]
- Sutter, H.-M.; Engeli, J.; Schneider, B.; Riond, J.-L.; Warner, M. Pharmacokinetics and bioavailability of spiramycin in pigs. Vet. Rec. 1992, 130, 10–513. [Google Scholar] [CrossRef]
- Bergogne-Be′re′zin, E. Clinical role of protein binding of quinolones. Clin. Pharmacokinet. 2002, 41, 741–775. [Google Scholar] [CrossRef] [PubMed]
- Toutain, P.L.; Bousquet-Melou, A. Free drug fraction vs. free drug concentration: A matter of frequent confusion. J. Vet. Pharmacol. Ther. 2002, 25, 460–463. [Google Scholar] [CrossRef] [PubMed]
- Benet, L.Z.; Hoener, B.A. Changes in protein binding has little clinical relevance. Clin. Pharmacol. Ther. 2002, 71, 115–121. [Google Scholar] [CrossRef]
- Mckellar, Q.A.; Sanchez Bruni, S.F.; Jones, D.G. Pharmacokinetic/pharmacodynamic relationships of antimicrobial drugs used in veterinary medicine. J. Vet. Pharmacol. Ther. 2004, 27, 503–514. [Google Scholar] [CrossRef]
- Periti, P.; Mazzei, T.; Mini, E.; Novelli, A. Clinical pharmacokinetic properties of the macrolide antibiotics. Clin. Pharmacokinet. 1989, 16, 193–214. [Google Scholar] [CrossRef]
- Elazab, S.T.; Elshater, N.S.; Hashem, Y.H.; Park, S.C.; Hsu, W.H. Pharmacokinetics, tissue residues, and ex vivo pharmacodynamics of tylosin against Mycoplasma anatis in ducks. J. Vet. Pharmacol. Ther. 2020, 43, 57–66. [Google Scholar] [CrossRef]
- Elbadawy, M.; Aboubakr, M.; Abugomaa, A. Pharmacokinetics of tylvalosin in broiler turkeys (Meleagris gallopavo) after single intravenous and oral administration. Front. Vet. Sci. 2019, 6, 355. [Google Scholar] [CrossRef]
- Drugeon, H.B.; Legallou., F.; Caillon., J.M. Cthodes d, Ctudes de I′activite bactkricide. In Bactiricidie; Courvalin, P., Drugeon, H., Flandrois, J.P., Goldstein, F., Eds.; Maloine: Paris, France, 1990; pp. 113–126. [Google Scholar]
- Renard, L.; Sanders, P.; Laurentie, M. Modtlisation de L′effet bacttricide de la spiramycine. Choix dun modtle pharmacodynamique. Vet. Res. 1993, 24, 3345. [Google Scholar]
- Zhou, Q.; Zhang, G.; Wang, Q.; Liu, W.; Huang, Y.; Yu, P.; Fang, B. Pharmacokinetic/pharmacodynamic modeling of tulathromycin against Pasteurella multocida in a porcine tissue cage model. Front. Pharmacol. 2017, 8, 392. [Google Scholar] [CrossRef] [Green Version]
- Huang, Z.; Wu, Y.; Zhou, Z.; Xia, X.; Gu, X.; Cai, Q.; Ding, H. Pharmacokinetic and pharmacodynamic integration and resistance analysis of tilmicosin against Mycoplasma gallisepticum in an in vitro dynamic model. Front. Pharmacol. 2019, 10, 670. [Google Scholar] [CrossRef]
- Huang, L.; Zhang, H.; Li, M.; Ahmad, I.; Wang, Y.; Yuan, Z. Pharmacokinetic-pharmacodynamic modeling of tylosin against Streptococcus suis in pigs. BMC Vet. Res. 2018, 14, 319. [Google Scholar] [CrossRef] [Green Version]
- Xiao, X.; Sun, J.; Chen, Y.; Zou, M.; Zhao, D.H.; Liu, Y.H. Pharmacokinetic and pharmacodynamic analysis of valnemulin against Mycoplasma gallisepticum S6 in Mycoplasma gallisepticum and Escherichia coli co-infected chickens. Vet. J. 2015, 204, 54–59. [Google Scholar] [CrossRef]
- Renard, L.; Sanders, P.; Laurentie, M.; Delmas, J.M. Pharmacokinetic-pharmacodynamic model for spiramycin in staphylococcal mastitis. J. Vet. Pharmacol. Ther. 1996, 19, 95–103. [Google Scholar] [CrossRef] [PubMed]
- Carbon, C. Pharmacodynamics of macrolides, azalides, and streptogramins: Effect on extracellular pathogens. Clin. Infect. Dis. 1998, 27, 28–32. [Google Scholar] [CrossRef] [PubMed] [Green Version]
- Fran Oise, V.B.; Stéphane, C.; Cristina, S.; Hugues, C.; Donatienne, T.; Marie Paule, M.L.; Tulkens, M.P. Cellular pharmacokinetics and pharmacodynamics of the glycopeptide antibiotic oritavancin (LY333328) in a model of J774 mouse macrophages. Antimicrob. Agents Chemother. 2004, 48, 2853. [Google Scholar] [CrossRef] [Green Version]
- Van, B.F.; Tulkens, P.M. Macrolides: Pharmacokinetics and pharmacodynamics. Int. J. Antimicrob. Agents 2001, 18, 17–23. [Google Scholar] [CrossRef]
- Emam, M.; Hashem, Y.M.; El-Hariri, M.; El-Jakee, J. Detection and antibiotic resistance of Mycoplasma gallisepticum and Mycoplasma synoviae among chicken flocks in Egypt. Vet. World 2020, 13, 1410. [Google Scholar] [CrossRef] [PubMed]
- Renaudin, H.; de Barbeyrac, B.; Bebear, C. Study of bactericidal effect of the spiramycin and minocycline on Mycoplasma pneumoniae. Pathol. Biol. 1987, 35, 595–598. [Google Scholar]
- CVMP. Spiramycin (2); Summary Report. London, UK 1994; European Agency for the Evaluation of Medicinal Products: Amsterdam, The Netherlands, 1994. [Google Scholar]
- Frey, M.L. A medium for the isolation of avian mycoplasmas. Am. J. Vet. Res. 1969, 29, 2163–2171. [Google Scholar]
- Furusawa, N. Spiramycin, oxytetracycline and sulphamonomethoxine contents of eggs and egg-forming tissues of laying hens. J. Vet. Med. Ser. A 1999, 46, 599–603. [Google Scholar] [CrossRef] [PubMed]
- EMA. Guideline on Validation of Bioanalytical Methods; EMEA/CHMP/EWP/192217/2009; EMA: Amsterdam, The Netherlands, 2009. [Google Scholar]
- Craig, A.W.; Suh, B. Protein binding and the antibacterial ef‐fects. Method for the determination of protein binding. In Antibiotics in Laboratory Medicine, 3rd ed.; Lorian, V., Ed.; Williams & Wilkins: Baltimore, MD, USA, 1991; pp. 367–402. [Google Scholar]
- Tanner, A.C.; Wu, C.C. Adaptation of the Sensititre broth microdilution technique to antimicrobial susceptibility testing of Mycoplasma gallisepticum. Avian Dis. 1992, 36, 714–717. [Google Scholar] [CrossRef] [PubMed]
- Zhang, N.; Gu, X.; Ye, X.; Wu, X.; Zhang, B.; Zhang, L.; Ding, H. The PK/PD interactions of doxycycline against Mycoplasma gallisepticum. Front. Microbiol. 2016, 7, 653. [Google Scholar] [CrossRef] [PubMed] [Green Version]
- Damte, D.; Jeong, H.J.; Lee, S.J.; Cho, B.H.; Kim, J.C.; Park, S.C. Evaluation of linear regression statistical approaches for withdrawal time estimation of veterinary drugs. Food Chem. Toxicol. 2012, 50, 773–778. [Google Scholar] [CrossRef] [PubMed]
- Toutain, P.L. Antibiotic treatment of animals—A different approach to rational dosing. Vet. J. 2003, 165, 98–100. [Google Scholar] [CrossRef]


| Parameters | IV | Oral |
|---|---|---|
| Cmax (µg/mL) | NA | 4.78 ± 0.30 |
| Tmax (h) | NA | 2.00 ± 0.00 |
| λz (1/h) | 0.22 ± 0.04 | 0.12 ± 0.02 |
| T1/2 λz (h) | 3.97 ± 0.85 | 6.25 ± 0.90 |
| AUC0-last (µg*h/mL) | 29.94 ± 4.74 | 23.11 ± 1.88 |
| AUC0-∞ (µg*h/mL) | 30.25 ± 4.78 | 23.61 ± 1.90 |
| Vz_obs (L/kg) | 3.30 ± 0.52 | -------- |
| Vz_F_obs (L/kg) | -------- | 6.58 ± 0.89 |
| Cl_obs (L/h/kg) | 0.68 ± 0.15 | -------- |
| Cl_F_obs (L/h/kg) | -------- | 0.74 ± 0.05 |
| MRT (h) | 5.04 ± 0.91 | 6.63 ± 0.43 |
| F (%) | -------- | 77.18 |
| Parameter | Units | Mean ± SEM |
|---|---|---|
| Emax | CFU/mL | 10.13 ± 0.97 |
| EC50 | h | 1241.46 ± 355.73 |
| E0 | CFU/mL | 0.32 ± 0.06 |
| Emax-E0 | h | 9.81 ± 0.91 |
| AUC 24 h/MIC for bacteriostatic effect (E = 0) | h | 10 |
| AUC 24 h/MIC for bactericidal effect (E = −2) | h | 185 |
| AUC 24 h/MIC for bactericidal effect (E = −3) | h | 405 |
| AUC 24 h/MIC for bacterial elimination (E = −4) | h | 780 |
| Time Post Last Dose (Days) | Liver | Muscle | Skin and Fat |
|---|---|---|---|
| 1 | 10.45 ± 0.88 a | 2.66 ± 0.47 b | 1.03 ± 0.21 b |
| 4 | 1.99 ± 0.32 a | 0.73 ± 0.11 b | 0.34 ± 0.07 b |
| 7 | 0.85 ± 0.06 a | 0.38 ± 0.06 b | 0.06± 0.01 c |
| 9 | 0.43 ± 0.05 a | 0.05 ± 0.02 b | ND |
| 11 | 0.07 ± 0.02 | ND | ND |
| 13 | ND | ND | ND |
| Analyte | Average Recovery (%) | Precision | Linearity and Range | Sensitivity | ||||
|---|---|---|---|---|---|---|---|---|
| Intra-Day RSD (%) | Inter-Day RSD (%) | Linearity Concentration Range | Calibration Equation | Correlation Coefficient (R2) | LOD | LOQ | ||
| Plasma | 101.93 ± 2.15 | 2.6 | 2.7 | 0.01–20 µg/mL | y = 142.73x + 0.2289 | 0.9999 | 0.003 | 0.01 µg/mL |
| Muscle | 91.69 ± 4.13 | 2.9 | 3.8 | 0.05–20 µg/g | y = 99.938x − 2.3052 | 0.9954 | 0.02 | 0.05 µg/g |
| Skin and fat | 95.20 ± 3.56 | 3.3 | 3.4 | 0.05–20 µg/g | y = 103.88x − 2.7223 | 0.9994 | 0.02 | 0.05 µg/g |
| Liver | 92.09 ± 4.40 | 3.4 | 3.9 | 0.05–20 µg/g | y = 98.526x − 2.6683 | 0.995 | 0.02 | 0.05 µg/g |
Publisher’s Note: MDPI stays neutral with regard to jurisdictional claims in published maps and institutional affiliations. |
© 2021 by the authors. Licensee MDPI, Basel, Switzerland. This article is an open access article distributed under the terms and conditions of the Creative Commons Attribution (CC BY) license (https://creativecommons.org/licenses/by/4.0/).
Share and Cite
Elazab, S.T.; Elshater, N.S.; Hashem, Y.H.; Al-Atfeehy, N.M.; Lee, E.-B.; Park, S.-C.; Hsu, W.H. Pharmacokinetic/Pharmacodynamic Modeling of Spiramycin against Mycoplasma synoviae in Chickens. Pathogens 2021, 10, 1238. https://0-doi-org.brum.beds.ac.uk/10.3390/pathogens10101238
Elazab ST, Elshater NS, Hashem YH, Al-Atfeehy NM, Lee E-B, Park S-C, Hsu WH. Pharmacokinetic/Pharmacodynamic Modeling of Spiramycin against Mycoplasma synoviae in Chickens. Pathogens. 2021; 10(10):1238. https://0-doi-org.brum.beds.ac.uk/10.3390/pathogens10101238
Chicago/Turabian StyleElazab, Sara T., Nahla S. Elshater, Yousreya H. Hashem, Nayera M. Al-Atfeehy, Eon-Bee Lee, Seung-Chun Park, and Walter H. Hsu. 2021. "Pharmacokinetic/Pharmacodynamic Modeling of Spiramycin against Mycoplasma synoviae in Chickens" Pathogens 10, no. 10: 1238. https://0-doi-org.brum.beds.ac.uk/10.3390/pathogens10101238