
Variables Affecting the Recovery of Acanthamoeba Trophozoites


R&D Microbiology, Alcon Research, LLC, Fort Worth, TX 76134, USA
*
Author to whom correspondence should be addressed.
Pathogens 2021, 10(2), 221; https://0-doi-org.brum.beds.ac.uk/10.3390/pathogens10020221
Submission received: 26 January 2021
/
Revised: 15 February 2021
/
Accepted: 16 February 2021
/
Published: 18 February 2021
(This article belongs to the Special Issue New Insights in Acanthamoeba)
Abstract
:While the results of Acanthamoeba testing have been extensively published, laboratories conducting such testing are left to develop their own methods in the absence of a standardized methodology. The wide disparity of methods has resulted in equally inconsistent reported results for contact lens care (CLC) products. This study’s objective was to determine the source of these discrepancies by evaluating basic Acanthamoeba biology and their impact on antimicrobial efficacy testing, including the ability of a recovery method to stimulate a single trophozoite to proliferate. Antimicrobial efficacy testing was conducted using well-published Acanthamoeba strains, storage conditions, and growth-based recovery methods. To identify variables that influence results, test solutions with low Acanthamoeba disinfection rates were utilized to prevent differences from being masked by high log reductions. In addition, single-cell proliferation assays were executed to understand the growth requirements to stimulate trophozoite propagation in two recovery methods. These studies indicated that both nutrient density (>106 CFU) and the length of plate incubation (at least 14 days) could significantly influence the accurate recovery of trophozoites. Together, this study emphasizes the need to understand how Acanthamoeba trophozoites biology can impact test methods to create divergent results.
1. Introduction
Acanthamoeba keratitis is a blinding eye infection, most often associated with contact lens users and poor contact lens care compliance [1,2,3,4,5]. Acanthamoeba, a biphasic protist, is found ubiquitously in nature with a preference for soil–water interfaces [6,7,8]. As a bacterivore, Acanthamoeba rarely causes opportunistic infections in humans and animals but has been associated with keratitis outbreaks in the United States and England [9,10,11,12,13,14,15]. Acanthamoeba keratitis stories have been widely reported in mainstream news, highlighting high-risk behaviors such as swimming with contact lenses and poor contact lens hygiene [16,17,18,19]. Since 2009, the FDA and other regulatory bodies have been urged to include Acanthamoeba as a standard microorganism to evaluate the antimicrobial efficacy of new contact lens care products [20]. Previous Acanthamoeba outbreaks have been associated with ineffective anti-Acanthamoeba activity of a contact lens care (CLC) product [21], and for this purpose, it is common for CLC manufacturing companies to highlight their Acanthamoeba efficacy for marketing. Likewise, other keratitis outbreaks, such as the Fusarium outbreak in 2005, were also a result of poor antimicrobial efficacy of CLC products [22]. Current requirements for registering a new CLC product require significant antimicrobial efficacy against common eye pathogens with representative species of bacteria, yeast, and mold [23]. Acanthamoeba has not been included in current standards, and no regulatory requirement exists for CLC products to show efficacy against any form of Acanthamoeba. Standardization of Acanthamoeba testing is challenging due to its unusual methods of cultivation and recovery requirements, which differ from most standard microbiological methods [23].
Without a regulatory standard, CLC manufacturing companies are left to develop their own methods for testing their products for antimicrobial efficacy against Acanthamoeba. Acanthamoeba biology further complicates testing by having two phases, the infective, mobile trophozoite phase and the drug-resistant, inert cyst phase [24]. These two forms possess radically different biocidal resistance and require special cultivation to generate homogenous populations essential for understanding the efficacy of a CLC product [25,26,27]. Finally, numerous variables such as recovery, cultivation, nutrient source, Acanthamoeba strain and source, neutralization [27,28,29], and quantification method have led to divergent methods that rarely, if ever, result in similar antimicrobial efficacy results [27,28,30,31,32,33]. As such, any antimicrobial efficacy testing done with Acanthamoeba must be critically scrutinized to evaluate the validity of the results. Rapid methods such as Alamar blue and flow cytometry have yet to gain traction as a suitable alterative as results based on percent viability rarely agree with traditional methods of efficacy testing (i.e., log reductions based on serial dilutions and growth recovery [34,35,36,37]), though recently, we have described a propidium iodide staining method that showed a strong correlation with recovery-based testing [38].
The current Acanthamoeba antimicrobial efficacy test most prevalent in the literature is loosely based on FDA 510k [39] and International Standards Organization (ISO) 14729 [23], wherein a set concentration of Acanthamoeba is inoculated into CLC aliquots and the CLC solutions are allowed to disinfect for the general time a contact lens would be expected to soak in the solution. The CLC is then neutralized based on its active ingredients, and Acanthamoeba is recovered from the solution. The surviving Acanthamoeba concentration is then determined. Each step of this process has numerous iterations that could ultimately affect the results, and efforts have been ongoing for several years to standardize the testing of Acanthamoeba disinfection efficacy of CLC products. The FDA, along with the American Academy of Ophthalmology, American Academy of Optometry, American Optometric Association, the Contact Lens Association of Ophthalmologists, and Contact Lens Institute conducted a Product Workshop to discuss the current gap in Acanthamoeba testing in 2009 [40,41]. Since then, no antimicrobial efficacy standards have been adopted, although numerous labs including academic, industrial, and governmental labs have published papers on the subject [27,42,43,44,45,46,47,48]. In 2015, an international standard (ISO 19045) was published to address the potential for CLC products to induce Acanthamoeba encystment [49]. This standard recommends all CLC manufacturers to assess their CLC products for their ability to induce Acanthamoeba trophozoites to encyst within 24 h [49]. The ability to induce encystment was found to be the major risk factor for the outbreak associated with Advanced Medical Optics Complete MoisturePlus Multi-Purpose Solution where propylene glycol was found to stimulate encystment [12].
In this paper, we examine the impact of basic Acanthamoeba biology and the potential pitfalls that prevent the development of robust testing methods for evaluating Acanthamoeba trophozoites. We also emphasize how Acanthamoeba can be set to deliver differential results even when using laboratory strains. Finally, we make general recommendations around Acanthamoeba testing and highlight techniques that laboratories can use to ensure their methods are reproducible and valid.
2. Results
2.1. Antimicrobial Efficacy Testing
2.1.1. Stand-Alone Procedure
The susceptibility of the two strains of Acanthamoeba to common CLC biocides was evaluated by combining all log reduction data (recovery method and source) to establish the total log reductions for each strain following plate incubation times of Day 7, Day 14, and Day 21 (Figure 1). The impact of longer plate incubations (Day 7 vs. Day 14 vs. Day 21) was also assessed to examine the changes in cell concentration and log reduction over time. Acanthamoeba ATCC 50370 had statistically lower log reductions after exposure to Solutions 1 and 2 regardless of the length of plate incubation (p < 0.05) (Figure 1). For both Acanthamoeba ATCC 30461 and Acanthamoeba ATCC 50370, Solution 1 showed the highest antimicrobial efficacy (p < 0.01 for all days with both 12-well and 96-well recovery methods). Log reduction changes between Day 7, Day 14, and Day 21 were observed for both strains and all three solutions because of changing cell concentrations (additional positive wells) between incubation time points. The differences in biocide resistance for the two strains are evident, suggesting inherent differences in strain susceptibility.
The impact of the three storage methods (ATCC, Cryo, Plug) of long-term Acanthamoeba maintenance (“source”, i.e., prepared directly from ATCC aliquots, revival of a cryogenically frozen sample, or use of prepared Acanthamoeba plugs) on antimicrobial efficacy were evaluated by comparing the log reductions for each solution/strain regardless of the recovery method (i.e., recovery using a 12-well or 96-well plate). No difference in recovery across all three solutions was seen between any storage methods (ATCC, Cryo, Plug) of Acanthamoeba for ATCC 50370 by Day 21 plate read (Figure 2). For ATCC 30461, the only statistical difference that was maintained through Day 21 plate incubation was for Solution 2, where the source “Plug” had a higher log reduction compared to “ATCC”. Together, this experiment indicated that long-term maintenance/storage methods as described did not result in an increase or decrease in biocidal susceptibility for the majority of the solutions tested.
2.1.2. 12-Well Versus 96-Well Recovery Methods
To establish if the two recovery methods (12-well and 96-well) could equally recover unchallenged Acanthamoeba trophozoites, the inoculum controls of all tests and sources were compared (Figure 3). For each Test/Source/Strain combination, Acanthamoeba trophozoites originated from the same suspension for both inoculum control recovery methods (12-well and 96-well). For both strains, the two methods showed statistically significant differences in the amount of recovery of the Inoculum Controls at Day 7 (Figure 3). For the 96-well, statistically significant differences in recovery were seen for both strains when comparing Day 7 to Day 14 or Day 21. No difference was seen for the 12-well Inoculum Controls when comparing different plate incubation times.
The impact of the two recovery methods on biocide susceptibility was evaluated for both Acanthamoeba strains (Figure 3). The log reductions were calculated using the plate concentrations recorded following plate incubations of 7, 14, and 21 days. The 96-well demonstrated different log reductions between Day 7 vs. 14 vs. 21 for both Acanthamoeba strains and all three solutions because of changing cell concentrations in either the inoculum controls or the test solution plates (or both). In contrast, no changes in log reduction were observed in the 12-well plate recovery method between Day 14 and Day 21. Statistically significant differences between the two recovery methods were observed for all three solutions for both strains (ATCC 50370 and ATCC 30461) at Day 7. The results obtained on Day 21 were statistically different for the 96-well plate for all Solution/Strain combinations compared to the results obtained on Day 7, whereas the 12-well plate only had a statistically significant difference for ATCC 30461 Solution 3 when comparing Day 7 to Day 21. Together, this indicates that the length of incubation dictated the efficacy obtained in a test.
The overall trends of how log reductions and inoculum controls changed between increasing plate incubation times were graphed (Figure 4). For ATCC 30461, the 12-well recovery demonstrated an increase in log reductions between Day 7 and Day 14, followed by no change. In contrast, the 96-well recovery decreased between Day 7 and Day 21, dropping from 1.4 to 0.7 for Solution 1. For ATCC 50370, the greatest change was observed in the inoculum control, which increased from 2.2 to 4.8 between Day 7 and Day 21.
2.1.3. Minimum Plate Incubation Time for Accurate Results
To understand the minimum incubation time needed to obtain accurate final results, the days to final concentration were evaluated for each Solution/Strain/Recovery method combination (Figure 5). For ATCC 30461, the inoculum control recovered statistically faster in the 12-well recovery method than the 96-well recovery method, which was also true for Solution 1 and Solution 3. By comparison, ATCC 50370 recovered statistically faster in the Inoculum Control, Solution 2, and Solution 3 in the 12-well plate versus the 96-well plate. ATCC 30461 had a statistically earlier average day of final concentration for the Inoculum Control for both recovery methods compared to ATCC 50370. The 12-well recovery method reached a final concentration before Day 14 for all strains and solutions tested.
The table in Figure 5 indicates all Strain/Test Replicate/Recovery Method/Test Solutions, where at least one plate reached a final concentration after Day 14. With ATCC 50370, every test, solution, and inoculum control had 96-well plates reach a final concentration after Day 14.
2.1.4. Single-Cell Proliferation Testing
To determine the effect of recovery method and nutrient density (amount of available Escherichia coli), single-cell viability was examined in 12-well and 96-well plates using three different E. coli densities (low 106, mid-106, and 107 CFU) for up to 65 days. The average viability (percentage of seeded wells demonstrating active trophozoites by day 65) of single trophozoites for both untreated (inoculum control) and Solution 2 samples are shown for both strains of Acanthamoeba for all recovery methods and E. coli concentrations (Figure 6). Acanthamoeba ATCC 50370 showed >90% viability within the inoculum control for both E. coli concentrations for the 12-well recovery method, as well as the Mid-106 and 107 CFU E. coli per well for the 96-well plate. In contrast, ATCC 30461 showed between 58–79% viability for both recovery methods tested for the inoculum control. Low 106 CFU E. coli per well resulted in limited recovery compared to all other nutrient density and recovery methods for ATCC 50370 for both the inoculum control and Solution 2. ATCC 30461 showed lower viability for the inoculum control compared to Solution 2, indicating that the nonviable cells were not available to be selected for seeding in the Single-cell experiment.
The percentage of viable wells (percent positivity) was also measured at regular time points between Day 7 and Day 65 to determine the time required to achieve trophozoite activity. For ATCC 50370, a nutrient density of 107 E. coli per well, regardless of 12-well or 96-well recovery method, resulted in 100% of positive wells occurring by Day 7 for the inoculum control (Figure 7). In contrast, both the Low and Mid-106 E. coli per well of the 96-well recovery method continued to have new positive wells through Day 50. For ATCC 30461 inoculum control, all recovery methods demonstrated 100% positivity by Day 14, with the 12-well and the 96-well at Mid-106 and 107 E. coli densities producing no additional positive wells after Day 7 (Figure 8). For Solution 2, Acanthamoeba ATCC 50370 demonstrated 100% positive wells by Day 7 for the 12-well and the 96-well with 107 CFU E. coli (Figure 7). In contrast, the Mid-106 E. coli concentration did not reach 100% positivity until Day 21 and Low 106 E. coli concentration not until Day 35. ATCC 30461 demonstrated 100% positivity by Day 7 for all recovery methods except 107 CFU E. coli (Figure 8).
2.1.5. Microscopy Observation and Impact of E. coli on Acanthamoeba Growth
The amount of E. coli available for Acanthamoeba to consume had a significant impact on trophozoite proliferation. For high-density E. coli wells, trophozoite proliferation resulted in Acanthamoeba cells numbered in the hundreds to thousands. Proliferation was generally complete by 7 days where all E. coli had been consumed and were no longer visible (Figure 9). In many cases, confluent wells contained homogenous populations of cysts after Acanthamoeba had completely consumed the available food source (E. coli) and then encysted in response to both starvation and trophozoite density. In comparison, in Low-E. coli wells, single trophozoites were visible in very low concentrations (<50, often less than 10), and E. coli was still visibly present and had not been completely consumed (Figure 9). The impact of E. coli density on Acanthamoeba trophozoite proliferation was evident for both inoculum controls and Solution 2 (Figure 9).
The individual wells that failed to show proliferation of trophozoites for long periods were photographed at different intervals. Random wells of each condition were photographed at each time point in order to capture a well becoming positive after prolonged incubation with no previous evidence of proliferation. Within ATCC 30461, only two wells failed to become positive by Day 7 regardless of recovery or E. coli density (Figure 8). Thus, a well from the Mid-106 E. coli concentration was viewed at Day 7, 14 and 21, despite being positive at Day 7 (Figure 10). For this well, no visible increase in Acanthamoeba could be seen, and Acanthamoeba were encysted with no visible E. coli by Day 7 (Figure 10). Once Acanthamoeba were encysted and the E. coli were consumed, the well ceased to change, as indicated by the arrows showing identical cysts on Day 14 and Day 21 (Figure 10). In contrast, ATCC 50370 had numerous wells in the 96-well that failed to become positive for extended periods (Figure 8, Figure 10 and Figure 11). Figure 10 and Figure 11 show several example wells of ATCC 50370 failing to proliferate over extended periods. While trophozoites were clearly present as indicated by later positive scoring, the lack of obvious visible trophozoites establishes that Acanthamoeba ATCC 50370 can sit dormant and forestall binary fission for many days. Less than 50 trophozoites were visible in wells, but a reduction of E. coli is also evident (Figure 12). Similar results were seen for other inoculum control wells with extended periods of no visible proliferation. Acanthamoeba trophozoites were not visible for as long as 35 days before low numbers of trophozoites were finally visible with a general decrease in E. coli (Figure 11). In wells with extended stasis of Acanthamoeba, Acanthamoeba failed to proliferate above a density of 20–50 trophozoites (Figure 11). More importantly, even wells that showed proliferation at earlier time points failed to show a significant increase in trophozoite numbers over time (Figure 11). Similar results were observed for ATCC 50370 after exposure to Solution 2, where limited E. coli concentration impacted both the speed of proliferation and the quantity of trophozoites (Figure 11). The decrease in E. coli was seen following visible proliferation, indicating that significant feeding on the E. coli did not occur until visible trophozoites were seen in the well (Figure 11 and Figure 12). Of note, ATCC 50370 struggled to proliferate at both the Low and Mid-106 E. coli for both the inoculum control and Solution 2, indicating the phenomena is not isolated to challenged organisms.
Twenty wells of ATCC 50370 in the 96-well plate failed to show visible proliferation after Day 14, compared to one well of ATCC 30461 (Figure 7 and Figure 8). Of all positive wells seeded in the 96-well plate regardless of concentration (111 wells, Figure 6), 20 wells (representing 18%) failed to proliferate within 14 days (Figure 7 and Figure 8). In contrast, ATCC 30461 had one well of 127 positive wells (or 0.8%) in the 96-well recovery method that failed to proliferate within 14 days (Figure 7 and Figure 8).
3. Discussion
3.1. Antimicrobial Efficacy
Many laboratories have developed their own test methods for evaluating efficacy against Acanthamoeba trophozoites while waiting for standards to be developed and approved by regulatory bodies. An extensive array of methods have been published in the literature, and just as widespread are the results reported therein [28,29,32,35,42,43,44,45,46,47,48,50,51,52,53,54,55,56,57,58,59]. While standardization of methods is underway by regulatory agencies, our study was meant to ask more fundamental questions around handling, testing, and recovering of Acanthamoeba trophozoites than may have been assessed in the past.
The two strains chosen for this study are well described in the literature [50]. Many laboratories use internal strains [43,58], isolated from the environment or clinical sources [51,59] as well as those available from ATCC [42,44]. This study has shown the importance of standardizing the strains used, as, while both strains were phylogenetically T4 [60], the strains demonstrated different responses to the test formulations and to the test itself. Our recommendation is that utilizing multiple standard Acanthamoeba strains with different resistance to biocides is important to fully characterize the efficacy of a product.
The ability of a laboratory to maintain and culture Acanthamoeba is critical in producing the homogenous populations of trophozoites needed for use in testing. This study has shown that storage methods do not affect susceptibility to biocides and do not account for the variability seen in the literature. However, long-term passaging in axenic culture has already been established to impact efficacy [52,61,62,63,64]. Genetic drift in long-term cell passages is a known phenomenon [39,65] and is one of the main reasons that most standards require testing within five passages of ATCC [66]. Our recommendation is that laboratories can utilize cryogenic storage or agar plugs to maintain their Acanthamoeba stocks (specifically for ATCC 50370 and ATCC 30461) without impacting efficacy.
The efficacy test for Acanthamoeba has generally the same steps for most methods that are based on recovery of live organisms: (1) Acanthamoeba are inoculated into testing formulations; (2) formulations are sampled and neutralized; (3) samples are serially diluted, and Acanthamoeba are recovered on a nutrient source (E. coli and Enterobacter aerogenes) [67,68,69]; (4) Acanthamoeba quantification occurs through a version of calculating a 50% endpoint using Reed and Munch [70], Spearman Karber [71], or Most Probable Number [33]. The recovery format varies from petri dishes [28,51,72] to 96-well plates [27], but the concept is the same, and overall the methods generally mimic the test outlined in ISO 14729 for bacteria, yeast, and mold [23]. Changes in recovery plate format over time reflect the optimization that laboratories are attempting to be able to execute larger tests with fewer resources and consumables.
This study evaluates only two recovery methods, though there are many variations. There are advantages and disadvantages to executing either method. While culturing Acanthamoeba is labor-intensive regardless of the method, recovery on 96-well plates requires fewer consumables and is easier to execute with a large number of test samples since a single 96-well plate can hold the equivalent number of samples as six 12-well plates. The agar dispensation into the 12-well requires a more advanced setup compared to 96-well, which can be immediately filled before testing. Execution between the two methods is very different. The 96-well requires both small volume pipetting and the use of multichannel pipetting for sample mixing and serial dilution, which are technical challenges and can easily introduce errors. The 12-well with its large volume pipetting and reliance on vortexing tubes for mixing is less likely to experience unintended errors because of operator error. Additionally, 96-well plates require taping to prevent dehydration, and the handling could easily result in unintended well-to-well transfer of liquid and, by extension, trophozoites. Taping is generally not required for 12-well plates as the agar provides a barrier from over-drying. While incubation is the same for either method, plate reading is easier with the 96-well plate as fewer plates are needed and the 96-well has only one plane of viewing. The 12-well plate can require continuous refocusing to adjust the viewing plane of the microscope due to agar height, which can slow down scoring. This can be mitigated by preventing dehydration of the agar in a humid incubator and precision in the initial filling of the 12-well plates. Despite these seemingly numerous advantages to using a 96-well recovery method, the 96-well plates consistently produced lower densities of Acanthamoeba that could easily be misread or time-consuming to identify. The 96-well plate additionally requires significant expertise in recognizing single or low numbers of trophozoites as well as differentiating trophozoites from clumps of E. coli. The clumping of E. coli can easily mimic trophozoites but is generally only seen in liquid environments, not on agar. Thus, 12-well plate recovery provides a significant advantage by promoting faster, more uniform Acanthamoeba growth while also providing an environment that reduces operator variability in identification of Acanthamoeba proliferation.
The conclusion from these investigations is that the major sources of differential results seen in Acanthamoeba efficacy testing are incubation time of recovery plates and, by extension, E.coli concentration. Our initial study using three different low-efficacy solutions served to evaluate strains, biocide susceptibility, and the impact of storage on efficacy (Figure 1, Figure 2, Figure 3 and Figure 4). This study also assumed the two recovery methods would have similar Acanthamoeba recovery results (cell/mL) since both methods are well described in the literature [27,45,50] and have the same basic premise. Our decision to read plates across multiple time points stems from the wide disparity in the literature of when results were recorded [27,29,45,50,73] and wanting to compare speed of recovery for injured and uninjured Acanthamoeba. However, we realized while observing plates that there was a vast difference in Acanthamoeba response within the plates themselves. For the 12-well plates, significant Acanthamoeba proliferation was visible as early as Day 1, with most plates reaching final concentration between Day 3 and Day 7. In comparison, almost no growth or visible trophozoites were seen on Day 1 in the 96-well, regardless of strain, in spite of the significantly smaller surface area we had to view and the expectation that low numbers of trophozoites would be evident sooner in the 96-well compared to the 12-well. The slow attainment of final concentration by the 96-well, even in the inoculum control, was surprising and concerning as was the low density of trophozoites in the 96-well that we observed in the initial Antimicrobial Efficacy study (Figure 5). As our E. coli concentration was dictated by the literature, we had not initially considered that to be the main determining factor as to why Acanthamoeba proliferated so slowly within the 96-well. Indeed, we assumed that a lower concentration of E. coli in the 96-well would be suitable given the working volume (180 μL solutions + 50 μL E. coli) [27] compared to the 12-well (1000 μL solution + 100 μL E. coli) [47] as well as the available growth surface area (0.32 cm2 vs. 3.8 cm2, respectively). Nor did we predicate that Acanthamoeba would be highly sensitive to the nutrient density such that 2.2 × 10⁶ E. coli resulted in such a different Acanthamoeba response and confluency compared to 5.0 × 10⁶ E. coli. Following the results of our initial experiment, we considered what would drive the observed slower proliferation. The two most likely variables were sample volume, as wells within a 96-well plate may consistently have wells containing only single trophozoites, and nutrient density available for Acanthamoeba consumption. The Single-Cell Proliferation assay (Figure 6, Figure 7 and Figure 8) was meant to address both.
3.2. Single-Cell Proliferation Assay
As shown by the inoculum control plate images, the relative density of Acanthamoeba being defined by the nutrient density was expected: higher E. coli density led to greater Acanthamoeba proliferation. However, the Single-Cell proliferation assay demonstrated that Acanthamoeba could prevent abundant proliferation for extended periods (50 days) based on nutrient density. Equally surprising, the phenomenon was strain-specific as ATCC 50370 consistently demonstrated in the 96-well plate that it found low 106 CFU E. coli to be insufficient to trigger confluent proliferation. More critically, small groups of trophozoites could potentially elect to limit proliferation, suggesting a level of communication between trophozoites. In contrast, ATCC 50370 was successful in proliferating in the 12-well plate with low concentrations of E. coli (Figure 6 and Figure 7), indicating that the communal proliferation suppression was not communicated in the 12-well plate as it was in the 96-well plate.
While Acanthamoeba are well-known to respond to chemotactic and intercellular signals [74,75], especially related to encystment [76,77], to our knowledge, this is the first reporting of Acanthamoeba communally limiting proliferation in response to nutrient density. From this, we have developed two postulations regarding a trophozoite population in stasis: (1) small numbers (<10) of Acanthamoeba trophozoites buried themselves under E. coli while feeding, and E.coli density provided sufficient cover, preventing detection under the microscope and/or (2) the Acanthamoeba limit their proliferation to prevent overgrazing on the limited E. coli population until the E.coli density reaches a critical point and trophozoite proliferation was triggered to increase the number of cells for eventual encystment. Successive images of the same wells showed how E. coli appearance and density changed over time, indicating not only the presence of Acanthamoeba but the movement as well. As cysts would be obvious due to autofluorescence [78], the Acanthamoeba must have remained trophozoites but were not viewable across many time points and under intense scrutiny as all wells were reviewed carefully at every time point. The trophozoites then become visible once the E. coli density decreased to the point that there are no potential visual obstacles provided by the bacteria. We believe that E.coli must be at the right concentration to guarantee the proliferation of Acanthamoeba trophozoites, which subsequently makes the Acanthamoeba so abundant that scoring results are clear to any scientist performing the test. Similarly, we consistently observed <20 trophozoites in 96-well wells that contained low 106 CFU E. coli initially, which suggests a communal effort to avoid proliferation (Figure 13). Acanthamoeba were also observed to be encysted even when E. coli was still present in the low-E. coli wells. In contrast, in the high-density E. coli wells, Acanthamoeba proliferated to confluency and completely consumed the E. coli. The intercellular signaling that occurred in the 96-well plates for ATCC 50370, which limited proliferation, did not occur in the 12-well plate as shown by the low E. coli results. It is likely that the cell signaling was simply not strong enough to transmit across the larger surface area of the 12-well plate or that the agar itself disrupted the signaling because the water environment is not continuous across the surface throughout incubation. It is a logical conclusion that the different controls and chemotactic responses exist for Acanthamoeba based on nutrient density and their own density given their adaptability in the environment [79,80]. Importantly, the fact that a small group of Acanthamoeba could contain their population and graze minimally for such extended periods (up to 50 days, as we have demonstrated here) has connotations in all areas of Acanthamoeba research, not just efficacy testing. Further, this leads to heightened concern when considering the accuracy of Acanthamoeba cyst efficacy testing, where recovery methods have to stimulate both excystment and then proliferation.
Following the observations in both experiments, we have formulated recommendations regarding the conduction of testing with Acanthamoeba trophozoites. While we did not see significant differences between methods at longer plate incubations (Day 21), we recognize that higher efficacy solutions could intensify differences that are seen. If a laboratory desires to use a 96-well recovery format, sufficient concentrations of E. coli are needed with the understanding that the threshold of E. coli to stimulate proliferation in trophozoites was narrow for the 96-well but not the 12-well plate. Our recommendation is that, when preparing for efficacy testing, laboratories should ensure they are observing confluent proliferation of trophozoites rapidly following recovery. When analyzing conflicting literature results on the efficacy of a solution, we need to examine the recovery method critically, including the nutrient source and density, as well as the day the results were read. Earlier reads prior to 14 days guarantee incorrect results as established by the testing in this study and the literature contains a large number of studies that reported results at Day 7. The impact of incorrect test results may be minimal with low efficacy solutions but with high efficacy solutions, and 1 to 2 wells being incorrectly scored may be the difference between being able to differentiate between formulations. Failure to trigger significant proliferation in trophozoites requires scientists to identify single or low numbers of trophozoites in wells and differentiate them from E. coli, such that significant technical expertise is then required to conduct testing. Our recommendation is that laboratories should incubate plates at least 14 days to ensure all wells containing one trophozoite could proliferate to the point of being easily identifiable as positive.
Lastly, ATCC 30461 was cultured to maximize homogenous populations of trophozoites, including 24-hour scale-ups prior to testing to ensure the health of the cell population. In spite of this, the Single-Cell Proliferation assay demonstrated that a significant nonviable population (up to 40%) was present in ATCC 30461 suspension that was not identifiable under the microscope. This nonviable population was not detected following exposure to Solution 2, suggesting that nonviable cells were lysed in response to biocide exposure. ATCC 50370 did not show a similar nonviable population in the Single-Cell Proliferation experiment and had identical culturing conditions. The impact on antimicrobial efficacy testing in the presence of a nonviable population highlights the need to always base initial Acanthamoeba concentrations on recovery plate methods and not on hemocytometer cell counts, which rely on identifying viable Acanthamoeba visually. For the Single-Cell Proliferation experiment, all cells selected under the microscope were chosen with criteria meant to identify only healthy cells, including the presence of food cups and pseudopodia, as well as excluding any rounded cells or cells displaying pre-encystment characteristics. Our recommendation is that inoculum control plates should always be used for calculating log reductions rather than relying on the counts from a hemocytometer. The hemocytometer cannot accurately identify viable Acanthamoeba and can overestimate the number of Acanthamoeba when there is a nonviable amoeba within the initially seeded population, which can lead to artificially inflated antimicrobial efficacy results.
4. Materials and Methods
4.1. Antimicrobial Efficacy Testing
4.1.1. Strains and Long-Term Maintenance of Acanthamoeba Cultures
Two commonly utilized strains of Acanthamoeba (ATCC 50370 and ATCC 30461) from the American Type Culture Collection were evaluated for the antimicrobial efficacy studies [27,45,53]. To evaluate differences in long-term storage methods (“source”), Acanthamoeba were maintained/stored over time in three independent ways. First, Acanthamoeba were freshly obtained from ATCC prior to testing and immediately put into “master cultures” as described below. This “source” was referred to as “ATCC”. Second, Acanthamoeba was obtained from ATCC and maintained in cryogenic storage for approximately 7 years prior to testing and was referred to as “Cryo”. Finally, Acanthamoeba was obtained from ATCC and maintained on non-nutrient agar plugs without bacteria as cysts for <1 year, prior to inoculation into “master cultures”. This method of Acanthamoeba maintenance was referred to as “Plug”.
4.1.2. Master Cultures and Scale-Up
Acanthamoeba from each of the three long-term storage methods were seeded into T75 flasks containing 30 mL of Axenic Culture Media 6 (AC6) to create “master cultures” and were incubated at 28 °C. AC6 is a semidefined axenic medium comprising: Biosate Peptone (BBL; Becton, Dickinson and Company, Oxford, UK) 20.0 g; glucose 5 g; KH2PO4 0.3 g; vitamin B12 10 μg; l-methionine 15 mg per liter of deionized water. The pH was adjusted to 6.5 to 6.6 with 1 M NaOH before autoclaving at 121 °C for 15 min and storage at room temperature for use within 2 months. Flasks were incubated until Acanthamoeba were near confluency. Twenty-four hours prior to antimicrobial efficacy testing, master cultures were selectively harvested for adherent trophozoites and seeded into T150 flasks with 75 mL of fresh AC6. Test flasks were incubated at 28 °C overnight. This scale-up ensured homogenous populations of trophozoites.
4.1.3. Trophozoite Harvest and Quantification
On day of test, adherent trophozoites were harvested by pouring off AC6 media and adding 30 mL of ¼ Ringers solution (Oxiod, Basingstoke, UK) to each test flask. Flasks were struck to remove adherent trophozoites and then transferred to 50 mL conical vials. Trophozoites were spun down at 500 g and washed three times with ¼ Ringers solution. Stock trophozoites were adjusted to a concentration of 5.0 × 10⁶ cells/mL for all antimicrobial efficacy testing.
4.1.4. Test Solutions
The three test solutions were prepared with common CLC active ingredients and are listed in Table 1.
4.1.5. Stand-Alone Procedure
Acanthamoeba from each source (ATCC, Cryo, Plug) was inoculated into 10 mL of each solution, in triplicate. Two independent antimicrobial efficacy tests (consisting of equal replicates of all variables) were conducted with separate inoculum controls. Inoculated test solutions were incubated at room temperature for four hours, as a common disinfection time for CLC products. After four hours, Acanthamoeba were recovered and plated in two independent methods as described in “12-well versus 96-well Recovery methods and plate scoring” (Figure 14).
4.1.6. 12-Well Versus 96-Well Recovery Methods and Plate Scoring
For each Strain/Source/Solution combination, the test solutions were neutralized and the Acanthamoeba was recovered in two independent recovery methods (Figure 14). For the 12-well recovery method, a 12-well plate with 2 mL of non-nutrient agar was prepared in advance and allowed to solidify [47]. Each well was inoculated with 1.0 × 10⁷ CFU/well of Escherichia coli (E. coli ATCC 8739) before Acanthamoeba was added to the plates. One mL of a test solution was put into a tube of 9 mL of lethicin/polysorbate 80 to neutralize the biocides [46,47,54,55,56,57]. Five serial dilutions were created by adding 1 mL of a dilution to 9 mL of ¼ Ringer’s solution. To plate into a 12-well plate, 1 mL of each dilution (−1 through −6) was plated in quadruplicate across four wells. Each replicate/solution/source combination had two 12-well plates to cover dilutions 10−1 to 10−6 as previously described. All 12-well plates were taped and incubated at 28 °C.
For the 96-well recovery method, 20 µL of the test solution was dispensed into 180 µL of lethicin/polysorbate 80 in quadruplicate across a 96-well plate as described by Kilvington et al. [27]. A multichannel pipette was used to serially dilute the 96-well plates by removing 20 µL of the test solution/lethicin/polysorbate 80 (10−1) and dispensing it in 180 µl of ¼ Ringers solution. Successive dilutions were created across the 96-well plate to the 10−6. Each well was inoculated with E. coli (low 106 CFU/well: 2.2 × 10⁶ CFU) based on methods previously published [27,45,72,81]. Following the addition of E. coli to each well, all 96-well plates were taped and incubated at 28 °C.
4.1.7. Acanthamoeba Quantification and Days to Final Concentration
At Days 1, 3, 7, 10, 14, and 21, all Acanthamoeba recovery plates were scored to determine positive and negative wells. This score (number of positive wells/dilution) determined the surviving Acanthamoeba concentration of that plate on that day using Reed Munch 50% endpoint calculations [70]. The day of final concentration was determined based on the day that no additional positive wells were observed in subsequent time points. The day of final concentration was thus identified as the minimum incubation time to achieve final cell concentration results for the test sample or control plate. Using day 14 and day 21 concentrations, log reductions were calculated by subtracting the log survivor cell concentrations for each test solution from the initial log inoculum control concentrations. Student t-tests were conducted on inoculum control concentrations, log reductions, and day of final concentration results using unequal variance.
4.2. Single-Cell Proliferation Testing
4.2.1. Culturing Procedure for Acanthamoeba Single Cells
Both strains of Acanthamoeba (ATCC 50370 and ATCC 30461) were evaluated during single-cell proliferation assays. Acanthamoeba strains were cultured, scaled up, and harvested as described for antimicrobial efficacy studies. Acanthamoeba were inoculated into either 10 mL of ¼ Ringers solution or Solution 2 (Table 1) at a final concentration of approximately 5.0 × 10⁴ cells/mL. Solution 2 was chosen as it demonstrated intermediate antimicrobial efficacy compared to Solution 1 (highest) and Solution 3 (lowest) (Figure 1). For inoculum control, Acanthamoeba was inoculated into ¼ Ringers solution and was plated immediately at Time Zero. For Solution 2, Acanthamoeba/Solution 2 samples were incubated for four hours prior to neutralization of the biocide.
One milliliter of each inoculum control was removed and placed in 9 mL of ¼ Ringers solution and 1 mL inoculated Solution 2 was removed and placed in 9 mL of lethicin/polysorbate 80 to neutralize the biocide. Further dilutions were conducted as needed to adjust the Acanthamoeba concentration for single-cell isolation. These steps were intended to mimic antimicrobial efficacy testing such that the Acanthamoeba trophozoites were treated identically as they were in the antimicrobial efficacy studies until plating where they were diluted and individual trophozoites placed in separate wells.
4.2.2. Single-Cell Seeding
The inoculated Ringers/Acanthamoeba suspensions were poured into petri dishes and viewed under a Nikon Ti microscope at 10× magnification. Individual trophozoites were removed from the suspension using a 10 µL micropipettor. For each strain, single Acanthamoeba trophozoites were plated in replicates of 24 for each solution, recovery method, and E. coli concentration (Figure 15). Trophozoites were plated sequentially, first 24 replicates into the 12-well with non-nutrient agar, and then 72 replicates into the 96-well plates. All trophozoites for each strain/solution came from the same petri dish to prevent differences in viability between different suspensions. All Acanthamoeba were assumed viable during plating.
4.2.3. E. coli Different Concentrations Evaluated
E. coli was prepared in 100 mL of Tryptic Soy Broth (TSB) at 37 °C shaking for 18–24 h. E. coli was harvested by centrifugation and washed with ¼ Ringers solution. Several concentrations of E. coli were prepared per published literature depending on the recovery method. For the 96-well, three concentrations were evaluated (Low 106 (2.2 × 10⁶ CFU), Mid 106 (5.0 × 10⁶ CFU), and 1.0 × 10⁷ CFU/well ) based on published methods [27,45], which used a low 106 CFU/mL for the smaller surface area/volume of a 96-well plate. For the 12-well, both strains were fed with 107 CFU/well [47,55,56]. Acanthamoeba ATCC 50370 was later evaluated on 12-well plates with low 106 CFU/well due to observations related to ATCC 50370 trophozoite growth in the 96-well plate at low concentrations of E. coli. After all single trophozoites had been plated, E. coli was added as described in Figure 15, and all plates were taped and incubated at 28 °C (Figure 15).
4.2.4. Microscopy Observation and Acanthamoeba Growth Quantification
Single Acanthamoeba trophozoite wells were examined for proliferation on Days 7, 14, 21, 28, 35, 50, and 65. Acanthamoeba was incubated beyond 21 days in order to ensure full growth for all strains/recovery methods/E. coli concentrations. The experiment was concluded at Day 65 after no change in Acanthamoeba growth was observed between Day 50 and Day 65 for any plate. At each time point, all wells were observed and scored as positive or negative. Random wells for all conditions/strains were photographed at each time-point at 4× magnification. As a result, the same wells were imaged across numerous time points to show changes in Acanthamoeba growth.
Acanthamoeba trophozoites were identified as proliferating, and the well was scored as positive if active motile trophozoites were observed. Wells with single or <10 trophozoites were marked as “low” positive, so the proliferation of an individual well could be observed and evaluated over time. Concentration and appearance of E. coli in the wells were also observed as confirmation that active feeding by Acanthamoeba was occurring. The number of positive wells for each strain and recovery method condition was determined at each time point. At Day 65, the experiment was concluded and the final total number of positive wells for each recovery method/solution/strain was determined. The percent viability of trophozoites per strain/solution/recovery method/E. coli concentration was determined by dividing the total number of positive wells at Day 65 by the original 24 replicate wells. This indicated the general viability of the Acanthamoeba going into the study. The percent of positive wells by time point was determined by taking the total wells positive on each day recorded and dividing by the number of positive wells at Day 65.
4.3. Statistical Analysis
Quantifications were calculated as mean ± standard error. Comparisons regarding days to final concentration were analyzed via student t-tests on inoculum control concentrations, log reductions, and day of final concentration results using unequal variance. All other statistical comparisons were calculated by two-way ANOVA or two-way repeated-measure ANOVA followed by a Tukey Test post-hoc analysis. Comparisons were considered significant at a p-value of less than 0.05.
5. Conclusions
Our paper is not meant to dictate how all laboratories should conduct testing against Acanthamoeba trophozoites; instead, we hope the information in this study assists laboratories in critically evaluating and optimizing their own current methods. As we observed no difference in storage methods, laboratories can utilize a variety of storage methods for their Acanthamoeba; however, laboratories should not expect equivalent results between different Acanthamoeba strains when testing the same products. A panel of Acanthamoeba strains should be utilized when examining efficacy against trophozoites. As Acanthamoeba has unpredictable viability, hemocytometer cell counting should not be considered a reliable measure of Acanthamoeba trophozoite concentration and recovery-based inoculum controls generated for all testing. Our study supports incubating plates at least through 14 days regardless of recovery format to guarantee rampant proliferation from a single Acanthamoeba trophozoite. Finally, laboratories should provide high-density bacteria during recovery to encourage maximum Acanthamoeba proliferation and allow for easy, fast identification of Acanthamoeba by microscopy.
Author Contributions
Conceptualization, M.J.C., R.W., and M.M.G.; methodology, M.J.C., R.W., and M.M.G.; writing—original draft preparation, M.J.C.; writing—review and editing, R.W. and M.M.G.; supervision, P.S. All authors have read and agreed to the published version of the manuscript.
Funding
This research was funded Alcon Research, LLC.
Institutional Review Board Statement
Not Applicable.
Informed Consent Statement
Not Applicable.
Data Availability Statement
The data presented in this study are available upon request from the corresponding author. The data are not publicly available due to commercial interests.
Acknowledgments
Special thanks to Elise Miller, Valerie Harris, Jamie King, and Megan Thomas for their technical support. Thanks to Allison Campolo and Brian Patterson for data analysis support. The authors would also like to acknowledge Acanthamoeba’s capricious nature, which makes studying it both interesting and challenging.
Conflicts of Interest
All Authors are employees of Alcon Research, LLC.
References
- Joslin, C.E.; Tu, E.Y.; Shoff, M.E.; Booton, G.C.; Fuerst, P.A.; McMahon, T.T.; Anderson, R.J.; Dworkin, M.S.; Sugar, J.; Davis, F.G.; et al. The association of contact lens solution use and Acanthamoeba keratitis. Am. J. Ophthalmol. 2007, 144, 169–180. [Google Scholar] [CrossRef] [Green Version]
- Marciano-Cabral, F.; Cabral, G. Acanthamoeba spp. As agents of disease in humans. Clin. Microbiol. Rev. 2003, 16, 273–307. [Google Scholar] [CrossRef] [Green Version]
- Khan, N.A. Acanthamoeba: Biology and increasing importance in human health. FEMS Microbiol. Rev. 2006, 30, 564–595. [Google Scholar] [CrossRef] [PubMed] [Green Version]
- Lorenzo-Morales, J.; Khan, N.A.; Walochnik, J. An update on Acanthamoeba keratitis: Diagnosis, pathogenesis and treatment. Parasite 2015, 22, 10. [Google Scholar] [CrossRef] [PubMed] [Green Version]
- Ahearn, D.G.; Gabriel, M.M. Contact Lenses, Disinfectants, and Acanthamoeba Keratitis; Academic Press: Cambridge, MA, USA, 1997; Volume 43. [Google Scholar]
- Preston, T.R.; Richards, H.; Wotton, R.S. Locomotion and feeding of Acanthamoeba at the water-air interface of ponds. FEMS Microbiol. Lett. 2001, 194, 143–147. [Google Scholar] [CrossRef]
- De Jonckheere, J.F. Ecology of acanthamoeba. Rev. Infect. Dis. 1991, 13, S385–S387. [Google Scholar] [CrossRef]
- Kilvington, S.; White, D.G. Acanthamoeba: Biology, ecology and human disease. Rev. Med. Microbiol. 1994, 5, 12–26. [Google Scholar] [CrossRef]
- Carnt, N.; Hoffman, J.J.; Verma, S.; Hau, S.; Radford, C.F.; Minassian, D.C.; Dart, J.K.G. Acanthamoeba keratitis: Confirmation of the UK outbreak and a prospective case-control study identifying contributing risk factors. Br. J. Ophthalmol. 2018, 102, 1621–1628. [Google Scholar] [CrossRef] [PubMed] [Green Version]
- Joslin, C.E.; Tu, E.Y.; McMahon, T.T.; Passaro, D.J.; Stayner, L.T.; Sugar, J. Epidemiological characteristics of a Chicago-area Acanthamoeba keratitis outbreak. Am. J. Ophthalmol. 2006, 142, 212–217. [Google Scholar] [CrossRef]
- Joslin, C.E.; Tu, E.Y.; Shoff, M.E.; Anderson, R.J.; Davis, F.G. Shifting distribution of Chicago-area Acanthamoeba keratitis cases. Arch. Ophthalmol. 2010, 128, 137–139. [Google Scholar] [CrossRef] [Green Version]
- Verani, J.R.; Lorick, S.A.; Yoder, J.S.; Beach, M.J.; Braden, C.R.; Roberts, J.M.; Conover, C.S.; Chen, S.; McConnell, K.A.; Chang, D.C.; et al. National outbreak of Acanthamoeba keratitis associated with use of a contact lens solution, United States. Emerg. Infect. Dis. 2009, 15, 1236–1242. [Google Scholar] [CrossRef] [PubMed]
- Visvesvara, G.S.; Shoff, M.E.; Sriram, R.; Booton, G.C.; Crary, M.; Fuerst, P.A.; Hanley, C.S.; Garner, M.M. Isolation, morphologic, serologic and molecular identification of Acanthamoeba t4 genotype from the liver of a temminck’s tragopan (tragopan temminckii). Vet. Parasitol. 2010, 170, 197–200. [Google Scholar] [CrossRef] [PubMed]
- Valladares, M.; Reyes-Batlle, M.; Mora-Peces, I.; Martín-Navarro, C.M.; López-Arencibia, A.; Dorta-Gorrín, A.; Comyn-Afonso, E.; Martínez-Carretero, E.; Maciver, S.K.; Piñero, J.E.; et al. A multisystemic Acanthamoeba infection in a dog in tenerife, canary islands, spain. Vet. Parasitol. 2014, 205, 707–711. [Google Scholar] [CrossRef]
- Karakavuk, M.; Aykur, M.; Şahar, E.A.; Karakuş, M.; Aldemir, D.; Döndüren, Ö.; Özdemir, H.G.; Can, H.; Gürüz, A.Y.; Dağcı, H.; et al. First time identification of Acanthamoeba genotypes in the cornea samples of wild birds; is acanthamoeba keratitis making the predatory birds a target? Exp. Parasitol. 2017, 183, 137–142. [Google Scholar] [CrossRef] [PubMed]
- Dorking, M.C. Woman left bed-bound in agonising pain after parasite burrowed into her eye. Yahoo! Sports, 5 August 2020. [Google Scholar]
- Benyon, L. Touching my contact lens with a wet hand left me blind in one eye. Daily Mail, 28 September 2020. [Google Scholar]
- Avramova, N. Ongoing outbreak of rare eye infection found among contact lens wearers. CNN, 21 September 2018. [Google Scholar]
- Lex18. Woman nearly loses eye after swimming in contacts. Lex18, 22 September 2018. [Google Scholar]
- Brocious, J.; Tarver, M.E.; Hampton, D.; Eydelman, M. Acanthamoeba: An overview of the challenges to the development of a consensus methodology of disinfection efficacy testing for contact lens care products. Eye Contact Lens 2018, 44, 351–354. [Google Scholar] [CrossRef] [PubMed]
- Yoder, J.S.; Verani, J.; Heidman, N.; Hoppe-Bauer, J.; Alfonso, E.C.; Miller, D.; Jones, D.B.; Bruckner, D.; Langston, R.; Jeng, B.H.; et al. Acanthamoeba keratitis: The persistence of cases following a multistate outbreak. Ophthalmic Epidemiol. 2012, 19, 221–225. [Google Scholar] [CrossRef]
- Epstein, A.B. In the aftermath of the fusarium keratitis outbreak: What have we learned? Clin. Ophthalmol. 2007, 1, 355–366. [Google Scholar] [PubMed]
- EN ISO 14729:2001/A1:2010. Ophthalmic Optics–Contact Lens Care Products–Microbiological Requirements and Test Methods for Products and Regimens for Hygienic Management of Contact Lenses; International Organization for Standardization: Geneva, Switzerland, 2010. [Google Scholar]
- Siddiqui, R.; Khan, N.A. Biology and pathogenesis of Acanthamoeba. Parasit Vectors 2012, 5, 6. [Google Scholar] [CrossRef] [PubMed] [Green Version]
- Coulon, C.; Collignon, A.; McDonnell, G.; Thomas, V. Resistance of Acanthamoeba cysts to disinfection treatments used in health care settings. J. Clin. Microbiol. 2010, 48, 2689–2697. [Google Scholar] [CrossRef] [PubMed] [Green Version]
- Turner, N.A.; Russell, A.D.; Furr, J.R.; Lloyd, D. Emergence of resistance to biocides during differentiation of Acanthamoeba castellanii. J. Antimicrob. Chemother. 2000, 46, 27–34. [Google Scholar] [CrossRef] [PubMed]
- Kilvington, S.; Lam, A. Development of standardized methods for assessing biocidal efficacy of contact lens care solutions against Acanthamoeba trophozoites and cysts. Investig. Ophthalmol. Vis. Sci. 2013, 54, 4527–4537. [Google Scholar] [CrossRef] [Green Version]
- Shoff, M.E.; Eydelman, M.B. Strategies to optimize conditions for testing multipurpose contact lens solution efficacy against Acanthamoeba. Eye Contact Lens 2012, 38, 363–367. [Google Scholar] [CrossRef]
- Shoff, M.; Rogerson, A.; Schatz, S.; Seal, D. Variable responses of Acanthamoeba strains to three multipurpose lens cleaning solutions. Optom. Vis. Sci. 2007, 84, 202–207. [Google Scholar] [CrossRef]
- Kolar, S.S.N.; Manarang, J.C.; Burns, A.R.; Miller, W.L.; McDermott, A.M.; Bergmanson, J.P.G. Contact lens care solution killing efficacy against Acanthamoeba castellanii by in vitro testing and live-imaging. Contact Lens Anterior Eye 2015, 38, 442–450. [Google Scholar] [CrossRef]
- Nakaminami, H.; Enomoto, K.; Yoshimura, Y.; Onuki, T.; Nihonyanagi, S.; Hamada, Y.; Noguchi, N. Evaluation of in vitro antiamoebic activity of antimicrobial agents against clinical Acanthamoeba isolates. J. Ocul. Pharmacol. Ther. 2017, 33, 629–634. [Google Scholar] [CrossRef]
- Kobayashi, T.; Gibbon, L.; Mito, T.; Shiraishi, A.; Uno, T.; Ohashi, Y. Efficacy of commercial soft contact lens disinfectant solutions against Acanthamoeba. Jpn. J. Ophthalmol. 2011, 55, 547–557. [Google Scholar] [CrossRef]
- Beattie, T.K.; Seal, D.V.; Tomlinson, A.; McFadyen, A.K.; Grimason, A.M. Determination of amoebicidal activities of multipurpose contact lens solutions by using a most probable number enumeration technique. J. Clin. Microbiol. 2003, 41, 2992–3000. [Google Scholar] [CrossRef] [PubMed] [Green Version]
- McBride, J.; Ingram, P.R.; Henriquez, F.L.; Roberts, C.W. Development of colorimetric microtiter plate assay for assessment of antimicrobials against Acanthamoeba. J. Clin. Microbiol. 2005, 43, 629–634. [Google Scholar] [CrossRef] [PubMed] [Green Version]
- Fears, A.C.; Metzinger, R.C.; Killeen, S.Z.; Reimers, R.S.; Roy, C.J. Comparative in vitro effectiveness of a novel contact lens multipurpose solution on Acanthamoeba castellanii. J. Ophthalmic Inflamm. Infect. 2018, 8, 19. [Google Scholar] [CrossRef] [PubMed]
- Borazjani, R.N.; May, L.L.; Noble, J.A.; Avery, S.V.; Ahearn, D.G. Flow cytometry for determination of the efficacy of contact lens disinfecting solutions against Acanthamoeba spp. Appl. Environ. Microbiol. 2000, 66, 1057–1061. [Google Scholar] [CrossRef] [Green Version]
- Hughes, R.; Heaselgrave, W.; Kilvington, S. Acanthamoeba polyphaga strain age and method of cyst production influence the observed efficacy of therapeutic agents and contact lens disinfectants. Antimicrob. Agents Chemother. 2003, 47, 3080–3084. [Google Scholar] [CrossRef] [PubMed] [Green Version]
- Campolo, A.; Shannon, S.P.; Crary, M.J. Evaluating alternate methods of determining the antimicrobial efficacy of contact lens care products against Acanthamoeba trophozoites. Pathogens 2021, 10, 126. [Google Scholar] [CrossRef]
- Seo, S.A.; Yong, T.S.; Im, K.I. The maintenance of free-living amoebae by cryopreservation. Korean J. Parasitol. 1992, 30, 151–153. [Google Scholar] [CrossRef] [PubMed]
- Clayton-Jeter, H.D. Looking good: Safe use and care of contact lenses. In FDA News for Health Care Professioals; FDA, Ed.; 2010. Available online: https://www.fda.gov/files/about%20fda/published/Looking-Good--Safe-Use-and-Care-of-Contact-Lenses--%28May-2010%29.pdf (accessed on 17 February 2021).
- Eydelman, M.B.; Tarver, M.E.; Kiang, T.; Alexander, K.Y.; Hutter, J.C. The food and drug administration’s role in establishing and maintaining safeguards for contact lenses and contact lens care products. Eye Contact Lens 2012, 38, 346–349. [Google Scholar] [CrossRef]
- Borazjani, R.N.; Kilvington, S. Efficacy of multipurpose solutions against Acanthamoeba species. Contact Lens Anterior Eye 2005, 28, 169–175. [Google Scholar] [CrossRef]
- Connor, C.G.; Blocker, Y.; Pitts, D.G. Acanthamoeba culbertsoni and contact lens disinfection systems. Optom. Vis. Sci. 1989, 66, 690–693. [Google Scholar] [CrossRef]
- Silvany, R.E.; Dougherty, J.M.; McCulley, J.P.; Wood, T.S.; Bowman, R.W.; Moore, M.B. The effect of currently available contact lens disinfection systems on Acanthamoeba castellanii and Acanthamoeba polyphaga. Ophthalmology 1990, 97, 286–290. [Google Scholar] [CrossRef]
- Lonnen, J.; Heaselgrave, W.; Nomachi, M.; Mori, O.; Santodomingo-Rubido, J. Disinfection efficacy and encystment rate of soft contact lens multipurpose solutions against Acanthamoeba. Eye Contact Lens 2010, 36, 26–32. [Google Scholar] [CrossRef]
- Crary, M. Differential Antimicrobial Efficacy of Multipurpose Solutions Against Acanthamoeba Spp Trophozoites; American Academy of Optometry: Orlando, FL, USA, 2018. [Google Scholar]
- Crary, M.J.; Walters, R.; Bartell, J.; Gabriel, M.M.; Kadurugamua, J.; Catalone, B. Establishing a standard method for evaluating efficacy against Acanthamoeba. Investig. Ophthalmol. Vis. Sci. 2013, 54. [Google Scholar]
- Fedorko, D.P.; Brocious, J.M.; Adams, K.D.; Hitchins, V.M.; Hampton, D.L.; Eydelman, M.B. Optimized protocol for testing multipurpose contact lens solution efficacy against Acanthamoeba. Eye Contact Lens 2018, 44, 367–371. [Google Scholar] [CrossRef] [PubMed]
- ISO. Ophthalmic Optics—Contact Lens Care Products—Method for Evaluating Acanthamoeba Encystment by Contact Lens Care Products, 1st ed.; ISO: Geneva, Switzerland, 2015. [Google Scholar]
- Buck, S.L.; Rosenthal, R.A.; Schlech, B.A. Methods used to evaluate the effectiveness of contact lens care solutions and other compounds against Acanthamoeba: A review of the literature. CLAO J. 2000, 26, 72–84. [Google Scholar]
- Shoff, M.E.; Joslin, C.E.; Tu, E.Y.; Kubatko, L.; Fuerst, P.A. Efficacy of contact lens systems against recent clinical and tap water Acanthamoeba isolates. Cornea 2008, 27, 713–719. [Google Scholar] [CrossRef] [PubMed]
- Mirjalali, H.; Niyyati, M.; Abedkhojasteh, H.; Babaei, Z.; Sharifdini, M.; Rezaeian, M. Pathogenic assays of Acanthamoeba belonging to the t4 genotype. Iran. J. Parasitol. 2013, 8, 530–535. [Google Scholar] [PubMed]
- Imayasu, M.; Tchedre, K.T.; Cavanagh, H.D. Effects of multipurpose solutions on the viability and encystment of Acanthamoeba determined by flow cytometry. Eye Contact Lens 2013, 39, 228–233. [Google Scholar] [CrossRef]
- Gabriel, M.M.; McAnally, C.; Bartell, J.; Walters, R.; Clark, L.; Crary, M.; Shannon, S. Biocidal efficacy of a hydrogen peroxide lens care solution incorporating a novel wetting agent. Eye Contact Lens 2019, 45, 164–170. [Google Scholar] [CrossRef]
- Gabriel, M.M.; Walters, R.; McAnally, C.; Bartell, J.; Crary, M.; Catalone, B. Biocidal efficacy of a hydrogen peroxide solution incorporating a novel wetting agent. Contact Lens Anterior Eye 2018, 41, S15. [Google Scholar] [CrossRef]
- Crary, M.J.; Walters, R.; McAnally, C.; Gabriel, M.M.; Shannon, S.P. Differential antimicrobial efficacy of multipurpose solutions against Acanthamoeba spp trophozoites. Optom. Vis. Sci. 2018, 82. [Google Scholar]
- Gabriel, M.M.; McAnally, C.; Walters, R.; Clark, L.; Crary, M.J.; Bartell, J.; Catalone, B. Biocidal efficacy of a new hydrogen peroxide disinfecting solution against clinical bacterial and yeast isolates, and Acanthamoeba species. Investig. Ophthalmol. Vis. Sci. 2015, 56, 272. [Google Scholar]
- Niszl, I.A.; Markus, M.B. Anti-acanthamoeba activity of contact lens solutions. Br. J. Ophthalmol. 1998, 82, 1033–1038. [Google Scholar] [CrossRef] [PubMed] [Green Version]
- del Buey, M.A.; Cristóbal, J.A.; Casas, P.; Goñi, P.; Clavel, A.; Mínguez, E.; Lanchares, E.; García, A.; Calvo, B. Evaluation of in vitro efficacy of combined riboflavin and ultraviolet a for Acanthamoeba isolates. Am. J. Ophthalmol. 2012, 153, 399–404. [Google Scholar] [CrossRef]
- Fuerst, P.A.; Booton, G.C.; Crary, M.J. Phylogenetic analysis and the evolution of the 18s rrna gene typing system of Acanthamoeba. J. Eukaryot. Microbiol. 2015, 62, 69–84. [Google Scholar] [CrossRef] [PubMed]
- Niyyati, M.; Abedkhojasteh, H.; Salehi, M.; Farnia, S.; Rezaeian, M. Axenic cultivation and pathogenic assays of Acanthamoeba strains using physical parameters. Iran. J. Parasitol. 2013, 8, 186–189. [Google Scholar]
- Coulon, C.; Dechamps, N.; Meylheuc, T.; Collignon, A.; McDonnell, G.; Thomas, V. The effect of in vitro growth conditions on the resistance of acanthamoeba cysts. J. Eukaryot. Microbiol. 2012, 59, 198–205. [Google Scholar] [CrossRef]
- Köhsler, M.; Leitsch, D.; Fürnkranz, U.; Duchêne, M.; Aspöck, H.; Walochnik, J. Acanthamoeba strains lose their abilities to encyst synchronously upon prolonged axenic culture. Parasitol. Res. 2008, 102, 1069–1072. [Google Scholar] [CrossRef]
- Ferrante, A.; Bates, E.J. Elastase in the pathogenic free-living amoebae naegleria and acanthamoeba spp. Infect. Immun. 1988, 56, 3320–3321. [Google Scholar] [CrossRef] [Green Version]
- Mazur, T.; Hadaś, E. The effect of the passages ofacanthamoeba strains through mice tissue on their virulence and its biochemical markers. Parasitol. Res. 1994, 80, 431–434. [Google Scholar] [CrossRef]
- ATCC. Reference strains: How many passages are too many? ATCC Connect. 2003, 23, 6–7. [Google Scholar]
- Weekers, P.H.H.; Bodelier, P.L.E.; Wijen, J.P.H.; Vogels, G.D. Effects of grazing by the free-living soil amoebae Acanthamoeba castellanii, Acanthamoeba polyphaga, and Hartmannella vermiformis on various bacteria. Appl. Environ. Microbiol 1993, 59, 2317–2319. [Google Scholar] [CrossRef] [Green Version]
- Wang, X.; Ahearn, D.G. Effect of bacteria on survival and growth of Acanthamoeba castellanii. Curr. Microbiol. 1997, 34, 212–215. [Google Scholar] [CrossRef]
- Yousuf, F.A.; Siddiqui, R.; Khan, N.A. Acanthamoeba castellanii of the t4 genotype is a potential environmental host for Enterobacter aerogenes and Aeromonas hydrophila. Parasit Vectors 2013, 6, 169. [Google Scholar] [CrossRef] [Green Version]
- Reed, L.J.; Muench, H. A simple method of estimating fifty per cent endpoints. Am. J. Epidemiol. 1938, 27, 493–497. [Google Scholar] [CrossRef]
- Hamilton, M.A.; Russo, R.C.; Thurston, R.V. Trimmed spearman-karber method for estimating median lethal concentrations in toxicity bioassays. Environ. Sci. Technol. 1977, 11, 714–719. [Google Scholar] [CrossRef]
- Kilvington, S.; Anger, C. A comparison of cyst age and assay method of the efficacy of contact lens disinfectants against Acanthamoeba. Br. J. Ophthalmol. 2001, 85, 336–340. [Google Scholar] [CrossRef] [Green Version]
- Martin-Navarro, C.M.; Lorenzo-Morales, J.; Lopez-Arencibia, A.; Valladares, B.; Pinero, J.E. Acanthamoeba spp.: Efficacy of bioclen fr one step, a povidone-iodine based system for the disinfection of contact lenses. Exp. Parasitol. 2010, 126, 109–112. [Google Scholar] [CrossRef] [PubMed]
- Schuster, F.L.; Rahman, M.; Griffith, S. Chemotactic responses of Acanthamoeba castellanii to bacteria, bacterial components, and chemotactic peptides. Trans. Am. Microsc. Soc. 1993, 112, 43–61. [Google Scholar] [CrossRef]
- Schuster, F.L.; Levandowsky, M. Chemosensory responses of Acanthamoeba castellanii: Visual analysis of random movement and responses to chemical signals. J. Eukaryot. Microbiol. 1996, 43, 150–158. [Google Scholar] [CrossRef]
- Du, Q.; Schilde, C.; Birgersson, E.; Chen, Z.-h.; McElroy, S.; Schaap, P. The cyclic amp phosphodiesterase rega critically regulates encystation in social and pathogenic amoebas. Cell. Signal. 2014, 26, 453–459. [Google Scholar] [CrossRef] [Green Version]
- Moon, E.-K.; Chung, D.-I.; Hong, Y.; Kong, H.-H. Expression levels of encystation mediating factors in fresh strain of Acanthamoeba castellanii cyst ests. Exp. Parasitol. 2011, 127, 811–816. [Google Scholar] [CrossRef] [PubMed]
- Wang, Y.E.; Tepelus, T.C.; Gui, W.; Irvine, J.A.; Lee, O.L.; Hsu, H.Y. Reduction of Acanthamoeba cyst density associated with treatment detected by in vivo confocal microscopy in acanthamoeba keratitis. Cornea 2019, 38, 463–468. [Google Scholar] [CrossRef] [PubMed]
- Shabardina, V.; Kischka, T.; Kmita, H.; Suzuki, Y.; Makałowski, W. Environmental adaptation of Acanthamoeba castellanii and Entamoeba histolytica at genome level as seen by comparative genomic analysis. Int. J. Biol. Sci. 2018, 14, 306–320. [Google Scholar] [CrossRef] [PubMed] [Green Version]
- Guimaraes, A.J.; Gomes, K.X.; Cortines, J.R.; Peralta, J.M.; Peralta, R.H.S. Acanthamoeba spp. As a universal host for pathogenic microorganisms: One bridge from environment to host virulence. Microbiol. Res. 2016, 193, 30–38. [Google Scholar] [CrossRef] [PubMed]
- Hughes, R.; Kilvington, S. Comparison of hydrogen peroxide contact lens disinfection systems and solutions against Acanthamoeba polyphaga. Antimicrob. Agents Chemother. 2001, 45, 2038–2043. [Google Scholar] [CrossRef] [Green Version]
Figure 1.
Strain ATCC 30461 demonstrates a significantly greater log reduction than strain ATCC 50370. Mean ± SE comparison of antimicrobial activity for three test solutions per Acanthamoeba strain as determined on Day 7, 14, and 21 plate reads. Means reflect combined recovery method and source data. a: p < 0.05 vs. 30461 of the same solution and day. n = 36/group.

Figure 2.
The source (long-term storage method) of Acanthamoeba has no impact on biocidal efficacy. Mean ± SE of comparison of log reductions for each test solution against (A) Acanthamoeba ATCC 50370 and (B) Acanthamoeba ATCC 30461 trophozoites by long-term maintenance method for Day 7, 14, and 21 plate reads. a: p < 0.05 vs. Solution 1 plug at the same time point, b: p < 0.05 vs. Solution 2 plug at the same time point. n = 6–18/group.

Figure 3.
Results show that 96-well recovery changed depending on plate incubation length. Left y-axis: Mean ± SE log reduction of (A) Acanthamoeba ATCC 30461 and (B) Acanthamoeba ATCC 50370 trophozoites for the three test solutions per recovery method as determined on Day 7, 14, and 21 plate reads. Right y-axis: total cells/mL (in log) of the paired inoculum control. a: p < 0.05 vs. 12-well recovery for the same solution at the same day, b: p < 0.05 vs. Day 7 of the same solution and recovery, c: p < 0.05 vs. Day 14 of the same solution and recovery. n = 12–18/group.

Figure 4.
Acanthamoeba growth requires at least 14 days to stabilize, with the greatest impact on incubation vs. log reduction results in 96-well method recovery. Left: mean ± SE and associated p-values of log reduction by strain, day, and solution. Right: associated visual trend. Left y-axis: Mean log reduction by day of Acanthamoeba ATCC 30461 and Acanthamoeba ATCC 50370 trophozoites for the three test solutions per recovery method as determined on Day 7, 14, and 21 plate reads. Right y-axis: total cells/mL (in log) of the paired inoculum control. Black lines: 12-well recovery, grey lines: 96-well recovery. n = 12–18/group.

Figure 5.
ATCC 30461 recovers faster than ATCC 50370 for both recovery methods, and the 12-well recovery method is the overall fastest recovery method for both strains. Days to final concentration for Acanthamoeba ATCC 30461 and ATCC 50370 trophozoites for inoculum controls, and Solutions 1–3, with all sources/test replicates combined. Days to final concentration were determined as the minimum incubation time for the number of positive wells on a recovery method to stop increasing. Dotted line indicates 14 days, which is the standard incubation time for Acanthamoeba recovery plates [47,48,50]. a: p > 0.05 vs. 96-well of the same strain/solution, b: p > 0.0001 vs. 12-well for ATCC 50370 with same solution, c: p > 0.0001 vs. 96-well for ATCC 50370 for same solution. Checkmarks in the table indicate where plates/replicates had Day of Final concentration after 14 days, resulting in differences in log reduction between Day 14 results and Day 21 results.

Figure 6.
The percent viability of a single trophozoite was dependent on strain and E.coli concentration. The number of positive wells following single trophozoite seeding are listed for each strain of Acanthamoeba and the different concentrations of E. coli. The number of seeded wells indicates the total number of possible positive wells. The percent viability of each strain was graphed to demonstrate the impact of E. coli concentration and strain on the recovery of single trophozoites. Black bars: ATCC 50370; grey bars: ATCC 30461. Please see Figure 7 and Figure 8 for statistical analysis of positive wells. NT: Not Tested.

Figure 7.
Results show that 96-well recovery and lower E. coli density significantly increase the days to final percent positive rates. Day when individual Acanthamoeba ATCC 50370 trophozoite wells were identified as positive for each recovery method within (A) Inoculum Control and (B) Solution 2 treatment. The percentage of positive wells was calculated using the total number of wells positive by Day 65 as the denominator and the positive wells positive on a particular day as the numerator. a: p < 0.05 vs. Day 7 within the same recovery and E. coli density, b: p < 0.05 vs. Day 14 within the same recovery and E. coli density, c: p < 0.05 vs. 107 CFU/well 96-well, d: p < 0.05 vs. 107 CFU/well 12-well.

Figure 8.
Results show that 96-well recovery and lower E. coli density significantly increase the days to final percent positive rates. Days when individual Acanthamoeba ATCC 30461 trophozoite wells were identified as positive for each recovery method, within (A) Inoculum Control and (B) Solution 2 treatment. The percentage of positive wells was calculated using the total number of wells positive by Day 65 as the denominator and the positive wells positive on a particular day as the numerator. a: p < 0.05 vs. day 7 within the same recovery and E. coli density, b: p < 0.05 vs. Day 14 within the same recovery and E. coli density, c: p < 0.05 vs. 107 CFU/well 96-well, d: p < 0.05 vs. 107 CFU/well 12-well.

Figure 9.
The density of Acanthamoeba in positive wells was visualized at the first day a representative well was identified as positive at a designated time point. Inoculum Control wells were evaluated for both strains (ATCC 30461 and ATCC 50370) and captured at 4× magnification. For ATCC 30461, all wells were captured at the Day 7 time point. For 50370, the 12-well and the 107 CFU E. coli per well in the 96-well were captured at Day 7, while the two 106 CFU E. coli in the 96-well were captured at Day 14. The density of Acanthamoeba in positive wells was visualized at the first day a representative well was identified as positive at a designated time point. Solution 2 wells were evaluated for both strains (ATCC 30461 and ATCC 50370) and captured at 4× magnification. All wells were captured at the Day 7 time point. Red arrows indicate only Acanthamoeba present, no other Acanthamoeba in the field of view; black arrows indicate a representative Acanthamoeba in the field. Green arrows indicate E.coli. Scale bar = 100 µm, all pictures taken at the same magnification. Reference Figure 6, Figure 7 and Figure 8 for quantification and analysis.

Figure 10.
Representative images from ATCC 30461 and ATCC 50370 inoculum controls following seeding with a single Acanthamoeba trophozoite on Day 0. Inoculum Control wells from the 96-well containing Mid-106 E. coli CFU were evaluated for both strains (ATCC 30461 and ATCC 50370) and captured at 4× magnification. ATCC 50370 was positive on Day 28 as indicated by the red arrows, which show all trophozoites in the field. ATCC 30461 was positive on day 7 with black arrows in Day 7 image indicating trophozoites only. On Day 14 and Day 21, the ATCC 30461 well had fully encysted, and the images show identical cysts at both time points. The single black arrows indicate the same cysts at both time points. Scale bar = 100 µm, all pictures taken at the same magnification. Green arrows indicate E.coli. See Figure 6, Figure 7 and Figure 8 for quantification and analysis.

Figure 11.
Representative images from ATCC 50370: higher density E. coli results in earlier well positivity. (A,B) Inoculum Control wells from the 96-well containing Mid-106 E. coli CFU from ATCC 50370 were captured at 4× magnification. (A) was positive at Day 35 as indicated by the arrows, while (B) was positive at Day 14. (C,D) Solution 2 wells from the 96-well containing Low 106 E. coli CFU from ATCC 50370 were captured at 4× magnification. (C) was positive at Day 21, while (D) was positive at Day 14. Red arrows indicate all trophozoites present. Scale bar = 100 µm, all pictures taken at the same magnification. Green arrows indicate E.coli. See Figure 6, Figure 7 and Figure 8 for quantification and analysis.

Figure 12.
Representative images of a Solution 2 well from a 96-well plate containing Low 106 E. coli CFU from ATCC 50370 were captured at 4× magnification. The well was positive at Day 14 as indicated by the red arrows, which indicate all trophozoites present. Scale bar = 100 µm, all pictures taken at the same magnification. Green arrows indicate E.coli. See Figure 6, Figure 7 and Figure 8 for quantification and analysis.

Figure 13.
Three potential life cycle paths for Acanthamoeba trophozoites, including the new path of dormancy (indicated by the dotted arrow), where Acanthamoeba trophozoites display extend proliferation suppression in the presence of a food source.
Figure 13.
Three potential life cycle paths for Acanthamoeba trophozoites, including the new path of dormancy (indicated by the dotted arrow), where Acanthamoeba trophozoites display extend proliferation suppression in the presence of a food source.

Figure 14.
Experimental design system indicating recovery methods and plate counting. Each solution was tested with three independent replicates.
Figure 14.
Experimental design system indicating recovery methods and plate counting. Each solution was tested with three independent replicates.

Figure 15.
Single-cell experimental design with E. coli concentrations.


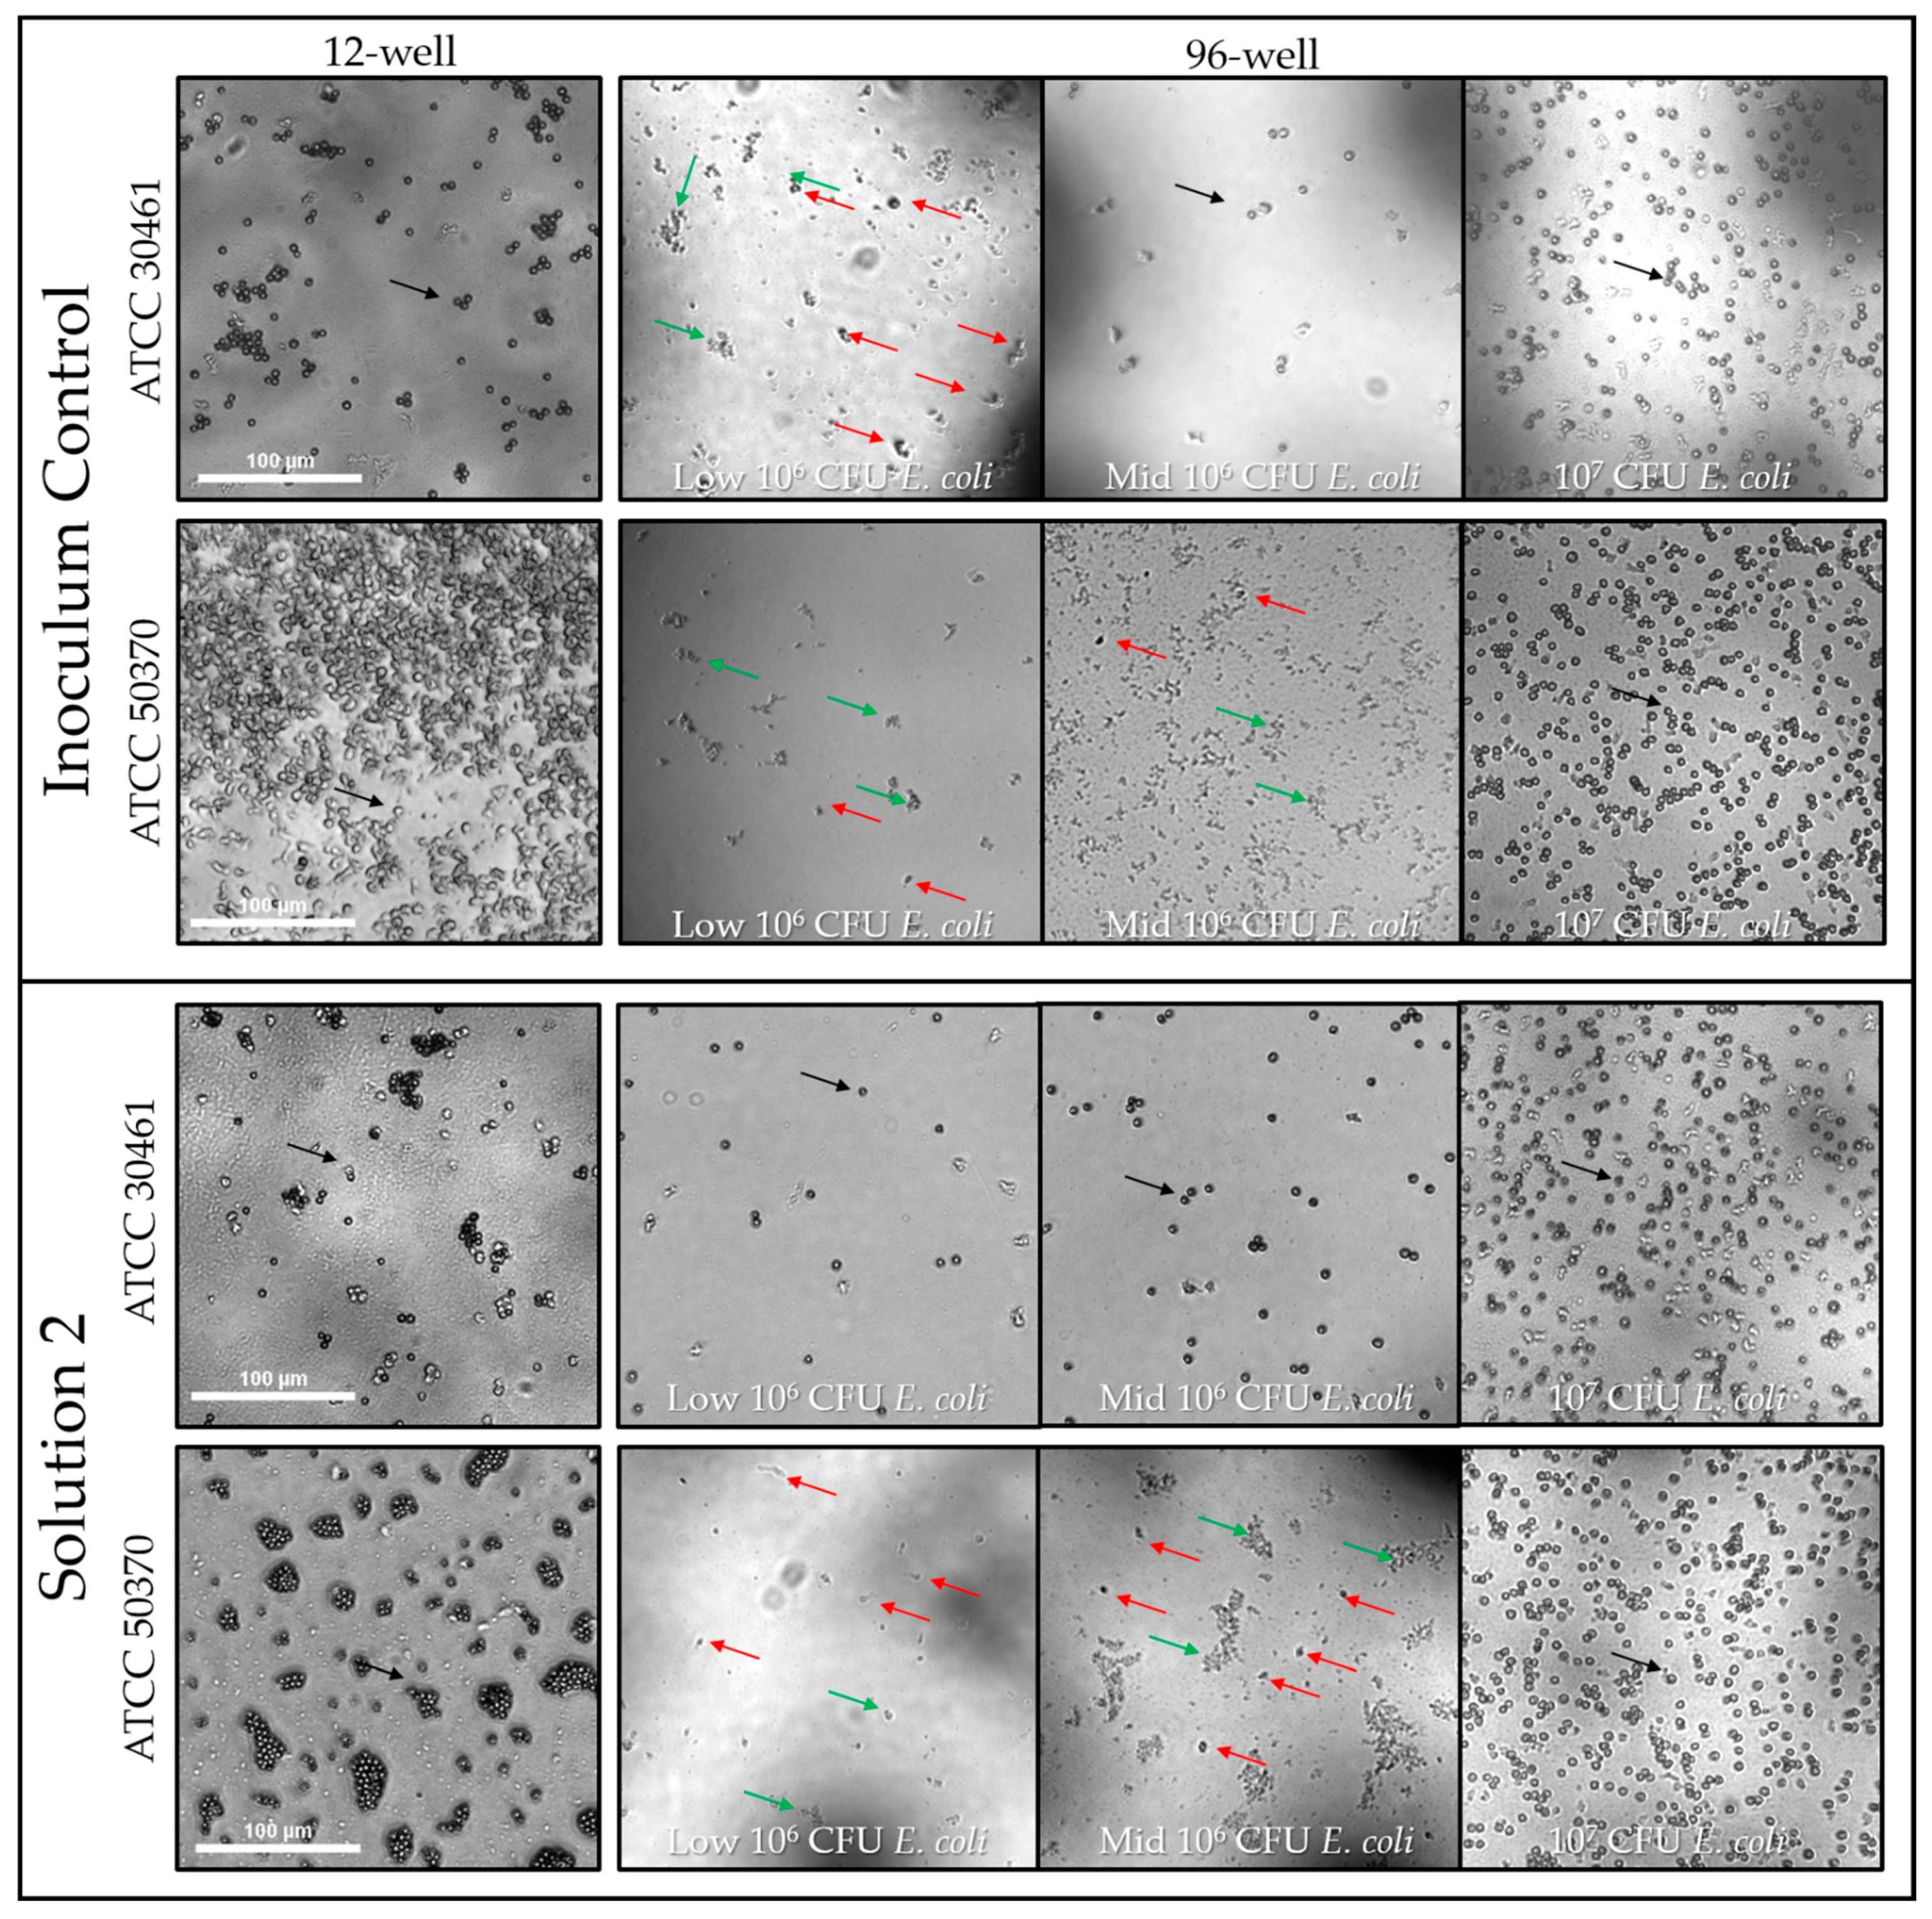
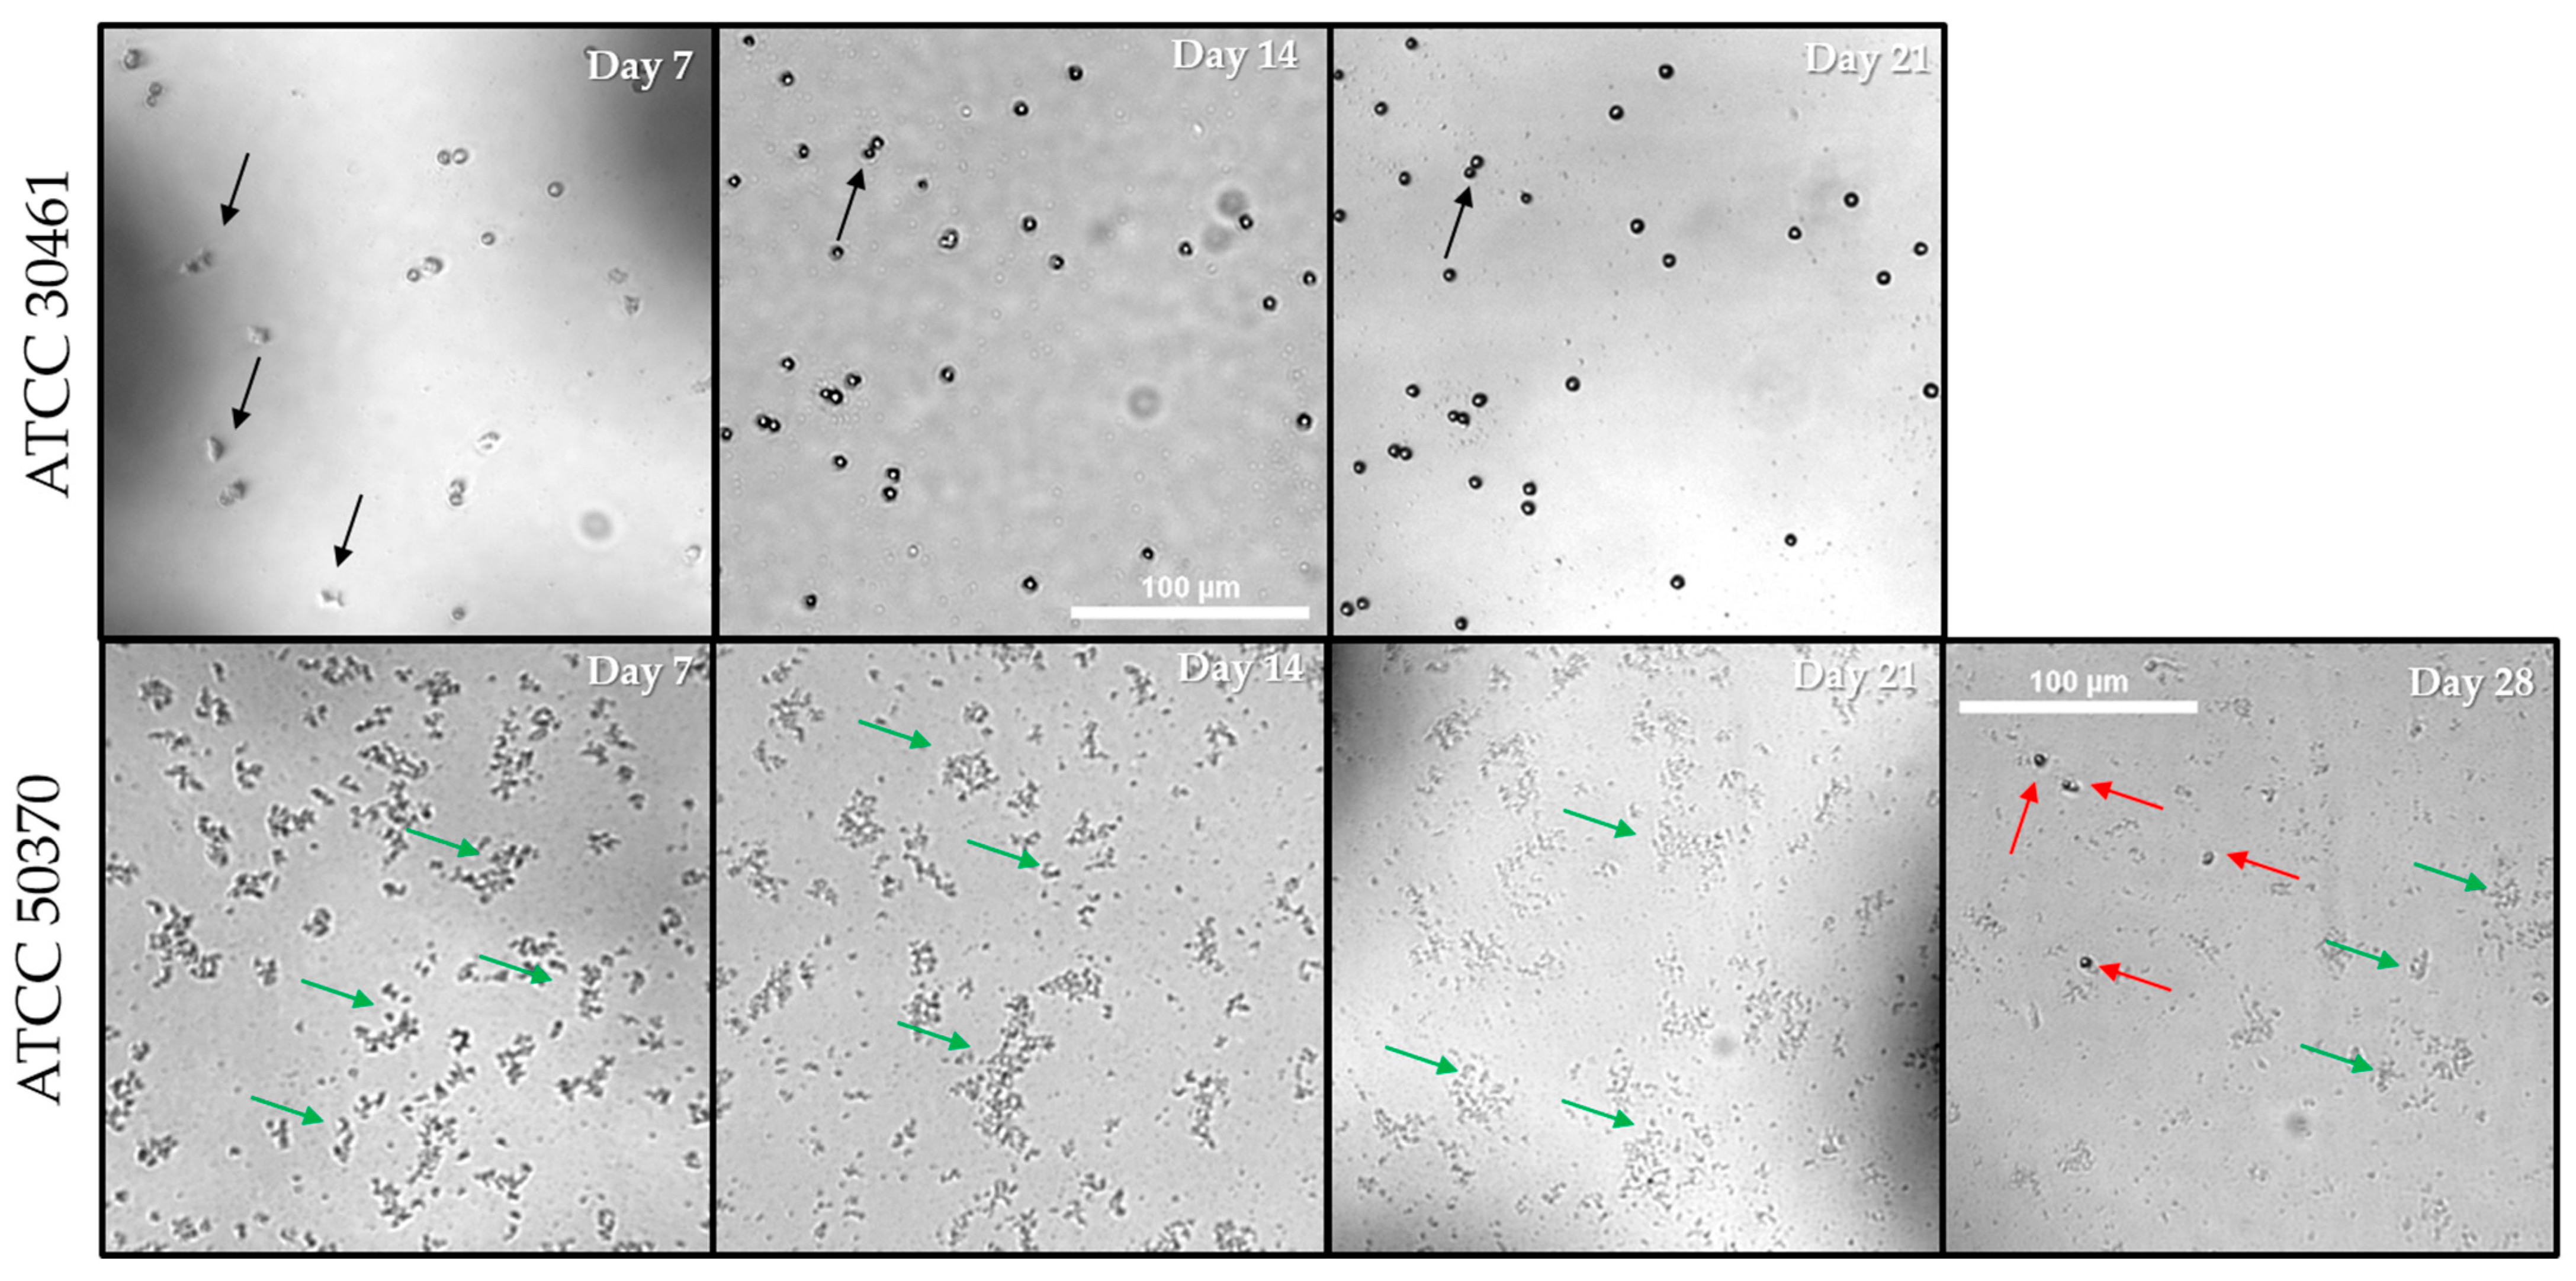
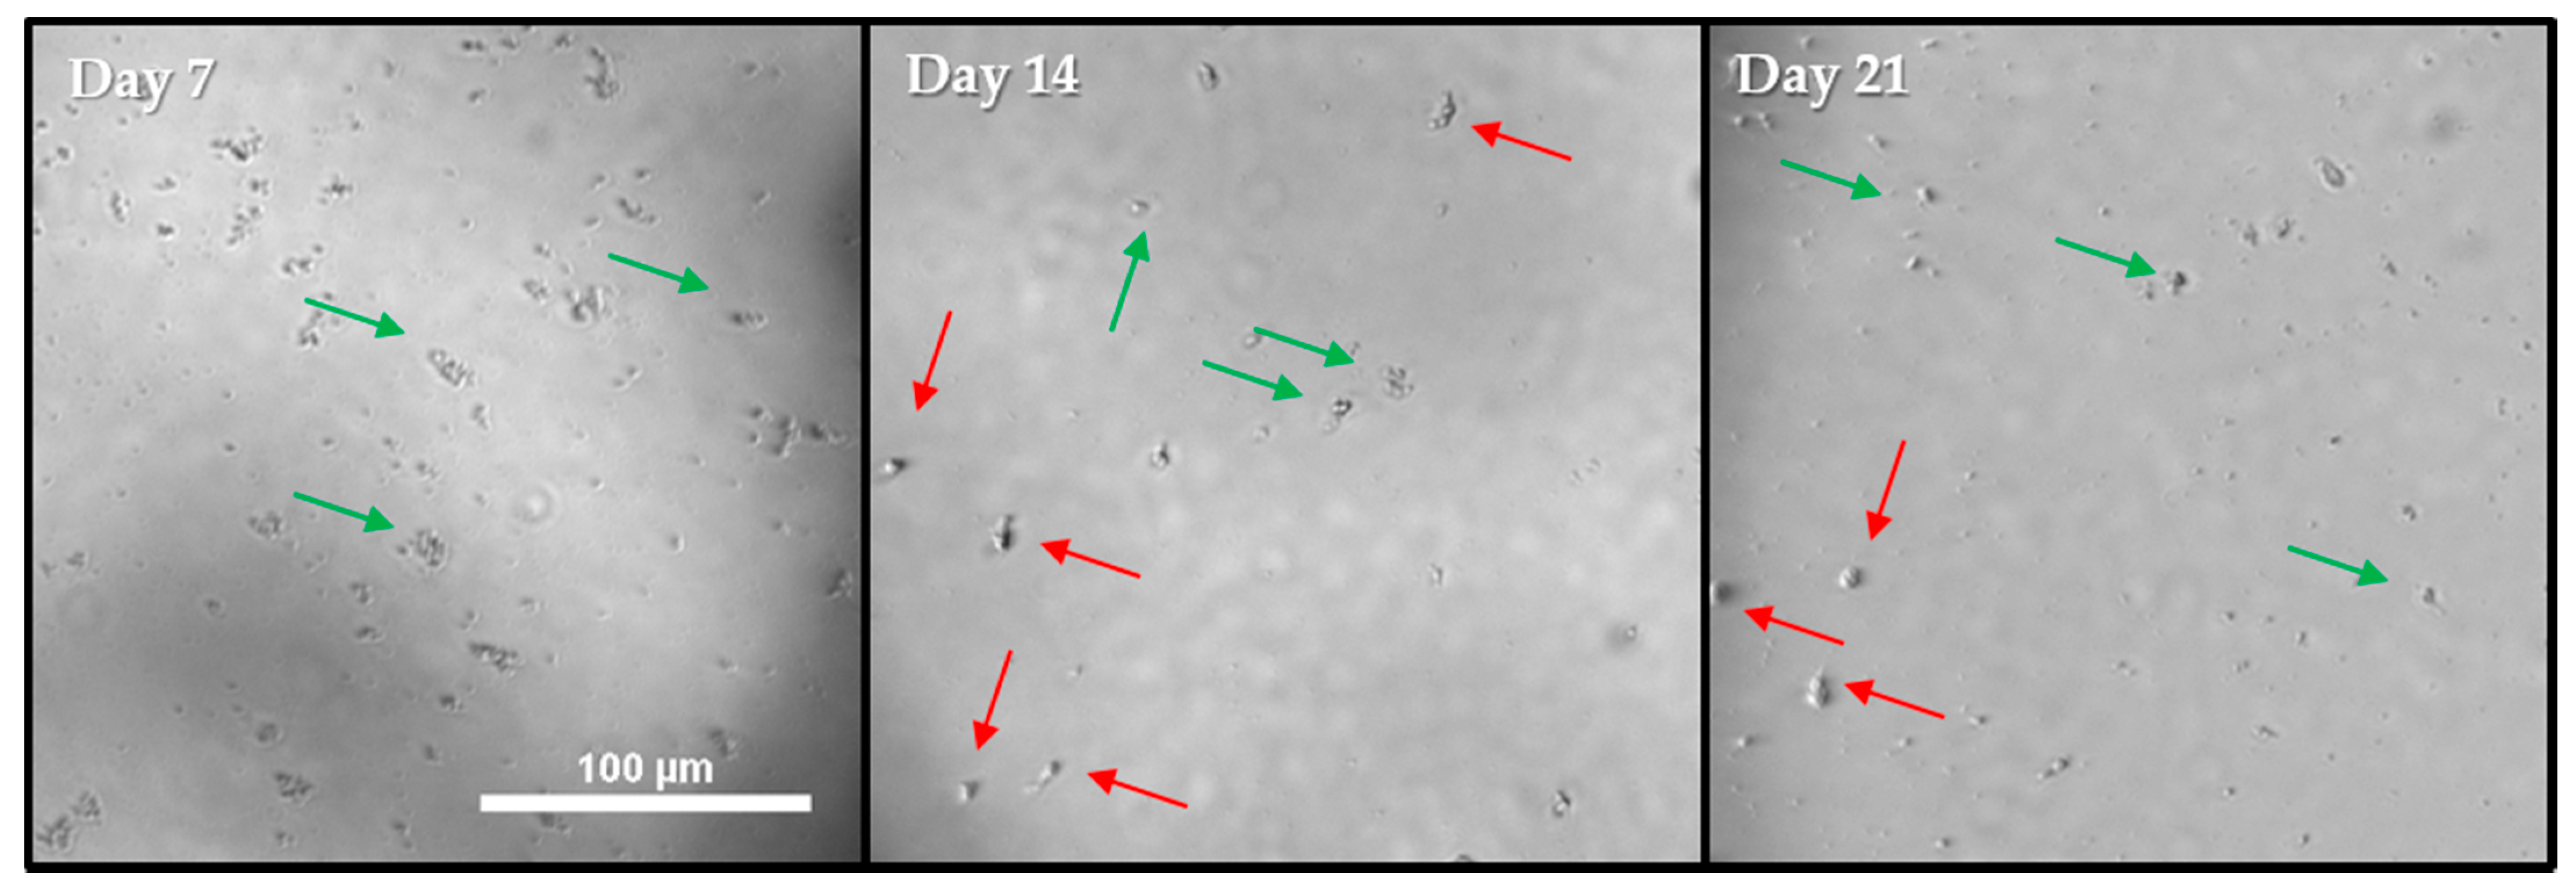
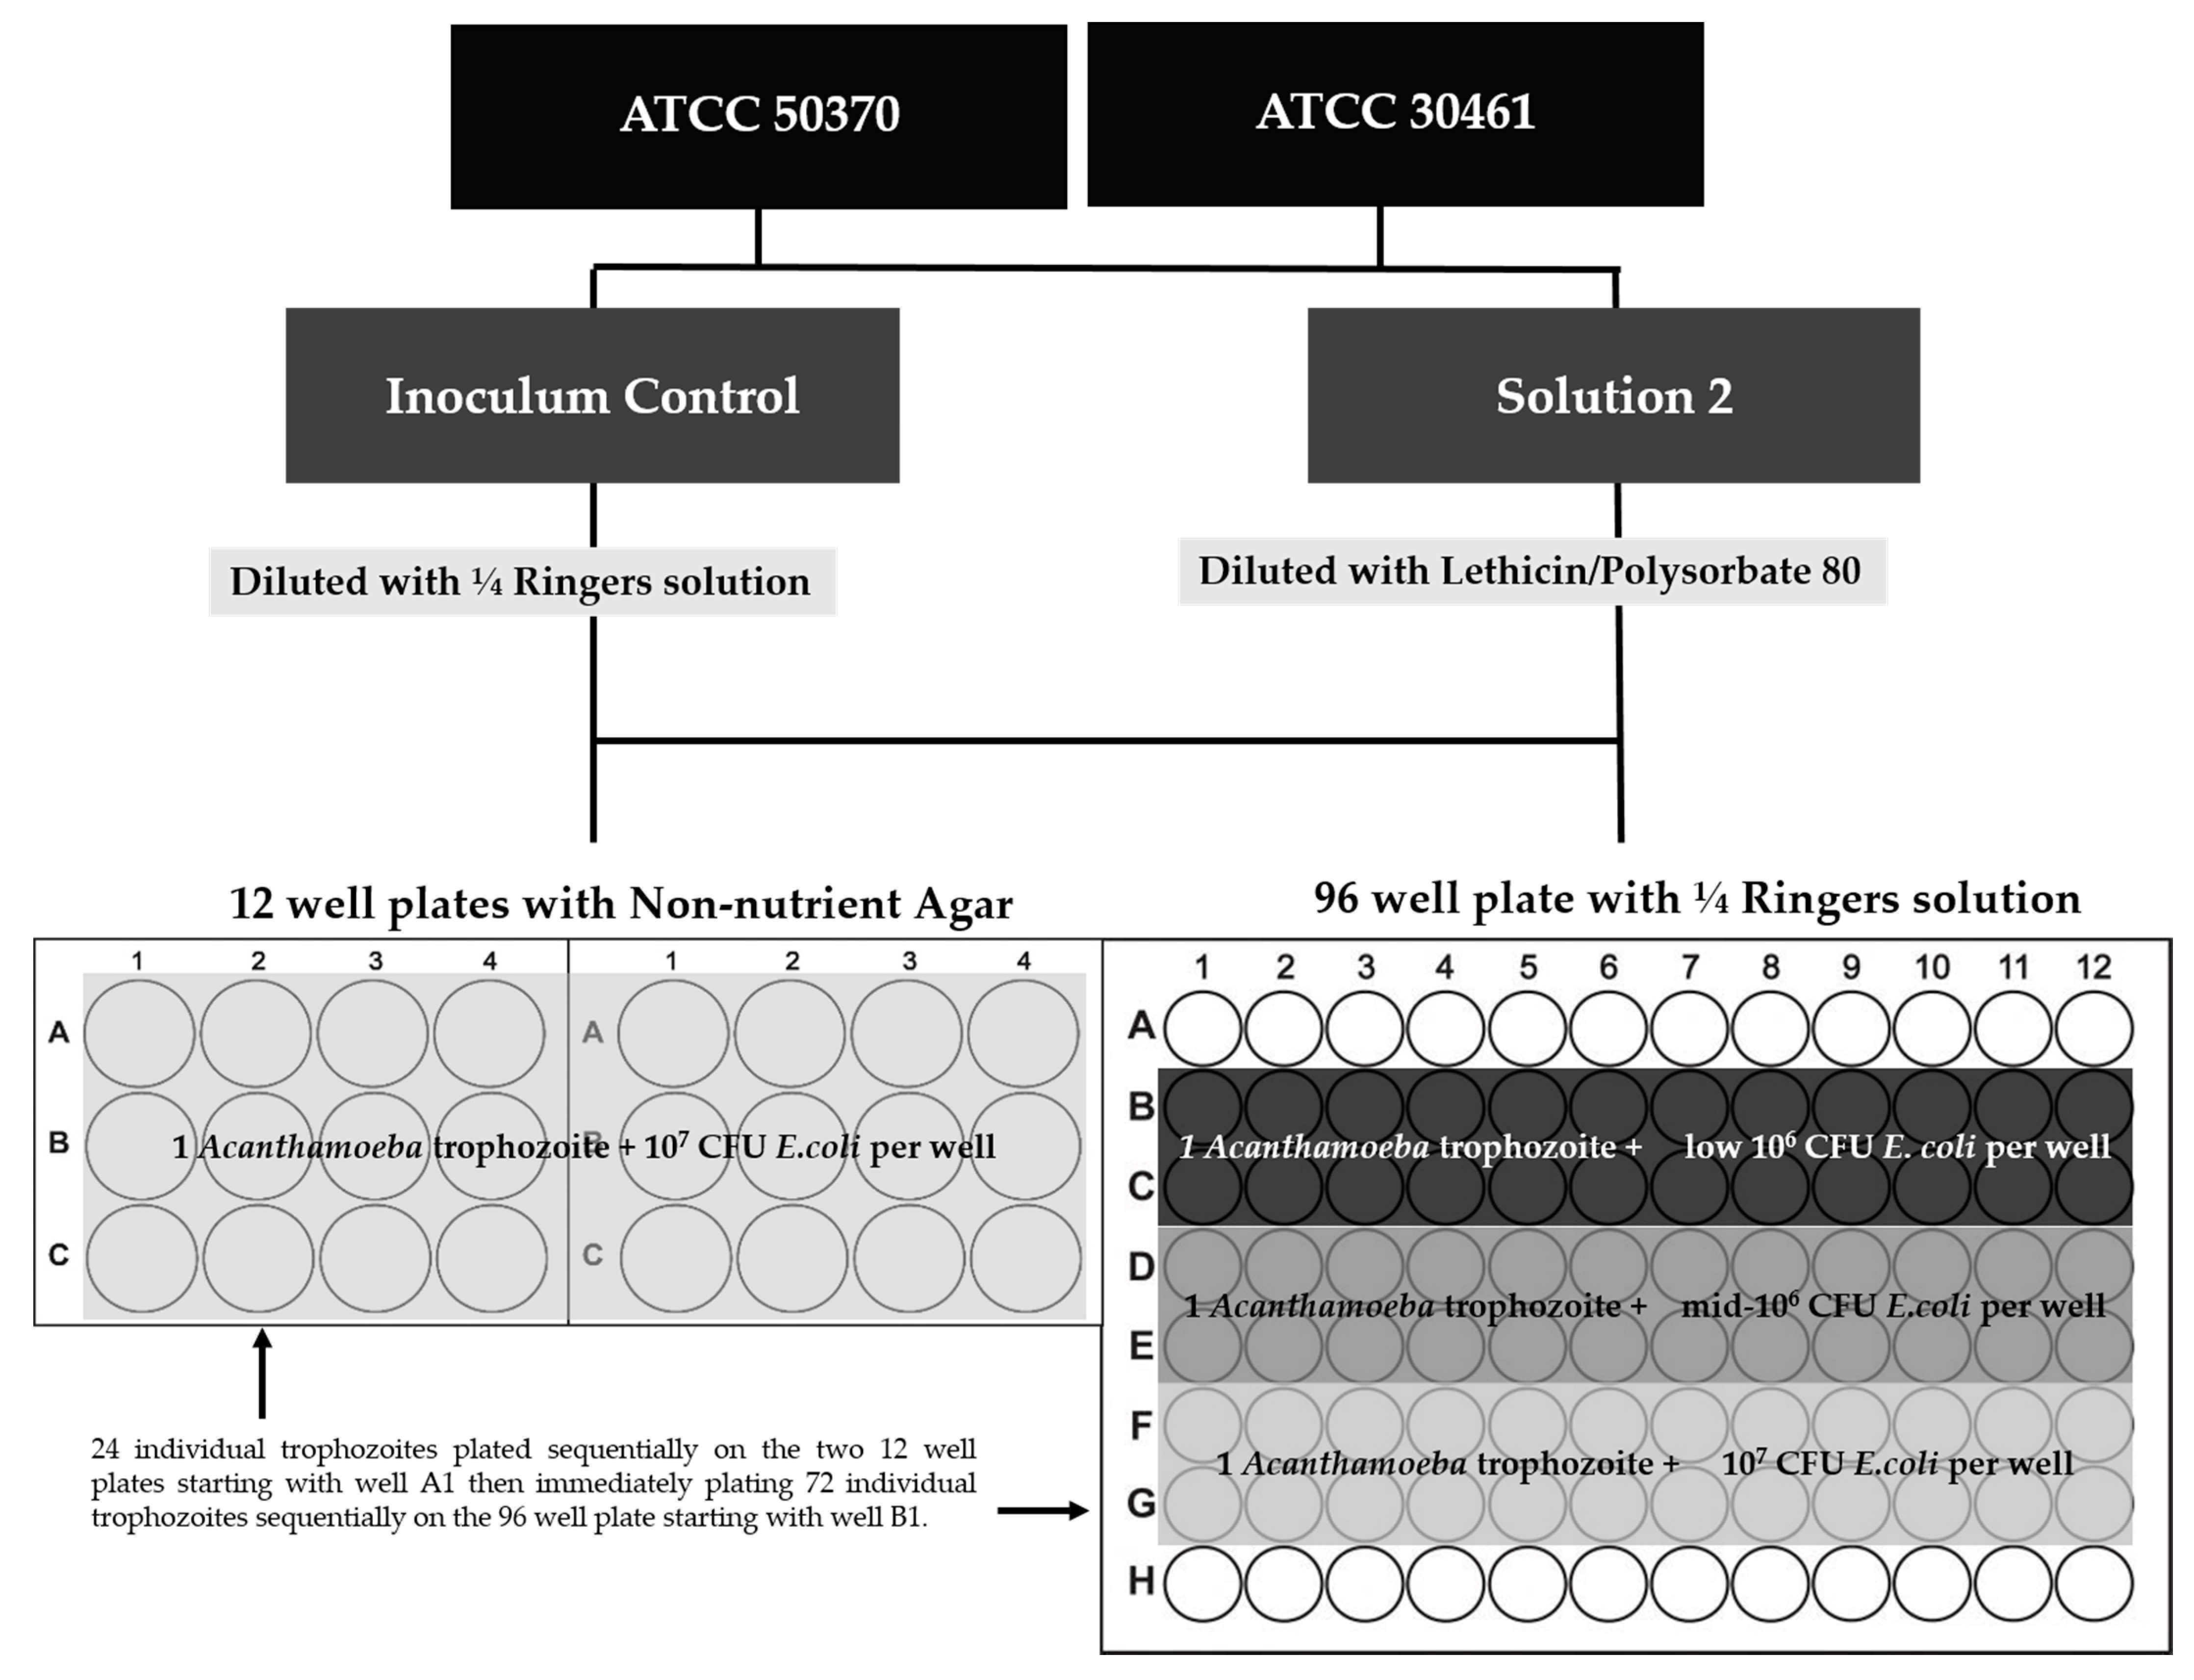
Table 1.
Laboratory-prepared Test Solutions with Active ingredients concentrations.
| Test Solution | Biocides |
|---|---|
| Solution 1 | Polyquaternium (0.0001%), Polyaminopropylbiguanide (0.0001%) |
| Solution 2 | Polyhexanide (0.0001%) |
| Solution 3 | Polyquaternium-1 (0.001%) |
Publisher’s Note: MDPI stays neutral with regard to jurisdictional claims in published maps and institutional affiliations. |
© 2021 by the authors. Licensee MDPI, Basel, Switzerland. This article is an open access article distributed under the terms and conditions of the Creative Commons Attribution (CC BY) license (http://creativecommons.org/licenses/by/4.0/).
Share and Cite
MDPI and ACS Style
Crary, M.J.; Walters, R.; Shannon, P.; Gabriel, M.M. Variables Affecting the Recovery of Acanthamoeba Trophozoites. Pathogens 2021, 10, 221. https://0-doi-org.brum.beds.ac.uk/10.3390/pathogens10020221
AMA Style
Crary MJ, Walters R, Shannon P, Gabriel MM. Variables Affecting the Recovery of Acanthamoeba Trophozoites. Pathogens. 2021; 10(2):221. https://0-doi-org.brum.beds.ac.uk/10.3390/pathogens10020221
Chicago/Turabian StyleCrary, Monica J., Rhonda Walters, Paul Shannon, and Manal M. Gabriel. 2021. "Variables Affecting the Recovery of Acanthamoeba Trophozoites" Pathogens 10, no. 2: 221. https://0-doi-org.brum.beds.ac.uk/10.3390/pathogens10020221
Note that from the first issue of 2016, this journal uses article numbers instead of page numbers. See further details here.