1. Introduction
Mitochondria are the essential cellular organelles responsible for many functions, the most important of which is ATP production during oxidative phosphorylation [
1]. Other tasks of mitochondria include maintaining normal Ca
2+ ion homeostasis, lipid peroxidation, free radical scavenging, production of NADH and GTP in the citric acid cycle, and synthesis of phospholipids for cell membrane biogenesis. Mitochondria also act as specific signaling centers of the cell, for example, by receiving signals leading to apoptosis [
2,
3].
The shape, size, number, and distribution of mitochondria are closely related to cell function and metabolic activity. Nerve cells, muscle cells, or liver cells have many mitochondria compared to erythrocytes, which have lost them [
4]. Mitochondria are distributed evenly throughout the cytoplasm or located peripherally. They are very dynamic and can move to different cell regions depending on the energy requirements. Most often, they are located in the perinuclear space, which is directly involved in protein biosynthesis [
5].
The main functions of mitochondria in the cell are well-known. However, their role during viral infection is not fully understood. The most common viral strategy described in the literature is “hijacking” the mitochondria, which allows the virus to replicate efficiently and to take control over the entire cell metabolism [
6]. Viruses alter the functions, morphology, and distribution of the mitochondrial network in infected cells. For example, the HBV core protein localizes to the OMM, disrupting electron transport and increasing ROS. Other studies indicate increased mitochondrial network fission dependent on Drp1 protein during HCV infection [
7]. In addition, the HCV viral protein NS5A, interacting with phosphatidylinositol 4-kinase IIIα to cause mitochondrial fragmentation, has also been identified [
8]. For Dengue virus, two proteins causing increased mitochondrial fission have also been identified: the NS4B and NS3 DENV proteins. Influenza virus H1N1, on the other hand, classified as an RNA virus, causes mitochondrial elongation, into tubular forms, by increasing Opa1 protein expression [
9]. The well-known recent SARS-CoV-2- interacts with mitochondrial transport proteins, e.g., TOM70, which may also translate into mitochondrial morphology by affecting the MAVS protein [
10]. In addition, the study by Chodkowski et al. indicates increased mitochondrial network fragmentation in human keratinocytes following HHV-1 infection [
6]. Many types of viral proteins have been identified as responsible for the modulation of apoptosis. Alphaherpesviruses, like other large DNA viruses, encode proteins that interfere with mitochondrial function and localization to block the apoptotic pathway. Some studies suggest that viruses can eliminate mtDNA, taking complete control over ATP production for “their own needs”. An example is the human herpesvirus type 1 (HHV-1). The HHV-1 UL12.5 protein exhibits nuclease activity, thereby degrading mtDNA [
11].
EHV-1 belongs to the family of herpesviruses and the subfamily of alphaherpesviruses like the widespread HHV-1. It poses a significant risk to horses due to its pathogenicity. The clinical signs associated with infection may be mild, such as respiratory tract inflammation. On the other hand, it can cause abortions, fetal death and severe neurological complications. Like HHV-1, it shows the ability to establish a latency state. Therefore, studies using EHV-1 provide a good model for research on alphaherpesviruses. Equid alphaherpesviruses show tropism to nerve cells, but information on the pathogenesis of EHV-1 infection, with particular emphasis on virus–neuron cell interactions, is still lacking. So far, the involvement of individual cytoskeleton elements during EHV-1 infection and modulation of apoptosis or autophagy have been determined [
12,
13,
14,
15]. The following work is a continuation of research into the role of cellular elements in EHV-1 infection. The aim of this study was to investigate the effects of EHV-1 infection on mitochondrial function in neurons.
3. Discussion
EHV-1 is the etiological agent causing, in addition to mild inflammation of the lower respiratory tract, a disease syndrome named equine herpesvirus myeloencephalopathy (EHM). Infected horses exhibit a range of neurological signs, ending with a high mortality rate. The exact pathogenesis of EHV-1-induced CNS infections is not fully understood, so it seems important to study how EHV-1 influences nerve cells and endothelial cells of blood vessels that form the blood–brain barrier [
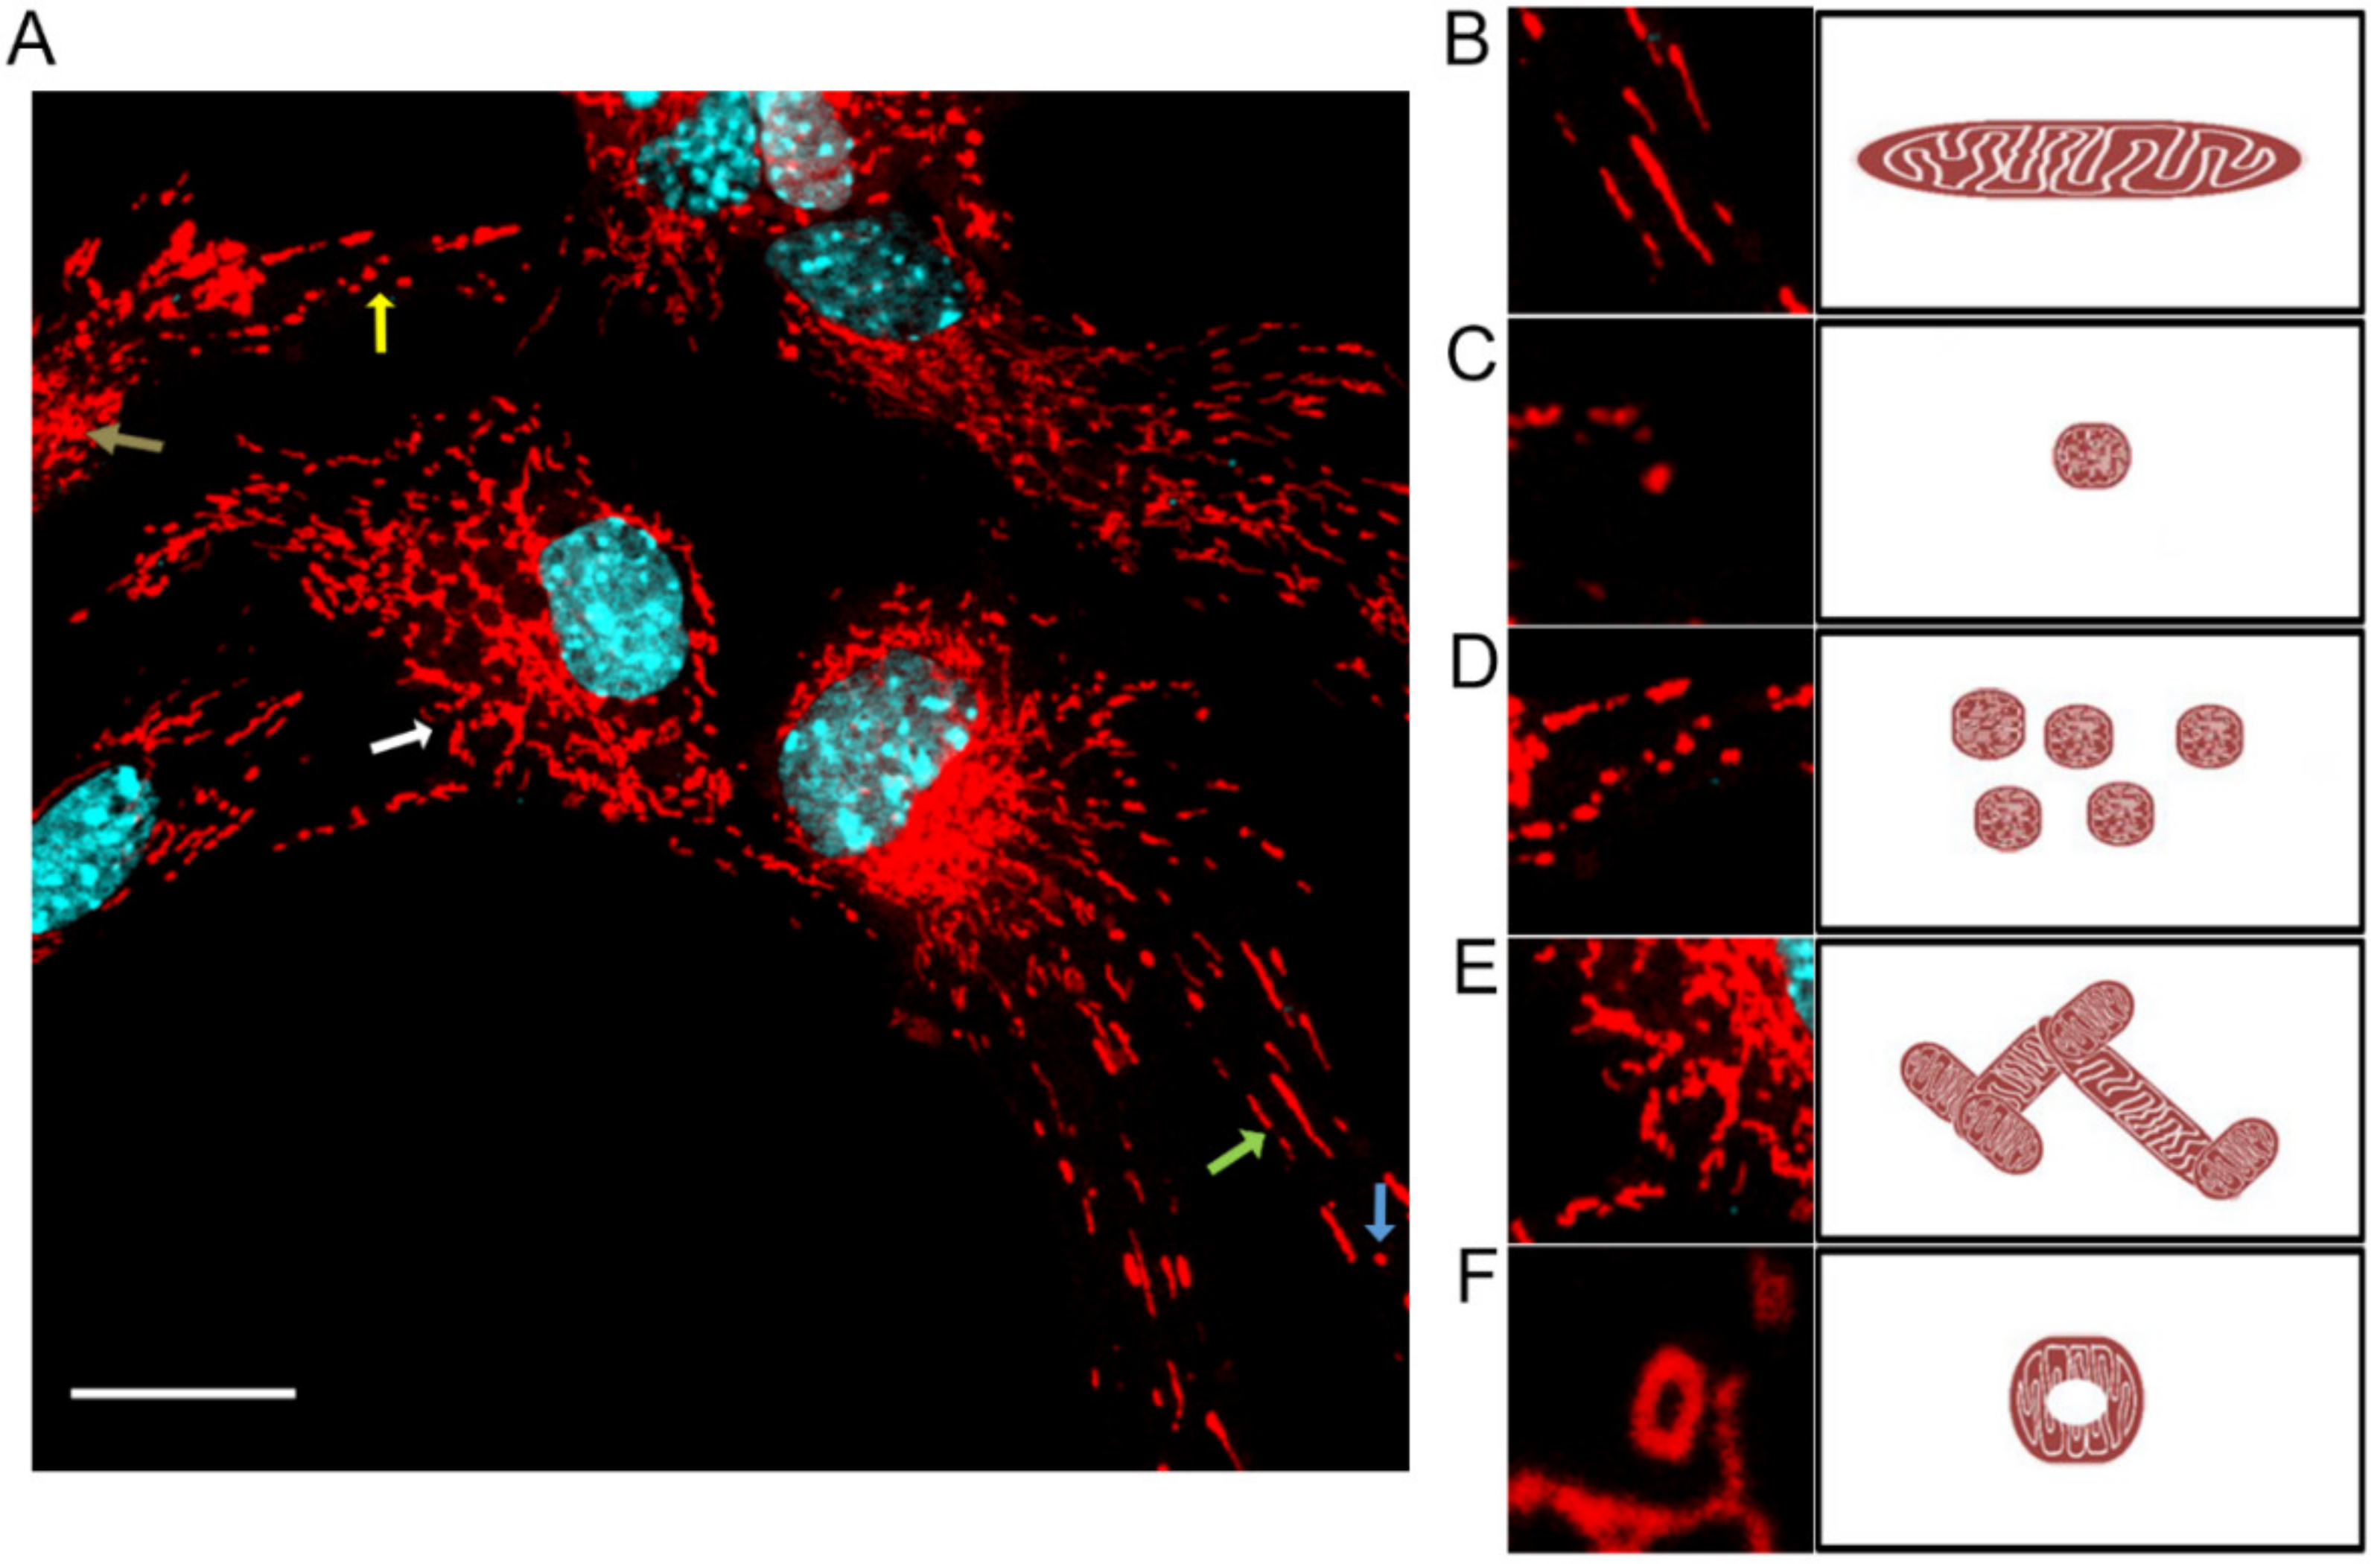
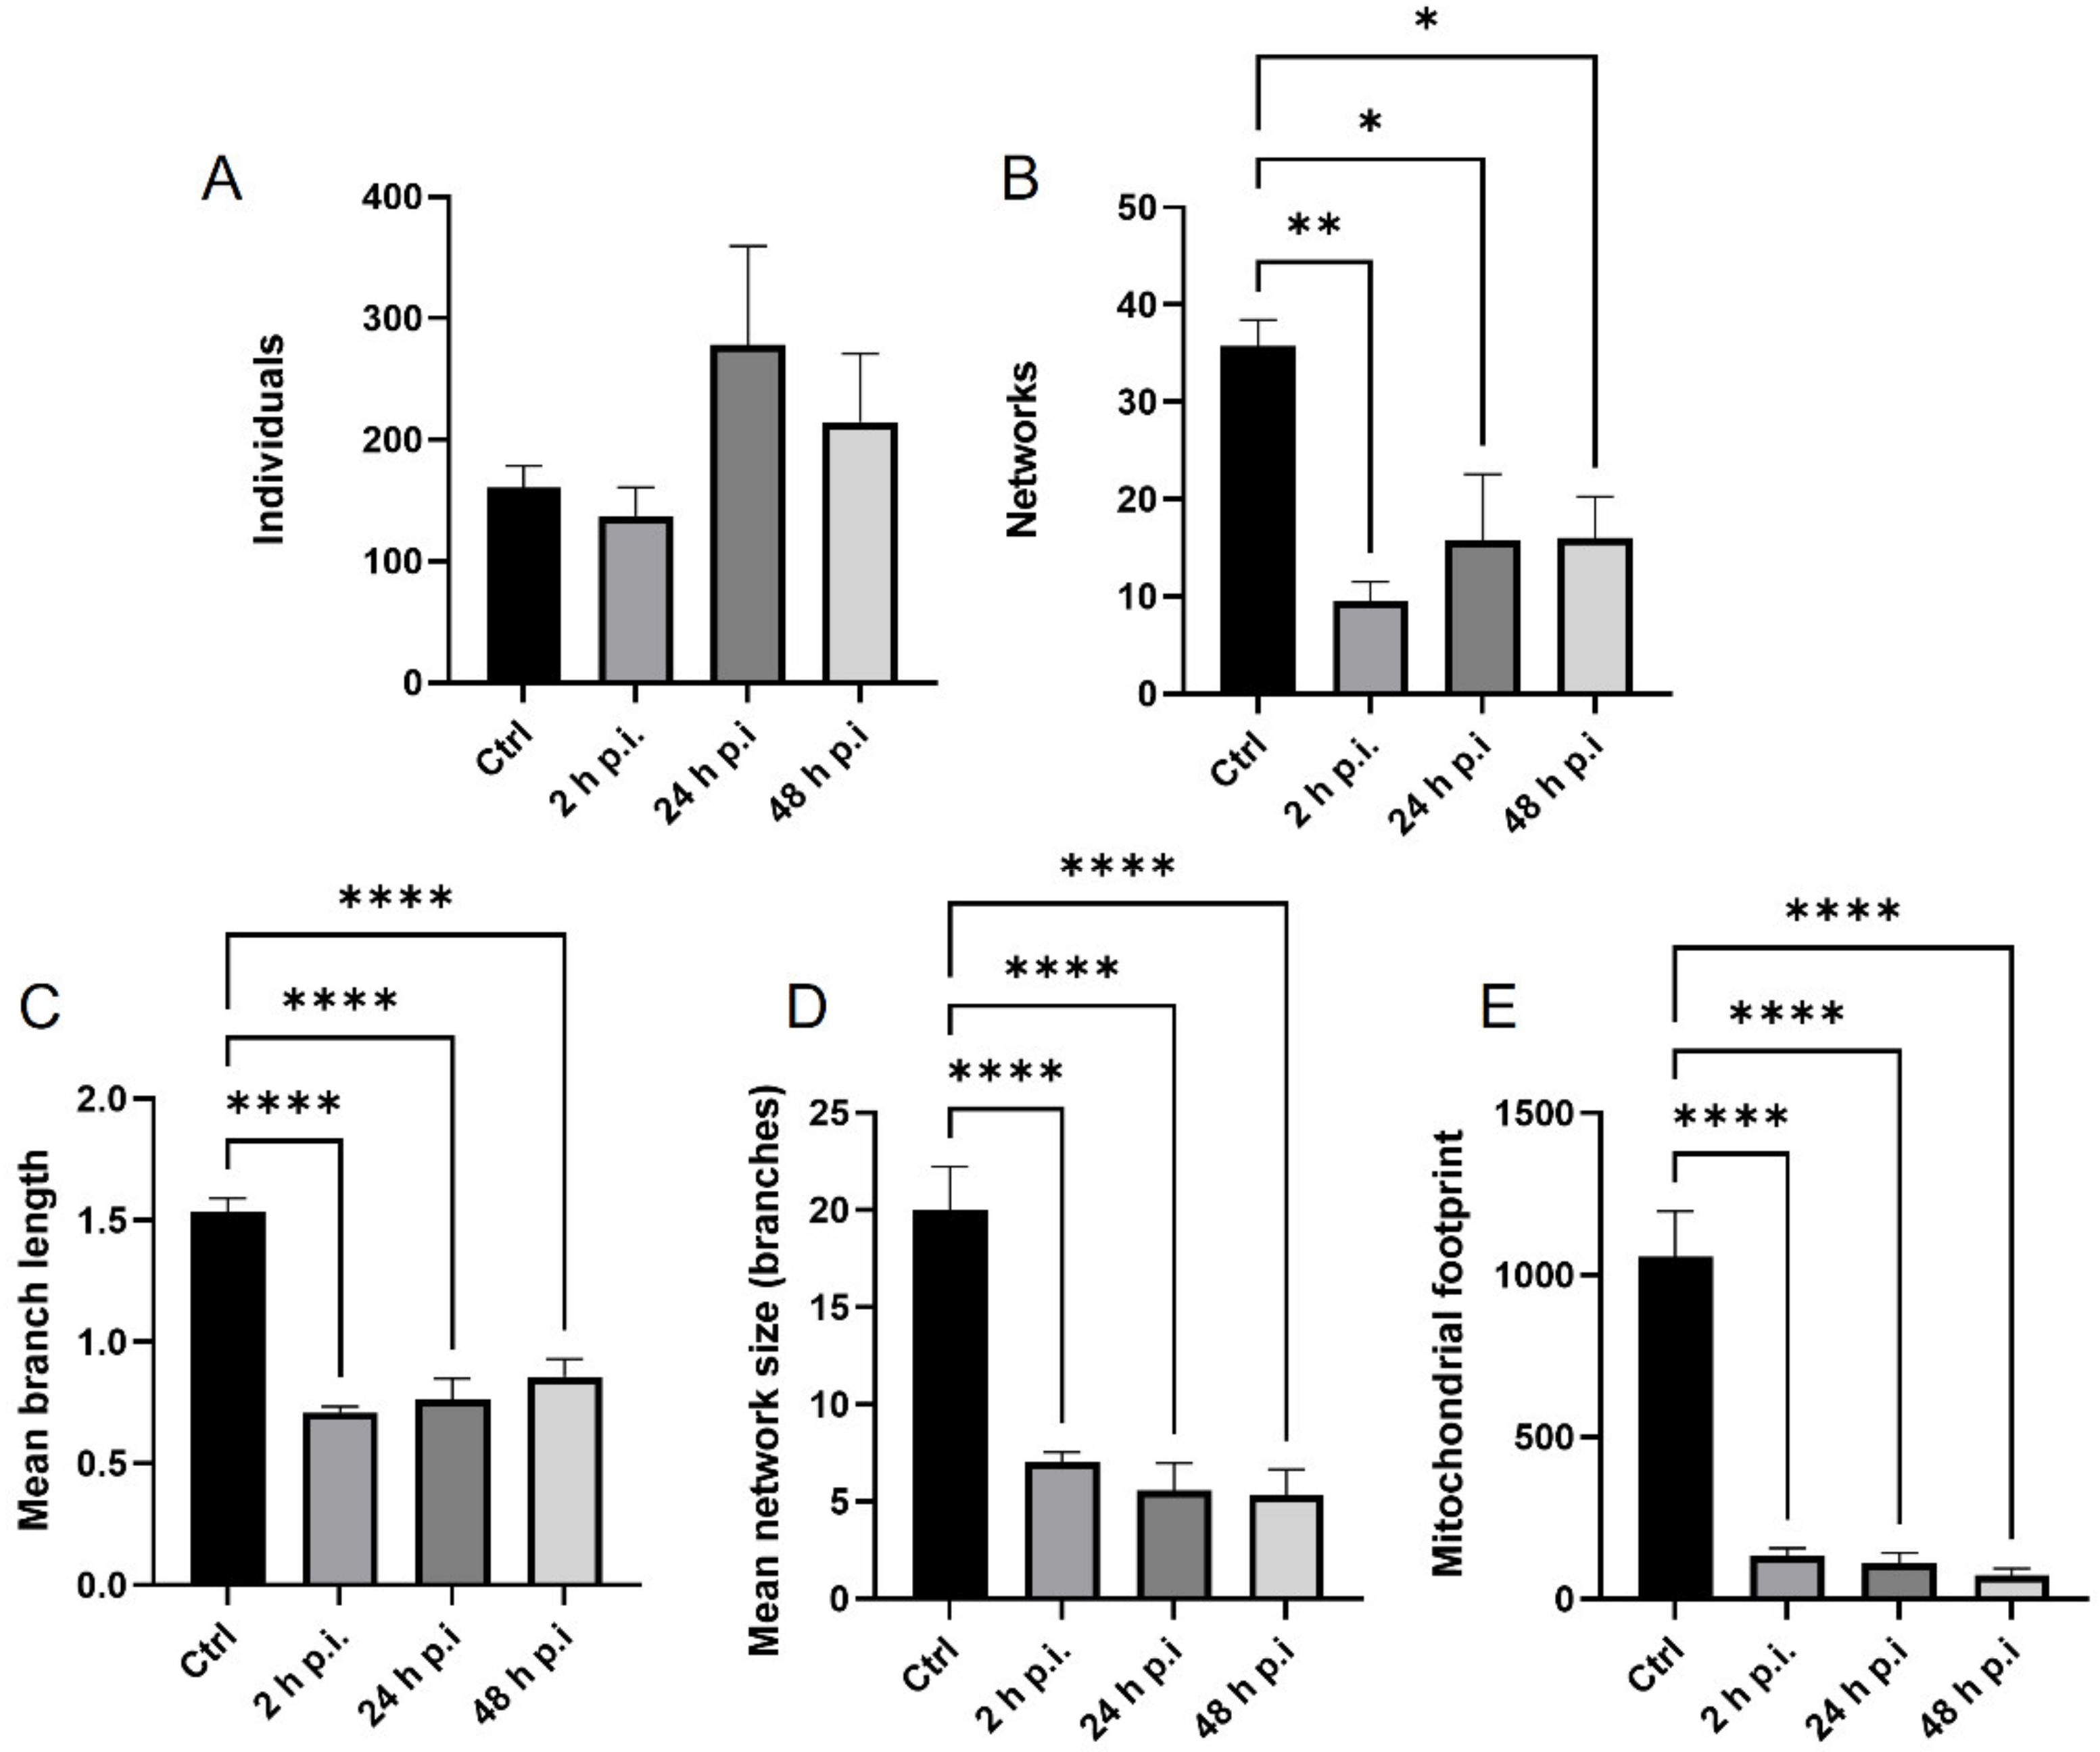
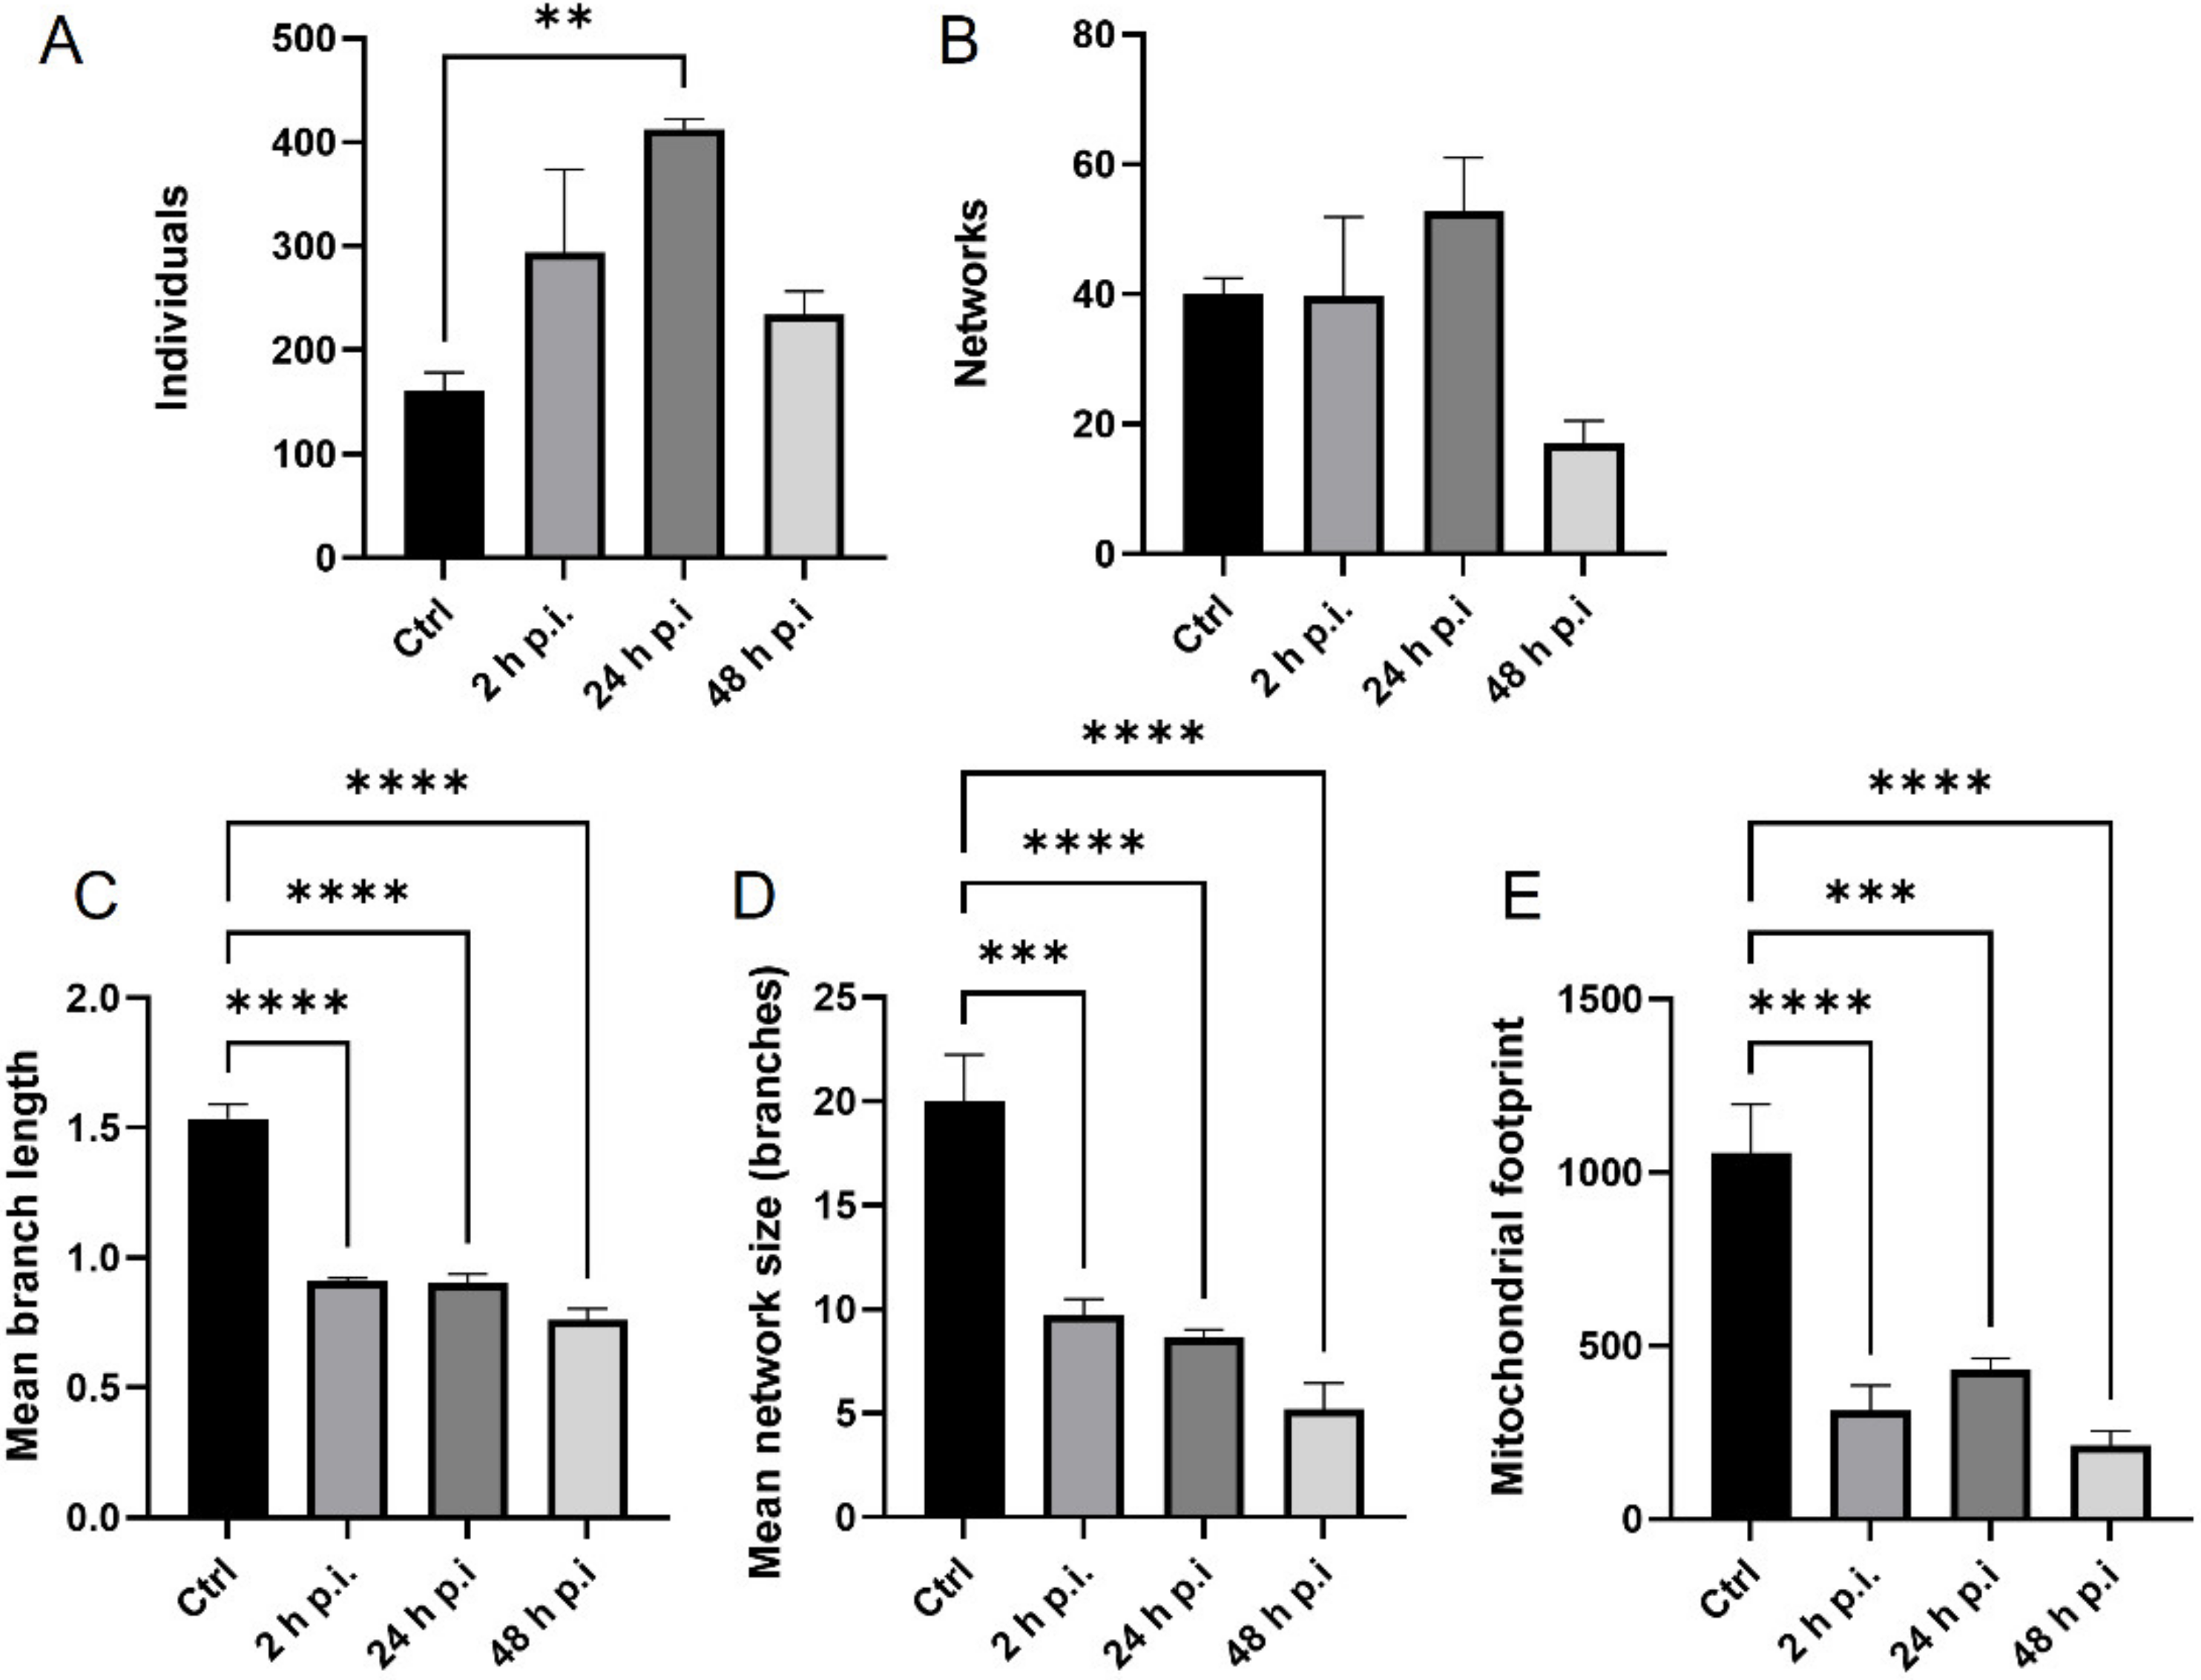
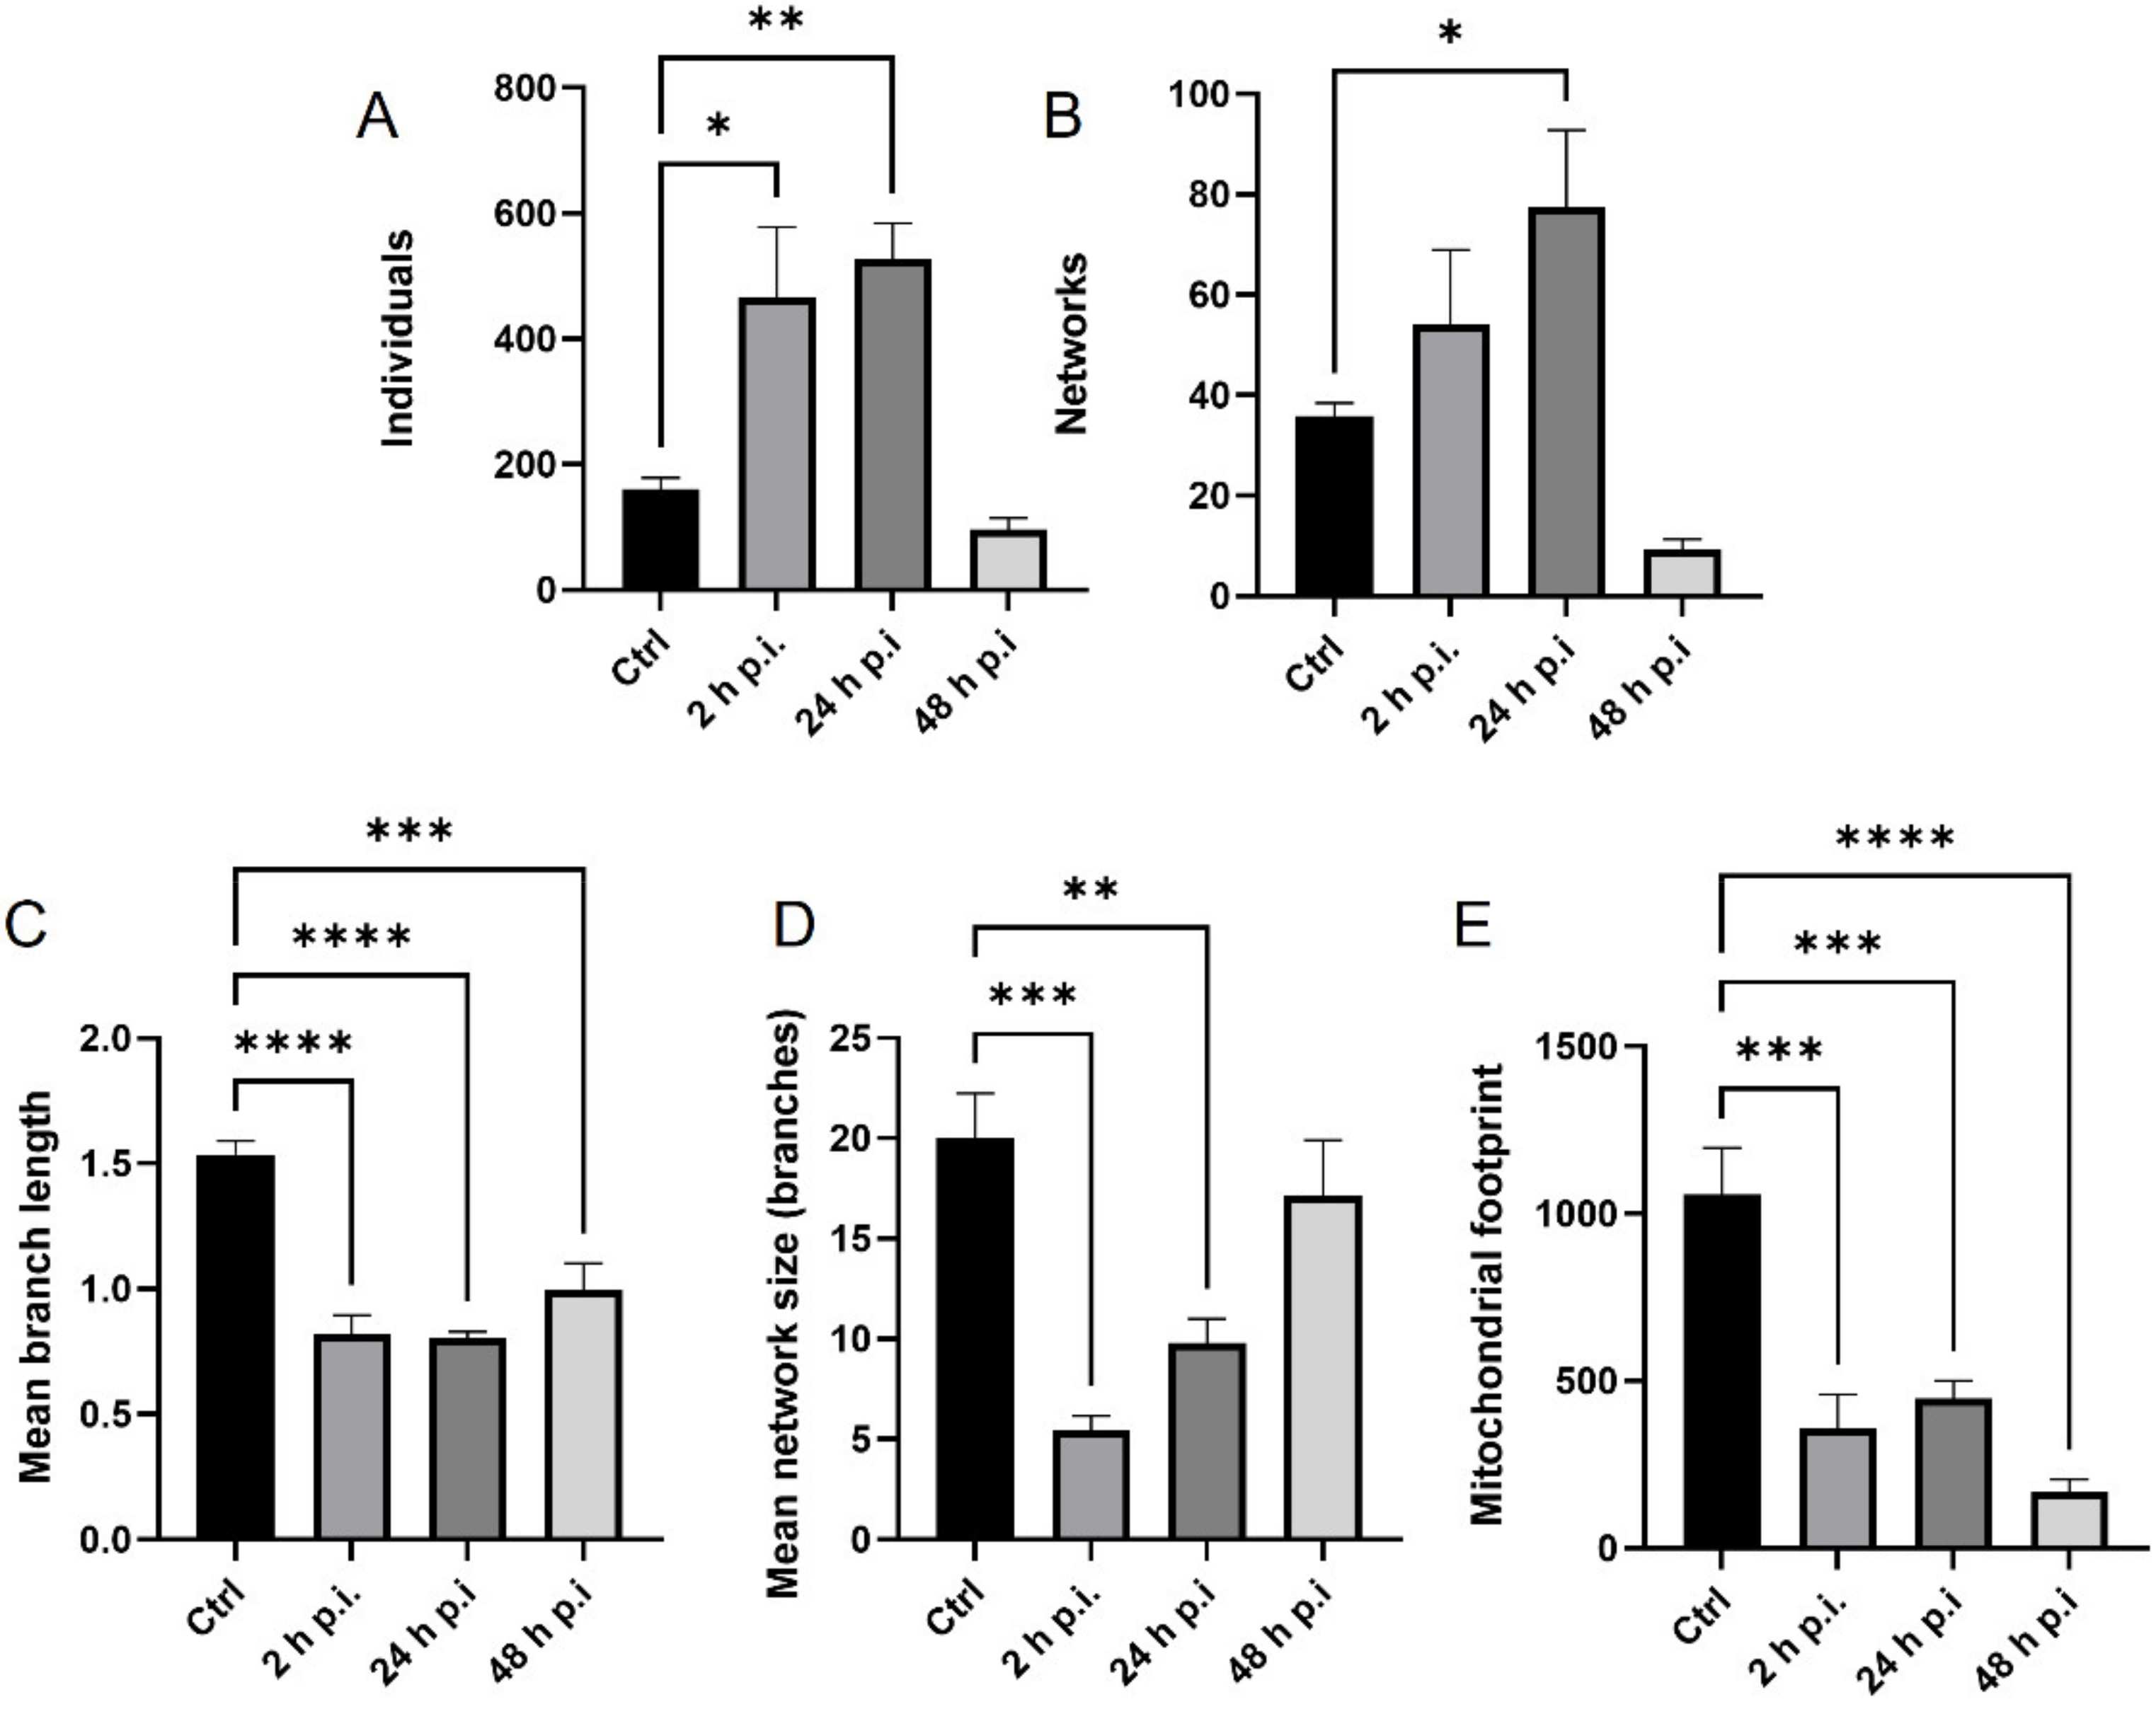
16,
17,
18,
19]. Here, we showed that after infection with all EHV-1 strains, changes in the mitochondrial network morphology occurred and were manifested mainly by its fission. The described changes appeared in the initial period of infection, i.e., at 2 h p.i. It can be assumed that they are connected with the migration of the virus to the cell nucleus to perform replication. The virus migrating to the nucleus uses elements of the cell cytoskeleton, which has been confirmed in our previous studies [
14,
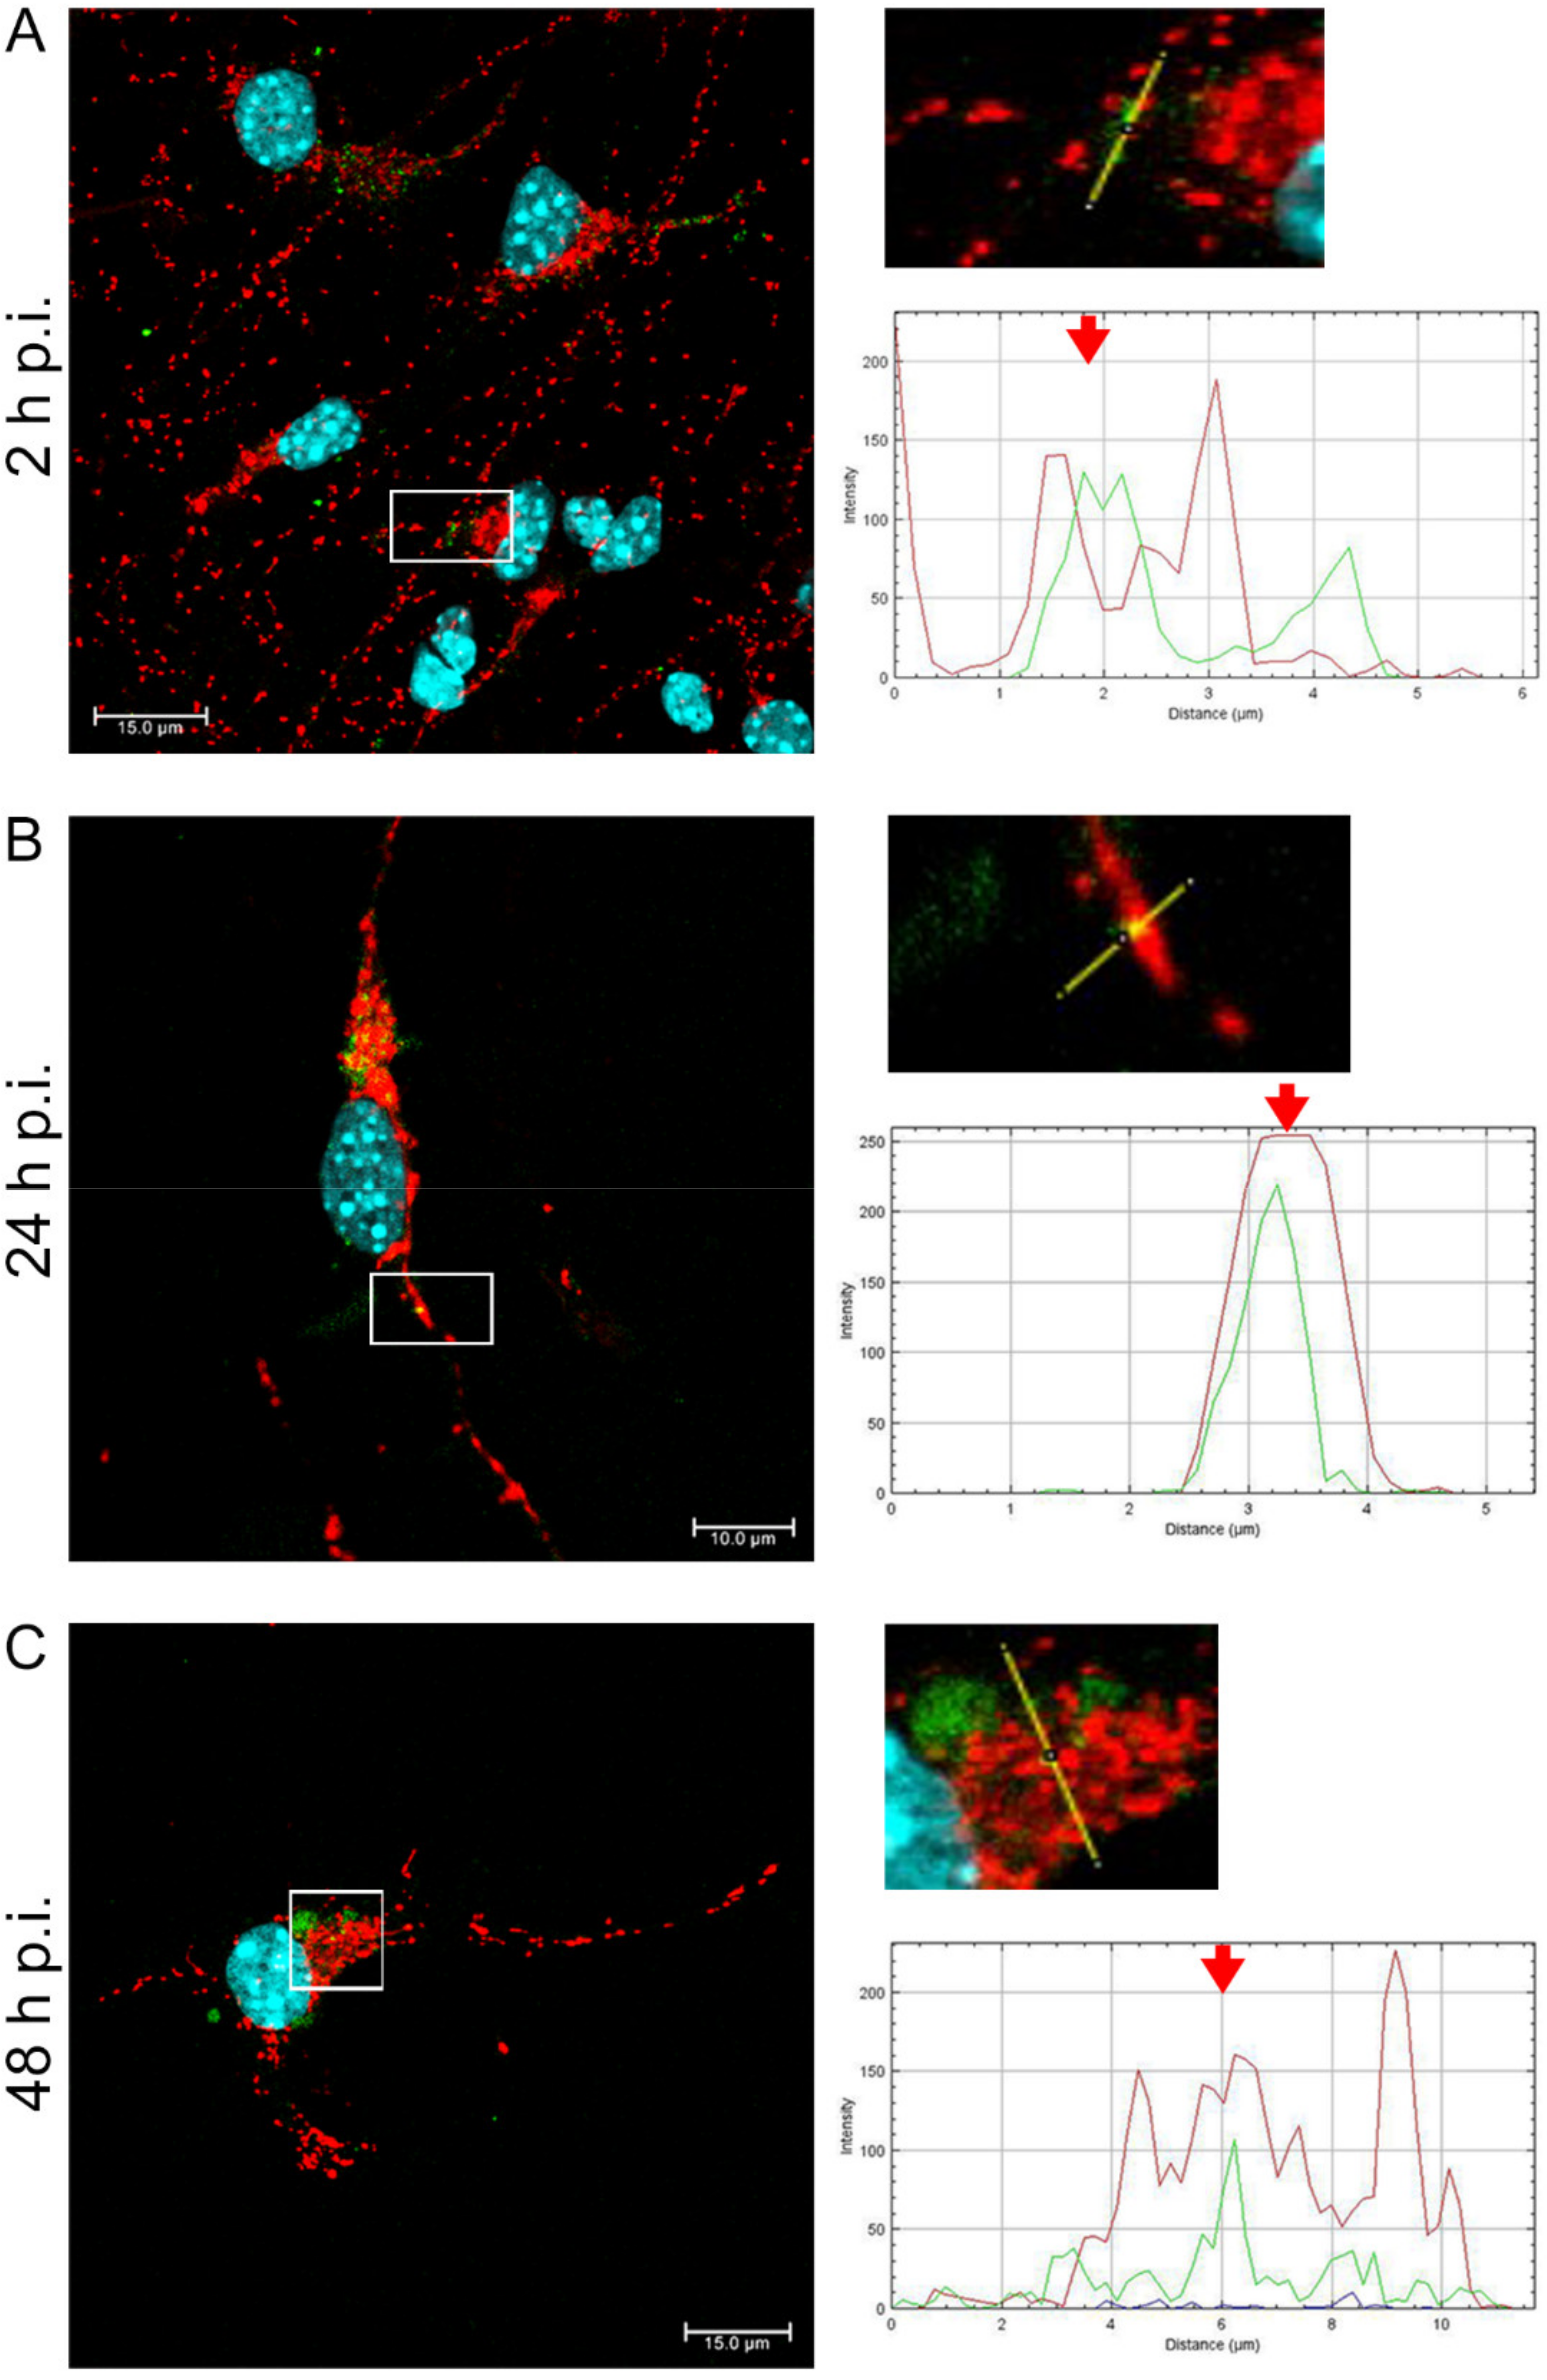
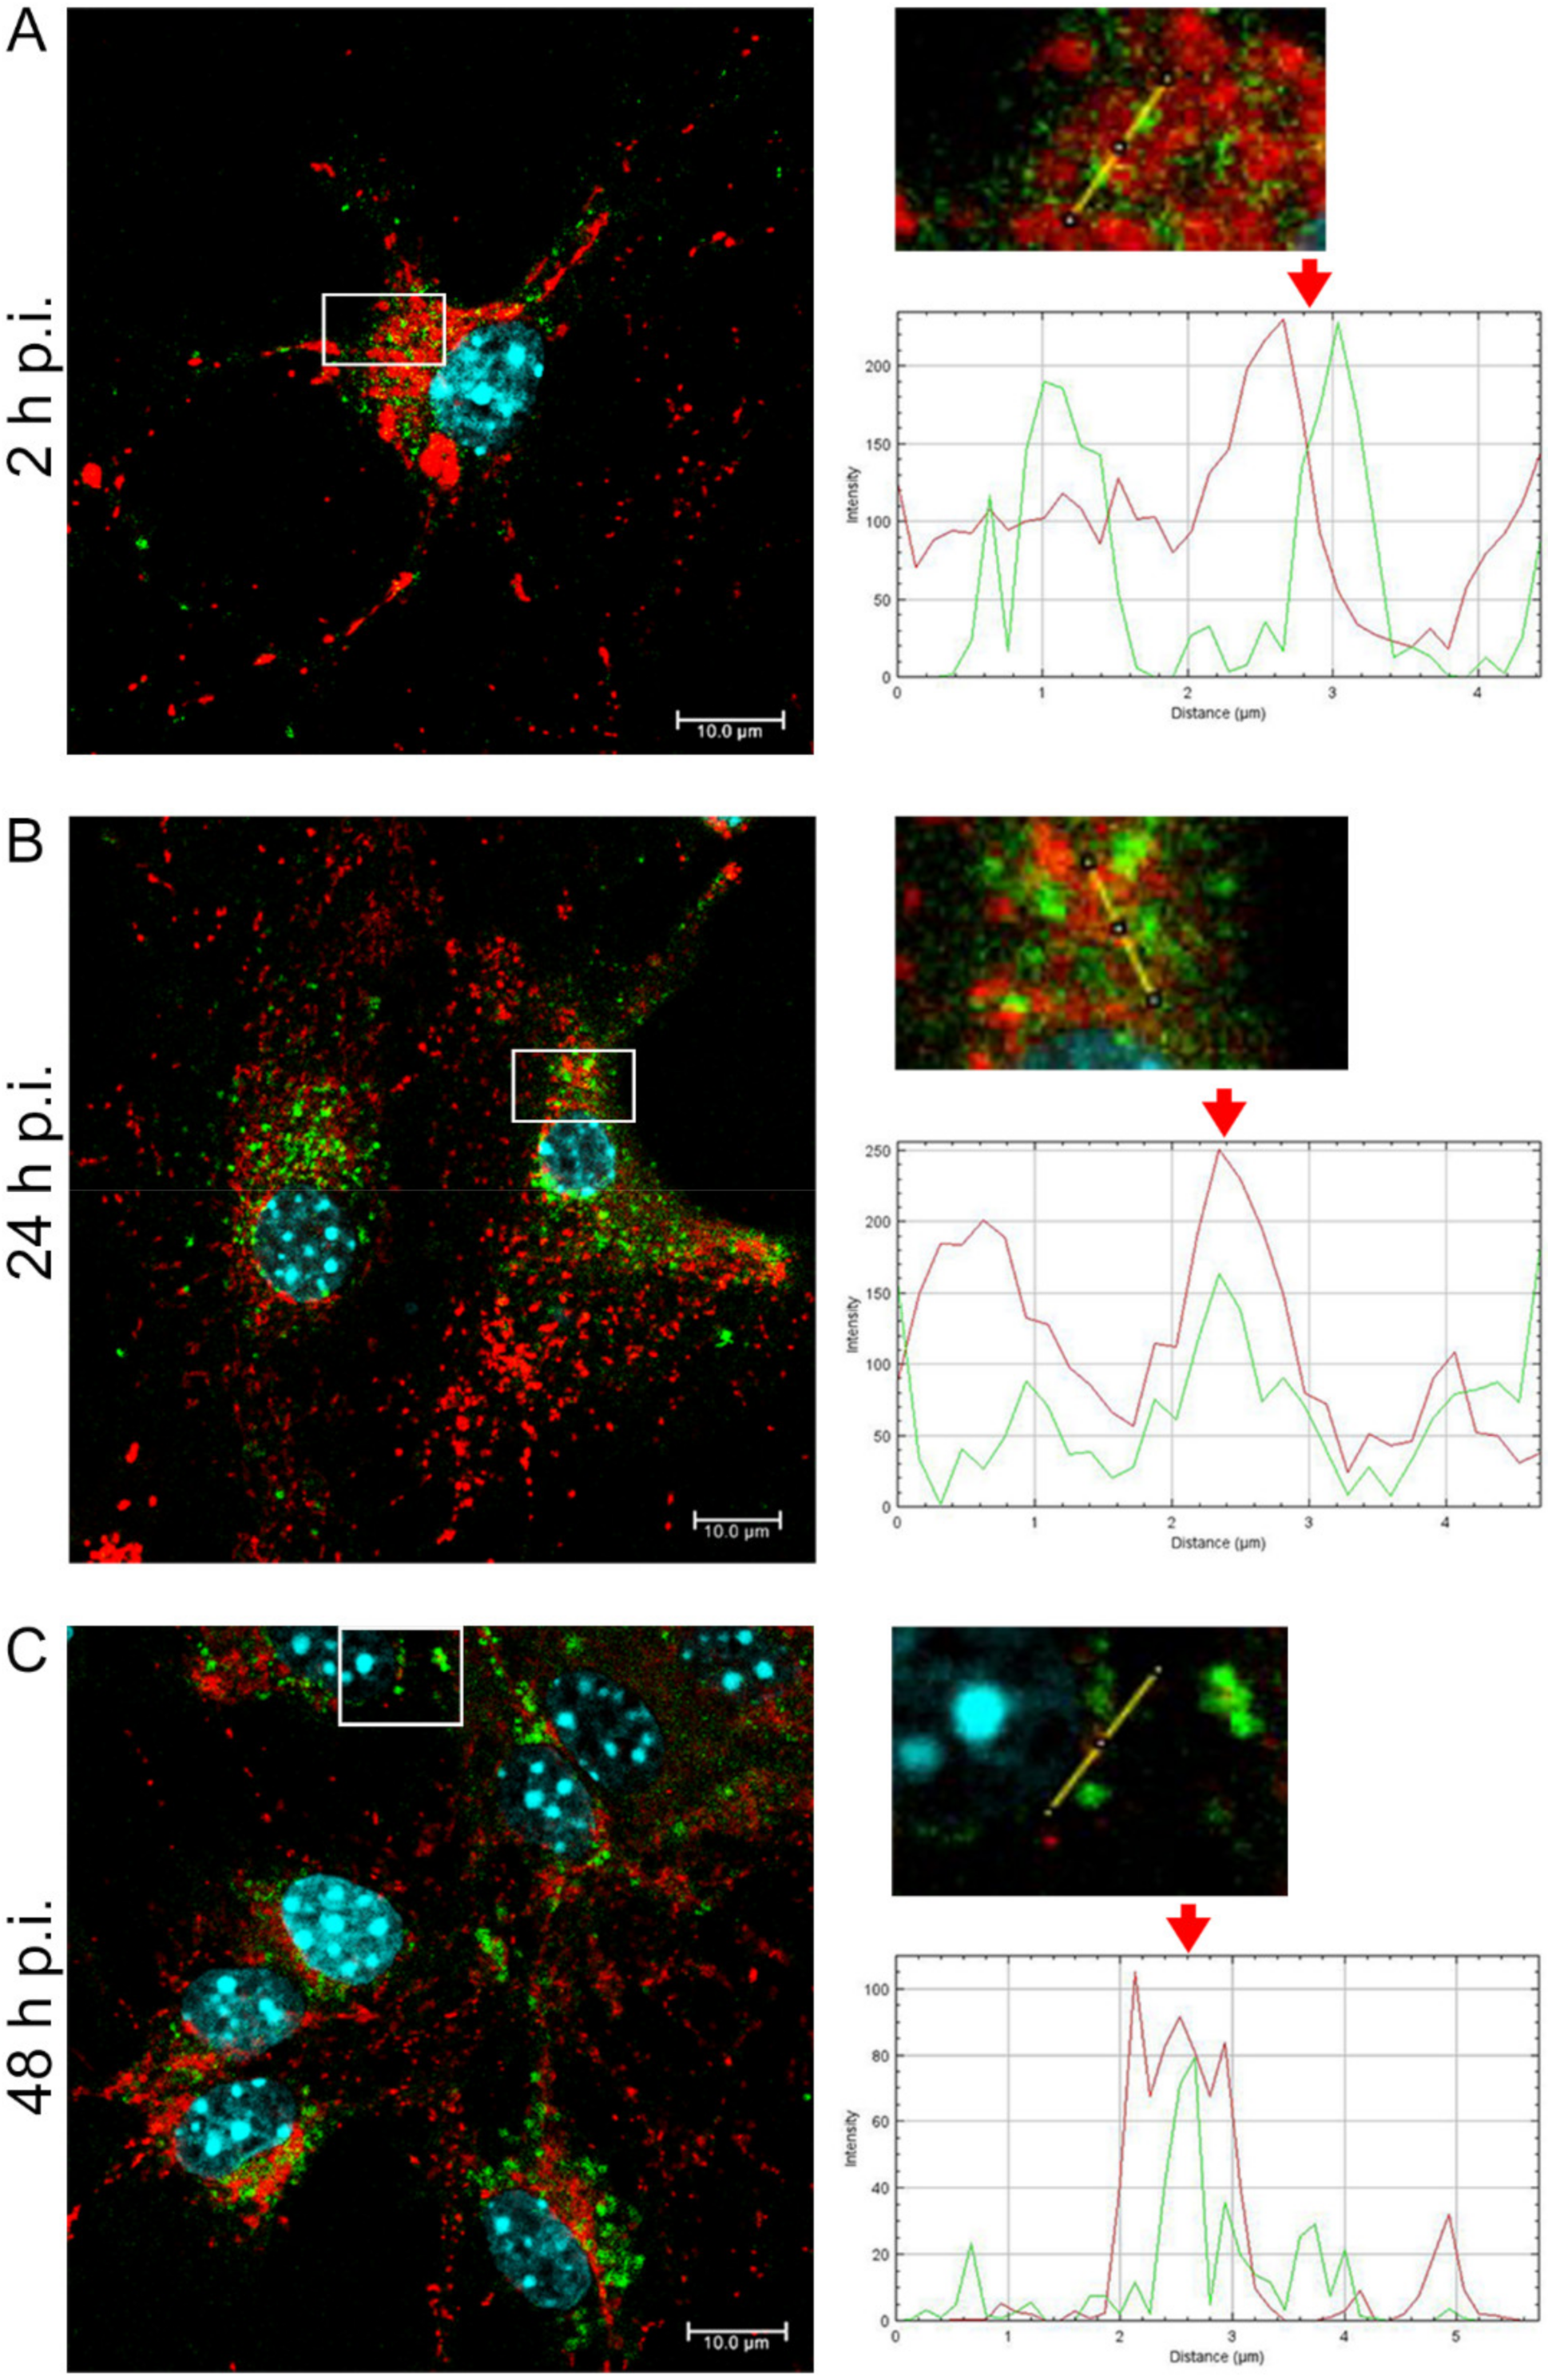
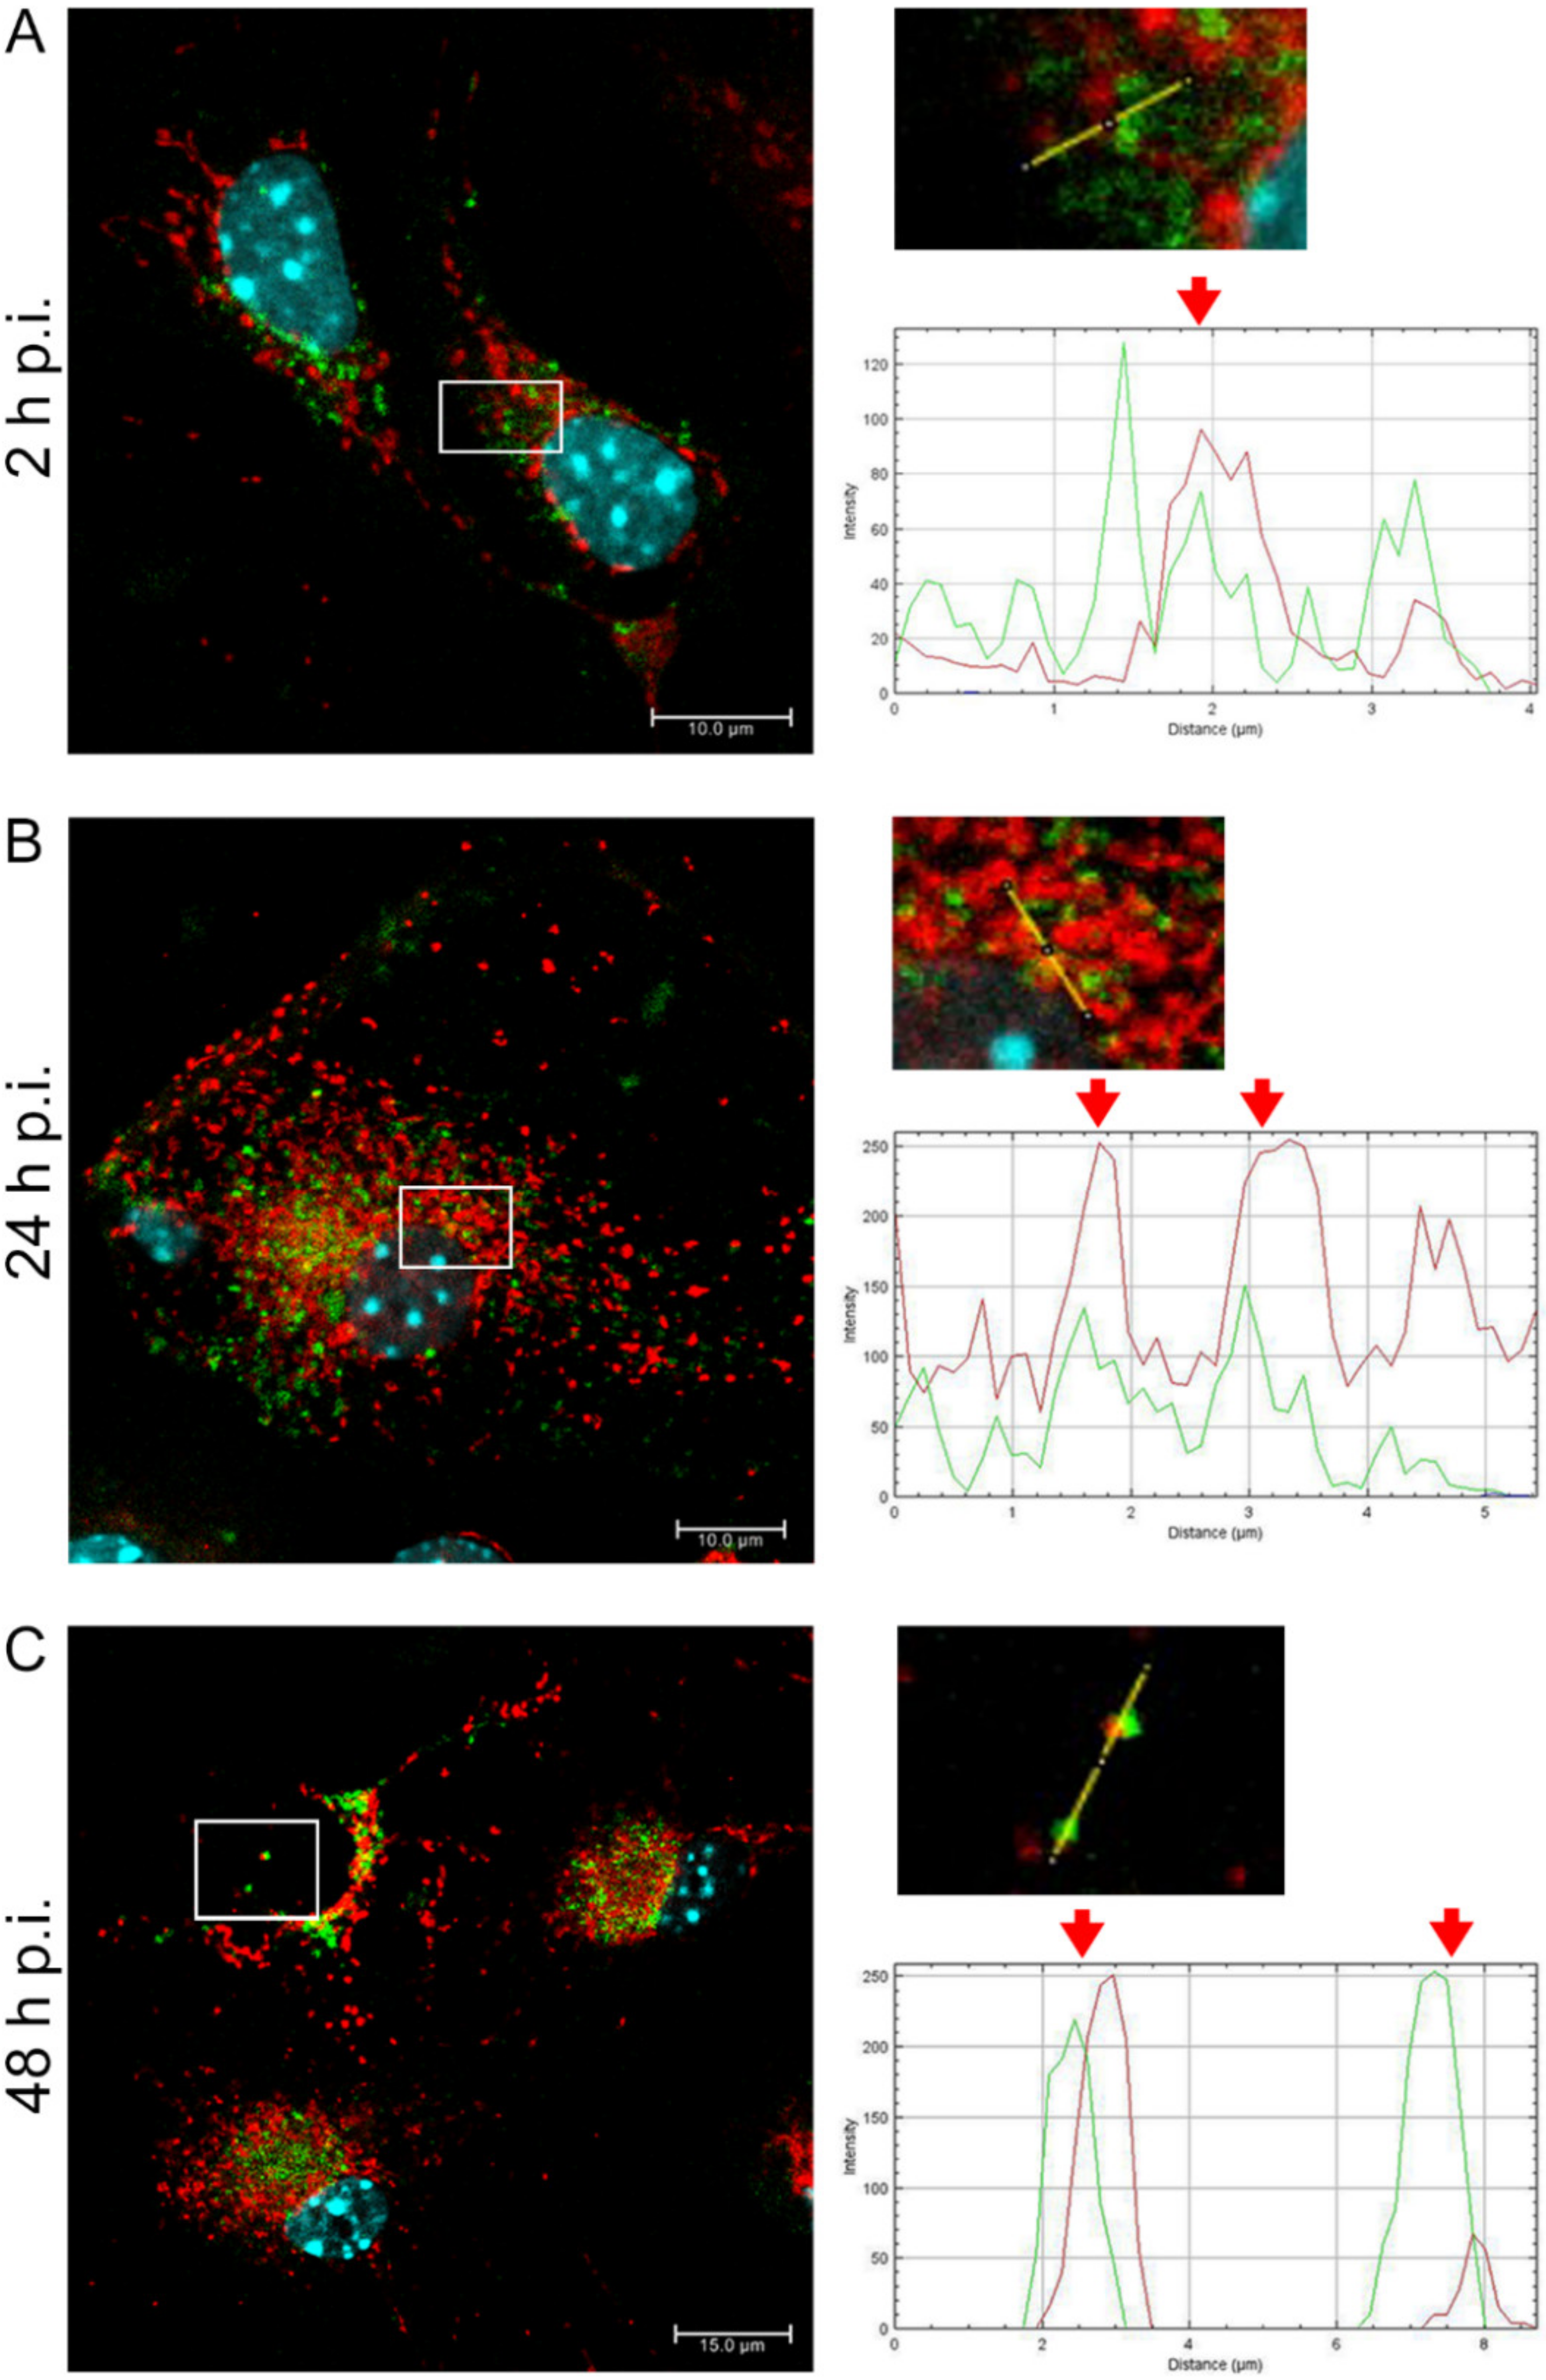
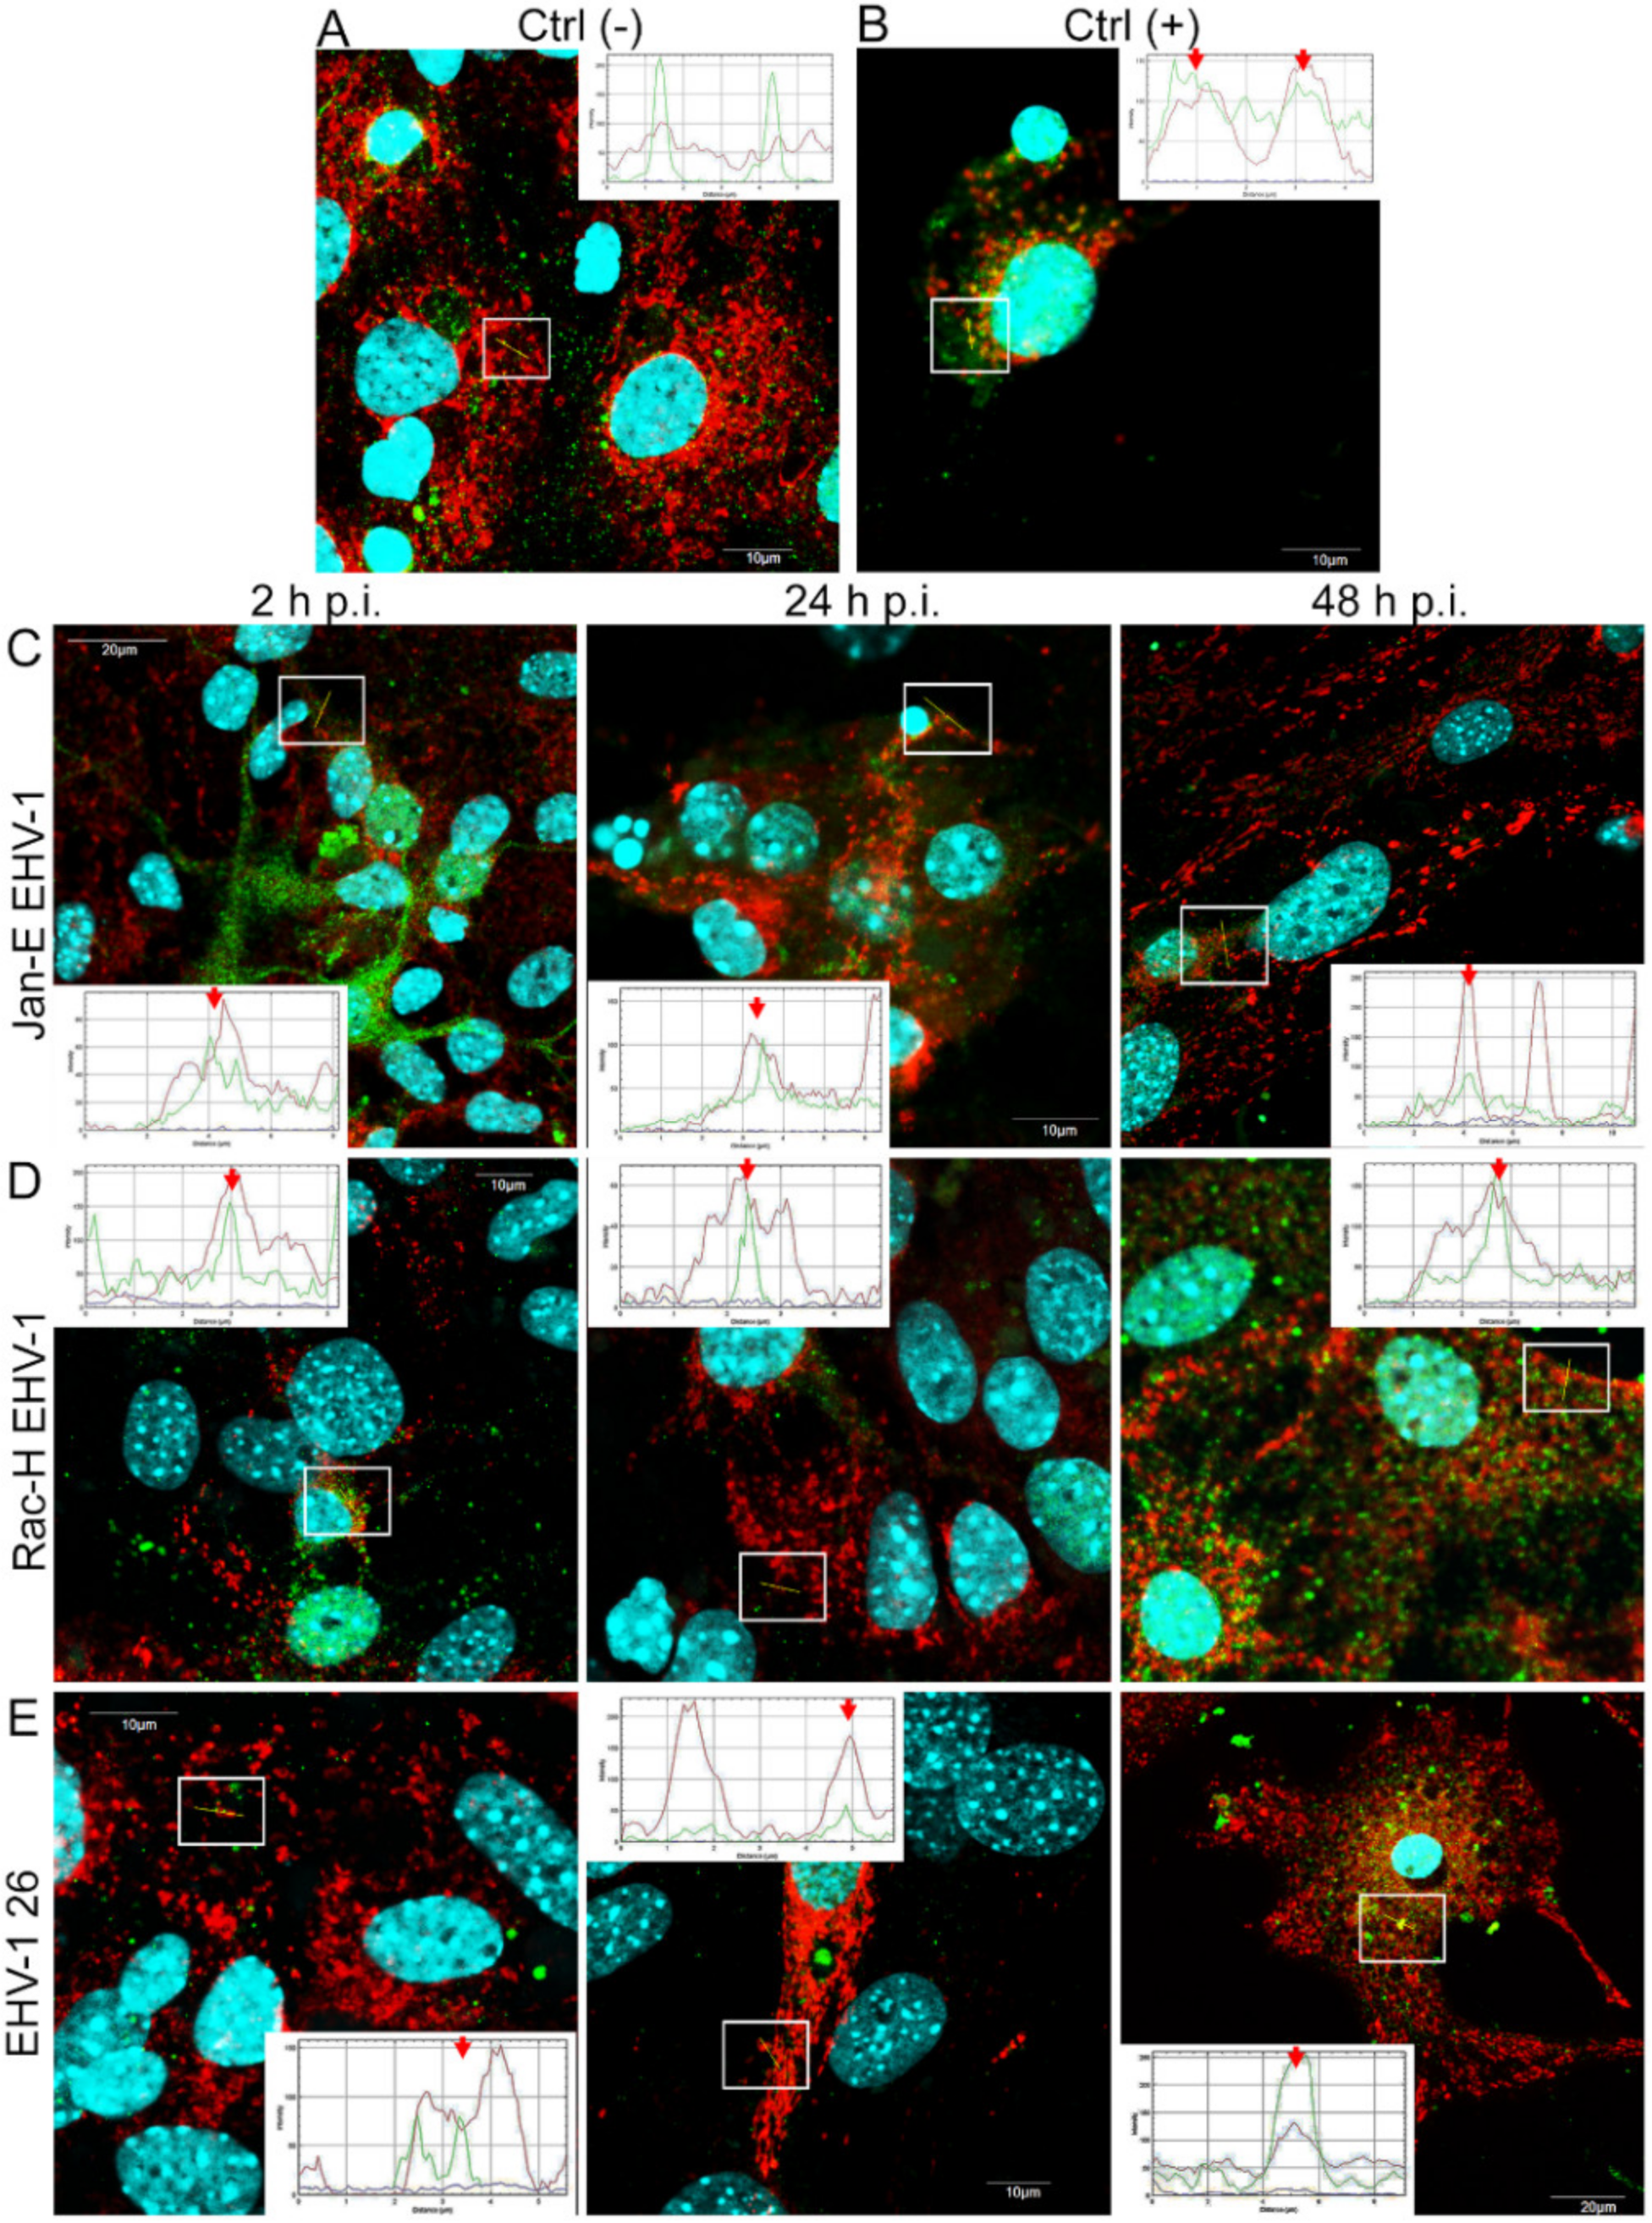
20]. Indeed, there is a possibility of inhibition of mitochondrial distribution, as it is supposed that mitochondria can "compete" with virions for space in the cytoskeleton. Murata et al. have shown that in Vero cells, mitochondria are recruited to the site of HHV-1 replication and morphogenesis. They have also demonstrated that mitochondria migrate to the perinuclear area where HHV-1 tegument was present. It is possible that mitochondria, as energy centers of the cell, provide the energy necessary for the replication of the virus. It has also been shown that the mitochondrial potential is stable up to 6 h post infection but decreases during the late phase of infection [
21]. Our studies show that EHV-1 infection causes an increase in mitochondrial punctate forms. Furthermore, we observed partial or complete colocalization of viral antigen with mitochondria. In our previous studies in a model of HHV-1 and HHV-2 infection, we obtained similar results. In HHV-1- and HHV-2-infected neurons, we observed increased fusion of the mitochondrial network. Furthermore, the translocation of the cytoplasmic protein Drp1 from the cytoplasm to the mitochondrial membrane was observed [
21,
22]. Studies on other herpesviruses also indicate that mitochondrial size changes during infection. Kramer et al. (2012) showed a decrease in mitochondrial size during SuHV-1 (SuHV-1, Aujeszky’s disease virus, ADV) infection [
23]. In addition, studies by Saffran et al., 2007 showed that it is possible to eliminate mtDNA and replace it with viral genetic material during the productive cycle. These studies shed new light on the role of mitochondria during viral infection. Damage to mtDNA accompanies many neurodegenerative diseases, so it is critical to determine the factors that influence mtDNA destruction during infection [
11]. Furthermore, swollen-like mitochondria, also known as megamitochondria, were observed during EHV-1 infection. This morphological type is associated with changes in permeability of ion channels, especially the so-called calcium megacanals [
24]. It has been experimentally demonstrated that both increased calcium ion concentration and the occurrence of free radicals cause permeability disruption of mitochondrial membranes, thus causing a change in their shape [
25].
After a complete replicative cycle of EHV-1 lasting about 18 h, mitochondria appeared in a punctate form. They continued to occur near the cell nucleus, probably serving as energy donors to transport the virus toward the cell membrane in the process of exocytosis. Migration and movement of cytoskeletal elements and assembly of progeny virions are processes that require energy supply [
15]. We observed perinuclear localization of mitochondria, which strongly suggest their involvement during EHV-1 virus assembly, occurring in the cell nucleus. This study remains consistent with other reports of perinuclear localization of mitochondria during infection. Hepatitis B virus (HBV), for example, produces the HBx protein that directs mitochondria toward the nucleus, even forming aggregates of these organelles [
26]. The morphological change in the mitochondrial network is often associated with its current physiological state. Previous studies reported that excessive mitochondrial network fission is associated with apoptosis [
27,
28]. Different results were obtained by [
22]. and Chodkowski et al, 2017, who showed that despite the fission of the mitochondrial network, the functioning of these organelles was preserved; moreover, during infection, some parameters such as mitochondrial potential were normalized compared to control cells, which does not indicate apoptosis. Therefore, to fully assess the functionality of mitochondria during EHV-1 infection, several indicators of the functioning of these organelles should be taken into account. In this study, we decided to investigate not only the morphology of the mitochondrial network but also such parameters as mitochondrial mass, ROS production, the occurrence of mitophagy, and changes in the level of mitochondrial gene expression during infection.
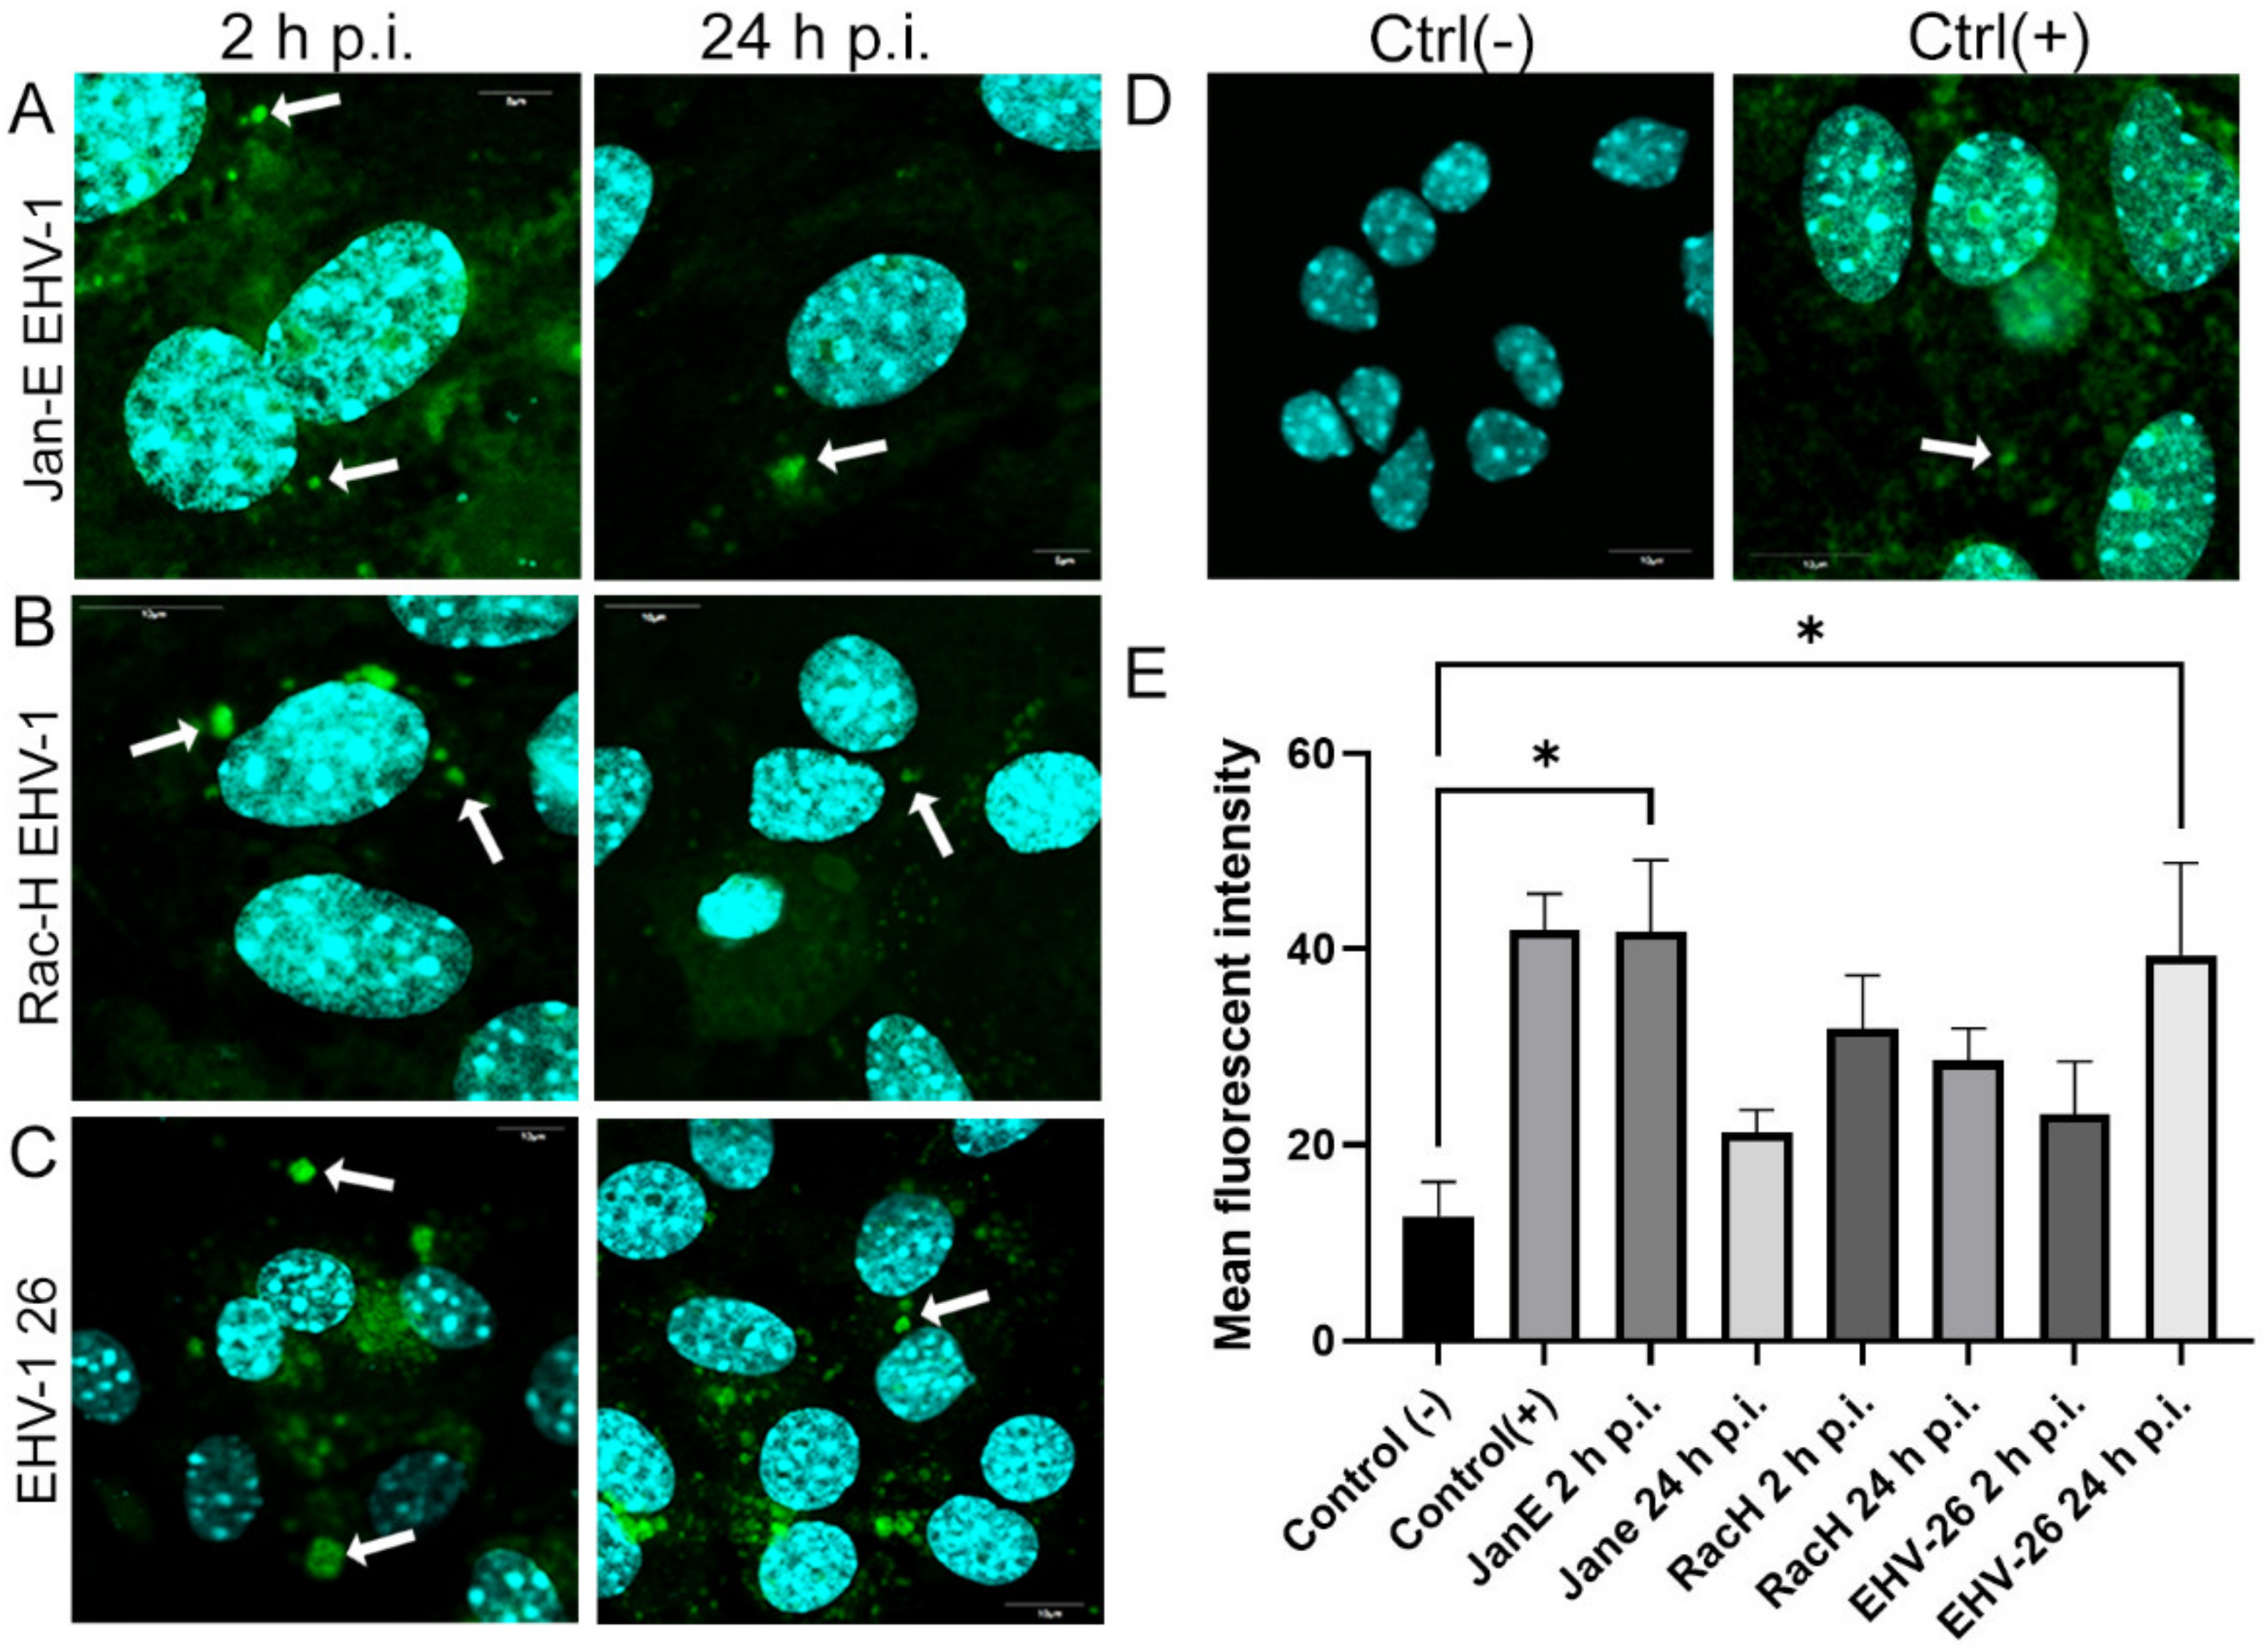
In this study, we analyzed the production of ROS during infection. Upon infection with non-neuropathogenic Jan-E and Rac-H EHV-1, the highest increase in ROS occurred at 2 h p.i., followed by a decrease observed at 24 h p.i. Our team previously showed that the Jan-E EHV-1 and Rac-H EHV-1 induced apoptosis only in a small population of cells [
14]. Different results were obtained upon infection with the EHV-1 26, where a higher amount of ROS was present at 24 h p.i. As indicated by our previous studies, infection with EHV-1 26 induces hyperphosphorylation of Tau protein, considered as an indicator of neurodegeneration. Therefore, high levels of ROS may be related with these processes [
29]. The amount of ROS seems to be an important indicator for the proper functioning of mitochondria and the whole cell. Similar results were obtained for HHV-1 and HHV-2 infections, where also the amount of ROS was highest at the beginning of the infection [
22]. In contrast, researchers studying viruses whose replication cycle occurs in the cytoplasm obtained different results. For ectromelia virus (ECTV), a gradual increase in the amount of ROS was observed during infection, where it reached its highest value only at the end of the infection [
3]. Neurons are characterized by a much broader spectrum of mechanisms protecting against oxidative stress than other cells. It has been shown that ROS can affect axonal growth in cell lines such as PC12 and SH-SY5Y. Therefore, the infected cells where large amounts of ROS are produced may have a different morphology and a different distribution of the mitochondrial network [
30].
Cytometric analysis of the mitochondrial inner-membrane potential demonstrated a decrease in IMM potential after infection. The decrease was low for Jan-E and Rac-H EHV-1 infection at both 2 and 24 h p.i. In contrast, different results were obtained for the neuropathogenic strain, where the decrease was more pronounced at the initial stage of infection and the IMM potential normalized at the final stage, relative to the negative control. The results obtained upon infection with the EHV-1 26 are consistent with HHV-1 and HHV-2 infection, where a higher decrease in potential was also observed very early during infection. For other viruses, such as ECTV, a gradual decrease in potential was observed with the progression of infection [
3,
22]. Furthermore, several authors described various viral proteins localizing to the IMM or OMM and disrupting the electrochemical gradient necessary for ATP synthesis [
31]. For example, HIV R protein (Vpr protein) localizes to mitochondria and binds to ANT (adenine nucleotide translocase), causing a decrease in IMM potential. The influenza virus type A protein PB1-F2, in turn, interacts with anion channels, thereby causing a decrease in the potential and activation of proapoptotic proteins [
3,
22,
31,
32,
33].
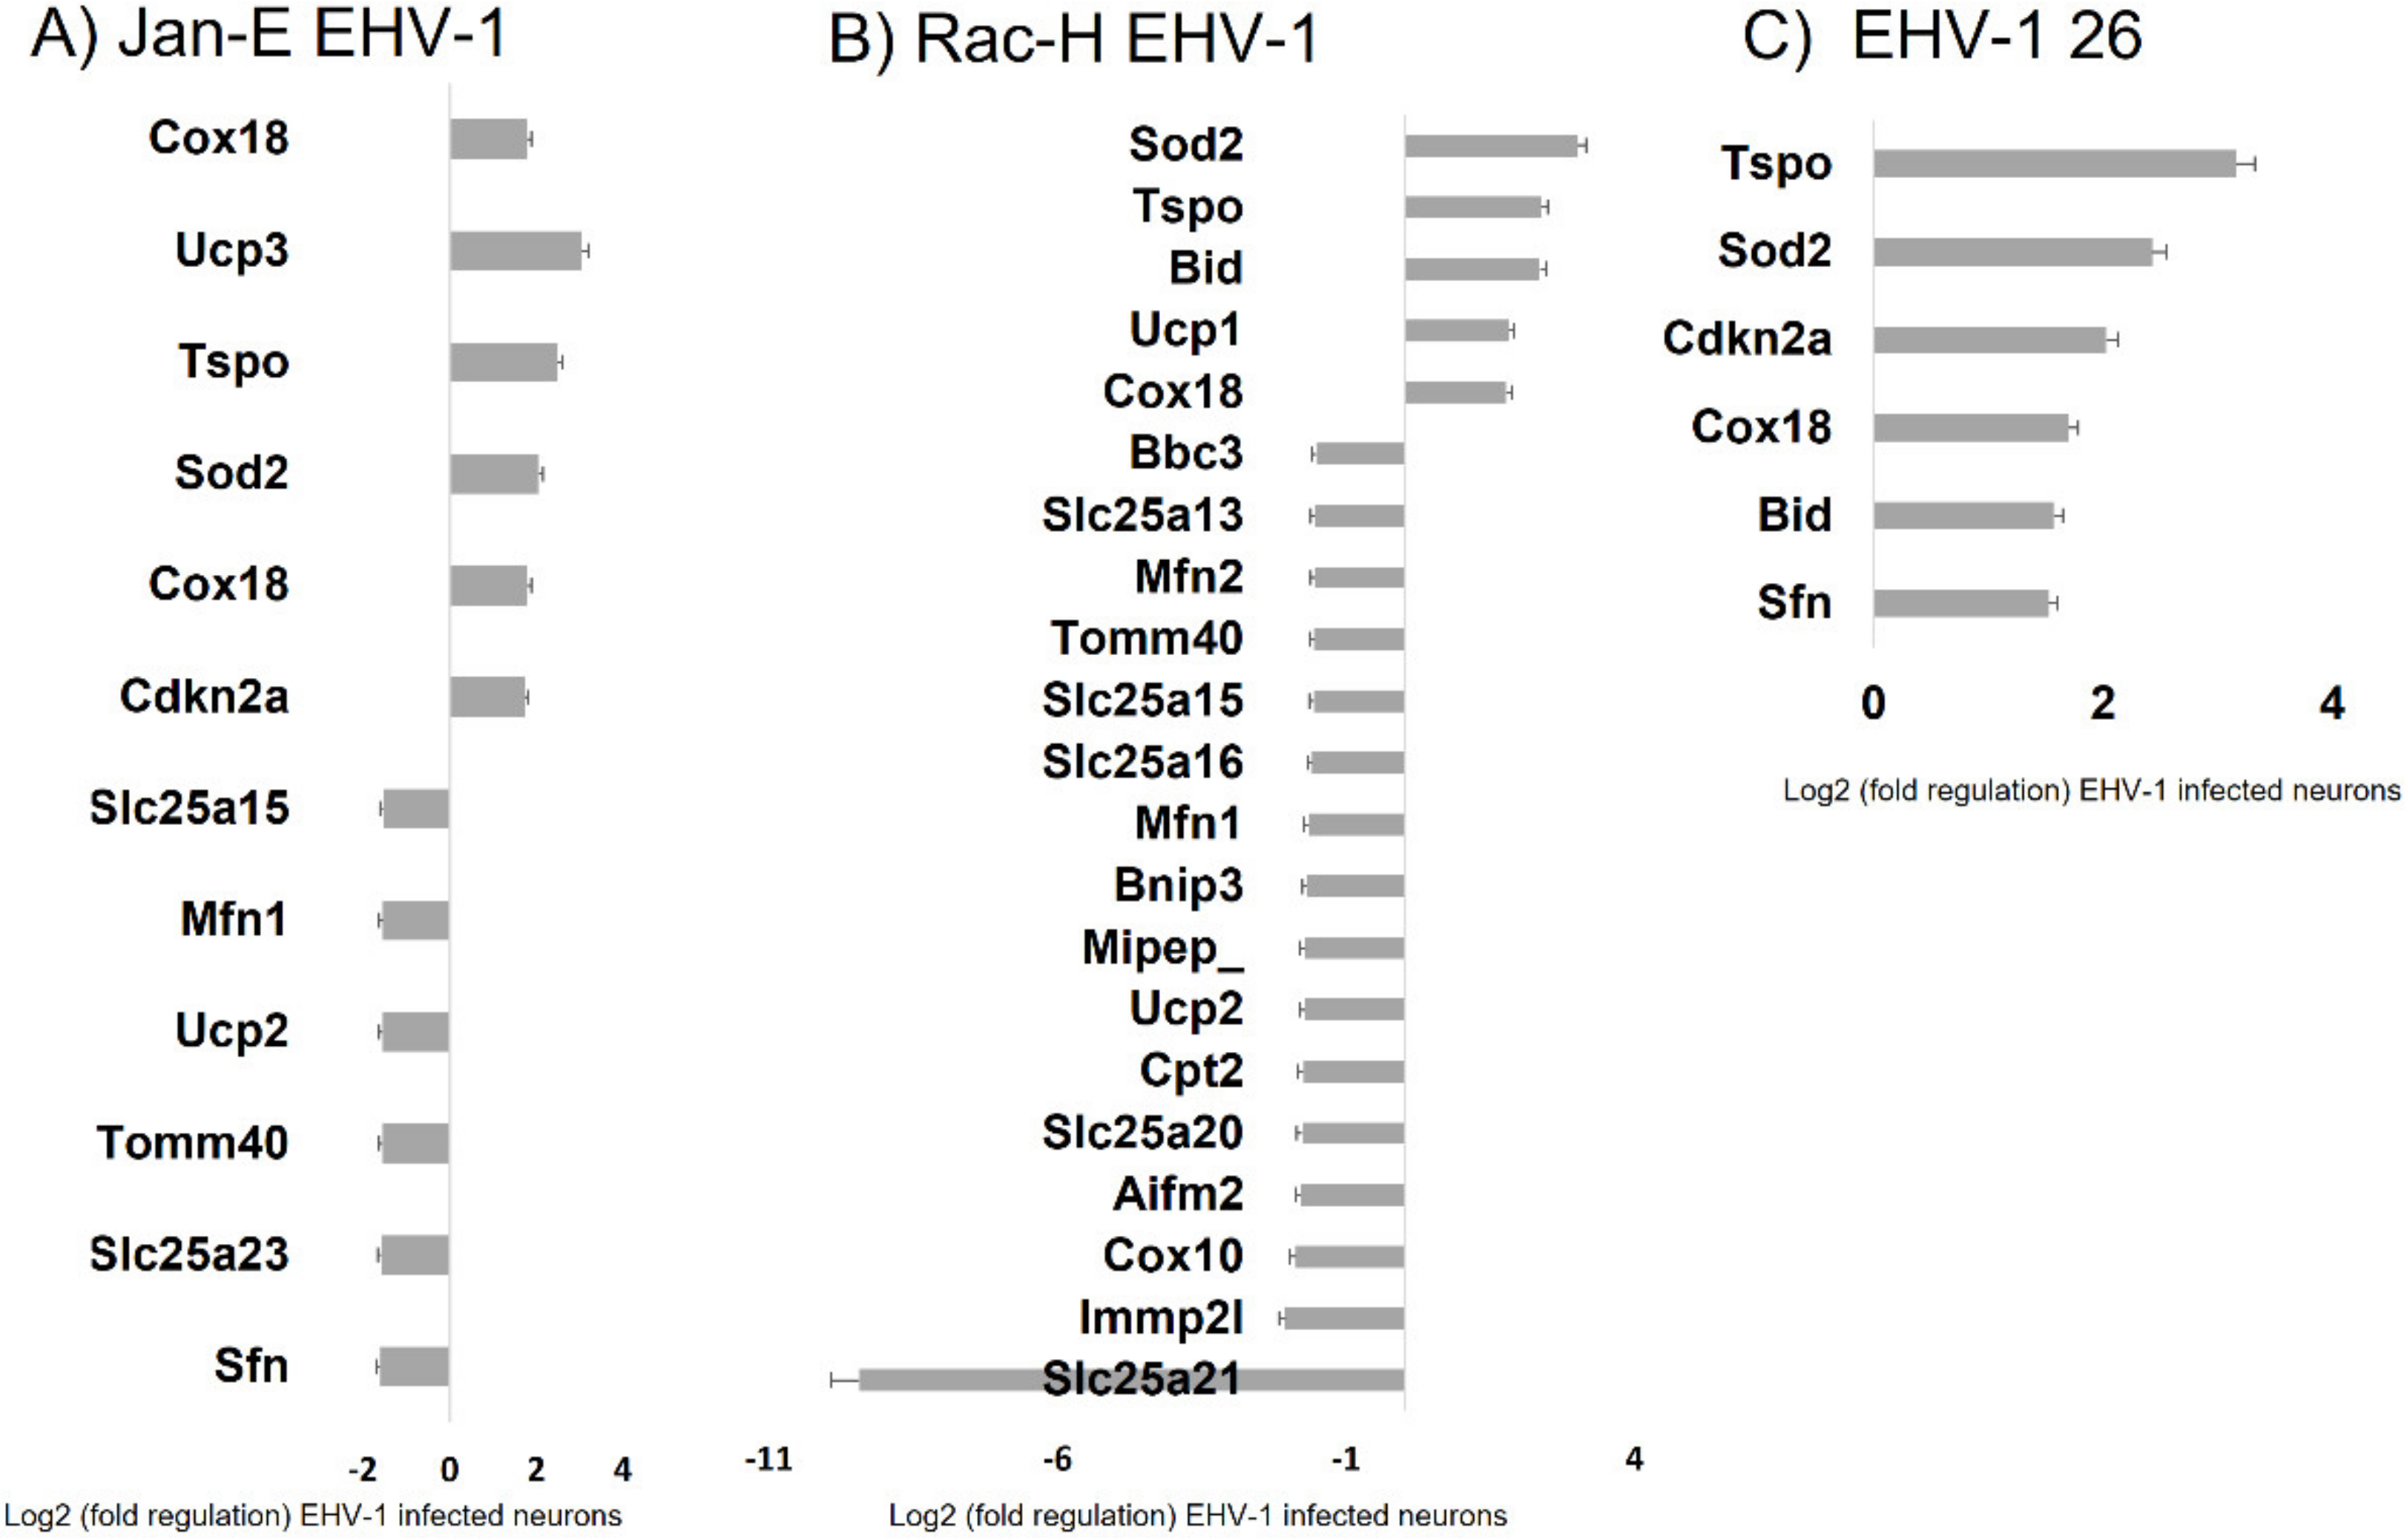
For all three EHV-1 strains there was an increase in expression of three genes:
Sod2, Tspo, and
Cox18. The
Sod2 (superoxide dismutase 2) protein is responsible for reducing the number of reactive oxygen species and converting to hydrogen peroxide [
34]. The increase in expression of this gene is in line with the demonstrated increase in ROS after EHV-1 infection. An increase in the expression of the
Cox18 gene related to cytochrome c oxidase was also observed. The product of this gene enables the translocation of the oxidase subunit across the inner membrane. Therefore, it is important for the proper conduct of electron transport along the respiratory chain [
35]. Another gene that was down-regulated during infection with all EHV-1 strains was
Tspo, responsible for mitochondrial transport. Experimentally, the Tspo protein has been shown to play a key role in the assembly of the HIV envelope, specifically its Env glycoprotein component. A more than 64-fold increase in the expression of this gene was observed in HIV-infected cells. Interestingly, when the
Tspo gene is turned off, the resulting glycoprotein is rapidly degraded [
36]. EHV-1 antigens also localized near mitochondria and partially colocalized with them, which may also indicate that mitochondria are involved in the production of viral envelope elements. The Tspo protein is also considered a biomarker for neurodegenerative diseases such as Alzheimer’s disease. For EHV-1 infection, the increase in expression of this gene was highest in the neuropathogenic strain EHV-1 26, which also makes it a good marker for neuroinfections with EHV-1 etiology.
In summary, we demonstrated that EHV-1 infection of neuronal cells leads to specific morphological and functional modifications at the early stage of infection, followed by colocalization of mitochondria with EHV-1 in the perinuclear area. The results indicate that mitochondria play an important role during EHV-1 replication both at the early stage and later during infection.
4. Materials and Methods
4.1. Neuronal Culture
Balb/c (H-2d) mice susceptible to EHV-1 infection were used to establish primary culture of murine neurons, according to the procedure described previously [
6,
12]. Neurons were cultured in B-27 neuron plating medium (neurobasal medium, B27 supplement, 200 mM glutamine, and 10 mM glutamate) supplemented with antibiotics (penicillin and streptomycin), 10% fetal bovine serum (FBS) and 5% horse serum (HS) (Gibco, Thermo Fisher Scientific, Waltham, MA, USA). The cells were maintained 37 °C with 5% CO
2. At day 3 post plating, cells were treated with 10 μM cytosine β-D-arabinofuranoside (Sigma-Aldrich, St. Louis, MO, USA) for 24 h to eliminate non-neural cells. Next, the medium was removed and replaced with neuron feeding medium (B-27 neuron plating medium without glutamate). Prior to treatments, the cells were cultured for 6 days at 37 °C with 5% CO
2.
4.2. Viruses and Cells Infection
Three different strains of EHV-1 were used to infect neuronal cultures: non-neuropathogenic, reference Rac-H (149th passage in ED cells) and non-neuropathogenic Jan-E (12th passage in ED cells) strains isolated from the aborted fetus (neuropathogenicity confirmed by a PCR-RFLP neuropathogenic/non-neuropathogenic discrimination test) [
15], and a neuropathogenic EHV-1 strain (EHV-1 26, 15th passage in Vero cells) isolated from an aborted fetus in Hungary in 2004 (neuropathogenicity confirmed by PriProET technique) [
37]. The viruses were propagated in equine dermal (ED) and Vero cell cultures, as described previously [
6,
12]. Neurons were infected with Jan-E, Rac-H, or EHV-1 26 EHV-1 strains at MOI (multiplicity of infection) of 1.0 for 60 min at 37 °C. Neurons were collected at 2, 24, or 48 h p.i.
4.3. Immunofluorescent Labeling and Confocal Microscopy Analysis
Primary murine neurons seeded on glass coverslips (coated with poly-D-lysine and laminin) were infected with Jan-E, Rac-H, or EHV-1 26. At 2, 24, and 48 h post infection (h p.i.), cells were incubated for 30 min at 37 °C with 100 nM MitoRed (Sigma-Aldrich) to visualize the mitochondrial network morphology and distribution. To detect the colocalization of EHV-1 antigens and LC3B, cells were fixed with 3.7% PFA in PBS for 20 min. Fixed cells were permeabilized with 0.5% Triton X-100 (Sigma-Aldrich) in PBS (15 min) and blocked with 1.5% bovine serum albumin (BSA, Sigma-Aldrich) in 0.1% Triton X-100- PBS solution (30 min) to prevent nonspecific binding. The presence of LC3B was detected by using anti-LC3B polyclonal antibody (dilution 1:500; Thermo Fisher Scientific, Waltham, MA, USA) and Alexa Fluor 488 goat anti-rabbit (dilution 1:250; Thermo Fisher Scientific, Waltham, MA, USA). The presence of viral antigen was detected by direct immunofluorescence, using polyclonal rabbit antiserum EHV-1/ERV conjugated to FITC (Veterinary Medical Research & Development, Inc, Pullman, WA, USA). Cell nuclei were visualized with Hoechst 33258 (1 μg/mL), according to the manufacturer’s recommendations. Slides were mounted in ProLong Gold Antifade Reagent (Thermo Fisher Scientific, Waltham, MA, USA). Non-infected neurons served as negative control. Confocal images were acquired using a Fluoview FV10i laser scanning confocal microscope (Olympus Poland Sp. z o.o, Wrocław, Poland) with a 60× water immersion lens. Microscopic analysis was performed using FV10i software (Olympus, Wrocław, Poland), Fiji ImageJ version (NIH Image, version 1.53a, USA), and Adobe Photoshop CS6 software (Adobe Systems Incorporated, San Jose, CA, USA).
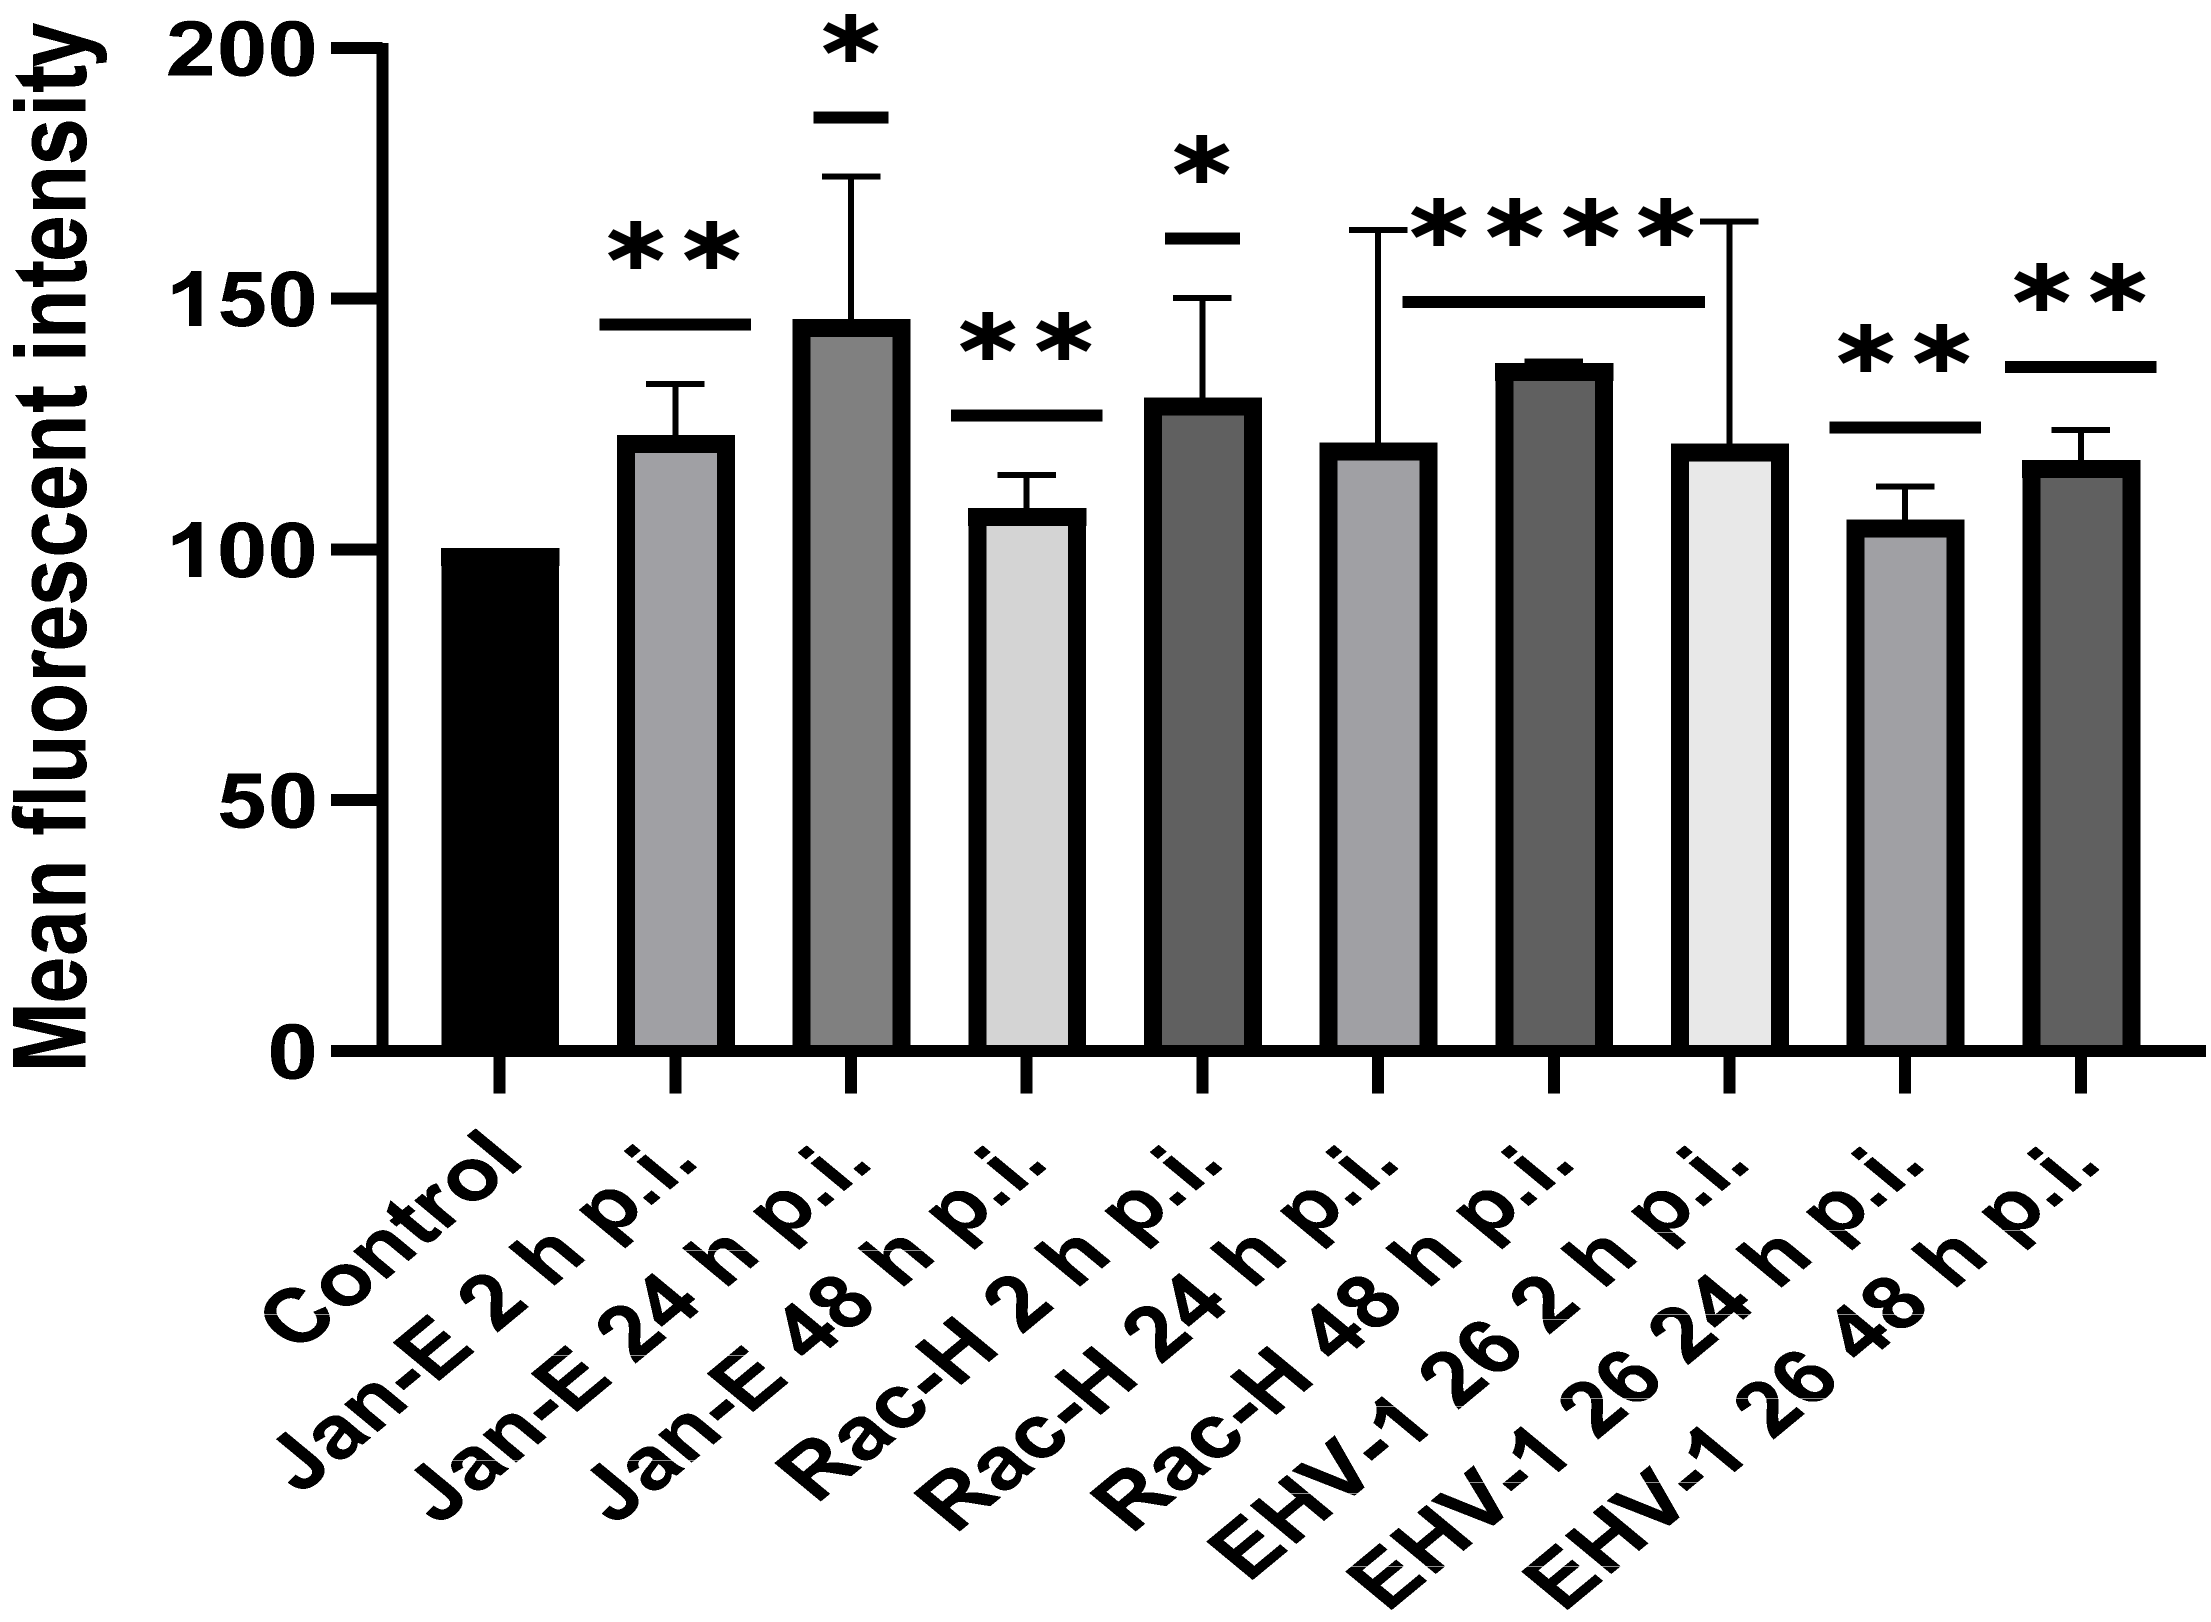
4.4. Flow Cytometry Analysis
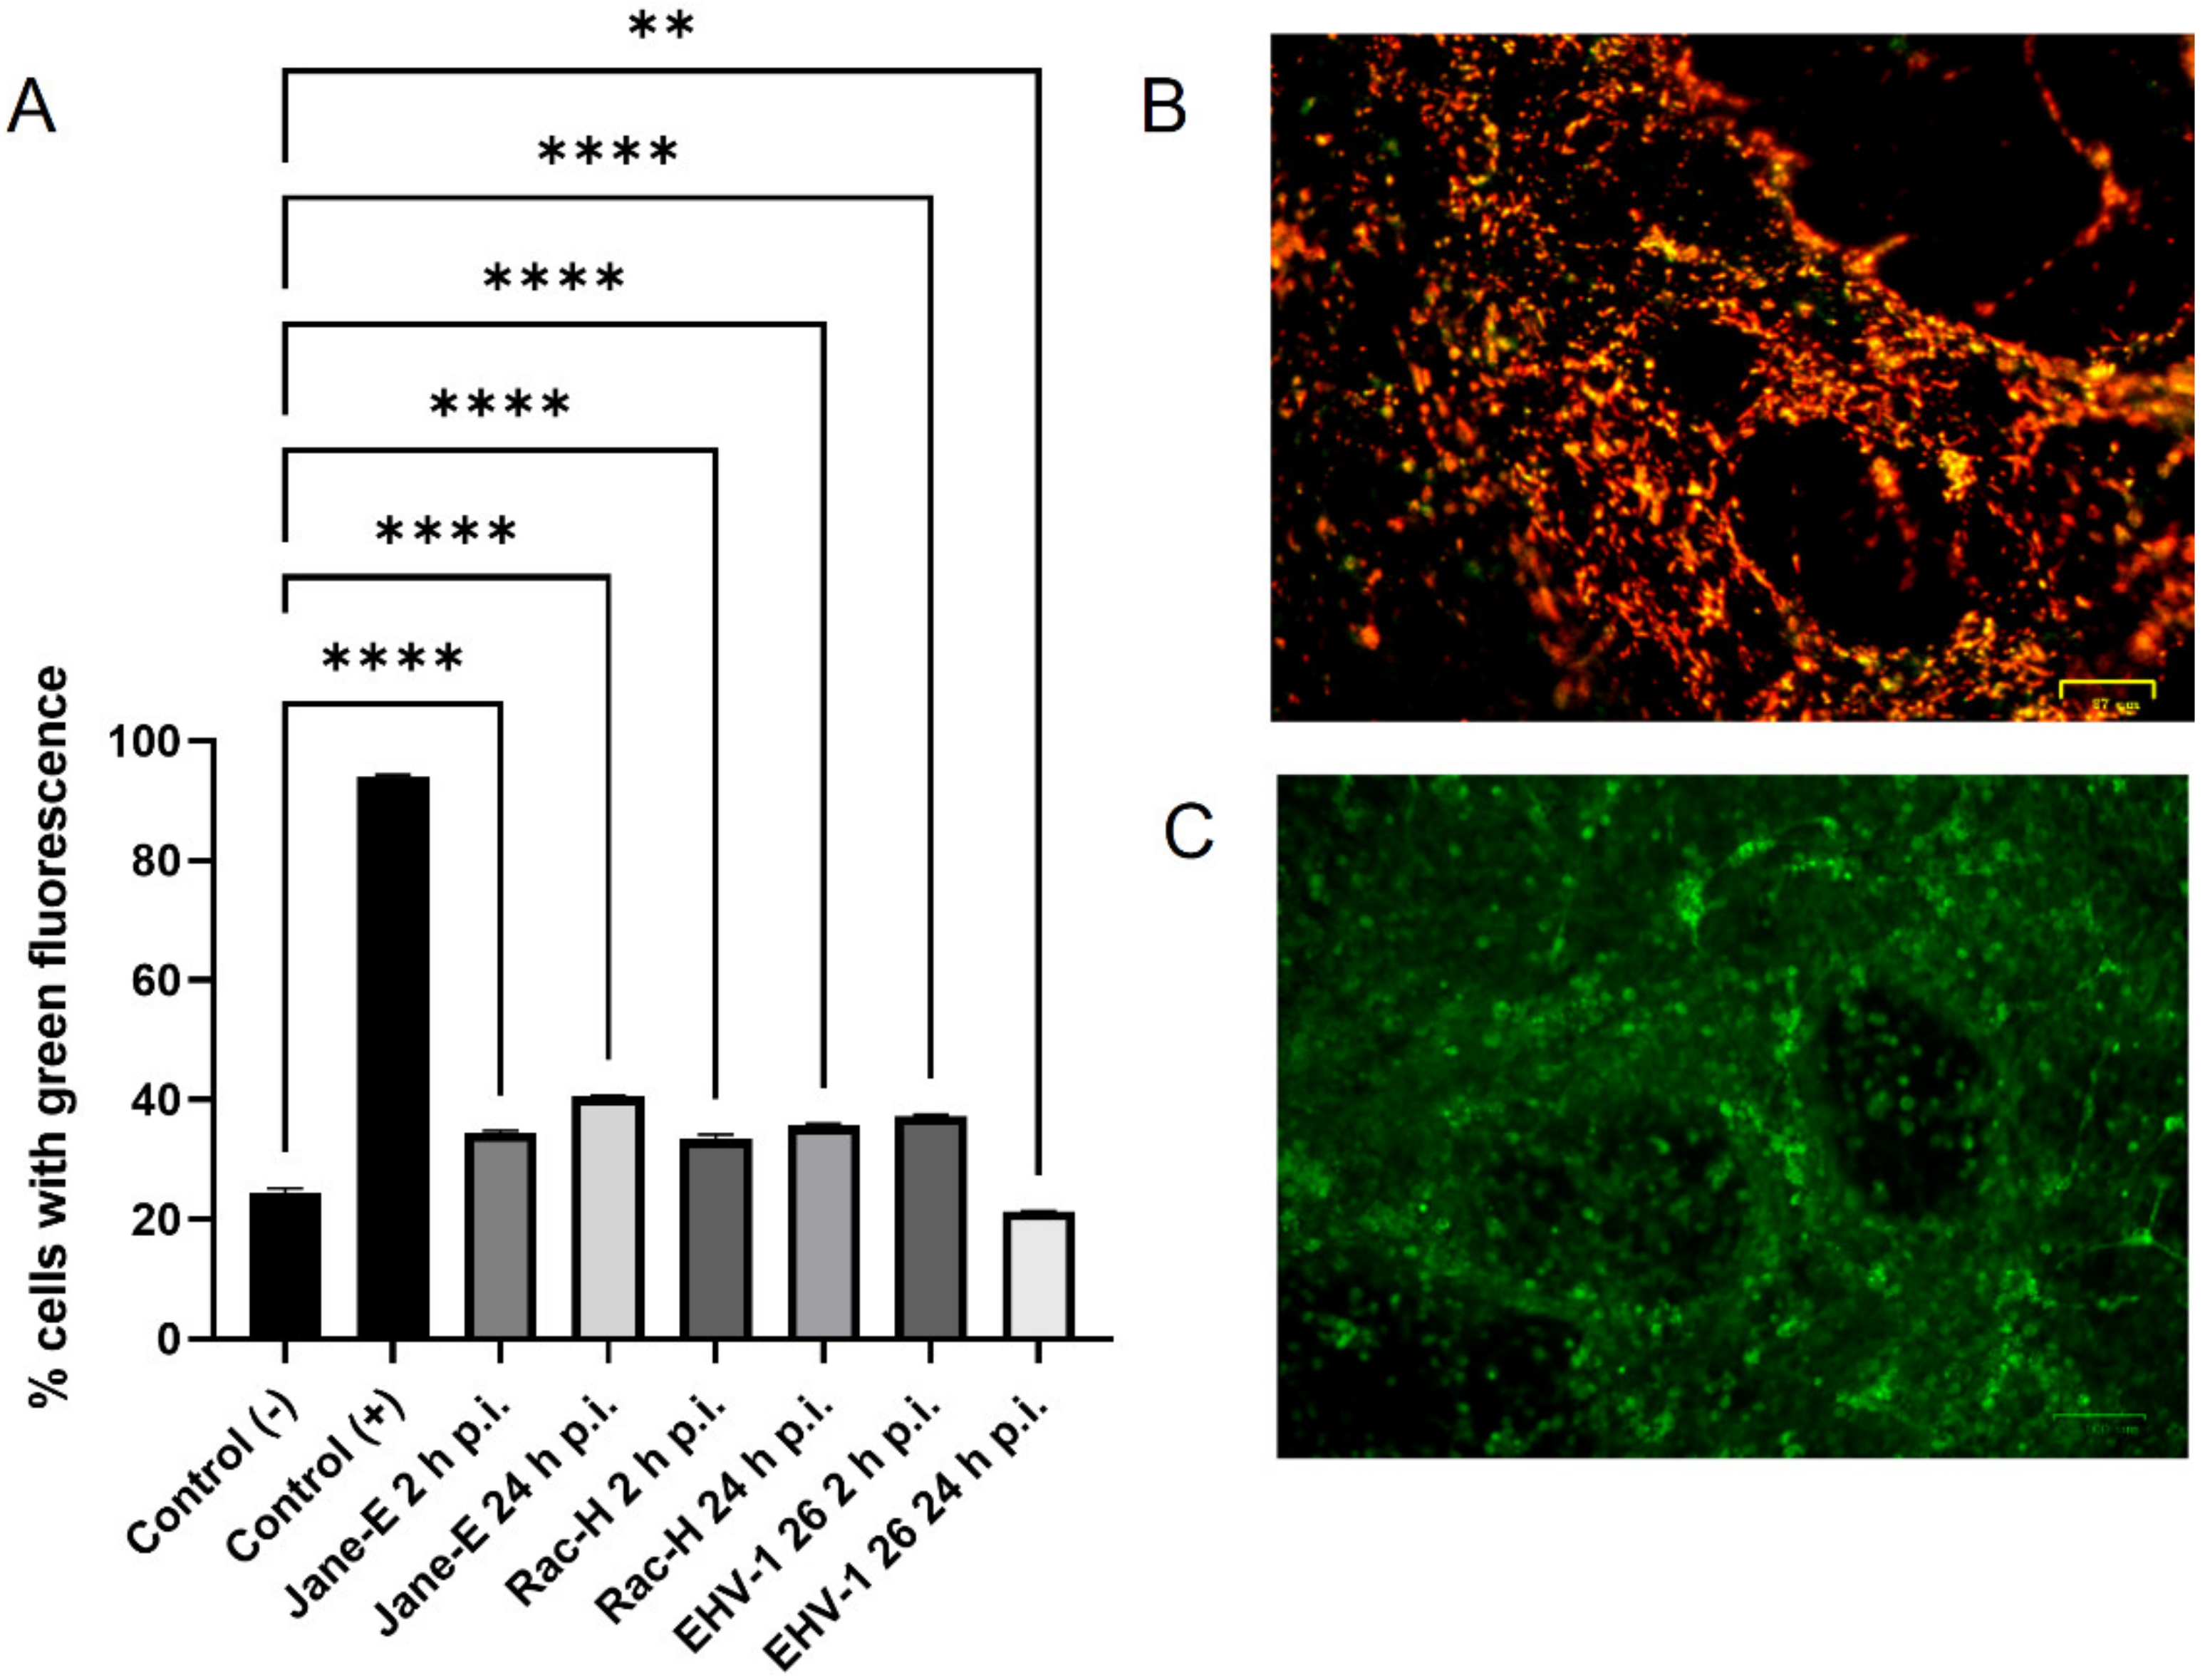
Flow cytometry was used to measure mitochondrial mass in EHV-1 infected neurons with MitoTracker Green FM (490/516 nm [Em/Ex]). Neurons (106 cells/mL) at 2, 24, and 48 h p.i. were stained with MitoTracker Green FM (200 nM; Thermo Fisher Scientific, Waltham, MA, USA) for 10 min in 37 °C, according to the manufacturer’s protocols. It is a non-fluorescent dye in aqueous solutions, but becomes fluorescent once it accumulates in the lipid environment of mitochondria, regardless of membrane potential. Samples were analyzed by BD LSR Fortessa cytometer (BD Biosciences, Franklin Lakes, NJ, USA). Non-infected neurons stained with MitoTracker Green FM were used as a positive control and non-infected neurons unstained with MitoTracer Green FM were used as a negative control.
4.5. Image Cytometry Analysis
To evaluate mitochondrial membrane potential and neuronal vitality after EHV-1 infection, we used NucleoCounter NC-3000 image cytometer (ChemoMetec, Lillerød, Denmark). The cultured neurons were stained with JC-1 (cationic dye 5,5,6,6-tetrachloro-1,1,3,3-tetraethylbenzimidazolcarbocyanine iodide; ChemoMetec A/S, Lillerød, Denmark) according to the manufacturer’s protocol. First, suspended cells (non-infected and infected) were diluted with PBS to a final concentration of 1.5 × 10
6 cells/mL. The samples were then incubated with 12.5 μL of 200 mg/mL JC-1 for 10 min at 37 °C. Following incubation, cells were washed twice and at the end of the second washing, samples were resuspended in 250 μL of 1 mg/mL 4′,6- diamidino-2-phenylindole in PBS. Next, the samples were analyzed with the NucleoCounter NC-3000, according to the manufacturer’s protocols. The results were analyzed using the NucleoView NC-3000 software (
www.chemometec.com, online access on 3 July 2018). A positive control for mitochondrial potential analysis was prepared by adding CCCP (carbonyl cyanide m-chlorophenylhydrazone; 5 μl/ml cell culture medium). Non-infected neurons served as a negative control.
4.6. Measurement of Reactive Oxygen Species Level
Reactive oxygen species (ROS) levels were measured with the CellROX® Green Reagent (Thermo Fisher Scientific, Waltham, MA, USA), a fluorogenic probe for measuring oxidative stress in live cells (Ex/Em~485/520 nm), according to the producer’s protocol. A total of 5 μM CellROX® Green Reagent and Hoechst 33342 were added to the complete media of both control and EHV-1-infected neurons and incubated at 37 °C for 30 min. After washing with PBS, cells were analyzed using a confocal microscope (Fluoview FV10i, Olympus, Wrocław, Poland). Images were captured and converted to 24-bit tiff files for visualization with FV10i software (Olympus, Wrocław, Poland). Uninfected neurons treated with 1 mM H2O2 were used as a positive control.
4.7. RNA Isolation and Quantitative PCR
RNA was isolated from neuron cells using the Qiagen RNAeasy Mini Kit (Qiagen, Germantown, MD, USA), as recommended by the manufacturer. The RNA concentration was measured using the Take-3 system on an Epoch BioTek spectrophotometer and quantified using Gen5 software (BioTek Instruments, Inc, Winooski, VT, USA). Real-time PCR was performed using 96-well Mitochondria RT2 profiler PCR array plates (Qiagen Germantown MD, USA) and ABI 7500 thermocycler (Life Technologies, Carlsbad, CA, USA) at 95 °C for 10 min, 40 cycles of 95 °C for 15 sec, and 60 °C for 1 min. Expression values were collected using the SDS Software system (Applied Biosystems). Assays were performed in three independent replicates. Gene expression was normalized to the expression values of reference genes (GAPDH, b2m, and Hsp90ab1) and evaluated against a negative control, which were uninfected cells. Each PCR array plate contained lyophilized primers for 84 genes associated with the mitochondrial functions into six categories: mitochondrial membrane potential and polarity, mitochondrial transport, transport of small molecules, targeting of proteins to mitochondria, import proteins, outer-membrane translocation, inner-membrane translocation, fusion and fission, mitochondrial localization, and apoptosis.
4.8. Analysis of Mitochondrial Network
MiNa Single Image macro tools were used to analyze changes in the mitochondrial network. This specific bioinformatic method allows the determination of the number of point mitochondria (individuals), cross-linked mitochondria (network), mean branch length [µm], mean network size per branches [µm], and mitochondrial area in the cell (mitochondrial footprint [µm
2]). A protocol according to Valente et al. 2017 was used [
38]. Confocal microscopy images of 20 cells per each experiment were used for analysis.
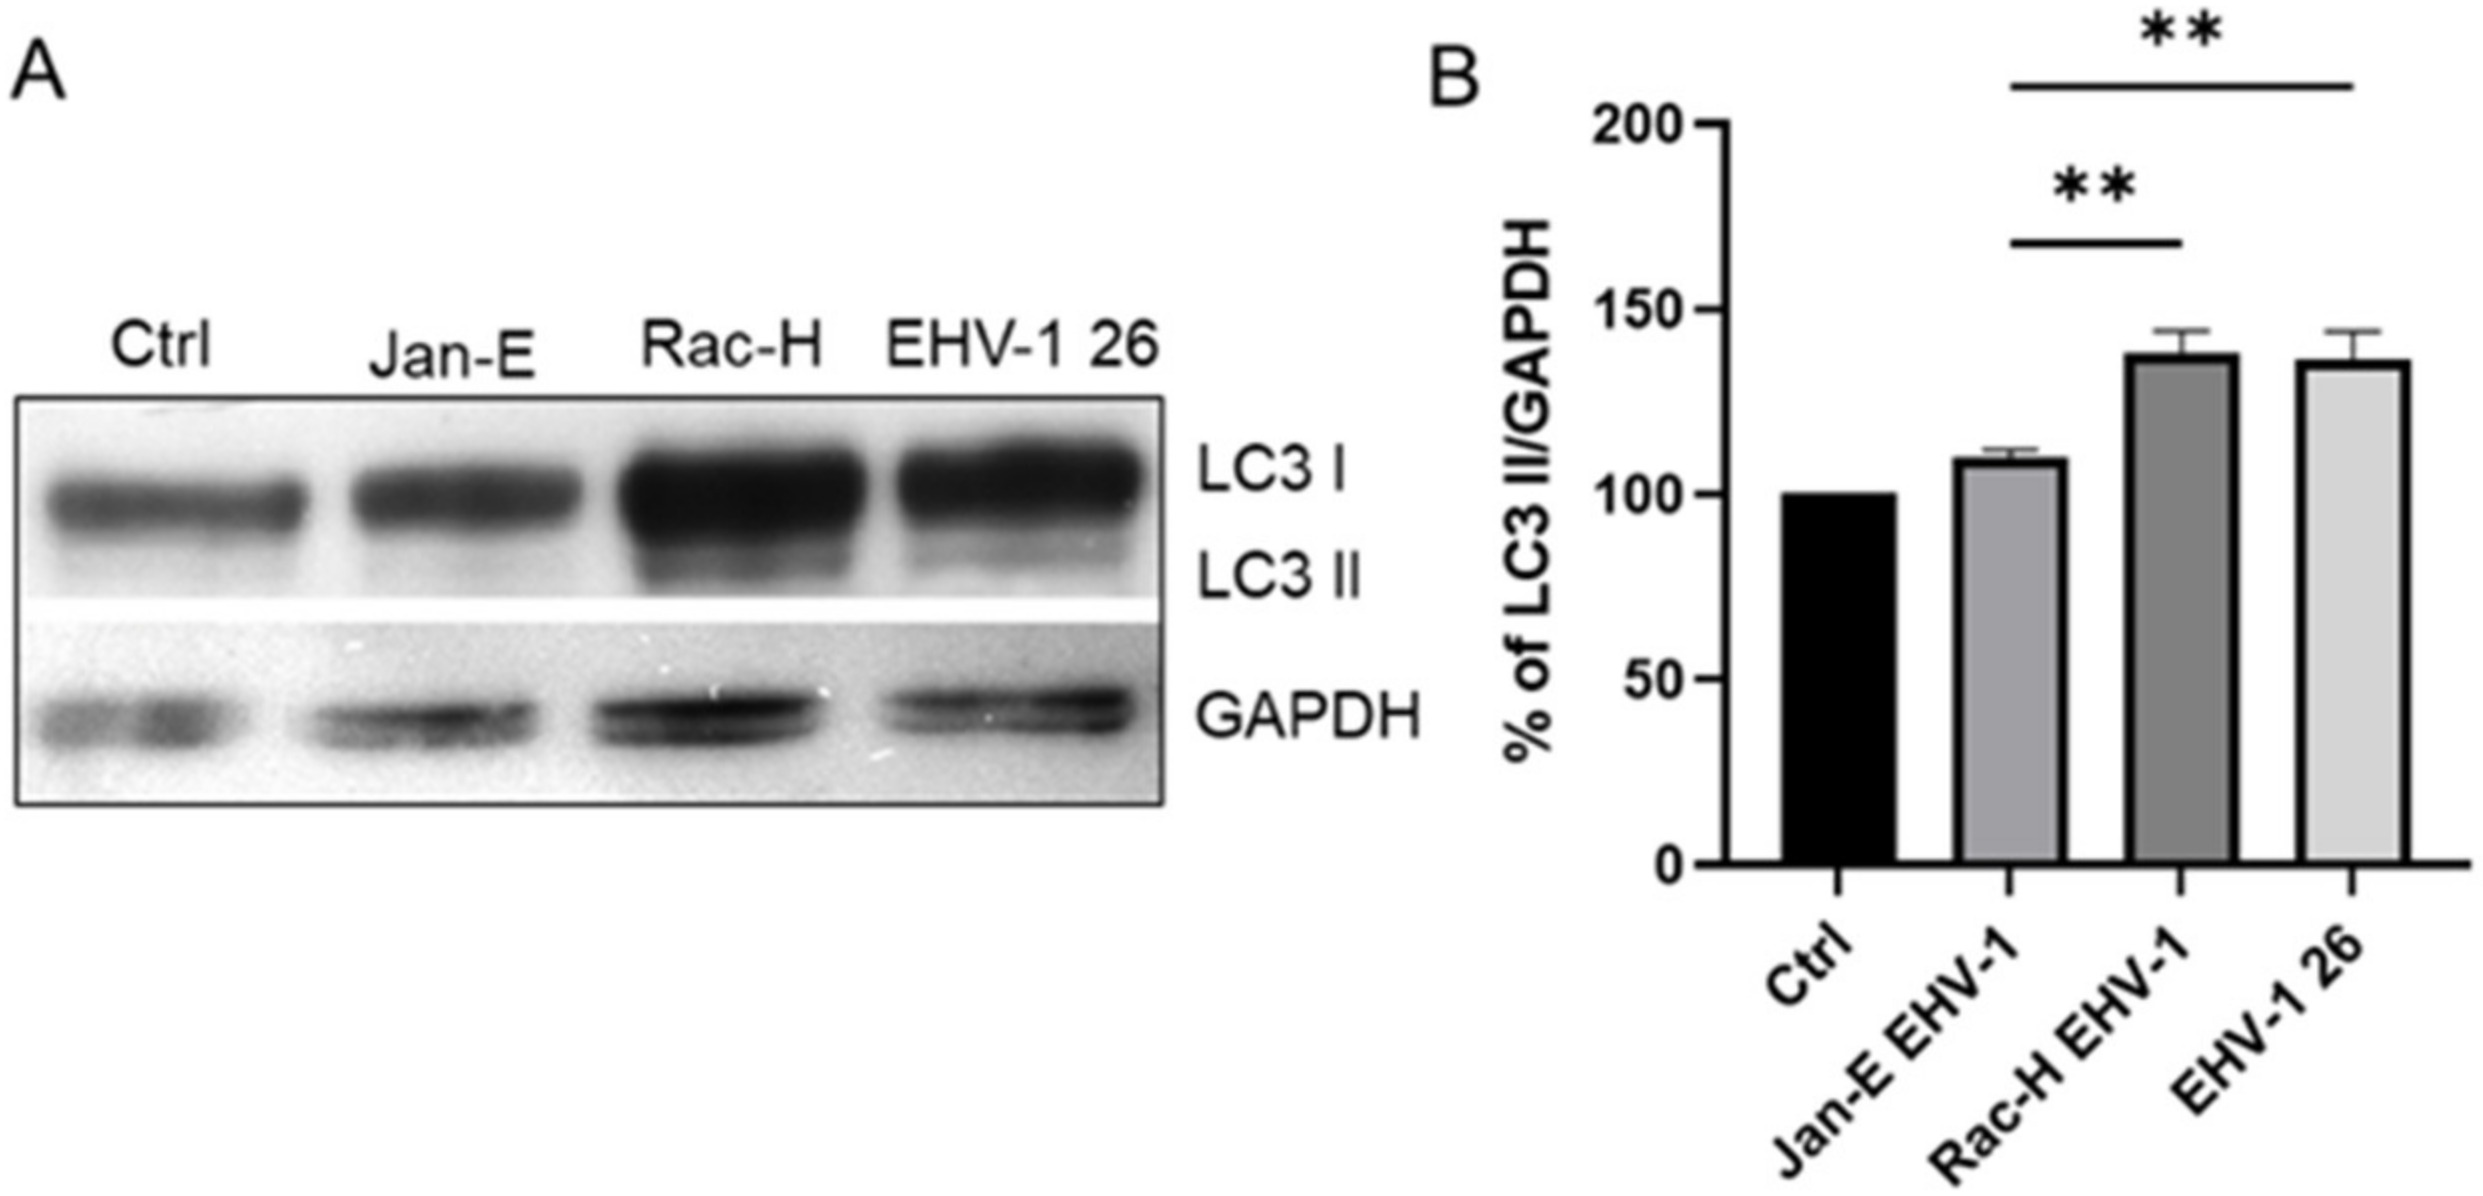
4.9. Western Blot Analysis
For Western blotting, cells were harvested 24 h post infection using N-PER Neuronal protein extraction reagent (Thermo Fisher Scientific, Waltham, MA, USA). The total protein content of each cell sample was measured using the BCA protein assay kit (Thermo Fisher Scientific, Waltham, MA, USA). Following SDS polyacrylamide gel electrophoresis and electroblotting to PVDF membrane, LC3 I/II proteins were detected using polyclonal anti LC3 antibody (Thermo Fisher Scientific, Waltham, MA, USA). After several washes in 0.1% Tris-buffered saline (TBS)-Tween 20, membranes were incubated with HRP-conjugated secondary antibodies for 1 h at RT and developed using enhanced chemiluminescence (Clarity Western ECL substrate; Bio-Rad, Hercules, CA, USA). The protein bands were visualized using the ChemiDoc™ MP Imaging system (Bio-Rad, Hercules, CA, USA). Glyceraldehyde 3-phosphate dehydrogenase (GAPDH) was used as a loading control and for protein normalization during densitometry measurements. For densitometry analysis, ImageLab 6.0.1 (BioRad Hercules, CA, USA) software was used.
4.10. Statistical Evaluation
The results were statistically evaluated by one-way analysis of variation (ANOVA) followed by a Turkey’s multiple comparison test with GraphPad Prism™ version 9 software (GraphPad Software Inc., San Diego, CA, USA). Statistical differences were interpreted as significant at p ≤ 0.05 *, highly significant at p ≤ 0.01 **, and extremally significant at p ≤ 0.001 *** or p ≤ 0.0001 ****.


 ,
, 


