
Relationship Prediction Based on Graph Model for Steam Turbine Control Valve


Department of Automation, Shanghai Jiao Tong University, Shanghai 200240, China
*
Author to whom correspondence should be addressed.
Actuators 2021, 10(5), 91; https://0-doi-org.brum.beds.ac.uk/10.3390/act10050091
Submission received: 24 March 2021
/
Revised: 15 April 2021
/
Accepted: 16 April 2021
/
Published: 27 April 2021
(This article belongs to the Section Actuators for Manufacturing Systems)
Abstract
:The control valve is an important piece of equipment in the steam turbine, which frequently suffers from the fault of the dead zone. The graph model is a promising method for dead zone detection, yet establishing an accurate and completed graph topology is not an easy task due to limited mechanism knowledge. Hence, a graph model is proposed to predict the links in the graph and estimate the relationship between variables of related equipment of the control valve. The graph convolution is conducted on the uncompleted graph to learn the low-level representations of the graph nodes, and the score function is used to evaluate the probability of the existence of links between a pair of graph nodes. Results demonstrate a test accuracy of 99.2% for the link prediction, and follow the principles of thermodynamics in the steam turbine. Consequently, the proposed graph model is capable of estimating the relationships for the steam turbine control valve, and other inter-connected industrial systems.
1. Introduction
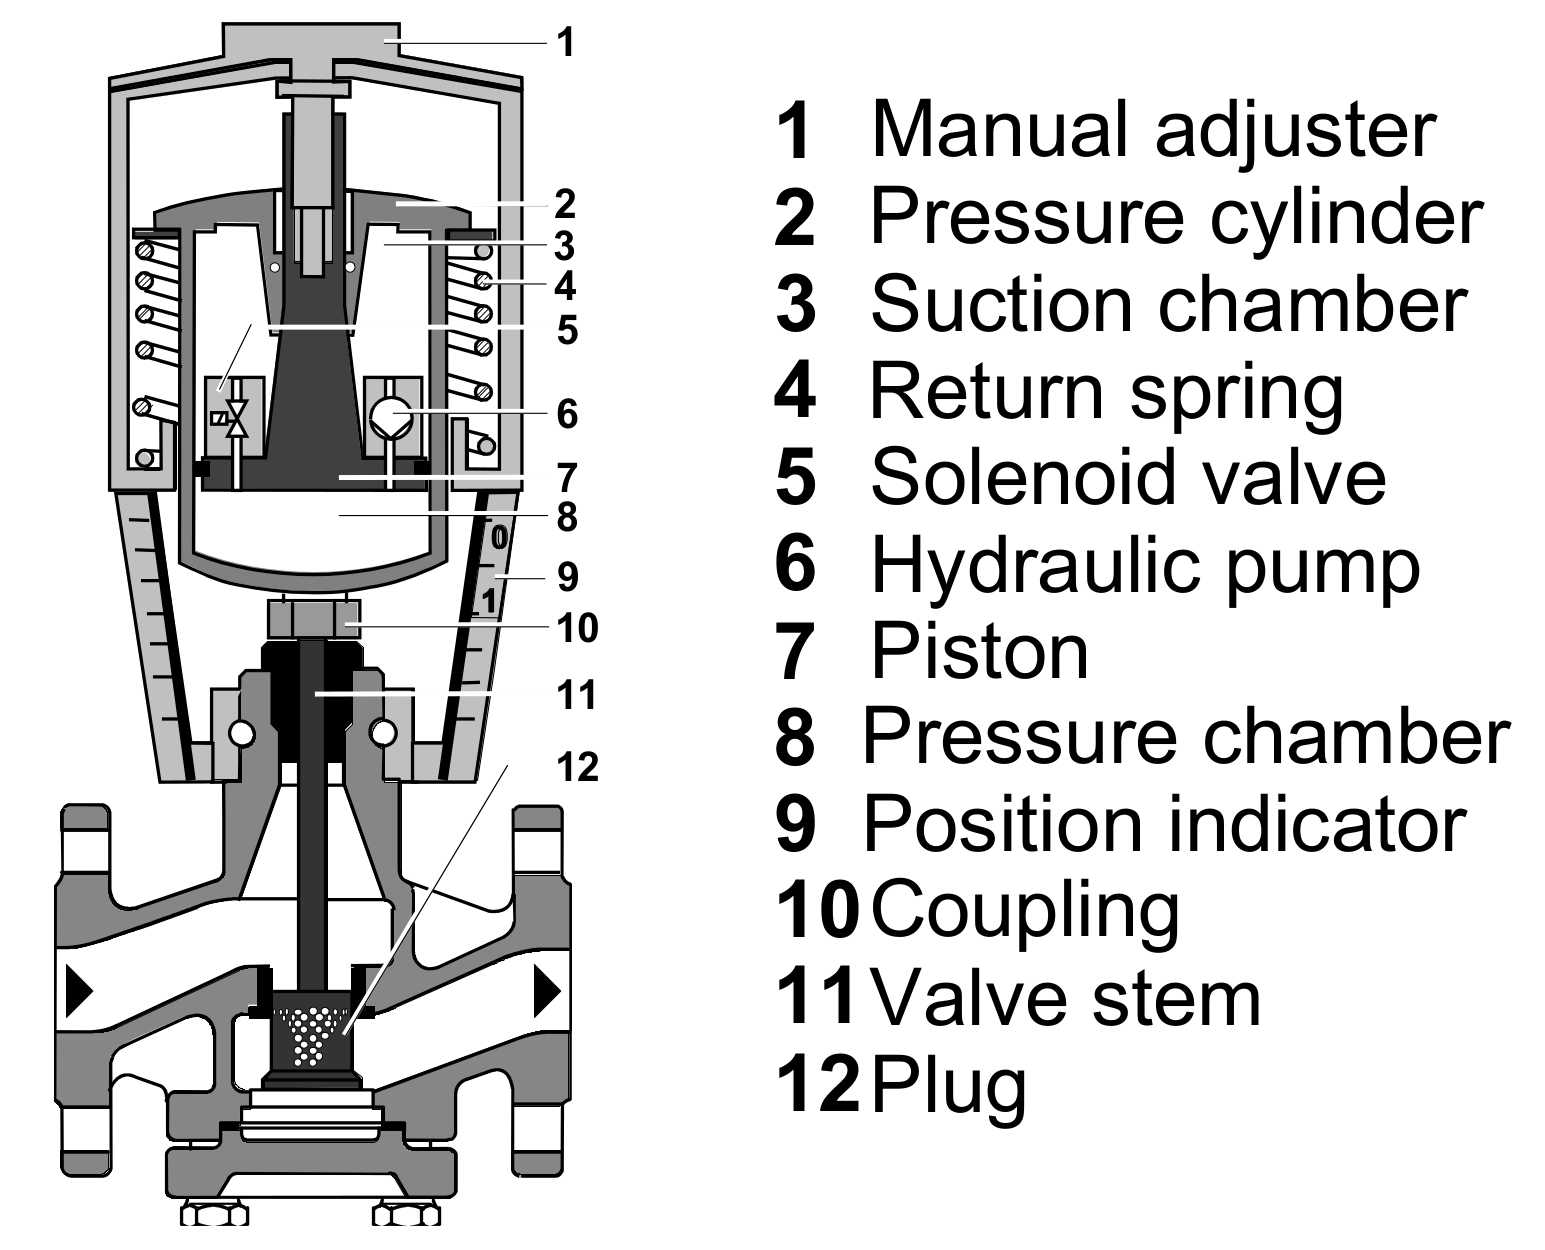
The high pressure control valve is one of the most important pieces of equipment in the steam turbine, which governs the steam flow and regulates the power generation. Figure 1 illustrates the working mechanism of the control valve. When the valve is opening, the pressure oil enters into the pressure chamber and pushes the valve stem downwards; when the valve is closing, the oil is discharged from the solenoid valve and the return spring drives the stem upwards.
Due to frequent opening and closing of the valve in the process of daily operation, the valve stem and valve body are easy to wear, resulting in the stiction, such as valve dead zone. The dead zone is an insensitive area where the valve position does not change with the command. The control valve dead zone can easily cause system oscillations. These oscillations will lead to increase energy consumption and increased wear and tear of equipment along with poor product quality [1,2]. Hence, detecting the valve stiction becomes imperative for the stable and economic operation and power generation for the steam turbine.
Much literature has revealed the fault detection and diagnosis in actuators, such as the state observer based method [3], the Kalman filter method [4], and the artificial neural network [5]. Among a large number of fault detection methods for the control valve, the graph model is a promising one due to its strong reasoning ability, such as bond graphs [6]. The premise of graph model application is to establish the graph topology accurately. On the one hand, the dead zone detection based on graph model requires accurate graph topology to characterize the industrial equipment, subsystem, and system. On the other hand, the fault of dead zone will propagate to other equipment, subsystem, and system along the related paths. The propagation paths are represented as the edges in the graph topology. Hence, completed and accurate graph edges or relationships between variables of graph nodes are crucial for the fault detection for the control valve dead zone.
However, obtaining the completed and accurate graph topology for the steam turbine control valve is never an easy task, since with the deepening of the research, the graph topology construction faces several difficulties. Above all, as the steam turbine system becomes more complex, it is never an easy task to find all the relationships according to the mechanism. Then, edges in the graph topology not only appear as physical connections, but also as cross-correlation dependencies, which is difficult to analyze by pure mechanism. Last but not least, only limited knowledge related to steam turbines can be obtained, leading to the inaccuracy of the graph topology. Hence, it is necessary to develop a method to estimate the relationship and predict the graph topology for the steam turbine graph model.
In complex networks or graph theory, the problem of relationship prediction for the steam turbine control valve is equivalent to the link prediction problem for the graph. The basic idea for link prediction is to reveal the relationship between graph nodes by analyzing the graph topology and the attributes of nodes and edges. Typical link prediction methods mainly include similarity-based algorithm [7], maximum likelihood methods [8], and probabilistic models [9], and they are well summarized in [10,11,12]. To the best of the authors’ knowledge, little literature implements the link prediction in the graph of the industrial system, and none of them studies the link prediction and relationship prediction for the steam turbine control valve.
In this study, a novel method for the relationship prediction based on graph model for steam turbine control valve is proposed. First of all, the uncompleted graph which may have missing edges is established for the steam turbine control valve and its surrounding equipment. Each node in the graph corresponds to the physical variable of the equipment in the steam turbine, along with its measurement. Next, graph convolution is implemented iteratively to learn the low-level representations for graph nodes. In the meantime, the dead zone detection is finished. Afterwards, a score function for the edge, relying on the low-level representations for the linked graph nodes, is defined to predict the links. Ultimately, the accuracy for the dead zone detection and link prediction are over 98%. Moreover, the results of the link prediction follow the principles of thermodynamics. The proposed method is suitable for the relationship prediction for the steam turbine system. Doubtlessly, the relationship prediction method can also be applied to other inter-connected industrial system. In this paper, Section 2 includes a more detailed definition of the problem, the mathematical preliminaries for the graph convolutional network, and the description of the link prediction algorithm. Section 3 shows a numerical examples for the fault detection and link prediction for the control valve of the steam turbine. Finally, Section 4 gives a conclusion for the whole paper.
2. Methods
2.1. Problem Definition
Fault detection and diagnosis based on the graph model is a promising technology owing to its strong reasoning ability. The premise of application of graph model is to build an accurate graph topology. For the construction of the graph topology for steam turbine system, it relies on a full understanding of the system, including the composition of the steam turbine system, the principles of thermodynamics, and control strategies. Whether the relational graph is constructed accurately will directly affect the reasoning effect of the graph model.
Remark 1.
The inaccuracy of the graph topology is mainly reflected in two aspects. On the one hand, the connected edges in the graph may not exist in reality and require deleting. On the other hand, the unconnected edges may exist in reality and need to be completed.
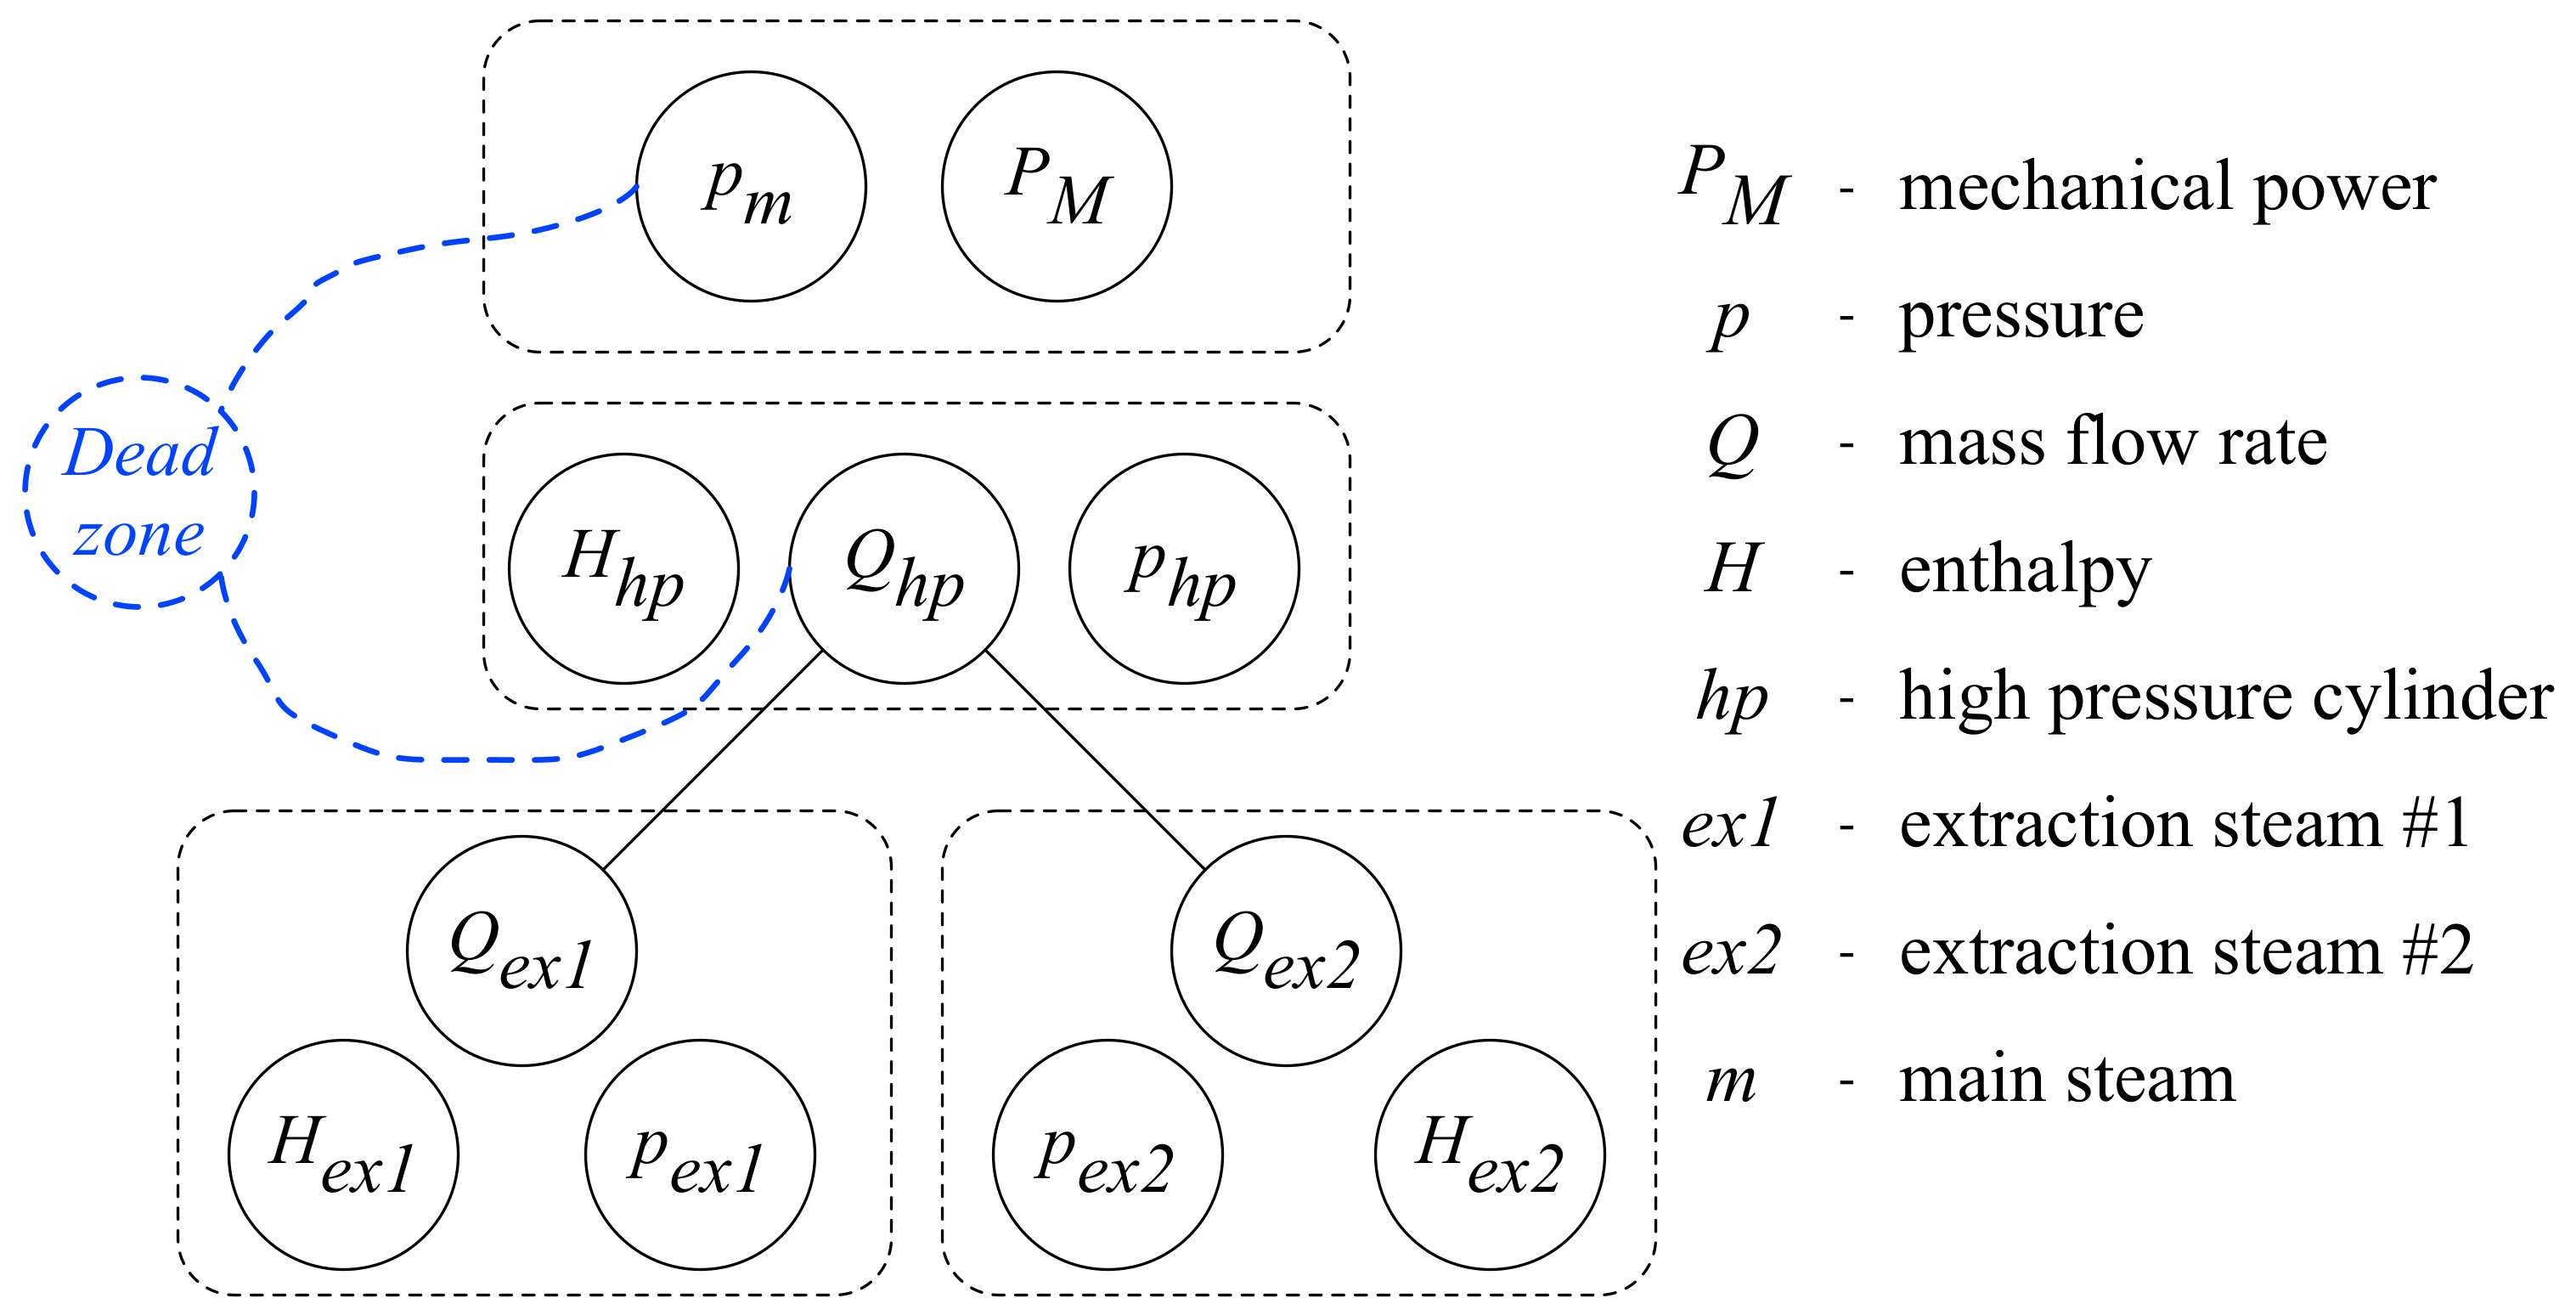
Consider the high pressure control valve in a steam turbine system. The control valve suffers from dead zone, which causes system oscillation. Figure 2 illustrates an uncompleted graph topology for control valve dead zone detection, whose nodes depict the physical variables of neighborhood equipment.
Remark 2.
The blue dashed nodes in Figure 2 are the virtual fault nodes representing the dead zone of the high pressure control valve. Since opening of the valve is controlled by pressure , and eventually regulates the steam flow into the high pressure cylinder, the fault node dead zone is connected to and .
Obviously, according to the steam turbine mechanism, the mass flow rate of the main steam is directly related to the mass flow rate of the high pressure cylinder , so do and . Hence, there exist three explicit links among these variables. However, more implicit links are neglected because of the lack of system knowledge. And some of the links are sometimes connected mistakenly. Here, the data-driven method is taken into account to complete the links. Therefore, the problem can be formulated as:
where ,, X and represent the uncompleted graph, the predicted completed graph, the attributes of the graph nodes and the model, respectively. The results of graph topology prediction can reveal the relationships between physical variables related to the control valve, which are represented by the links between graph nodes.
2.2. Mathematical Preliminaries
Consider a graph, depicted as
where and represent the set of nodes and edges. Then the adjacency matrix of is A, in which each entry if there exist an edge between node i and j, otherwise . The degree matrix is D, and
if , otherwise , where .
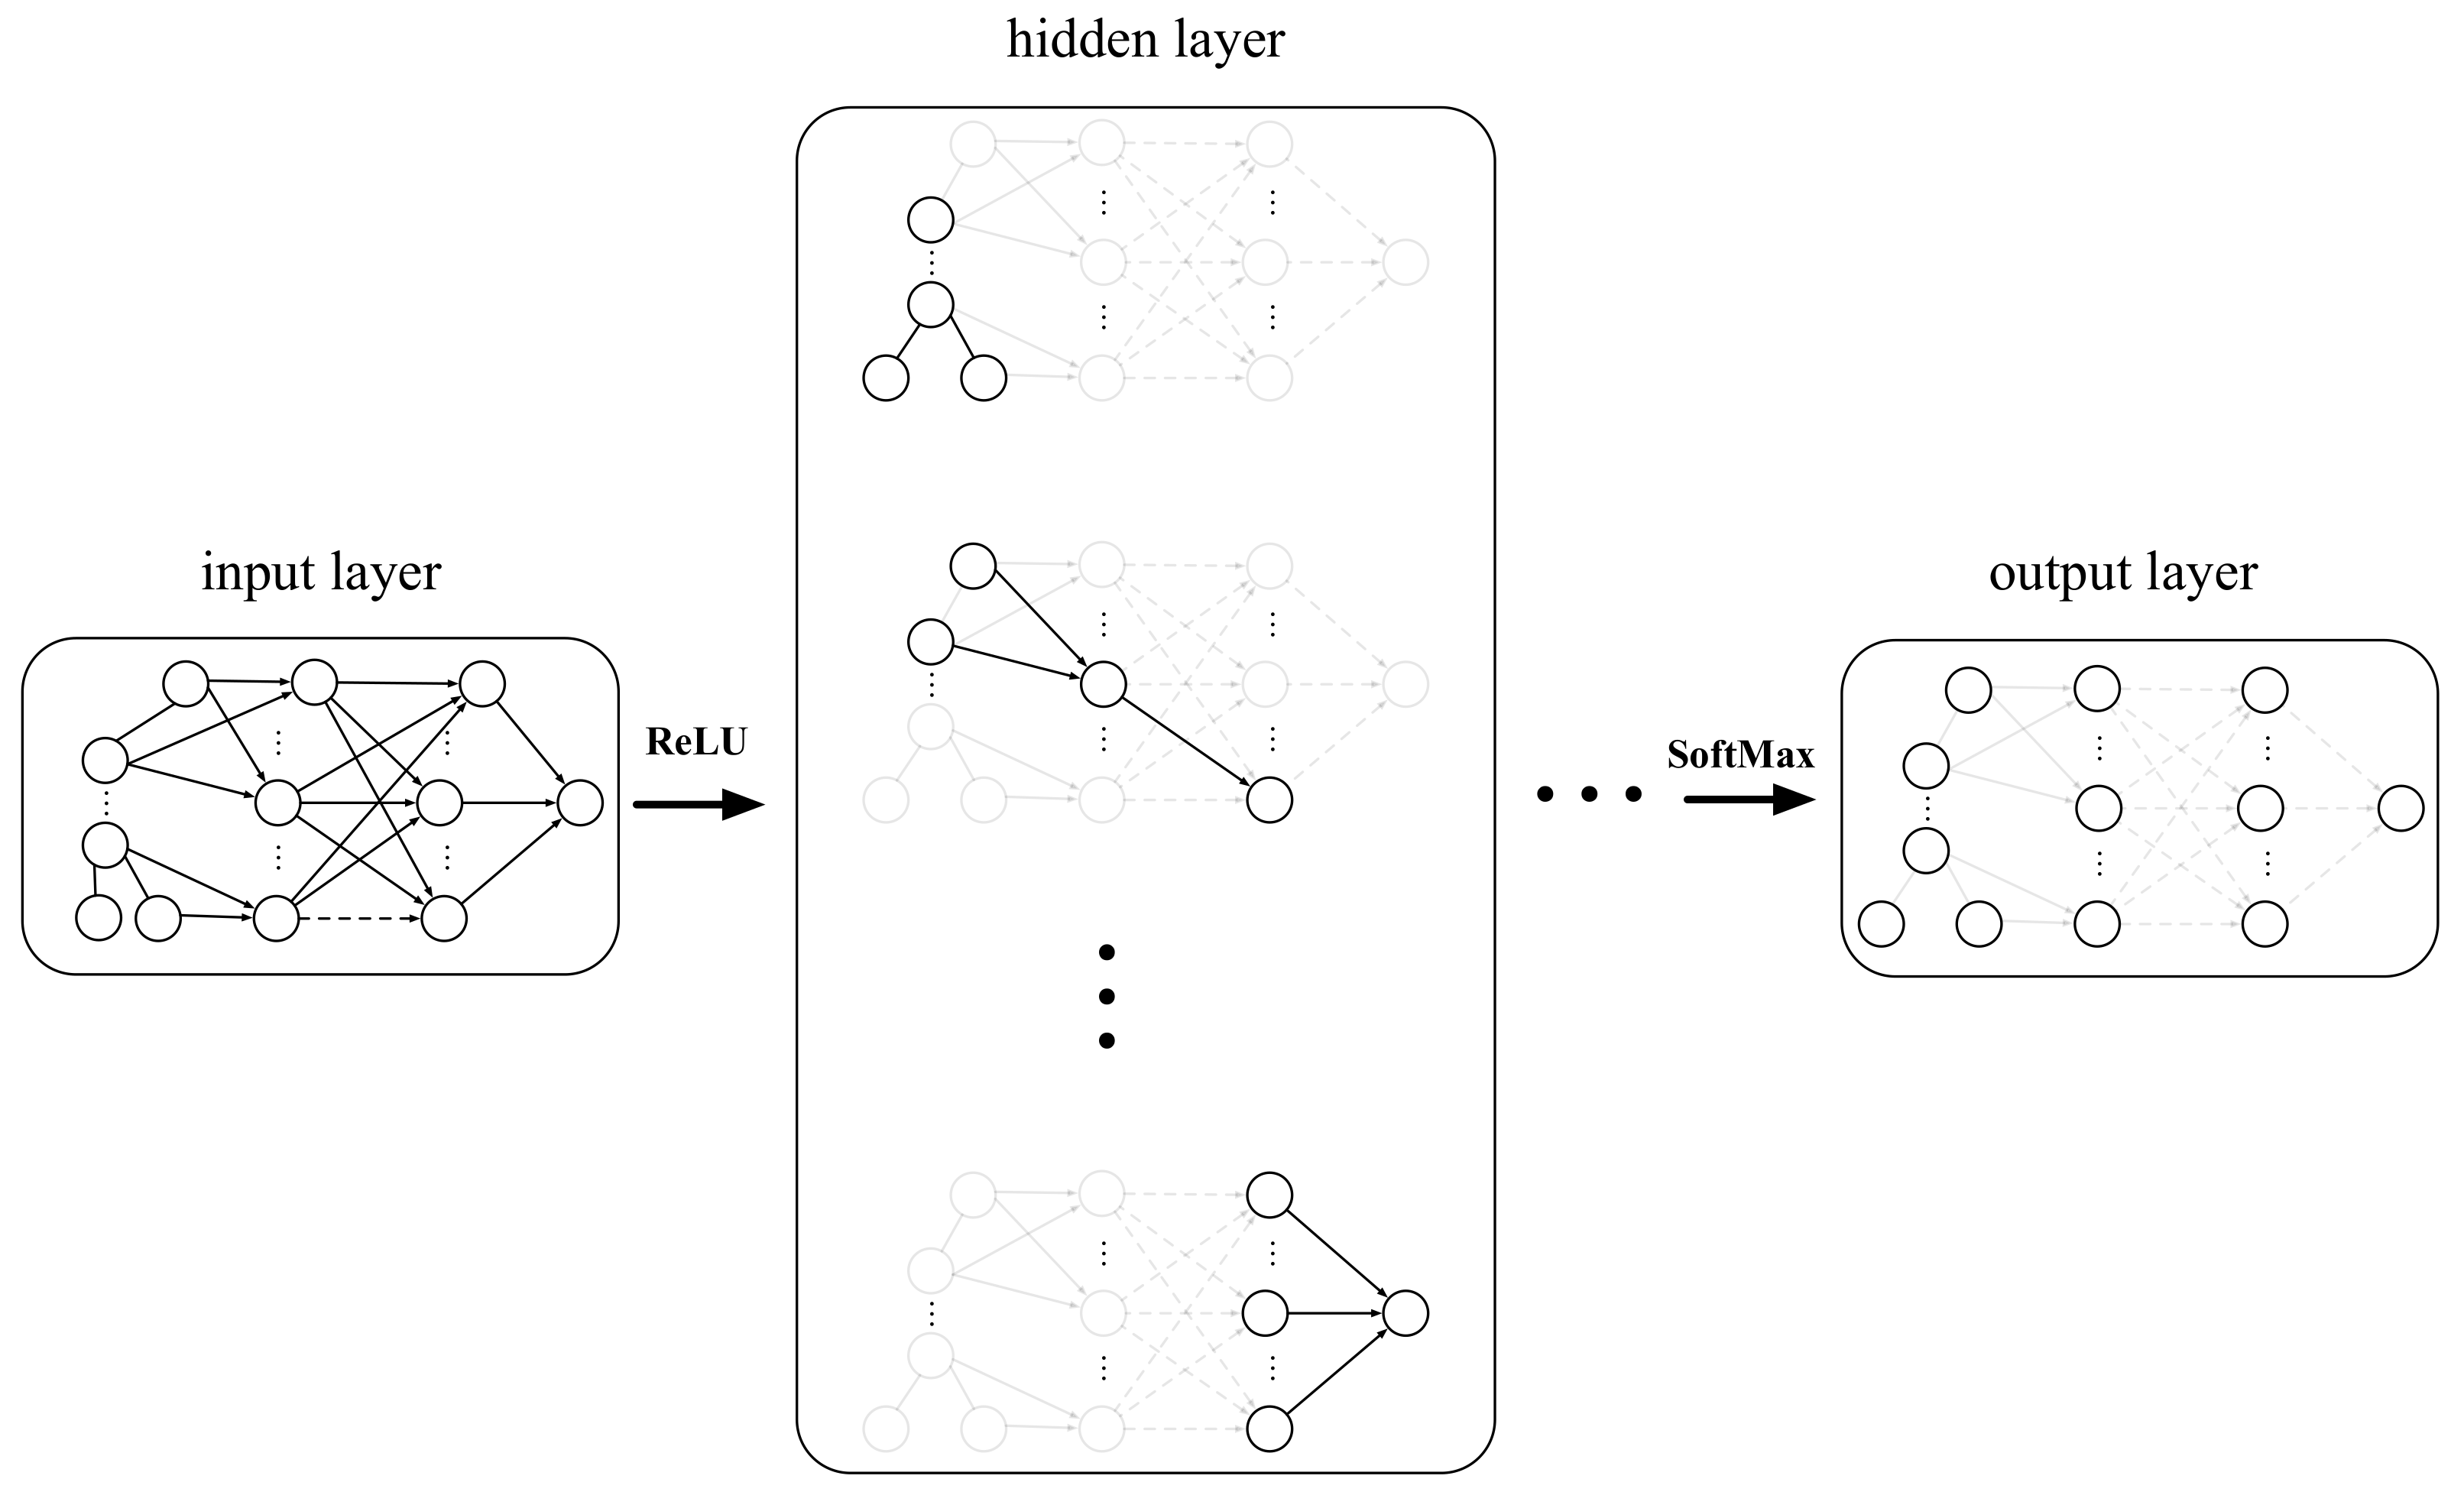
In the Graph Convolutional Network scheme, the representations for nodes are calculated iteratively by [13]
where , and indicate the representation of the graph nodes on layer l, the linear transformation matrix between layer l and , and the activation function. Besides [14],
where , and .
And the graph model is illustrated in Figure 3.
The representation for the i-th node on the last layer, i.e., layer L, is , or . Then the loss function of the optimization is
2.3. The Link Prediction Algorithm
To predict the links, a score is given to the existence of link between node i and j:
where is a square matrix. u is the extra non-linearity descriptor.
Remark 3.
In Equation (7), M and tanh are bi-linear and non-linear operators characterizing the linear and non-linear relationships between node i and j, respectively. In reality, the score function utilizes the local or global features of the graph to measure the relationship between nodes.
Remark 4.
The score function varies with the problem. Apart from Equation (7), other common score functions are listed in Table 1.
Where
and
are linear and bi-linear transformations, respectively.
For each node i, select the connected node j to form a positive pair ,with label , and the select an unconnected node k randomly to form a negative pair , with label . Consequently, the positive set , the negative set , and the whole set
Then the loss function for link prediction problem in cross-entropy form is
where is the Sigmoid function.
Remark 5.
In addition to the Equation (11), the following loss function is also utilized:
Consequently, set the score threshold to be 0.5. If , the edge between nodes i and j exists, otherwise the edge does not exist.
3. Numerical Examples
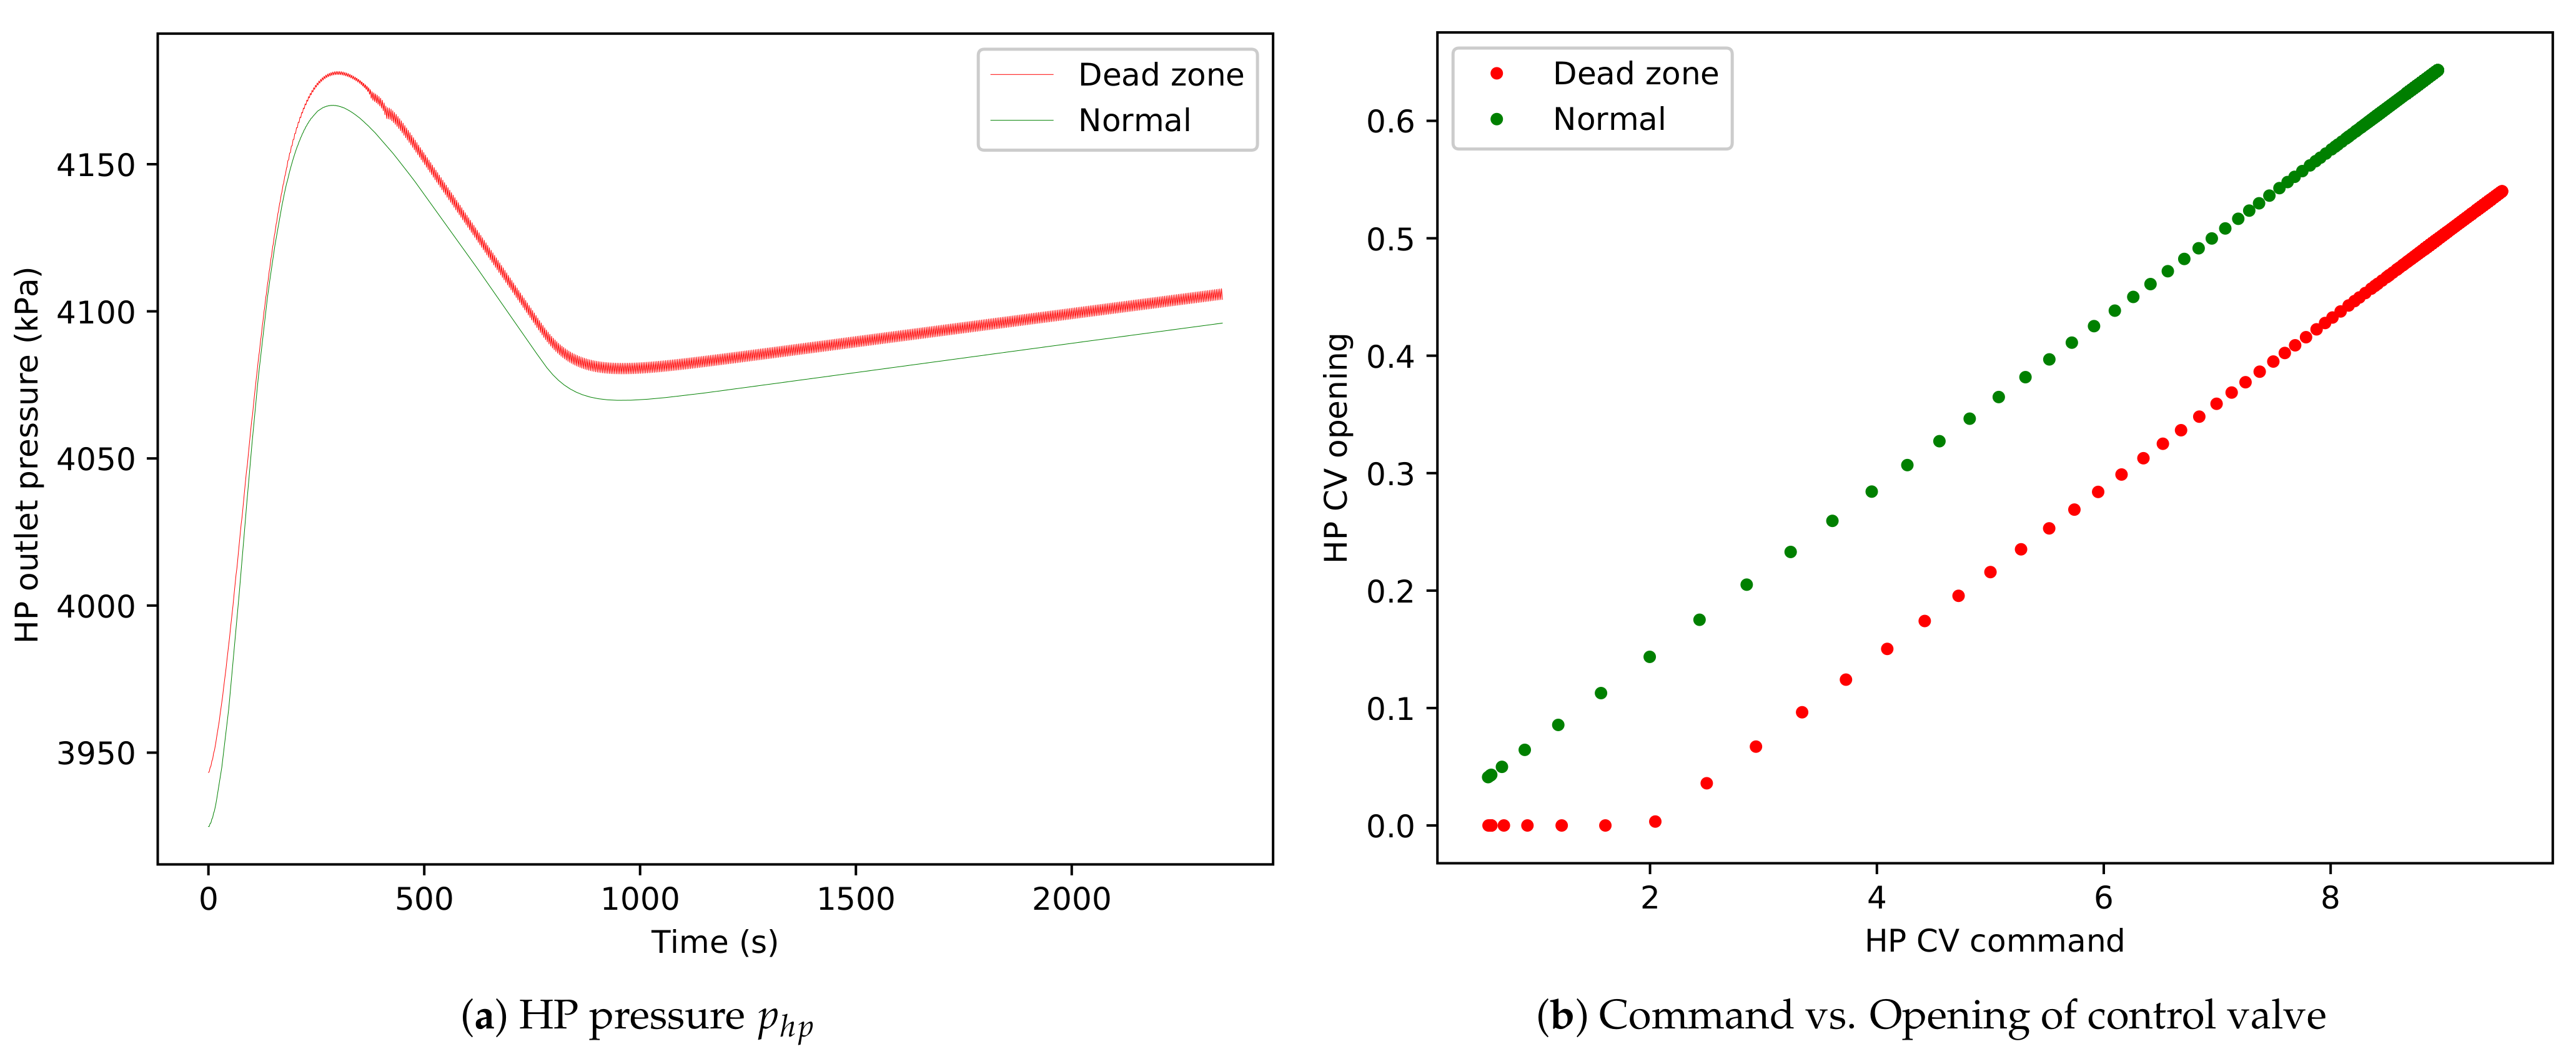
Consider a steam turbine simulation system, which consists of the boiler, the control valve, the high, intermediate, low pressure turbine, the condenser, and the two stage steam extractions, etc. The simulation is conducted under the Matlab/Simscape environment. Matlab/Simscape supports a steam turbine physical system based on Rankine cycle [18]. For the simulation of the fault, a dead zone block is connected between the PID controller output and the opening of the high pressure control valve, and a 15% dead zone is injected into the valve, with the simulation time of 2400 s. Consequently, the time series of node variables in Figure 2 is obtained, and together with dead zone illustration are exhibited in Figure 4. Figure 4a shows the inlet pressure of HP in the process of turbine power regulation. The inlet pressure of HP is nearly stable at 4100 kPa. It can be inferred that the control valve dead zone does cause the HP oscillation. To some extent, the HP oscillation will lead to system oscillation, which will affect the safe and stable operation of steam turbine.
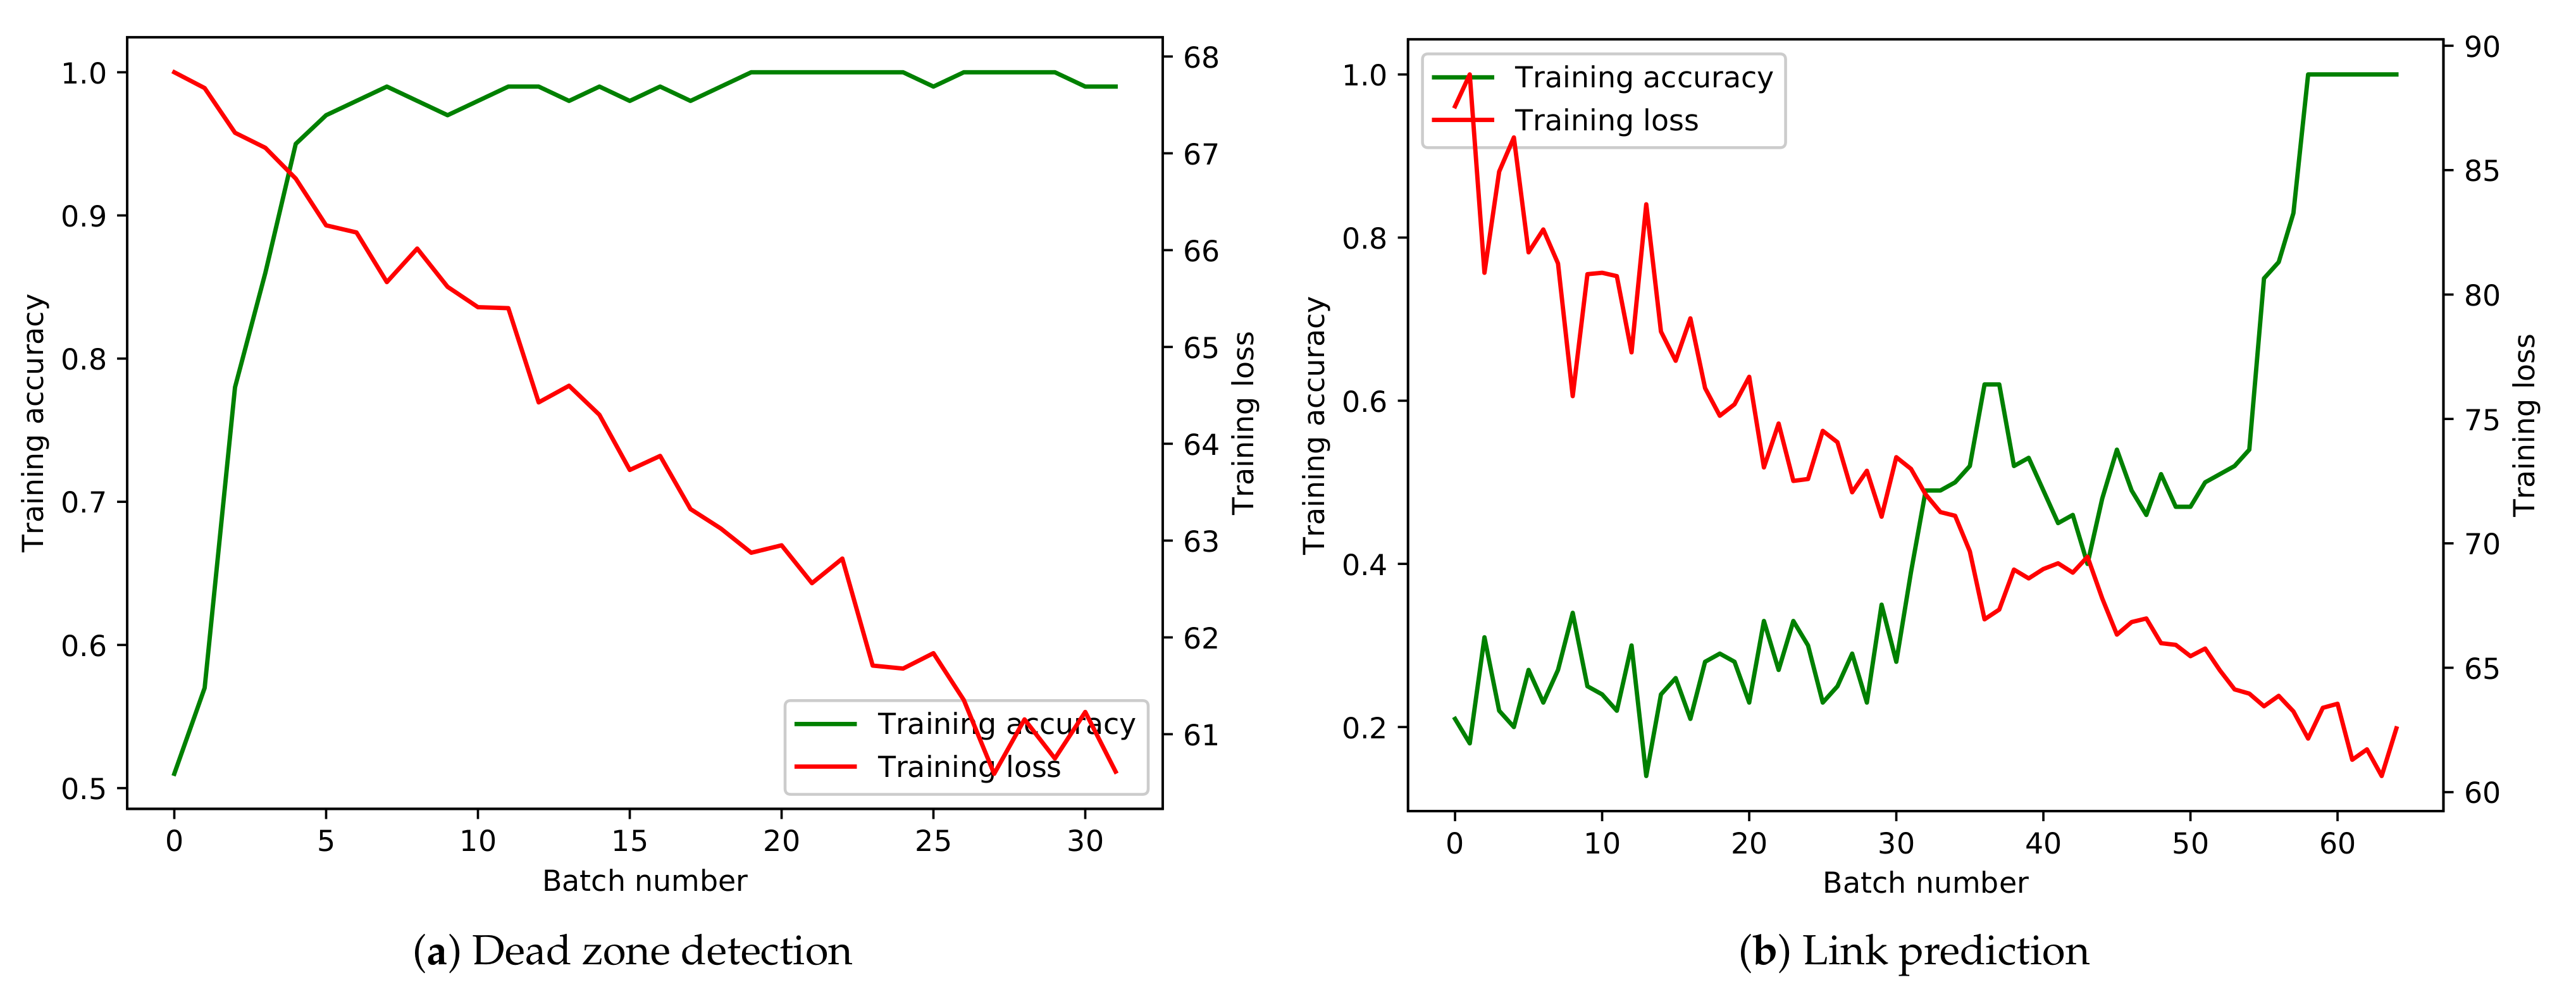
To feed the time series data into the proposed link prediction model, the data are pre-processed. Above all, the data is scaled into 0∼1 using standard normalization. Then, data under normal and dead zone condition are labeled with 0 and 1 respectively. Next, they are combined and randomly shuffled, with 70% for training the model and 30% for testing the model. The total layers sum up to 4, and the dimensions of the layers are 4, 8, 8, 4. The coefficient of the L2 normalization is 0.001. The learning rate of the batched gradient descent algorithm is 0.01. Each batch contains 10 samples, and the batched gradient descent algorithm utilizes all the 10 samples in one batch to update the parameters of the model at one training step. The training batches for dead zone detection and link prediction are 31 and 63, respectively. Finally, the training accuracy and loss are shown in Figure 5a. Moreover, the test accuracy for dead zone detection reaches 98.8%.
After dead zone detection, the representations for graph nodes are obtained. The link prediction can be conducted based on the node’s representations. Regard the edges and as the positive samples, and randomly selected another two unconnected edges as the negative samples. The training results are illustrated in Figure 5b. The test accuracy for the link prediction reaches 99.2%.
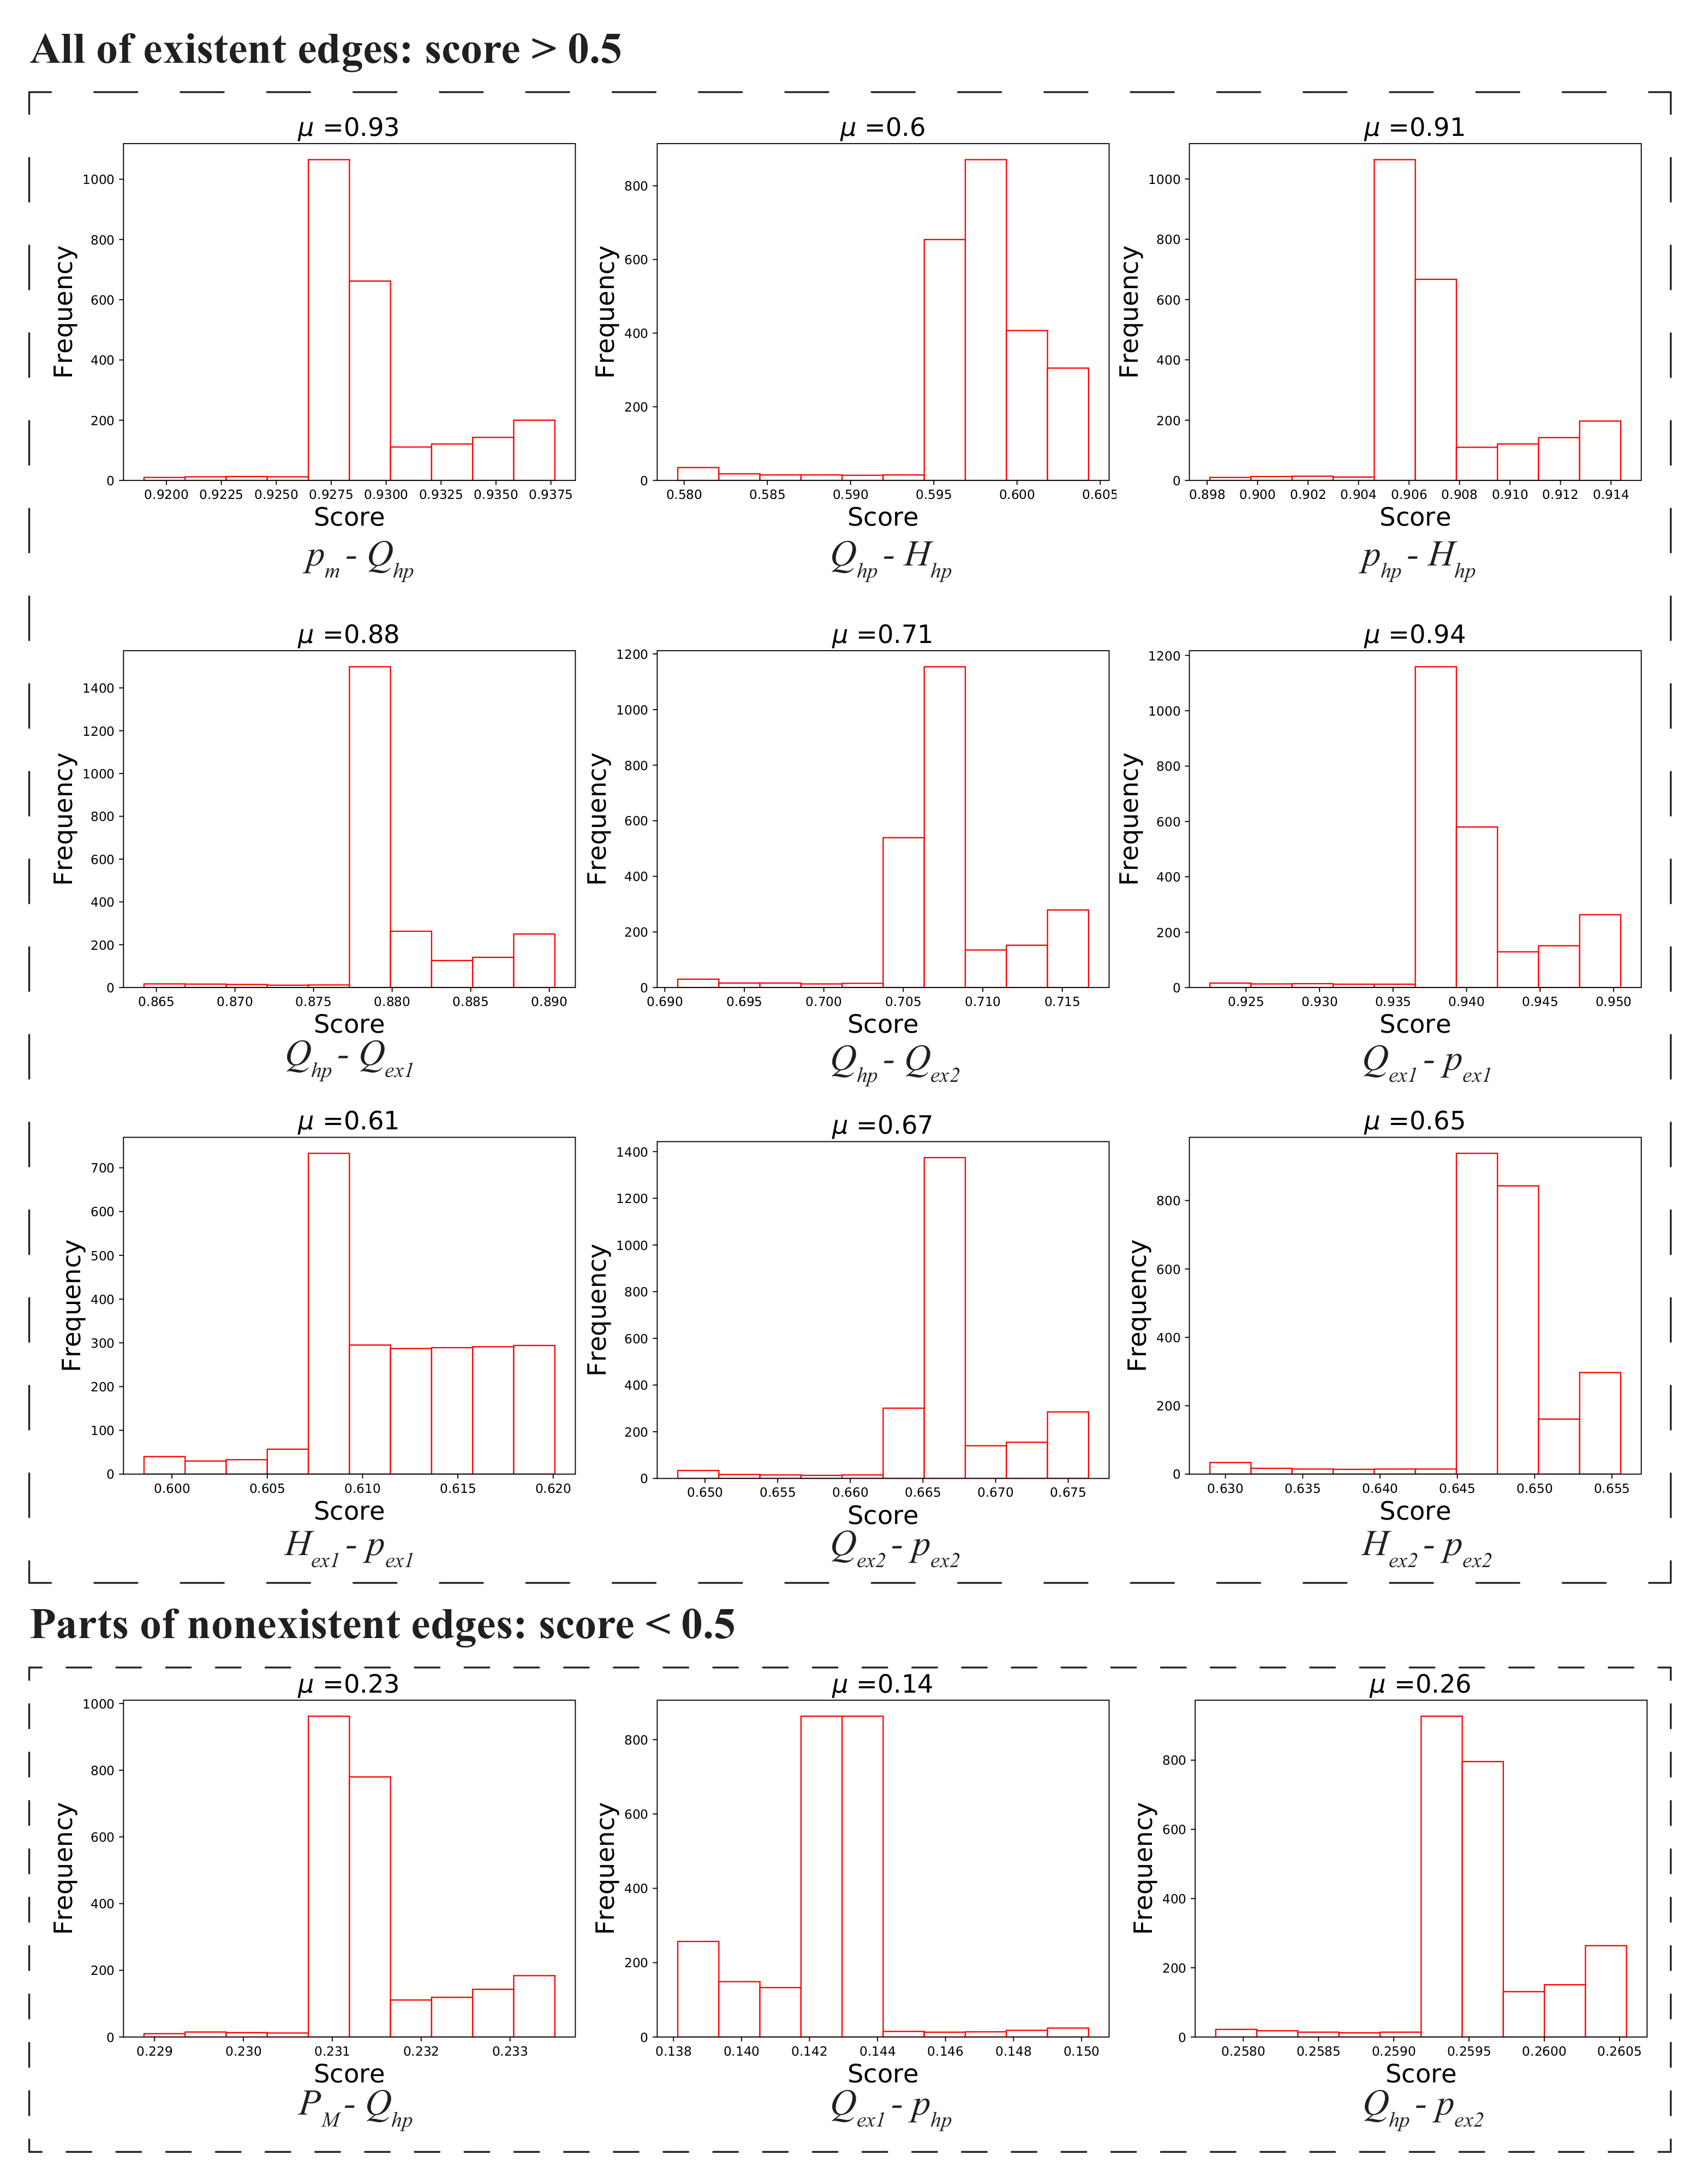
Since the link prediction model is tested with high accuracy, it can be adopted to predict the unknown edges. In Figure 6, the score histograms for all of the predicted existent edges and parts of the nonexistent are exhibited. Each histogram shows the score distribution of the corresponding links, and the average score is attached above each picture, indicated by . For the positive samples, i.e., the existent links, it can be inferred that the predicted average scores for the nine types of links are bigger than 0.5. For the negative samples, that is the nonexistent links, the predicted average scores for the three types of links are smaller than 0.5. Obviously, the link prediction based on the score function for the steam turbine system is accurate.
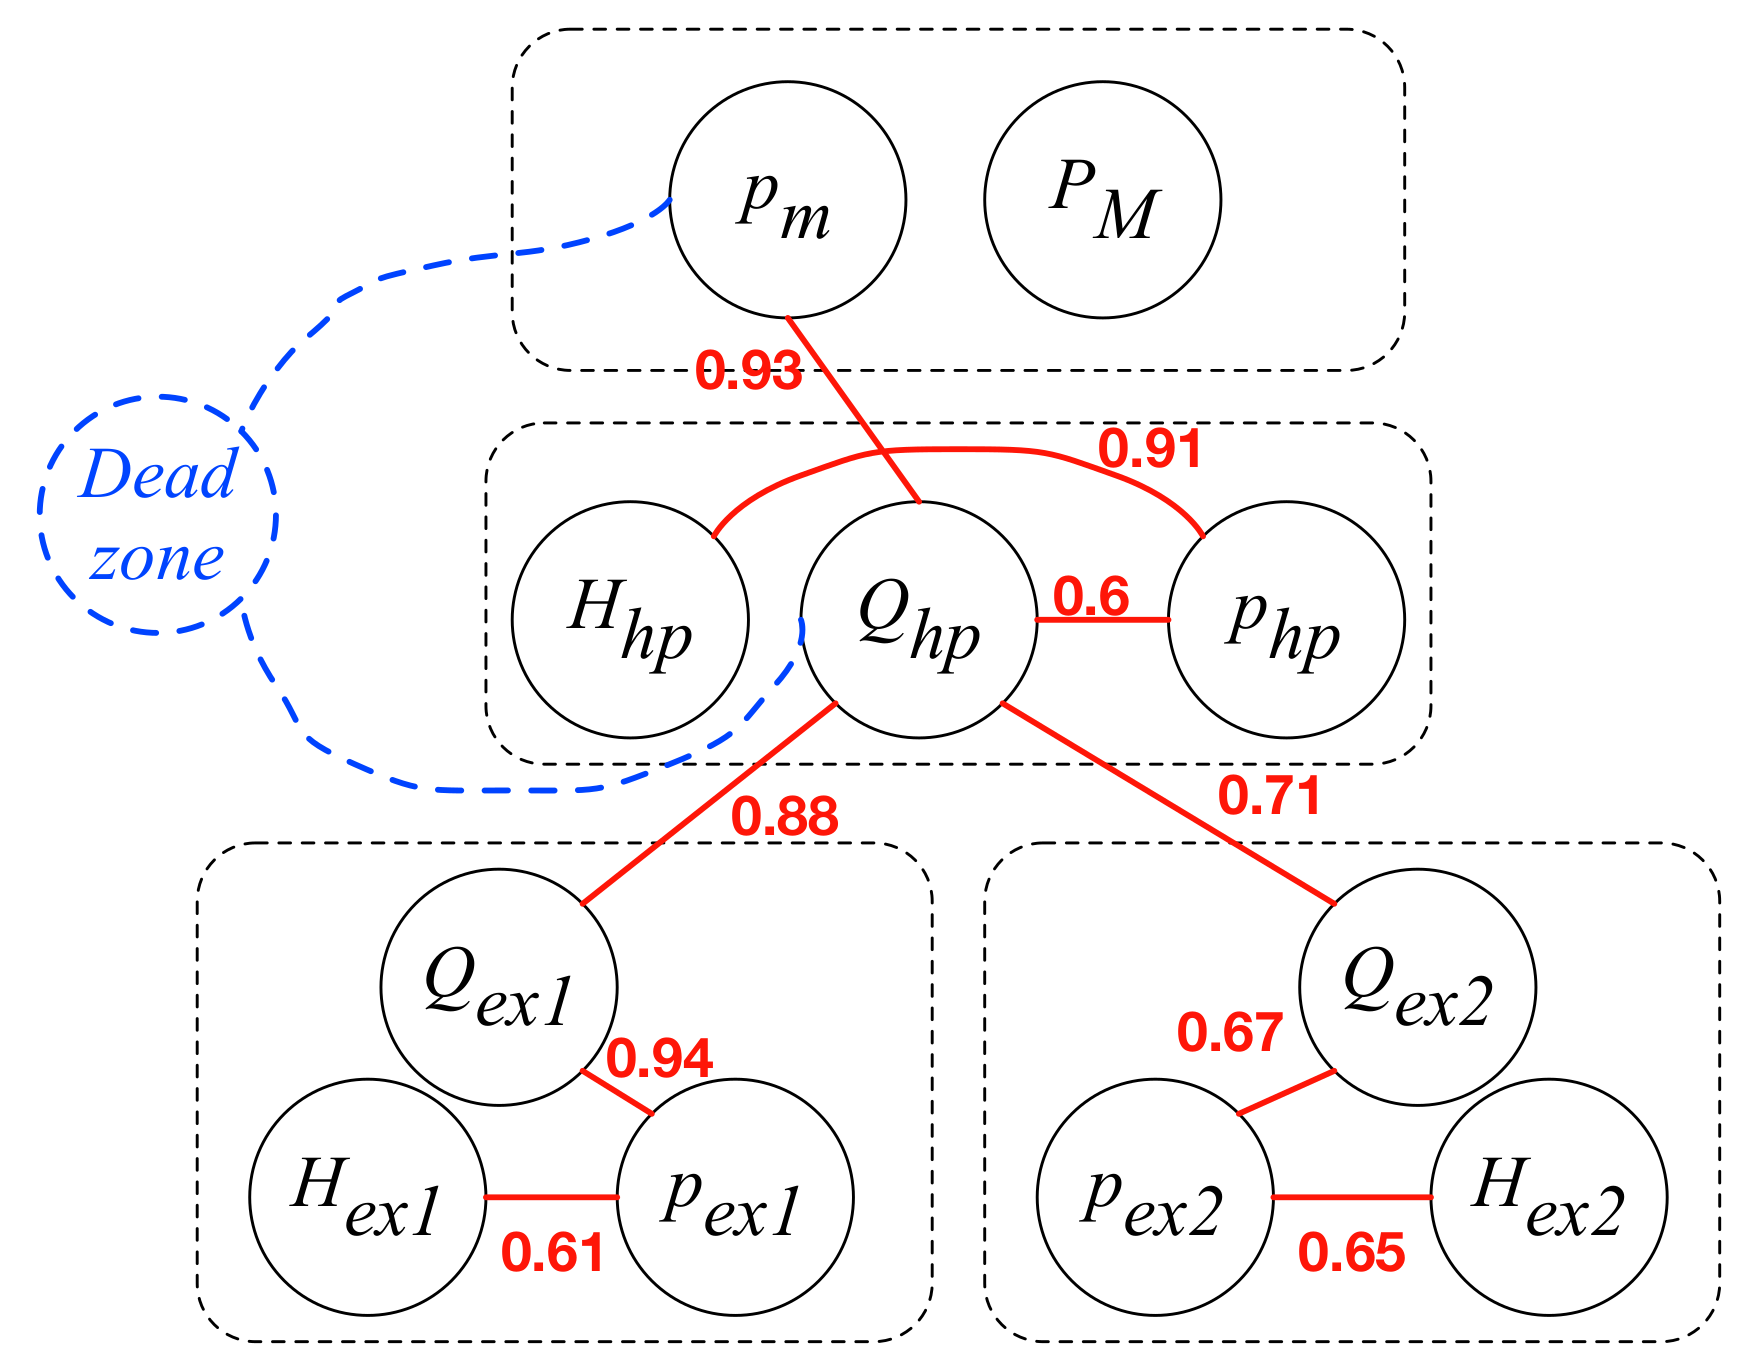
What is more, the completed graph is shown in Figure 7, which conforms to the results in Equation (1). The red lines are the predicted existent edges, labeled with the score of the link prediction model.
The link prediction results mainly reveal two kinds of relations: the relation between the steam pressure and the steam mass flow rate, and the relation between the steam pressure and the steam enthalpy. On the one hand, according to the thermodynamics of fluid, when the cross-sectional area of the flow is fixed, the larger the flow rate is, the greater the pressure is. On the other hand, the enthalpy H has the following relations with the intensity of pressure P:
where U and V represent the system internal energy and the volume, respectively. Obviously, the enthalpy is directly related to the pressure. Therefore, the link prediction results are convincing. The proposed method is suitable for the relationship prediction for the steam turbine and other inter-connected industrial system.
4. Conclusions Remarks
To solve the problem of inaccurate and uncompleted graph topology while detecting the fault of dead zone for the steam turbine control valve based on the graph model, a link prediction technology is proposed to estimate the relationships in this study. First of all, the uncompleted graph topology for the steam turbine control valve, which may lack some edges, is established according to the limited mechanism knowledge. Then, graph nodes representations are obtained using the graph convolution network. Finally, scores for edges are calculated utilizing pairs of connected graph nodes. The edges with scores larger than 0.5 indicate that there exist relationships between the corresponding graph nodes. Results exhibit the test accuracy of 99.2%, and follow the principles of thermodynamics. Moreover, in addition to the steam turbine control valve, other industrial system and even other disciplines, such as social networks and recommendation systems, must also have the same issue of link prediction and relationship prediction. The proposed method can also take these areas into account, with a good application prospect.
Author Contributions
Conceptualization, L.-S.H. and Y.-J.Z.; methodology, Y.-J.Z.; software, Y.-J.Z.; validation, L.-S.H.; formal analysis, Y.-J.Z.; investigation, Y.-J.Z.; resources, L.-S.H.; data curation, L.-S.H.; writing—original draft preparation, Y.-J.Z.; writing—review and editing, L.-S.H.; visualization, Y.-J.Z.; supervision, L.-S.H.; project administration, L.-S.H.; funding acquisition, no funding. All authors have read and agreed to the published version of the manuscript.
Funding
This research received no external funding.
Institutional Review Board Statement
Not applicable.
Informed Consent Statement
Not applicable.
Data Availability Statement
If necessary, you can send email to the author for data.
Acknowledgments
The authors thank Zhiwei You, an experienced engineer who has been engaged in thermal power plants for decades. He provided the faults faced in the practical application of the steam turbine, which greatly enhanced the applicability of this work. Besides, the author Yi-Jing Zhang would like to thank his girlfriend Ziyou Zhu, an excellent neurosurgery surgeon from Xiangya Hospital Central South University. Without her warm companionship, the study could not have been completed.
Conflicts of Interest
The authors declare no conflict of interest.
Abbreviations
| HP | High Pressure Turbine |
| Mechanical power | |
| P | Pressure |
| Q | Mass flow rate |
| H | Enthalpy |
References
- Vazquez, N.R.; Fernandes, D.P.; Chen, D.H. Control Valve Stiction: Experimentation, Modeling, Model Validation and Detection with Convolution Neural Network. Int. J. Chem. Eng. Appl. 2019, 10, 195–199. [Google Scholar] [CrossRef]
- Amiruddin, A.A.A.M.; Zabiri, H.; Jeremiah, S.S.; Teh, W.K.; Kamaruddin, B. Valve stiction detection through improved pattern recognition using neural networks. Control Eng. Pract. 2019, 90, 63–84. [Google Scholar] [CrossRef]
- Trinh, H.A.; Truong, H.V.A.; Ahn, K.K. Fault Estimation and Fault-Tolerant Control for the Pump-Controlled Electrohydraulic System. Actuators 2020, 9, 132. [Google Scholar] [CrossRef]
- De la Guerra, A.; Jimenez-Mondragon, V.M.; Torres, L.; Escarela-Perez, R.; Olivares-Galvan, J.C. On-Line Open-Phase Fault Detection Method for Switched Reluctance Motors with Bus Current Measurement. Actuators 2020, 9, 117. [Google Scholar] [CrossRef]
- Quattrocchi, G.; Berri, P.C.; Dalla Vedova, M.D.L.; Maggiore, P. Innovative Actuator Fault Identification Based on Back Electromotive Force Reconstruction. Actuators 2020, 9, 50. [Google Scholar] [CrossRef]
- Athanasatos, P.; Costopoulos, T. Proactive fault finding in a 4/3-way direction control valve of a high pressure hydraulic system using the bond graph method with digital simulation. Mech. Mach. Theory 2012, 50, 64–89. [Google Scholar] [CrossRef]
- Li, S.; Huang, J.; Zhang, Z.; Liu, J.; Huang, T.; Chen, H. Similarity-based future common neighbors model for link prediction in complex networks. Sci. Rep. 2018, 8, 1–11. [Google Scholar] [CrossRef] [PubMed] [Green Version]
- Clauset, A.; Moore, C.; Newman, M.E. Hierarchical structure and the prediction of missing links in networks. Nature 2008, 453, 98–101. [Google Scholar] [CrossRef] [PubMed]
- Wang, C.; Satuluri, V.; Parthasarathy, S. Local probabilistic models for link prediction. In Proceedings of the Seventh IEEE International Conference on Data Mining (ICDM 2007), Omaha, NE, USA, 28–31 October 2007; pp. 322–331. [Google Scholar]
- Lü, L.; Zhou, T. Link prediction in complex networks: A survey. Phys. A Stat. Mech. Its Appl. 2011, 390, 1150–1170. [Google Scholar] [CrossRef] [Green Version]
- Pandey, B.; Bhanodia, P.K.; Khamparia, A.; Pandey, D.K. A comprehensive survey of edge prediction in social networks: Techniques, parameters and challenges. Expert Syst. Appl. 2019, 124, 164–181. [Google Scholar] [CrossRef]
- Haghani, S.; Keyvanpour, M.R. A systemic analysis of link prediction in social network. Artif. Intell. Rev. 2019, 52, 1961–1995. [Google Scholar] [CrossRef]
- Kipf, T.N.; Welling, M. Semi-supervised classification with graph convolutional networks. arXiv 2016, arXiv:1609.02907. [Google Scholar]
- Mohar, B.; Alavi, Y.; Chartrand, G.; Oellermann, O. The Laplacian spectrum of graphs. Graph Theory Comb. Appl. 1991, 2, 12. [Google Scholar]
- Yang, B.; Yih, W.t.; He, X.; Gao, J.; Deng, L. Embedding entities and relations for learning and inference in knowledge bases. arXiv 2014, arXiv:1412.6575. [Google Scholar]
- Bordes, A.; Usunier, N.; Garcia-Duran, A.; Weston, J.; Yakhnenko, O. Translating embeddings for modeling multi-relational data. In Proceedings of the Advances in Neural Information Processing Systems, Lake Tahoe, NV, USA, 5–8 December 2013; pp. 2787–2795. [Google Scholar]
- Socher, R.; Chen, D.; Manning, C.D.; Ng, A. Reasoning with neural tensor networks for knowledge base completion. In Proceedings of the Advances in Neural Information Processing Systems, Lake Tahoe, NV, USA, 5–8 December 2013; pp. 926–934. [Google Scholar]
- Affandi, M.; Abdullah, I.; Khalid, N.S. MATLAB as a Tool for the Teaching of Rankine Cycle with Simulation of a Simple Steam Power Plant. J. Teknol. 2015, 77. [Google Scholar] [CrossRef] [Green Version]
Figure 1.
Diagram of the control valve in the steam turbine.

Figure 2.
Diagram of an uncompleted graph for control valve dead zone detection.

Figure 3.
Graph Convolutional Network for fault detection.

Figure 4.
Simulation results of steam turbine under normal and faulty conditions.

Figure 5.
Training curves for dead zone detection and link prediction.

Figure 6.
Histograms for the scores of existent and nonexistent edges.

Figure 7.
Completed graph .


Publisher’s Note: MDPI stays neutral with regard to jurisdictional claims in published maps and institutional affiliations. |
© 2021 by the authors. Licensee MDPI, Basel, Switzerland. This article is an open access article distributed under the terms and conditions of the Creative Commons Attribution (CC BY) license (https://creativecommons.org/licenses/by/4.0/).
Share and Cite
MDPI and ACS Style
Zhang, Y.-J.; Hu, L.-S. Relationship Prediction Based on Graph Model for Steam Turbine Control Valve. Actuators 2021, 10, 91. https://0-doi-org.brum.beds.ac.uk/10.3390/act10050091
AMA Style
Zhang Y-J, Hu L-S. Relationship Prediction Based on Graph Model for Steam Turbine Control Valve. Actuators. 2021; 10(5):91. https://0-doi-org.brum.beds.ac.uk/10.3390/act10050091
Chicago/Turabian StyleZhang, Yi-Jing, and Li-Sheng Hu. 2021. "Relationship Prediction Based on Graph Model for Steam Turbine Control Valve" Actuators 10, no. 5: 91. https://0-doi-org.brum.beds.ac.uk/10.3390/act10050091
Note that from the first issue of 2016, this journal uses article numbers instead of page numbers. See further details here.