
Remaining Useful Life Prediction of Lithium-Ion Batteries Based on Deep Learning and Soft Sensing

School of Computer Science, Northwestern Polytechnical University, Xi’an 710129, China
*
Author to whom correspondence should be addressed.
Actuators 2021, 10(9), 234; https://0-doi-org.brum.beds.ac.uk/10.3390/act10090234
Submission received: 4 August 2021
/
Revised: 4 September 2021
/
Accepted: 9 September 2021
/
Published: 13 September 2021
(This article belongs to the Special Issue Modelling, Control and Condition Monitoring of Actuator-Based Land Transport Systems)
Abstract
:The Remaining useful life (RUL) prediction is of great concern for the reliability and safety of lithium-ion batteries in electric vehicles (EVs), but the prediction precision is still unsatisfactory due to the unreliable measurement and fluctuation of data. Aiming to solve these issues, an adaptive sliding window-based gated recurrent unit neural network (GRU NN) is constructed in this paper to achieve the precise RUL prediction of LIBs with the soft sensing method. To evaluate the battery degradation performance, an indirect health indicator (HI), i.e., the constant current duration (CCD), is firstly extracted from charge voltage data, providing a reliable soft measurement of battery capacity. Then, a GRU NN with an adaptive sliding window is designed to learn the long-term dependencies and simultaneously fit the local regenerations and fluctuations. Employing the inherent memory units and gate mechanism of a GRU, the designed model can learn the long-term dependencies of HIs to the utmost with low computation cost. Furthermore, since the length of the sliding window updates timely according to the variation of HIs, the model can also capture the local tendency of HIs and address the influence of local regeneration. The effectiveness and advantages of the integrated prediction methodology are validated via experiments and comparison, and a more precise RUL prediction result is provided as well.
1. Introduction
As the main energy component, lithium-ion batteries (LIBs) play an important role in the development of hybrid and electric vehicles (EVs) and other electronic industry, owing to the advantages of high energy density, low-emission, lightweight, etc. [1]. However, the maximum available capacity gradually fades with the repeated charge and discharge, leading to the end of the battery life. It will cause waste if the battery is replaced too early, while safety accidents may occur when it is replaced too late [2,3]. The health monitoring and prognostics for LIBs can make great contributions to improve the safety and reliability of EVs and provide early warning for battery replacement [4]. One of the most important issues in the condition monitoring and prognostics of LIBs is the prediction of remaining useful life (RUL) via degradation modeling and online inference.
Typically, the methods for an RUL prediction mainly include model-based methods and data-driven methods. The model-based methods, particularly the Kalman filter (KF), the particle filter (PF) and some stochastic models, have been recognized to contribute the state of charge (SOC) and state of health (SOH) estimation of batteries in recent years [5,6,7,8]. However, for LIBs, the sensitivity of a stochastic model when facing the complicated degradation mechanisms causes a decrease in the model robustness. By contrast, the data-driven methods can learn the battery degradation trends from battery monitoring data directly, whereby it circumvents the analysis of electrochemical reaction and failure mechanism. Hence, these kinds of technologies have attracted great interest recently among researchers [9].
The accuracy of data-driven RUL prediction methods relies heavily on a health indicator (HI), which usually refers to the indicator that can significantly reflect the degradation behaviors of LIBs. The traditional His [10,11,12], e.g., capacity or impedance, are difficult to measure in real applications due to the expensive instruments and complex operations. To address these issues, in [13,14,15], discharge voltage data are employed to derive indirect His to characterize the battery degradation. However, when applying the above His in practice, the high sensitivity of discharge profiles to dynamic operation conditions may cause big prediction errors [7]. Comparatively, the charge process is more stable and can provide a more reliable HI, such as the sampling points of terminal voltage used in [16]. Nevertheless, the reliability of the abovementioned indirect HI is still not assessed, and the local fluctuations in the measuring data are not considered.
Furthermore, prediction modeling has always been the focus of attention on battery RUL predictions. As matters stand, there are many data-driven approaches, with emphasis on artificial intelligence being increasingly applied to RUL estimations, such as a relevance vector machine (RVM) [13], a support vector machine (SVM) [17], an artificial neural network (ANN) [18,19]. These methods have brought great progress to the field of state prediction, but there are still some issues, including the complex model structure and the low prediction accuracy [20]. Recently, deep learning with a better learning character and stronger model adaptability has aroused the interest of researchers for improving the prediction accuracy of the model [21]. One of the most influential methods is the recurrent neural network (RNN) for dealing with the prediction of time series [22]. However, it lacks the efficient mechanism for selecting key information and may suffer from a vanishing gradient or an exploding gradient. Then, some of the improved RNNs, i.e., the long short-term memory neural network (LSTM NN) [23], are widely proven to effectively contribute the above problems thanks to the long-term dependencies learning capacity. However, the computation cost of the training and prediction process of the LSTM NN is still large, which limits its practical application. Currently, it is noted that a gated recurrent unit neural network (GRU NN) [24] is proposed, which not only deal with the long-term dependencies data, but also has the advantages of a lighter structure, fewer parameters and a shorter training time. Thus, a GRU NN is more suitable for the online RUL prediction of LIBs. However, when the aforementioned method is applied to the RUL prediction of LIBs, the prediction result may be unreliable due to the existence of the local regeneration phenomenon [7]. Local regeneration is a frequent phenomenon in the shelving phase of battery operations, and it has been recognized in [25,26]. The regeneration phenomena can result in the local fluctuations of battery monitoring data in reality. However, it is still a challenging mission to design a precise battery RUL prognostics arithmetic using online monitoring data in the presence of local regenerations and fluctuations.
Inspired by the above works, in this paper, we propose an RUL prediction method combining deep learning and soft sensing. To avoid the measurement difficulties of direct HIs in the online application, we firstly extract the constant current duration (CCD) from the voltage and current data of the charge process as the HI to reflex the battery degradation performance. Then, an adaptive sliding window-based GRU prediction model is constructed to synchronously learn the long-term dependencies and capture the local regenerations. Due to the advantages in learning long-term dependencies and capturing the local regenerations and fluctuations, a more accurate prediction result can be expected. The major contributions of this paper are listed as follows:
- (1)
- Combining soft sensing with deep learning, a reliable RUL prediction model is proposed, which can accomplish a satisfactory HI estimation and provide an accurate RUL for LIBs in the routine environment.
- (2)
- A unique indirect HI, i.e., the CCD extracted from the charge monitoring data, is considered as the indirect HI without complicated measurements and time-consuming calculations, providing a soft measurement of battery performance degradation.
- (3)
- A GRU prediction network with an adaptive sliding window is utilized to estimate the HI tendencies and determine the battery residual life. The designed GRU NN can not only learn the long-term dependencies but also fit the local regenerations and fluctuations of the battery degeneration with low computation cost.
2. HI Extraction
2.1. Test Data
All the data for the analysis and tests in this manuscript are selected from the experimental data of 18,650 sized LIBs provided by the NASA PCoE research center [27]. A set of four LIBs (B5, B6, B7 and B18) cycles through three operation profiles (charge discharge and impedance) under room temperature (24 °C). The parameter setups about ambient temperature (AT), charge current (CC), discharge current (DC), end-of-discharge (EOC) and end of life criteria (EOLC) for these batteries are presented in Table 1. Since the charge process is more stable than the discharge process, the measured data during battery charge are employed to analyze the battery degradation performance.
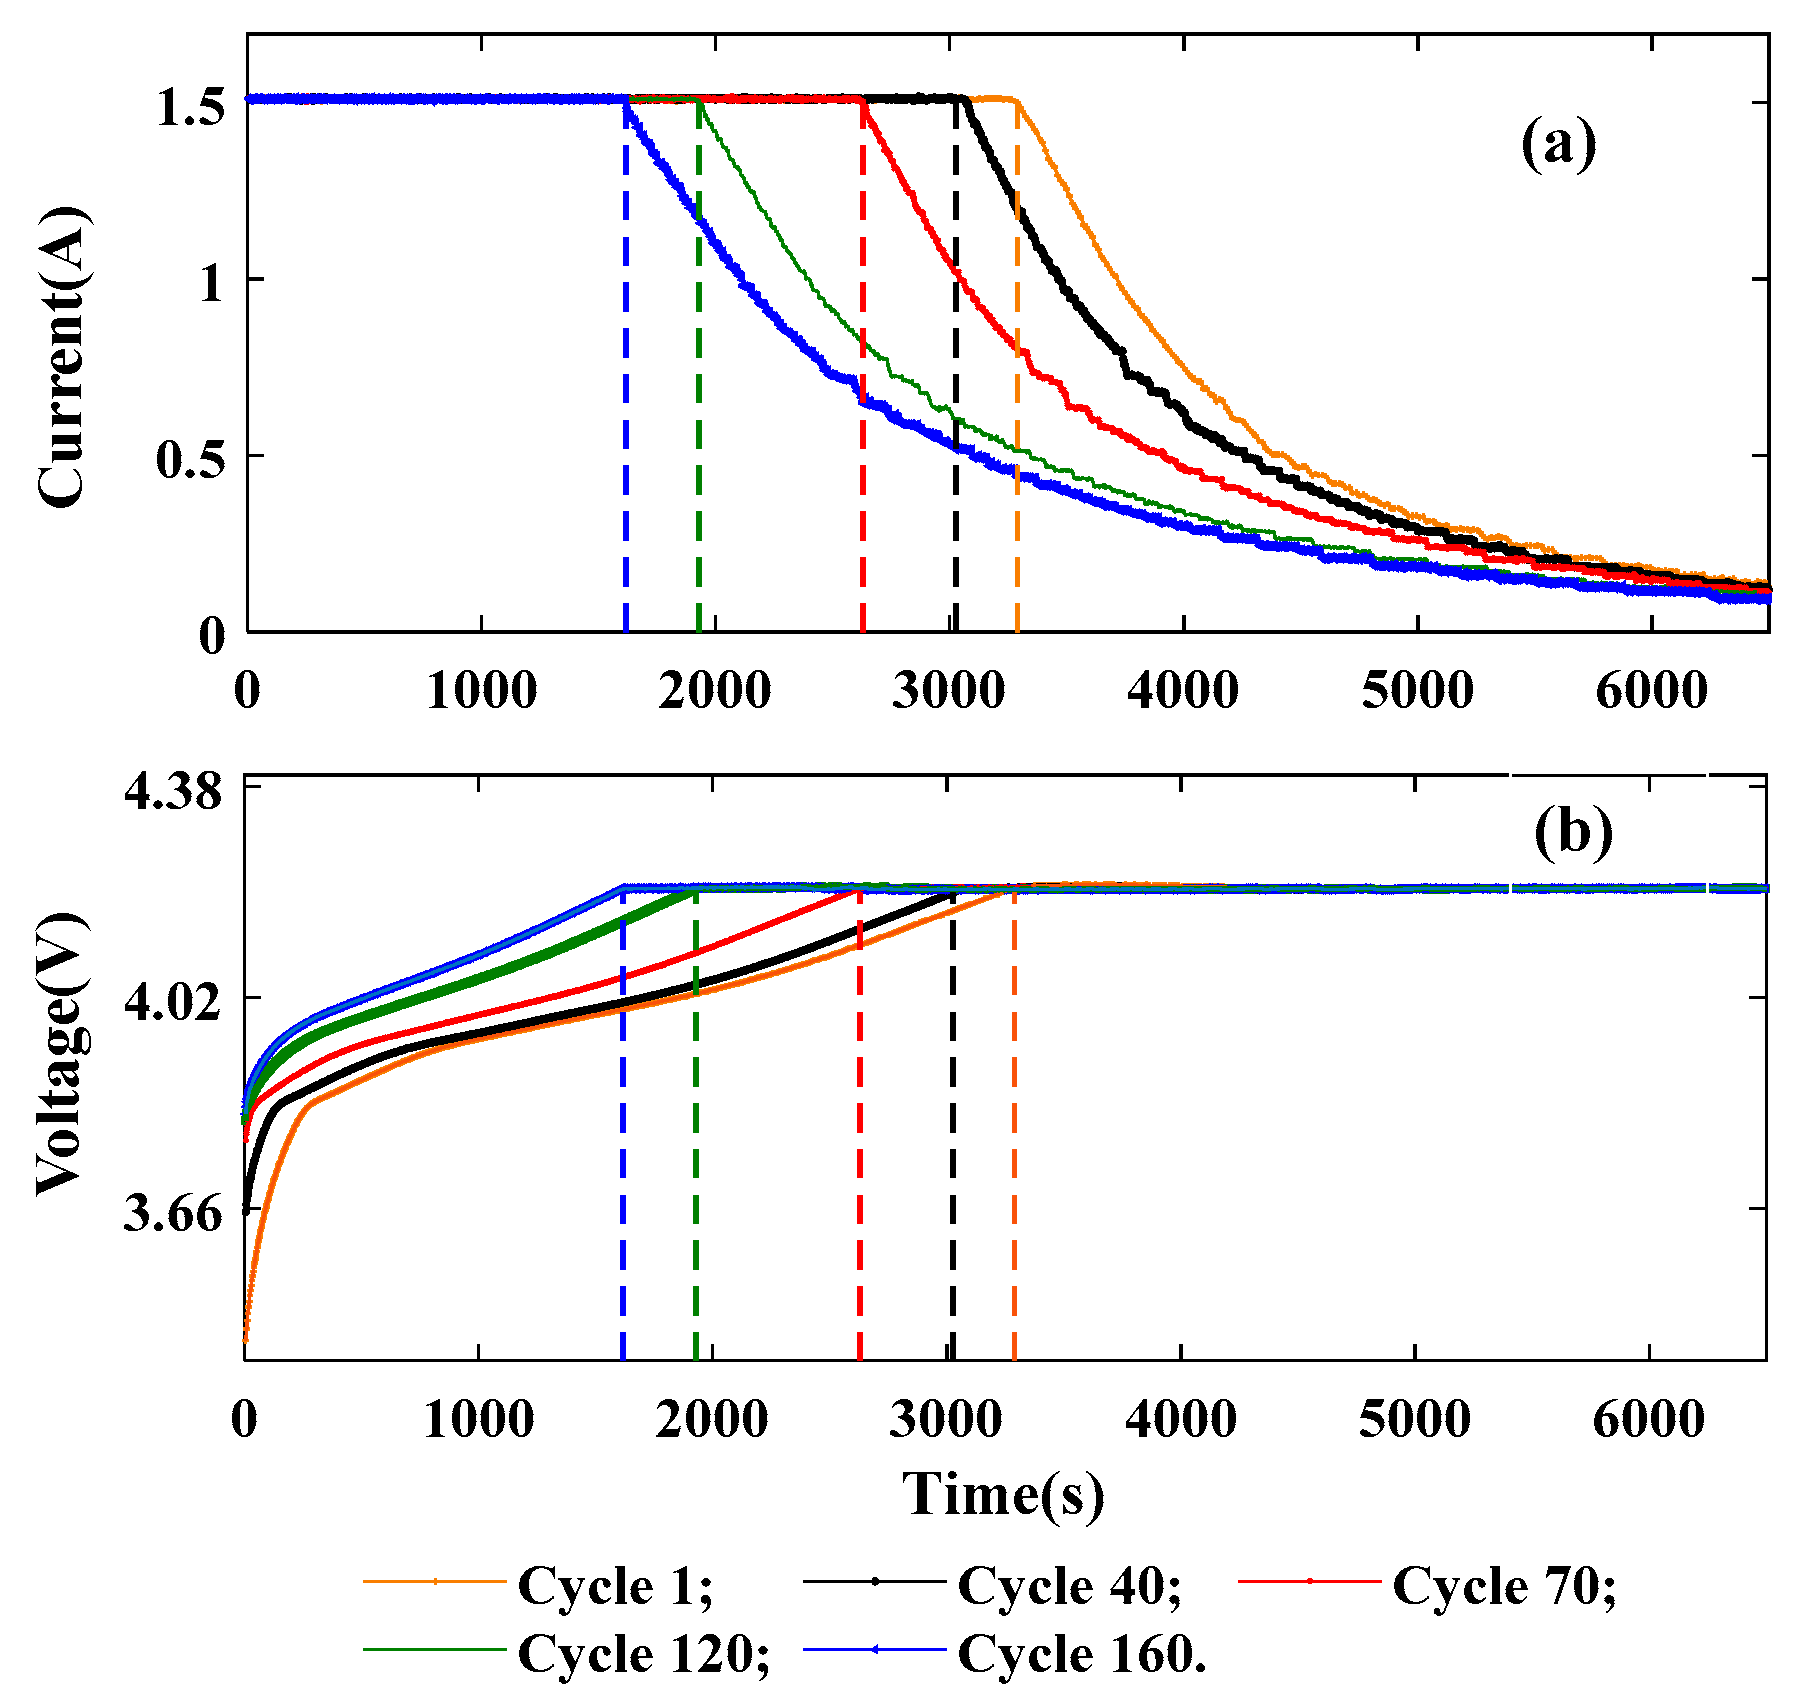
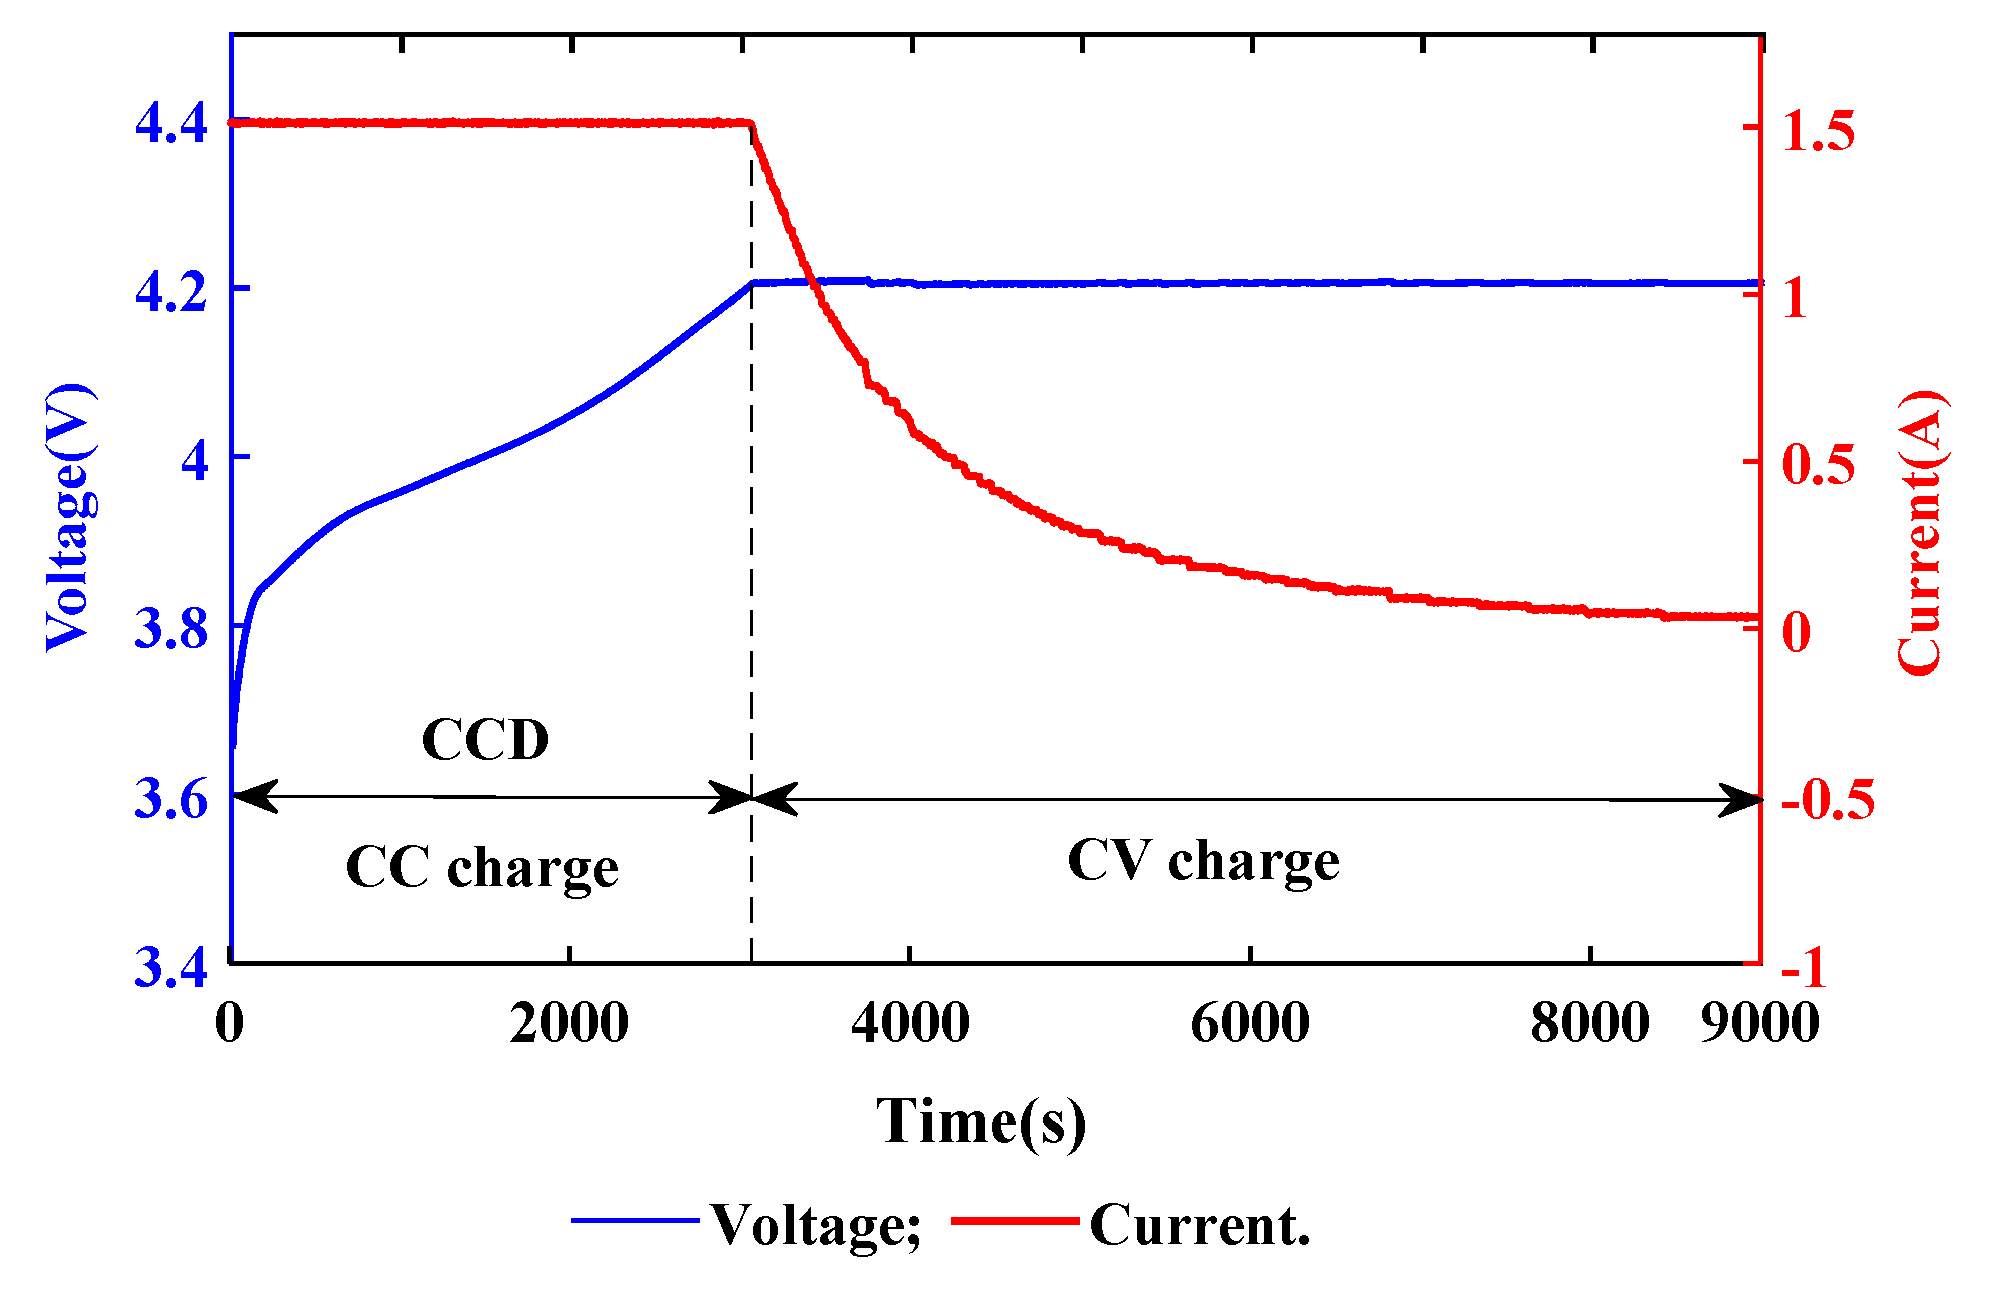
The database used in this paper contains the charge information covering cycle 0 to cycle 168 for B5–B7, and cycle 0 to cycle 132 for B18. Taking B5 as an example, Figure 1a,b illustrates the varying charge current curves and voltage curves at charge cycle 1, 40, 70, 120 and 160, separately. Specifically, the battery charge profile is carried out in a constant current (CC) and constant voltage (CV) mode, and the detail of the CC-CV charge curves at cycle 40 is shown in Figure 2. As we see in Figure 2, the CC charge mode is firstly implemented at the beginning of the charge process with a current of 1.5 A until the battery voltage reaches 4.2 V. Then, the battery enters the CV charge mode until the current drops to 20 mA. The work conditions and test modes of B6, B7 and B18 are the same as those of B5.
2.2. HI Extraction
An effective HI that can reflex the real battery degeneration characteristics is important for the RUL prediction of LIBs. The traditional His, e.g., capacity or impedance, are difficult to measure due to the fact that they generally need expensive instruments and complex operations and cannot be used in online real-time prognosis. Hence, the soft sensing method is becoming the mainstream for the data-driven prediction method. As stated in [28], the soft sensing model takes easily measurable variables and difficult-to-measure variables as the input and output, to estimate the variables that cannot be detected due to the limitations of the sensors. In this section, we aim to construct an easily measurable indirect HI to reflect battery capacity degradation, which is unavailable in the online application.
As known, the performance of LIBs gradually degrades with the increase in the charge number, and this degradation can be observed in geometrical shapes of current and voltage curves at different cycles, as seen in Figure 1. By analyzing these curves, the time length of the CC charge mode gradually shortens, and the growth of the voltage becomes faster and faster with the growth of the cycle number. Namely, there exists a certain correlation between the charge current duration and battery performance. To describe the battery degradation processes, the CCD is selected in this paper as the HI to reflect the battery degradation performance. The CCD is the duration of the CC charge mode, as defined in Figure 2. It is a direct indicator of the battery capacity variation and reflexes the battery polarization to a certain extent.
The vector of the CCD along charge cycle can be expressed as follows:
where CCD is the vector of the observed values of the CCD, N indicates the number of battery cycles and represents the end time of the CC charge process for cycle i, which is also the start time of the CV charge process. Generally, as in Figure 1 and Figure 2, the end time of the CC charge process can be considered as the time when the battery voltage reaches 4.2 V.
3. Algorithm Description
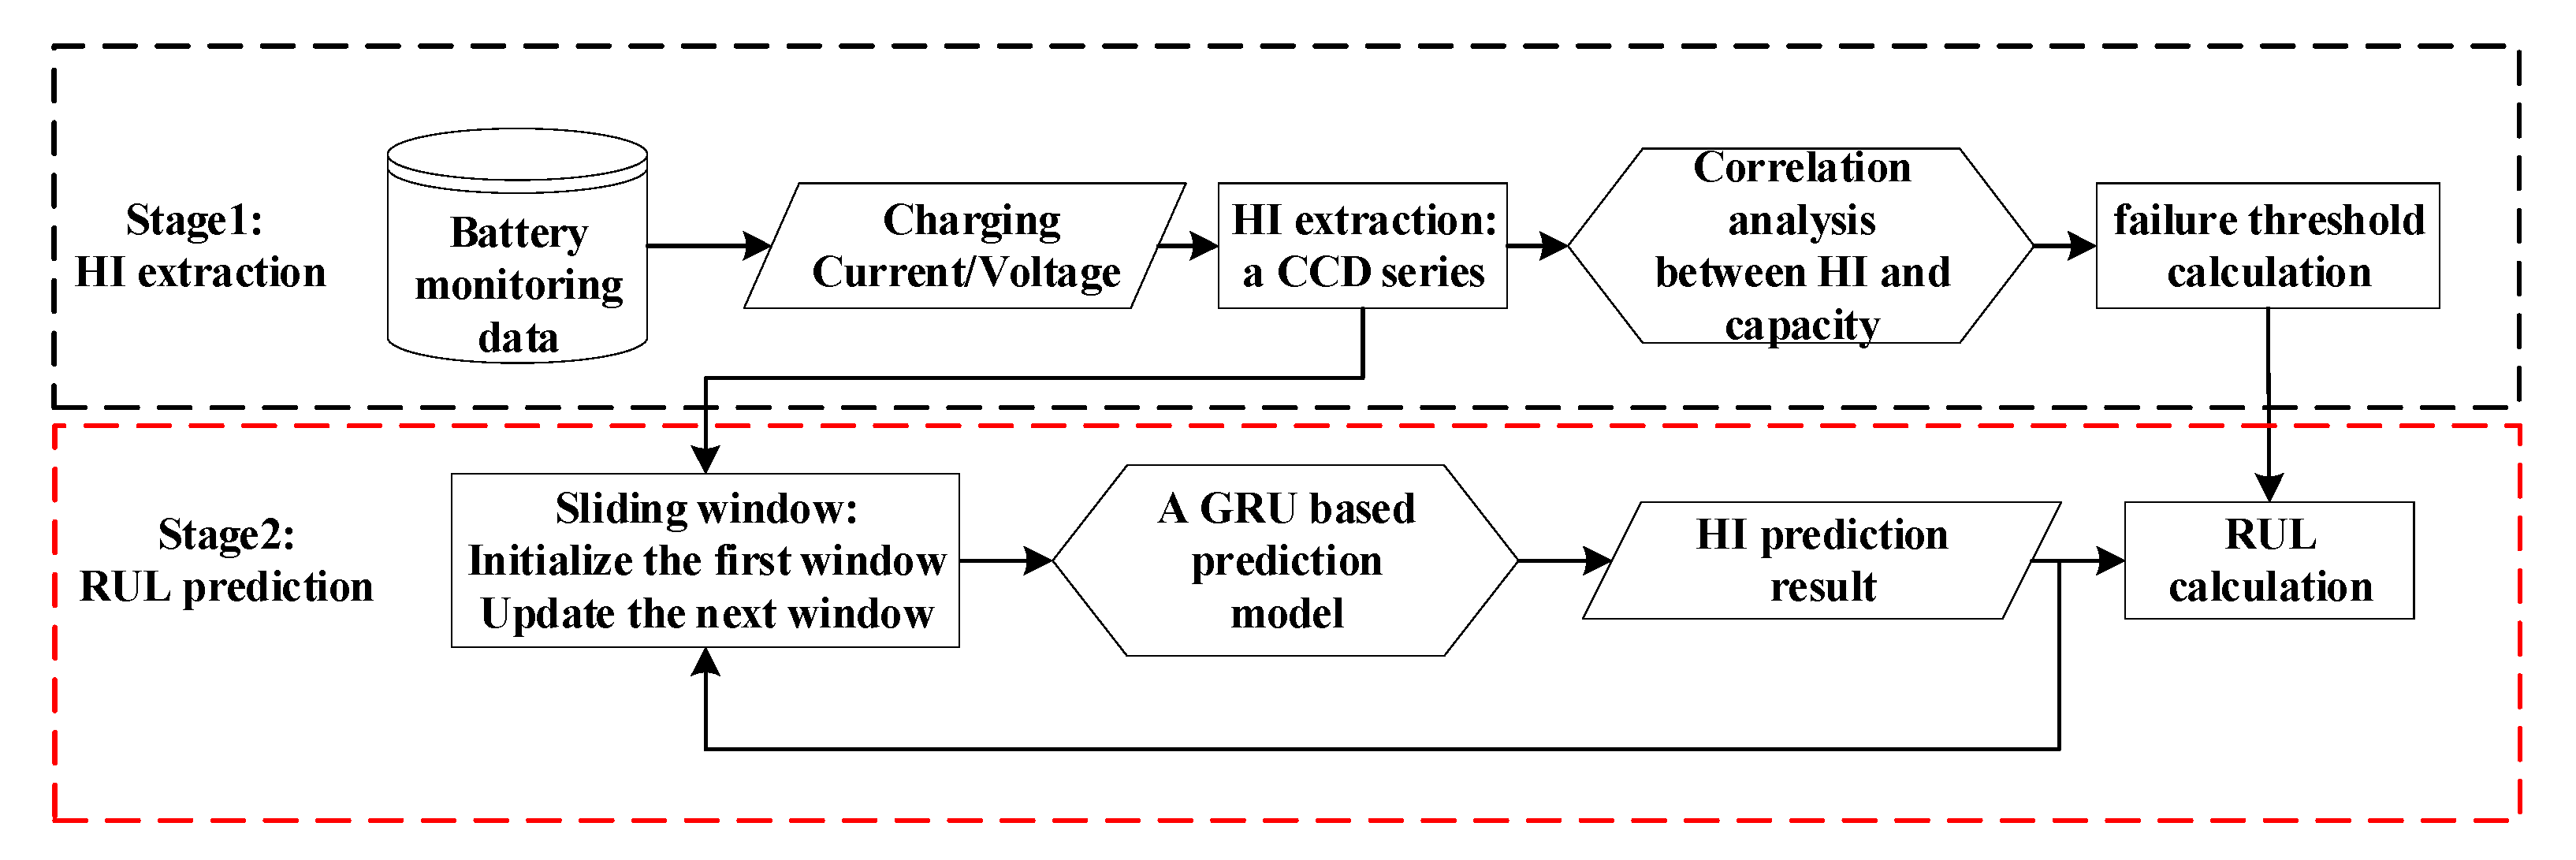
Using the extracted CCD as the HI, an adaptive sliding window-based GRU prediction network is constructed in this section to estimate the HI degradation and predict the RUL of the LIB. The structure of the prediction model is illustrated in Figure 3. As presented, an adaptive sliding window is designed to dynamically select the input data for training and forecasting. Then, a GRU NN is constructed with the purpose of estimating the decline of CCD online using the trained model parameters and forecasting inputs. At last, the RUL of the LIB can be determined from the predicted CCD values.
3.1. GRU Prediction with Adaptive Sliding Window
As an improved recurrent neural network, a GRU is designed to solve the gradients’ exploding and vanishing problem by virtue of the peculiar memory unit and gate mechanism. Additionally, meanwhile, compared with the traditional LSTM, less training data and time are required to promote the convergence of the model with the streamlined gates. By combining with the GRU cells, an adapted window updating mechanism is designed to contribute the GRU NN construction to conduct the CCD estimation and RUL prediction.
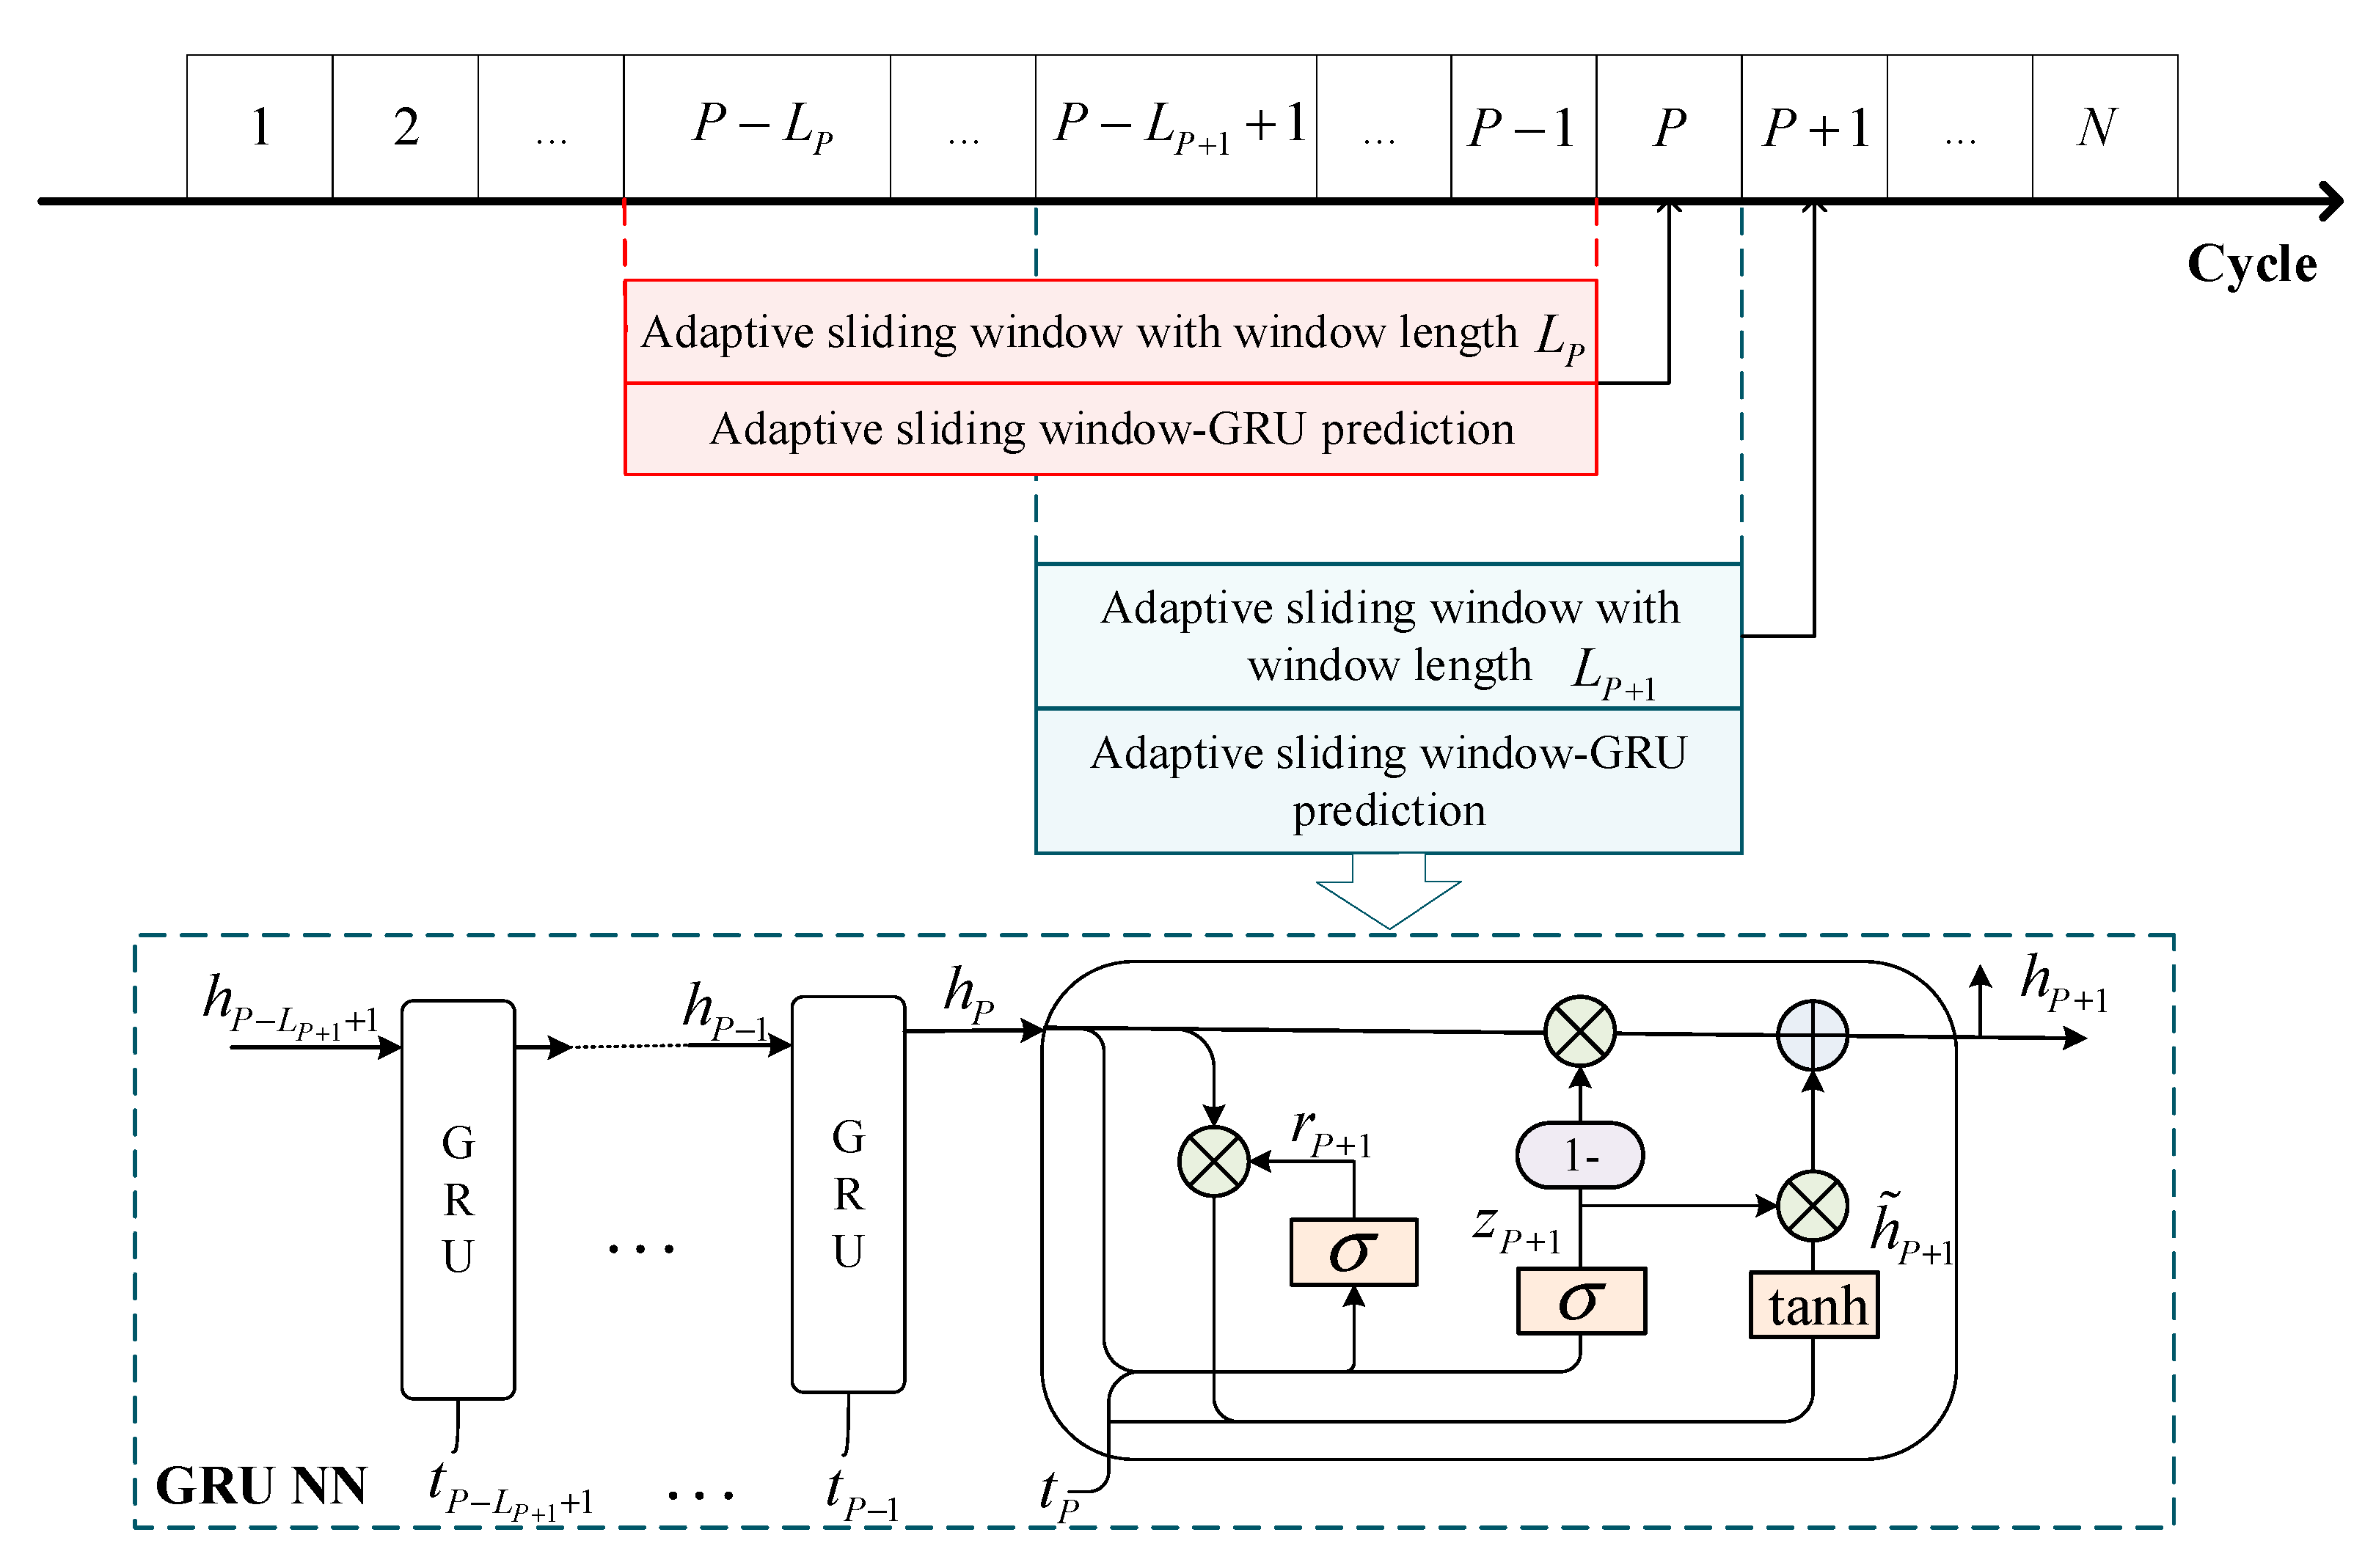
The graphical description of the proposed adaptive sliding window-based GRU prediction structure is revealed in Figure 4. The amount of CCD data fed into the GRU model in each iteration is updated as the window length changes. Significantly, the number of GRU cells, i.e., the hidden size of the GRU NN, is dynamically consistent with the length of the sliding window. The generation process of learning data for the GRU model using the adaptive sliding window is given as follows:
- (1)
- The sliding mode of the window is set as one-step ahead, i.e., the number of the new data in the window adds only one for each step. Let the current point be P, and the next point be P + 1; the value of the CCD at P + 1 needs to be predicted.
We use the priori data captured in the current sliding window to predict the CCD value at P + 1, and the length of this sliding window is , which can be updated by using the following formula [29]:
where indicates the Euclidean vector of the norm of the difference between and , with and . is the mean value of . indicates the absolute value of the difference between the and , which are the variances of and respectively, and denotes the mean value of . and are hyper-parameters for the proposed sliding window, which are determined by trial and error.
- (2)
- In the online training stage, through selecting the initial window length and performing the one-step-ahead prediction, the CCD data for training are expanded into two-dimensional space to explore the structure and parameters of the GRU NN. For each sequence, its length varies with the adaptive mechanism (Equation (2)). With the trained model, the designed GRU NN can predict the CCD of the next cycle one by one. As seen in Figure 4, the GRU NN is composed of the basic GRU cell with a reset gate () and an update gate (). The information propagating in GRU cells can be controlled by the gate mechanism.
Given that the input at the current time is and is the CCD value at the next time, it is P + 1 that needs to be predicted. indicates the hidden state of GRU cells at P, which is also the output of the cell. The reset gate () aims to control the data information from the new input information and output information yielded by previous cells. The update gate is employed to maintain the helpful historical information. The reset gate and update gate at time P + 1 are, respectively, calculated using the following formulas:
where is the logistic sigmoid function, and represent the layer weights and indicates the biases.
The output of the reset gate is employed to generate the candidate state using a tanh function for updating the cell state. Then, the output of this cell can be calculated using and the output of the update gate, . The transformation process of the cell states is presented in the following form:
where means the element-wise product, and represent the layer weights and indicates the biases.
The RUL prediction model is constructed by connecting the above GRU cells. When the predicted CCD is lower than the failure threshold, a failure occurs, and the RUL can be calculated.
3.2. RUL Prediction
An LIB is deemed to fail when the HI reaches its pre-specified failure threshold. Additionally, the length of available service cycles from the current cycle to the end-of-life cycle are referred to as the RUL. In this paper, the end-of-life cycle is the cycle number when the CCD decreases below its failure threshold, and the current cycle is the prediction start cycle.
The high correlation between the capacity and the extracted HI is demonstrated in the subsequent Section 4.1, then the failure threshold of the normalized CCD () can be expressed as follows [13]:
where indicates the failure threshold on battery capacity, which is usually set to 70–80% of its nominal value [10], and and are the maximum and minimum of capacity. For convenience, the normalized CCD and its failure threshold are employed in the following experiment and analysis.
The RUL can be calculated using the following [16]:
where is the number of residual cycles, i.e., the RUL. indicates the cycle number when the value of CCDs degrades below , and represents the prediction starting cycle.
4. Results and Discussion
To verify the validity of the RUL prognostic model proposed in this manuscript, several experiments and comparisons are performed here. Additionally, the degradation data of cells B5, B6, B7 and B18 introduced in Section 2.1 are selected for prediction and analysis experiments in this chapter.
4.1. Correlation Analysis and Life Threshold Calculation
According to the analyses in Section 2.2, the proposed HIs, i.e., the CCDs, are extracted from the charge current and voltage monitoring data of each battery.
To assess the consistency between the extracted CCD and the capacity, the spearman correlation analysis and significant test are performed for batteries B5–B7 and B18. The spearman correlation ranges from 0 to 1, in which the value of 1 indicates a strong correlation, while 0 denotes a low correlation. Next, to obtain the statistical significance, the significant test on the spearman rank correlation coefficient is performed. The level of statistical significance expressed as H with H ∈ [0, 1]. A small H leads to a strong possibility of rejecting the null hypothesis, which indicates a significant correlation between the extracted HI and capacity. The detail can refer to [30]. The obtained results are presented in Table 2. As can be seen, the correlation coefficients between the capacity and the extracted CCD for all the considered batteries are close to 1. These indicate that a significant linear correlation between the CCD and the capacity of LIBs exists. Hence, the extracted HI can prominently reflect the degradation performance of LIBs as an alternative to capacity.
Next, the failure threshold of normalized CCDs can be calculated according to the threshold transforming of the normalized capacity in Equation (7). The corresponding failure thresholds for four batteries are also listed in Table 2.
4.2. Performance Assessment
In this manuscript, two evaluating standards are adopted to evaluate the prediction performance of the proposed model, which are listed as the coefficient of determination (R-square), and the Absolute Error (AE).
Here, the expression of R-square is as follows:
where represents the mean value of .
As to the evaluation standard AE, it is calculated by the following:
where and denote the real RUL and the predicted one of LIBs, respectively.
4.3. Prediction Results Analysis
This paper develops an adaptive sliding window-based GRU (ASWGRU) NN for the RUL prediction of LIBs to improve the prediction precision and robustness. This algorithm is implemented by implanting an adaptive sliding window into the GRU arithmetic. In which, the inputs of the GRU are replaced with rebuilt data by the designed adaptive sliding window. With the long-term learning performance of the GRU and the transient state capturing capacity of an adaptive sliding window, this method can not only predict the global degradation trends of CCD, but also estimate the local regenerations. The window parameters and are set to 5 and 25, respectively. In the experiment, we found that the GRU with more than two hidden layers tends to overfit the training set; therefore, the number of GRU layers is set to 1. The hidden size of the GRU is updated by the ASW. Additionally, the resilient mean square backpropagation method is employed for adaptively optimizing the weights and biases in the GRU model. The other hyper-parameters of the neural network are selected with the manual search method.
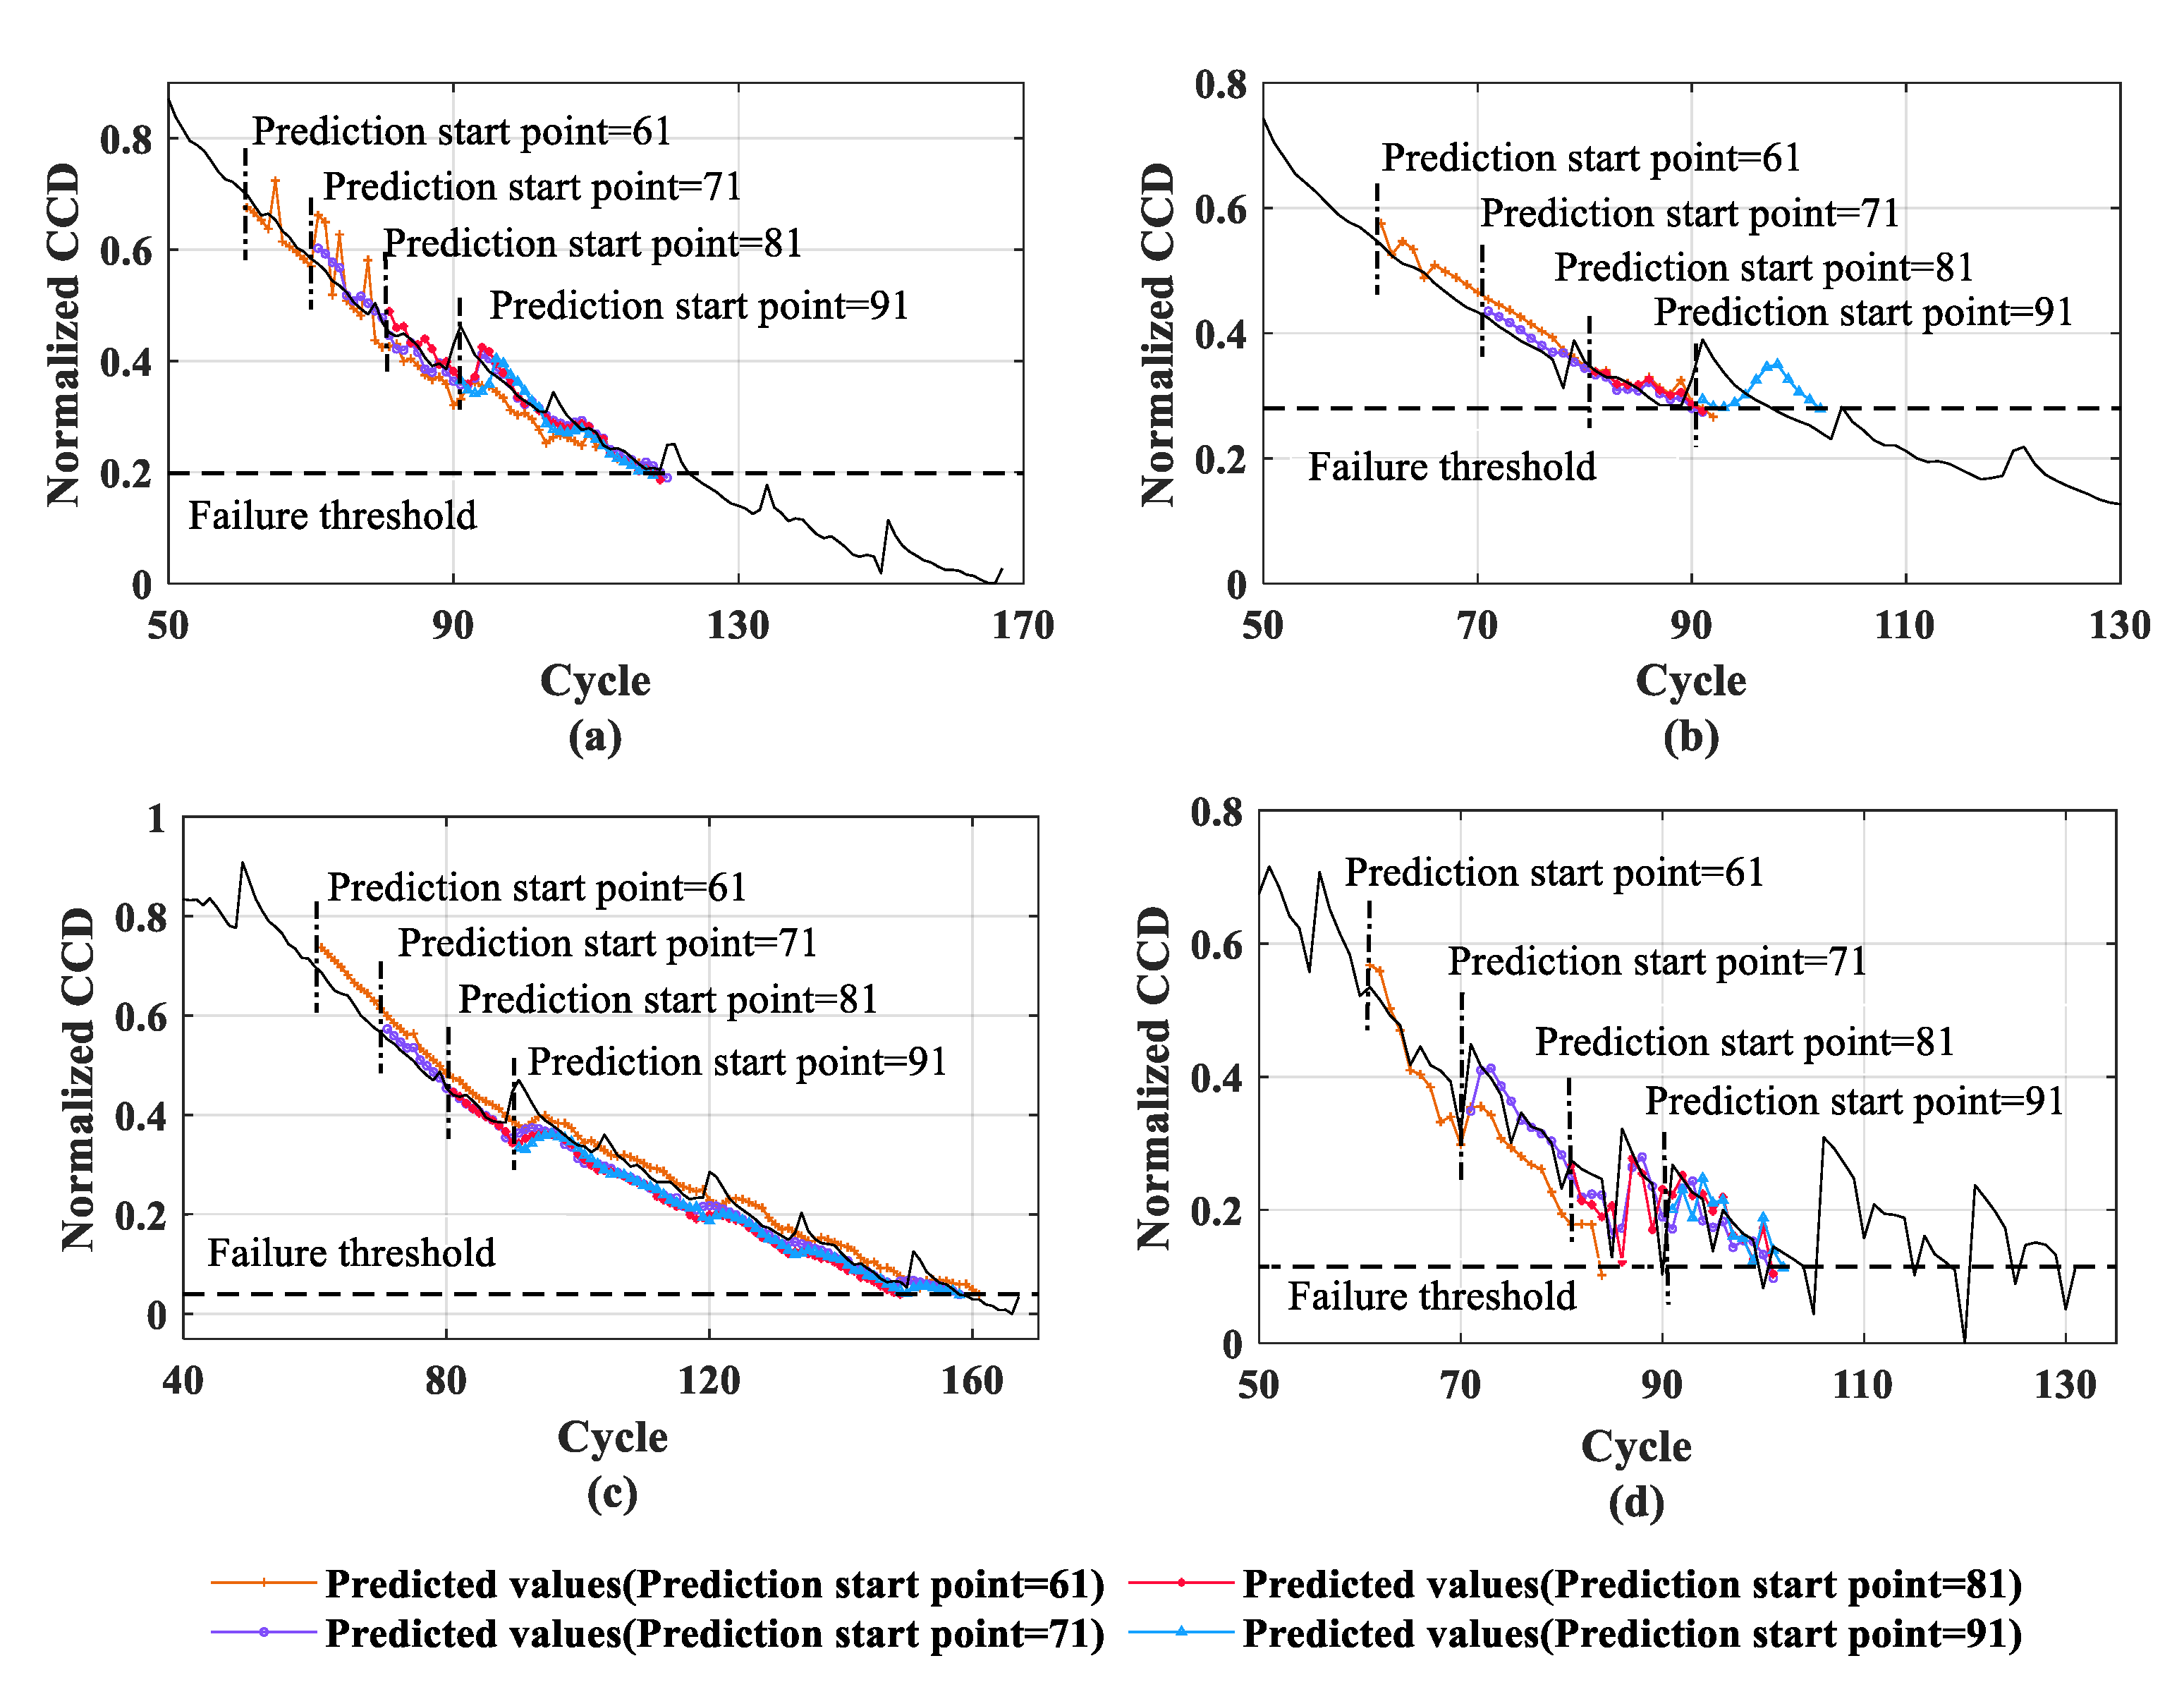
First, an RUL prediction with start points 61, 71, 81 and 91 is conducted for B5, B6, B7 and B18. The prediction results can be seen in Figure 5. As seen, despite the fact the transient state estimation performance for the CCD reduces as the training data decrease, the designed prediction algorithm can still provide a satisfactory RUL prediction for all the batteries. In the sequel, the R-square between the estimated CCD and the actual value and the AE of the predicted RUL for four batteries are collected in Table 3, Table 4, Table 5 and Table 6. In which, all the R-square values of the B5–B7 batteries are close to 1, which demonstrates that the CCDs estimated using the present method are consistent with their real values, implicating a high prediction precision. For B18, the local fluctuations in the battery data are more frequent and the RUL prediction precision descends by comparison with the prediction result of B5 and B7.
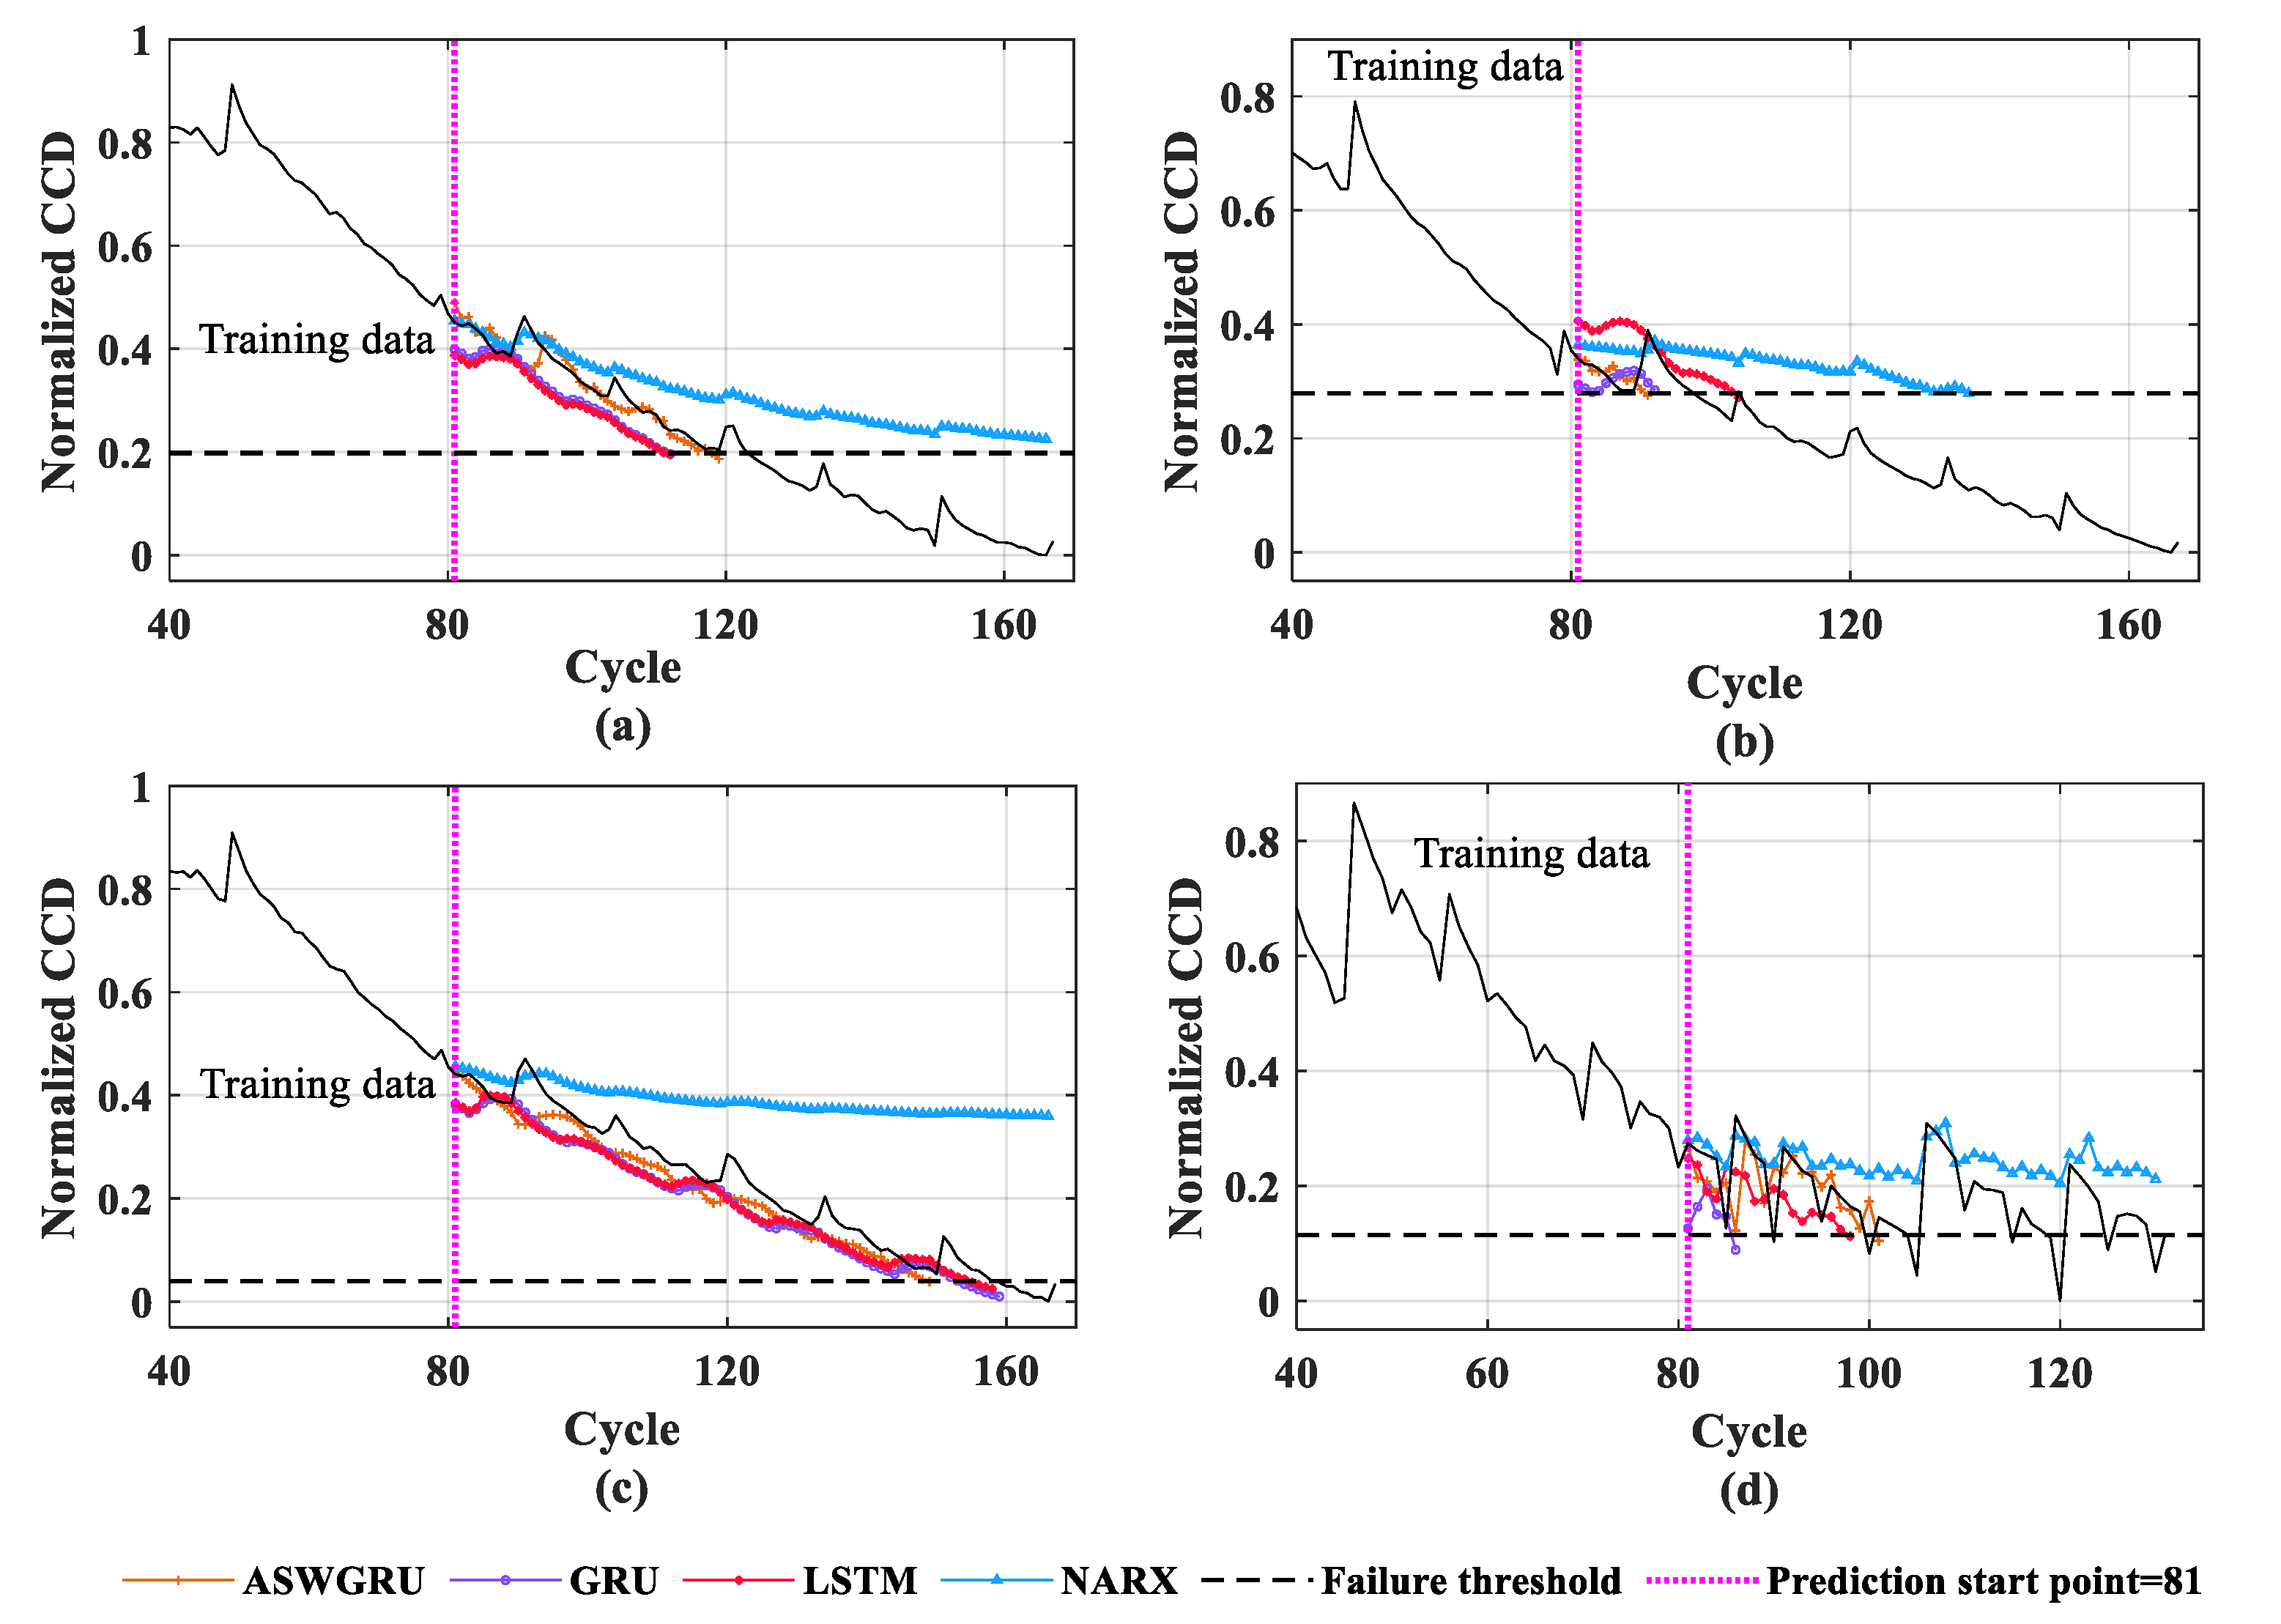
Further, we compare the results at the 81st prediction start point with some commonly used time series neuro network models including the GRU without an ASW [24], the standard LSTM [31] and the Nonlinear Auto-Regressive Network (NARX) [32]. The LSTM is one of the advanced RNN algorithms with a more complicated gate mechanism in its memory cells to learn the long-term dependent sequences. For comparison purposes, the parameters of the LSTM are chosen as the same as the ASWGRU and GRU. The NARX is the nonlinear extension of the linear auto-regressive with exogenous input (ARX) model, where the current output is described with a nonlinear functional expansion of lagged input and output signals, plus additive noise. The NARX model is often employed for time-series modeling. For the parameters of NARX, please refer to reference [33].
Figure 6 illustrates the RUL prediction results. It is evident that more accurate results can be yielded by employing the proposed ASWGRU models, which can better fit local recovery dynamics and precisely estimate the final failure point for the four batteries considered. In contrast, the other three non-windows approach only obtain a steady decline prediction for the overall trends and failed to estimate the local regeneration due to the lack of a capturing mechanism for the local dynamics. Moreover, the NARX performs the worst performance among all these methods, which cannot achieve an effective RUL prediction at the 81st prediction start point because of lacking the long-term memory capacity. Furthermore, compared with the traditional GRU, some better prediction results can be obtained by using LSTM. However, at the same time, the LSTM needs more training iterations, which is not conducive to practical applications. The similar conclusions can be drawn from the R-square between the estimated CCD and actual value and the AE of the predicted RUL for the four batteries collected in Table 3, Table 4, Table 5 and Table 6, where “-” denotes that the estimated value does not reach its failure threshold. As shown in Table 3, Table 4, Table 5 and Table 6, using the proposed arithmetic, the RUL of all the batteries can be accurately forecasted, with all the AE holding at the reasonable ranges, which verifies the effectiveness of the proposed method.
5. Conclusions
In this paper, we present a novel RUL prediction framework by incorporating the deep learning and soft sensing method, where the CCD is extracted from the monitoring data of the charge process to reflex the battery degradation performance and an adaptive sliding window based GRU NN is constructed to simultaneously learn the long-term dependencies and fit the local fluctuations of the battery degeneration with a low computation cost. The precise prediction result is verified via some meaningful comparison experiments using the test data from the NASA PCoE research center. In reality, the high frequency measurement noise and the characteristic variation of the loads are still the main challenges for battery RUL predictions. In the future, we will further validate the effectiveness and superiority of the designed prediction method using more practical measurement data and improve the performance of prediction arithmetic for dealing with the high frequency noises and load fluctuations.
Author Contributions
Methodology, Z.W.; Software, Z.W.; Validation, Z.W., Q.M.; Writing—original draft preparation, Z.W.; Writing—review and editing, Z.W.; Supervision, Y.G.; Project administration, Y.G. All authors have read and agreed to the published version of the manuscript.
Funding
This research has been supported in part by National Key Scientific Research Project (No. MJ-2016-S-42, MJ-2018-S-34), in part by Shaanxi Science and Technology Program (No. 2019PT-03), and in part by National Defense Basic Research Program, and Equipment Community Technology Pre-research Project.
Institutional Review Board Statement
Not applicable.
Informed Consent Statement
Not applicable.
Acknowledgments
The authors would like to thank the reviewers and the editor for their comments and suggestions that helped to improve the paper significantly. The authors declared that no conflict of interest exists in the submission of this manuscript, and the manuscript is approved by all authors for publication. I would like to declare on behalf of my co-authors that the work described was original research that has not been published previously, and not under consideration for publication elsewhere, in whole or in part. No conflict of interest exits in the submission of this manuscript, and manuscript is approved by all authors for publication.
Conflicts of Interest
The authors declare no conflict of interest.
References
- Bai, C.; Hu, C.H.; Si, X.H.; Li, H.P.; Zhang, Z.X.; Pei, H. Remaining useful life prediction method for degradation equipment with random shocks. Syst. Eng. Electron. 2018, 40, 2729–2735. [Google Scholar]
- Wang, D.; Miao, Q.; Pecht, M. Prognostics of lithium-ion batteries based on relevance vectors and a conditional three-parameter capacity degradation model. J. Power Sources 2013, 239, 253–264. [Google Scholar] [CrossRef]
- Lu, L.; Han, X.; Li, J.; Hua, J.; Ouyang, M. A review on the key issues for lithium-ion battery management in electric vehicles. J. Power Sources 2013, 226, 272–288. [Google Scholar] [CrossRef]
- Hao, J.; Jing, L.; Ke, H.L.; Wang, Y.; Gao, Q.; Wang, X.X.; Sun, Q.; Xu, Z.J. Determination of cut-off time of accelerated aging test under temperature stress for LED lamps. Front. Inf. Technol. Electron. Eng. 2017, 18, 1197–1205. [Google Scholar] [CrossRef]
- Zhang, Y.; Xiong, R.; He, H.; Pecht, M.G. Lithium-ion battery remaining useful life prediction with Box-Cox transformation and Monte Carlo simulation. IEEE Trans. Ind. Electron. 2019, 66, 1585–1597. [Google Scholar] [CrossRef]
- Cugnet, M.; Sabatier, J.; Laruelle, S.; Grugeon, S.; Sahut, B.; Oustaloup, A.; Tarascon, J.M. On lead-acid-battery resistance and cranking capability estimation. IEEE Trans. Ind. Electron. 2010, 57, 909–917. [Google Scholar] [CrossRef]
- Zou, Y.; Hu, X.; Ma, H.; Li, S.E. Combined state of charge and state of health estimation over lithium-ion battery cell cycle lifespan for electric vehicles. J. Power Sources 2015, 273, 793–803. [Google Scholar] [CrossRef]
- Lipu, M.H.; Hannan, M.A.; Hussain, A.; Hoque, M.M.; Ker, P.J.; Saad, M.M.; Ayob, A. A review of state of health and remaining useful life estimation methods for lithium-ion battery in electric vehicles: Challenges and recommendations. J. Clean. Prod. 2018, 205, 115–133. [Google Scholar] [CrossRef]
- Gomez, J.; Nelson, R.; Kalu, E.E.; Weatherspoon, M.H.; Zheng, J.P. Equivalent circuit model parameters of a high-power Li-ion battery: Thermal and state of charge effects. J. Power Sources 2011, 196, 4826–4831. [Google Scholar] [CrossRef]
- Wei, J.; Dong, G.; Chen, Z. Remaining useful life prediction and state of health diagnosis for lithium-ion batteries using particle filter and support vector regression. IEEE Trans. Ind. Electron. 2018, 65, 5634–5643. [Google Scholar] [CrossRef]
- Sun, Y.; Jou, H.L.; Wu, J. Aging estimation method for lead-acid battery. IEEE Trans. Energy Convers. 2011, 26, 264–271. [Google Scholar] [CrossRef]
- Song, Y.; Liu, D.T.; Hou, Y.D.; Yu, J.; Peng, Y. Satellite lithium-ion battery remaining useful life estimation with an iterative updated RVM fused with the KF algorithm. Chin. J. Aeronaut. 2018, 31, 32–39. [Google Scholar] [CrossRef]
- Liu, D.; Zhou, J.; Liao, H.; Peng, Y.; Peng, X. A health indicator extraction and optimization framework for lithium-ion battery degradation modeling and prognostics. IEEE Trans. Syst. Man Cybern.-Syst. 2015, 45, 915–928. [Google Scholar]
- Widodo, A.; Shim, M.C.; Caesarendra, W.; Yang, B.S. Intelligent prognostics for battery health monitoring based on sample entropy. Expert Syst. Appl. 2011, 38, 11763–11769. [Google Scholar] [CrossRef]
- Chen, L.; Chen, J.; Wang, H.; Wang, Y.; An, J.; Yang, R.; Pan, H. Remaining useful life prediction of battery using a novel indicator and framework with fractional grey model and unscented particle filter. IEEE Trans. Power Electron. 2020, 35, 5850–5859. [Google Scholar] [CrossRef]
- Wu, J.; Zhang, C.; Chen, Z. An online method for lithium-ion battery remaining useful life estimation using importance sampling and neural networks. Appl. Energy 2016, 173, 134–140. [Google Scholar] [CrossRef]
- Patil, M.A.; Tagade, P.; Hariharan, K.S.; Kolake, S.M.; Song, T.; Yeo, T.; Doo, S. A novel multistage Support Vector Machine based approach for Li ion battery remaining useful life estimation. Appl. Energy 2015, 159, 285–297. [Google Scholar] [CrossRef]
- Zhang, Y.; Xiong, R.; He, H.; Pecht, M.G. Long short-term memory recurrent neural network for remaining useful life prediction of lithium-ion batteries. IEEE Trans. Veh. Technol. 2018, 67, 5695–5705. [Google Scholar] [CrossRef]
- Hussein, A.A. Capacity fade estimation in electric vehicle li-ion batteries using artificial neural networks. IEEE Trans. Ind. Appl. 2015, 51, 2321–2330. [Google Scholar] [CrossRef]
- ElSaid, A.; El Jamiy, F.; Higgins, J.; Wild, B.; Desell, T. Optimizing long short-term memory recurrent neural networks using ant colony optimization to predict turbine engine vibration. Appl. Soft Comput. 2018, 73, 969–991. [Google Scholar] [CrossRef] [Green Version]
- Liu, D.; Xie, W.; Liao, H.; Peng, Y. An integrated probabilistic approach to lithium-ion battery remaining useful life estimation. IEEE Trans. Instrum. Meas. 2015, 64, 660–670. [Google Scholar]
- Guo, L.; Li, N.; Jia, F.; Lei, Y.; Lin, J. A recurrent neural network based health indicator for remaining useful life prediction of bearings. Neurocomputing 2017, 240, 98–109. [Google Scholar] [CrossRef]
- Li, X.Y.; Zhang, L.; Wang, Z. Remaining useful life prediction for lithium-ion batteries based on a hybrid model combining the long short-term memory and Elman neural networks. J. Energy Storage 2019, 21, 510–518. [Google Scholar] [CrossRef]
- Cho, K.; van Merriënboer, B.; Gulcehre, C.; Schwenk FB, H.; Bengio, Y. Learning phrase representations using RNN encoder-decoder for statistical machine translation. In Proceedings of the 2014 Conference on Empirical Methods in Natural Language Processing (EMNLP), Doha, Qatar, 25–29 October 2014; pp. 1724–1734. [Google Scholar]
- He, Y.J.; Shen, J.N.; Shen, J.F.; Ma, Z.F. State of health estimation of lithium-ion batteries: A multiscale Gaussian process regression modeling approach. AIChE J. 2015, 61, 1589–1600. [Google Scholar] [CrossRef]
- Zhang, Z.X.; Si, X.S.; Hu, C.H.; Pecht, M.G. A prognostic model for stochastic degrading systems with state recovery: Application to li-ion batteries. IEEE Trans. Reliab. 2017, 66, 1293–1308. [Google Scholar] [CrossRef]
- Saha, B.; Goebel, K. Battery Data Set: NASA Ames Prognostics Data Repository; NASA Ames: Moffett Field, CA, USA, 2007. Available online: https://ti.arc.nasa.gov/tech/dash/groups/pcoe/prognostic-data-repository/ (accessed on 25 August 2021).
- Kadlec, P.; Gabrys, B.; Strandt, S. Data-driven soft sensors in the process industry. Comput. Chem. Eng. 2009, 33, 795–814. [Google Scholar] [CrossRef] [Green Version]
- Yu, J.B. State of health prediction of lithium-ion batteries: Multiscale logic regression and gaussian process regression ensemble. Reliab. Eng. Syst. Saf. 2018, 174, 82–95. [Google Scholar] [CrossRef]
- Gibert, K.; Sevilla-Villanueva, B.; Sànchez-Marrè, M. The role of significance tests in consistent interpretation of nested partitions. J. Comput. Appl. Math. 2016, 292, 623–663. [Google Scholar] [CrossRef]
- Zheng, S.; Kosta, R.; Ahmed, F.; Chetan, G. Long short-term memory network for remaining useful life estimation. In Proceedings of the 2017 IEEE International Conference on Prognostics and Health Management (ICPHM), Dallas, TX, USA, 19–21 June 2017; IEEE: Piscataway, NJ, USA, 2017; pp. 88–95. [Google Scholar]
- Diaconescu, E. The Use of NARX Neural Networks to Predict Chaotic Time Series; World Scientific and Engineering Academy and Society (WSEAS): Dallas, TX, USA, 2008; pp. 182–191. [Google Scholar]
- Pang, X.Q.; Wang, Z.Q.; Zeng, J.C.; Jia, J.F.; Shi, Y.H.; Wen, J. Prediction for the Remaining Useful Life of Lithium-ion Battery Based on PCA-NARX. Trans. Beijing Inst. Technol. 2019, 39, 406–412. [Google Scholar]
Figure 1.
The charge voltage and current curves for different cycles: (a) The charge voltage curves, (b) The charge current curves.
Figure 1.
The charge voltage and current curves for different cycles: (a) The charge voltage curves, (b) The charge current curves.

Figure 2.
The charge voltage and current curves at cycle 40.

Figure 3.
The RUL prediction model.

Figure 4.
The architecture of proposed ASWGRU.

Figure 5.
The prediction result of CCD with different prediction starting point for batteries: (a) B5, (b) B6, (c) B7, (d) B18.
Figure 5.
The prediction result of CCD with different prediction starting point for batteries: (a) B5, (b) B6, (c) B7, (d) B18.

Figure 6.
The prediction result of CCD using the considered three prediction modes for batteries: (a) B5, (b) B6, (c) B7, (d) B18.
Figure 6.
The prediction result of CCD using the considered three prediction modes for batteries: (a) B5, (b) B6, (c) B7, (d) B18.


Table 1.
Parameter setups of battery #5, #6, #7 and #18.
| Battery | AT (24 °C) | CC (A) | DC (A) | EOC (V) | EOLC (%) |
|---|---|---|---|---|---|
| B5 | 24 | 1.5 | 2 | 2.7 | 30 |
| B6 | 24 | 1.5 | 2 | 2.5 | 30 |
| B7 | 24 | 1.5 | 2 | 2.2 | 30 |
| B18 | 24 | 1.5 | 2 | 2.5 | 30 |
Table 2.
The correlation analysis and the failure thresholds calculation.
| Battery | H | Actual Life (Cycles) | |||
|---|---|---|---|---|---|
| B5 | 0.990 **a | 0 | 124 | 1.4 | 0.198 |
| B6 | 0.992 ** | 0 | 101 | 1.4 | 0.279 |
| B7 | 0.989 ** | 0 | 158 | 1.42 | 0.040 |
| B18 | 0.962 ** | 0 | 93 | 1.4 | 0.115 |
a** expresses that it is a significant correlation when the confidence level (bilateral) is 0.01.
Table 3.
The obtained results with different prediction start points for B5.
| Battery | Methods | Starting Point | R-Square | Real RUL | Predicted RUL | RUL AE |
|---|---|---|---|---|---|---|
| B5 | ASWGRU | 61 | 0.755 | 64 | 59 | 5 |
| 71 | 0.945 | 54 | 51 | 3 | ||
| 81 | 0.944 | 44 | 40 | 4 | ||
| 91 | 0.929 | 34 | 29 | 5 | ||
| GRU | 81 | 0.971 | 44 | 31 | 13 | |
| LSTM | 0.967 | 31 | 13 | |||
| NARX | 0.085 | — | — |
Table 4.
The obtained results with different prediction start points for B6.
| Battery | Methods | Starting Point | R-Square | Real RUL | Predicted RUL | RUL AE |
|---|---|---|---|---|---|---|
| B6 | ASWGRU | 61 | 0.914 | 41 | 31 | 10 |
| 71 | 0.914 | 31 | 20 | 11 | ||
| 81 | 0.890 | 21 | 10 | 11 | ||
| 91 | 0.852 | 11 | 11 | 0 | ||
| GRU | 81 | 0.923 | 21 | 12 | 9 | |
| LSTM | 0.925 | 24 | 3 | |||
| NARX | −0.797 | 57 | 36 |
Table 5.
The obtained results with different prediction start points for B7.
| Battery | Methods | Starting Point | R-Square | Real RUL | Predicted RUL | RUL AE |
|---|---|---|---|---|---|---|
| B7 | ASWGRU | 61 | 0.960 | 98 | 100 | 2 |
| 71 | 0.966 | 88 | 91 | 3 | ||
| 81 | 0.944 | 78 | 71 | 7 | ||
| 91 | 0.928 | 68 | 69 | 1 | ||
| GRU | 81 | 0.961 | 78 | 73 | 5 | |
| LSTM | 0.959 | 75 | 3 | |||
| NARX | −1.303 | — | — |
Table 6.
The obtained results with different prediction start points for B18.
| Battery | Methods | Starting Point | R-Square | Real RUL | Predicted RUL | RUL AE |
|---|---|---|---|---|---|---|
| B18 | ASWGRU | 61 | 0.414 | 33 | 24 | 9 |
| 71 | 0.375 | 23 | 30 | 7 | ||
| 81 | 0.245 | 13 | 20 | 7 | ||
| 91 | 0.203 | 3 | 11 | 8 | ||
| GRU | 81 | 0.019 | 13 | 5 | 8 | |
| LSTM | 0.295 | 18 | 5 | |||
| NARX | −0.575 | — | — |
Publisher’s Note: MDPI stays neutral with regard to jurisdictional claims in published maps and institutional affiliations. |
© 2021 by the authors. Licensee MDPI, Basel, Switzerland. This article is an open access article distributed under the terms and conditions of the Creative Commons Attribution (CC BY) license (https://creativecommons.org/licenses/by/4.0/).
Share and Cite
MDPI and ACS Style
Wang, Z.; Ma, Q.; Guo, Y. Remaining Useful Life Prediction of Lithium-Ion Batteries Based on Deep Learning and Soft Sensing. Actuators 2021, 10, 234. https://0-doi-org.brum.beds.ac.uk/10.3390/act10090234
AMA Style
Wang Z, Ma Q, Guo Y. Remaining Useful Life Prediction of Lithium-Ion Batteries Based on Deep Learning and Soft Sensing. Actuators. 2021; 10(9):234. https://0-doi-org.brum.beds.ac.uk/10.3390/act10090234
Chicago/Turabian StyleWang, Zhuqing, Qiqi Ma, and Yangming Guo. 2021. "Remaining Useful Life Prediction of Lithium-Ion Batteries Based on Deep Learning and Soft Sensing" Actuators 10, no. 9: 234. https://0-doi-org.brum.beds.ac.uk/10.3390/act10090234
Note that from the first issue of 2016, this journal uses article numbers instead of page numbers. See further details here.