Article

A Multidimensional Elastic–Plastic Calculation Model of the Frame Structure with Magnetorheological Damper

1
School of Mechanics and Safety Engineering, Zhengzhou University, Zhengzhou 450001, China
2
College of Mechanical and Electronic Engineering, Nanjing Forestry University, Nanjing 210037, China
3
China Construction Fifth Engineering Bureau Co., Ltd., Changsha 410004, China
*
Author to whom correspondence should be addressed.
Submission received: 25 October 2022 / Revised: 26 November 2022 / Accepted: 1 December 2022 / Published: 3 December 2022
(This article belongs to the Special Issue Vibration Control and Structure Health Monitoring)

Abstract

:
To analyze the multidimensional elastic–plastic response of the frame structure with magnetorheological (MR) dampers under strong seismic excitations, the test of the MRD was performed, the location matrix of the MRD in the frame structure was derived, and the multidimensional elastic–plastic calculation models of the frame structure with and without an MRD were established based on the three-segment variable stiffness beam. Taking a five-story reinforced concrete (RC) frame structure as an example, the multidimensional elastic–plastic calculation models were developed by MATLAB software and the dynamic time history analyses were performed under strong seismic excitations. The results show that under the seismic wave, after the MRD is installed in the structure, the maximum horizontal displacements of the top-story node of the structure in X and Y directions is reduced by 51.87% and 39.59%, respectively, and the maximum horizontal accelerations are reduced by 36.67% and 47.86%. The maximum displacements and the story drift ratios of each story of the structure are significantly reduced, and the reduction in the maximum accelerations of each story is small relatively. In the frame structure without an MRD, plastic hinges appear at the ends of most columns, and the structure is characterized by a column hinge yield mechanism. The maximum residual displacement angles of the column end in X and Y directions which reach 1.628 × 10⁻³ rad and 2.101 × 10⁻³ rad, respectively. After setting the MRD, the number of plastic hinges in X and Y directions at the column end are both reduced by 37.5%, and the residual displacement angle at some column ends are reduced to 0. The results show that the complied calculation model programs of the frame structure can effectively simulate the multi-dimensional seismic response of the structure with and without MRD.

1. Introduction

A magnetorheological damper (MRD), as a kind of damping control device with an adjustable damping force, has the advantages of a simple structure, large output, continuously adjustable damping force, and a good control effect [1,2,3], so it can effectively improve the seismic performance of the structure [4]. As one of the important factors affecting the effect of the structural vibration control [5], the mechanical properties of the MRD should be fully studied by the experiments [6,7].
Over the past twenty years, the variation in the mechanical properties of the MR damper with the current, velocity, displacement amplitude, and the frequency has been comprehensively studied. Xu et al. [8] designed and manufactured a five-stage coil shear valve mode MRD, whose damping force and energy dissipation effect increased significantly with the increase in the current, and the maximum output could reach 260 kN. Zemp et al. [9] designed and manufactured a long-axis MRD with a working course of up to 1 m, and conducted corresponding mechanical property tests, with a maximum output of up to 280 kN. Zhang et al. [10] designed and manufactured a five-stage coil shear valve MRD with an output up to 478 kN and conducted tests on its mechanical properties. Jiang et al. [11] designed a novel MRD with selectable performance parameters to improve the environmental adaptability of the vibration systems equipped with such a damper and to provide a new idea for the design of an MRD.
For the field of the vibration control of the engineering structure, using an MRD to control the structure is one of the important contents. Raju et al. [12] proved that the scissors jack-MR damper can effectively reduce the displacement response of the steel frame bending moment frame model’s structure and improve the seismic performance of the structure. Cruze et al. [13] proved that an MRD can reduce the seismic response of reinforced concrete (RC) frame structures under moderate and strong earthquakes. Rakshita et al. [14] conducted a hybrid simulation analysis of the seismic response in a single-story frame with MRDs by using the OpenSees software, and the test results show that the MRD can effectively control the displacement and acceleration response of the frame structures. Chae et al. [15] conducted a real-time hybrid simulation test on the three-story steel frame structure with MRDs and confirmed that the MRD can better control the displacement and acceleration response of the frame structure. Aggumus et al. [16] investigated the effect of the MRD on reducing the vibration amplitude of structures though a test; the results show that the MRD can effectively reduce the vibration of a six-story steel structure, and the MRD arrangement in which the one end is connected to the ground can reduce the vibration amplitudes. The experimental research on the structure with MRD can truly reflect the damping effect of the structure, with accurate results and a high reliability, but the experimental research cycle is long, the cost is high, and the test conditions are limited.
Establishing the calculation model of building structures with MRD and carrying out a numerical simulation is an economical and effective means to study its seismic performance. At present, the RC building structure with an MRD is mainly simplified into an elastic story model [17,18], elastic–plastic story model [19], and plane elastic–plastic beam–column element model [20]. The layer model and plane model can reflect the impact of the MRD on the seismic performance of the structure to a certain extent, and the calculation efficiency is high, but the layer model and plane model cannot reflect the multi-dimensional seismic performance of a spatial structure. Hence, Zhao et al. [21] established the spatial elastic beam system model of the RC frame’s structure with an MRD by using the MATLAB programming method, and studied the multi-dimensional damping control effect of the MRD on the structure, but the model did not consider the stiffness degradation caused by structural damage under a strong earthquake. Xu et al. [22] simplified the RC frame with an MRD as a spatial elastic–plastic beam system model, but the model ignored the influence of the slab, and the research results were not closely related to the elastic–plastic response of the structure. Xu et al. [23,24] analyzed the seismic performance of the nonlinear steel frame structure with an MRD by using LS-DYNA software. In the aspect of multi-dimensional vibration reduction [25,26,27] and the establishment of the dampers’ calculation model [28,29,30], many scholars have done relevant research in recent years, but not many have conducted research related to the MRD. Recently, You et al. [31] established the model of an L-shaped frame structure with MRDs, and studied its multi-dimensional seismic performance and torsional vibration characteristics, but they did not study the effect of the MRD on the hysteretic behavior and yield mechanism of the structures under seismic excitation. To sum up, although many innovative simulation studies have been carried out on the seismic response of frame structures with an MRD, there are still few studies on the multi-dimensional elastic–plastic calculation model and the multi-dimensional elastic–plastic seismic performance of an RC frame structures with an MRD; especially, the influence of the MRD on the cracking, yield, hysteretic behavior, and structural yield mechanism of concrete beams and columns in spatial structures is not completely clear.
In this paper, the position matrix of the MRD was derived at first. Then, a multi-dimensional elastic–plastic calculation model of the MRDs frame structure was established based on the three-fold linear stiffness retrograde model. Finally, a multi-dimensional elastic–plastic model program of a five-story RC frame with an MRD was developed using MATLAB software, and the dynamic time history analysis was carried out under a strong earthquake. The purposes of the study are summarized as (1) to provide a numerical analysis method for the multi-dimensional elastoplastic dynamic time history analysis of the MRD frame structure; (2) to study the multi-dimensional elastic–plastic seismic performance and the damping effect of the MRD frame structure; and (3) to study the effects of the MRD on the cracking, yield, hysteretic behavior of the beam and column members, and the structural yield mechanism.

2. Elastic–Plastic Calculation Model of the RC Frame Structure

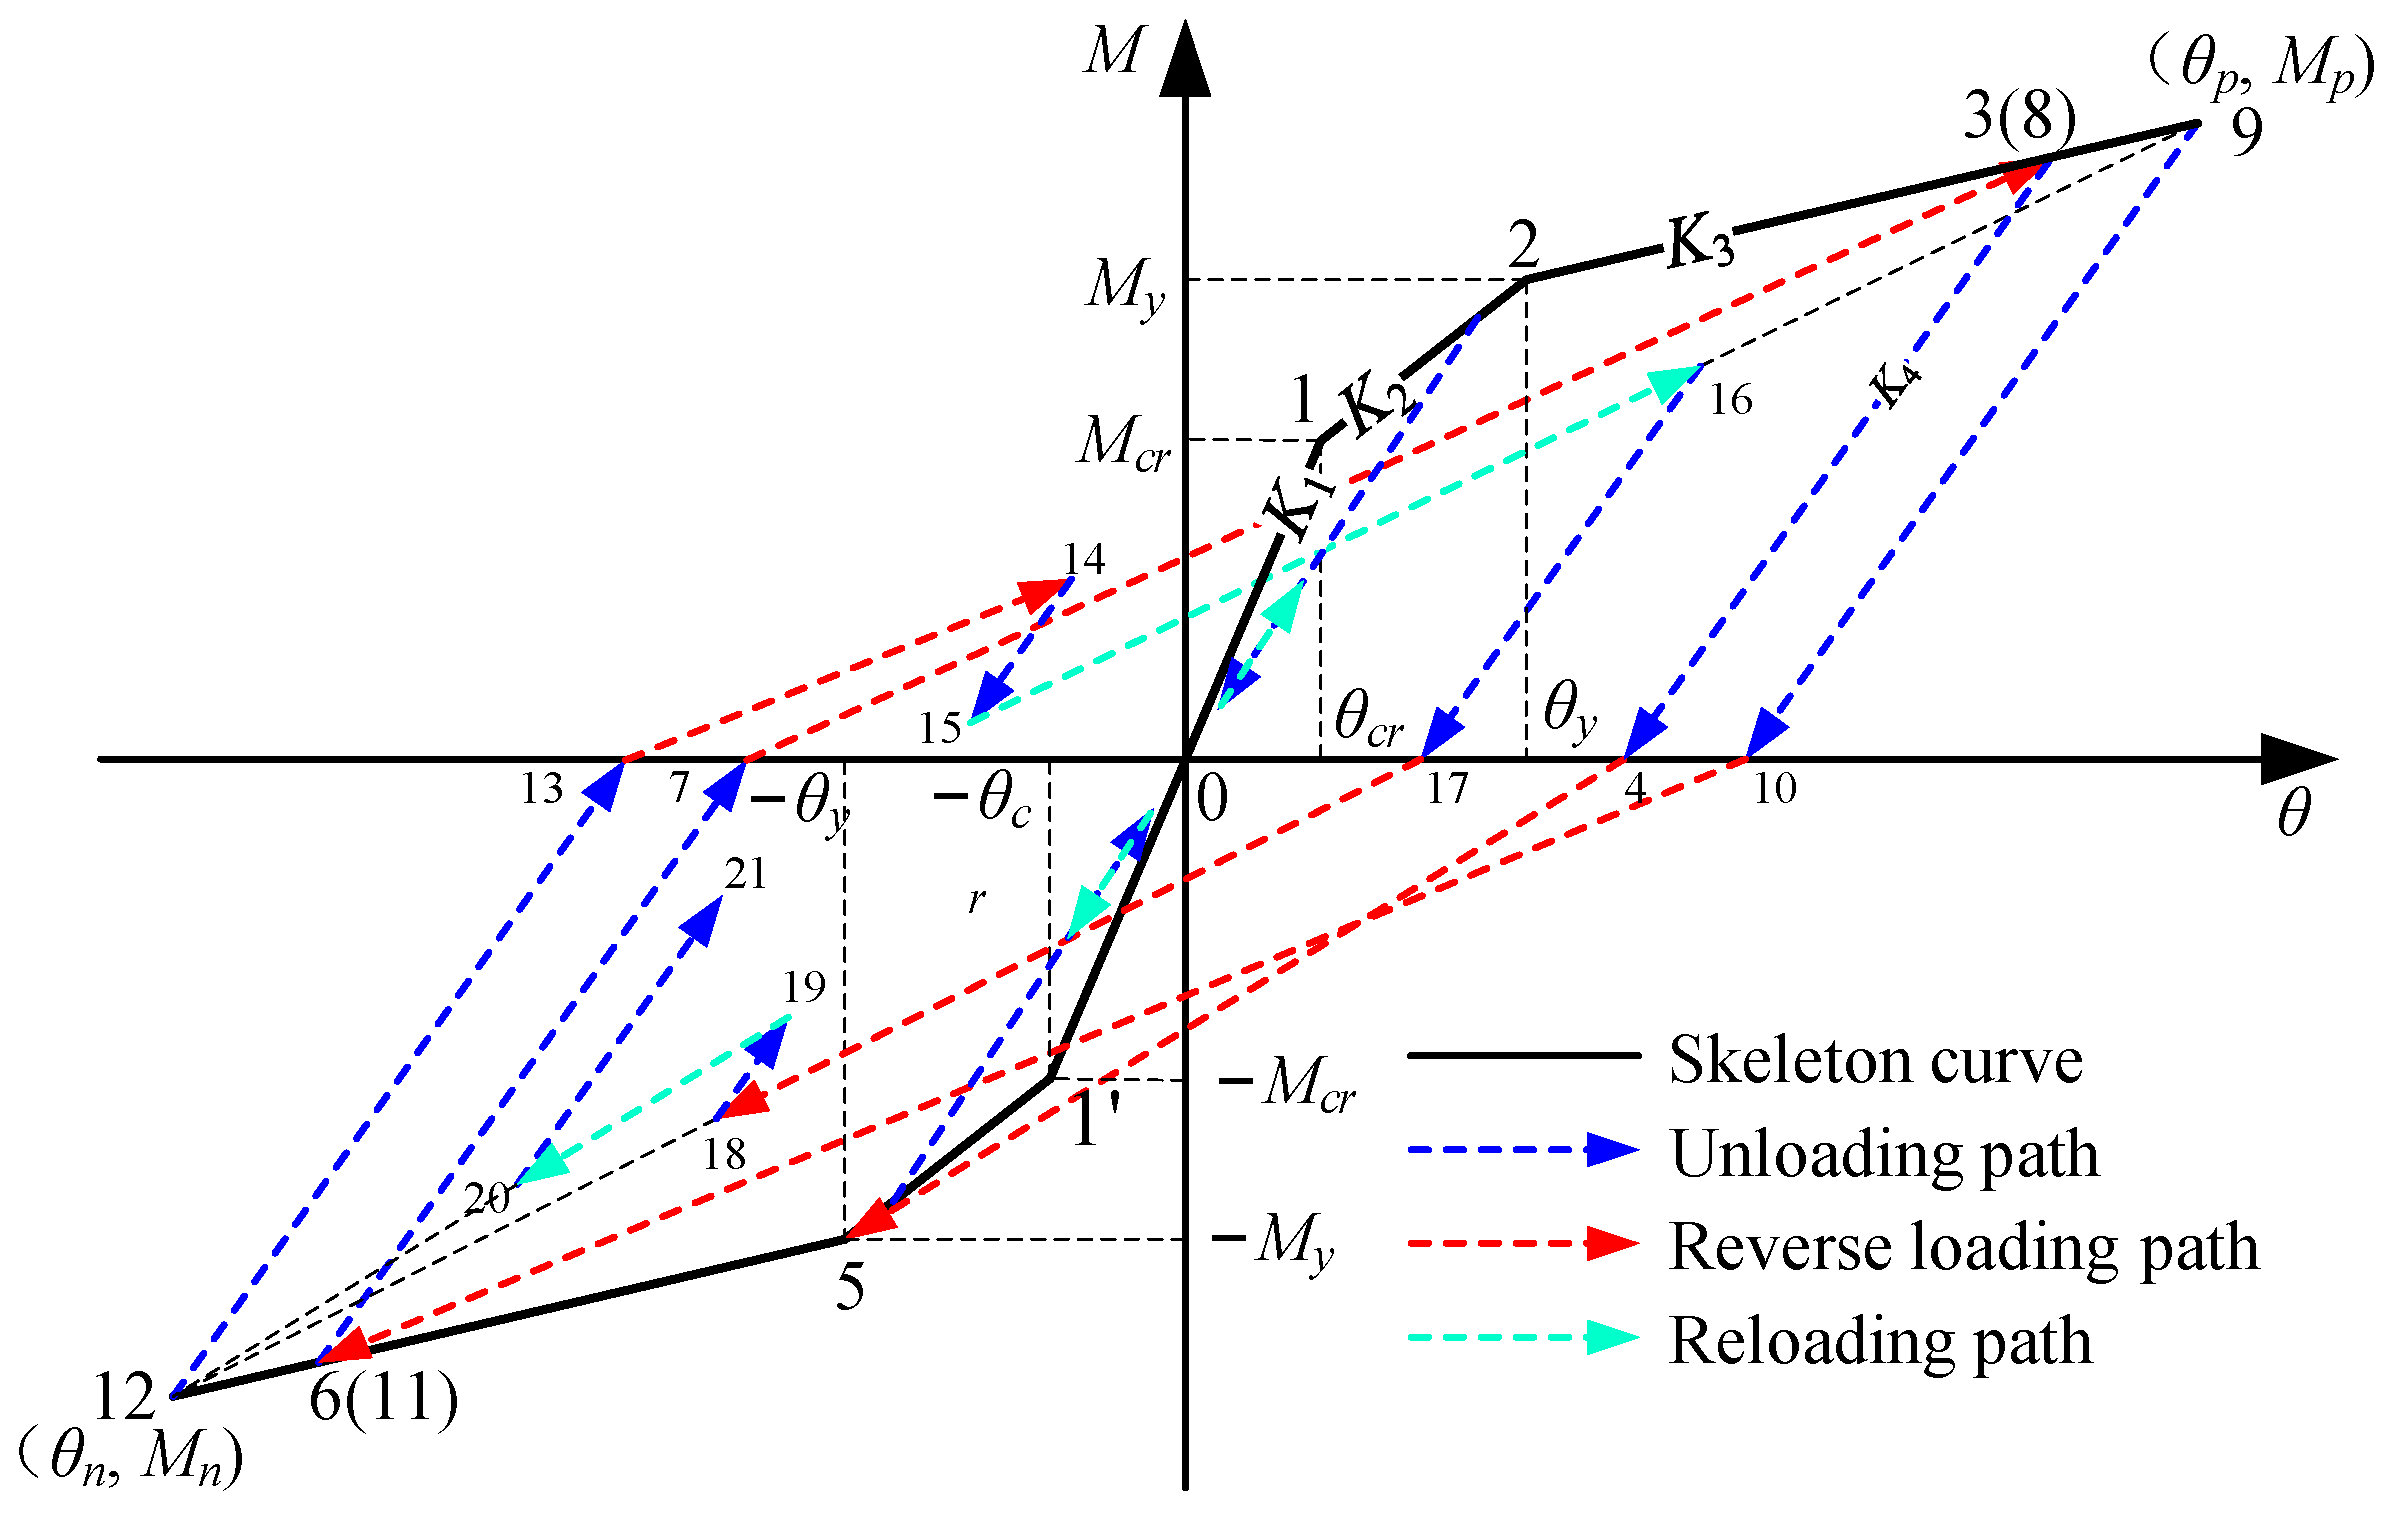
2.1. Three-Fold Line Model Considering Stiffness Degradation

For RC building structures, the three-fold linear stiffness degradation model can reflect the stress process of RC beam and column members [32]. The model considers that: (1) when reloading after the previous cycle, the reduction in the stiffness is related to the loading history, and the loading path points to the maximum deformation point of all the previous cycles; (2) the unloading stiffness after the yielding is equal to the secant stiffness at the yield point. Therefore, the three-fold linear stiffness degradation model is selected as the restoring force model of the elastic–plastic region of the beam in this paper, as shown in Figure 1.
The model shown in Figure 1 consists of a skeleton curve and hysteretic path. The skeleton curve is divided into the elastic segment, elastic–plastic segment, and plastic segment. The hysteretic path of each segment is as follows:
(1)
Hysteresis path of elastic segment
Segments 0→1 and 0→1’ are the elastic segment of the skeleton curve, and the initial stiffness is K1. Point 0 is the starting point, and points 1 and 1’ are the cracking points. For the elastic stage, the maximum deformation point of all the previous cycles does not exceed the cracking point; the loading and unloading path will go straight up or down with the initial stiffness K1.
(2)
Hysteresis path of elastic–plastic segment
Segments 1→2 and 1’→5 are the elastic–plastic segment of the skeleton curve, and the stiffness is K2. Points 2 and 5 are the yield points. For the elastic–plastic stage, the maximum deformation point of all the previous cycles does not exceed the yield point and is not lower than the cracking point; the loading path will go straight up with the stiffness K2 to the yielding point, and the unloading path will go straight down to the initial point 0. After the unloading path crosses the initial point 0, the model enters the reverse loading phase, and the reverse loading path points to the maximum deformation point of all the previous cycles. If reloading occurs before the unloading path reaches the initial point 0, the reloading path will follow the unloading path.
(3)
Hysteresis path of plastic segment
Segments 2→3 and 5→6 are the plastic sections of the skeleton curve, and the stiffness is K3. For the plastic stage, the maximum deformation point of all the previous cycles is not lower than the yield point, the loading path will go straight up with stiffness K3, and for the unloading path, for example, the 3→4 segment or 6→7 segment, will go straight down with the secant stiffness K4 at the yield point. After the unloading path crosses the residual deformation point (such as points 4 and 7), the model enters the reverse loading phase, and the reverse loading path points to the maximum deformation point of all previous cycles, such as 4→5 segment or 7→8 segment. If reloading occurs before the unloading path reaches the residual deformation point, the reloading path will point to the maximum deformation point of all previous cycles, such as the 15→16 segment or 19→20 segment.
The cracking moment Mcr, the angular displacement corresponding to the cracking moment θcr, the yield moment My, the angular displacement corresponding to the yield moment θy, and the yield point cut stiffness reduction coefficient αy of each RC beam and column are determined by the Chinese code for design of concrete structures (GB50010-2010) and the structural reinforcement diagram.

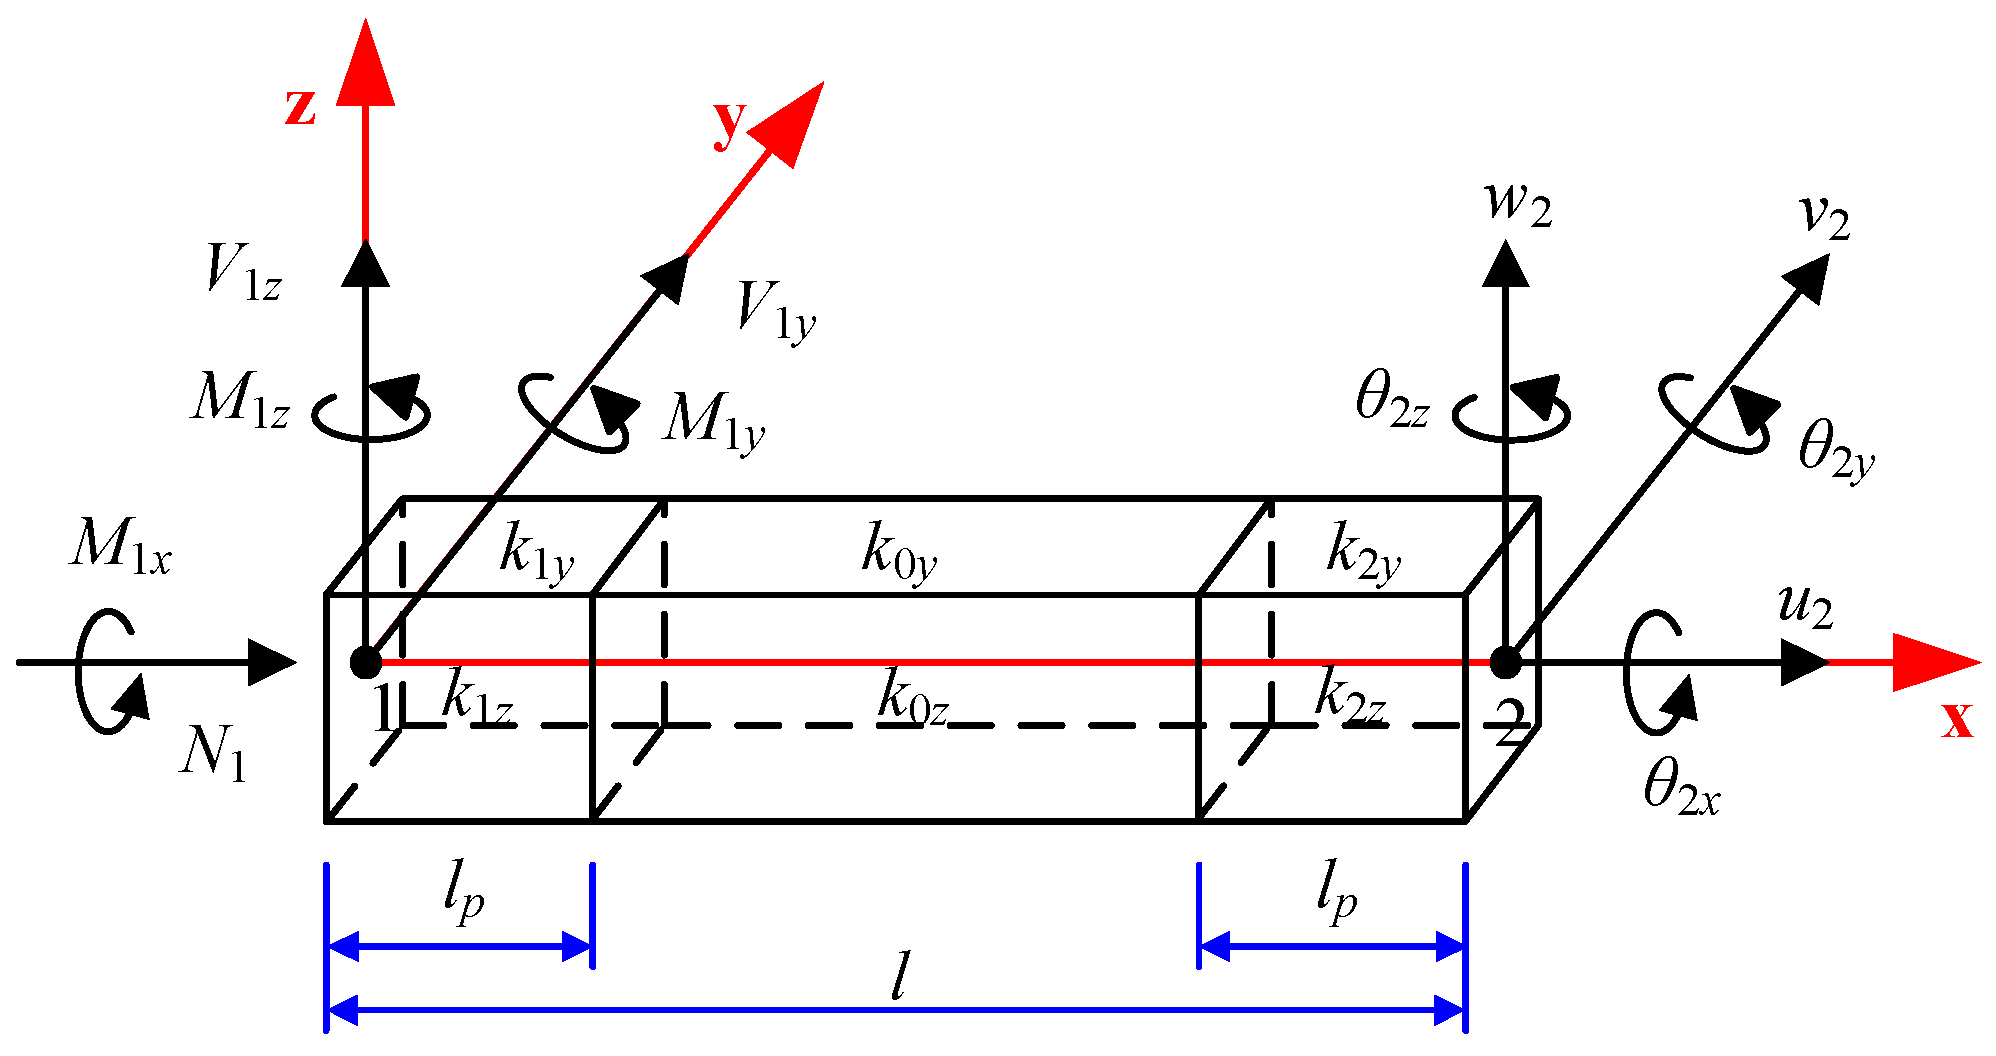
2.2. Elastic–Plastic Stiffness Matrix of the Variable Stiffness Space Beam Element

The three-segment variable stiffness beam element consists of two types of regions: the linear elastic region in the middle and the fixed length elastic–plastic region at both ends, as shown in Figure 2. Assuming that the RC beam and column is a straight member with an equal section, the section deformation of the member meets the plane section assumption, the member only has a bending failure, and the plastic hinge only appears in the elastic–plastic area at both ends, ignoring the influence of the shear deformation of the member. The length lp of the elastic–plastic at both ends of the member can be given as follows [33]:
l p = 0.014 d b f y + 0.12 l
where db is the diameter of the tensile longitudinal reinforcement, fy is the yield strength of the reinforcement, and l is the length of the member.
The elastic–plastic stiffness matrix of the space beam element is given as follows [34]:
k e = [ k 1 0 0 0 0 0 k 1 0 0 0 0 0 0 k 2 0 0 0 k 4 0 k 2 0 0 0 k 6 0 0 k 3 0 k 5 0 0 0 k 3 0 k 7 0 0 0 0 k 14 0 0 0 0 0 k 14 0 0 0 0 k 5 0 k 8 0 0 0 k 5 0 k 10 0 0 k 4 0 0 0 k 9 0 k 4 0 0 0 k 11 k 1 0 0 0 0 0 k 1 0 0 0 0 0 0 k 2 0 0 0 k 4 0 k 2 0 0 0 k 6 0 0 k 3 0 k 5 0 0 0 k 3 0 k 7 0 0 0 0 k 14 0 0 0 0 0 k 14 0 0 0 0 k 7 0 k 10 0 0 0 k 7 0 k 12 0 0 k 6 0 0 0 k 11 0 k 6 0 0 0 k 13 ]
The elements within the elastic–plastic stiffness matrix are shown below:
k 1 = E A l , k 2 = 2 ( a 1 z + a 2 z + b 1 z ) b 2 z l 2 , k 3 = 2 ( a 1 y + a 2 y + b 1 y ) b 2 y l 2 , k 4 = ( 2 a 2 z + b 1 z ) b 2 z l 2 , k 5 = ( 2 a 2 y + b 1 y ) b 2 y l 2 , k 6 = ( 2 a 1 z + b 1 z ) b 2 z l 2 , k 7 = ( 2 a 1 y + b 1 y ) b 2 y l 2 , k 8 = 2 a 2 y b 2 y , k 9 = 2 a 2 z b 2 z k 10 = b 1 y b 2 y , k 11 = b 1 z b 2 z , k 12 = 2 a 1 y b 2 y , k 13 = 2 a 1 z b 2 z , k 14 = G J l
in which:
a 1 z = p 2 z q 3 p 1 z ( 1 q ) 3 + p 1 z + 1 , a 2 z = p 1 z q 3 p 2 z ( 1 q ) 3 + p 2 z + 1 a 1 y = p 2 y q 3 p 1 y ( 1 q ) 3 + p 1 y + 1 , a 2 y = p 1 y q 3 p 2 y ( 1 q ) 3 + p 2 y + 1 b 1 z = ( p 2 z + p 1 z ) q 2 ( 3 2 q ) + 1 , b 2 z = 6 k 0 z 4 a 1 z a 2 z l b 1 z 2 l , b 1 y = ( p 2 y + p 1 y ) q 2 ( 3 2 q ) + 1 , b 2 y = 6 k 0 y 4 a 1 y a 2 y l b 1 y 2 l , p 1 z = k 0 z k 1 z 1 , p 2 z = k 0 z k 2 z 1 , p 1 y = k 0 y k 1 y 1 , p 2 y = k 0 y k 2 y 1 , q = l p l
E is the elastic modulus of the concrete, A is the cross-sectional area of the beam and column member, G is the shear modulus, J is the torsional inertia moment, and kiz and kiy (i = 0, 1, 2) are the cross-sectional bending stiffness in Figure 1, as determined by the M-θ relation in Figure 1. There are six force components and six displacement vectors at each end of the beam and column member, including three axial forces (N, Vy, and Vz) along the x-axis, y-axis, and z-axis directions and three bending moments (Mx, My, and Mz) around x-axis, y-axis, and z-axis directions. The displacement vector consists of three axial displacements (u, v, and w) along the x, y, and z axes and three angular displacements (θx, θy, and θz) around the x, y, and z axes, as seen in Figure 2.
The mass matrix of the beam and column member and the spatial shell element used in the RC frame’s structure are consistent with the literature [21] and will not be repeated here.

3. Differential Equation of Motion of the RC Structure with MRD

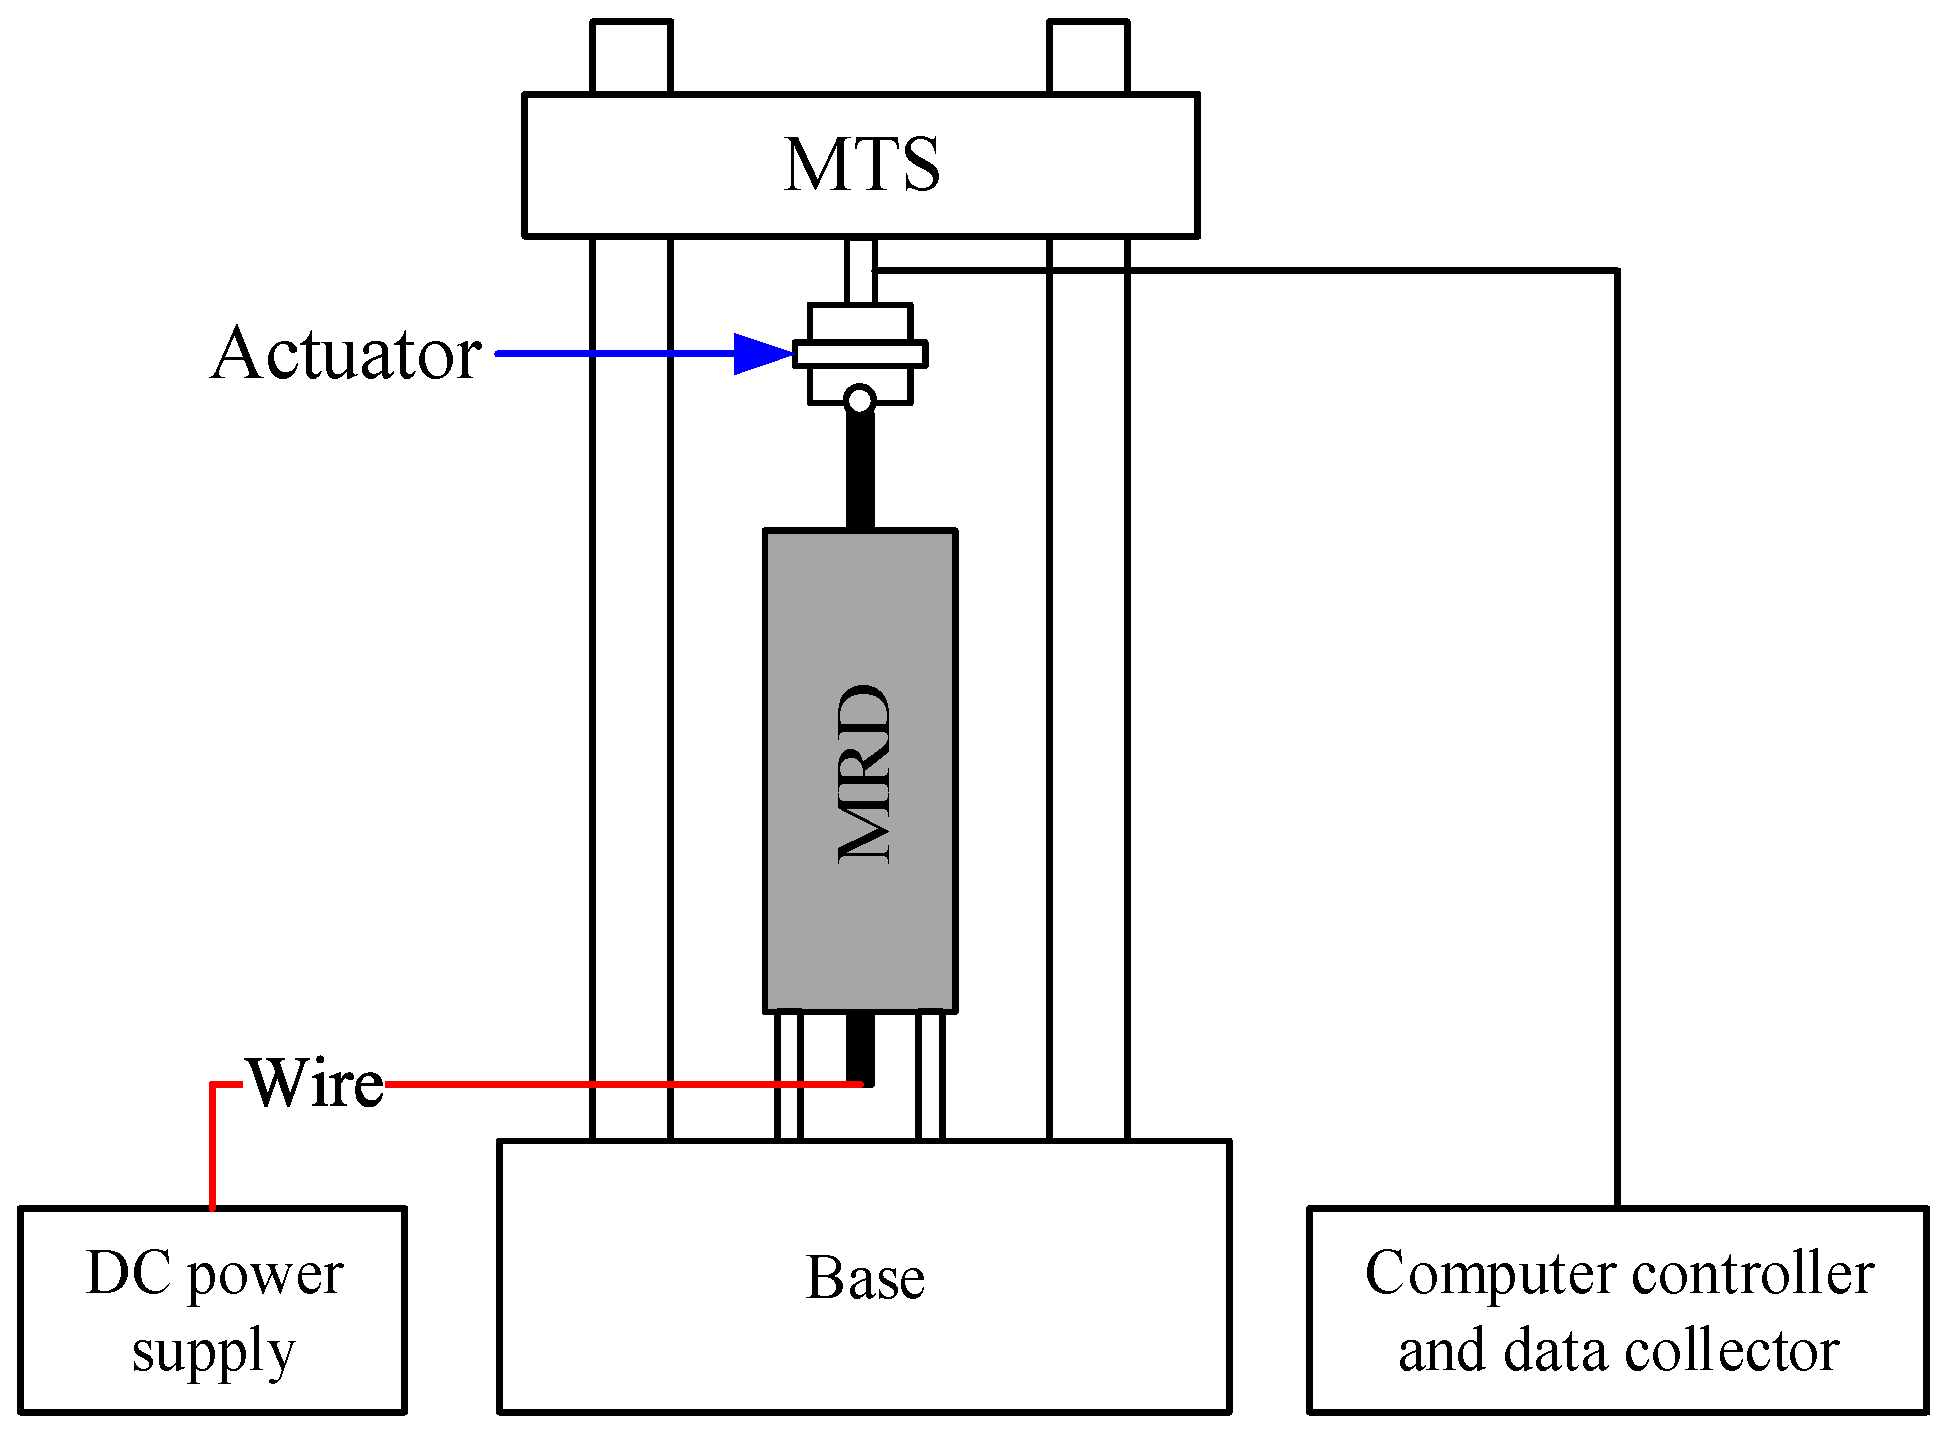
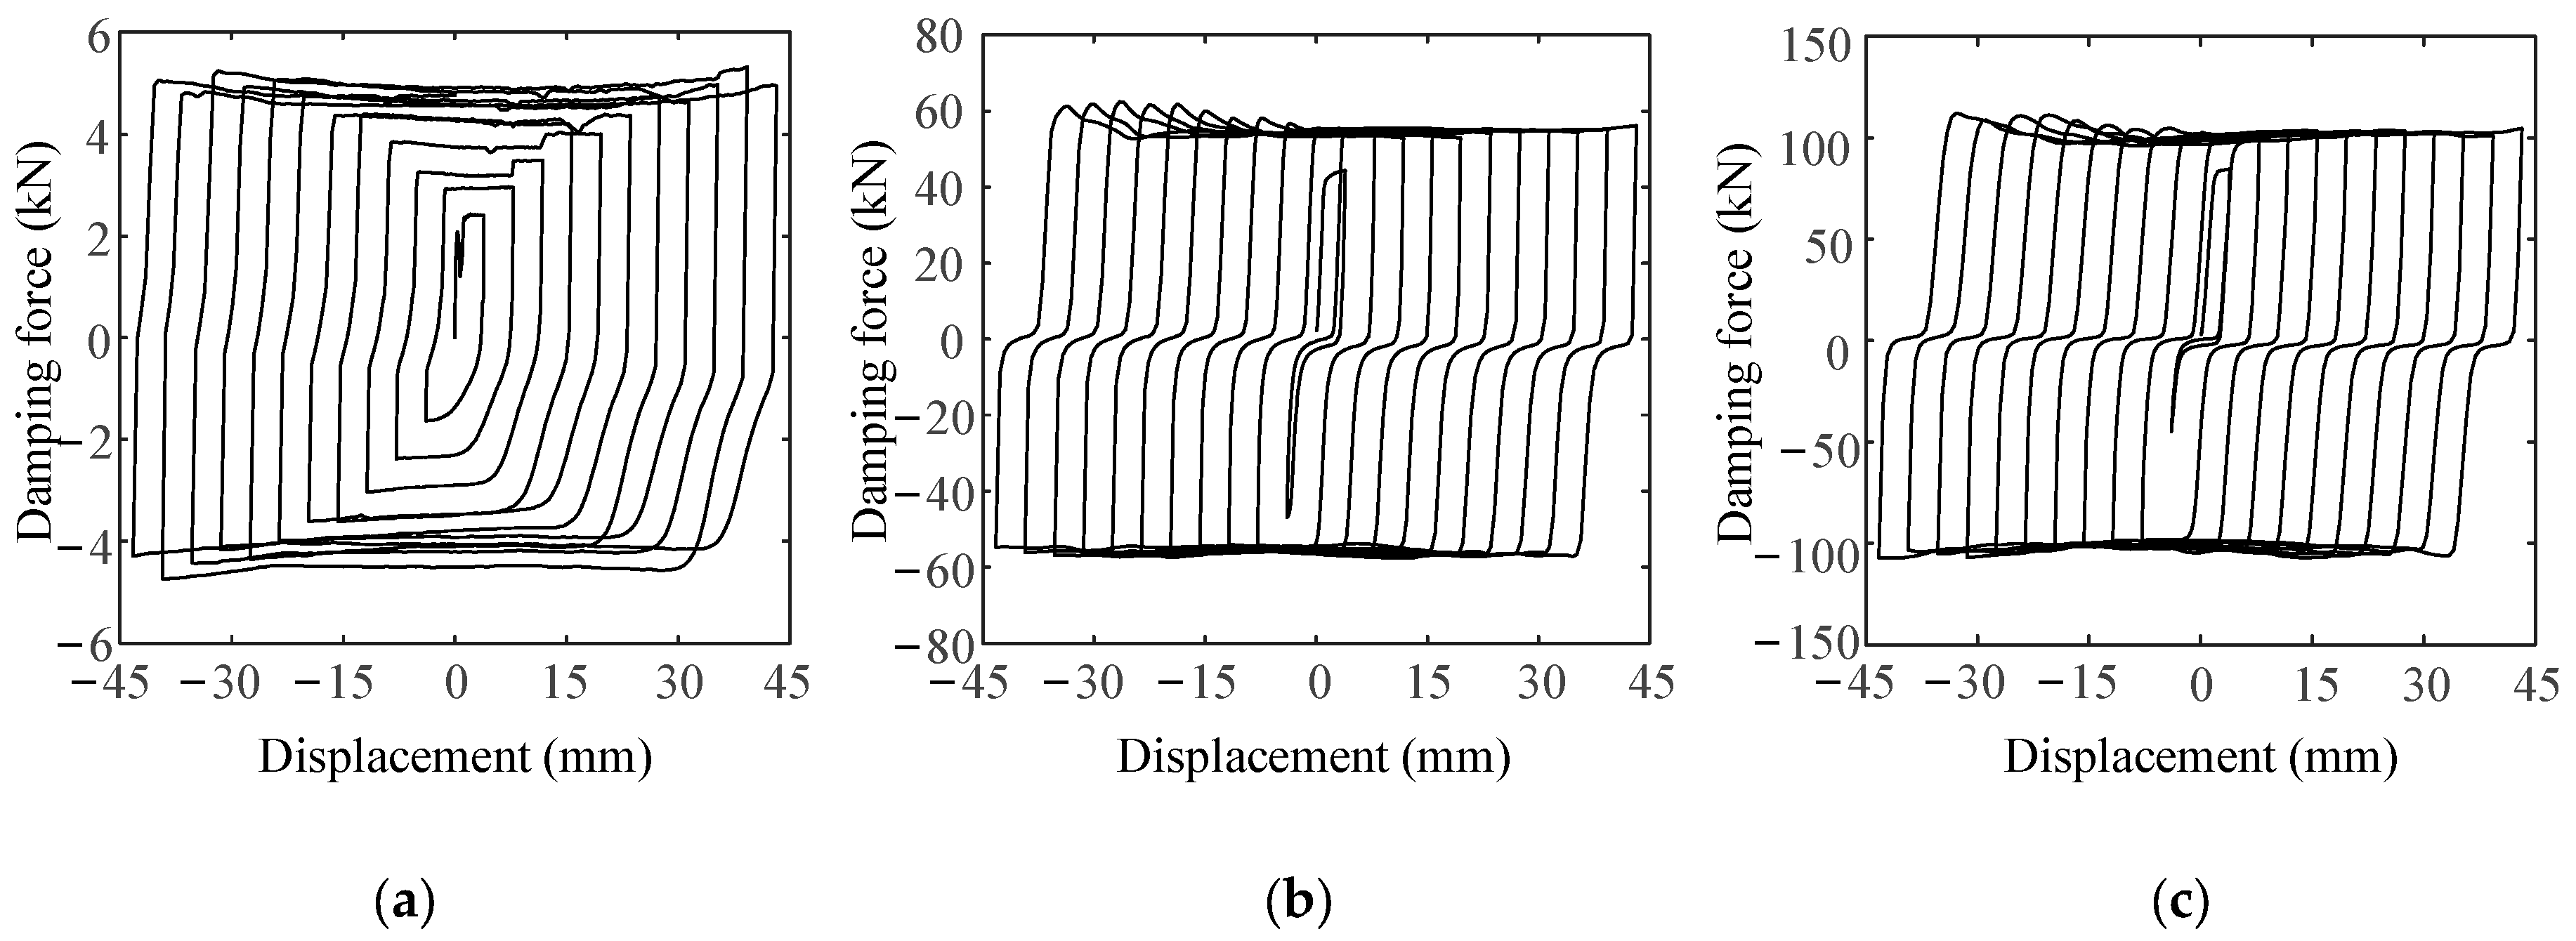
3.1. Test Results of MRD

The MRD to be used in the RC frame’s structure was made by ourselves and is the same as the MRD used in reference [31]; its mechanical property tests were carried out with the current of 0 A to 0.28 A at the interval of 0.14 A. The schematic diagram of the test loading equipment is shown schematically in Figure 3. As is shown in Figure 3, the test device was mainly composed of a fatigue testing machine and regulated DC power supply. Before the test, the position of the vertical centerline of the loading head of the actuator shall be consistent with that of the piston rod of the MRD, and then the loading head of the actuator and the damper should be connected through a spherical bowl seat, high strength bolt, and spherical cover plate. The other end of the damper was connected with the base through the three steel pipes and the high strength bolt, and the base is fixed by the anchor screw. The test data are automatically recorded on the computer console through the external digital acquisition device.
The mechanical performance fluctuation with displacement is depicted in Figure 4. It can be seen from Figure 4 that the mechanical performance fluctuation of the MRD with the current. When the current was small, the damping force provided by the MRD was also small. As the current increased, so did the damping force. It can be seen from Figure 4a, when the current was 0 A, that the maximum damping force of the MRD was around 5.3 kN; when the current reached 0.14 A and 0.28 A, the maximum damping forces of the MRD are around 60 kN and 120 kN, respectively, as shown in Figure 4b,c.

3.2. Equilibrium Equation of the RC Structure

Under the action of the earthquake, the set of second-order nonlinear ordinary differential equations of an RC frame structure with MRDs can be expressed as follows [10]
M u ¨ + C u ˙ + K u = M I x ¨ g H F
where M, C, and K are the mass matrix, the damping matrix, and the stiffness matrix of the frame structure, respectively; u is the displacement column vector of the controlled structure; x ¨ g is the seismic acceleration; I is the unit column vector; F is the control force column vector of the MRD that can be efficiently simulated by adopting analytical hysteresis models [35,36,37]; and H is the location matrix of the MRD.
C is the Rayleigh damping matrix as Equation (4) and α 1 and α 2 are the two constants [38].
C = α 1 M + α 2 K
where α 1 and α 2 are the two constants and can be expressed as
α 1 = 2 ω 1 ω 2 ( ζ 1 ω 2 ζ 2 ω 1 ) ω 2 2 ω 1 2 , α 2 = 2 ( ζ 2 ω 2 ζ 1 ω 1 ) ω 2 2 ω 1 2
where ω 1 and ω 2 are the first and second order natural vibration frequencies of the structure (circular frequency), respectively, and ζ 1 and ζ 2 are the damping ratios of the first and second order frequencies of the structure, respectively.
Using the Wilson-θ method, the dynamic responses of the structure with and without the MRD can be calculated step by step. However, if one wants to carry out nonlinear dynamic analyses without performing iterations and by maintaining a very high level of accuracy, more recent methods can be adopted [39,40].

3.3. Semi-Active Control Algorithm

At present, the optimal control force imposed on RC structures by the MRD is mainly solved by the linear quadratic regulator (LQR) control algorithm [41]. As can be seen from Section 3.1, the damping force provided by our homemade MRD ranges from 3.1 to 120 kN. Because the MRD of the real-time control can effectively trace the required damping force, except the force beyond the range of damping force [42,43,44]. Thus, the same semi-active control strategy as in reference [34] is adopted in this paper.

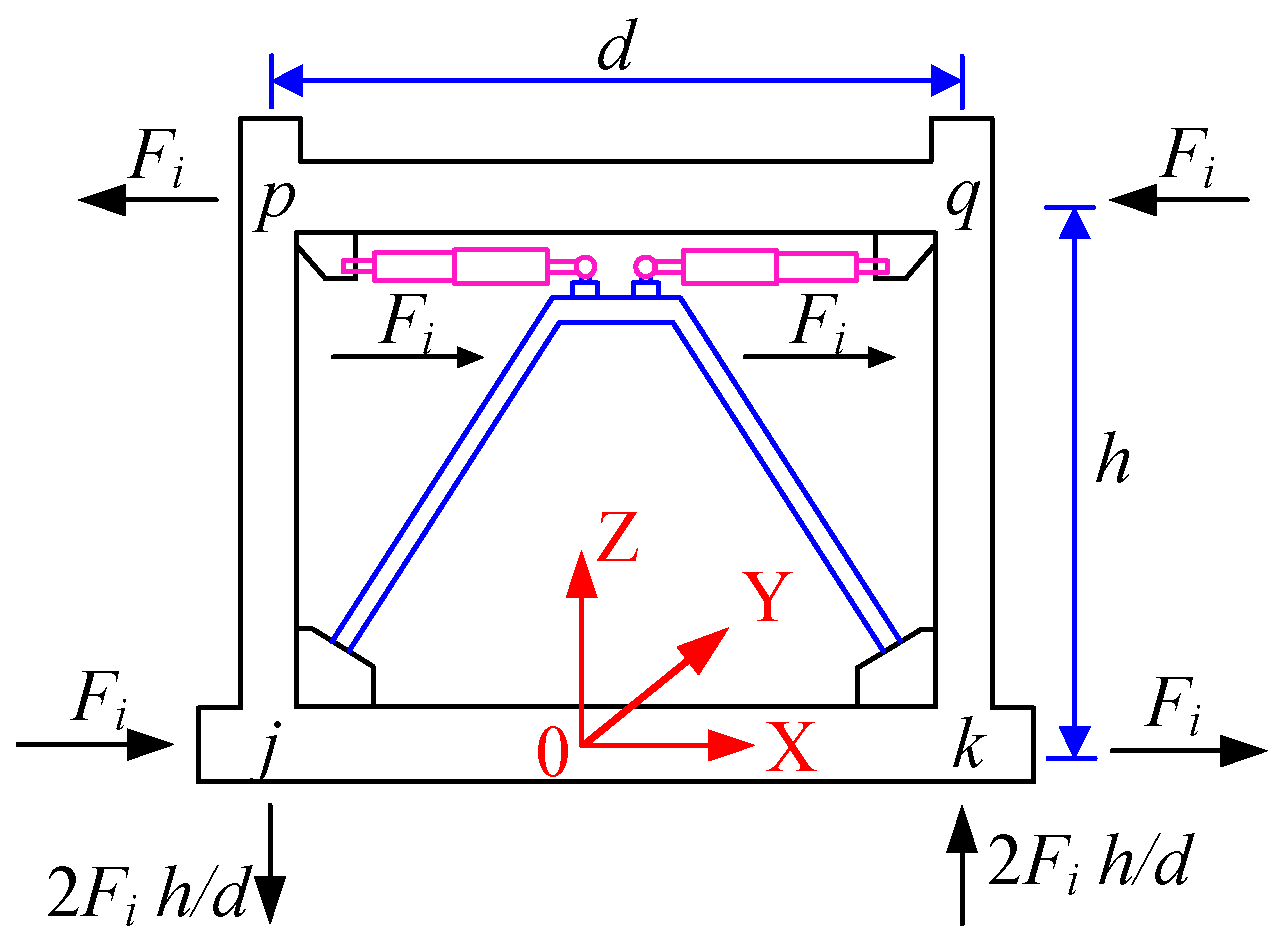
3.4. MRD Location Matrix

The schematic installation diagram of the MRD in the structure is shown in Figure 5. The relationships between the damping force of the MRD and the force on the corresponding node of the structure are as follows:
{ F j x = F k x = F i F p x = F q x = F i F j z = F k z = 2 F i h / d
The location matrix H is used to distribute the control force vector F of the MRD to the corresponding nodes of the structure, whose dimension is n × m , in which n is the amount of the structural degrees of freedom (DOFs), and m is the amount of herringbone supports. There are six DOFs at each node of the space frame structure, including three axial displacements along the x, y, and z directions, and three angular displacements around the x, y, and z axes, which are consistent with the literature [21]. Therefore, for the MRDs on the ith chevron support shown in Figure 5, the elements which correspond to nodes j and k in the location matrix H are: H ( 6 j 5 , i ) = H ( 6 k 5 , i ) = 1 and H ( 6 j 3 , i ) = H ( 6 k 3 , i ) = 2 h / d , and the elements which correspond to nodes p and q in the location matrix H are: H ( 6 p 5 , i ) = H ( 6 q 5 , i ) = 1 . While the others without a damping force are all equal to zero. For example, the location matrix H for the MRDs in Figure 5 can be expressed as:
i H = [ 1 0 2 h / d 0 1 0 2 h / d 0 1 0 1 ] 6 j 5 6 j 4 6 j 3 6 k 5 6 k 4 6 k 3 6 p 5 6 q 5

4. Case Analysis

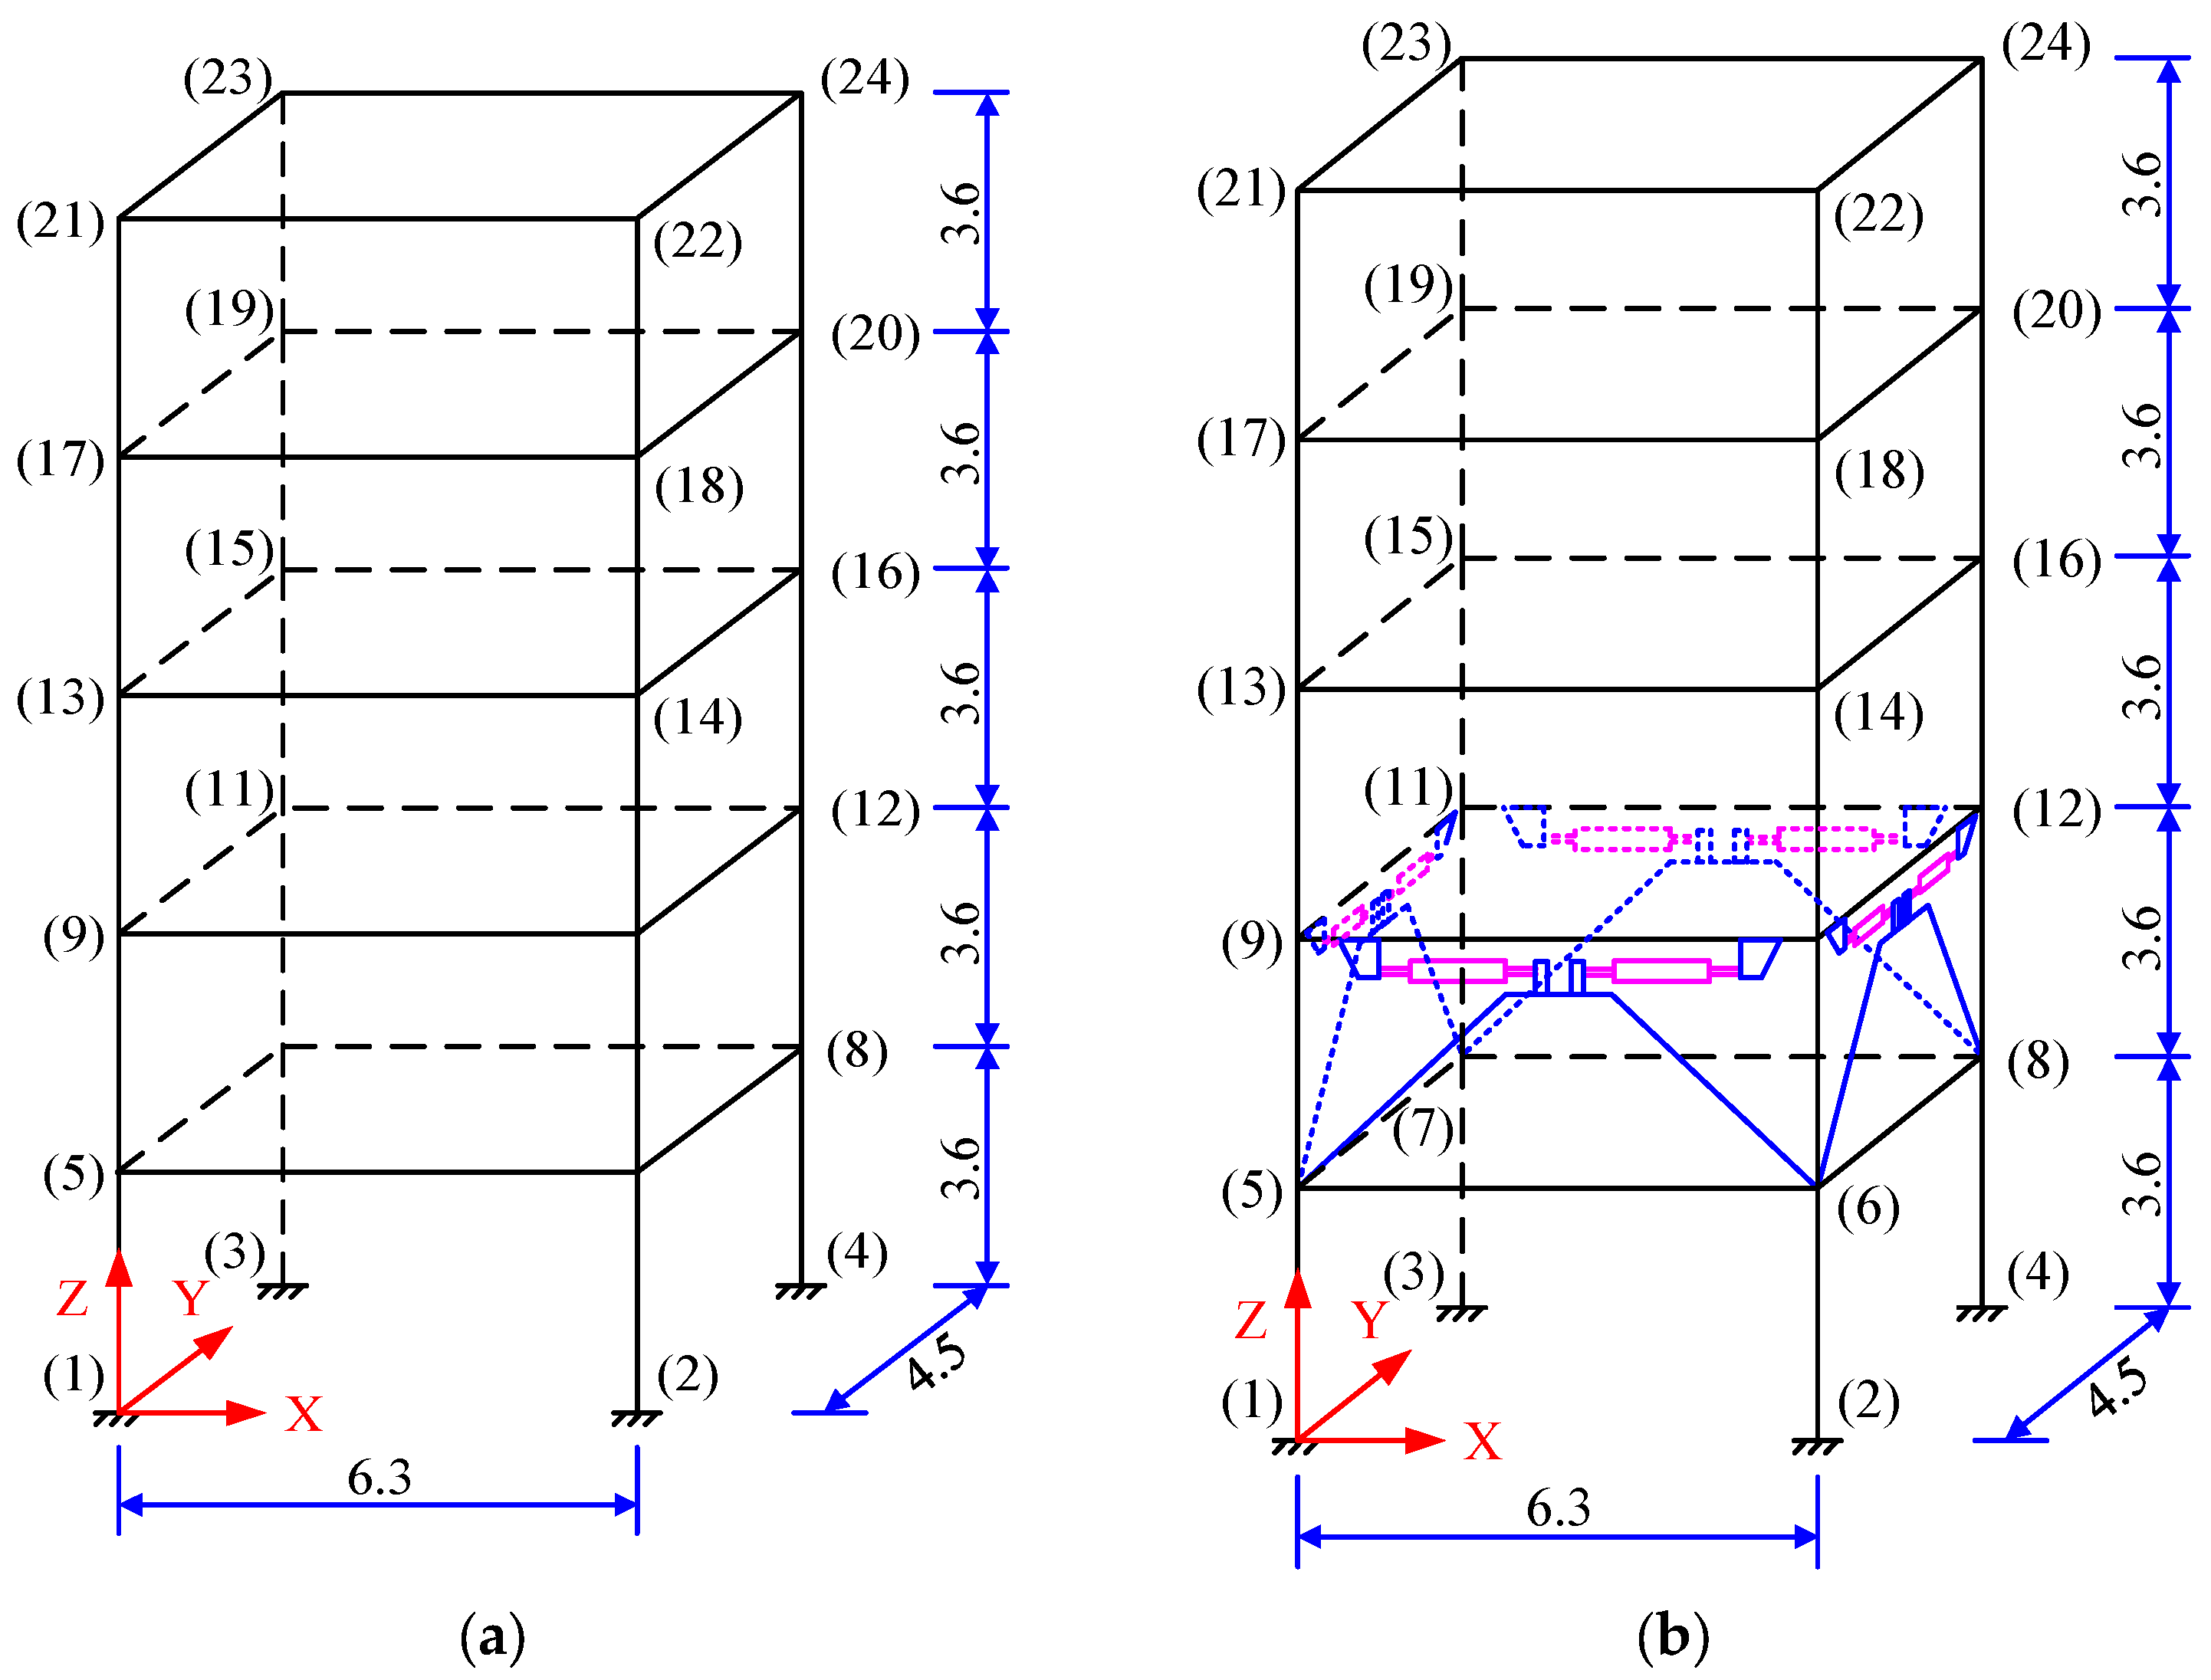
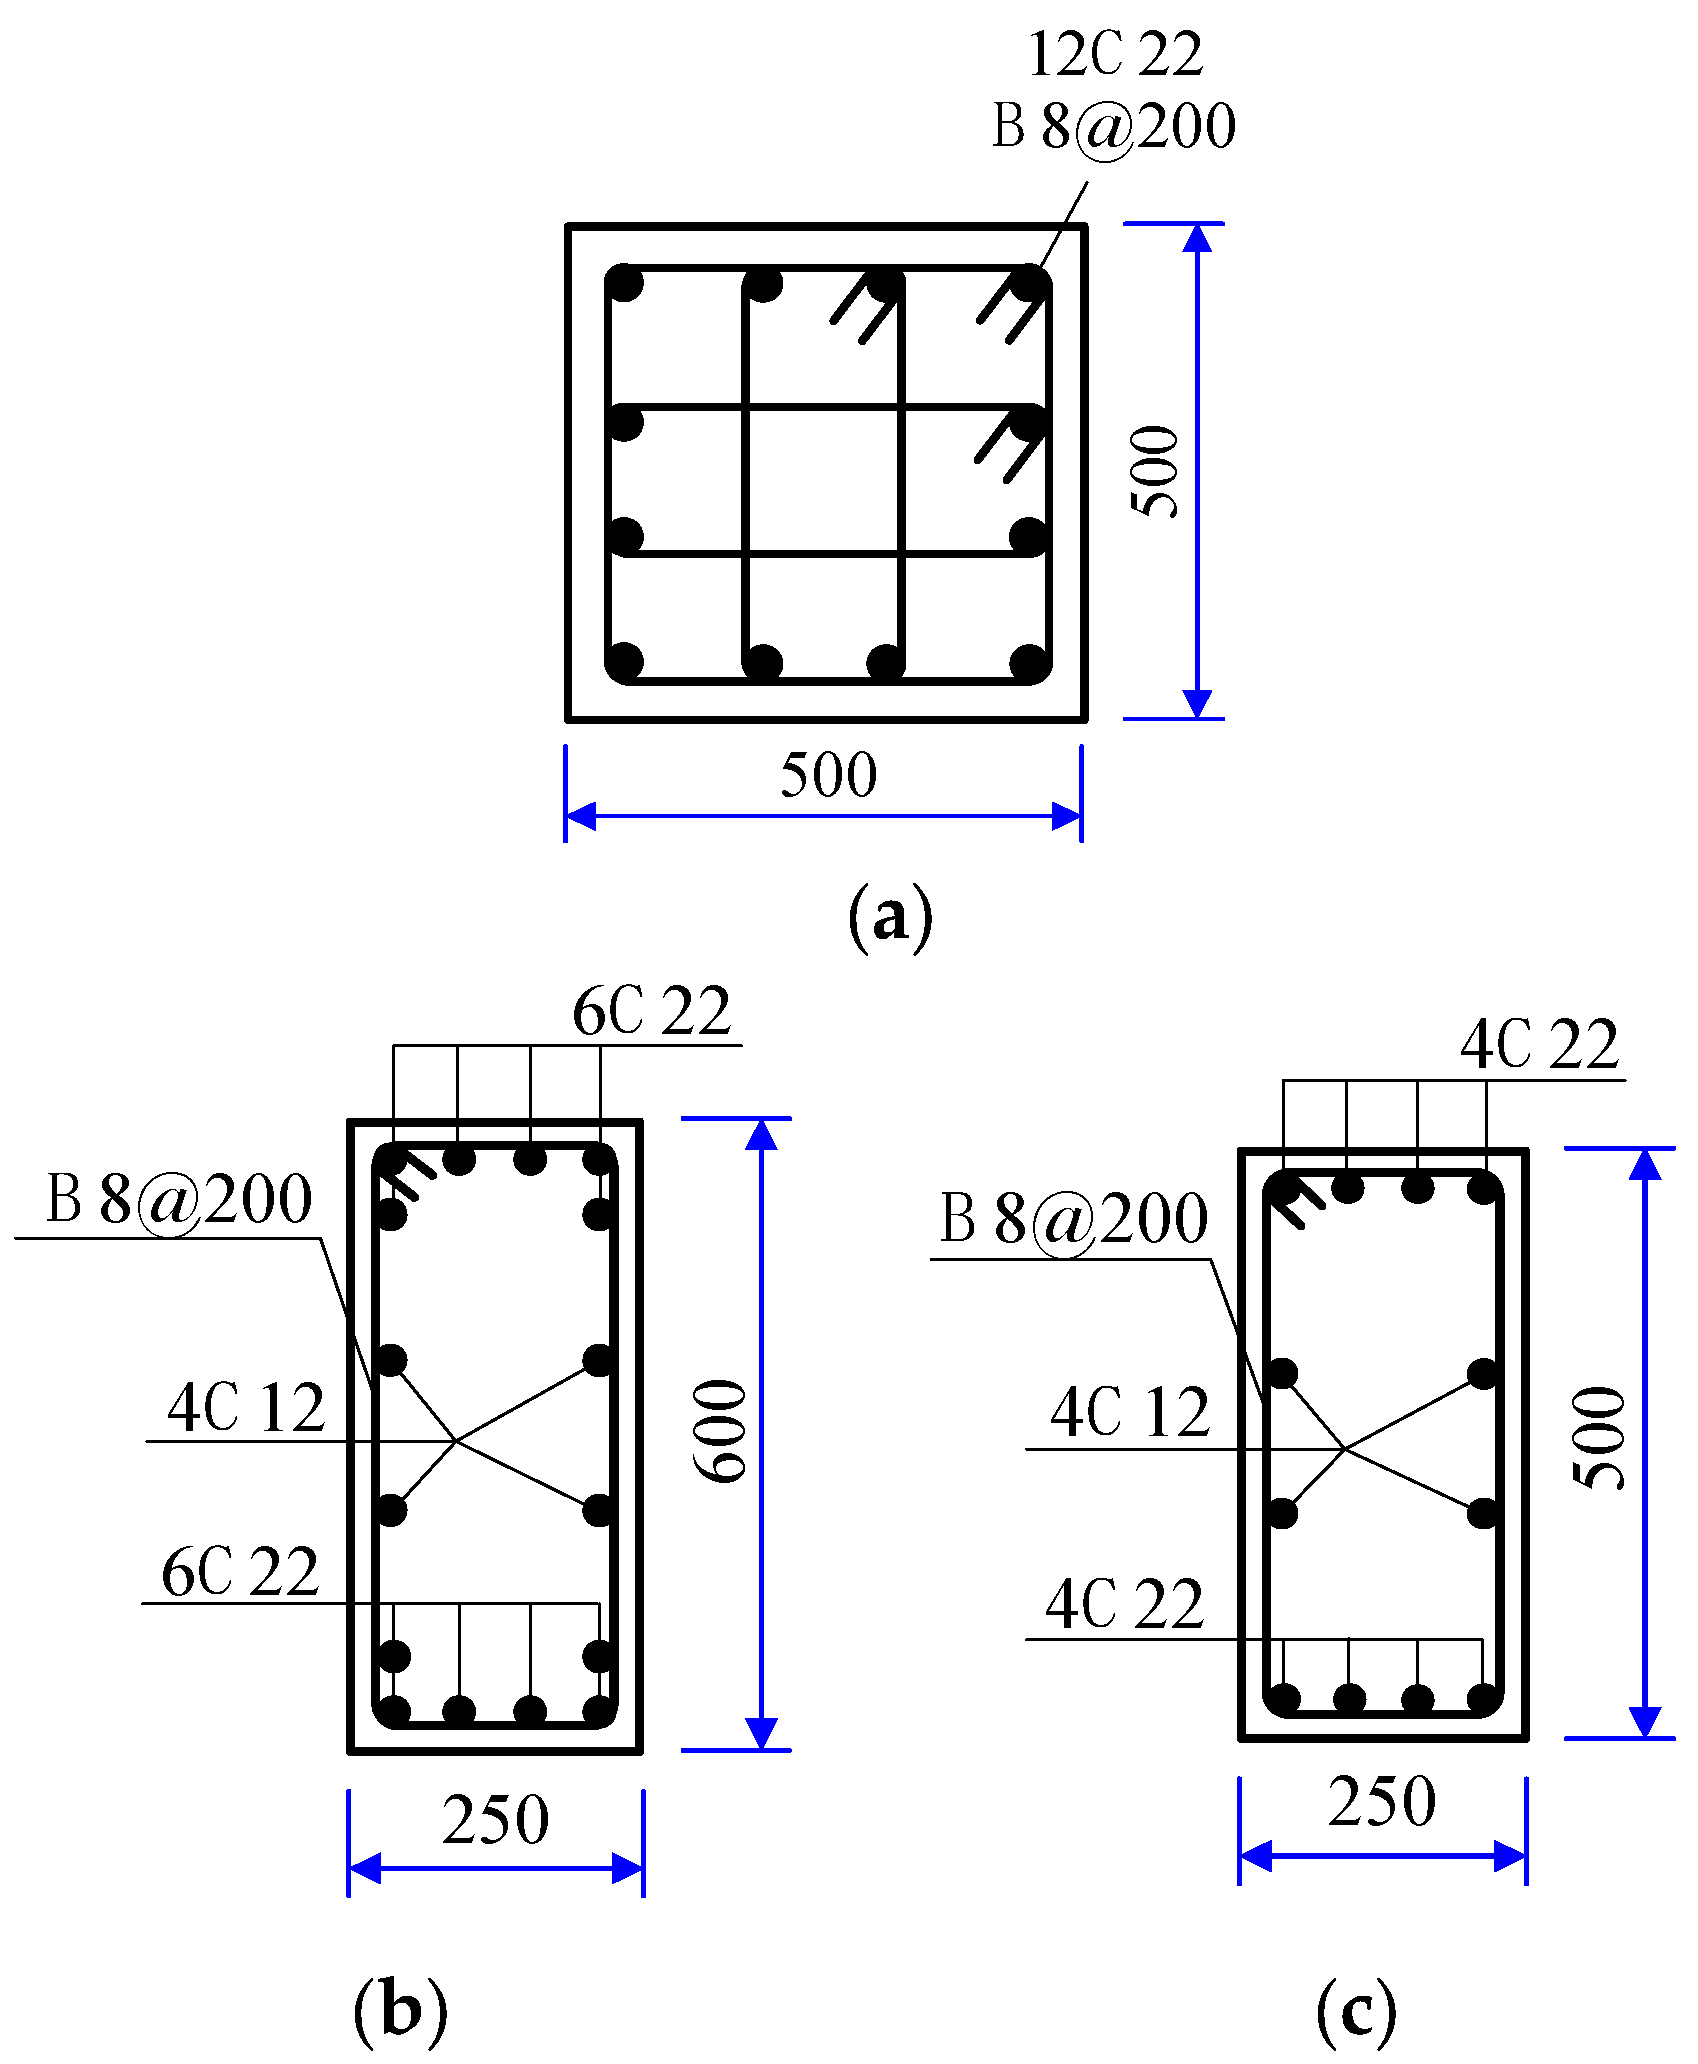
4.1. The RC Frame Structure with and without MRD

This paper takes the five-story RC frame structure as an example, and the floor height of the structure is 3.6 m. The concrete strength grade is C35, and the thickness of each floor of the structure is 0.12 m. The seismic fortification intensity of the structure is eight (0.2 g), the site category is a class III area, and the design seismic group is the first group. The three-dimensional size of the RC frame’s structure with and without MRDs is shown in Figure 6. The maximum inter-story displacement of the frame structure under the action of a strong earthquake occurs at the second floor [21,34], therefore, the MRDs were arranged on the second floor to exert the effect of an MRD energy dissipation and shock absorption as much as possible. The cross-sectional dimensions of the columns are all 0.5 m × 0.5 m; the cross-sectional dimensions of the X and Y directional beam are all 0.25 m × 0.6 m and 0.25 m × 0.5 m, respectively. The section reinforcement of the RC beams and columns are shown in Figure 7, in which the longitudinal reinforcement of the beams and columns is the HRB400 deformed reinforcement; the stirrup is the HRB335 ordinary round reinforcement.

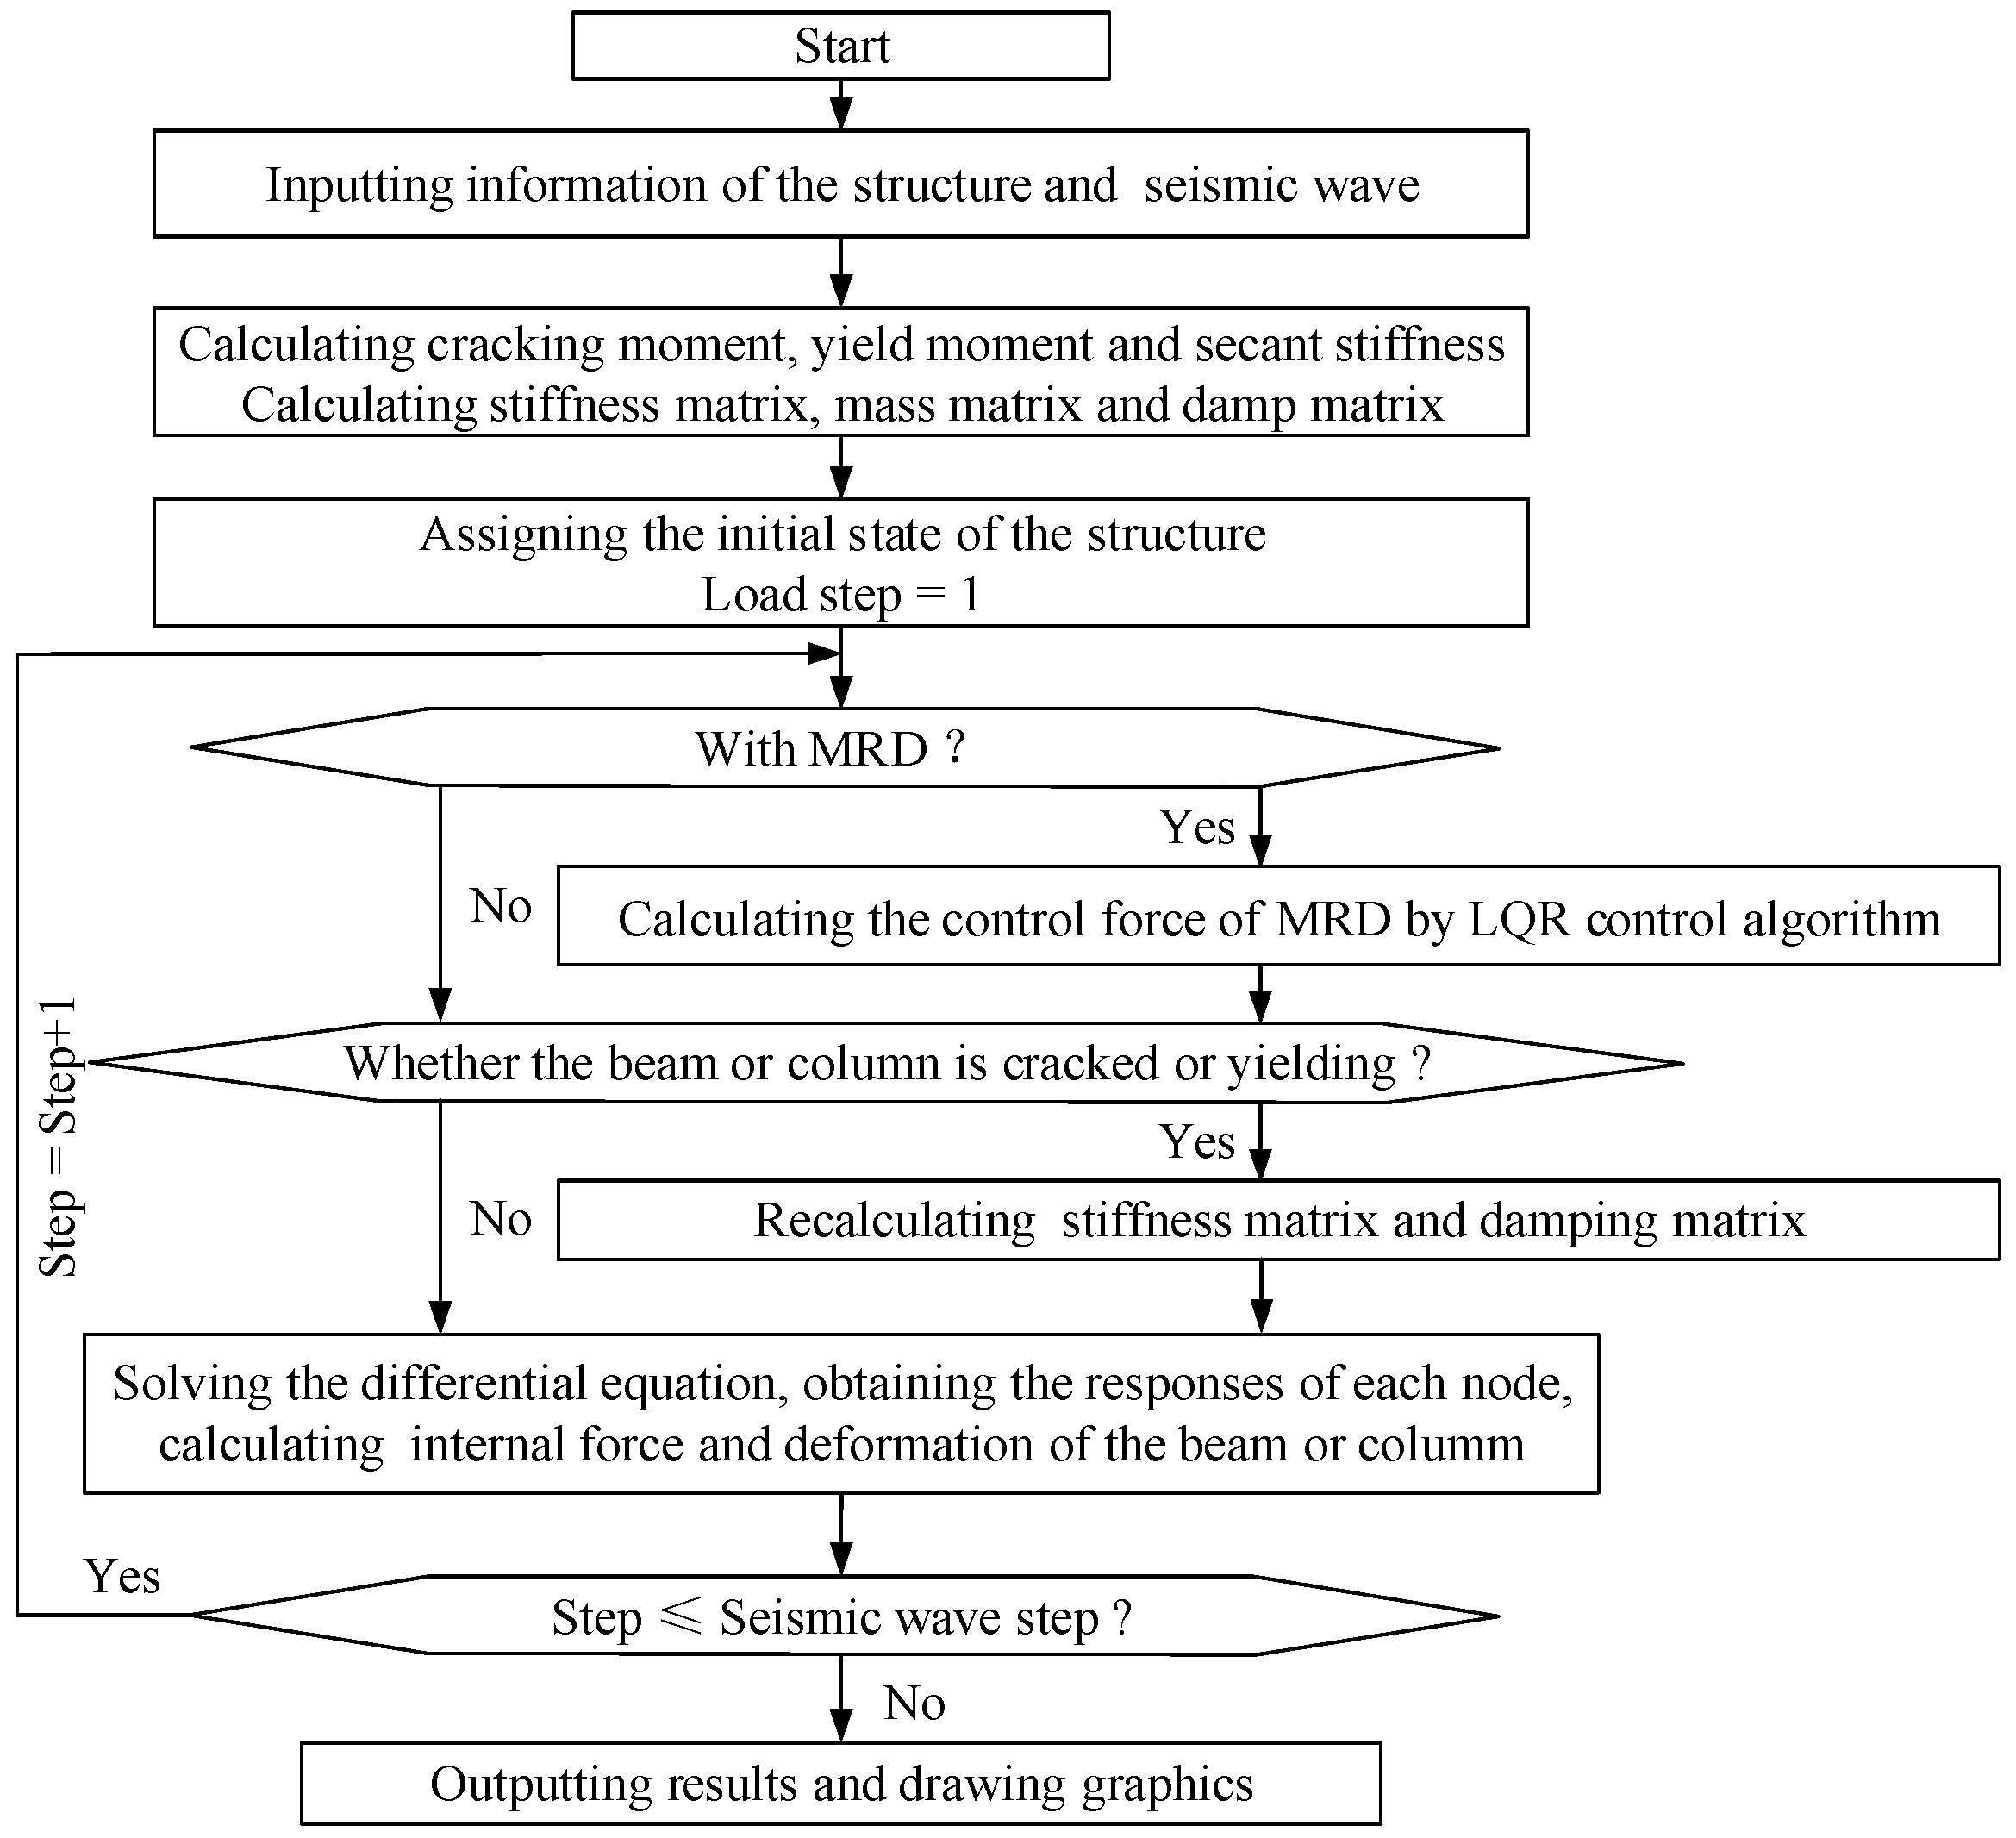
4.2. Introduction of Dynamic Time History Analysis Process

Based on the conditions and methods mentioned above, this paper used MATLAB to program the elastic–plastic time history analysis program of the RC frame’s structure with and without an MRD. The program calculation flowchart is shown in Figure 8. The following assumptions are adopted in programming: (1) ignoring the influence of the second moment caused by a structural deformation; (2) ignoring the influence of the tangential relative displacement at both ends of the member on the bending moment and the rotation angle of the member; (3) ignoring the effect of the diagonal bracing on the mass of the structure; and (4) assume that the lower end of the bottom column is consolidated.

4.3. Verification of Model Validity

Due to the disadvantages of the long period and high cost of experimental simulation, a numerical simulation method was adopted in this paper to verify the effectiveness of an elastic–plastic time history analysis program by using MATLAB. By using ANSYS software, the finite element model of the structure was built, in which the BEAM188 element and SHELL181 element were used to simulate the beam, column, and floor slab, respectively. All the beams and columns in the ANSYS model were divided into four units, and all the floor slabs were divided into 4 × 4 units. In addition, the geometry, density, and material property in the ANSYS model were the same as that in the MATLAB program. Then, the modal analysis was conducted, and the calculated natural frequencies were listed in Table 1, in which the maximum error was only 1.59%. It shows the validity and accuracy of the elastic–plastic history analysis program for the RC frame’s structure.

4.4. Analysis of Structural Damping Results

The elastic–plastic analysis of the seismic response of the RC frame’s structure was carried out by using the MATLAB self-made program. According to the Chinese code for design of concrete structures (GB50010-2010) and the assumptions of the site type and design seismic grouping in Section 4.1, two seismic waves, the El-Centro wave (NS component) and Tangshan wave (NS component), were selected. The seismic duration was 20 s, the peak acceleration of the two seismic waves was set to 400 cm/s2, and the ratio of the two-way seismic wave peak acceleration was X:Y = 1:0.85. The damping ratios ζ 1 and ζ 2 in Equation (5) were set to 0.05 according to the Chinese code for design of concrete structures (GB50010-2010). The Wilson-θ method was used to solve the differential equations of the structure and took θ = 1.40. The weight matrix coefficients α = 20 and β = 7 × 10⁻⁶ in the LQR control algorithm were determined by a trial calculation.

4.4.1. Comparative Analysis of Multi-Dimensional Damping Results

The displacement time history results of the node 24 of the RC frame’s structure with and without an MRD under the action of the El-Centro wave and Tangshan wave are shown in Figure 9. As can be seen from Figure 9, the X and Y directions’ displacement time history curves of the node 24 of the structure without an MRD are offset, the reason is that some members in the structure enter the yield stage and have a residual deformation. After setting the MRD in the structure, the residual deformation is greatly reduced, and the offset of the displacement time history curve is reduced.
Figure 9a,b shows that under the action of the El-Centro wave and Tangshan wave, the horizontal bidirectional displacement response of the node 24 in the structure with an MRD was reduced compared with the structure without an MRD. Figure 9a shows that, under the action of an El-Centro wave, the X and Y directional maximum displacements of the top node in the RC structure were 76.66 mm and 74.44 mm, respectively, after setting the MRD in the structure; the X and Y directional maximum displacements of the top node in the RC structure were 52.42 mm and 50.79 mm, which were reduced by 31.63% and 31.76%, respectively. Under the action of the Tangshan wave shown in Figure 9b, the X and Y directional maximum displacements of the node 24 in the RC structure were 109.40 mm and 92.53 mm, respectively. After setting the MRD in the structure, the X and Y directional maximum displacements of the node 24 in the RC structure were 52.65 mm and 55.91 mm, which were reduced by 51.87% and 39.59%, respectively.
The acceleration time history results of the node 24 of the RC frame’s structure without an MRD and with an MRD under the action of the El-Centro wave and Tangshan wave are shown in Figure 10. As can be seen from Figure 10, the X and Y directional acceleration time-history curves of the node 24 do not deviate. In addition, under the action of the El-Centro wave and Tangshan wave, the horizontal bidirectional acceleration response of the node 24 of the structure with an MRD is reduced compared with the structure without an MRD, but the effect is not as obvious as the MRD in reducing the displacement response of the structure.
Figure 10a shows that under the action of the El-Centro wave, the X and Y directional maximum accelerations of the top node in the RC structure were 12.08 m/s2 and 9.98 m/s2, respectively. After setting the MRD in the structure, the X and Y directional maximum accelerations of the top node in the RC structure were 9.67 m/s2 and 8.64 m/s2, which were reduced by 19.96% and 13.50%, respectively. Under the action of the Tangshan wave shown in Figure 10b, the X and Y directional maximum accelerations of the node 24 in the RC structure were 11.98 m/s2 and 11.71 m/s2, respectively. After setting the MRD in the structure, the X and Y directional maximum accelerations of the node 24 in the RC structure were 7.62 m/s2 and 6.11 m/s2, which were reduced by 36.67% and 47.86%, respectively.
Adding the MRD to the structure can be equivalent to increasing the stiffness and damping of the structure. It can be obtained from Equation (1) that the increase in the stiffness and damping of the structure is conducive to reducing the displacement response of the structure under an earthquake action, as shown in Figure 9. Although increasing the damping of the structure can reduce the acceleration response of the structure under an earthquake action, increasing the stiffness will increase the acceleration response of the structure. Therefore, after adding the MRD, the acceleration damping effect of the structure will be lower than the displacement damping effect, as shown in Figure 10.

4.4.2. Comparative Analysis of Maximum Response Results of Each Story

The envelope diagram of the maximum horizontal acceleration, displacement, and story drift ratio of the RC frame structure with and without an MRD under the El-Centro and Tangshan waves are shown in Figure 11. As shown in Figure 11a,b, under the action of the El-Centro wave and Tangshan wave, compared with the structure without an MRD, the maximum horizontal displacement, acceleration, and story drift ratio of each story of the structure with an MRD are reduced.
Taking node 16 on the third story as an example, Figure 11a shows that under the action of the El-Centro wave, the X and Y directional maximum displacements of the RC structure were 55.22 mm and 54.04 mm, respectively. After setting the MRD in the structure, the X and Y directional maximum displacements of the RC structure were 37.15 mm and 35.24 mm, which were reduced by 32.73% and 34.80%, respectively. The X and Y directional maximum accelerations of the RC structure were 9.96 m/s2 and 8.69 m/s2, respectively. After setting the MRD in the structure, the X and Y directional maximum accelerations of the RC structure were 7.65 m/s2 and 6.83 m/s2, which are reduced by 23.22% and 21.35%, respectively. The X and Y directional maximum story drift ratios of the RC structure were 4.46 × 10⁻³ rad and 4.51 × 10⁻³ rad, respectively. After setting the MRD in the structure, the X and Y directional maximum story drift ratios of the RC structure were 3.18 × 10⁻³ rad and 3.15 × 10⁻³ rad, which were reduced by 28.67% and 29.91%, respectively.
As shown in Figure 11b, under the action of the Tangshan wave, the X and Y directional maximum displacements of the RC structure were 78.21 mm and 65.09 mm, respectively. After setting the MRD in the structure, the X and Y directional maximum displacements of the RC structure were 37.78 mm and 39.43 mm, which were reduced by 51.69% and 39.42%, respectively. The X and Y directional maximum accelerations of the RC structure were 8.41 m/s2 and 6.66 m/s2, respectively. After setting the MRD in the structure, the X and Y directional maximum accelerations of the RC structure were 4.89 m/s2 and 4.42 m/s2, which were reduced by 41.90% and 33.59%, respectively. The X and Y directional maximum story drift ratios of the RC structure were 6.58 × 10⁻³ rad and 5.53 × 10⁻³ rad, respectively. After setting the MRD in the structure, the X and Y directional maximum story drift ratios of the RC structure were 2.92 × 10⁻³ rad and 3.13 × 10⁻³ rad, which were reduced by 55.64% and 43.49%, respectively.
As can be seen from Figure 11, the maximum story drift ratio of the RC frame structure with and without an MRD firstly increase and then decrease with the increase in the structural stories, and the maximum values are all less than 1/50. After setting the MRD in the RC frame’s structure, the maximum story drift ratio of each story are far less than 1/50, which significantly improves the seismic performance of the RC frame’s structure.

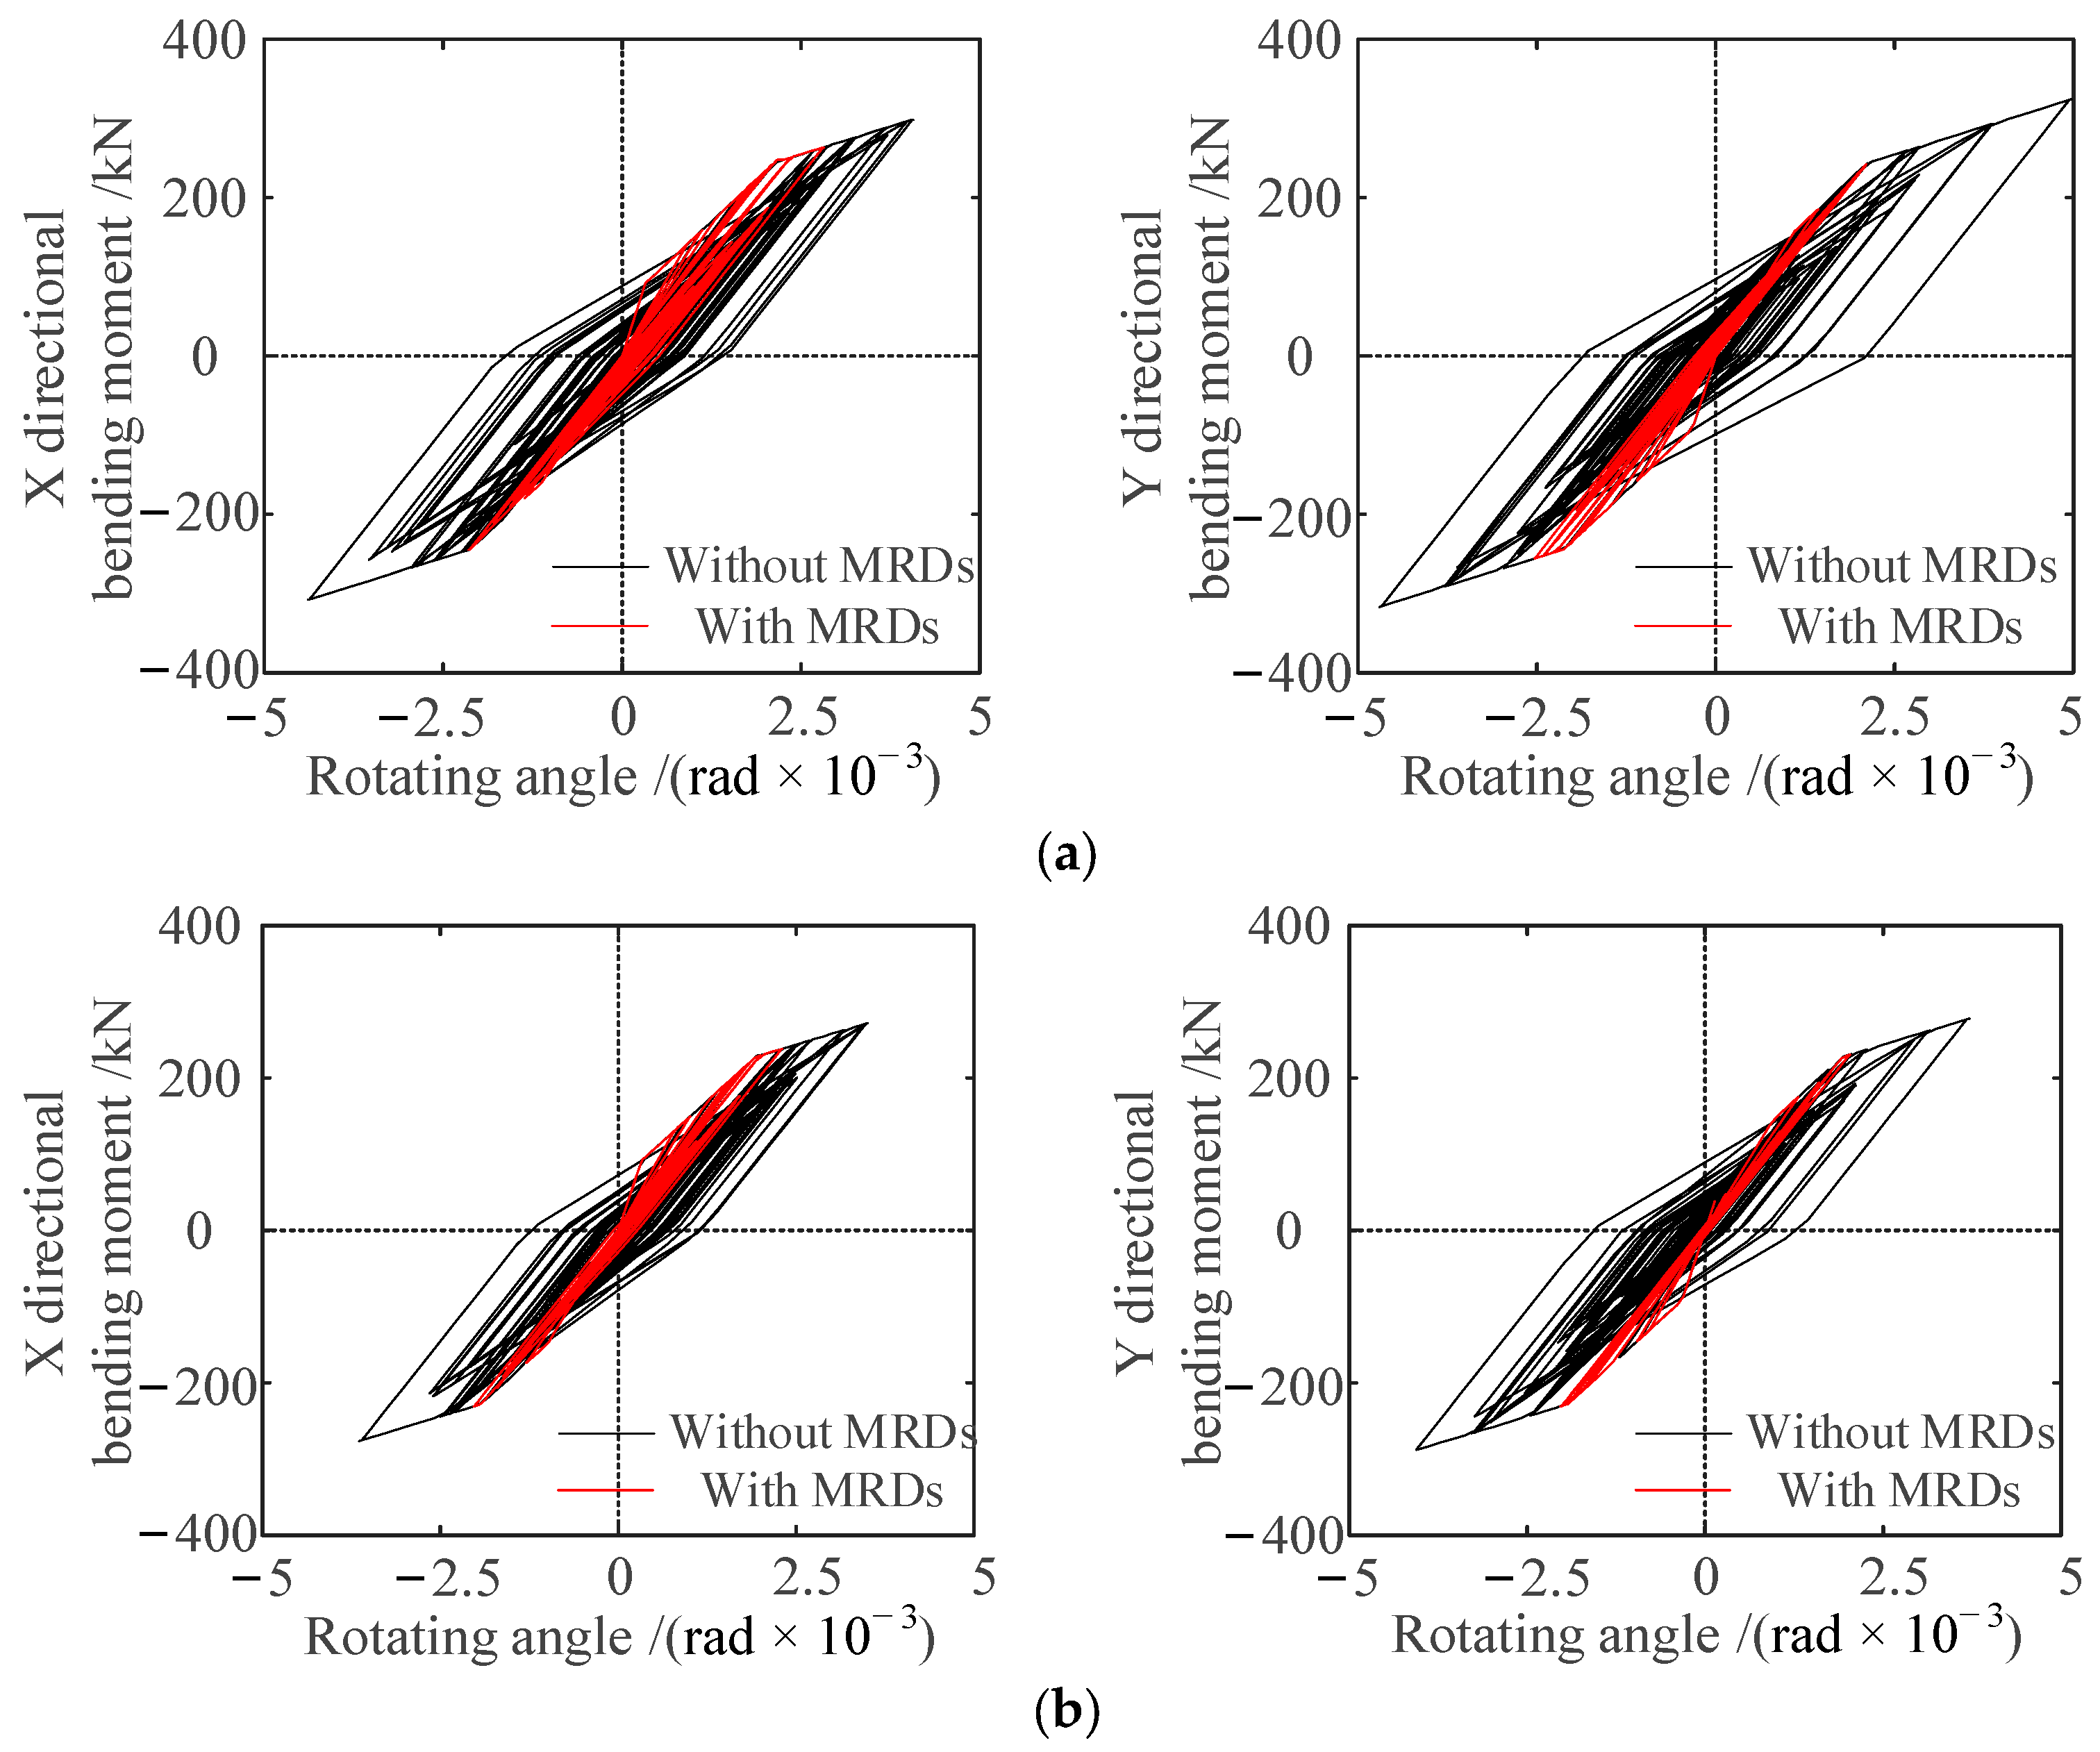
4.4.3. Comparative Analysis of Moment Rotation Hysteretic Curve Results

Figure 12 and Figure 13 show the comparison of moment-angle hysteresis curves at the bottom of each column of the RC frame’s structure with and without an MRD. As can be seen from Figure 12, under the action of the El-Centro wave, a hysteresis loops appeared in both X and Y directions of the column in the third story of the structure, and the intersection of the hysteresis curves and coordinate axes deviated from the origin, indicating that the column entered the yield stage in X and Y directions, and the maximum residual deformations in X and Y directions were 0.923 × 10⁻³ rad and 0.914 × 10⁻³ rad, respectively. After setting the MRD in the structure, the seismic response of the column in the X and Y direction was weakened significantly, the maximum value of the moment rotation curve at the bottom of the column was significantly smaller, the hysteretic loop area was reduced, and the maximum residual deformations in X and Y directions were reduced to 0.205 × 10⁻³ rad and 0.188 × 10⁻³ rad, respectively. Similar to the column in the third story, after setting the MRD in the structure, the maximum residual deformations in the X and Y direction of the column in the fourth story decreased from 0.648 × 10⁻³ rad and 0.672 × 10⁻³ rad to 0.241 × 10⁻³ rad and 0.141 × 10⁻³ rad, respectively.
It can be seen from Figure 13 that under the action of the Tangshan wave, the rotation angles in X and Y directions were large when the column in the third story of the structure was loaded, and a large residual deformation occurred during the unloading, and hysteresis loops appeared in both X and Y directions of the column in the third story of the structure, the intersection of the hysteresis curves and coordinate axes deviated from the origin, which indicates that the column entered the yield stage in the X and Y directions, and the maximum residual deformations in the X and Y directions were 1.628 × 10⁻³ rad and 2.101 × 10⁻³ rad, respectively. After setting the MRD in the structure, the seismic response of the column in X and Y direction was weakened significantly, the maximum value of the moment rotation curve at the bottom of the column was significantly smaller, the hysteretic loop area was reduced, and the maximum residual deformations in the X and Y directions were reduced to 0.511 × 10⁻³ rad and 0.297 × 10⁻³ rad, respectively. Similar to the column in the third story, after setting the MRD in the structure, the maximum residual deformations in the X and Y direction of the column in fourth story decreased from 1.217 × 10⁻³ rad and 1.562 × 10⁻³ rad to 0.264 × 10⁻³ rad and 0.065 × 10⁻³ rad, respectively.
Table 2 shows the maximum residual displacement angles in the X and Y directions at the column bottom of each story of the RC frame’s structure with and without an MRD under the action of the seismic wave. It can be seen from Table 2 that the MRD can effectively consume the vibration energy transmitted to the structure and reduce the residual deformation at the column bottom of each story of the structure.
In addition, whether the X-direction and Y-direction of each member of the RC frame structure with or without an MRD enters the yield stage under the action of two seismic waves can be compared in Figure 14. All the above indicate that the stiffness of the structural components would degrade under the action of seismic waves, but the seismic performance of the RC frame’s structure is significantly improved after setting the MRD in the structure.

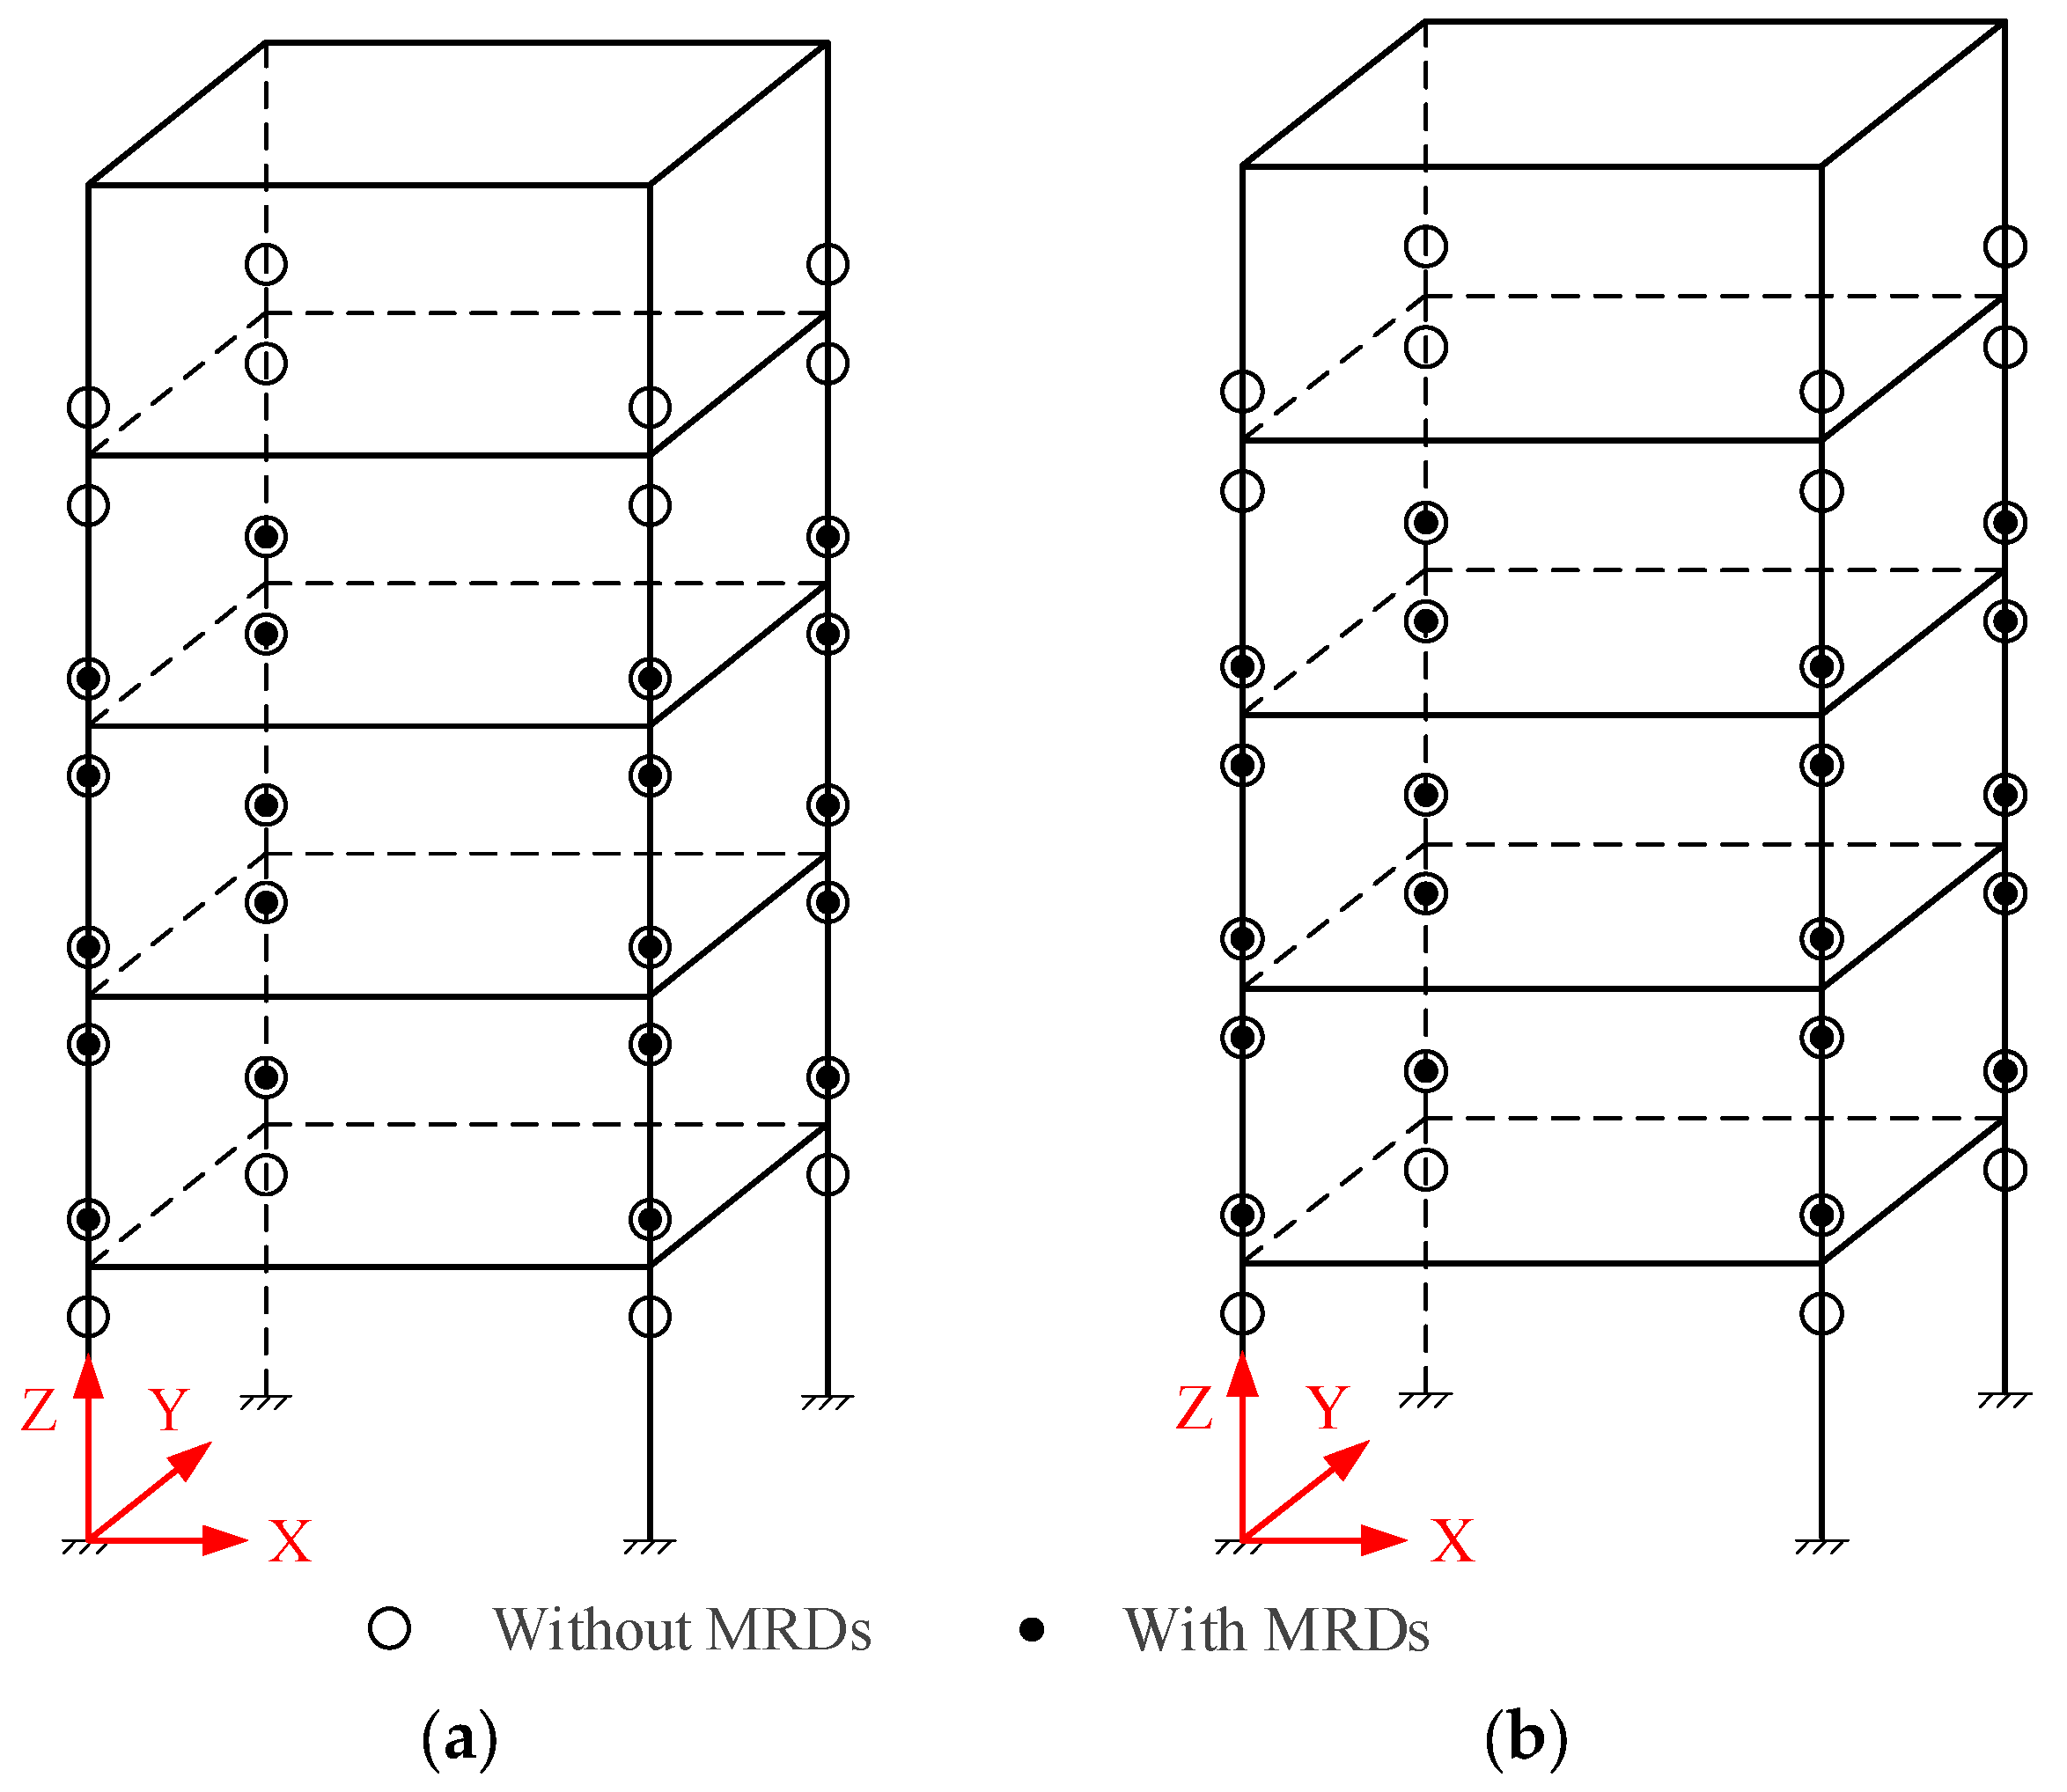
4.4.4. Cracking and Yield of Each Member of Structure

Figure 14 shows the plastic hinges distribution of the beams and columns of RC frame’s structure with and without an MRD under different seismic waves. Under the action of two seismic waves, the plastic hinge distribution of the RC frame’s structure was exactly the same.
It can be seen from Figure 14a,b that under the action of the El-Centro wave and Tangshan wave, most of the column ends of the second to fifth stories of the structure appeared to be a plastic hinge, but the beam ends did not yield. After the MRD was set in the structure, the plastic hinges at the column ends of the structure were reduced. The number of plastic hinges in the X direction and Y direction have been decreased by 37.50%.
Therefore, setting the MRD in the RC frame’s structure can effectively inhibit the yield of the structural members, so as to improve the overall seismic performance of the structure. In addition, the multi-dimensional elastic–plastic calculation model and elastic–plastic dynamic time history analysis program established by MATLAB software in this chapter can effectively describe the yield position, sequence, failure degree, and process of each beam and column, so as to judge the plastic deformation concentration position, weak position, and possible failure type of the overall structure.

5. Conclusions

(1)
The multi-dimensional elastoplastic calculation model of the MRD frame’s structure was established, and the elastoplastic dynamic time history analysis program was developed by using MATLAB software, which could accurately calculate the multi-dimensional elastoplastic response of the structure under a strong earthquake.
(2)
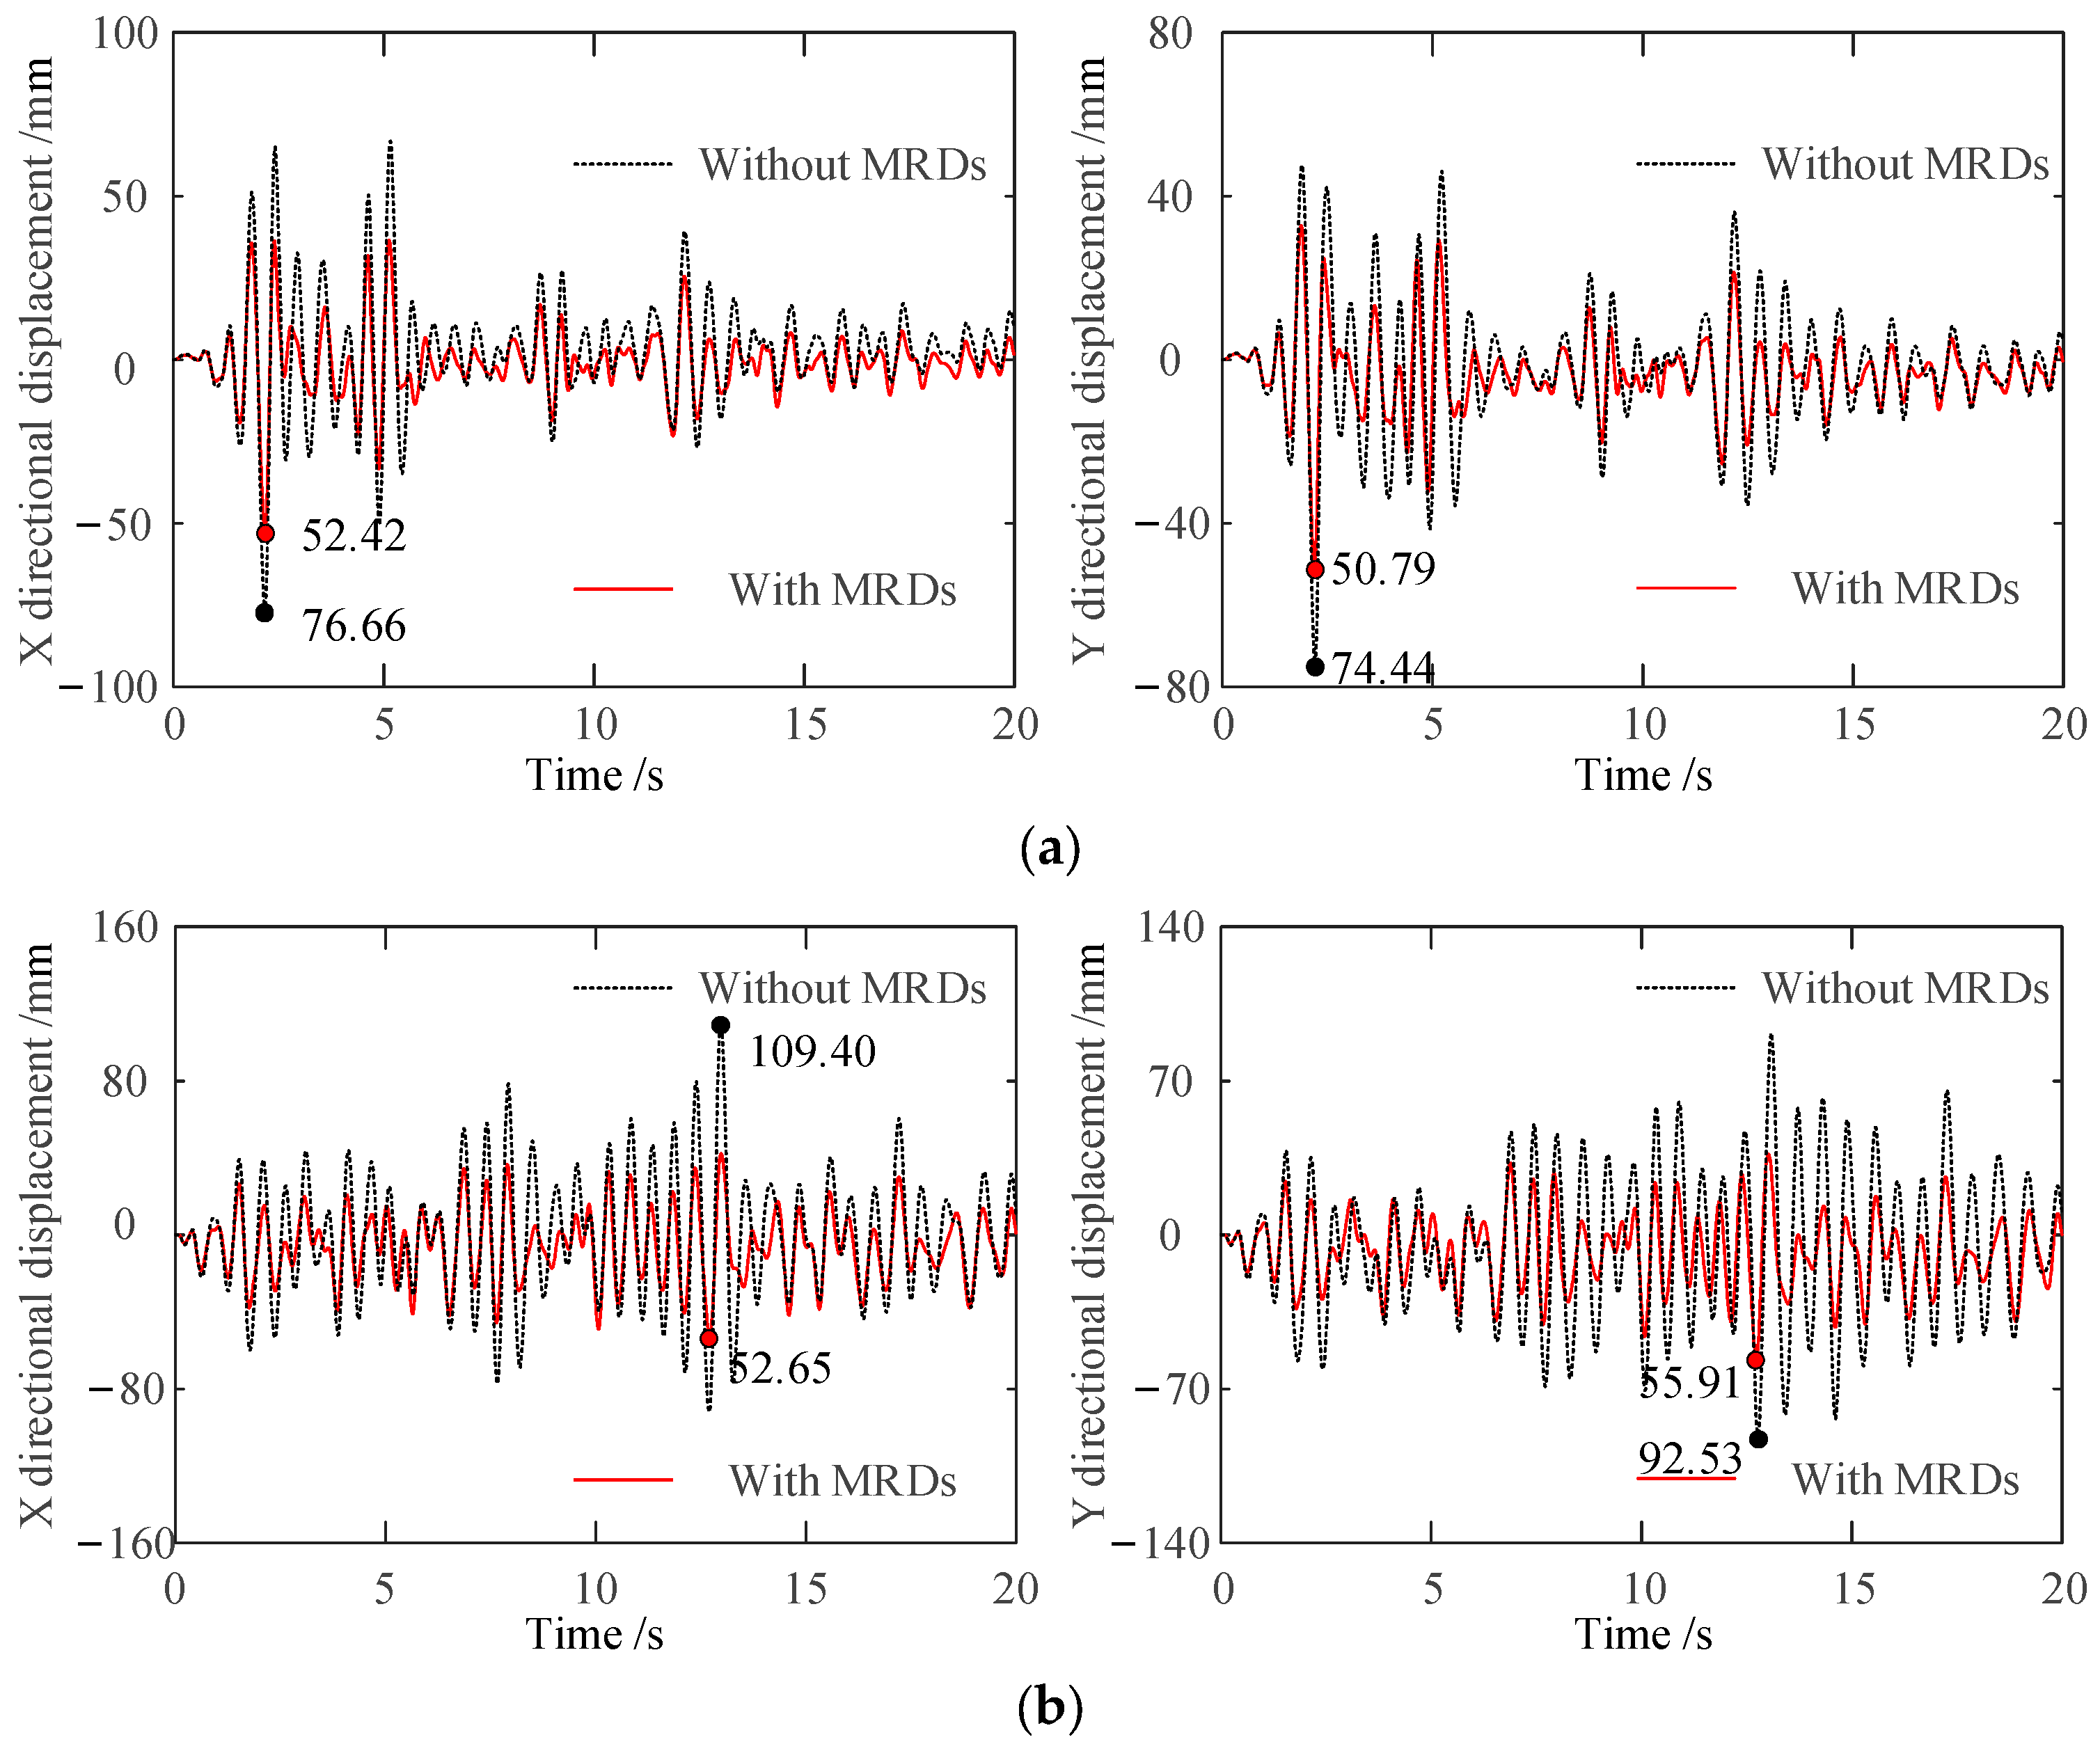
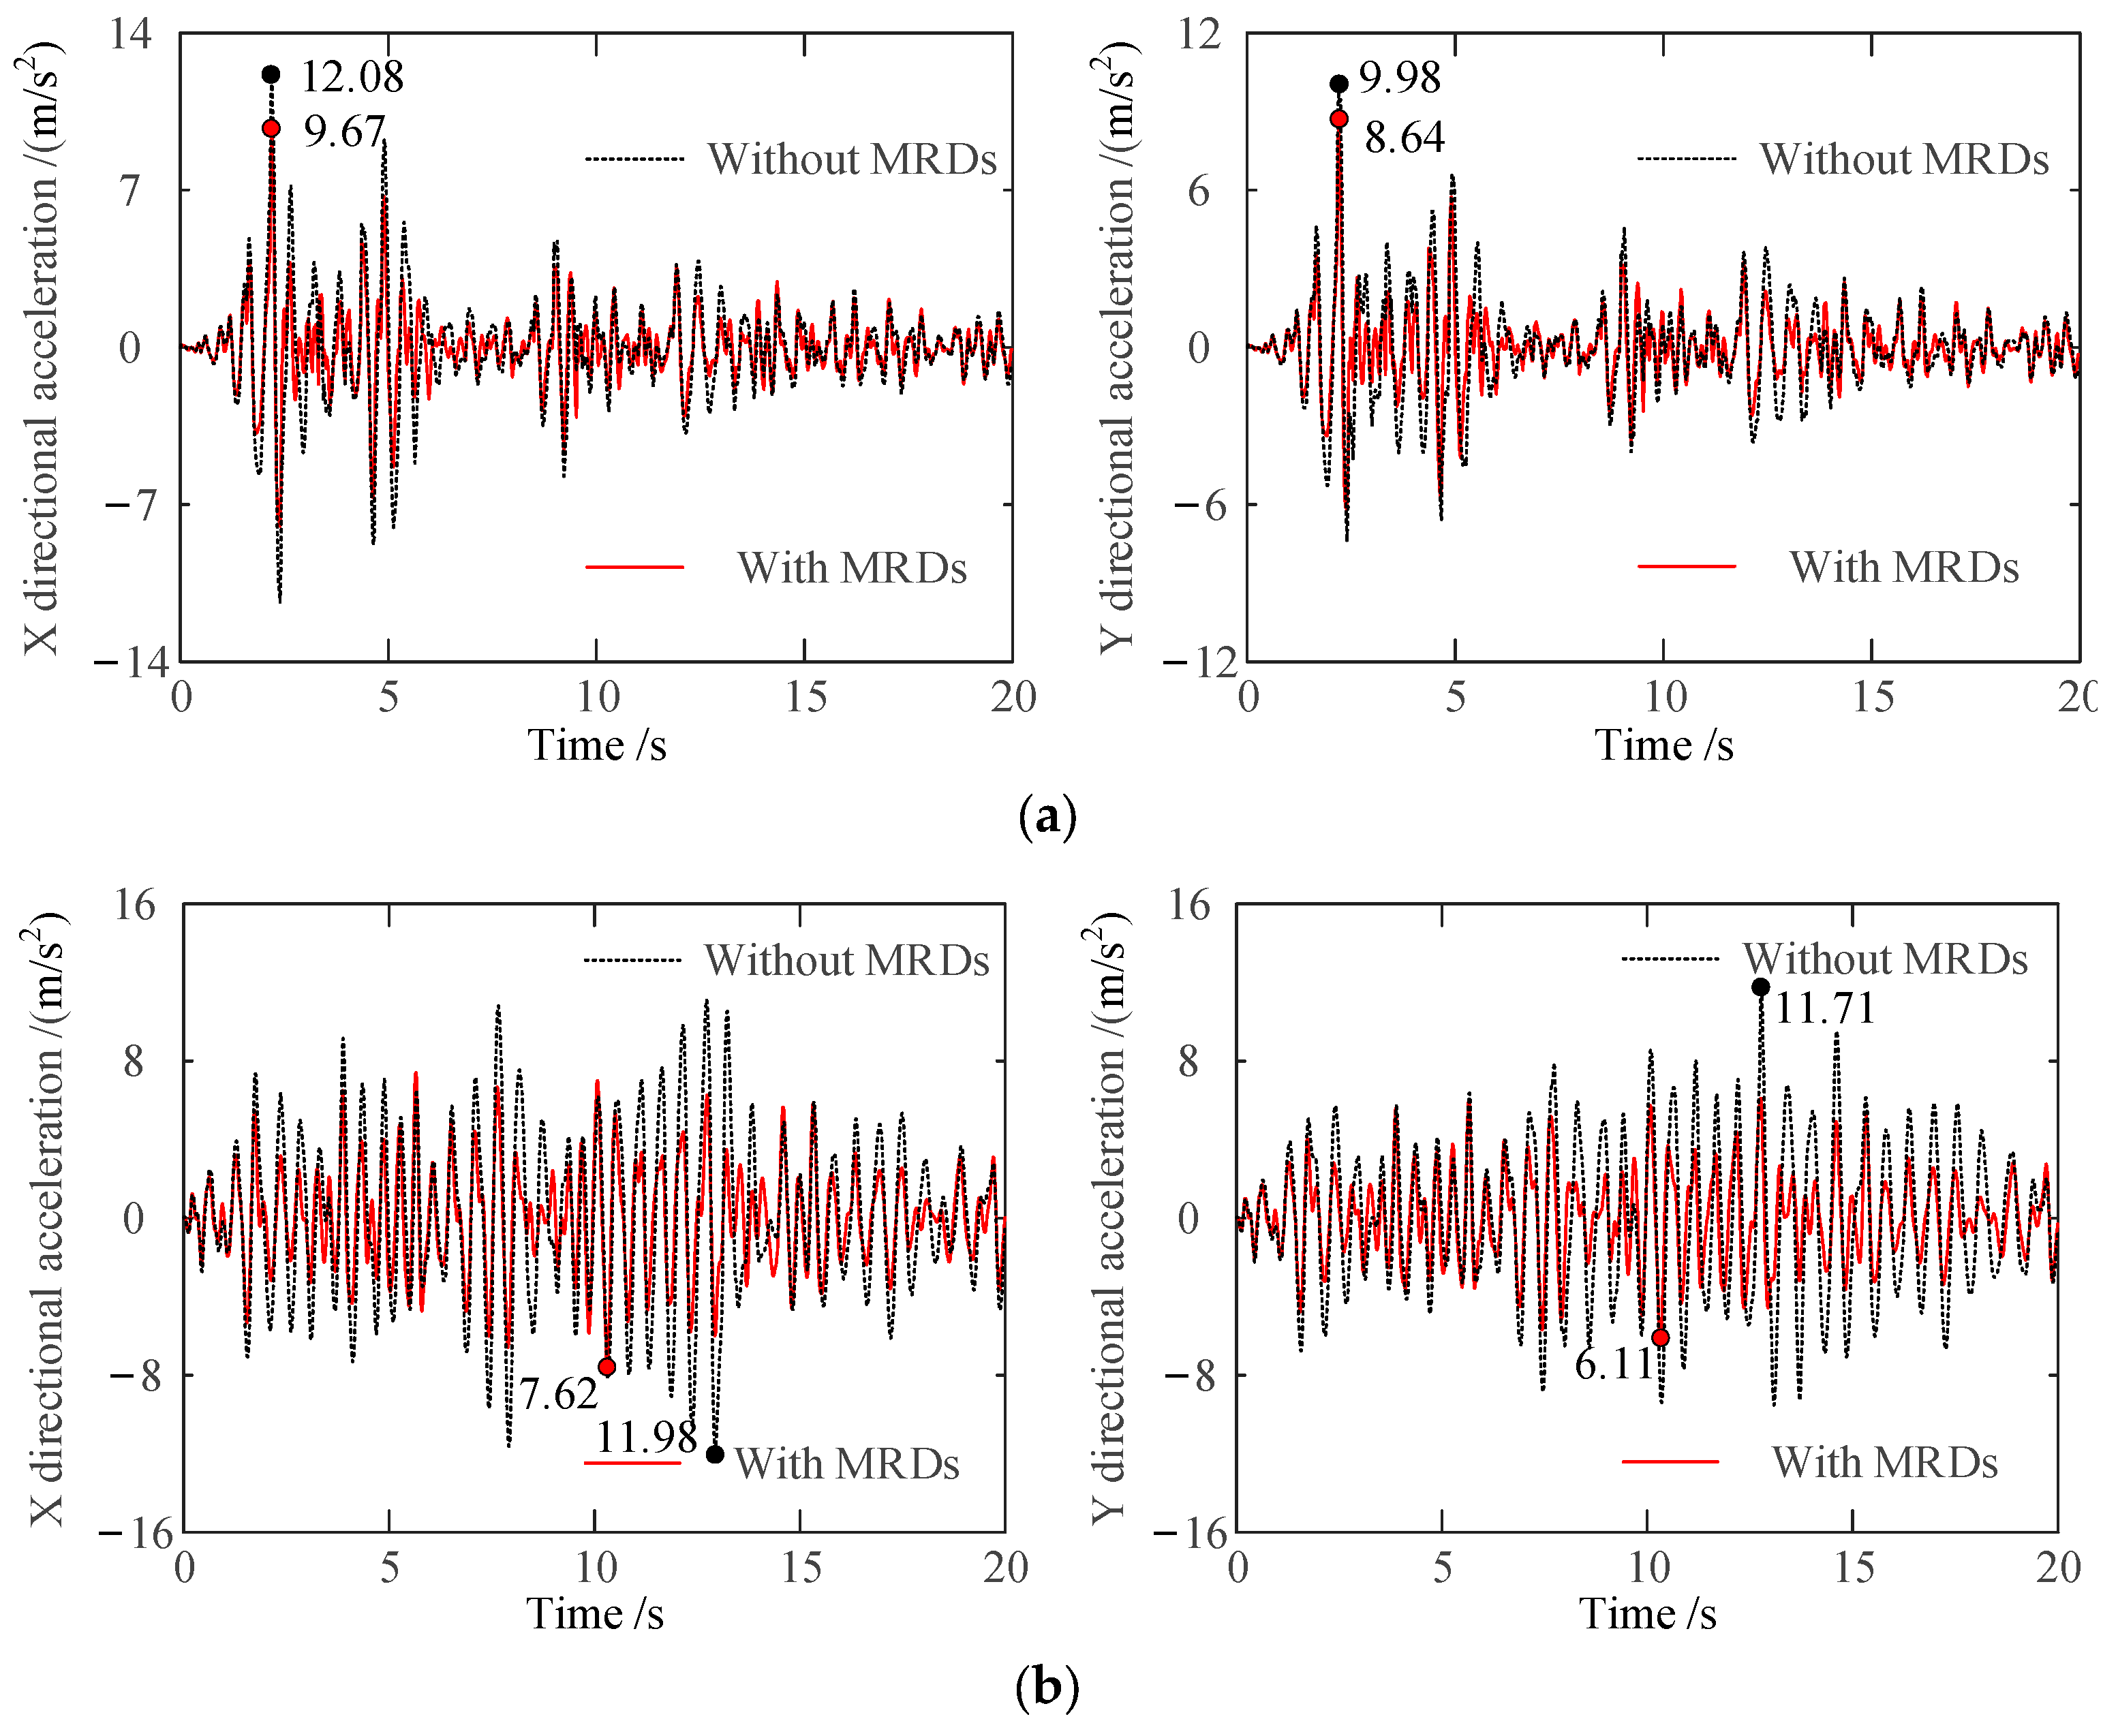
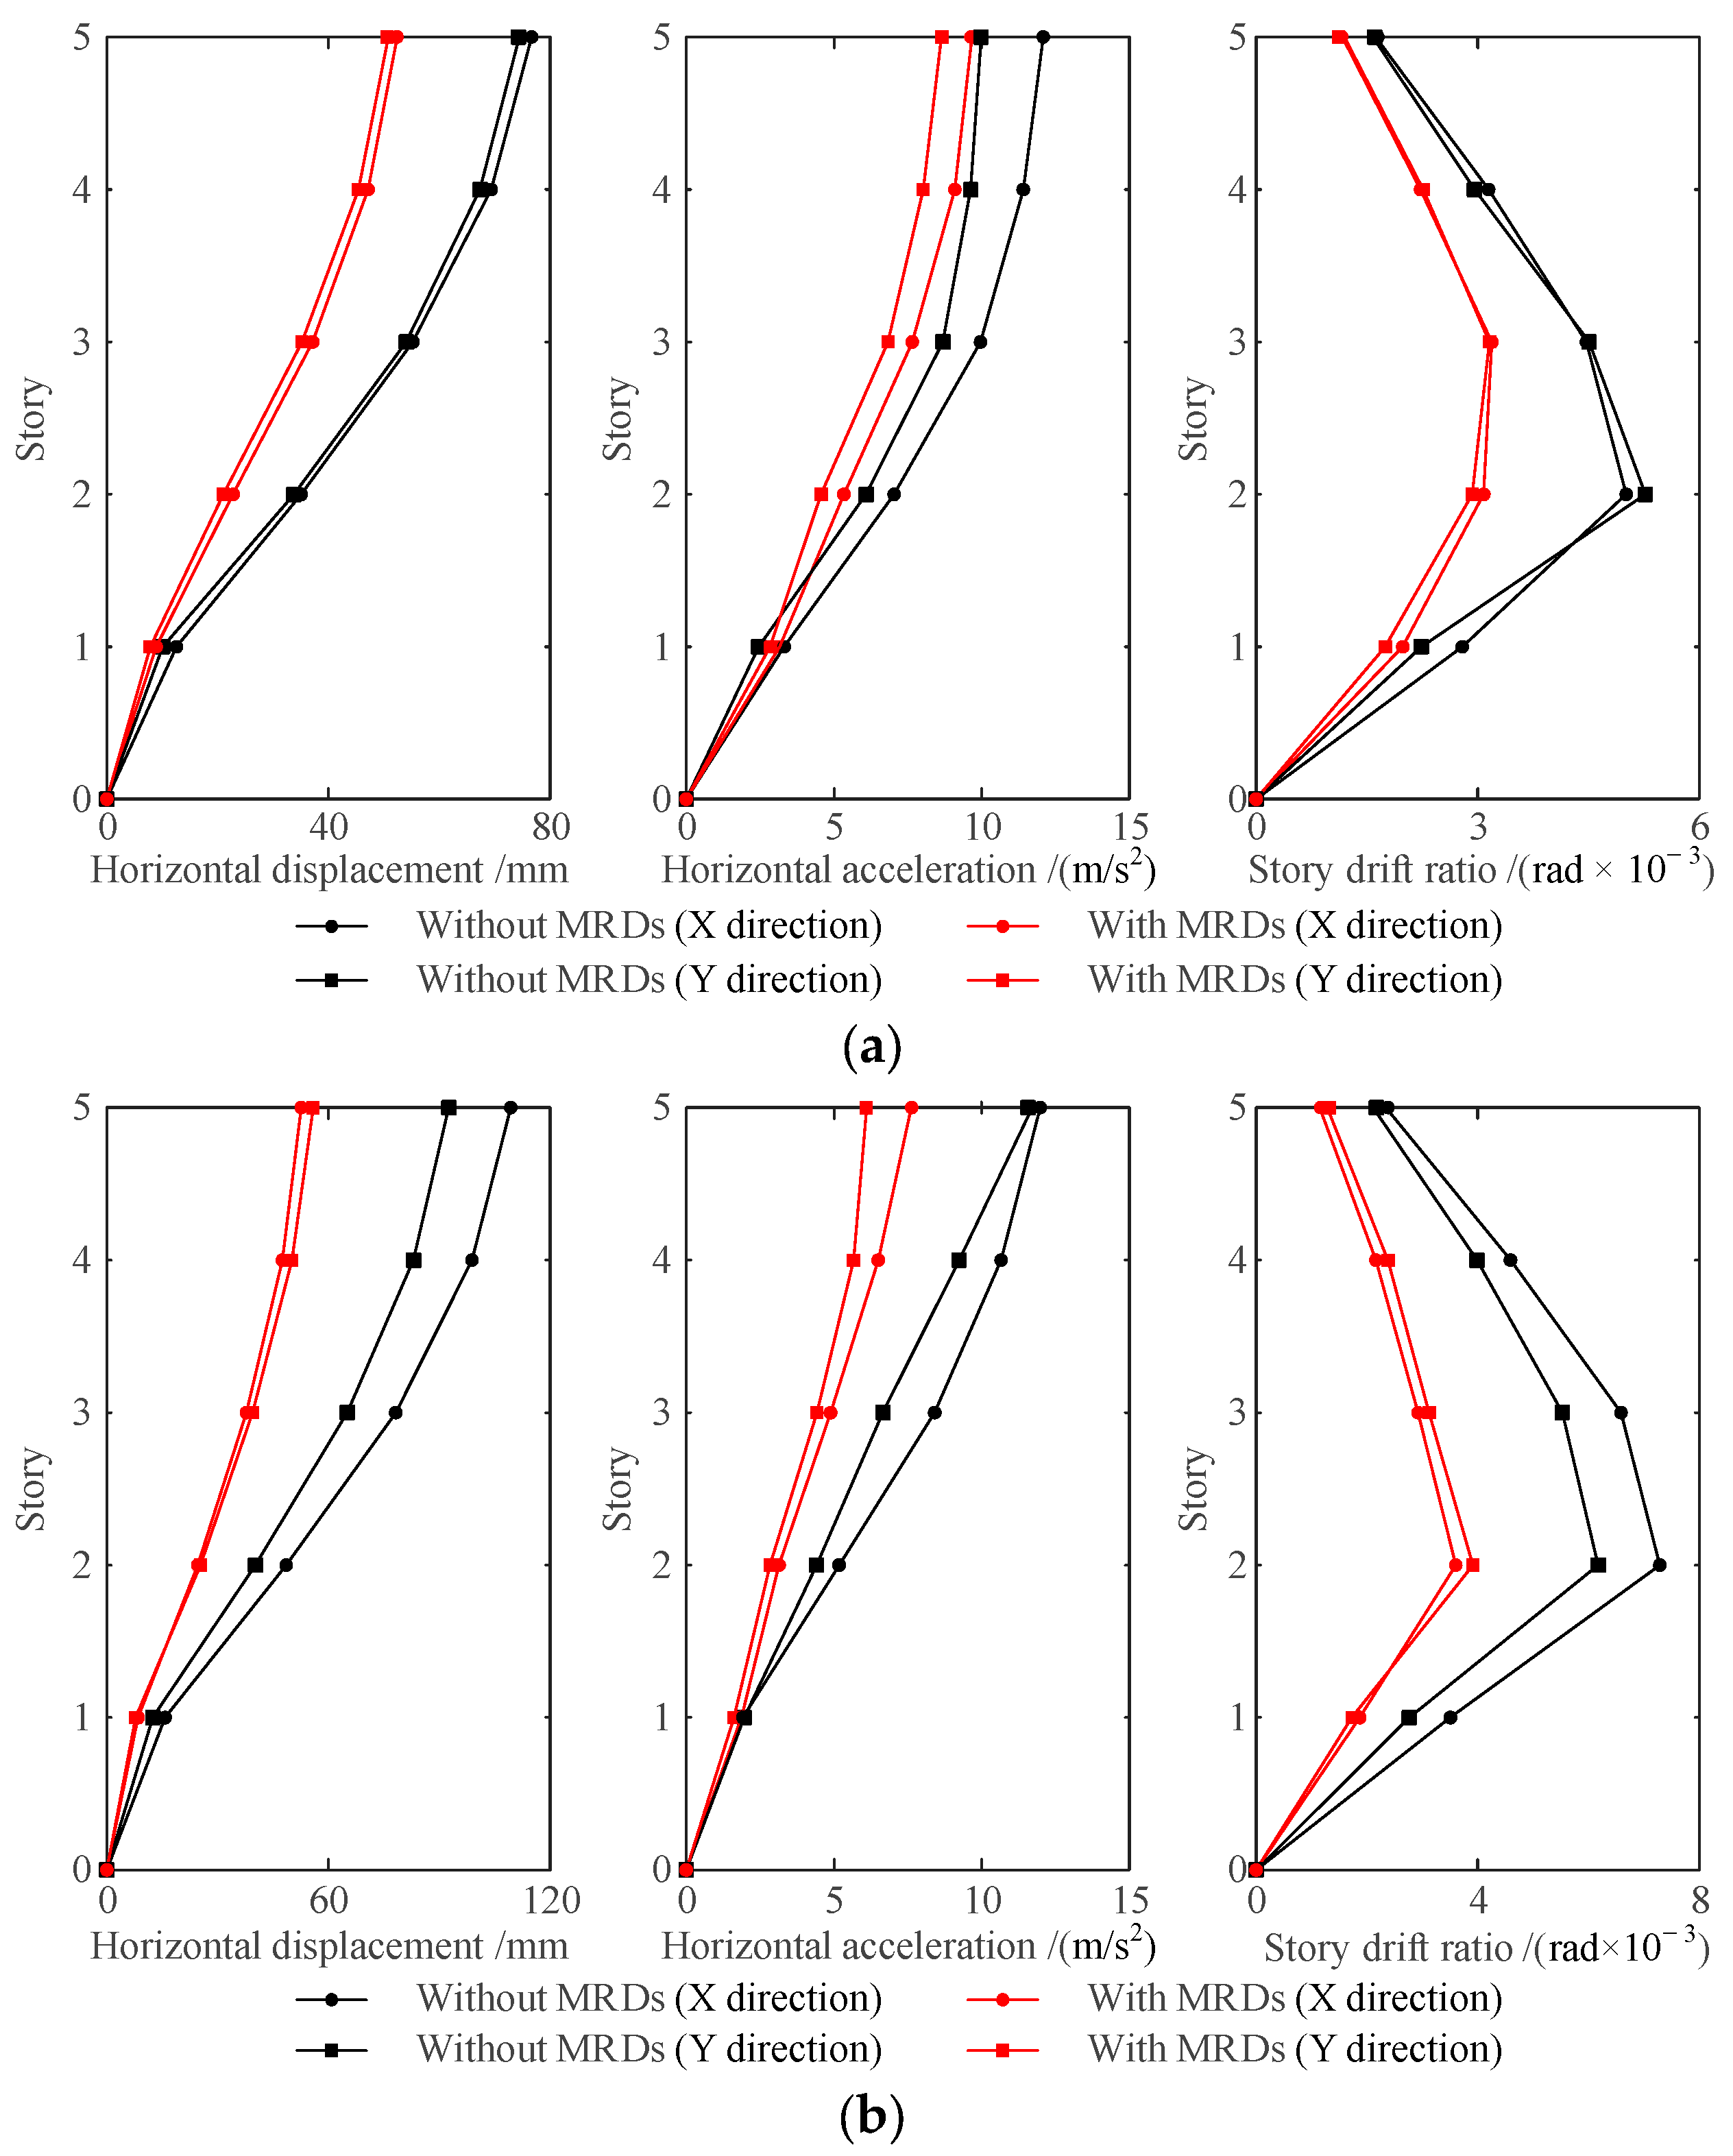
After the MRD is set in the frame structure, the maximum horizontal displacement and acceleration of each story decreases. The maximum displacement and acceleration of the top node 24 on the structure in the X direction and Y direction decreased by 51.87%, 39.59%, 36.67%, and 47.86%, respectively; the decrease in the acceleration is not very significant.
(3)
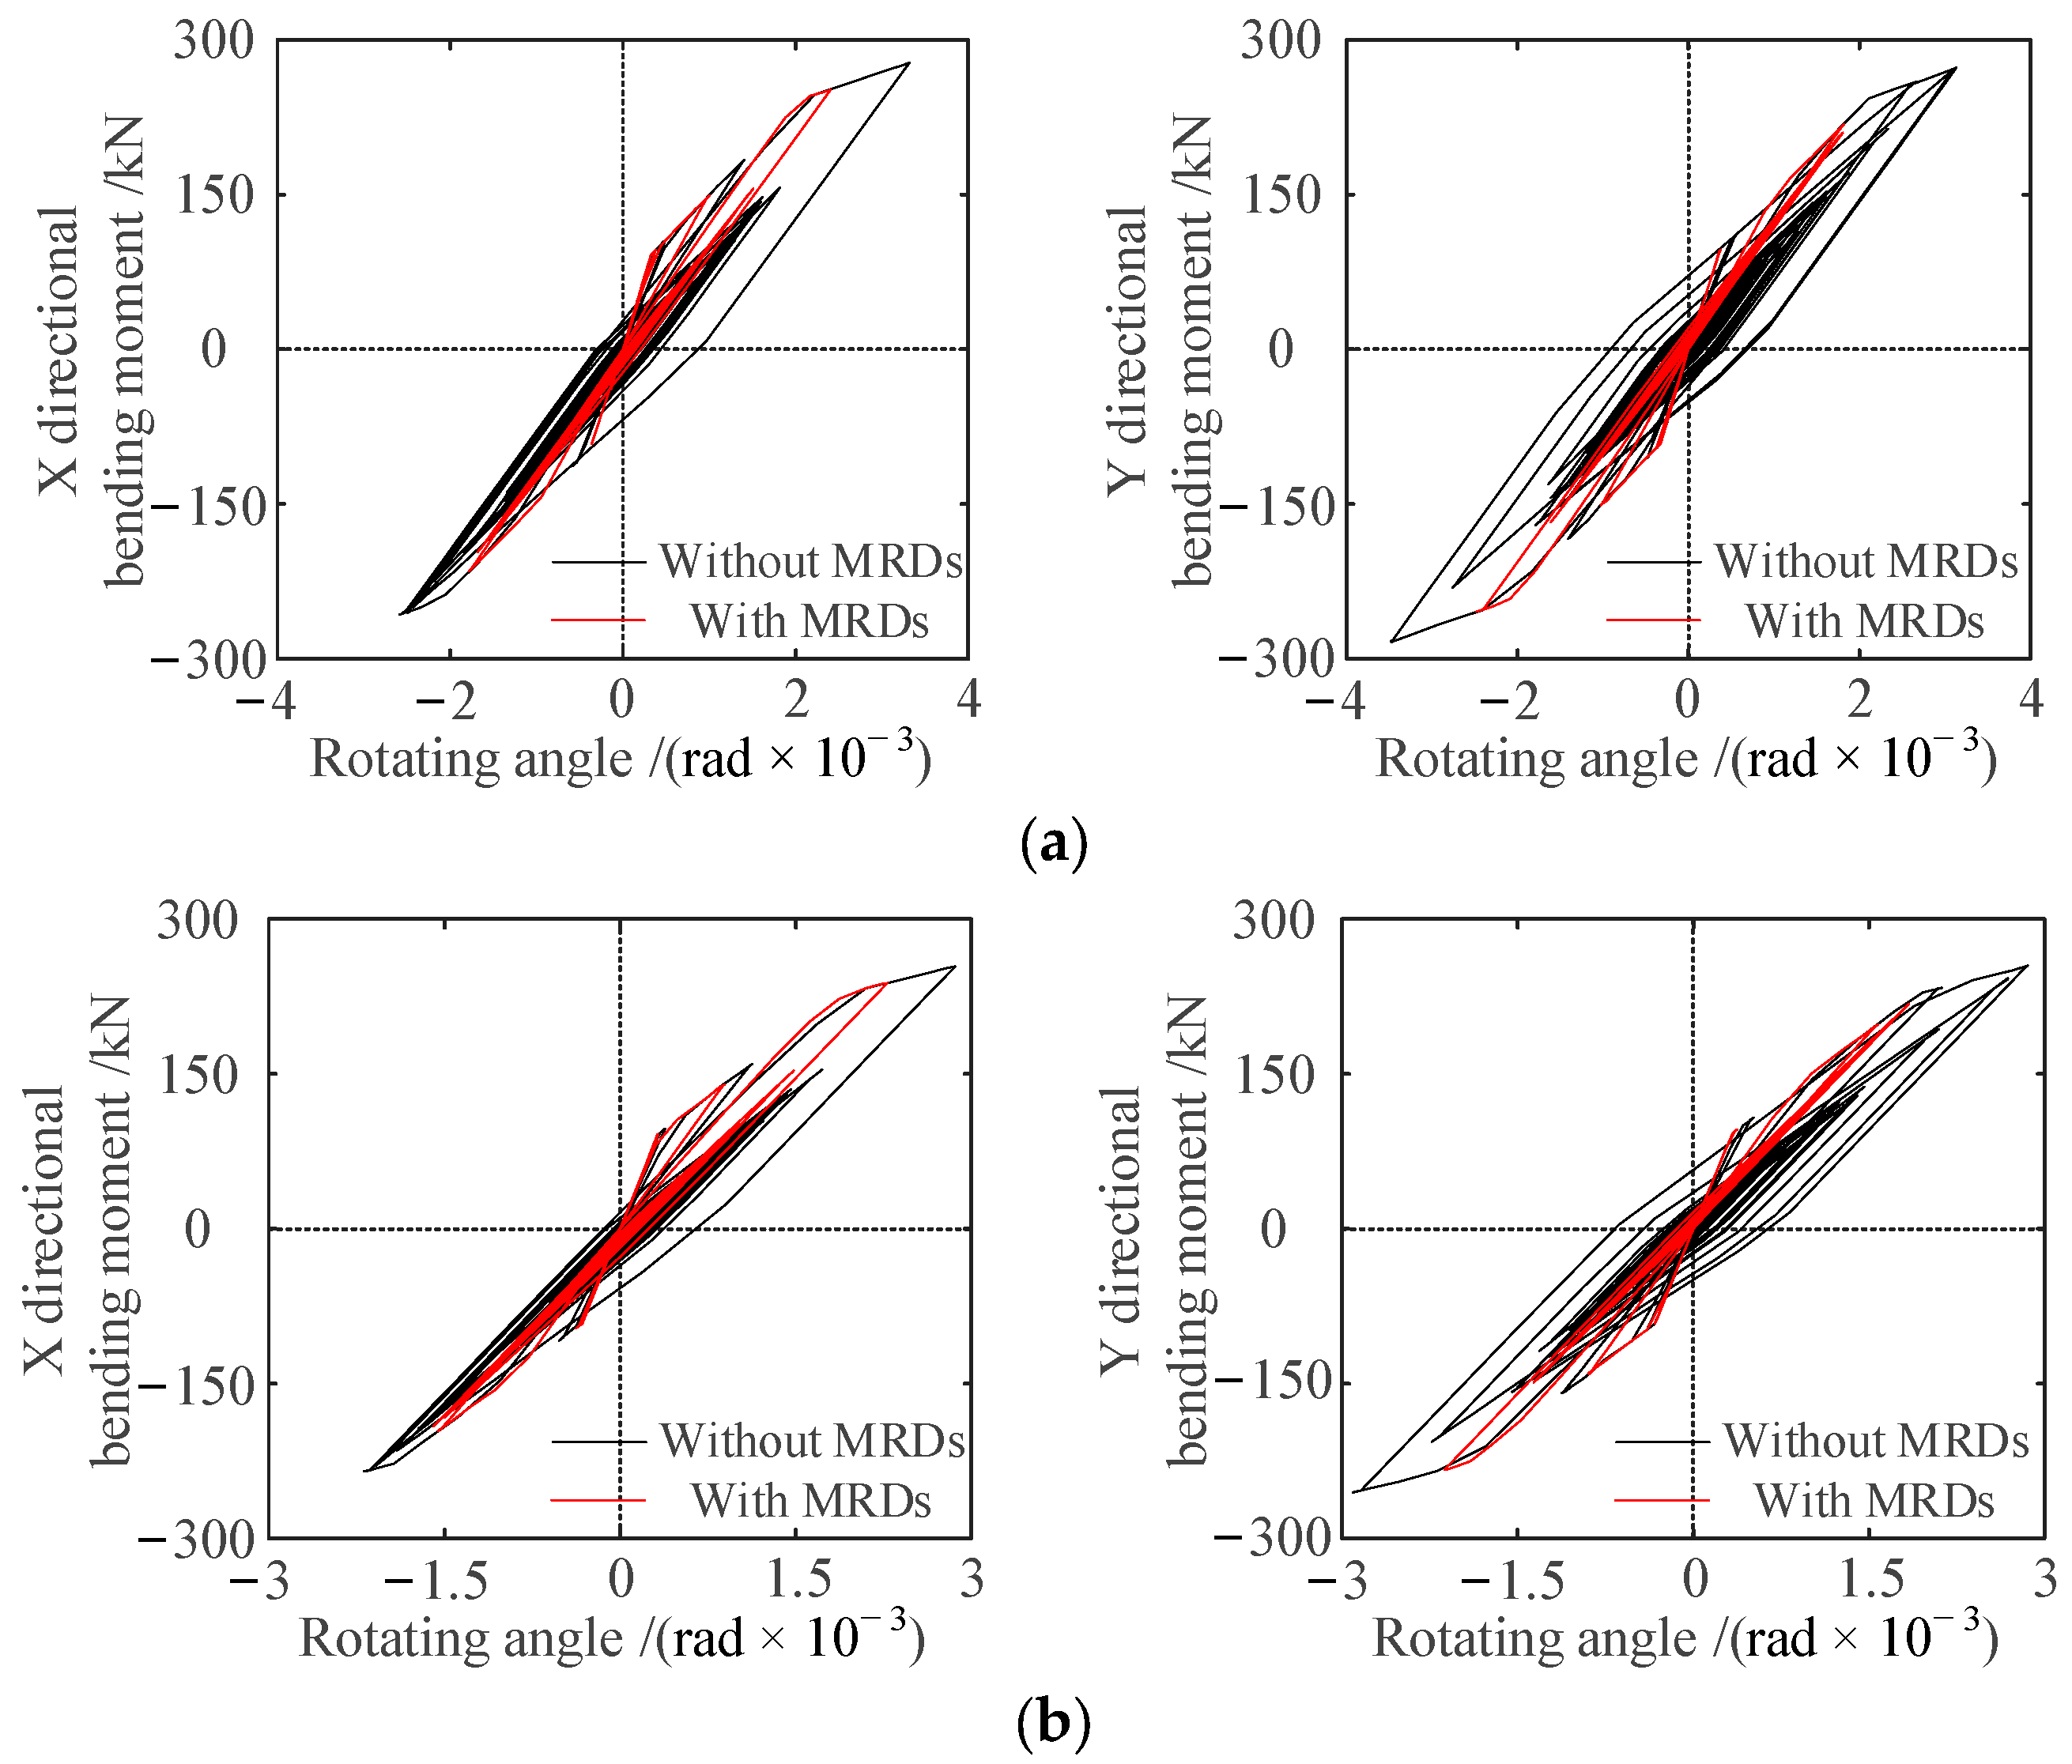
For the frame structure with an MRD, the offset of the displacement time history curve of the column in the third story is weakened and the hysteretic loop area of the structural members is significantly reduced. The maximum residual displacement angle in the X and Y directions of the column in the third story decreased from 1.628 × 10⁻³ rad and 2.101 × 10⁻³ rad to 0.511 × 10⁻³ rad and 0.297 × 10⁻³ rad, indicating that the MRD can effectively consume the vibration energy of the incoming structure and significantly improve the seismic performance of the structure.
(4)
The column end of the frame structure without an MRD appears to be more of a plastic hinge, which is the yield mechanism of the column hinge. Compared with the frame structure without the MRD, after setting the MRD in the structure, the number of plastic hinges in the X direction and Y direction were all reduced by 37.50%. Although some structural members still yield, it will not endanger the safety of the whole structure.

Author Contributions

Conceptualization, methodology, investigation, data curation, and writing—review and editing, X.Z. Software, formal analysis, writing—original draft, visualization, and data curation, C.M. Conceptualization, project administration, supervision, and writing—review and editing, J.Z. Software, validation, methodology, data curation, and review and editing, Y.G. Supervision, project administration, resources, and funding acquisition, Y.S. Data curation, writing—original draft, validation, and funding acquisition, J.Y. All authors have read and agreed to the published version of the manuscript.

Funding

This research was funded by the National Natural Science Foundation of China, grant number 51878621; Program for Changjiang Scholars and Innovative Research Team in University of Minister of Education of China, grant number IRT_16R67.

Institutional Review Board Statement

Not applicable.

Informed Consent Statement

Not applicable.

Data Availability Statement

Not applicable.

Acknowledgments

The authors are grateful for the financial support provided by the National Natural Science Foundation of China and the Program for Changjiang Scholars and Innovative Research Team in the University of the Minister of Education of China.

Conflicts of Interest

The authors declare no conflict of interest.

References

  1. Zhang, X.C.; Zhang, X.; Zhao, Y.X.; Zhao, J.; Xu, Z. Experimental and numerical studies on a composite MR damper considering magnetic saturation effect. Eng. Struct. 2017, 132, 576–585. [Google Scholar] [CrossRef]
  2. Xu, Z.D.; Huang, X.H.; Xu, F.H.; Yuan, J. Parameters optimization of vibration isolation and mitigation system for precision platforms using non-dominated sorting genetic algorithm. Mech. Syst. Signal Process. 2019, 128, 191–201. [Google Scholar] [CrossRef]
  3. Wang, W.X.; Hua, X.G.; Chen, Z.Q.; Wang, X.; Song, G. Modeling, simulation, and validation of a pendulum-pounding tuned mass damper for vibration control. Struct. Control Health Monit. 2019, 26, e2326. [Google Scholar] [CrossRef]
  4. Sakurai, T.; Morishita, S. Seismic response reduction of a three-storey building by an MR grease damper. Front. Mech. Eng. 2017, 12, 224–233. [Google Scholar] [CrossRef]
  5. Xu, Z.D.; Jia, D.H.; Zhang, X.C. Performance tests and mathematical model considering magnetic saturation for magnetorheological damper. J. Intell. Mater. Syst. Struct. 2012, 23, 1331–1349. [Google Scholar] [CrossRef]
  6. Lv, H.Z.; Zhang, S.S.; Sun, Q.; Chen, R.; Zhang, W.J. The dynamic models, control strategies and applications for magnetorheological damping systems: A systematic review. J. Vib. Eng. Technol. 2020, 9, 131–147. [Google Scholar] [CrossRef]
  7. Parlak, Z.; Engin, T. Time-dependent CFD and quasi-static analysis of magnetorheological fluid dampers with experimental validation. Int. J. Mech. Sci. 2012, 64, 22–31. [Google Scholar] [CrossRef]
  8. Xu, Z.D.; Sha, L.F.; Zhang, X.C.; Ye, H.-H. Design, performance test and analysis on magnetorheological damper for earthquake mitigation. Struct. Control Health Monit. 2013, 20, 956–970. [Google Scholar] [CrossRef]
  9. Zemp, R.; De la Llera, J.C.; Weber, F. Experimental analysis of large capacity MR dampers with short- and long-stroke. Smart Mater. Struct. 2014, 23, 125028. [Google Scholar] [CrossRef]
  10. Zhang, X.C.; Xu, Z.D. Testing and modeling of a CLEMR damper and its application in structural vibration reduction. Nonlinear Dynamics 2012, 70, 1575–1588. [Google Scholar] [CrossRef]
  11. Jiang, R.L.; Rui, X.T.; Zhu, W.; Yang, F.; Zhang, Y.; Gu, J. Design of multi-channel bypass magnetorheological damper with three working modes. Int. J. Mech. Mater. Des. 2022, 18, 155–167. [Google Scholar] [CrossRef]
  12. Raju, K.R.; Jame, A.; Gopalakrishnan, N.; Muthumani, K.; Iyer, N.R. Experimental studies on seismic performance of three-storey steel moment resisting frame model with scissor-jack-magnetorheological damper energy dissipation systems. Struct. Control Health Monit. 2014, 21, 741–755. [Google Scholar] [CrossRef]
  13. Cruze, D.; Gladston, H.; Farsangi, E.N.; Banerjee, A.; Loganathan, S.; Solomon, S.M. Seismic performance evaluation of a recently developed magnetorheological damper: Experimental investigation. Pract. Period. Struct. Des. Constr. 2021, 26, 04020061. [Google Scholar] [CrossRef]
  14. Rakshita, R.; Daniel, C.; Hemalatha, G.; Sarala, L.; Tensing, D.; Manoharan, S.S. Studies on modeling and control of RCC frame with MR damper. Smart Technol. Sustain. Dev. 2021, 78, 223–234. [Google Scholar]
  15. Chae, Y.; Ricles, J.M.; Sause, R. Large-scale real-time hybrid simulation of a three-story steel frame building with magneto-rheological dampers. Earthq. Eng. Struct. Dyn. 2014, 43, 1915–1933. [Google Scholar] [CrossRef]
  16. Aggumus, H.; Cetin, S. Experimental investigation of semiactive robust control for structures with magnetorheological dampers. J. Low Freq. Noise Vib. Act. Control 2018, 37, 216–234. [Google Scholar] [CrossRef] [Green Version]
  17. Eltahawy, W.; Ryan, K.; Cesmeci, S.; Gordaninejad, F. Displacement/velocity-based control of a liquid spring—MR damper for vertical isolation. Struct. Control Health Monit. 2019, 26, e2363. [Google Scholar] [CrossRef]
  18. Bhaiya, V.; Shrimali, M.K.; Bharti, S.D.; Datta, T.K. Modified semi-active control with MR dampers for partially observed systems. Eng. Struct. 2019, 191, 129–147. [Google Scholar] [CrossRef]
  19. Li, L.Y.; Liang, H.Z. Semiactive control of structural nonlinear vibration considering the MR damper model. J. Aerosp. Eng. 2018, 31, 04018095. [Google Scholar] [CrossRef]
  20. Zafarani, M.M.; Halabian, A.M. Supervisory adaptive nonlinear control for seismic alleviation of inelastic asymmetric buildings equipped with MR dampers. Eng. Struct. 2018, 176, 849–858. [Google Scholar] [CrossRef]
  21. Zhao, J.; Li, K.; Zhang, X.C.; Sun, Y.; Xu, Z. Multidimensional vibration reduction control of the frame structure with magnetorheological damper. Struct. Control Health Monit. 2020, 27, e2572. [Google Scholar] [CrossRef]
  22. Xu, F.H.; Xu, Z.D.; Zhang, X.C. Study on the space frame structures incorporated with magnetorheological dampers. Smart Struct. Syst. 2017, 19, 279–288. [Google Scholar] [CrossRef]
  23. Xu, L.H.; Li, Z.X.; Lv, Y. Nonlinear seismic damage control of steel frame-steel plate shear wall structures using MR dampers. Earthq. Struct. 2014, 7, 937–953. [Google Scholar] [CrossRef]
  24. Xu, L.H.; Xie, X.S.; Li, Z.X. Seismic performances of magnetorheological flag-shaped damping braced frame structures. Smart Mater. Struct. 2020, 29, 075032. [Google Scholar] [CrossRef]
  25. Dai, J.; Xu, Z.D.; Gai, P.P.; Hu, Z.-W. Optimal design of tuned mass damper inerter with a Maxwell element for mitigating the vortex-induced vibration in bridges. Mech. Syst. Signal Process. 2021, 148, 107180. [Google Scholar] [CrossRef]
  26. Xu, Z.D.; Yang, Y.; Miao, A.N. Dynamic analysis and parameter optimization of pipelines with multidimensional vibration isolation and mitigation device. J. Pipeline Syst. Eng. Pract. 2021, 12, 04020058. [Google Scholar] [CrossRef]
  27. Lu, H.; Xu, Z.D.; Iseley, T.; Matthews, J.C. Novel data-driven framework for predicting residual strength of corroded pipelines. J. Pipeline Syst. Eng. Pract. 2021, 12, 04021045. [Google Scholar] [CrossRef]
  28. Ge, T.; Xu, Z.D.; Yuan, F.G. Predictive model of dynamic mechanical properties of VE damper based on acrylic rubber–graphene oxide composites considering aging damage. J. Aerosp. Eng. 2022, 35, 04021132. [Google Scholar] [CrossRef]
  29. Sun, B.; Liu, X.; Xu, Z.D. A Multiscale Bridging Material Parameter and Damage Inversion Algorithm from Macroscale to Mesoscale Based on Ant Colony Optimization. J. Eng. Mech. 2022, 148, 04021150. [Google Scholar] [CrossRef]
  30. Li, H.; Xu, Z.D.; Gomez, D.; Gai, P.; Wang, F.; Dyke, S.J. A modified fractional-order derivative zener model for rubber-like devices for structural control. J. Eng. Mech. 2022, 148, 04021119. [Google Scholar] [CrossRef]
  31. You, J.T.; Yang, Y.; Fan, Y.F.; Zhang, X. Seismic response study of L-shaped frame structure with magnetorheological dampers. Appl. Sci. 2022, 12, 5976. [Google Scholar] [CrossRef]
  32. Xu, Z.D.; Guo, Y.Q. Fuzzy control method for earthquake mitigation structures with magnetorheological dampers. J. Intell. Mater. Syst. Struct. 2006, 17, 871–881. [Google Scholar] [CrossRef]
  33. Panagiotakos, T.B.; Fardis, M.N. Deformations of reinforced concrete members at yielding and ultimate. ACI Struct. J. 2001, 98, 135–148. [Google Scholar]
  34. Rao, S.S. The Finite Element Method in Engineering, 6th ed.; Butterworth-Heinemann: Oxford, UK, 2017. [Google Scholar]
  35. Vaiana, N.; Rosati, L. Classification and unified phenomenological modeling of complex uniaxial rate-independent hysteretic responses. Mech. Syst. Signal Process. 2022, 182, 1132. [Google Scholar] [CrossRef]
  36. Vaiana, N.; Sessa, S.; Marmo, F.; Rosati, L. A class of uniaxial phenomenological models for simulating hysteretic phenomena in rate-independent mechanical systems and materials. Nonlinear Dyn. 2018, 93, 1647–1669. [Google Scholar] [CrossRef]
  37. Vaiana, N.; Sessa, S.; Rosati, L. A generalized class of uniaxial rate-independent models for simulating asymmetric mechanical hysteresis phenomena. Mech. Syst. Signal Process. 2021, 146, 2162. [Google Scholar] [CrossRef]
  38. Yang, H.X.; Shen, T.; Yao, J.G. Study on Earthquake Response Analysis of Reinforced Concrete Masonry Structure. Adv. Mater. Res. 2011, 1336, 244–248. [Google Scholar] [CrossRef]
  39. Vaiana, N.; Sessa, S.; Marmo, F.; Rosati, L. Nonlinear dynamic analysis of hysteretic mechanical systems by combining a novel rate-independent model and an explicit time integration method. Nonlinear Dyn. 2019, 98, 2879–2901. [Google Scholar] [CrossRef]
  40. Vaiana, N.; Sessa, S.; Paradiso, M.; Marmo, F.; Rosati, L. An Efficient Computational Strategy for Nonlinear Time History Analysis of Seismically Base-Isolated Structures. In Proceedings of the AIMETA 2019 XXIV Conference, Rome, Italy, 15–19 September 2019; Springer: Cham, Switzerland, 2020; pp. 1340–1353, Lecture Notes in Mechanical Engineering. [Google Scholar]
  41. Motra, G.B.; Mallik, W.; Chandiramani, N.K. Semi-active vibration control of connected buildings using magnetorheological dampers. J. Intell. Mater. Syst. Struct. 2011, 22, 1811–1827. [Google Scholar] [CrossRef]
  42. Ubaidillah, H.K.; Kadir, F.A.A. Modelling, characterisation and force tracking control of a magnetorheological damper under harmonic excitation. Int. J. Model. Identif. Control 2011, 13, 9–21. [Google Scholar] [CrossRef] [Green Version]
  43. Russo, R.; Terzo, M. Modelling, parameter identification, and control of a shear mode magnetorheological device. Proc. Inst. Mech. Eng. Part I-J. Syst. Control. Eng. 2011, 225, 549–562. [Google Scholar] [CrossRef]
  44. Weber, F. Robust force tracking control scheme for MR dampers. Struct. Control Health Monit. 2015, 22, 1373–1395. [Google Scholar] [CrossRef]
Figure 1. Three-fold linear stiffness retrograde model of RC beam–column element.
Actuators 11 00362 g001
Figure 2. Three-segment variable stiffness model of the RC beam and column member.
Actuators 11 00362 g002
Figure 3. Schematic diagram of test loading equipment.
Actuators 11 00362 g003
Figure 4. Damping force-displacement hysteresis loops of MRD at different current. (a) Current 0A; (b) current 0.14A; (c) current 0.28A.
Actuators 11 00362 g004
Figure 5. The schematic diagram of damping force distribution.
Actuators 11 00362 g005
Figure 6. Three-dimensional diagram of the RC frame structure with and without an MRD (unit: m). (a) Without MRDs; (b) with MRDs.
Actuators 11 00362 g006
Figure 7. Reinforcement of the beams and columns (unit: mm). (a) Column; (b) X directional beam; (c) Y directional beam.
Actuators 11 00362 g007
Figure 8. Calculation flowchart of elastic–plastic time history analysis program.
Actuators 11 00362 g008
Figure 9. Comparison of horizontal bidirectional total displacement response of node 24 of RC frame structure. (a) Under the action of El-Centro wave; (b) under the action of Tangshan wave.
Actuators 11 00362 g009
Figure 10. Comparison of horizontal bidirectional total acceleration response of node 24 of RC frame structure. (a) Under the action of El-Centro wave; (b) under the action of Tangshan wave.
Actuators 11 00362 g010
Figure 11. Envelope diagram of maximum horizontal displacement, acceleration and story drift ratio of RC frame structure. (a) Under the action of El-Centro wave; (b) under the action of Tangshan wave.
Actuators 11 00362 g011
Figure 12. Bending moment-angle hysteresis loops of RC frame structures with and without MRD under El-Centro waves. (a) The column in third story; (b) the column in fourth story.
Actuators 11 00362 g012
Figure 13. Bending moment-angle hysteresis loops of RC frame structures with and without MRD under Tangshan waves. (a) The column in third story; (b) the column in fourth story.
Actuators 11 00362 g013
Figure 14. Plastic hinges distribution of RC frame structure with and without MRD under seismic waves. (a) X direction; (b) Y direction.
Actuators 11 00362 g014
Table 1. Comparison of structural natural frequencies.
Natural Frequencies1st2nd3rd4th5th6th7th8th9th10th
ANSYS0.7590.8230.8962.3712.5592.7774.3224.4414.9406.352
MATLAB0.7490.8100.8812.3482.5242.7494.2554.4874.8776.315
Relative error (%)1.291.590.950.971.361.001.54−1.031.280.58
Table 2. The maximum residual displacement angle of column bottom of RC frame structure under seismic wave (rad × 10−3).
Story (Node)El-Centro WaveTangshan Wave
Without MRDWith MRDWithout MRDWith MRD
X-DirectionY-DirectionX-DirectionY-DirectionX-DirectionY-DirectionX-DirectionY-Direction
1(4)00000000
2(8)0.4120.8280.0140.0171.1371.6860.0310.069
3(12)0.9230.9140.2050.1881.6282.1010.5110.297
4(16)0.6480.6720.2410.1411.2171.5620.2640.065
5(20)0.2050.133000.5610.62000
Publisher’s Note: MDPI stays neutral with regard to jurisdictional claims in published maps and institutional affiliations.

