Article

Visualization of the Electrohydrodynamic and Thermal Effects of AC-DBD Plasma Actuators of Plate- and Wire-Exposed Electrodes

Department of Mechanical Systems Engineering, Tokyo University of Agriculture and Technology, Koganei, Tokyo 184-8588, Japan
*
Author to whom correspondence should be addressed.
Submission received: 15 December 2021 / Revised: 16 January 2022 / Accepted: 23 January 2022 / Published: 25 January 2022
(This article belongs to the Special Issue Dielectric Barrier Discharge Plasma Actuator for Active Flow Control)

Abstract

:
The dielectric barrier discharge plasma actuator is a promising flow control device that uses surface discharge. The actuator generates an electrohydrodynamic force and Joule heating that contribute to the flow control. Thus, it is important to investigate the electrohydrodynamic and thermal effects on the air flow. To this end, the flow velocity field, density field, and surface temperature distribution induced by an alternating current dielectric barrier discharge plasma actuator were experimentally examined, adopting particle image velocimetry, the background oriented schlieren technique, and an infrared camera. These experiments were conducted for plate- and wire-exposed electrode plasma actuators to investigate the effect of the shape of the exposed electrode. It was confirmed that the topology of the discharge is different between the two types of plasma actuators. This results in a difference in the spatial distributions of the velocity and density fields between the two actuators. In particular, we clarified that there is an obvious difference in the peak position of the density and temperature distribution between the two actuators. We also confirmed that the difference in the spatial distribution of the vertical velocity makes the above difference.

1. Introduction

A dielectric barrier discharge (DBD) plasma actuator (PA) is an aerodynamic flow control device that has been studied for more than two decades [1,2,3]. As shown in Figure 1, a typical PA comprises of two plate electrodes and a dielectric. One electrode is exposed to the surrounding air, and the other is asymmetrically located on the opposite side of the dielectric and electrically grounded. When applying a high voltage between the two electrodes, the surface DBD is energized on the exposed electrode side and plasma is generated. The PA manipulates the airflow, through the interaction between the plasma and surrounding air molecules. Because of a simple structure, no mechanical moving parts, and high active controllability, the PA is expected to improve the performance of various types of fluid machinery (e.g., airfoils [4,5], trucks [6,7], and turbine blades [8]).
Two well-known phenomena occur when the PA is driven in the discharge region and acts on the surrounding air. One is the generation of an electrohydrodynamic (EHD) force, and the other is thermal effects. In the discharge region, the charged particles are accelerated by a Coulomb force. The EHD force is generated by the momentum exchange collision between the charged and neutral particles, and a wall-surface jet then forms along the surface [9,10]. The thermal effects, generated by the PA, are composed of two heating mechanisms: the Joule and dielectric heating. Here, the dielectric heating caused by the externally applied electric field [11,12] was reported to have small contribution to the heat generation of PAs by Shen et al. [12], and the thermal effect is mainly due to the Joule heating. In the Joule heating, the charged particles absorb the electric field energy through their motion (i.e., the discharge current) and particle collisions (electrical resistivity). The Joule heating of the charged particles causes the gas heating, resulting in pressure and density perturbation in the gas [13,14]. The gas heating phenomenon in an atmospheric discharge is explained as follows. Through the particle collisions, the energy absorbed by ions is totally and instantaneously transferred into gas heating [15]. On the other hand, a part of the energy absorbed by electrons is transferred into gas heating through two processes [16,17]. One is an isochoric process known as the fast gas heating process. It is caused by the quenching process of the electronically excited molecules. The other is an isobaric process. It is known as the slow gas heating process and caused by the energy relaxation process of the vibrationally excited molecules. The increase in gas temperature causes the heating of the dielectric surface, due to the heat transfer. The ionization energy is also released into the dielectric as heat, through the recombination on the dielectric surface. Note that, in the atmospheric discharge, it is expected that the gas heating effect has dominant impact because of frequent particle collisions.
It is believed that the EHD force and thermal effects, respectively, work dominantly as a flow control mechanism when an alternating current voltage (in the case of ac-DBDPAs) [3,4] and nanosecond pulsed voltage (in the case of ns-DBDPAs) [5,13] are applied. The velocity of the jet induced by the ac-DBDPA is up to several meters per second [1,2,3,4,6]. The ac-DBDPA is expected to be used for low-Reynolds-number flow (Re < 105), owing to its versatility. The jet velocity of the ns-DBDPA is much weaker than that of the ac-DBDPA. Little et al. [18] obtained the velocity profiles of ac- and ns-DBDPAs driven in quiescent air and observed the weak EHD effect of the ns-DBDPA. Nevertheless, the ns-DBDPA can control high-speed flow (106 < Re). It is believed that the mechanism of the flow control of the ns-DBDPA is not the EHD force effect but the density fluctuation and resulting flow instability caused by the Joule heating [5,14].
Many quantitative investigations have revealed the characteristics of the EHD force through thrust or velocity measurements [10,19,20,21,22,23,24]. In particular, in an effort to expand the practical use of the PA, improving performance by enhancing the EHD force and jet velocity has been a main topic of research. Many approaches have been adopted, e.g., optimizing the applied voltage waveform [23,25], installing an additional electrode [26], and using several PAs in series [27]. Another approach is the optimization of the shape of the exposed electrode. A serrated exposed electrode can generate a jet uniformly along the spanwise direction, which improves thrust [26,28]. It has also been reported that the wire-PA can improve the jet velocity [28,29,30]. The use of a wire electrode instead of a plate electrode modifies the topology of the discharge, and it results in a higher jet velocity and force efficiency (i.e., thrust/power consumption ratio). Meanwhile, the effect of Joule heating on ambient air has been investigated through the visualization of the density perturbation of the heated gas. Almost all relevant studies have used the schlieren method to obtain the qualitative characteristics of the density field of the ns-DBDPA [5,13,14,31]. It has been clarified that the ns-DBDPA induces a shock wave and hot plume, owing to the plasma discharge. Although the Joule heating is dominant in the case of the ns-DBDPA, it affects the ambient air, even in the case of the ac-DBDPA. Liu et al. [32] demonstrated that the ac-DBDPA is effective in preventing ice formation and accretion over an airfoil, owing to its thermal effect. Kolbakir et al. [33] investigated the effect of the layout of ac-DBDPA, implemented over an airfoil, on the anti-icing performance, comparing the spanwise-oriented with streamwise-oriented DBDPA arrays. They reported that the spanwise-oriented DBDPA arrays have better anti-icing performance than the streamwise-oriented DBDDPA arrays. They explained the reason for this as follows; the flow over an airfoil was affected by the layout of the DBDPA arrays because an interference between the wall-surface jet, induced by the DBDPA, and mainflow was changed. Consequently, the convective heat transfer from the airfoil surface to the flow over an airfoil was also affected. It can be said that both the wall-surface jet and heat generation is needed for the anti-icing. The potential of the DBDPAs for ice detection and prevention was also demonstrated by Abdollahzadeh et al. [34], Rodrigues et al. [35], and so on. In the case of the ac-DBDPA, therefore, it is important to quantitatively investigate not only the effect of the EHD force but also that of the Joule heating, in understanding the aerodynamic and thermal characteristics and expanding the application. In recent years, studies have measured the density field of the ac-DBDPA using quantitative methods, such as the background-oriented schlieren (BOS) technique [36,37,38,39]. However, this quantitative measurement of the density field has been made only for the typical plate-PA. Considering the practical use of the PA, the wire-PA is an attractive candidate because of its higher thrust and force efficiency. As previously stated, the discharge topology of the wire-PA differs greatly from that of the plate-PA. It is, therefore, important to clarify the effect of the shape of the exposed electrode on the flow velocity and density field for practical use.
Against the above background, the objective of this study was to clarify the effects of the EHD force and Joule heating on the surrounding air when the shape of the exposed electrode was changed. For this purpose, the velocity and density fields were, respectively, obtained using particle image velocimetry (PIV) and the BOS technique for the plate- and wire-PA. Furthermore, images of discharge emission were taken, and the surface temperature distributions of each PA were obtained using an infrared (IR) camera. Note that the measurement timing was set at 300 s after driving the PA, when the flow field was roughly in a steady state.

2. Materials and Methods

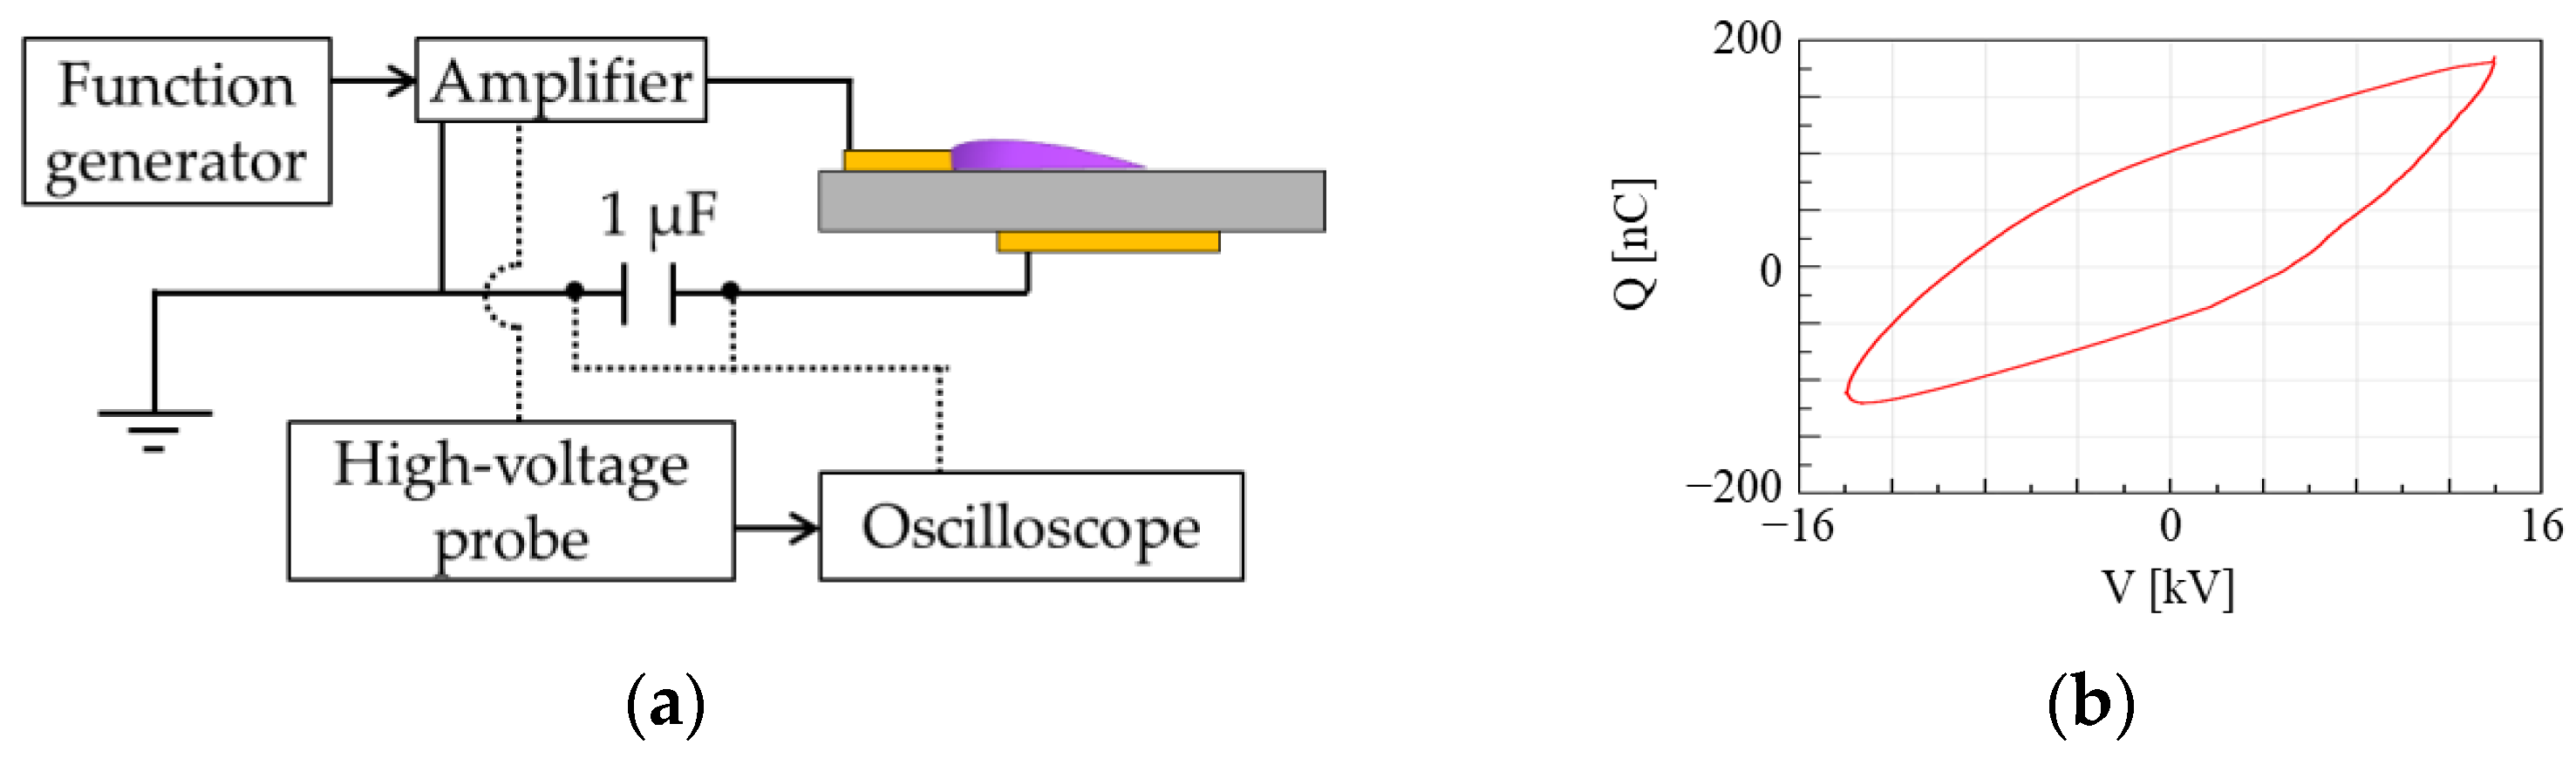
2.1. PA and Power Supply System

Figure 2 shows the geometrical configuration of the PAs with (a) plate and (b) wire exposed electrodes. These PAs comprise of a dielectric plate (polymethyl methacrylate) with a thickness of 3 mm and grounded electrode (copper tape) with a thickness of 50 μm. The grounded electrode is encapsulated with polyimide tape to prevent discharge on the lower surface. Copper tape with a thickness of 50 μm and tungsten wire with a diameter of 20 μm were used for the exposed electrode. There are three reasons why we used not the copper but the tungsten wire for the exposed electrode of wire-PA. First, the copper wire easily breaks, while the tungsten wire has high durability. Second, according to the experimental study by Hoskinson et al. [40], there is no significant effect of the exposed electrode material on the thrust force and power consumption. Third, the configuration and materials were set to the previous study by Moreau et al. [28]. The gap between the exposed and grounded electrodes was set at 2 mm. The actuators have a span length of 120 mm. Note that the entire surface of the PA, including the electrode, was coated with a black-body spray coating (having thermal emissivity of 0.94) for the measurement of the surface temperature by the IR camera. Figure 3 shows the power supply system of the PA. The voltage signal from a function generator (IWATSU, Tokyo, Japan, SG-4222) was amplified by a Trek 20/20C-HC and applied to the PA. The AC waveform, voltage, and frequency are sinusoidal, 28 kVpp and 1 kHz, respectively. The voltage applied to the PA was monitored with a high-voltage probe (Tektronix, Beaverton, OR, USA, P6015A) and oscilloscope (Teledyne LeCroy, New York, NY, USA, HDO4034). In addition, power consumption was measured by adopting the V–Q Lissajous method [41]. The capacitor (1 μF) was inserted into the grounded line. The charge Q was obtained by measuring the potential difference through the capacitor. The V–Q Lissajous curve of the charge Q against the applied voltage V was obtained as shown in Figure 3b. The area inside the V–Q Lissajous curve corresponds to the power consumption.

2.2. Measurement System and Conditions of PIV

The PIV system comprises of an sCMOS camera (Andor, Belfast, UK, Neo 5.5, 2560 × 2160 pixel), a double-pulse Nd-YAG laser (Litron Lasers, Rugby, UK, Nano S 30-15 PIV) and seeding device, as shown in Figure 4. The PA was placed inside a stainless-steel chamber. It is noted that the thermal insulation material (having thermal conductivity of 0.08 W/(mK)) was placed under the PA in all experiments reported in this paper. The seeding device was fabricated in house and consists of an acrylic box (about 43 mm × 20 mm × 25 mm) and axial fan, with the diameter of about 8 mm. The seeding device and chamber were connected with a duct. The smoke of incense sticks, whose particle size was less than 1μm, was used as tracer particles [42]. The smoke of incense stick was stored in the acrylic box and then sent out by the fan to the chamber. A single-focal length lens (Nikon, Tokyo, Japan, AI Micro-Nikkor 105 mm f/2.8 s) was attached to the sCMOS camera. In addition, a bandpass filter (having a central wavelength of 532 nm) was used to capture only the scattered light of the laser light. The velocity field was calculated using the Koncerto II software (SEIKA Digital Image Co., Tokyo, Japan). The image correlation conditions are given in Table 1. In this experiment, five measurements were made by changing the laser position along the spanwise direction because the discharge does not occur uniformly along the spanwise direction.

2.3. BOS Technique

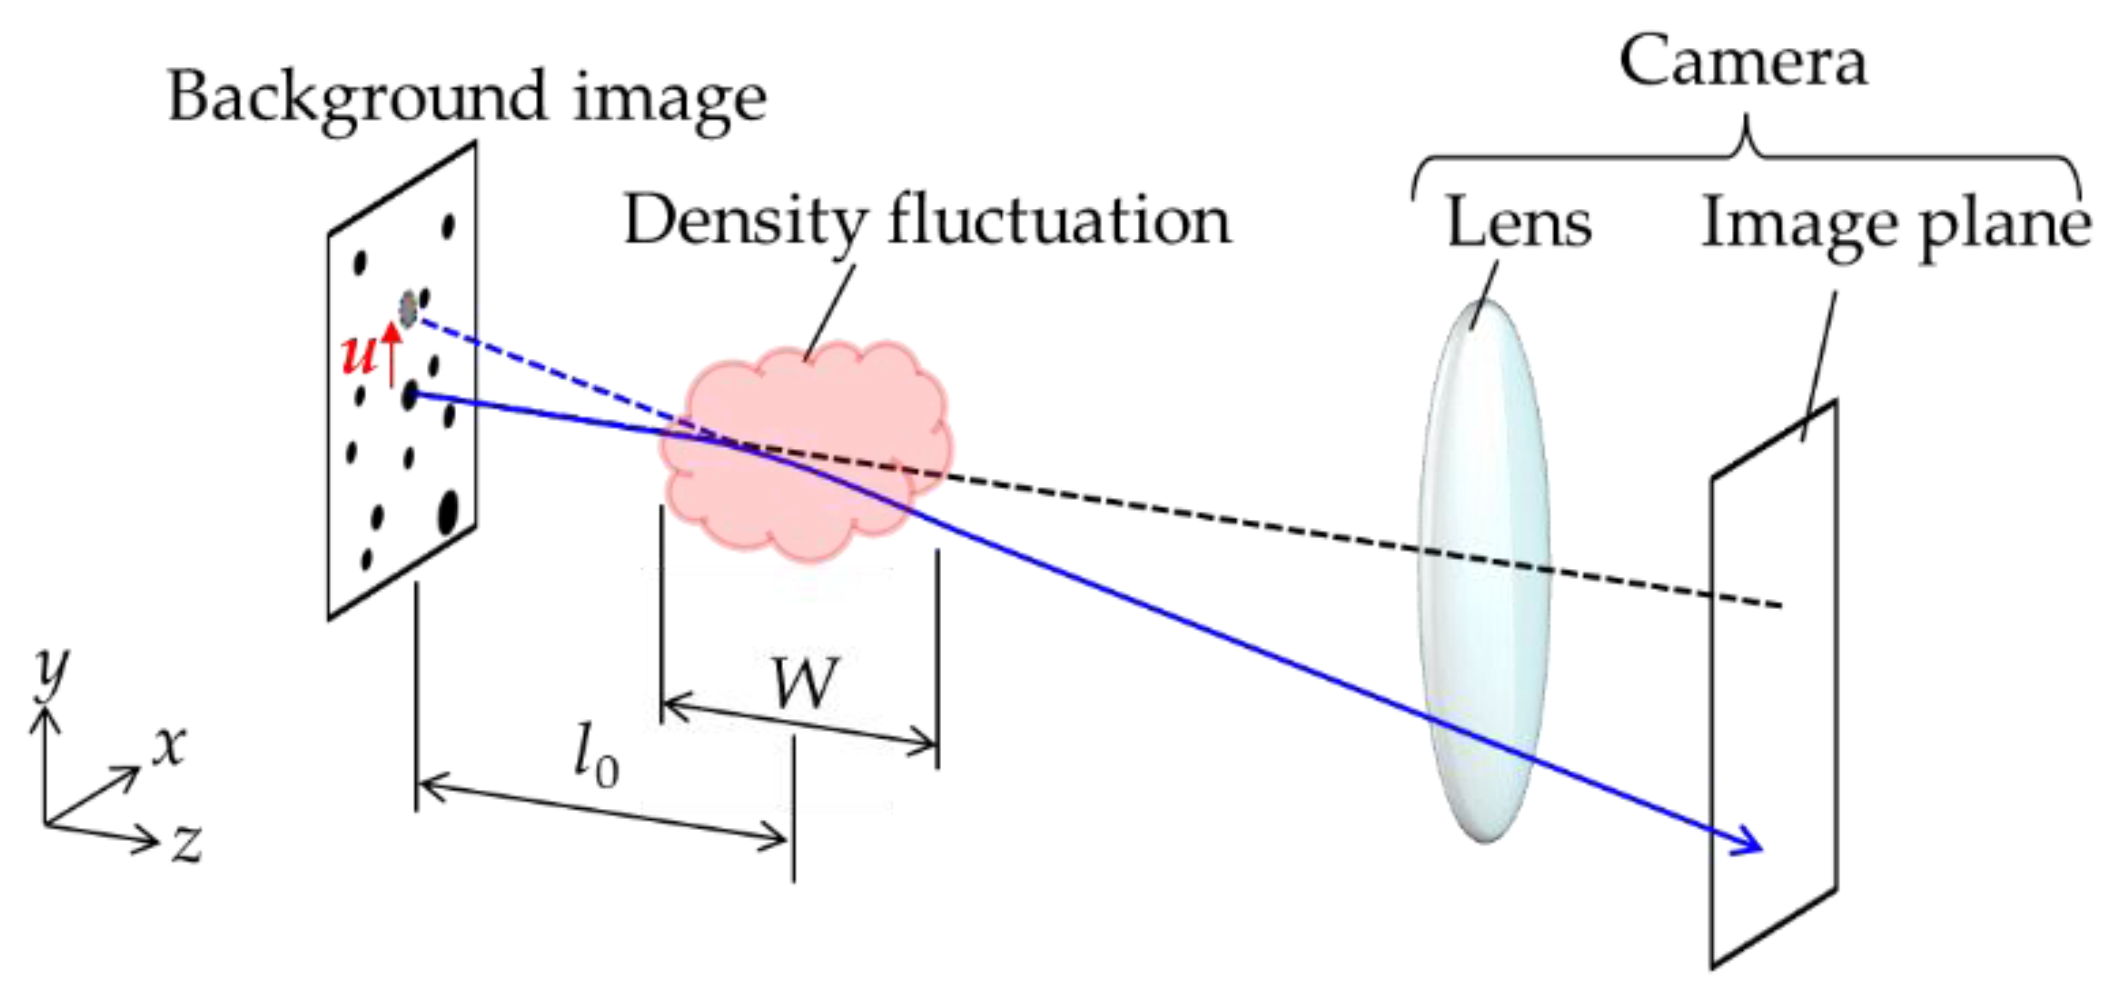
2.3.1. Measurement Principle

The BOS technique is a non-contact optical measurement method that enables us to measure the density field quantitatively [43,44,45,46,47]. As shown in Figure 5, the BOS measurement is made with a background image, camera, and measurement object. The BOS measurement is based on the displacement of the background image, due to the deflection of a light ray. When there is a density fluctuation, the light ray from the background image is deflected, owing to the variation in the refractive index (i.e., the density variation). This results in a displacement of the background image pattern. The amount of displacement relates to the integrated value of the first spatial derivative of density ( ρ / x and ρ / y ) along the light path (i.e., the z-axis in Figure 5). The displacement field is obtained by comparing the pictures of the background image with and without the density fluctuation. Image correlation, which is generally used in PIV, can be adopted for the displacement calculation. The density field is finally obtained by numerically calculating the Poisson equation for the density and displacement fields.

2.3.2. Measurement System for the BOS Technique and Conditions of the Density Field Calculation

Figure 6 shows the measurement system for the BOS technique, which is almost the same as that presented by Kaneko et al. [38]. The BOS system comprises of a white light-emitting diode, a background image with random dot patterns, the PA, and a camera. A single-lens reflex camera (Nikon, Tokyo, Japan, D3200), with a single-focal-length lens (Nikon, Tokyo, Japan, AI Micro-Nikkor 105 mm f/2.8 s), was used. The density variation region W was 120 mm, as indicated in Section 2.1. The distance between the background image and center of the PA, l0, was set at 100 mm, whereas the distance between the center of the PA and camera, lc, was set at 440 mm. Imaging was conducted with an f-number of f/32 and shutter speed of 1/100 s. The displacement field was calculated with the software Koncerto II, as in the PIV. Table 2 shows the image correlation conditions for the calculation of the displacement field. The density field was, finally, calculated using the method proposed by Komuro et al. [29]. The uncertainty of the BOS measurement in this experiment could be estimated to be 0.03% against to the reference density (ambient air) at most (the uncertainty was discussed in our previous study [38]).

2.4. Measurement Systems and Conditions of the Surface Temperature Measurement

The surface temperature of the PA was measured using the IR camera (FLIR, Wilsonville, OR, USA, CPA-T630SC, 640 × 480 pixels). The spectral range and temperature resolution of the camera were, respectively, 7.5–14 μm and 0.03 K. The distance between the surface of the PA and the camera was set at 0.4 m, and the spatial resolution was 0.27 mm/pixel. We present not the absolute temperature of the PA surface but the change in temperature, ΔT = TT0. Here, T was the absolute temperature when the PA was driven, and T0 was the initial temperature when the PA was not driven. The data of the surface temperature were obtained as a two-dimensional array. The data were averaged along the spanwise direction to obtain the temperature profile.

2.5. Discharge Emission Photograph

The discharge emission imaging was conducted from the side to characterize the discharge region. A single-lens reflex camera (Nikon, Tokyo, Japan, D3200), equipped with a single-focal-length lens (Nikon, Tokyo, Japan, AI Micro-Nikkor 105 mm f/2.8 s), was placed horizontally, as in the BOS measurement. The f-number and shutter speed were set at f/5.6 and 1/1.6 s, respectively. The spatial resolution was 0.017 mm/pixel.

3. Results

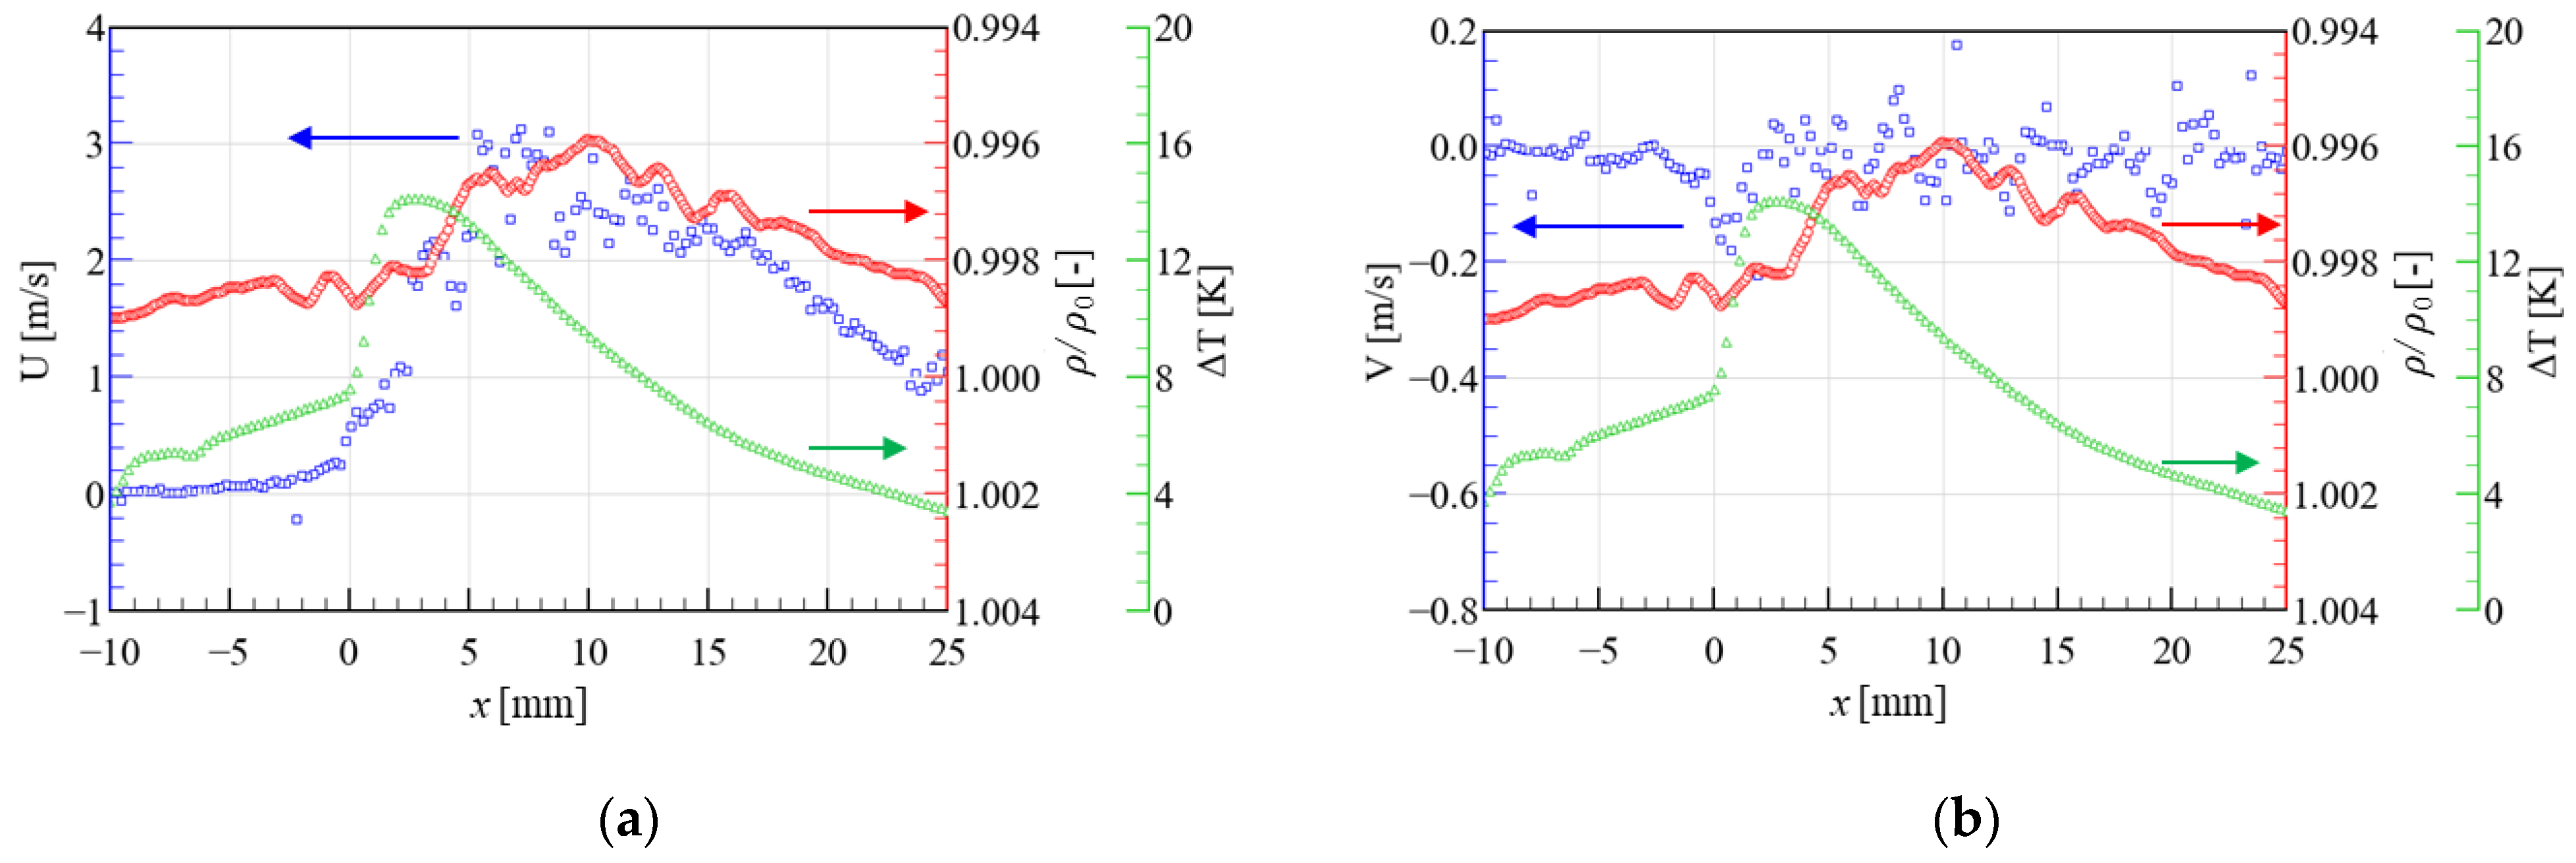
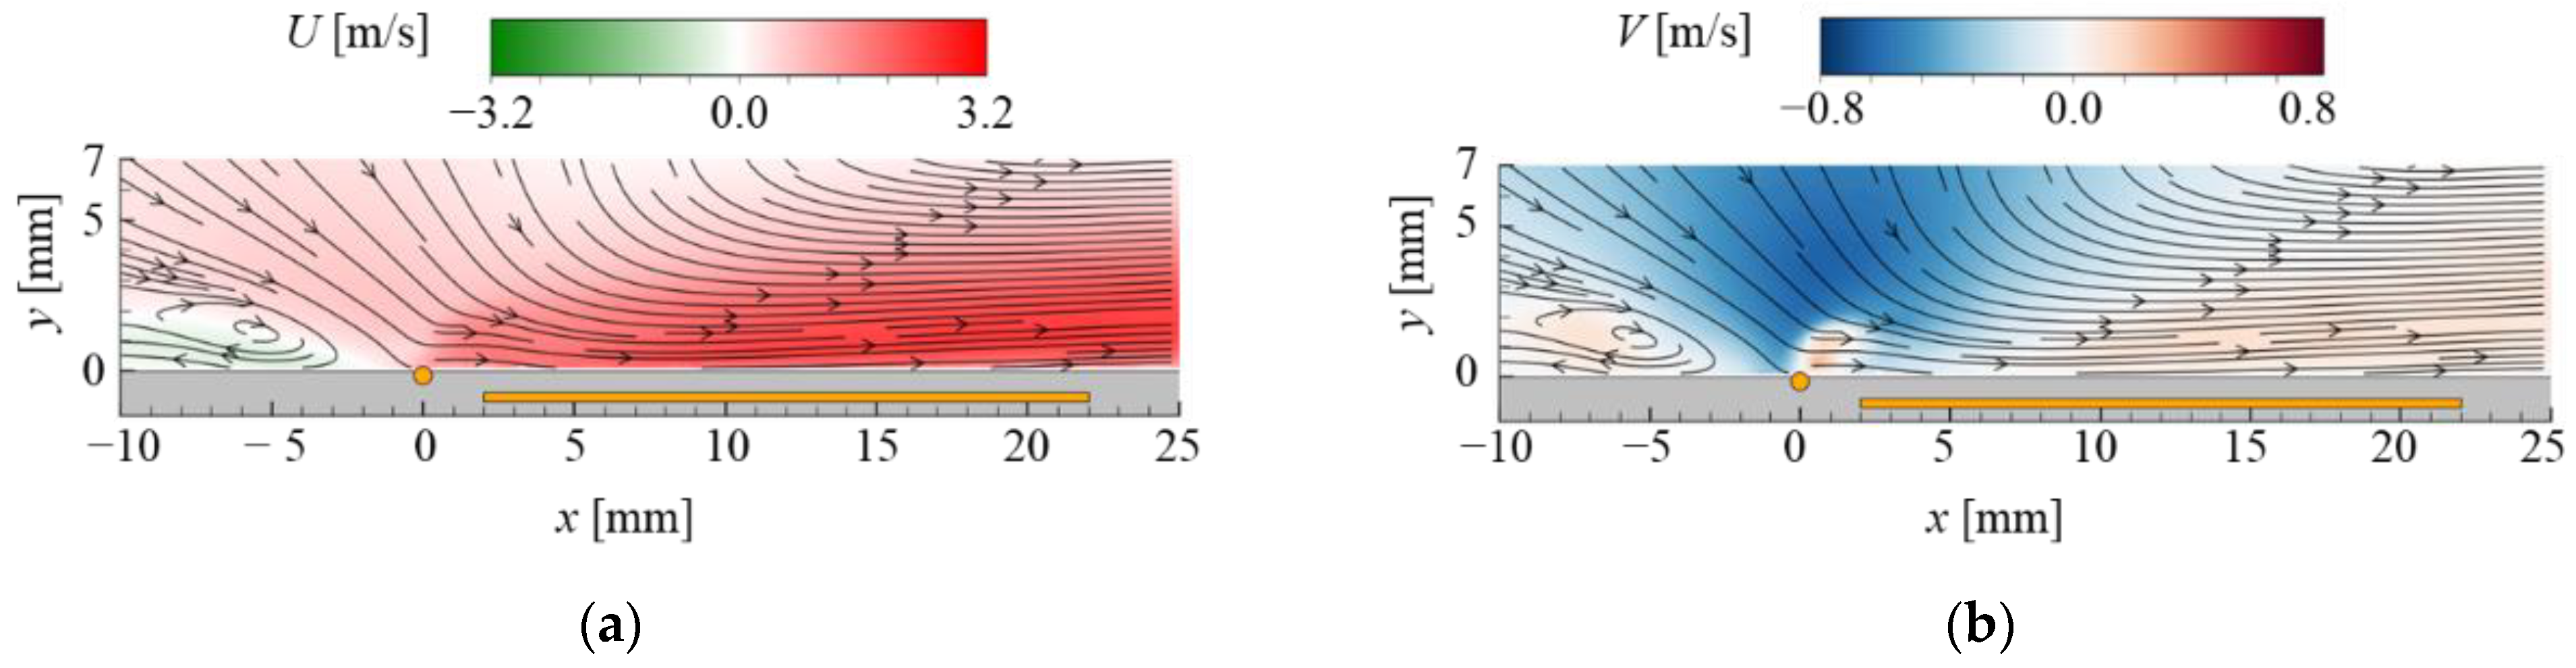
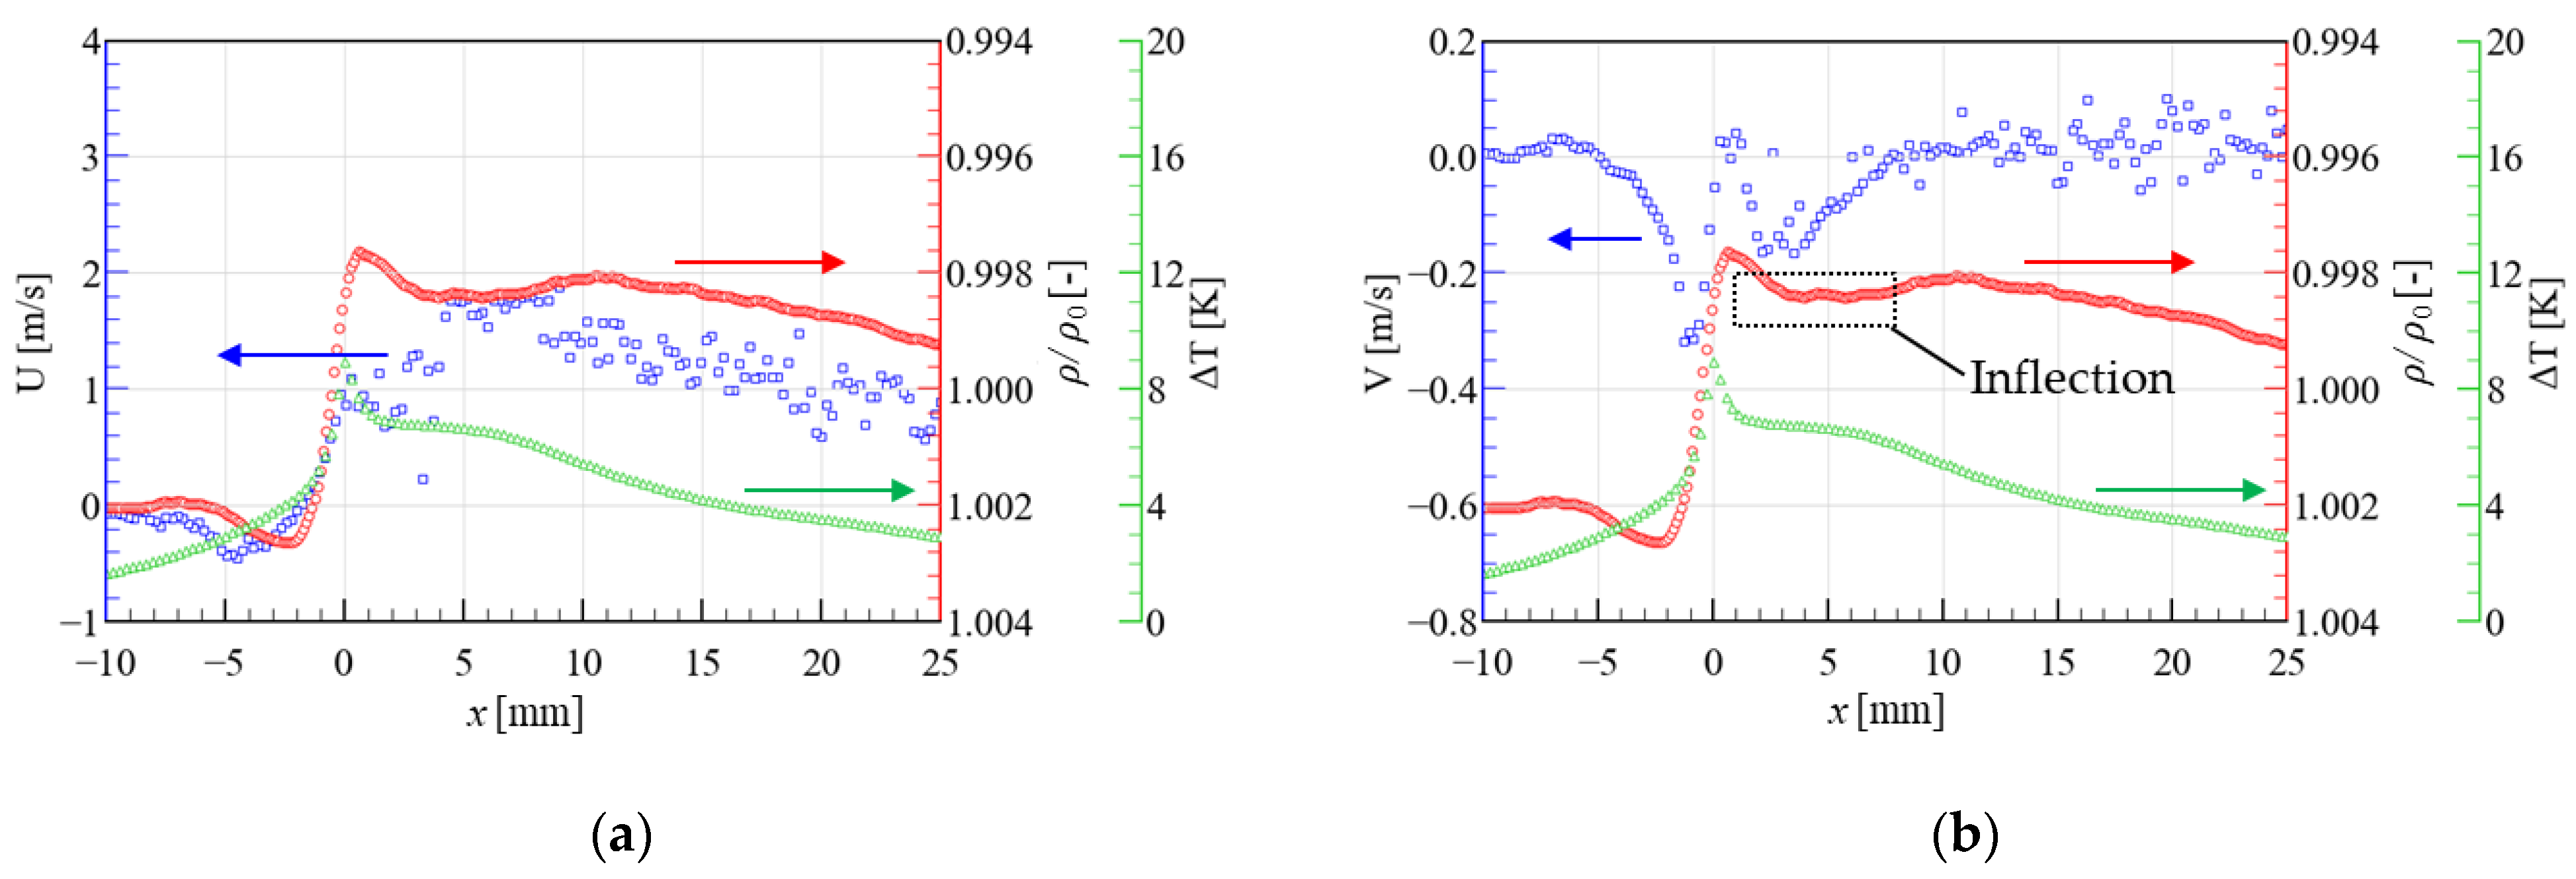
3.1. Results for the Plate-PA

Figure 7a shows a photograph of the discharge taken from the side. In the figure, x = 0 mm and y = 0 mm, respectively, indicate the edge of the exposed electrode and surface of the PA. An enlarged view of the discharge area is presented within a red frame. Furthermore, to make clear comparison of the side views of the plasma emission, the binarized image (threshold value is set at 50) is also shown in Figure 7b. It is seen that the discharge occurs from the exposed electrode edge and extends approximately 10 mm. The enlarged view shows that the height of the discharge area was less than 1 mm.
The results of the PIV and BOS measurements for the plate-PA are, respectively, shown in Figure 8 and Figure 9. Figure 8a,b, respectively, show the horizontal and vertical velocities with the streamlines. Figure 9 shows the density field, normalized by the ambient air density. As seen in Figure 8a, the wall-surface jet formed from the tip of the exposed electrode. Furthermore, as shown in Figure 8b, there was suction flow around the exposed electrode edge (−2 mm < x < 5 mm and 0 mm < y < 7 mm). The density field is next discussed. It is seen that a region of lower density spreads along the dielectric surface and plate-exposed electrode. In addition, the density increased around the exposed electrode edge (−2 mm < x < 3 mm and 1 mm < y < 3 mm). These characteristics of the spatial distribution of the flow and density field are the same as those observed in previous studies [19,29,38].
Figure 10 plots the x-profiles of the flow velocity field (y = 0.114 mm) in blue and that of the density (y = 0.193 mm) in red. The x-profile of the surface temperature, obtained using the IR camera, is also plotted in green. The horizontal and vertical velocities are, respectively, plotted in Figure 10a,b. In the following, the mechanism of the heat transfer between the PA surface and surrounding flow will be discussed. In addition, the spatial resolution of the measured velocity and density field were different from each other. We, therefore, plot the x-profiles of the velocity and density field at the specific height as close to the wall-surface as possible, i.e., velocity at y = 0.114 mm and density at y = 0.193 mm. The left axis shows the horizontal and vertical velocities, whereas the right axes indicate the density and temperature. Note that the plotted data of the density and temperature are the same in Figure 10a,b. Figure 10a confirms that the horizontal velocity increases from x = −3 mm and peaks at about x = 7 mm. This is a result of the acceleration, due to the EHD force generated in the discharge area (x > 0 mm) and suction effect in −3 mm < x < 0 mm. Figure 10b shows that the vertical velocity is negative at −3 mm < x < 2 mm. This indicates that the flow impinges on the surface of the PA around the exposed electrode edge and then flows downstream along the dielectric surface. Above the plate-exposed electrode (i.e., at −10 mm < x < −6 mm), the horizontal and vertical velocities are almost zero because there is no discharge. Both the horizontal and vertical velocities fluctuate downstream. The reason is presumed to be the generated nonuniform discharge, as mentioned in Section 2.2. It is, therefore, considered that the spanwise EHD force is generated simultaneously because of the nonuniform discharge in the spanwise direction. As a result, a longitudinal vortex is induced and may affect the flow. The x-profile of the density confirms that the density peak is more downstream of the peak of the horizontal velocity. In addition, the density decreases above the exposed electrode. The x-profile of the temperature shows a peak temperature at x = 2 mm and decrease in temperature downstream. It is noted that the temperature at −10 mm < x < −6 mm is not measured correctly because there is no coating of the black-body spray in this region.
Next, the x-profiles at other heights are focused. Figure 11 shows the x-profiles of the flow velocity and density field at about 0.8 and 2.1 mm, as well as in Figure 10, the horizontal and vertical velocity are plotted in Figure 11a,b, respectively. The densities plotted in Figure 11a,b are the same data. It can be observed that the qualitative characteristics of the horizontal and vertical velocity profiles are the same as those at 0.114 mm, shown in Figure 10. On the other hand, the density profiles shown in Figure 11 are different from those shown in Figure 10. The densities at both heights are almost greater than 1.000. In addition, it can be confirmed that the position of the highest density corresponds to the position in which the vertical velocity takes large minus values. It means that the air compression occurs in this region.
The formation mechanism of the above-mentioned flow field, density field and temperature distribution is next discussed using Figure 12. Firstly, driving the PA, there was discharge from the exposed electrode edge, and the plasma formed along the dielectric surface. In the plasma region, there were both an EHD force and Joule heating. The air flowing into the plasma region was accelerated and heated. The horizontal velocity had a peak value at the point where the EHD force was balanced with the viscous resistance, due to the wall. The air was compressed by the impingement on the wall surface around the exposed electrode edge. The air was then advected downstream, while being heated and gradually expanding. In other words, the air expanded downstream after being compressed around the exposed electrode edge. Consequently, the position of the peak density was far from the exposed electrode and was downstream of the peak position of the horizontal velocity. The velocity was almost zero above the exposed electrode; thus, it is considered that the decrease in density there was caused by the heat conduction from the hot exposed electrode. There are two reasons for the exposed electrode heating. One is the Joule heating, due to the electric current flowing in the exposed electrode. The other is the heat transfer from the hot air, heated by the discharge. Finally, the obtained temperature distribution is explained as follows. The air continued to be heated in the discharge region, and the air temperature, thus, became highest at some distance from the exposed electrode. In addition, the flow impingement on the wall surface (see Figure 10b) resulted in a thinner velocity boundary layer around the exposed electrode. As a result of the above, the heat transfer from the air to the dielectric surface was mostly enhanced some distance away from the exposed electrode. The surface temperature, therefore, peaks more downstream of the exposed electrode edge.

3.2. Results for the Wire-PA
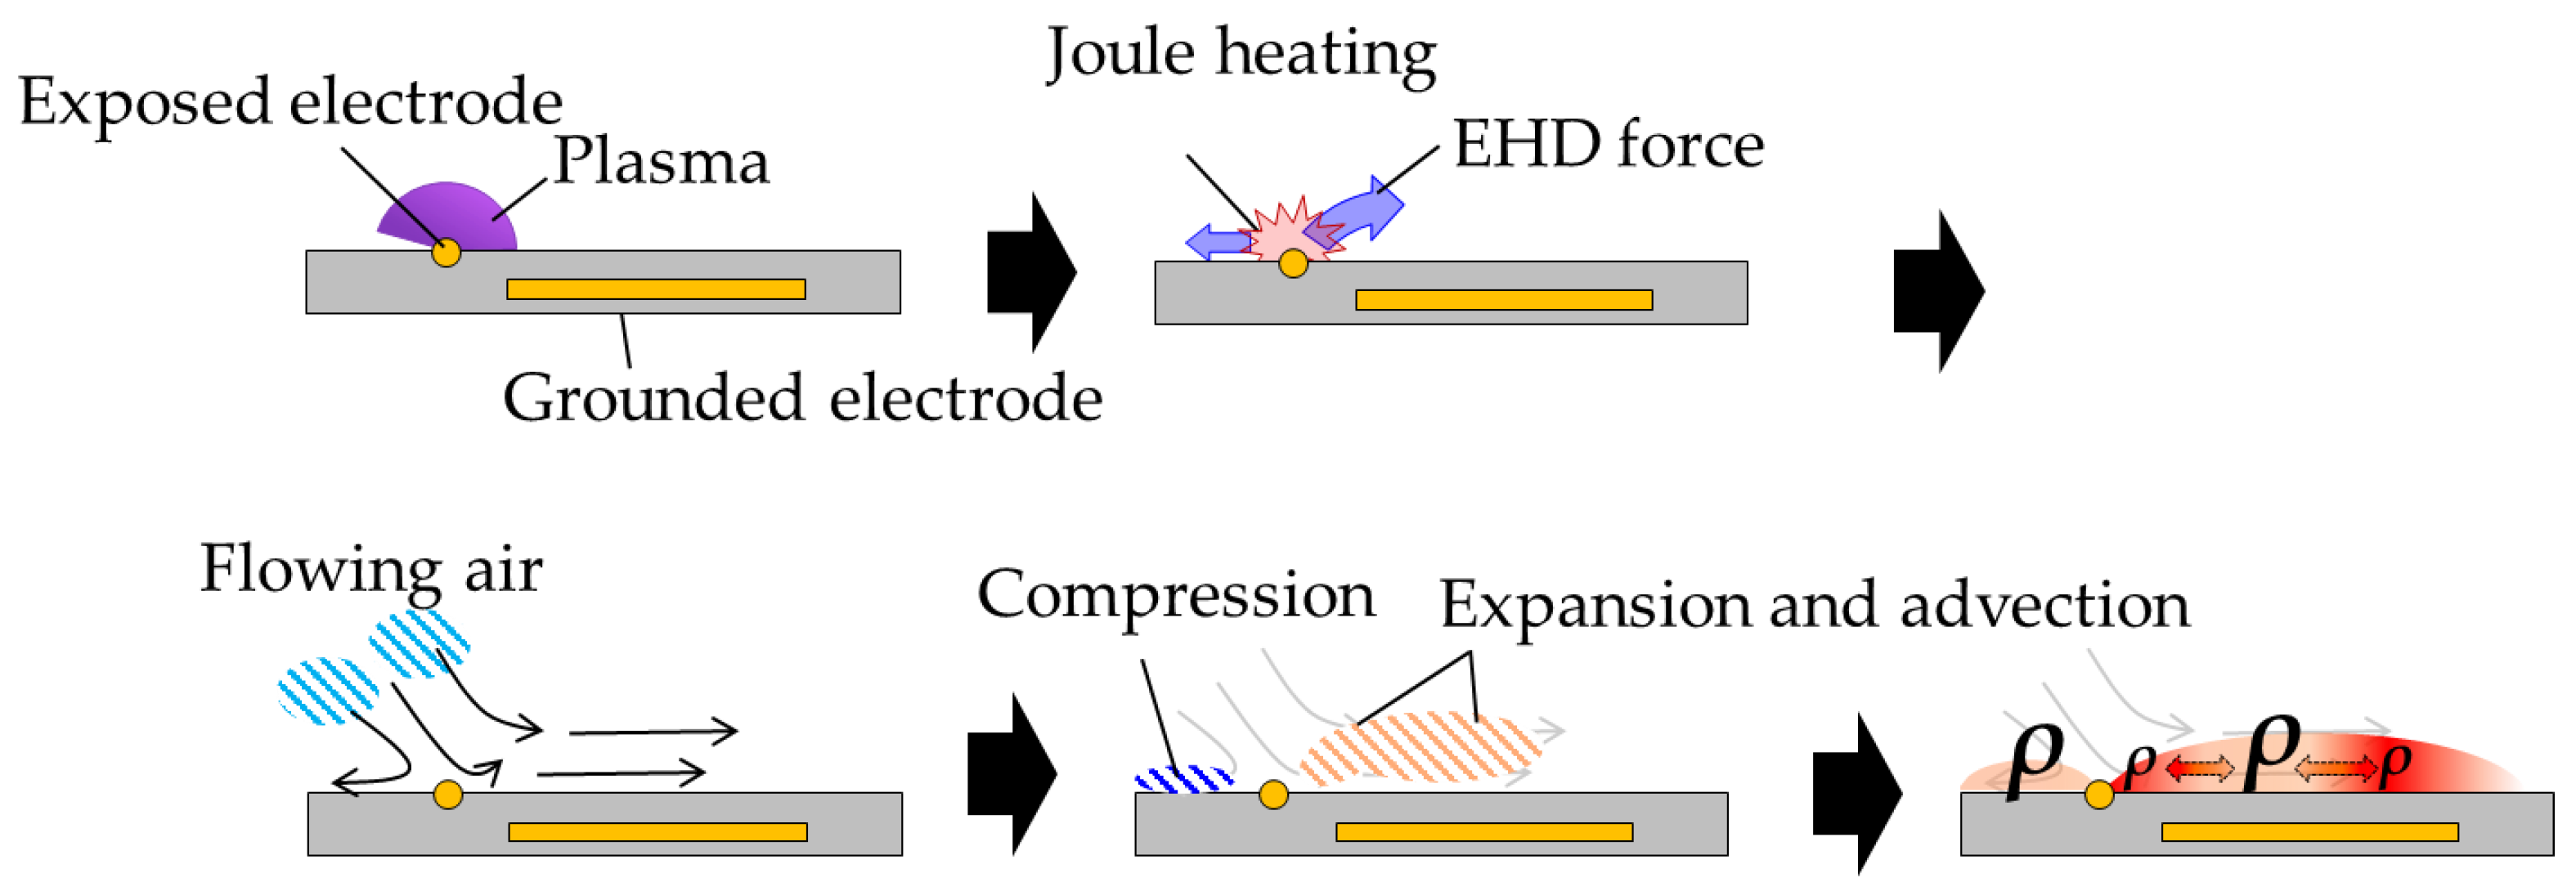
Figure 13a shows a photograph of the discharge of the wire-exposed electrode. The wire-exposed electrode was at x = 0 mm. An enlarged view of the discharge area is shown within a red frame. Figure 13b shows the binarized image (threshold value is the same as the plate-PA). It is seen that the discharge was diffused in a fan-shape. In addition, the discharge occurred not only downstream (x > 0 mm) but also upstream (x < 0 mm) of the wire-exposed electrode. A previous study on a wire-PA also reported the discharge occurring upstream of the wire-exposed electrode [30].
The flow velocity and density fields of the wire-PA are, respectively, shown in Figure 14 and Figure 15. Figure 14a shows the generated wall-surface jet and suction flow, as well as the plate-exposed electrode (see Figure 8a). However, a backward flow and resulting circulation area are also generated upstream of the exposed electrode. Figure 14b reveals that a vertically upward flow formed around the wire-exposed electrode. The air then flowed along the dielectric surface. Figure 15 shows that the density decreased around the wire-exposed electrode and its downstream. Upstream of the wire-exposed electrode, there was a high-density region. It can be said that the topology of the discharge, flow velocity, and density field, generated by the wire-PA, was different from that generated by the plate-PA.
In Figure 16, the x-profiles of the horizontal and vertical velocity (y = 0.114 mm), density (y = 0.193 mm), and surface temperature are, respectively, plotted in blue, red, and green. We first focus on the horizontal velocity, shown in Figure 16a. It is seen that the horizontal velocity increased downstream and then peaked away from the exposed electrode, as in the case of the plate-PA. There was backward flow at x < −2 mm. Figure 16b reveals that the flow near the exposed electrode (x = 1 mm) was upward. Meanwhile, the flow upstream and downstream of the exposed electrode was downward. We especially note that the flow jumped around the wire-exposed electrode. We next focus on the density profile. At x < 0 mm, the density was higher than that of the ambient air (i.e., the air in the region is compressed) and, as in the case of the plate-PA, the density decreased downstream of the exposed electrode. However, the density peaks at x = 1 mm, which was near the exposed electrode. Finally, in the surface temperature distribution, the temperature was the highest at x = 0 mm, where the exposed electrode was positioned.
Similar to Section 3.1, Figure 17 plots the x-profiles of the flow velocity and density field at about 0.8 and 2.1 mm. Focusing on the x-profiles of the horizontal and vertical velocity and the density at around y = 0.8 mm, a similar profile change to that shown in Figure 16 can be observed. In particular, the density of the wire-PA was different from that of the plate-PA and the density near the exposed electrode decreased at this height. At about y = 2.1 mm, however, the profile characteristic is different. The horizontal velocity at y = 2.171 mm, which is slightly far from the wall-surface, increased toward downstream. Additionally, from the vertical velocity profile, it can be confirmed that the flow near the exposed electrode was not upward at this height. Finally, the density at this height is not below 1.000. Considering Figure 10, Figure 11, Figure 16 and Figure 17, it can be concluded that there was a difference in the height of the EHD and thermal influence between the plate- and wire-PA.
Using the above results, we discuss the forming mechanism of the flow field, density field, and temperature distribution of the wire-PA, according to Figure 18. It is considered that the EHD force radiated from the wire electrode, owing to the diffusive plasma generation around the wire electrode. In other words, not only a forward but also an upward EHD force was generated near the wire electrode. In addition, a Joule heating field was generated around the electrode. As a result, backward flow and a flow jump were induced near the exposed electrode. The absolute values of the horizontal velocity upstream and downstream were at a maximum, where the EHD force balanced with the viscous resistance of the wall boundary. The density peak downstream (x = 1 mm) was explained as follows. It is noted that the density peak is closer to the exposed electrode for the wire-PA than for the plate-PA. Near the wire-exposed electrode, there was expansion, due to Joule heating, but not compression, due to the flow impingement on the wall. Therefore, the air flowing into the plasma region immediately expanded. This explains why the density peak was closer to the wire-exposed electrode. It is considered that the compression of the flow at 1 mm < x < 8 mm caused the inflection of the density profile (see Figure 16b). Meanwhile, at x < 0 mm, the air was compressed, rather than heated. As a result, a region of higher density spreads along the dielectric surface at x < 0 mm. There are two reasons for the temperature peaking at x = 0 mm. The first reason is the convective heat transfer. The air flowing into the plasma region was heated at −1 mm < x < 0 mm and then immediately transferred heat to the dielectric surface through convection. The second reason is heat conduction from the hot wire-electrode to the dielectric.

4. Discussion

The above section clarified the qualitative characteristics of the flow fields (i.e., flow velocity field, density field, and surface temperature distribution), generated by the two types of PA. In the following, comparing the present results with the results of previous studies, a quantitative discussion is presented.
Firstly, the power consumption is discussed. The power consumptions of the plate- and wire-PA were 24.7 and 23.9 W/m, respectively, i.e., the power consumption was not greatly affected by the shape of the exposed electrode. This result does not follow the results of previous studies, which found that the power consumption of a wire-PA was greater than that of a plate-PA [28,30]. Against the above background, we look at the surface temperature distribution. The similar power consumption for the plate- and wire-PA suggests that the amount of heat given to the air by the Joule heating was also similar. However, Figure 10 and Figure 16 show that the surface temperature of the plate-PA was higher than that of the wire-PA. This result is due to the difference in the velocity boundary layer. Figure 19 shows the y-profiles of the horizontal velocity of the plate- and wire-PA. It is observed that the velocity boundary layer of the plate-PA was thinner than that of the wire-PA. As discussed in Section 3.1, the flow induced by the plate-PA was directed toward the surface of the PA, around the exposed electrode edge, and produced a thinner velocity boundary layer. Meanwhile, the velocity boundary layer of the wire-exposed electrode was thicker because of the upward velocity around the wire electrode. Hence, the heat transfer coefficient of the plate-PA was greater than that of the wire-PA. As a result, the heat transfer from the flow to the dielectric surface was stronger than that in the case of the wire-PA.
Next, the horizontal thrusts, Fx, generated by the PAs, are discussed. The thrust is numerically calculated on the basis of momentum conservation in a control volume (CV). Figure 20 shows the CV for the momentum conservation equation with the dashed line. In the previous studies, the EHD force distribution was experimentally estimated, such as in the work of Benard et al. [10] and Kotsonis et al. [19]. According to their results, the EHD force is considered not to extend downstream of the grounded electrode and distribute near the PA surface. As shown in Figure 20, the right side of the CV was set at x = 25 mm—that is, downstream of the grounded electrode end. The upper side was set far from the PA surface, y = 7 mm. The CV, therefore, was expected to cover the whole EHD force generation region. The momentum conservation equation is presented as equation (1). It is noted that not only the velocity but also the density were used in the calculation of thrust. The thrusts for the plate- and wire-PA were calculated as 8.0 and 18.6 mN/m, respectively. These results agree with the results of a previous study, which found that the thrust for a wire-PA was larger than that for a plate-PA under the same power consumption [30]. It is noted that the maximum horizontal velocities of the plate- and wire-PA were, respectively, 3.1 and 2.4 m/s. The reason the thrust of the wire-PA was more than double that of the plate-PA, in spite of its lower maximum horizontal velocity, is discussed. Here, Figure 21 plots the momentum flux at the left and right side of the CV. Open and closed symbols, respectively, show the results of the left and right side of the CV. The momentum flux of the wire-PA was more than double that of the plate-PA at the right side of the CV, while there was no significant difference in the momentum flux at the left side of the CV. This difference is due to the difference in the thickness of the velocity boundary layer. As shown in Figure 19, the velocity boundary layer of the wire-PA was thicker than that of the plate-PA, at any location. It means that the loss of viscous stress of the wire-PA was smaller, resulting in the higher thrust. The second reason was the higher EHD force generation efficiency. Moreau et al. [28] reported that positive streamers were eliminated when a plate-exposed electrode was replaced by a wire electrode. It is also said that the glow discharge is more efficient than streamer discharge for velocity production. It is, therefore, considered that the wire-PA generated the EHD force more efficiently than the plate-PA. In addition, as seen from Figure 13, discharge of the wire-PA spread more in the height direction. It is also considered that the integrated value of the EHD force of the wire-PA was larger than that of the plate-PA.
F x = bc ρ u 2 d y + cd ρ uvdx ad ρ u 2 d y ,
Finally, the y-profiles of the density of the plate- and wire-PA are plotted in Figure 22a,b, respectively. The trends of the density profiles of the plate- and wire-PA were the same, i.e., the density was at a minimum near the wall surface. This trend coincides with the results of Kaneko et al. [38], who measured density 300 s after the PA was turned on. Meanwhile, the result of the present study does not coincide with that of Komuro et al. [37], which was obtained 1000 ms after the actuator was turned on. As described by Kaneko et al. [38], it is considered that the difference in the profile is due to the amount of heat transfer. The plate- and wire-PA have similar power consumption; thus, it was seen that the density downstream (x = 15.09 mm) was almost the same between the two PAs. Meanwhile, there were differences in the density profiles at x = −5.056 and 0.029 mm between the plate- and wire-PA. Focusing on the density at x = −5.056 mm, though the density near the surface of the plate-PA was reduced by the heated plate electrode, that of the wire-PA was increased. As mentioned in Section 3.2, the air upstream of the wire-exposed electrode impinged onto the dielectric surface and compresses, and the higher density air then flowed upstream. The density at x = 0.039 mm is finally discussed. Although the density near the wall surface was almost the same for the two types of PA, the thickness of the lower-density region differed, owing to the difference in the flow topology. As discussed in Section 3.2, the flow near the wire-exposed electrode was upward. The expanding air, therefore, spread upward in this region. As described, the change in the shape of the exposed electrode affected the density profile.

5. Conclusions

This paper experimentally clarified the effects of the exposed electrode shape of a PA on the characteristics of the flow velocity field, density field, and surface temperature distribution. PIV, a BOS measurement, a surface temperature measurement using an IR camera, and discharge emission imaging were conducted for the plate- and wire-PA. It was first clarified that the topology of the discharge was different between the two types of PA. In particular, the discharge generated by the wire-PA had a diffused fan shape. This resulted in a difference in the spatial distribution of the velocity and density field between the two types of PA. For both actuators, it can be said that the horizontal velocity peaks where the EHD force was balanced with the resistance, due to the dielectric surface. It was then clarified that there was an obvious difference in the peak position of the density between the two types of PA. The density of the plate-PA had a peak value downstream of the horizontal velocity peak position, whereas the density peak of the wire-PA was closer to the wire-exposed electrode. The reason for the above observed difference was the different vertical velocity distributions. The vertical velocities of the plate- and wire-PA, near the exposed electrode, were downward and upward, respectively. This difference may affect the expansion and advection of the heated air. Finally, the surface temperature distributions were investigated. It was observed that the qualitative and quantitative characteristics of the temperature profile were different between the plate- and wire-PA. These differences were due to the difference in the vertical velocity near the exposed electrode, as well as the resulting thickness of the velocity boundary layer.
At last, we take into consideration the application of these PAs, based on the results obtained in this study. Considering the amount of thrust force, it can be said that the wire-PA is better for flow control application. Although further investigation is needed, it can be said that the plate-PA is better for the ice prevention and anti-icing because of its higher surface temperature and horizontal velocity near the wall-surface.

Author Contributions

Conceptualization, H.N.; methodology, Y.T., H.N. and Y.K.; software, Y.K.; validation, Y.K.; formal analysis, Y.K.; investigation, Y.K.; resources, H.N.; data curation, Y.K.; writing—original draft preparation, Y.K.; writing—review and editing, H.N. and Y.T.; visualization, Y.K.; supervision, H.N.; project administration, H.N.; funding acquisition, H.N. and Y.T. All authors have read and agreed to the published version of the manuscript.

Funding

This research was supported by the Japan Society for the Promotion of Science (JSPS), through a Grants-in-Aid for Scientific Research (19H02062, 20H00223). This work was supported by JST, PRESTO Grant Number JPMJPR21O5, Japan.

Data Availability Statement

The data presented in this study are available on request from the corresponding author.

Conflicts of Interest

The authors declare no conflict of interest.

References

  1. Corke, C.T.; Post, L.M.; Orlov, M.D. Single dielectric barrier discharge plasma enhanced aerodynamics: Physics, modeling and applications. Exp. Fluids 2009, 46, 1–26. [Google Scholar] [CrossRef]
  2. Benard, N.; Moreau, E. Electrical and mechanical characteristics of surface AC dielectric barrier discharge plasma actuators applied to air flow control. Exp. Fluids 2014, 55, 1846. [Google Scholar] [CrossRef] [Green Version]
  3. Benard, N.; Jolibois, J.; Moreau, E. Lift and drag performances of an axisymmetric airfoil controlled by plasma actuator. J. Electrostat. 2009, 67, 133–139. [Google Scholar] [CrossRef]
  4. Jolibois, J.; Forte, M.; Moreau, E. Application of an AC barrier discharge actuator to control airflow separation above a NACA 0015 airfoil. J. Electrostat. 2008, 66, 496–503. [Google Scholar] [CrossRef]
  5. Komuro, A.; Takashima, K.; Suzuki, K.; Kanno, S.; Nonomura, T.; Kaneko, T.; Ando, A.; Asai, K. Influence of discharge energy on the lift and drag forces induced by a nanosecond-pulse-driven plasma actuator. Plasma Sources Sci. Technol. 2019, 28, 065006. [Google Scholar] [CrossRef]
  6. Roy, S.; Zhao, P.; DasGupta, A.; Soni, J. Dielectric barrier discharge actuator for vehicle drag reduction at highway speeds. AIP Adv. 2016, 6, 025322. [Google Scholar] [CrossRef] [Green Version]
  7. Vernet, J.A.; Orlu, R.; Soderblom, D.; Elofsson, P.; Alfredsson, P.H. Plasma Streamwise vortex Generators for Flow Separation Control on Trucks A Proof-of-concept Experiment. Flow Turbul. 2018, 100, 1101–1109. [Google Scholar] [CrossRef] [Green Version]
  8. Matsuda, H.; Tanaka, M.; Osako, T.; Yamazaki, K. Plasma Actuation Effect on a MW class Wind Turbine. Int. J. Gas Turbine Propuls. Power Syst. 2017, 9, 47–52. [Google Scholar] [CrossRef]
  9. Boeuf, J.P.; Lagmich, Y.; Pitchford, L.C. Contribution of positive and negative ions to the electrohydrodynamic force in a dielectric barrier discharge plasma actuator operating in air. J. Appl. Phys. 2009, 106, 023115. [Google Scholar] [CrossRef]
  10. Benard, N.; Debien, A.; Moreau, E. Time-dependent volume force produced by a non-thermal plasma actuator from experimental velocity field. J. Phys. D Appl. Phys. 2013, 46, 245201. [Google Scholar] [CrossRef]
  11. Gilbart, B.; Dickenson, A.; Walsh, J.L.; Hasan, M.I. Dominant heating mechanisms in a surface barrier discharge. J. Phys. D Appl. Phys. 2021, 54, 175202. [Google Scholar] [CrossRef]
  12. Shen, L.; Chen, Z.; Wen, C.Y. Thermal Effect on the Performance of an Alternating-Current Dielectric-Barrier-Discharge Plasma Actuator. AIAA J. 2020, 58, 3368–3377. [Google Scholar] [CrossRef]
  13. Sekimoto, T.; Shulaiman, T.; Anyoji, M.; Nonomura, T.; Fujii, K. Experimental Study of a Nano-second Pulse Plasma Actuator for Low Reynolds Number Flow Control. In Proceedings of the 52nd AIAA Aerospace Sciences Meeting, National Harbor, MA, USA, 13–17 January 2014. [Google Scholar] [CrossRef]
  14. Ukai, T.; Kontis, K. Thermal Fluctuation Characteristics around a Nanosecond Pulsed Dielectric Barrier Discharge Plasma Actuator using a Frequency Analysis based on Schlieren Images. Energies 2020, 13, 628. [Google Scholar] [CrossRef] [Green Version]
  15. Abdollahzadeh, M.; Pascoa, J.C.; Oliveira, P.J. Two-dimensional numerical modeling of interaction of micro-shock wave generated by nanosecond plasma actuators and transonic flow. J. Comput. Appl. Math. 2014, 270, 401–416. [Google Scholar] [CrossRef]
  16. Komuro, A.; Tsukada, H.; Ando, A. Slow Gas Heating Process in an Atmospheric-Pressure Streamer Discharge Visualized by High-Speed Schlieren Method. IEEE Trans. Plasma Sci. 2018, 47, 1164–1171. [Google Scholar] [CrossRef]
  17. Leonov, S.B.; Petrishchev, V.; Adamovich, I.V. Dynamics of energy coupling and thermalization in barrier discharges over dielectric and weakly conducting surfaces on μs to ms time scales. J. Phys. D Appl. Phys. 2014, 47, 465201. [Google Scholar] [CrossRef]
  18. Little, J.; Takashima, K.; Nishihara, M.; Adamovich, I.; Samimy, M. Separation Control with Nanosecond Pulse Driven Dielectric Barrier Discharge Plasma Actuators. AIAA J. 2012, 50, 350–365. [Google Scholar] [CrossRef]
  19. Kotsonis, M.; Ghaemi, S.; Veldhuis, L.; Scarano, F. Measurement of the body force field of plasma actuators. J. Phys. D Appl. Phys. 2011, 44, 045204. [Google Scholar] [CrossRef]
  20. Albrecht, T.; Weier, T.; Gerbeth, G.; Metzkes, H.; Stiller, J. A method to estimate the planar, instantaneous body force distribution from velocity field measurement. Phys. Fluids 2011, 23, 021702. [Google Scholar] [CrossRef]
  21. Ota, K.; Sekiya, T.; Nishida, H. Effects of flow measurement resolution on quasi-steady body force estimation in dielectric-barrier-discharge plasma actuator. AIP Adv. 2016, 6, 105109. [Google Scholar] [CrossRef] [Green Version]
  22. Ashpis, D.E.; Laun, M.C. Characterization of Dielectric Barrier Discharge Plasma Actuators: Logarithmic Thrust-Voltage Quadratic Relationship. AIAA J. 2017, 55, 3807–3816. [Google Scholar] [CrossRef]
  23. Nakano, A.; Nishida, H. The effect of the voltage waveform on performance of dielectric barrier discharge plasma actuator. J. Appl. Phys. 2019, 126, 173303. [Google Scholar] [CrossRef]
  24. Nonomura, T.; Ozawa, Y.; Ibuki, T.; Nankai, K.; Komuro, A.; Nishida, H.; Kotsonis, M.; Kubo, N.; Kawabata, H. Single-Pixel Particle Image Velocimetry for Characterization of Dielectric Barrier Discharge Plasma Actuators. AIAA J. 2020, 58, 4952–4957. [Google Scholar] [CrossRef]
  25. Benard, N.; Moreau, E. Role of the electric waveform supplying a dielectric barrier discharge plasma actuator. Appl. Phys. Lett. 2012, 100, 193503. [Google Scholar] [CrossRef]
  26. Matsuno, T.; Sugahara, M.; Kawazoe, H.; Nishida, H. Development of Serrated Multi-Electrode Plasma Actuators for Enhanced Force Production. In Proceedings of the 54th AIAA Aerospace Sciences Meeting, San Diego, CA, USA, 4–8 January 2016. [Google Scholar] [CrossRef]
  27. Sato, S.; Furukawa, H.; Komuro, A.; Takahashi, M.; Ohnishi, N. Successively accelerated ionic wind with integrated dielectric-barrier-discharge plasma actuator for low-voltage operation. Sci. Rep. 2019, 9, 5813. [Google Scholar] [CrossRef]
  28. Moreau, E.; Cazour, J.; Benard, N. Influence of the air-exposed electrode shape on the electrical, optical and mechanical characteristics of a surface dielectric barrier discharge plasma actuator. J. Electrostat. 2018, 93, 146–153. [Google Scholar] [CrossRef]
  29. Debien, A.; Benard, N.; David, L.; Moreau, E. Unsteady aspect of the electrohydrodynamic force produced by surface dielectric barrier discharge actuators. Appl. Phys. Lett. 2012, 100, 013901. [Google Scholar] [CrossRef]
  30. Debien, A.; Benard, N.; Moreau, E. Streamer Inhibition for improving force and electric wind produced by DBD actuators. J. Phys. D Appl. Phys. 2012, 45, 215201. [Google Scholar] [CrossRef]
  31. Correale, G.; Michelis, T.; Ragni, D.; Kotsonis, M.; Scarano, F. Nanosecond-pulsed plasma actuation in quiescent air and laminar boundary layer. J. Phys. D Appl. Phys. 2014, 47, 105201. [Google Scholar] [CrossRef]
  32. Liu, Y.; Kolbakir, C.; Hu, H.; Hu, H. A comparison study on the thermal effects in DBD plasma actuation and electrical heating for aircraft icing mitigation. Int. J. Heat Mass Transf. 2018, 124, 319–330. [Google Scholar] [CrossRef]
  33. Kolbakir, C.; Hu, H.; Liu, Y.; Hu, H. An experimental study on different plasma actuator layout for aircraft icing mitigation. Aerosp. Sci. Technol. 2020, 107, 106325. [Google Scholar] [CrossRef]
  34. Abdollahzadeh, M.; Rodrigues, F.; Pascoa, J.C. Simultaneous ice detection and removal based on dielectric barrier discharge actuators. Sens. Actuator A Phys. 2020, 315, 112361. [Google Scholar] [CrossRef]
  35. Rodrigues, F.; Abdollahzadeh, M.; Pascoa, J.C.; Oliveira, P.J. An Experimental Study on Segmented-Encapsulated Electrode Dielectric-Barrier-Discharge Plasma Actuator for Mapping Ice Formation on a Surface: A Conceptual Analysis. J. Heat Transf. 2021, 143, 011701. [Google Scholar] [CrossRef]
  36. Biganzoli, I.; Capone, C.; Barni, R.; Riccardi, C. Note: Background oriented schlieren as a diagnostics for airflow control by plasma actuators. Rev. Sci. Instrum. 2019, 86, 026103. [Google Scholar] [CrossRef]
  37. Komuro, A.; Ogura, N.; Ito, M.; Nonomura, T.; Asai, K.; Ando, A. Visualization of density variations produced by alternating-current dielectric-barrier-discharge plasma actuators using the background-oriented-schlieren method. Plasma Sources Sci. Technol. 2019, 28, 055002. [Google Scholar] [CrossRef]
  38. Kaneko, Y.; Nishida, H.; Tagawa, Y. Background-oriented schlieren measurement of near-surface density field in surface dielectric-barrier-discharge. Meas. Sci. Technol. 2021, 32, 125402. [Google Scholar] [CrossRef]
  39. Kaneko, Y.; Emori, K.; Shimazaki, T.; Tagawa, Y.; Nishida, H. Investigation of Density and Flow Velocity Field of DBD Plasma Actuator in Quiescent Air Using Background Oriented Schlieren and Particle-Image-Velocimetry Method. In Proceedings of the 25th ICTAM 2020+1, Online, 22–27 August 2021; p. 108201. [Google Scholar]
  40. Hoskinson, A.E.; Hershkowitz, N.; Ashpis, D.E. Comparisons of Force Measurement Methods for DBD Plasma Actuators in Quiescent Air. In Proceedings of the 47th AIAA Aerospace Sciences Meeting Including The New Horizons Forum and Aerospace Exposition, Orlando, FL, USA, 5–8 January 2009. [Google Scholar] [CrossRef] [Green Version]
  41. Pons, J.; Moreau, E.; Touchard, G. Asymmetric surface dielectric barrier discharge in air at atmosphere pressure: Electrical properties and induced airflow characteristics. J. Phys. D Appl. Phys. 2005, 38, 3635–3642. [Google Scholar] [CrossRef]
  42. Hamdi, M.; Havet, M.; Rouaud, O.; Tarlet, D. Comparison of different tracers for PIV measurements in EHD airflow. Exp. Fluids 2014, 55, 1702. [Google Scholar] [CrossRef]
  43. Raffel, M. Background-oriented Schlieren (BOS) techniques. Exp. Fluids 2015, 56, 60. [Google Scholar] [CrossRef] [Green Version]
  44. Settles, G.S.; Hargather, M.J. A review of recent developments in Schlieren and shadowgraph techniques. Meas. Sci. Technol. 2017, 28, 042001. [Google Scholar] [CrossRef]
  45. Hayasaka, K.; Tagawa, Y.; Liu, T.; Kameda, M. Optical-flow-based background-oriented Schlieren technique for measuring a laser-induced underwater shock wave. Exp. Fluids 2016, 57, 179. [Google Scholar] [CrossRef] [Green Version]
  46. Yamamoto, S.; Tagawa, Y.; Kameda, M. Application of background-oriented schlieren (BOS) technique to a laser-induced underwater shock wave. Exp. Fluids 2015, 56, 93. [Google Scholar] [CrossRef] [Green Version]
  47. Hayasaka, K.; Tagawa, Y. Mobile visualization of density fields using smartphone background-oriented schlieren. Exp. Fluids 2019, 60, 171. [Google Scholar] [CrossRef] [Green Version]
Figure 1. Typical configuration of a DBDPA.
Actuators 11 00038 g001
Figure 2. Schemes of the plasma actuators: (a) plate-PA; (b) wire-PA.
Actuators 11 00038 g002
Figure 3. Power supply system of the PA: (a) schematic of the high-voltage supply and consumption power measuring system; (b) Q–V Lissajous curve, obtained from the charge Q and applied voltage V, in the case of 28 kVpp and 1 kHz.
Actuators 11 00038 g003
Figure 4. PIV system.
Actuators 11 00038 g004
Figure 5. Principle of the BOS technique.
Actuators 11 00038 g005
Figure 6. System for the BOS density field measurement.
Actuators 11 00038 g006
Figure 7. Photograph of the discharge emission of the plate-PA. An enlarged view of the area around the discharge is shown in a red frame: (a) row image; (b) binarized image.
Actuators 11 00038 g007
Figure 8. Flow velocity field of the plate-PA, obtained by PIV: (a) streamlines and the horizontal velocity; (b) streamlines and the vertical velocity.
Actuators 11 00038 g008
Figure 9. Density field of the plate-PA, obtained from the BOS measurement.
Actuators 11 00038 g009
Figure 10. x-profiles of the flow, density field, and surface temperature of the plate-PA: (a) x-profiles of the horizontal velocity, density, and temperature; (b) x-profiles of the vertical velocity, density, and temperature. The blue marker shows the horizontal and vertical velocity. The red and green markers show the density and surface temperature, respectively.
Actuators 11 00038 g010
Figure 11. x-profiles of the flow and density field of the plate-PA: (a) x-profiles of the horizontal velocity (y = 0.8 and 2.171 mm) and density (y = 0.772 and 2.161 mm); (b) x-profiles of the vertical velocity (y = 0.8 and 2.171 mm) and density (y = 0.772 and 2.161 mm).
Actuators 11 00038 g011
Figure 12. Forming mechanism of the flow and density field of the plate-PA.
Actuators 11 00038 g012
Figure 13. Photograph of the discharge emission of the wire-PA. An enlarged view of the area around the discharge is shown in the red frame: (a) row image; (b) binarized image.
Actuators 11 00038 g013
Figure 14. Flow velocity field of the wire-PA, obtained by PIV: (a) streamlines and the horizontal velocity; (b) streamlines and the vertical velocity.
Actuators 11 00038 g014
Figure 15. Density field of the wire-PA.
Actuators 11 00038 g015
Figure 16. x-profiles of the flow, density field, and surface temperature of the wire-PA: (a) x-profiles of the horizontal velocity, density, and temperature; (b) x-profiles of the vertical velocity, density, and temperature. The blue marker shows the horizontal and vertical velocities. The red and green markers respectively show the density and surface temperature.
Actuators 11 00038 g016
Figure 17. x-profiles of the flow, density field of the wire-PA: (a) x-profiles of the horizontal velocity (y = 0.8 and 2.171 mm) and density (y = 0.772 and 2.161 mm); (b) x-profiles of the vertical velocity (y = 0.8 and 2.171 mm) and density (y = 0.772 and 2.161 mm).
Actuators 11 00038 g017
Figure 18. Forming mechanism of the flow and density field of the plate-PA.
Actuators 11 00038 g018
Figure 19. y-profiles of the horizontal velocity of (a) the plate-PA and (b) the wire-PA.
Actuators 11 00038 g019
Figure 20. Control volume for the momentum conservation equation.
Actuators 11 00038 g020
Figure 21. Momentum flux at the left and right side of the CV of the plate- and wire-PA.
Actuators 11 00038 g021
Figure 22. y-profiles of the density of (a) the plate-PA and (b) the wire-PA.
Actuators 11 00038 g022
Table 1. Conditions of the velocity field calculation.
Image correlation algorithmMulti-grid interrogation
Multiple correlation
Image deformation correlation
Spatial resolution0.014 mm/pixel
Interrogation window sizeInitial: 96 pixels
Final: 32 pixels
Overlap50%
Number of fields100 (20 × 5)
Table 2. Conditions for the displacement field calculation.
Image correlation algorithmMulti-grid interrogation
Multiple correlation
Image deformation correlation
Spatial resolution0.013 mm/pixel
Interrogation window sizeInitial: 96 pixels
Final: 48 pixels
Overlap80%
Number of fields40 (10 × 4)
Publisher’s Note: MDPI stays neutral with regard to jurisdictional claims in published maps and institutional affiliations.

