Aerodynamic Drag Reduction and Optimization of MIRA Model Based on Plasma Actuator


1
School of Vehicle Engineering, Chongqing University of Technology, Chongqing 400054, China
2
Institute of Fluid Science, Tohoku University, Sendai 980-8577, Japan
*
Author to whom correspondence should be addressed.
Actuators 2020, 9(3), 64; https://0-doi-org.brum.beds.ac.uk/10.3390/act9030064
Submission received: 3 July 2020
/
Revised: 23 July 2020
/
Accepted: 28 July 2020
/
Published: 30 July 2020
(This article belongs to the Section Actuators for Land Transport)
Abstract
:Active flow control of surface dielectric barrier discharge (SDBD) plasma is a technology that converts electrical energy into kinetic energy to achieve flow control. Its main application areas are concentrated in the aviation field. Undoubtedly, few studies have applied it in the field of automobile flow control. Meanwhile, during high-speed driving, there is a serious airflow separation phenomenon at the rear of notch-back cars, which brings a large area of negative pressure to the back of the cars. Due to the huge pressure difference between the front and end of the cars, it will increase the driving drag and fuel cost of the car. In this context, we seek to discuss the control effect on the airflow separation at the rear of the notch-back by using the phenomenological numerical simulation method of plasma flow control. Firstly, the plasma actuator is arranged separately on the rear end of the roof, c-pillar, upper and side of the trunk to study the control effect of airflow separation. After that, the plasma actuators at each position are combined and actuated simultaneously. We try to observe the control effect of airflow separation and select the combination with the best drag reduction effect. In the third stage, an efficient global optimization (EGO) algorithm based on kriging response surface is applied to optimize the supply voltage of the best combination that has been obtained before and obtain the driving voltage parameter of each actuator optimized under this combination. The results show that when plasma actuation is applied at four locations, only the actuation applied to the side of the luggage compartment has a significant drag reduction effect, while in other cases, the drag coefficient will increase. Specifically, drag reduction is better when the actuation is applied at four positions simultaneously. The maximum drag reduction coefficient of the car is reduced by 13.17%.
1. Introduction
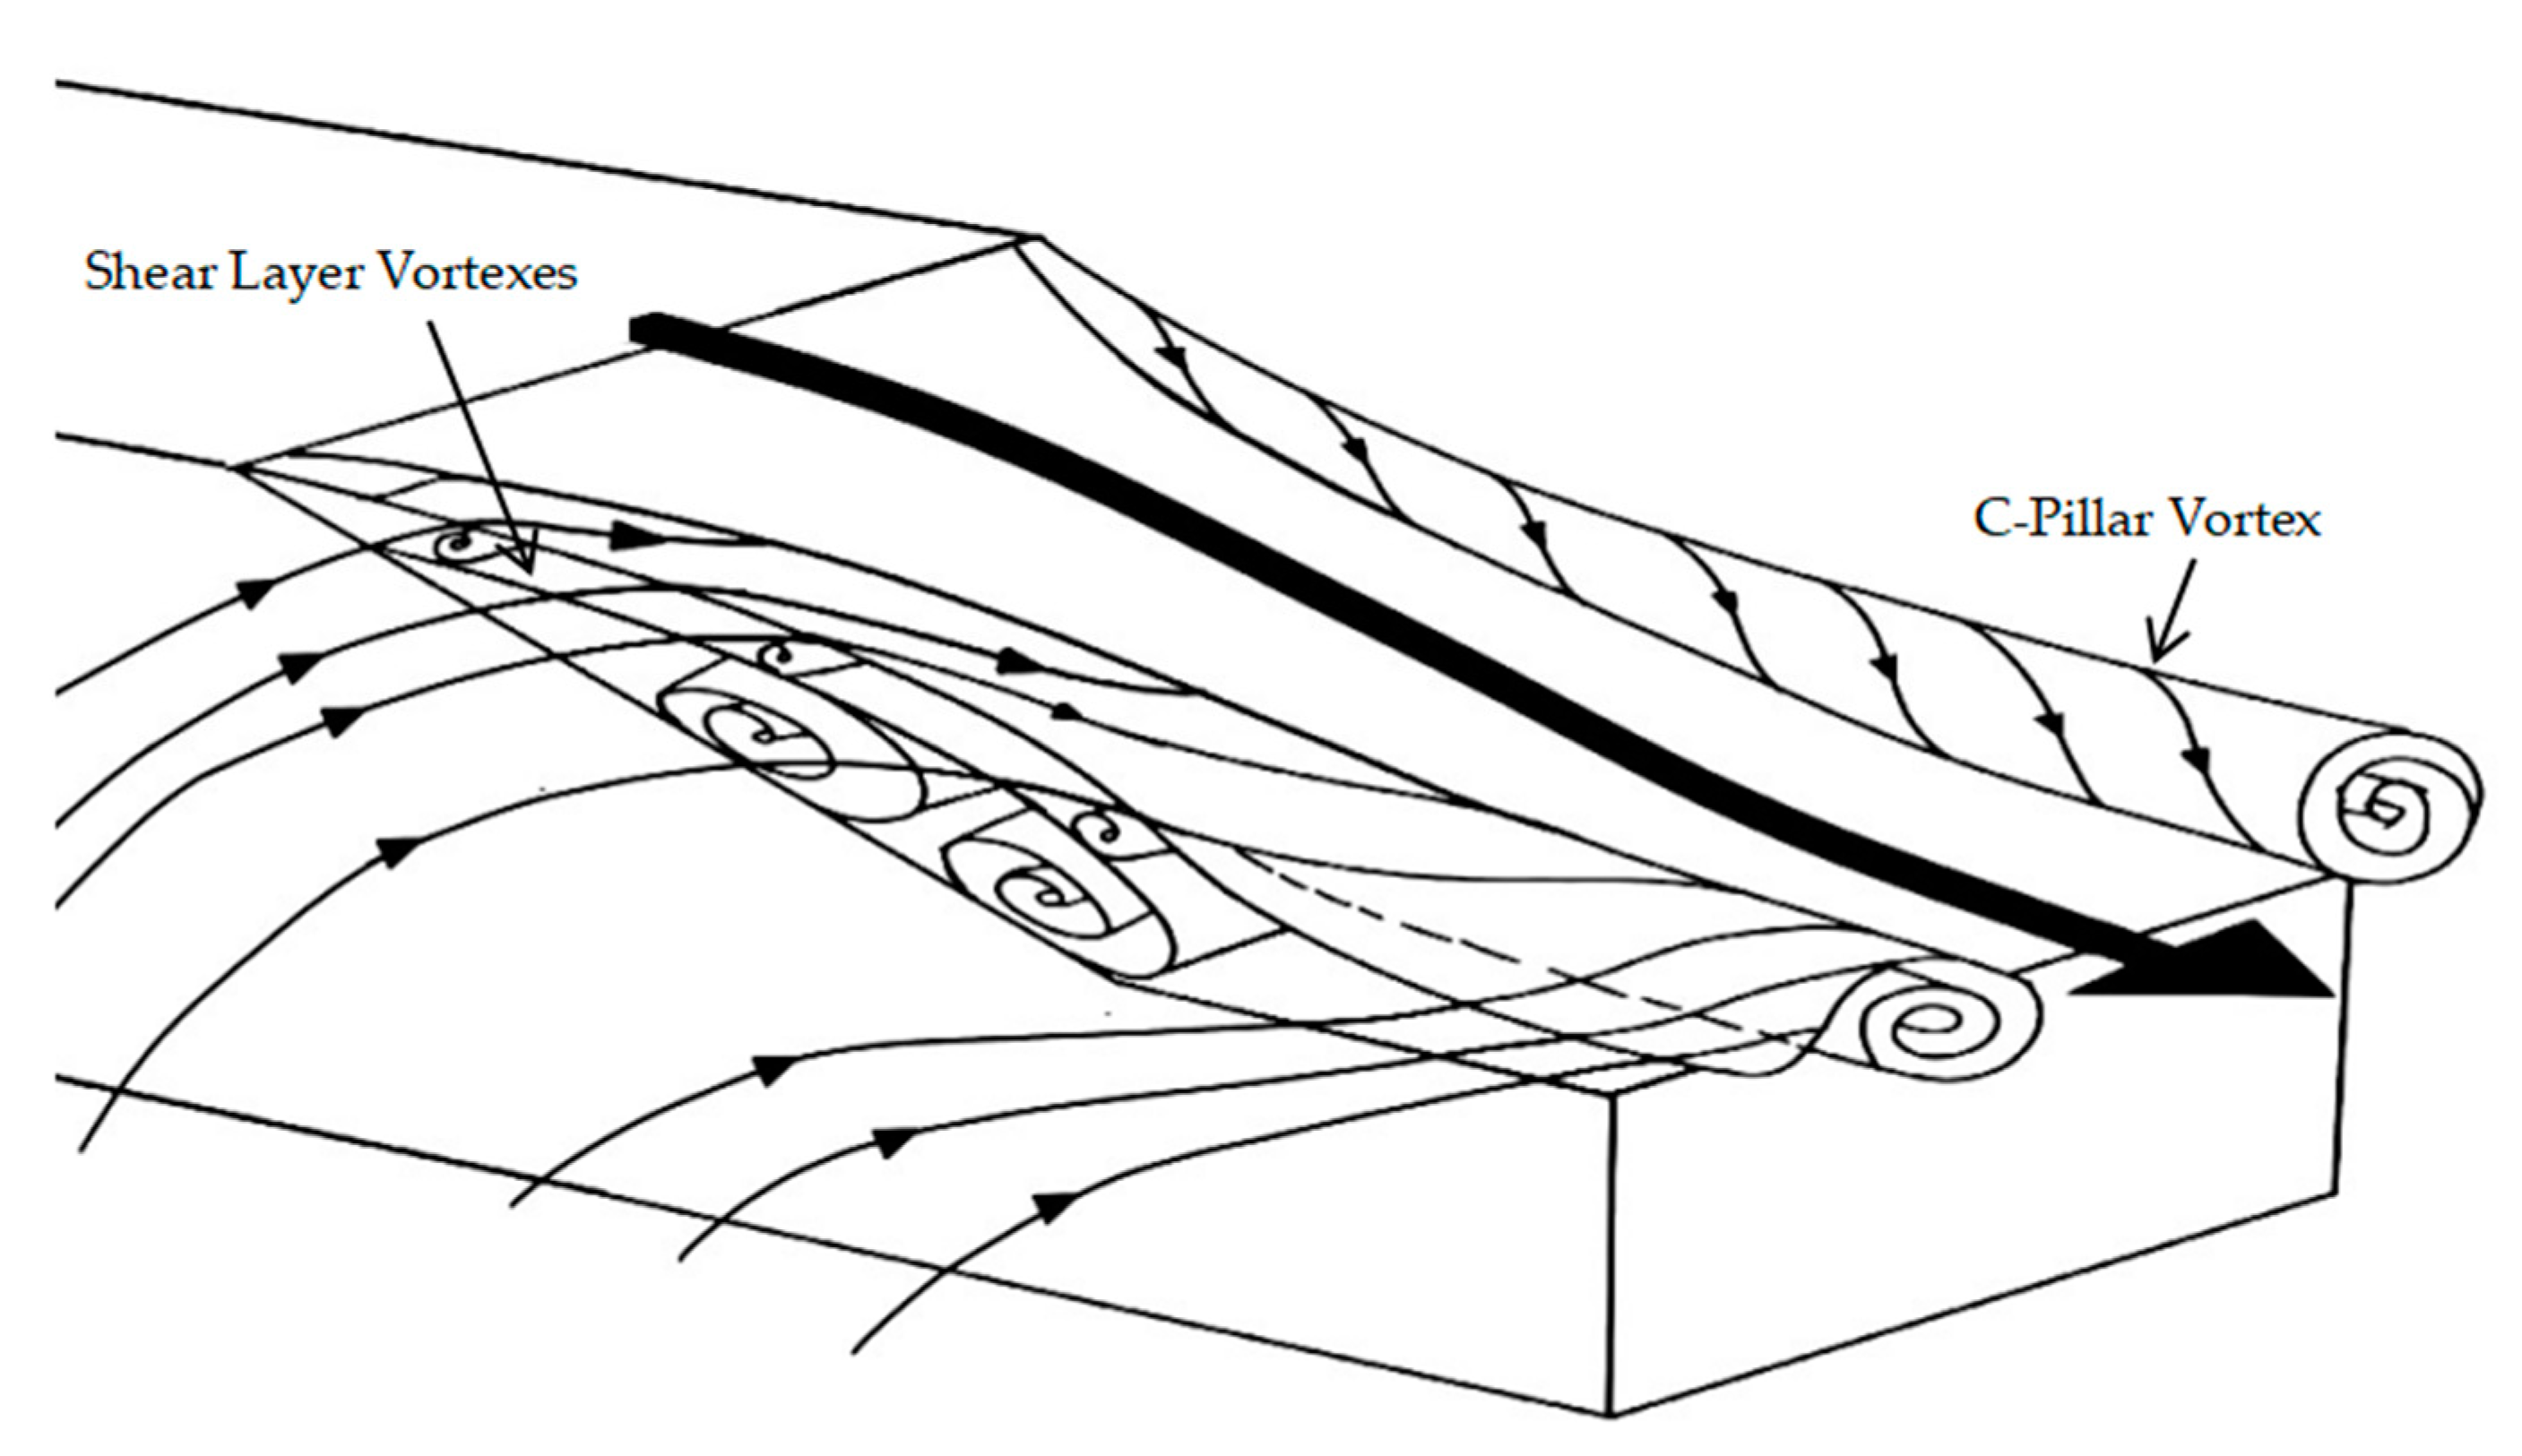
With the rapid development of the expressway, vehicle speed has been constantly improved, which puts forward higher requirements for vehicles’ handling stability and safety. Meanwhile, due to the intensifying energy crisis, improving the fuel economy of automobiles has become an important research direction [1]. The studies on the airflow separation of the rear of the notch-back vehicle generally indicate that the airflow tends to separate at a fixed location (edge of a roof, c-pillar, the edge of trunk lid) (see Figure 1), which mainly consists of two-dimensional and three-dimensional separation structures. Moreover, due to the three-dimensional effect of fluid flow, the separated vortexes are very adjacent, and tend to interact with each other, resulting in a more complex airflow structure at the rear of the vehicle [2,3].
The technology of passive flow control is mostly used in aerodynamic drag reduction of cars. Wang studied the aerodynamic characteristics of different tail shapes of a Motor Industry Research Association (MIRA) model through a wind tunnel test [4]. The research on the pit, convex hull and groove non-smooth surface at the rear of the MIRA notch-back model also show that it has a drag reduction effect [5,6]. However, specific working conditions must be in position if we are to seek perfect passive flow control performance.
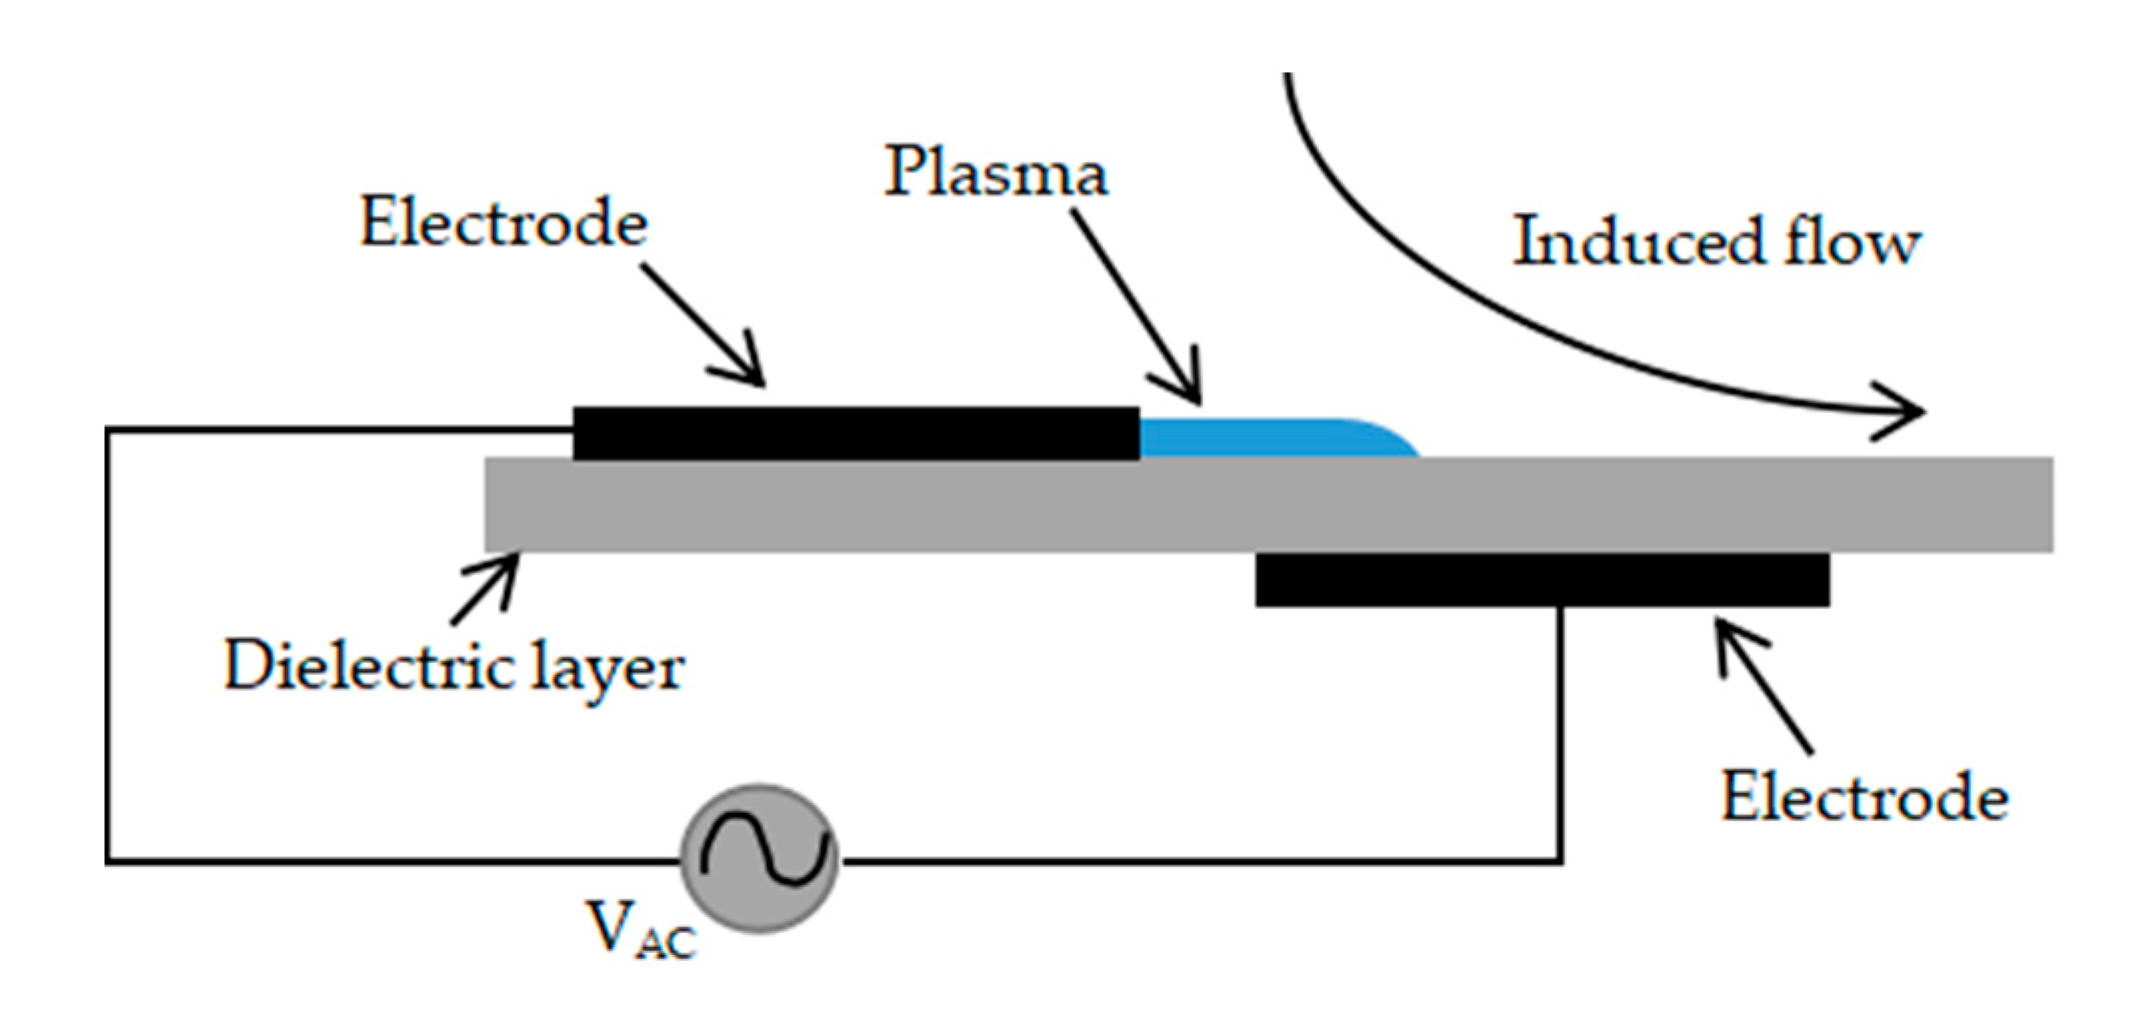
In recent years, active flow control has become an increasingly attractive subject in the field of aerodynamics, especially plasma active flow control, which has been broadly favored by researchers thanks to its advantages of simple structure, low energy consumption and fast response speed [7]. The earliest used DC corona surface discharge plasma actuator was to control fluid flow, but it was not applied on a large scale due to its unstable discharge [8]. Compared with DC corona surface discharge, the plasma generated by surface dielectric barrier discharge (SDBD) is more united, and its flow control effect is better [9]. The structure of an SDBD plasma actuator is shown in Figure 2. The two electrodes are alternately arranged on the upper and lower sides of the insulating dielectric layer. The upper electrode is exposed to the air and connected to the positive electrode of the power supply, and the lower electrode is buried in the dielectric layer and connected to the negative electrode of the power supply. The air surrounding the bare electrode will be ionized, when a high voltage is applied, producing a blue plasma as is shown in Figure 2. The plasma will move in the direction of the electric field and collide with neutral gas molecules to transfer momentum, thereby accelerating the fluid near the wall surface [10]. Undoubtedly, there exist scopes of improvements for the enormous energy consumption and control capabilities of SDBD plasma actuators. Some researchers added a bare electrode to the plasma actuator, connecting it to the buried electrode, thereby reducing the breakdown potential and increasing the coverage of the plasma generated by the discharge [11]. Serpentine, horseshoe and round shapes of plasma actuators have been developed to improve control capabilities [12,13]. Recently, it is worth noting that a new plasma actuator of a stair-shaped dielectric layer was proposed by Rodrigues et al. [14,15], which leads to an increase in both plasma discharge extension and maximum induced flow velocity. Other researchers have greatly improved the plasma flow control capability by changing the AC actuation to nanosecond pulse actuation. It mainly releases heat and generates micro-explosion impact, when the pulse width is small. It has two kinds of actuation, namely body force acceleration and heat release impact, when the pulse width is large. It has a unique advantage in generating an induced vortex compared with AC actuation [16,17,18].
At present, there is no consensus on the flow control mechanism of plasma, of which momentum and energy effects are considered to be the most important. The SDBD has a weak non-thermal effect on the location of transonic shock waves, but it is more inclined to the effect of discharge heating [19]. Shang et al. [20] believed that the main impact of plasma discharge is for electrons to convert electrical energy into heat energy and transfer it to the fluid, while the positive ions have no obvious effect. According to the similarity of discharge in space and time, and considering the asymmetry of discharge and not controlling the direction of momentum coupling, Enloe et al. [21] believed that the collision between plasma and neutral particles caused momentum transmission and generated volume force, and that was the main coupling mechanism. Roupassov et al. [22] proposed a generally accepted view that the energy coupling mechanism is related to the actuation source. For AC actuation, the momentum transfer is the main influence mechanism, and for nanosecond pulse actuation, heat transfer is the main influence mechanism.
Most of the numerical simulation studies on plasma flow control use phenomenological methods, without taking the discharge process into consideration. The body force or thermal effect generated by the plasma are directly substituted into the aerodynamic equation as the momentum and the energy source term, respectively [23,24].
The SDBD plasma flow control technology boasts a wide range of applications. It has a remarkable effect on the flow separation of the delayed boundary layer [25,26]. Some researchers have used plasma to inhibit airfoil flow separation, thereby reducing airfoil drag and increasing lift [27,28]. Meanwhile, the SDBD plasma has also been applied in turbine compressor stabilization and efficiency enhancement [29], and noise-canceling [30]. What is worth mentioning is that there are researchers in the world beginning to put plasma aerodynamic actuation into an application to reduce the drag coefficients of land vehicles in recent years. SHIMIZU et al. [31] installed plasma actuators at the rear of a simplified three-dimensional blunt car body, where the induced flow direction is opposite to the mainstream direction, which promotes flow separation, and successfully moves the longitudinal vortex away from the rear end angle. The surface pressure increases with the displacement of the vortex, resulting in a reduction in the drag of the car. Michelis et al. [32] proved plasma actuators can reduce or eliminate the leading-edge separation of guide vanes for full-scale transport truck side mirrors by a wind tunnel test. Comparing the control effects of linear and serpentine plasma actuators on the rear flow field of the tractor-trailer truck by Roy et al. [33], it was found that the former fails to reduce the drag, while the latter has a big change in the drag, and obtained the drag drops by more than 14% and 10% at an inflow velocity of 26.8 and 31.3 m/s. At the same time, some researchers use plasma actuators to control the airflow separation on the rear window of the Ahmed model, so as to achieve the purpose of reducing drag [34,35,36].
Based on the above discussion, it is appropriate to apply the SDBD plasma active flow control techniques for automobile aerodynamic drag reduction. In this paper, in order to reduce the aerodynamic drag of the vehicle, the control of plasma on the airflow separation at the rear of the car will be studied via the phenomenological numerical simulation method, and to explore the influence of the actuation of location as well as voltage on the control effect. The efficient global optimization (EGO) algorithm based on the response surface is used to optimize the actuation voltage at each location to obtain the optimal control strategy. Compared with previous studies, this paper combines optimization algorithms with plasma flow control. In this way, an optimal control strategy and the relationship between control variables and targets can be obtained. The results of this paper will be used as a reference for the application of plasma in an automobile.
2. Geometry and Simulation Method
2.1. Research Model and Mesh Strategy
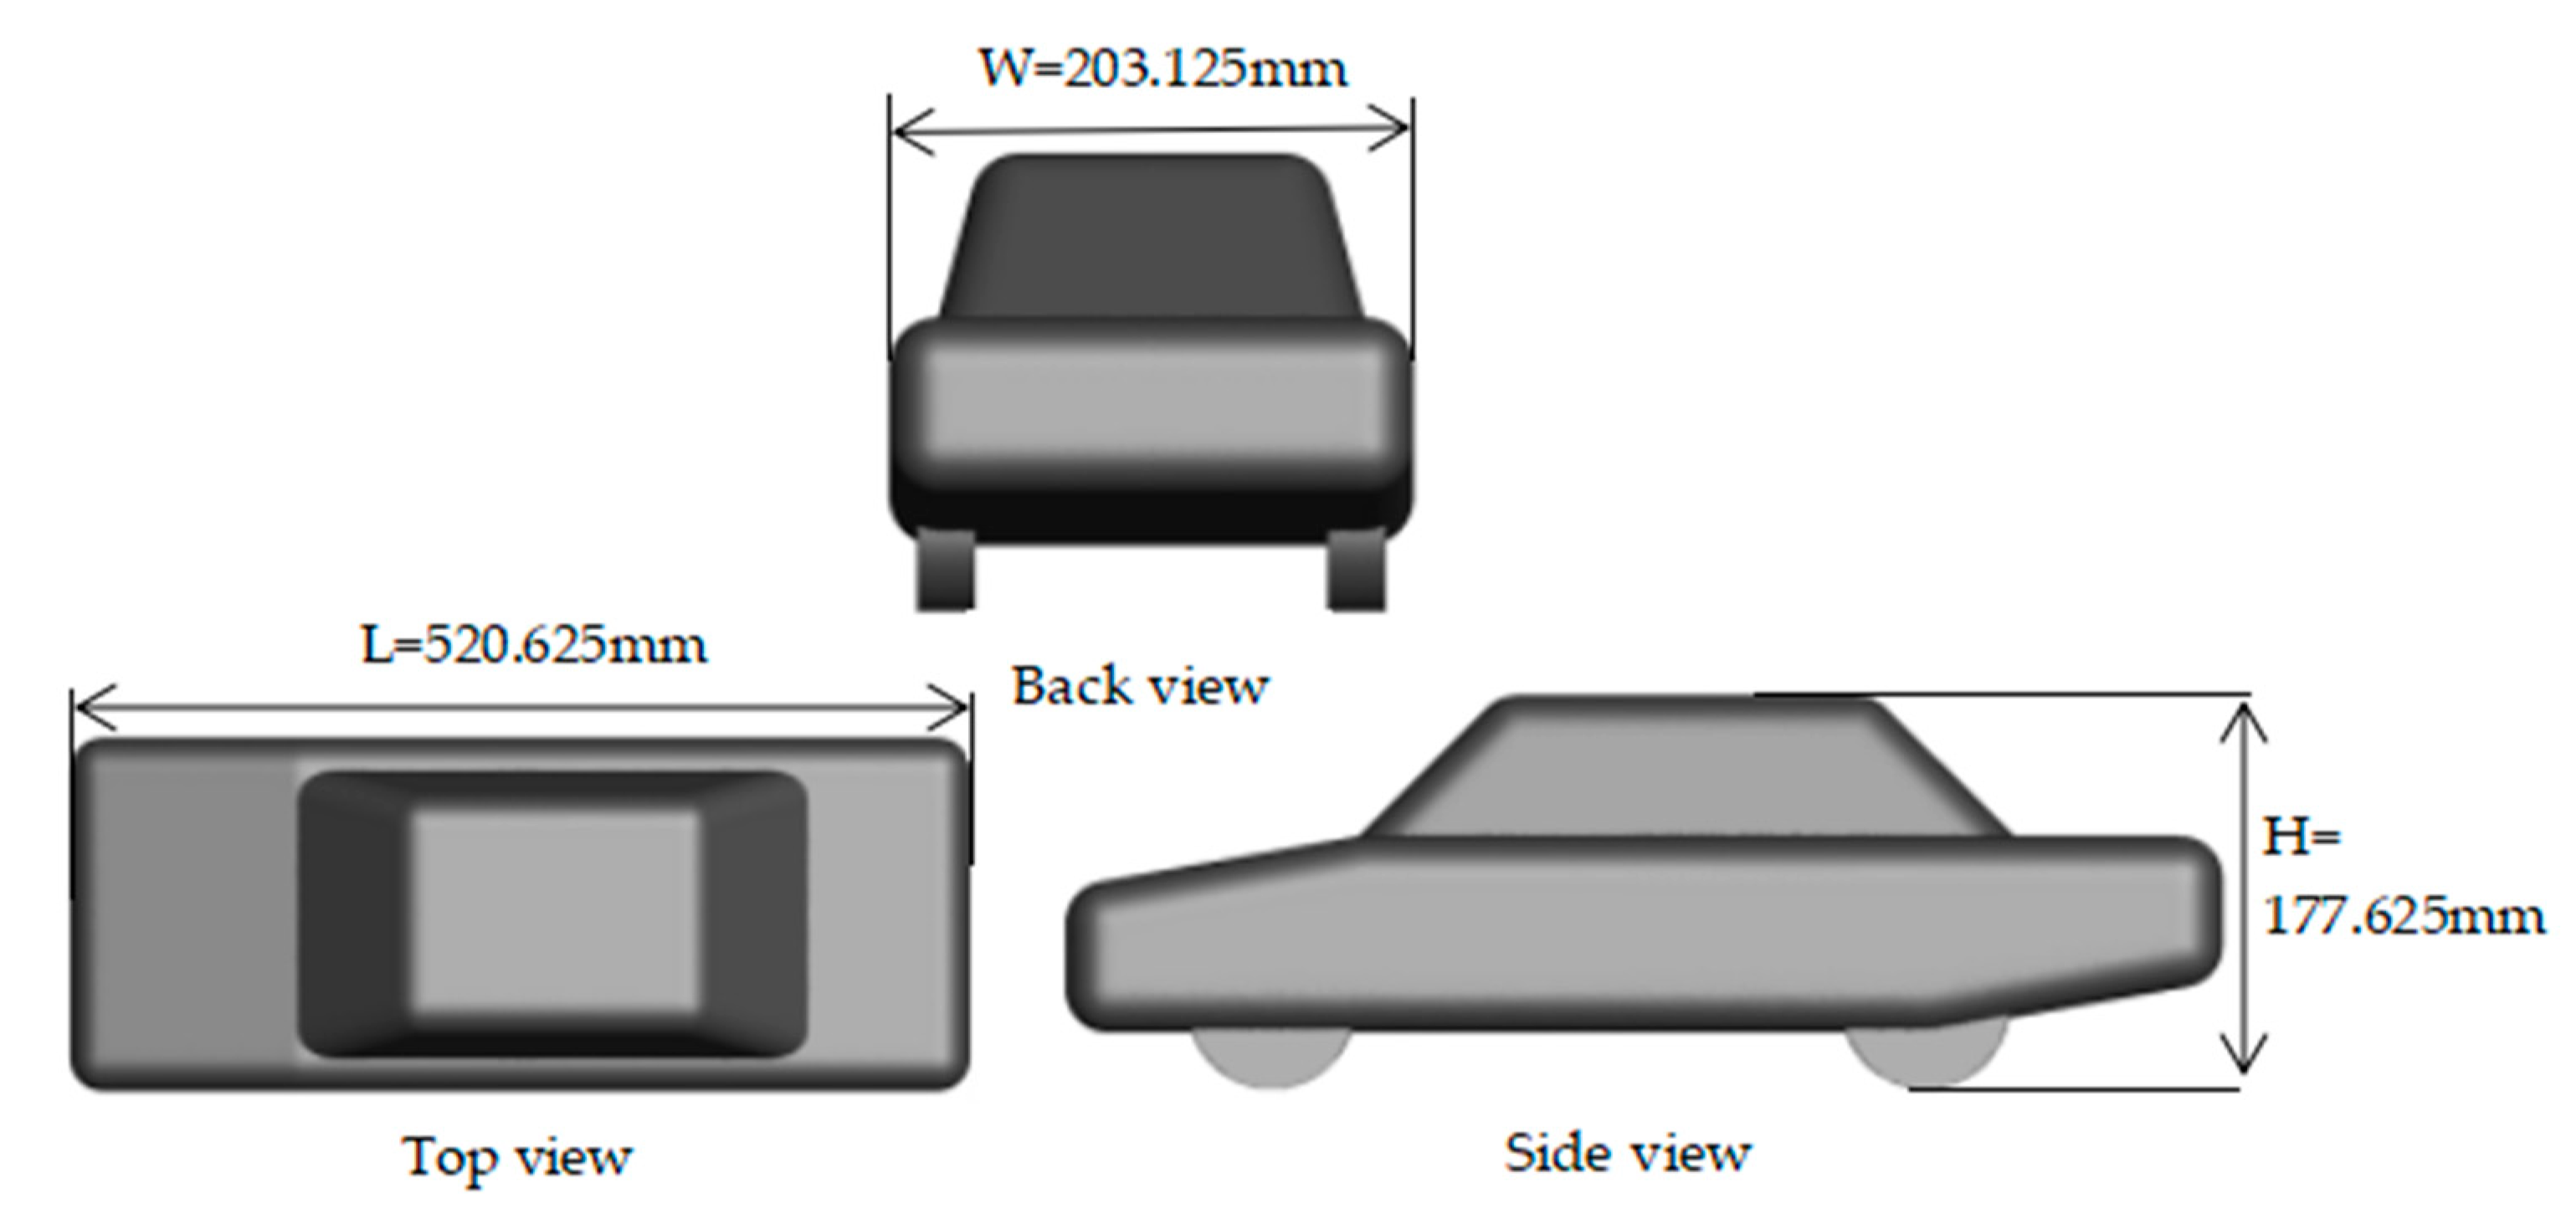
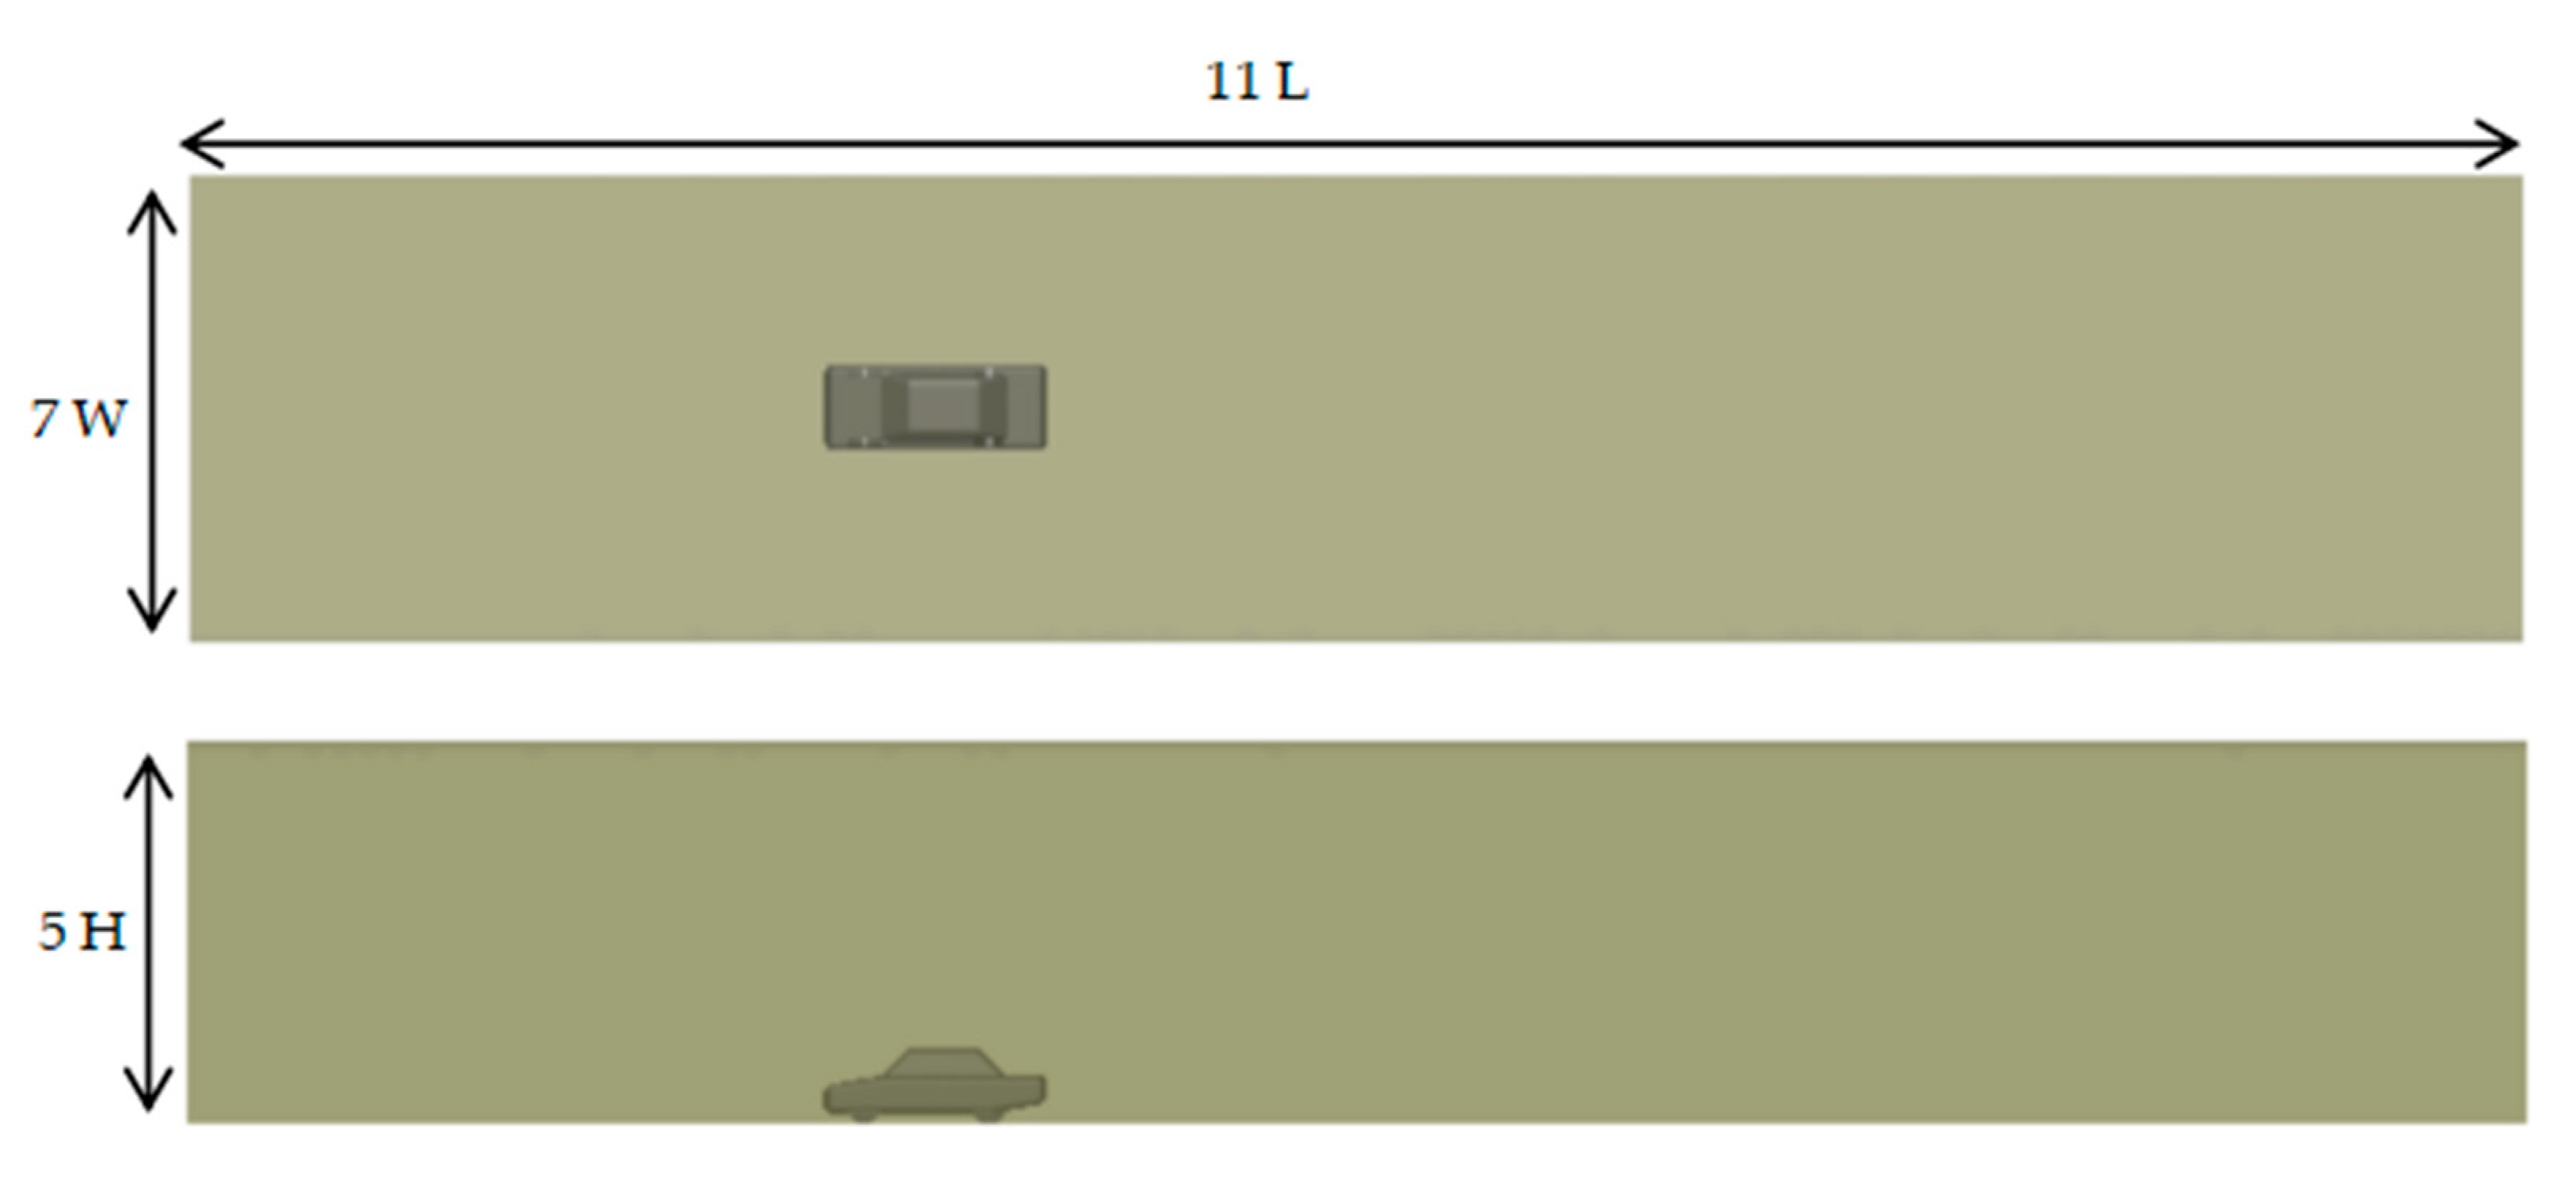
The research model (see Figure 3) is a simplified model build in CATIA based on the standard model of the Motor Industry Research Association (MIRA). It reduced the scale of the whole vehicle model by 8 times; meanwhile, it ignored details that have no impact on this study, such as engine compartment, rear-view mirror and other components. The length, width and height of the model are 520.625, 203.125 and 177.625 mm, respectively. The coordinate origin O is set at the midpoint of the intersection of the plane where the front and the chassis are located. To meet the requirement that the blocking ratio of the computing domain (see Figure 4) is less than 5%, and fully develop the fluid, the fluid inlet and outlet are 3 times and 7 times the length of the vehicle, respectively, the upper surface is 4 times the height of the vehicle and the side surface is 3 times the width of the vehicle. After calculation, the computation domain blocking ratio is 2.23%.
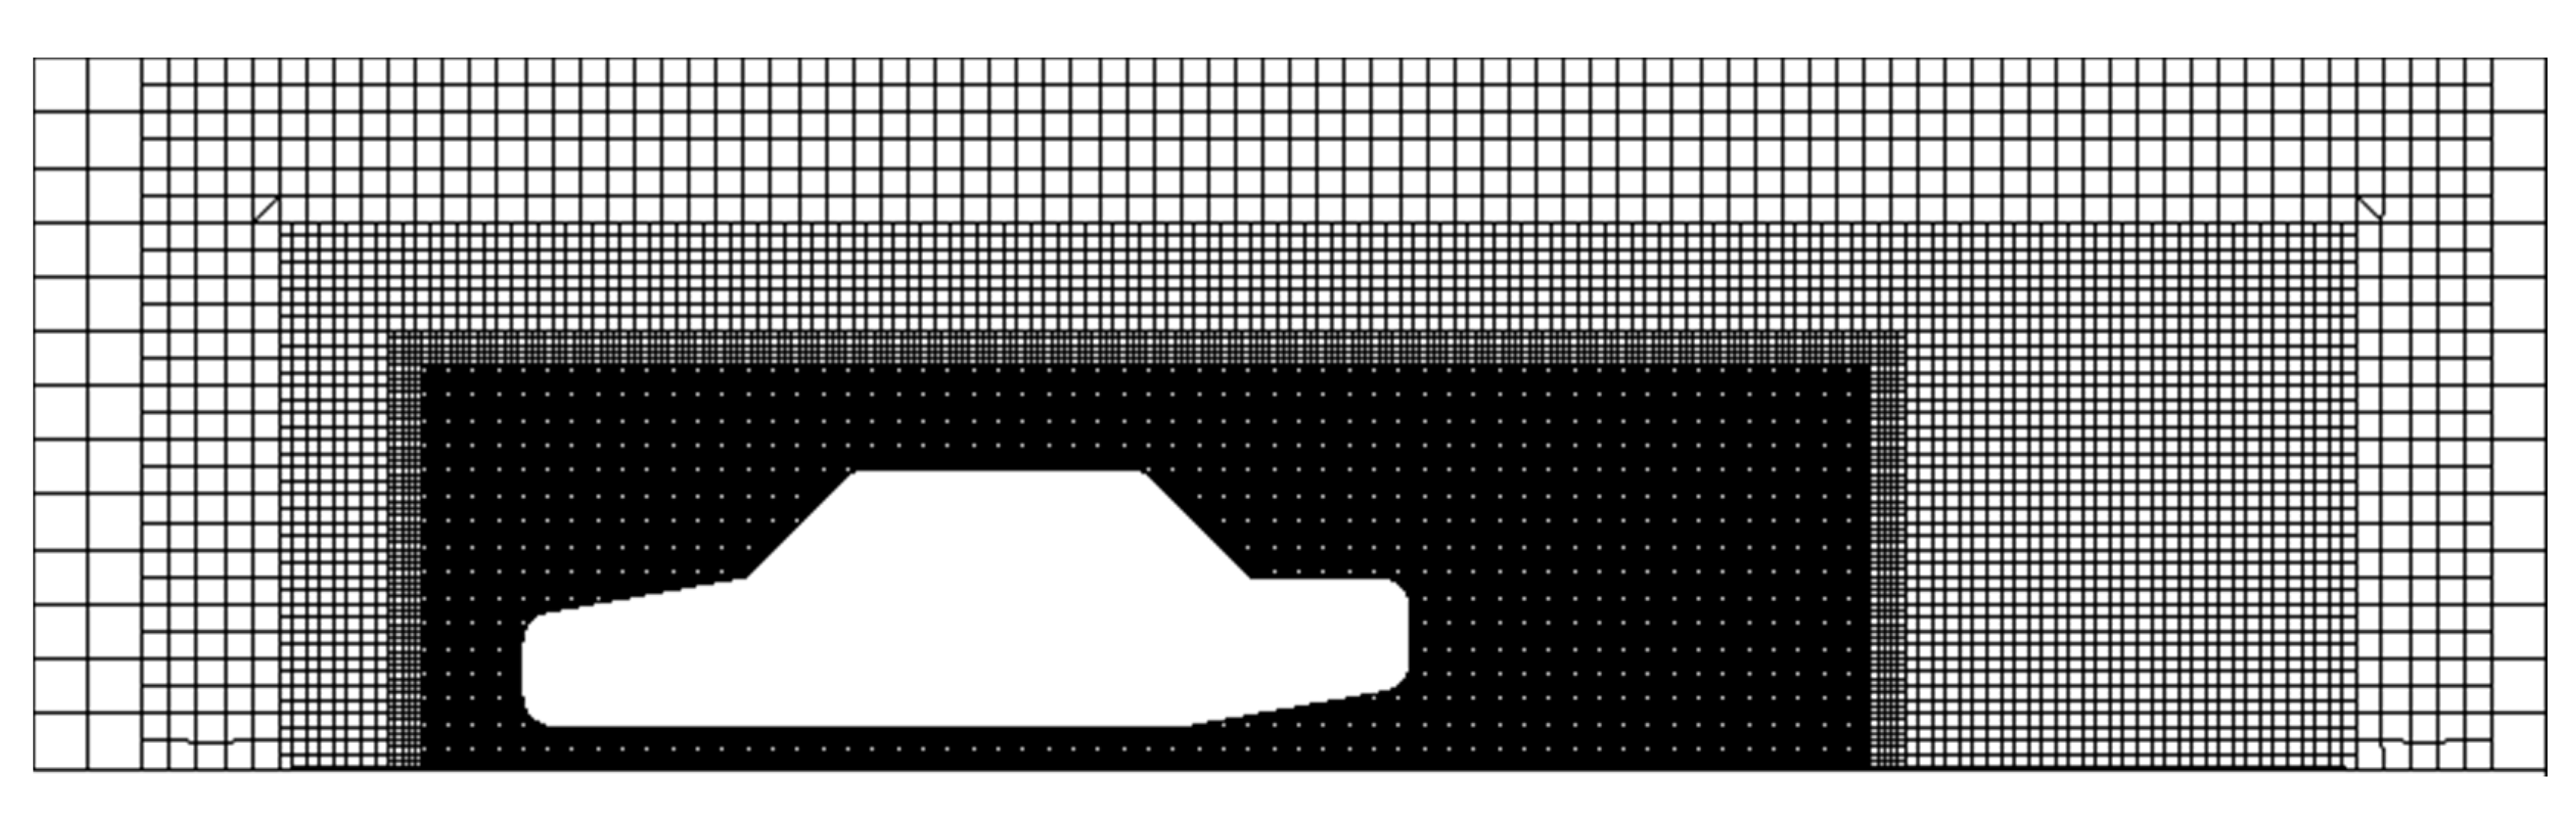
Structured mesh is used to generate mesh in the STAR CCM+ software (see Figure 5). Encrypt the mesh closer to the body surface and the tail of the car area. In order to accurately capture the flow details in the boundary layer, the grid nodes of the first prism layer need to be arranged in the viscous bottom layer, and the y+ value should be less than or equal to 1 [37], therefore the thickness of the first boundary layer grid is set to 0.01 mm, and the total thickness of the boundary layer is 2mm. After the verification of grid independence, the number of the mesh remains around 5 million, which has little influence on the calculation results. Table 1 shows the Cd results of the experiment and numerical simulation, where the error is 1.4% and meets the accuracy requirement.
2.2. Boundary Condition and Solver Settings
The CFD simulation is carried out in the commercial software STAR CCM+. The velocity inlet boundary condition is set to 30m/s, the outlet as pressure outlet, the reference pressure is atmospheric pressure and the ground of the calculation domain adopts the boundary condition of no sliding wall; the other walls are the symmetric wall. Selecting the turbulence model, the second order upwind difference is used for dissociation, and the SIMPLE algorithm based on pressure–velocity coupling solves the fluid governing equation.
2.3. Plasma Body Force Model
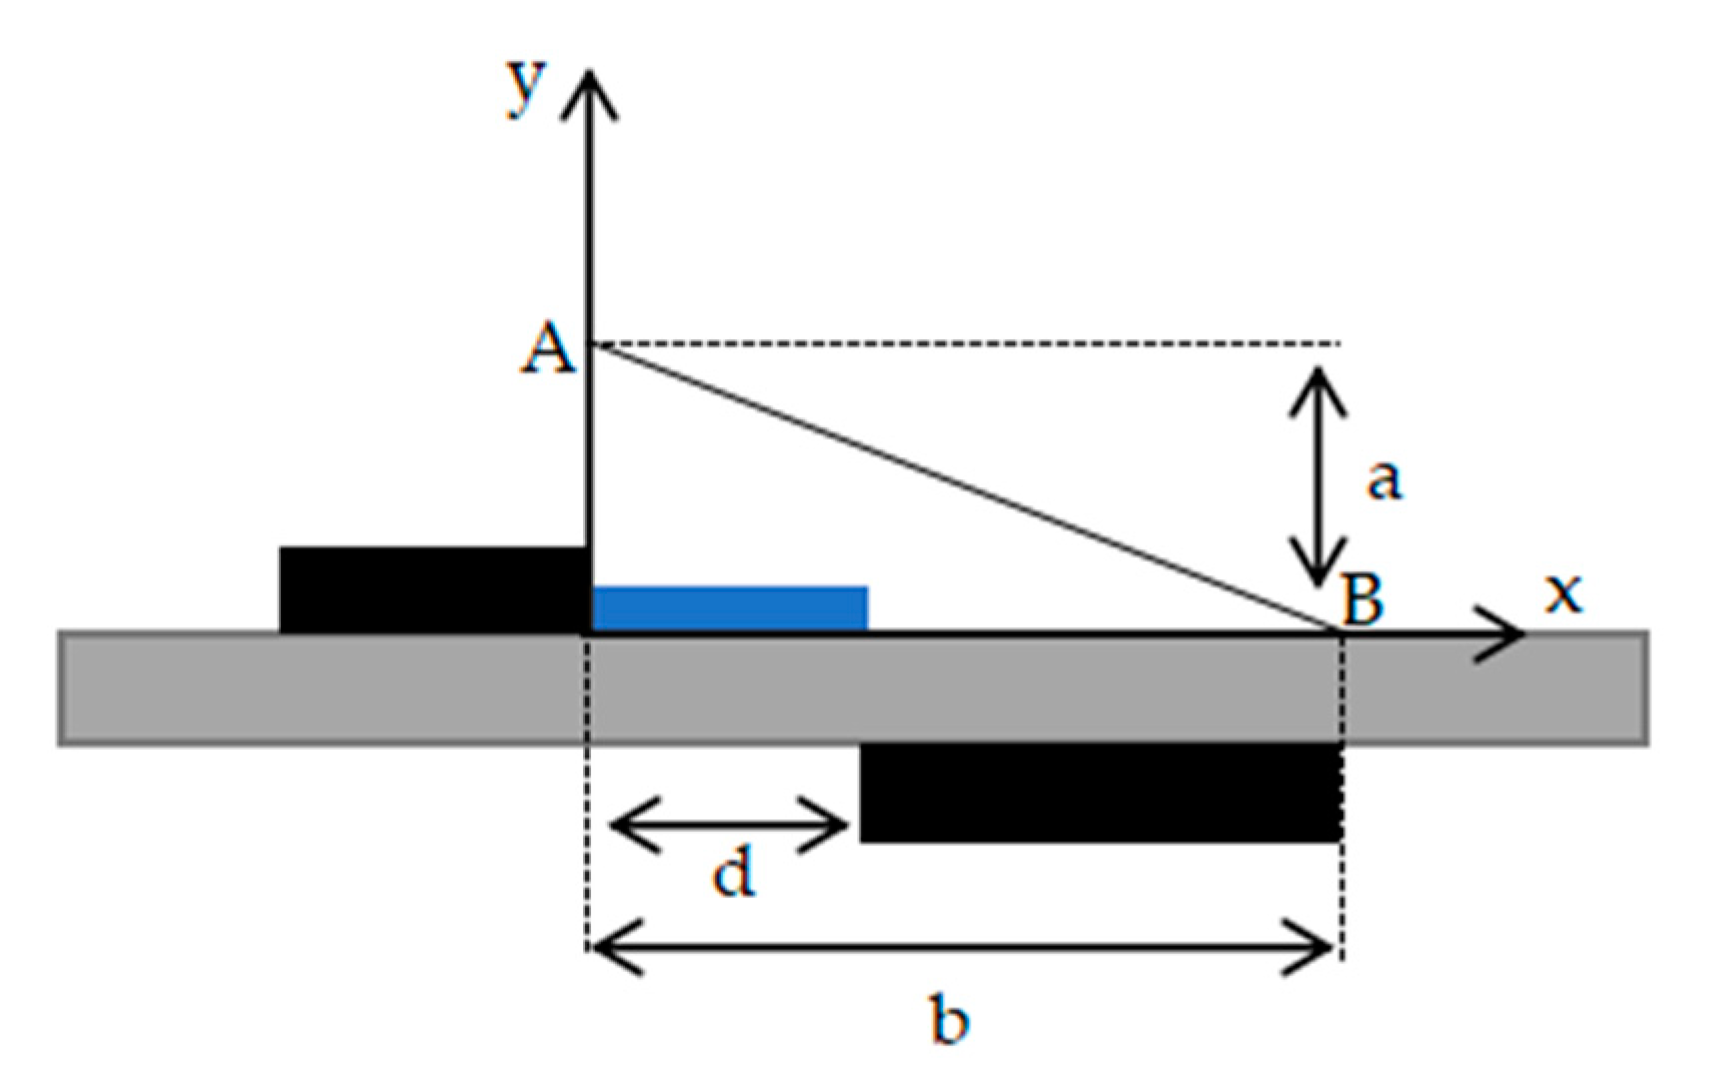
The numerical simulation of SDBD plasma on fluids was developed by Shyy et al. [23]. Instead of considering the discharge process, the force acted by plasma discharge on the fluid is put into the fluid governing equation in the form of a momentum source term for calculation. The body force of plasma acting on the fluid can be approximated by a quantitative model considering the dielectric properties, actuated frequency and geometries of the electrodes. The electric intensity is greatest at the right end of the exposed electrode and gradually decreases downstream. When the electric intensity is too weak to break down the air, there will be no plasma. Therefore, the plasma region can be approximately a triangle (see Figure 6). The lengths of the upper and lower electrodes are 0.5 and 3 mm, respectively. Their thickness is 0.1 mm, a is the height of the plasma = 1.5 mm, b is the width of the plasma = 3 mm and the side of AB represents the boundary of the plasma. The distribution of the electric field is approximately linear in the triangle. The electric intensity can be expressed as a linear function:
where is the electric field in the blue region in Figure 6, where it can be approximated as
where is the applied voltage root mean square (rms), and d is the distance between the two electrodes in the horizontal direction = 0.25 mm. and are constants, and they can be estimated by the electric intensity threshold of the breakdown air (30 kv/cm). The components of the electric field are given by
Since the time scale of the micro-discharge and the excitation period of the power source is several orders of magnitude different from the response scale of the fluid, it can be considered that the plasma body force on the fluid is steady. It can, therefore, be approximated by
where is the frequency of the applied voltage, is the effective coefficient of elastic collision = 1, is the charge density = , is the elementary charge = , is the discharge time = , and is the Dichler function, and to determine the scope of plasma action, the value is equal to 1, when the electric intensity reaches the threshold of breaking down the air.
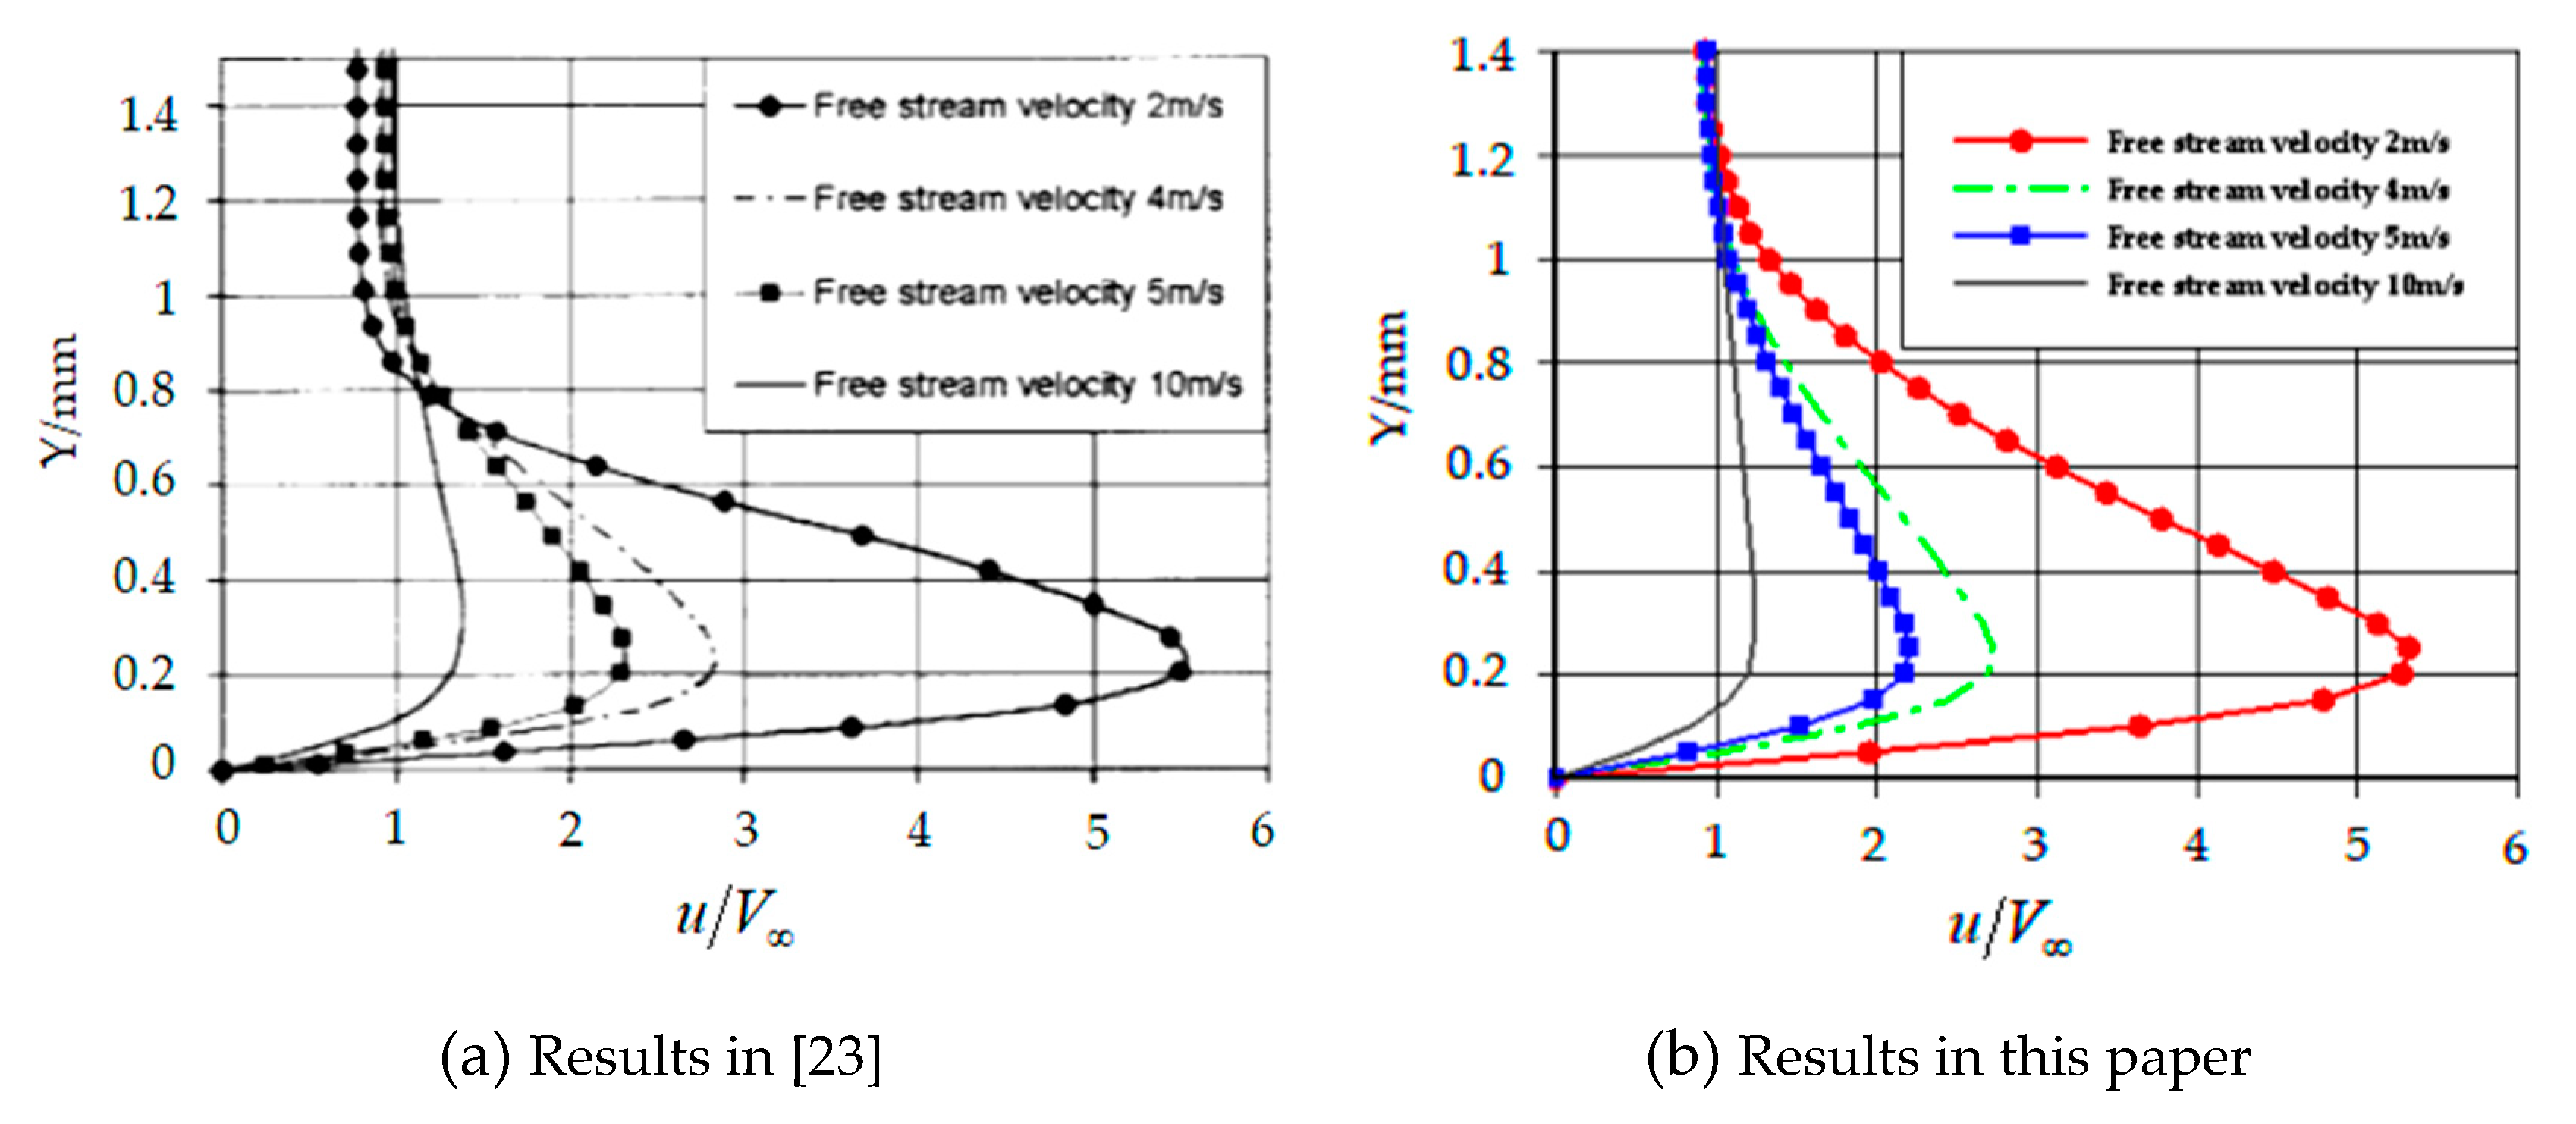
The plasma model is implemented by a user-defined function (UDF) of the STAR CCM+ software. To compare with the results in reference [23], the actuation voltage and frequency are 5.6568 kV and 3 kHz, respectively. If we put together the investigation on the velocity distribution along the y direction at 3.8 mm downstream of the upper electrode and the comparison between Shyy’s results (see Figure 7), we can get the observation result that the velocity distribution trends under various incoming flow velocities are in good agreement, thus verifying the accuracy of the plasma simulation in this paper. According to the previous experimental study [38], the influence of actuation frequency on the maximum average velocity of plasma-induced fluid is very subtle. Therefore, the later research only considers the influence of the voltage input parameters of the actuator on the control effect.
2.4. Location of Plasma Actuators
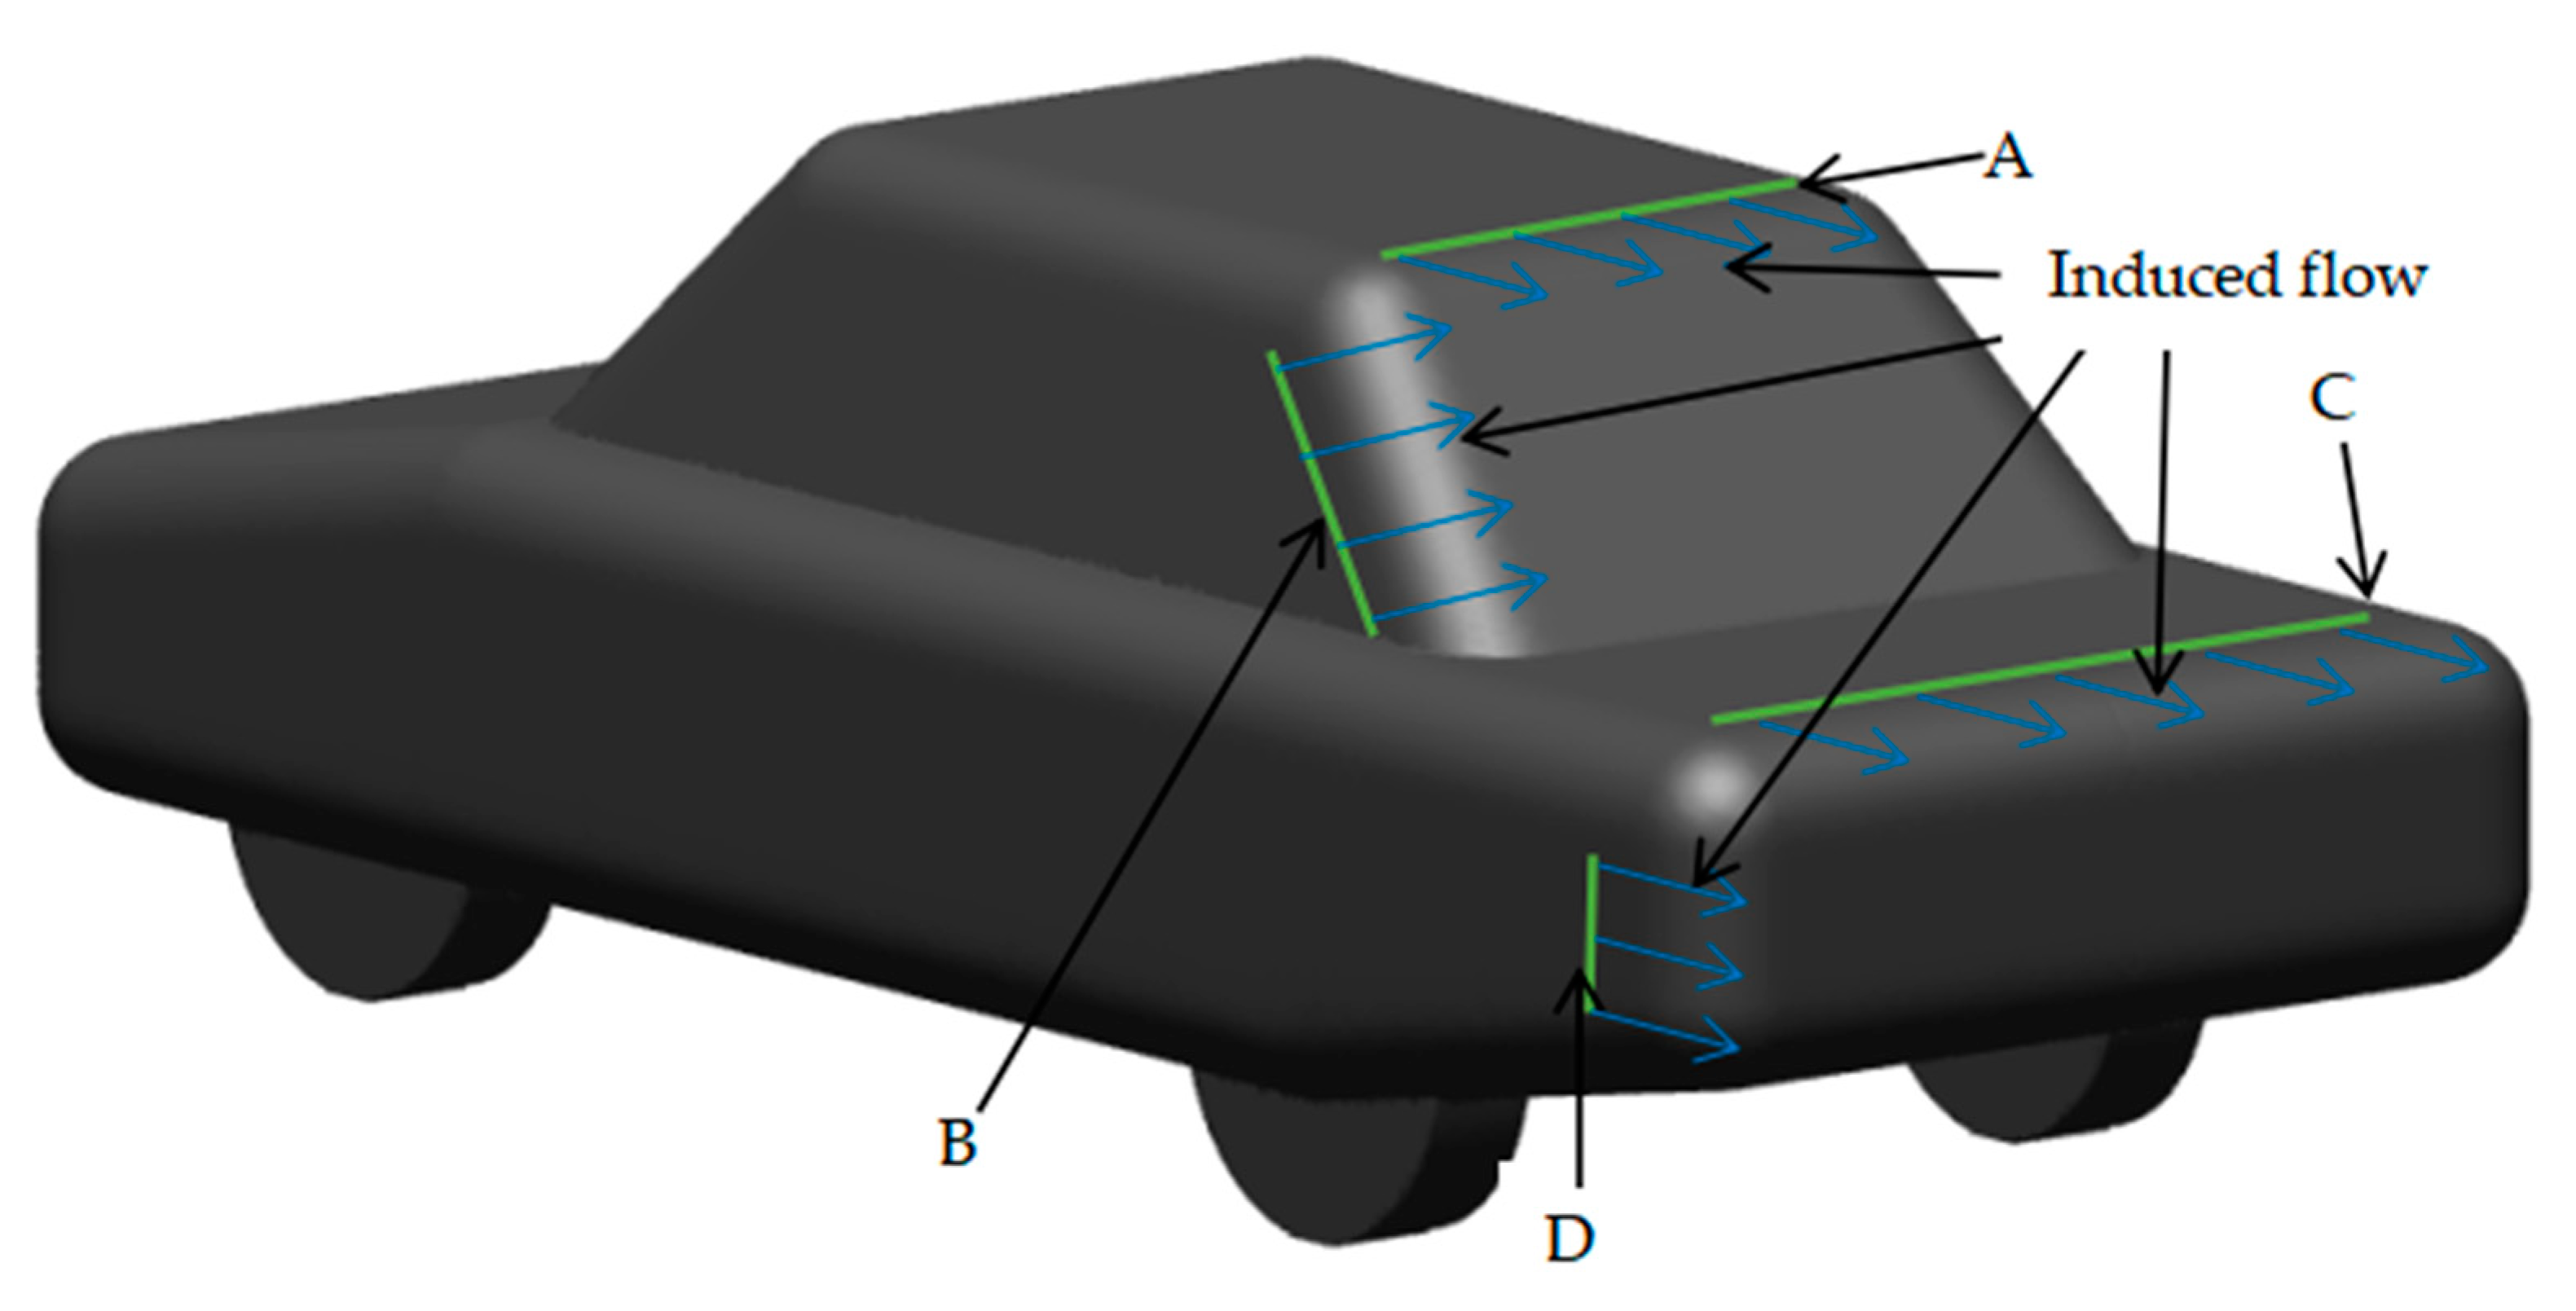
This paper focuses on the effect of plasma flow control on the rear flow field of the car, where the actuators are arranged on the roof and c-pillar, top and side of the trunk lid (see Figure 8), where flow separation is serious. The blue arrow in the figure represents the direction of induced flow. The induced flow generated by plasma will interact with the fluid near the car body wall. Studies show that the plasma actuator location is most effective before the fluid separation point [26], and so they are positioned at that place.
3. Optimization
3.1. Optimization Algorithm
The optimization algorithm adopted in this paper is the efficient global optimization (EGO) algorithm based on the kriging response surface [39]. At its core is the expected improvement (EI) plus point criterion. The response surface of the initial training sample fit cannot reach the expected accuracy, and it is necessary to increase the accuracy by increasing the sample points. The idea of the EI plus point criterion is that it adds the point with the maximum EI value to the initial training sample to refit the response surface. This method considers both the prediction value and the prediction error at the search location, and due to this principle of the EI function, the EGO algorithm can preferably avoid the risk of local optimization in the search process, and realize the effect of taking into account both optimization efficiency and global optimization. The EI function can be expressed as
where is the prediction function value of x at a certain point and is better than the optimal value of the existing response surface, is the current optimal value, is the predictive value, is the prediction error, is the normal cumulative distribution function, and is the normal distribution density function. For a detailed derivation of Equation (5), please refer to [39].
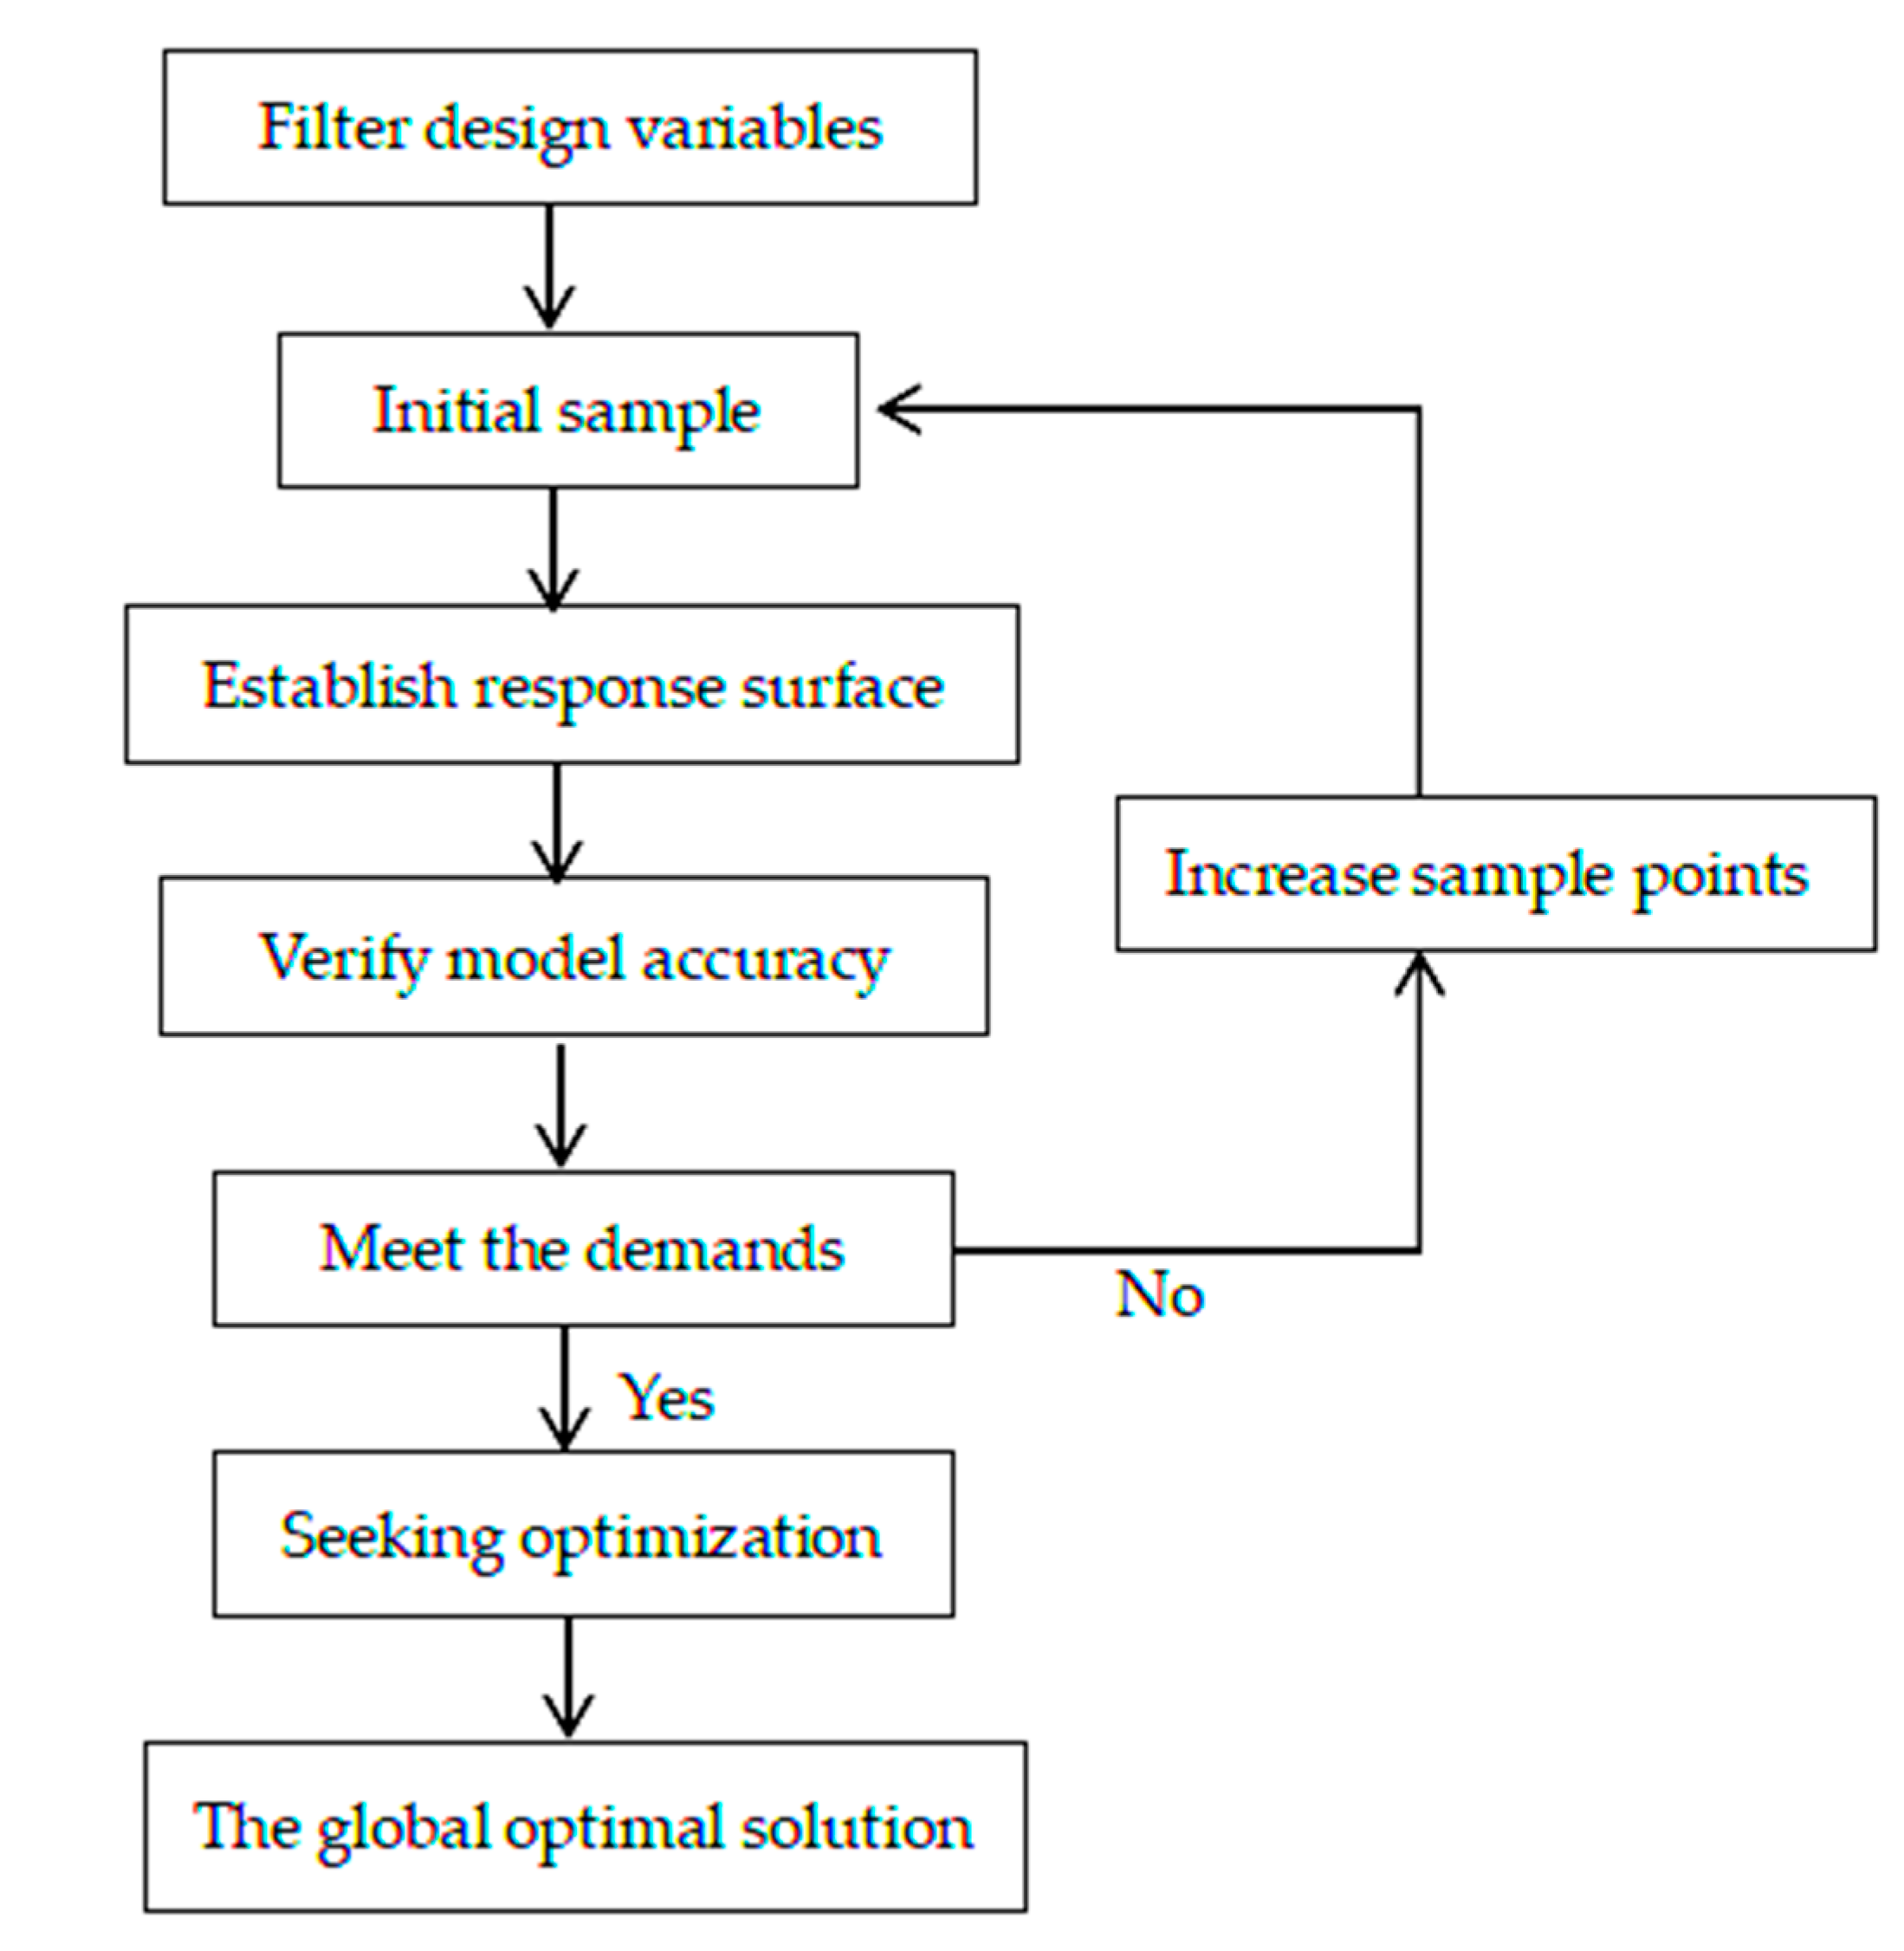
Figure 9 schematically shows the optimization process of this paper, which mainly consists of filter design variables, sampling, fitting response surface and optimization. The original intention of sampling is to study the whole spatial situation by taking sample points with a uniform spatial distribution. Thus, theoretically speaking, the bigger the number of sample points gets, the greater possibility of accurately reflecting the overall situation it bears, but it will lose the significance of sampling, making the target function estimation of sample points excessively costly. Compared with the Latin hyper cube sampling (LHS) adopted by the classical EGO algorithm, uniform design (UD) sampling has better spatial uniformity [40]. Therefore, response surface models have been built on the basis of the CFD simulations of 21 sample points in the design space selected by the UD sampling technique [41]. In the process of optimizing the EI function, the self-adaptive multi-objective differential evolution (SMODE) algorithm is used to search the maximum EI value [42], which has better convergence performance when compared with the traditional differential evolution algorithm.
3.2. Variables and Optimization Objectives
The goal of this paper is to improve the structure of the entire flow field at the rear of the car through plasma actuation, thereby reducing its drag coefficient (Cd). Meanwhile, the requirements for plasma actuation intensity at each flow separation are different. Through the numerical simulation results before optimization (see Section 4), we can infer that simultaneous actuation at four positions has the best effect of control. Therefore, the supply voltage is selected as the design variable, and the minimum Cd is the optimization objective. The optimization problem statement of this study is expressed as:
Optimization objective: minimize Cd;
Subject to: .
4. Results and Discussion
4.1. Original Model Flow Field Analysis
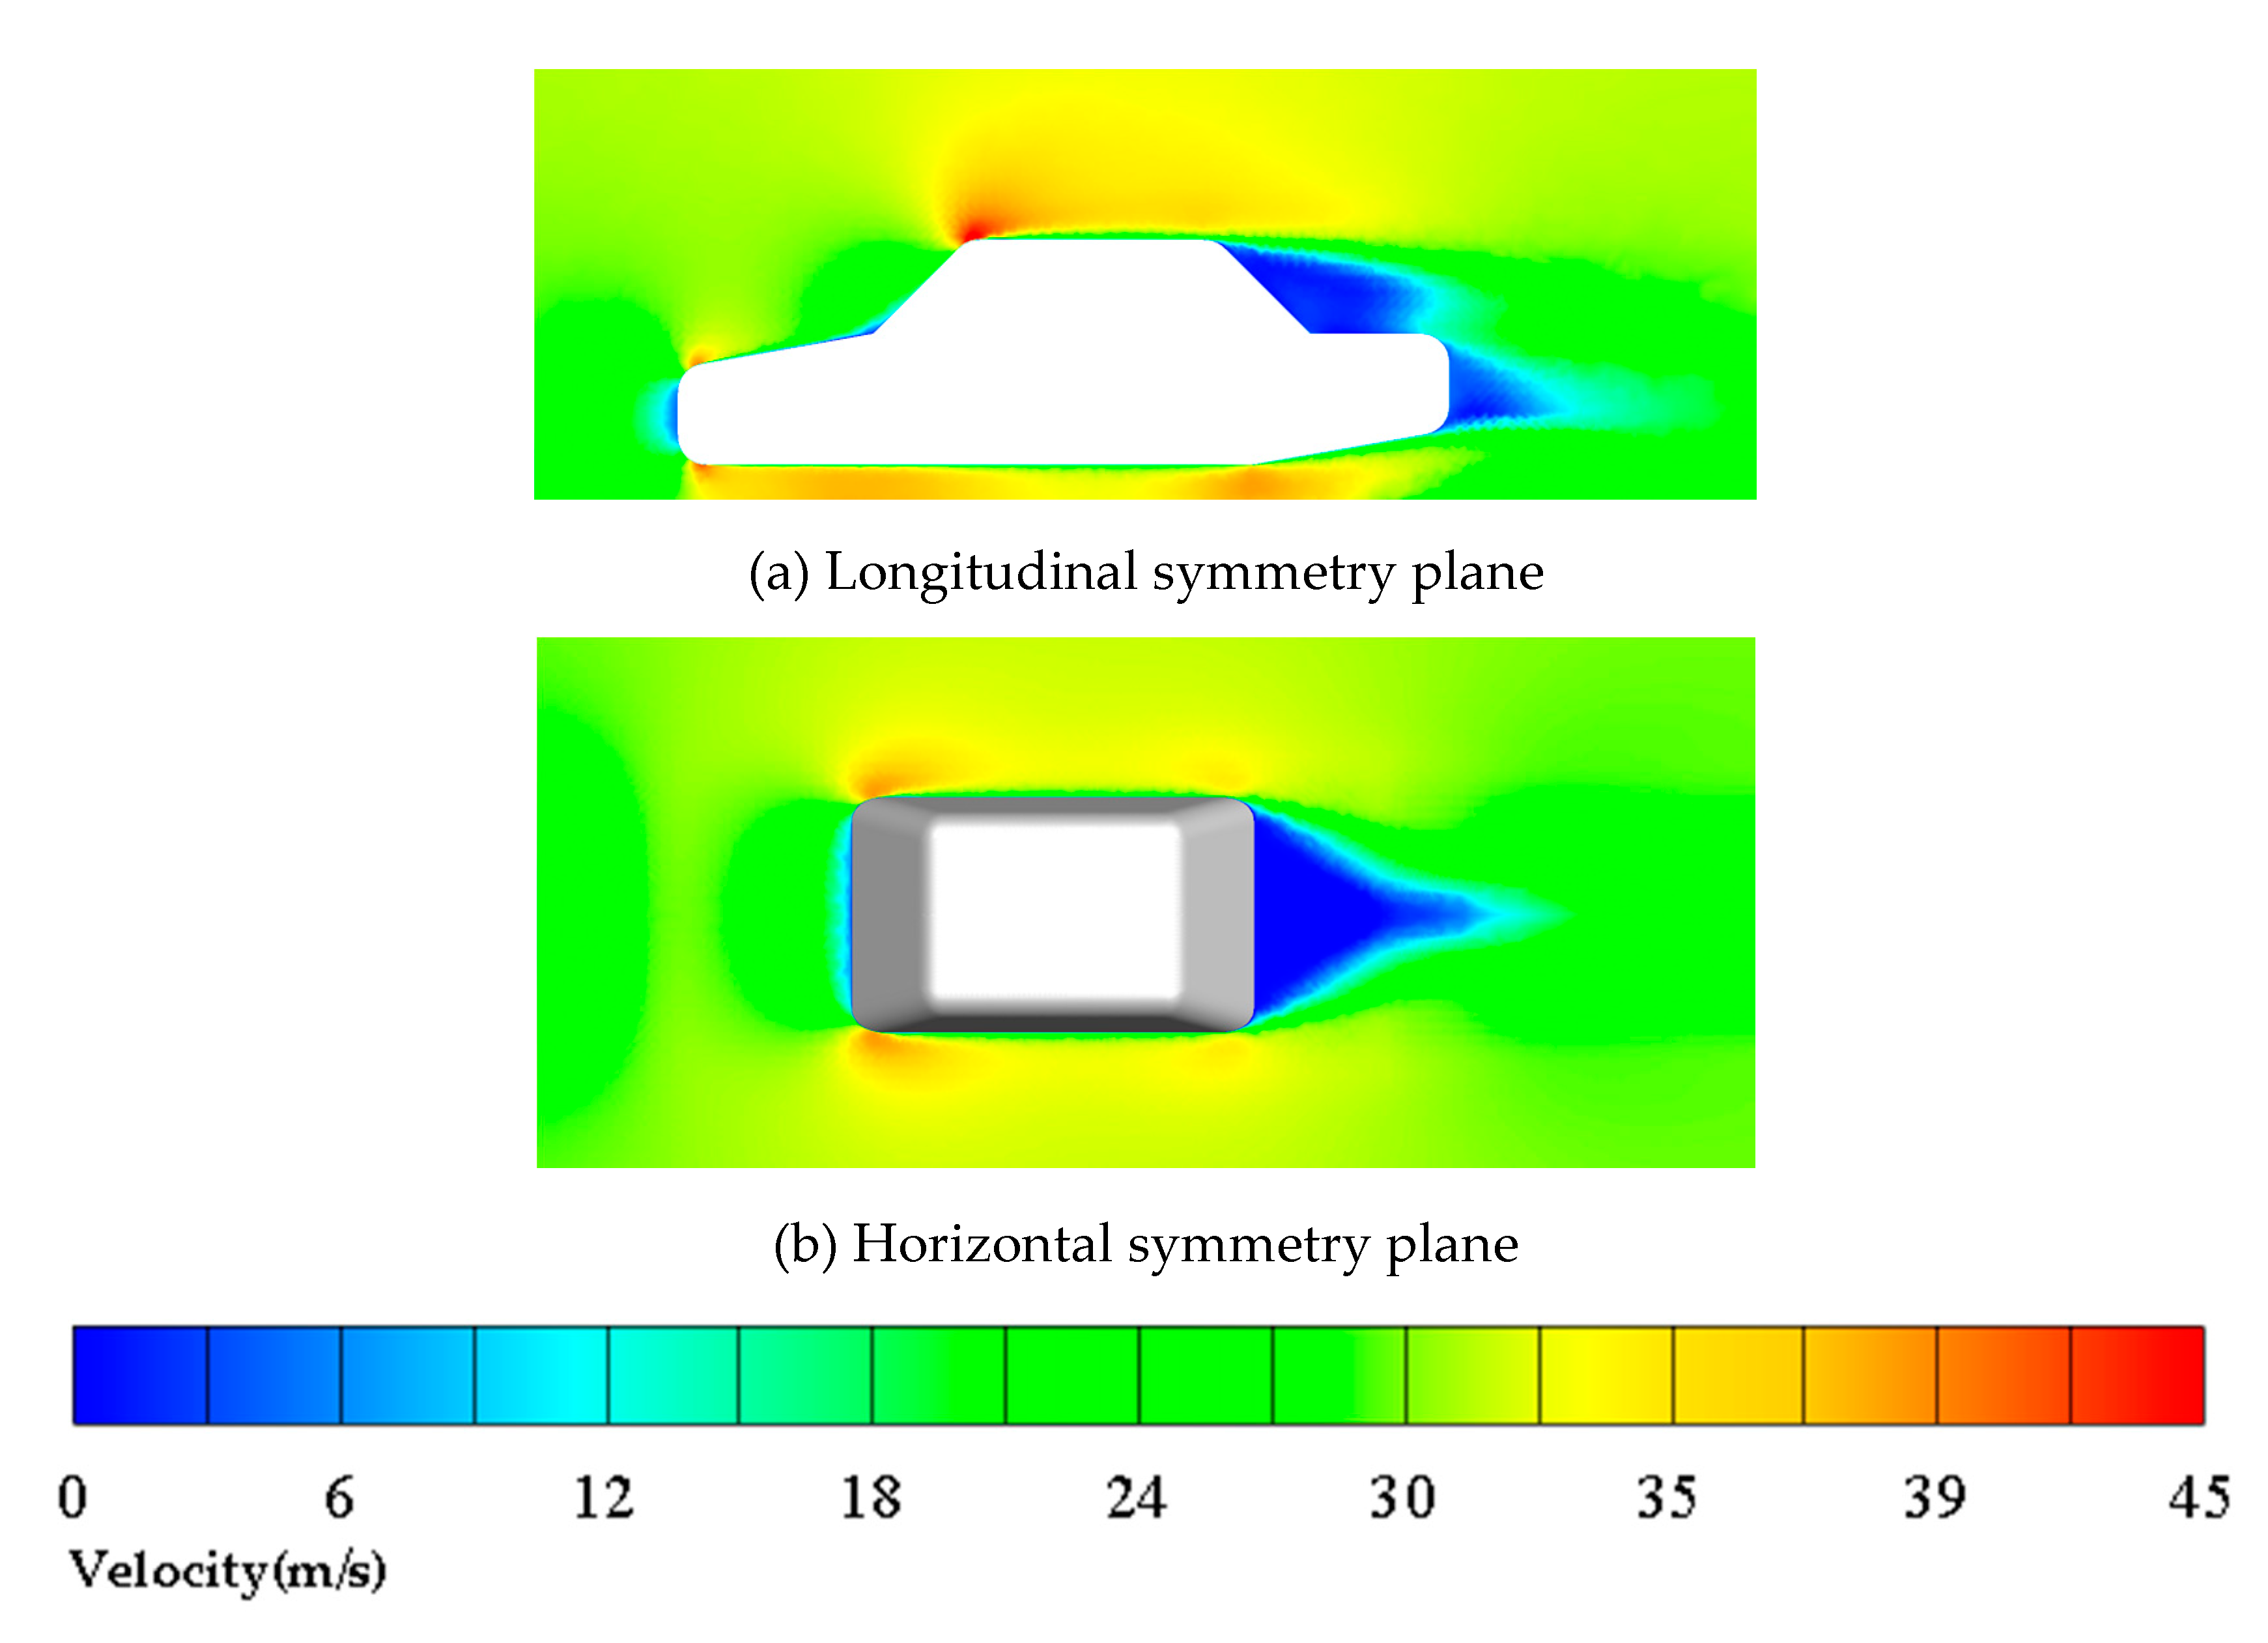
After numerical simulation of the original model under uniform flow conditions, the details of the flow field structure are obtained (see Figure 10). We can observe that flow separation will occur at the sudden position of the car surface when the incoming flow reaches the rear of the car. The main source of car drag is the negative pressure zone caused by the tail airflow separation, which creates a pressure difference between the front and rear and increases the differential pressure drag of the car. Hence, restraining the flow separation of various parts of the rear of the car is beneficial to reduce the drag of the car.
4.2. Single Plasma Actuation Results
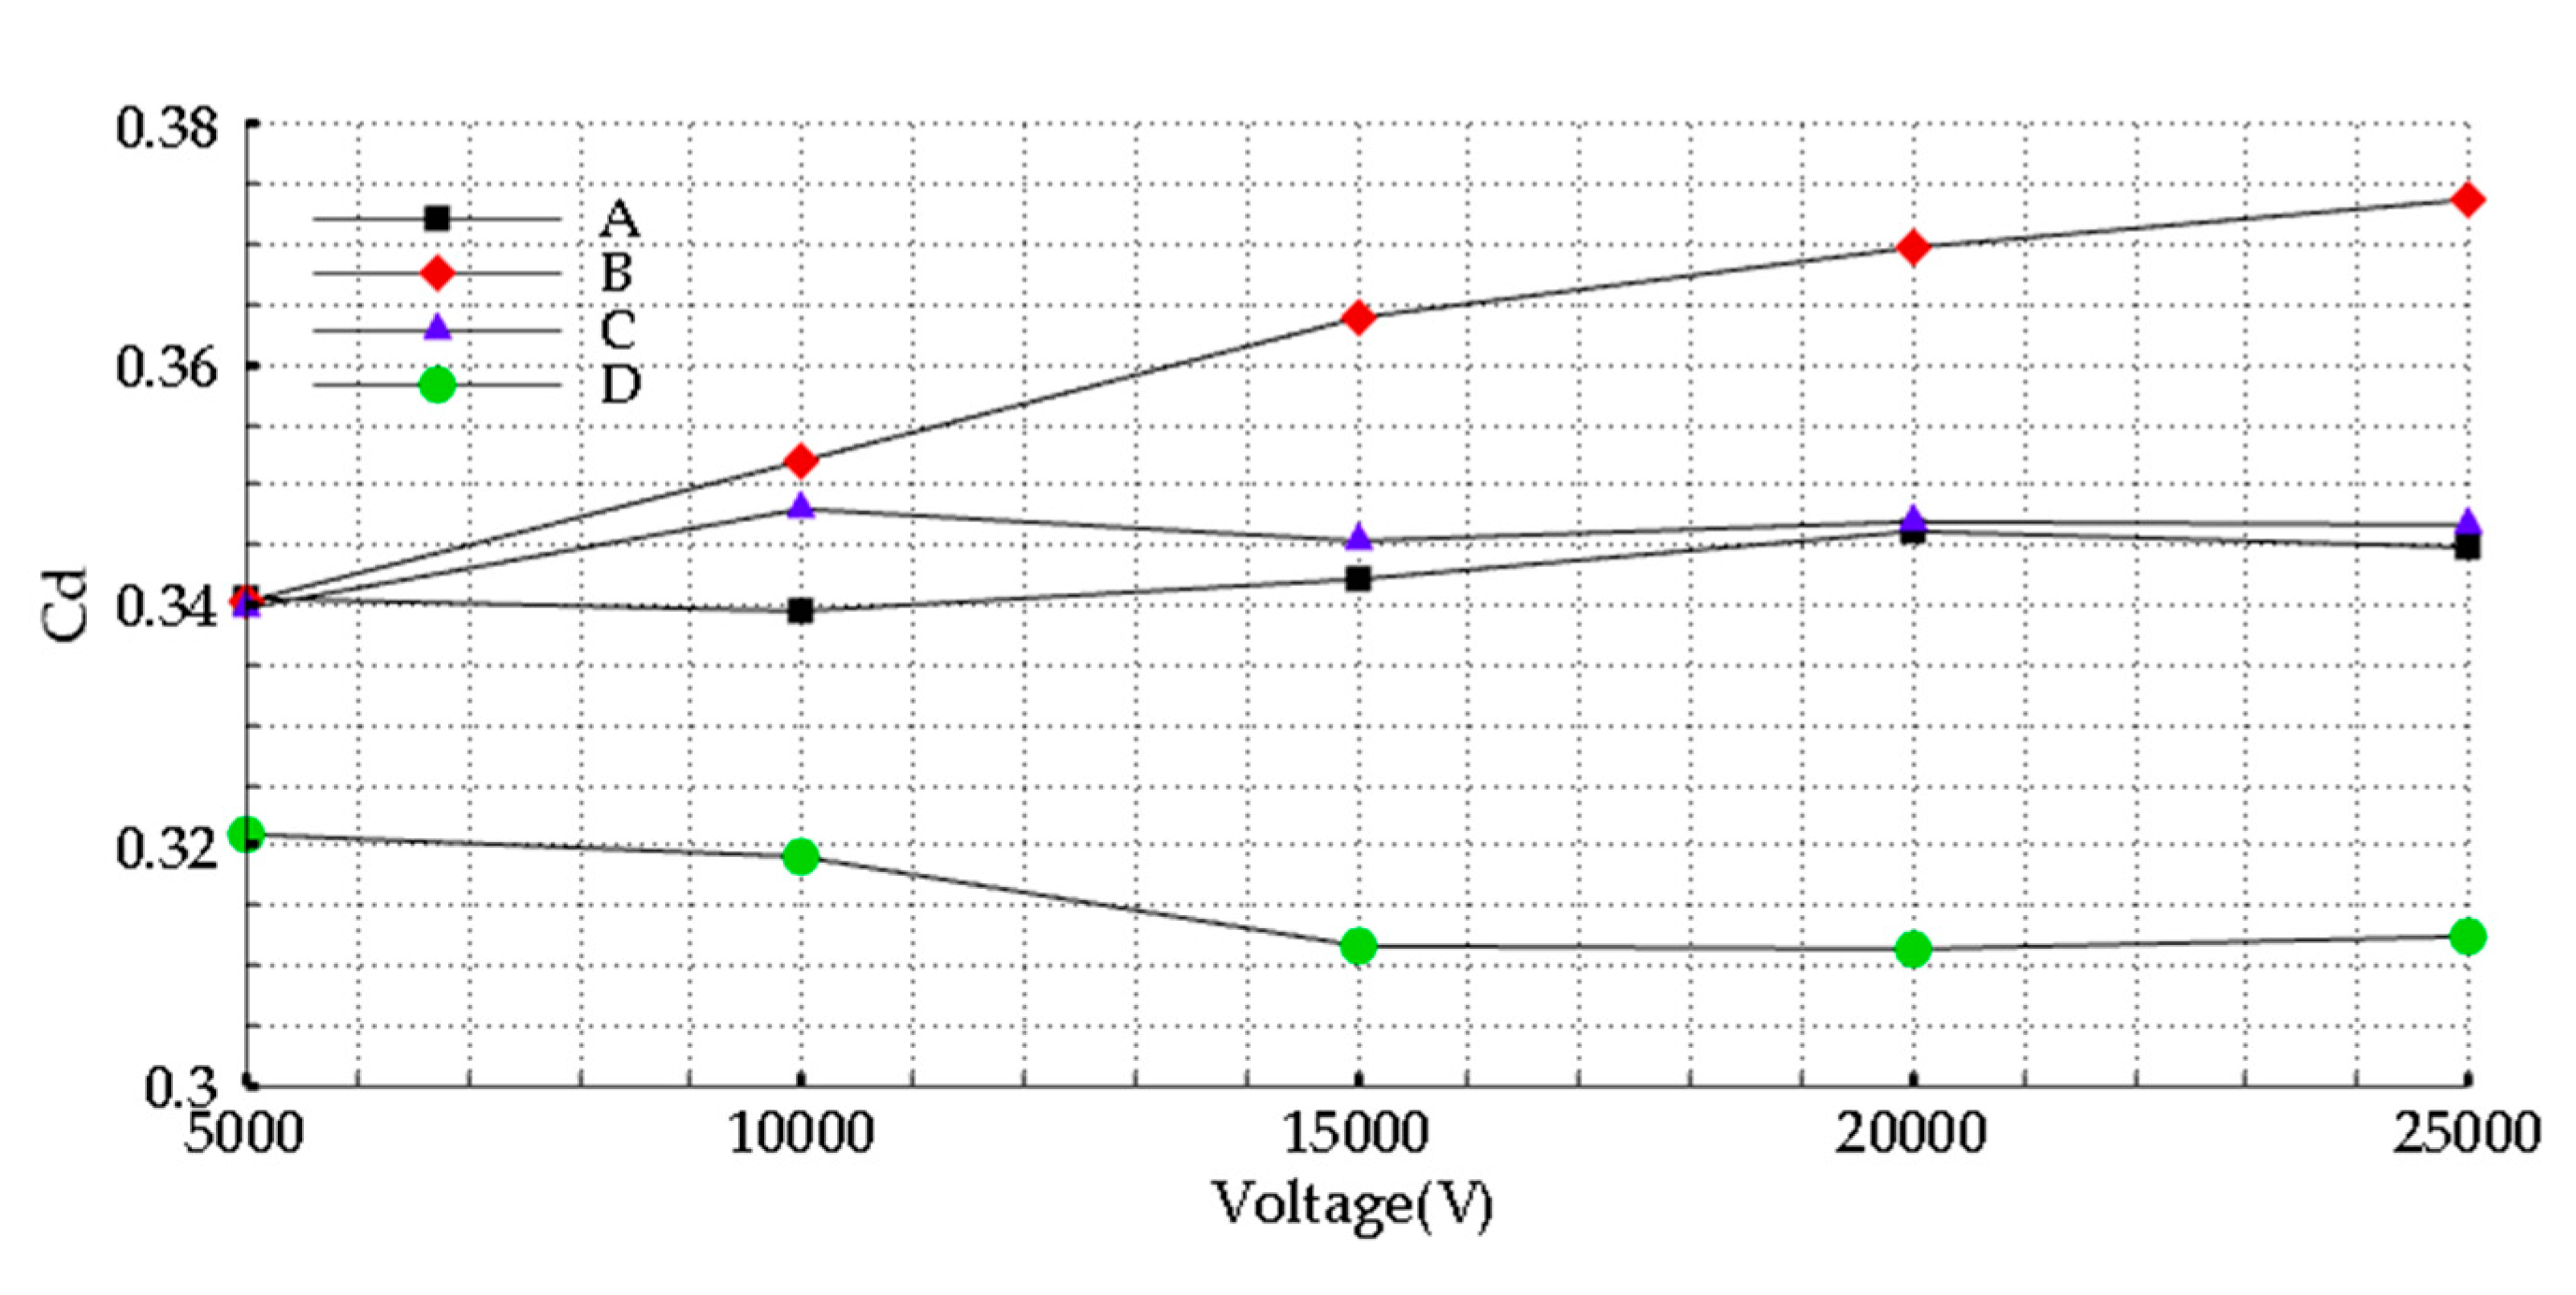
To explore the effect of applying plasma actuation at each position individually on the flow field control, as well as its influence on the supply voltage of the control effect, four voltages are applied respectively on each position. They are 5, 10, 15, 20 and 25 kV. Figure 11 shows the change of Cd with a voltage at each position. We can see that applying plasma at the D position exhibits a significant drag reduction effect, with a maximum drag reduction rate of 5.35%. When the voltage exceeds 15 kV, the variation curve of the Cd with the voltage tends to be flat, indicating that there is an optimal voltage at position D, so that the Cd here is the smallest. The drag coefficient at other positions increases correspondingly. What is beyond our expectation is that applying plasma actuation at the other three positions not only has no drag reduction effect, but also increases the aerodynamic drag. The reason for the increase and decrease in Cd will be analyzed according to the change in the tail flow field structure.
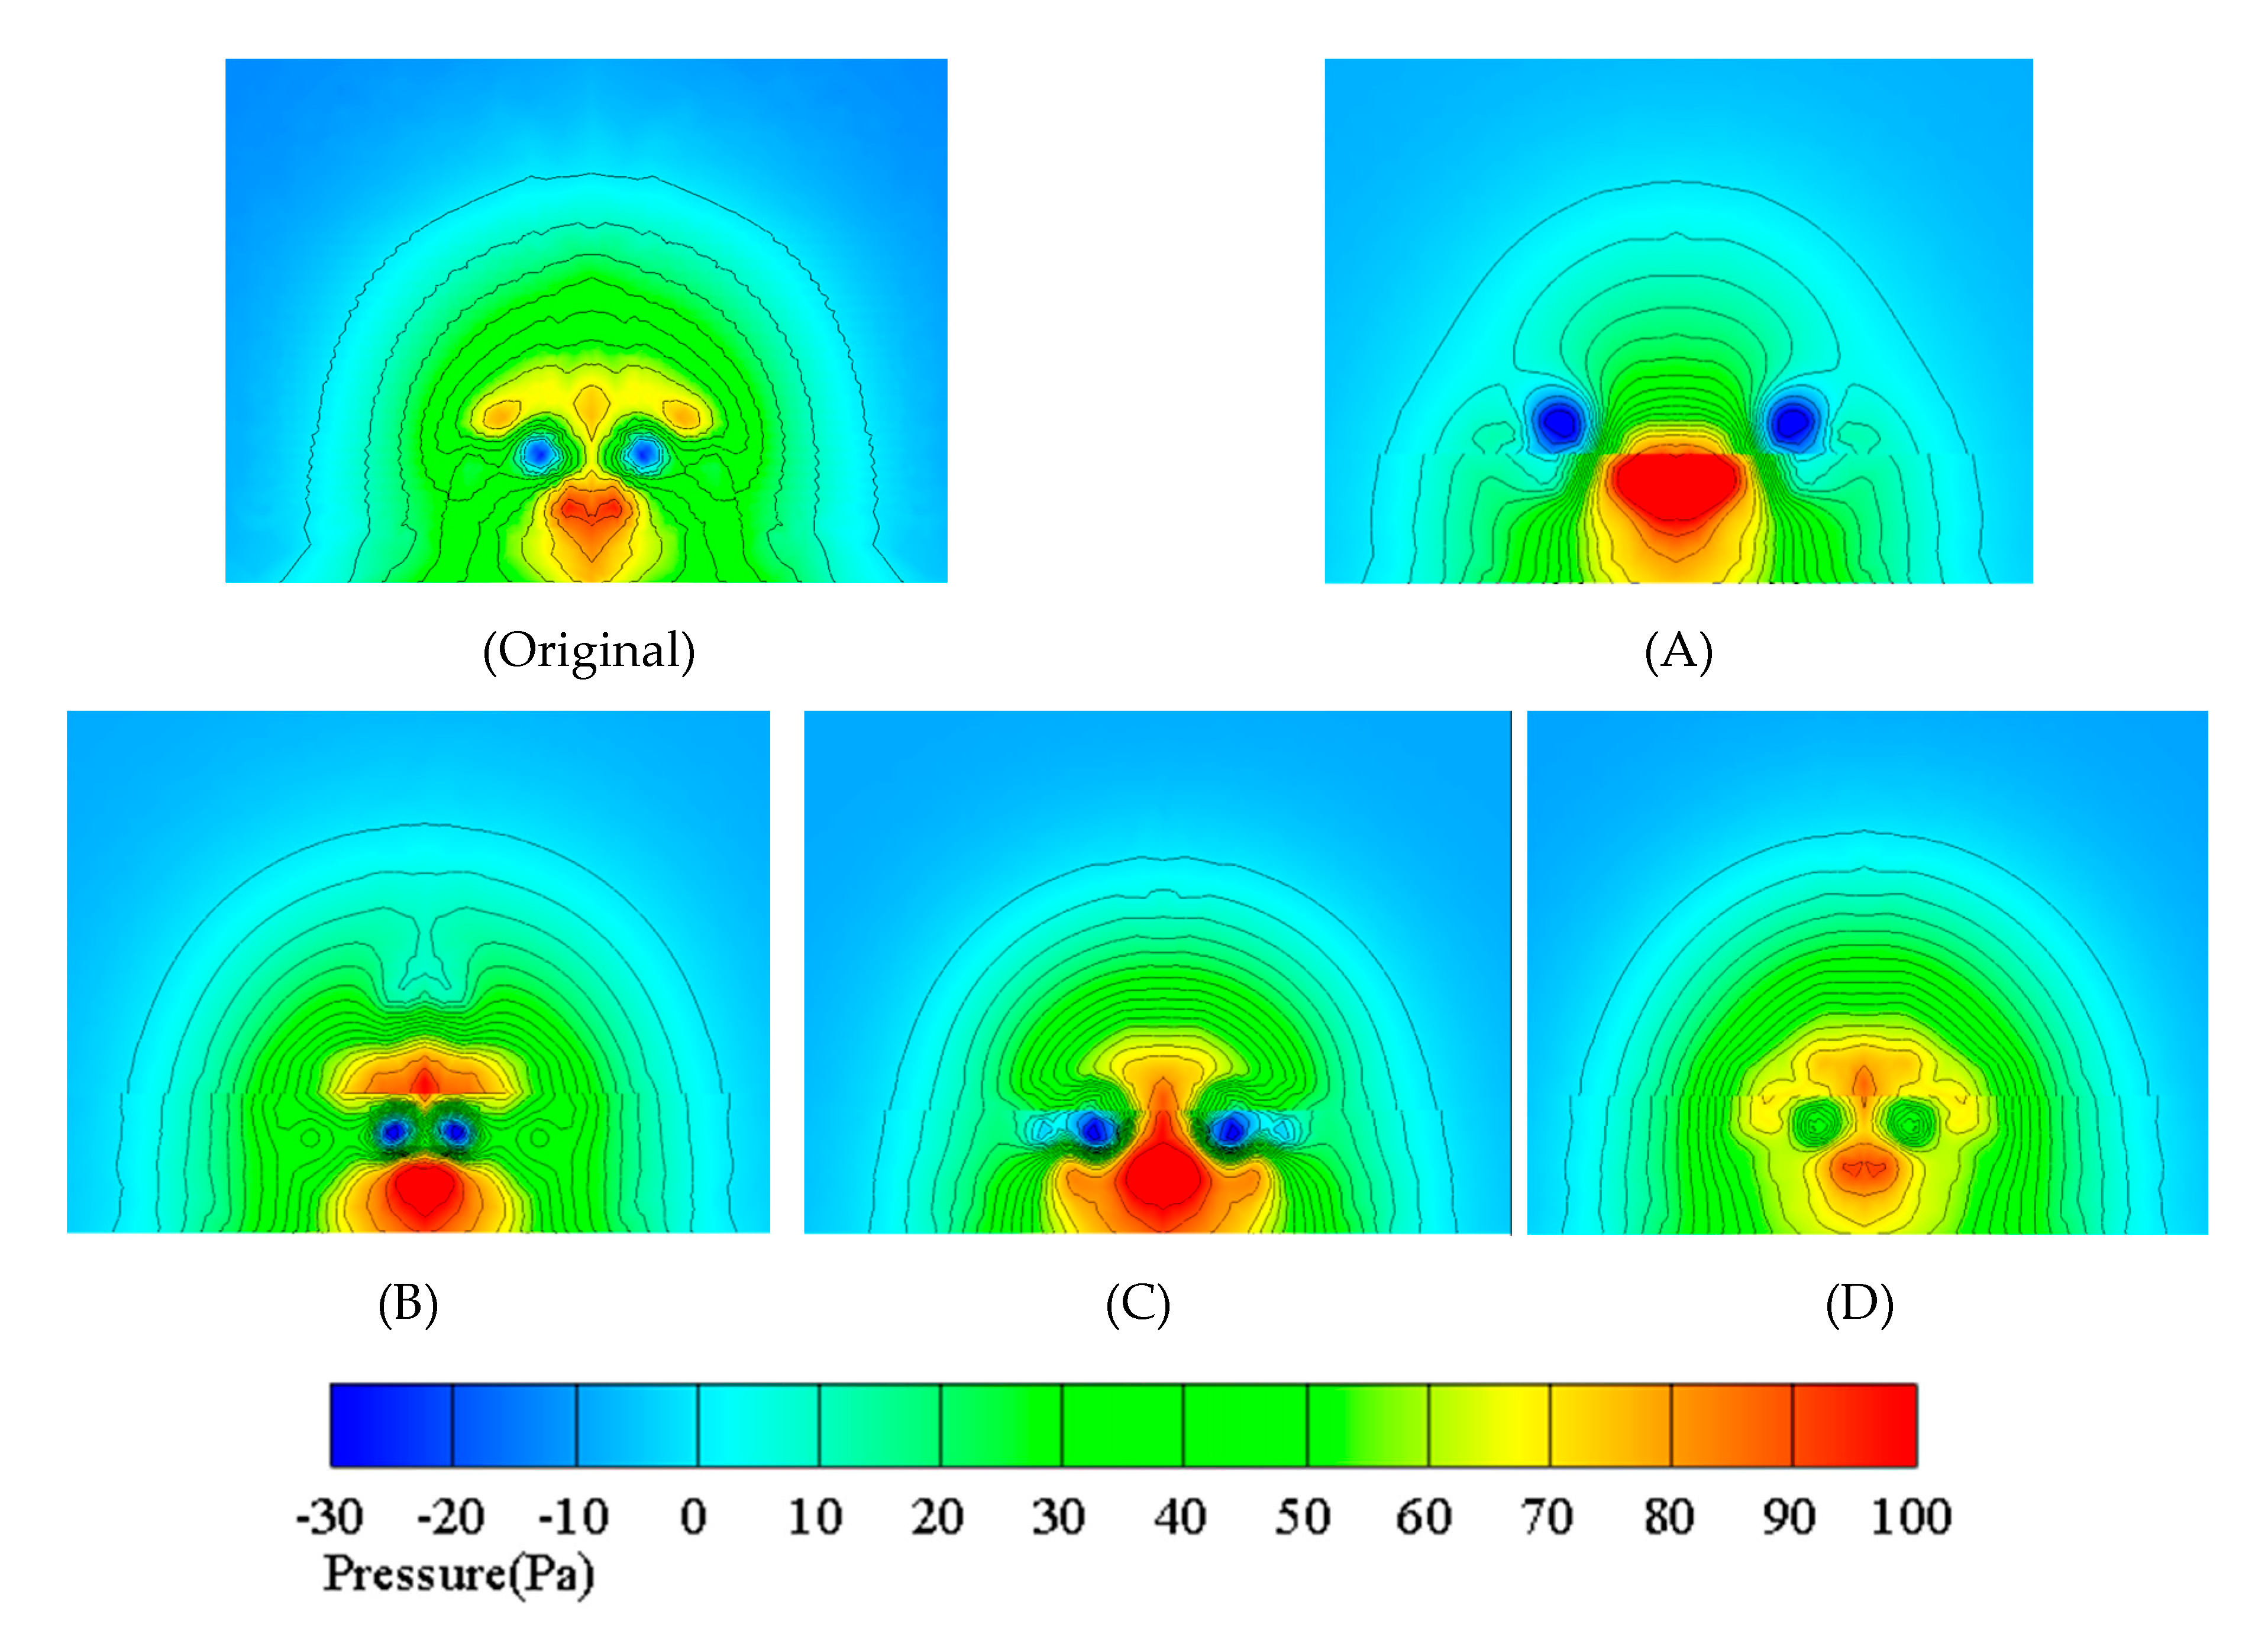
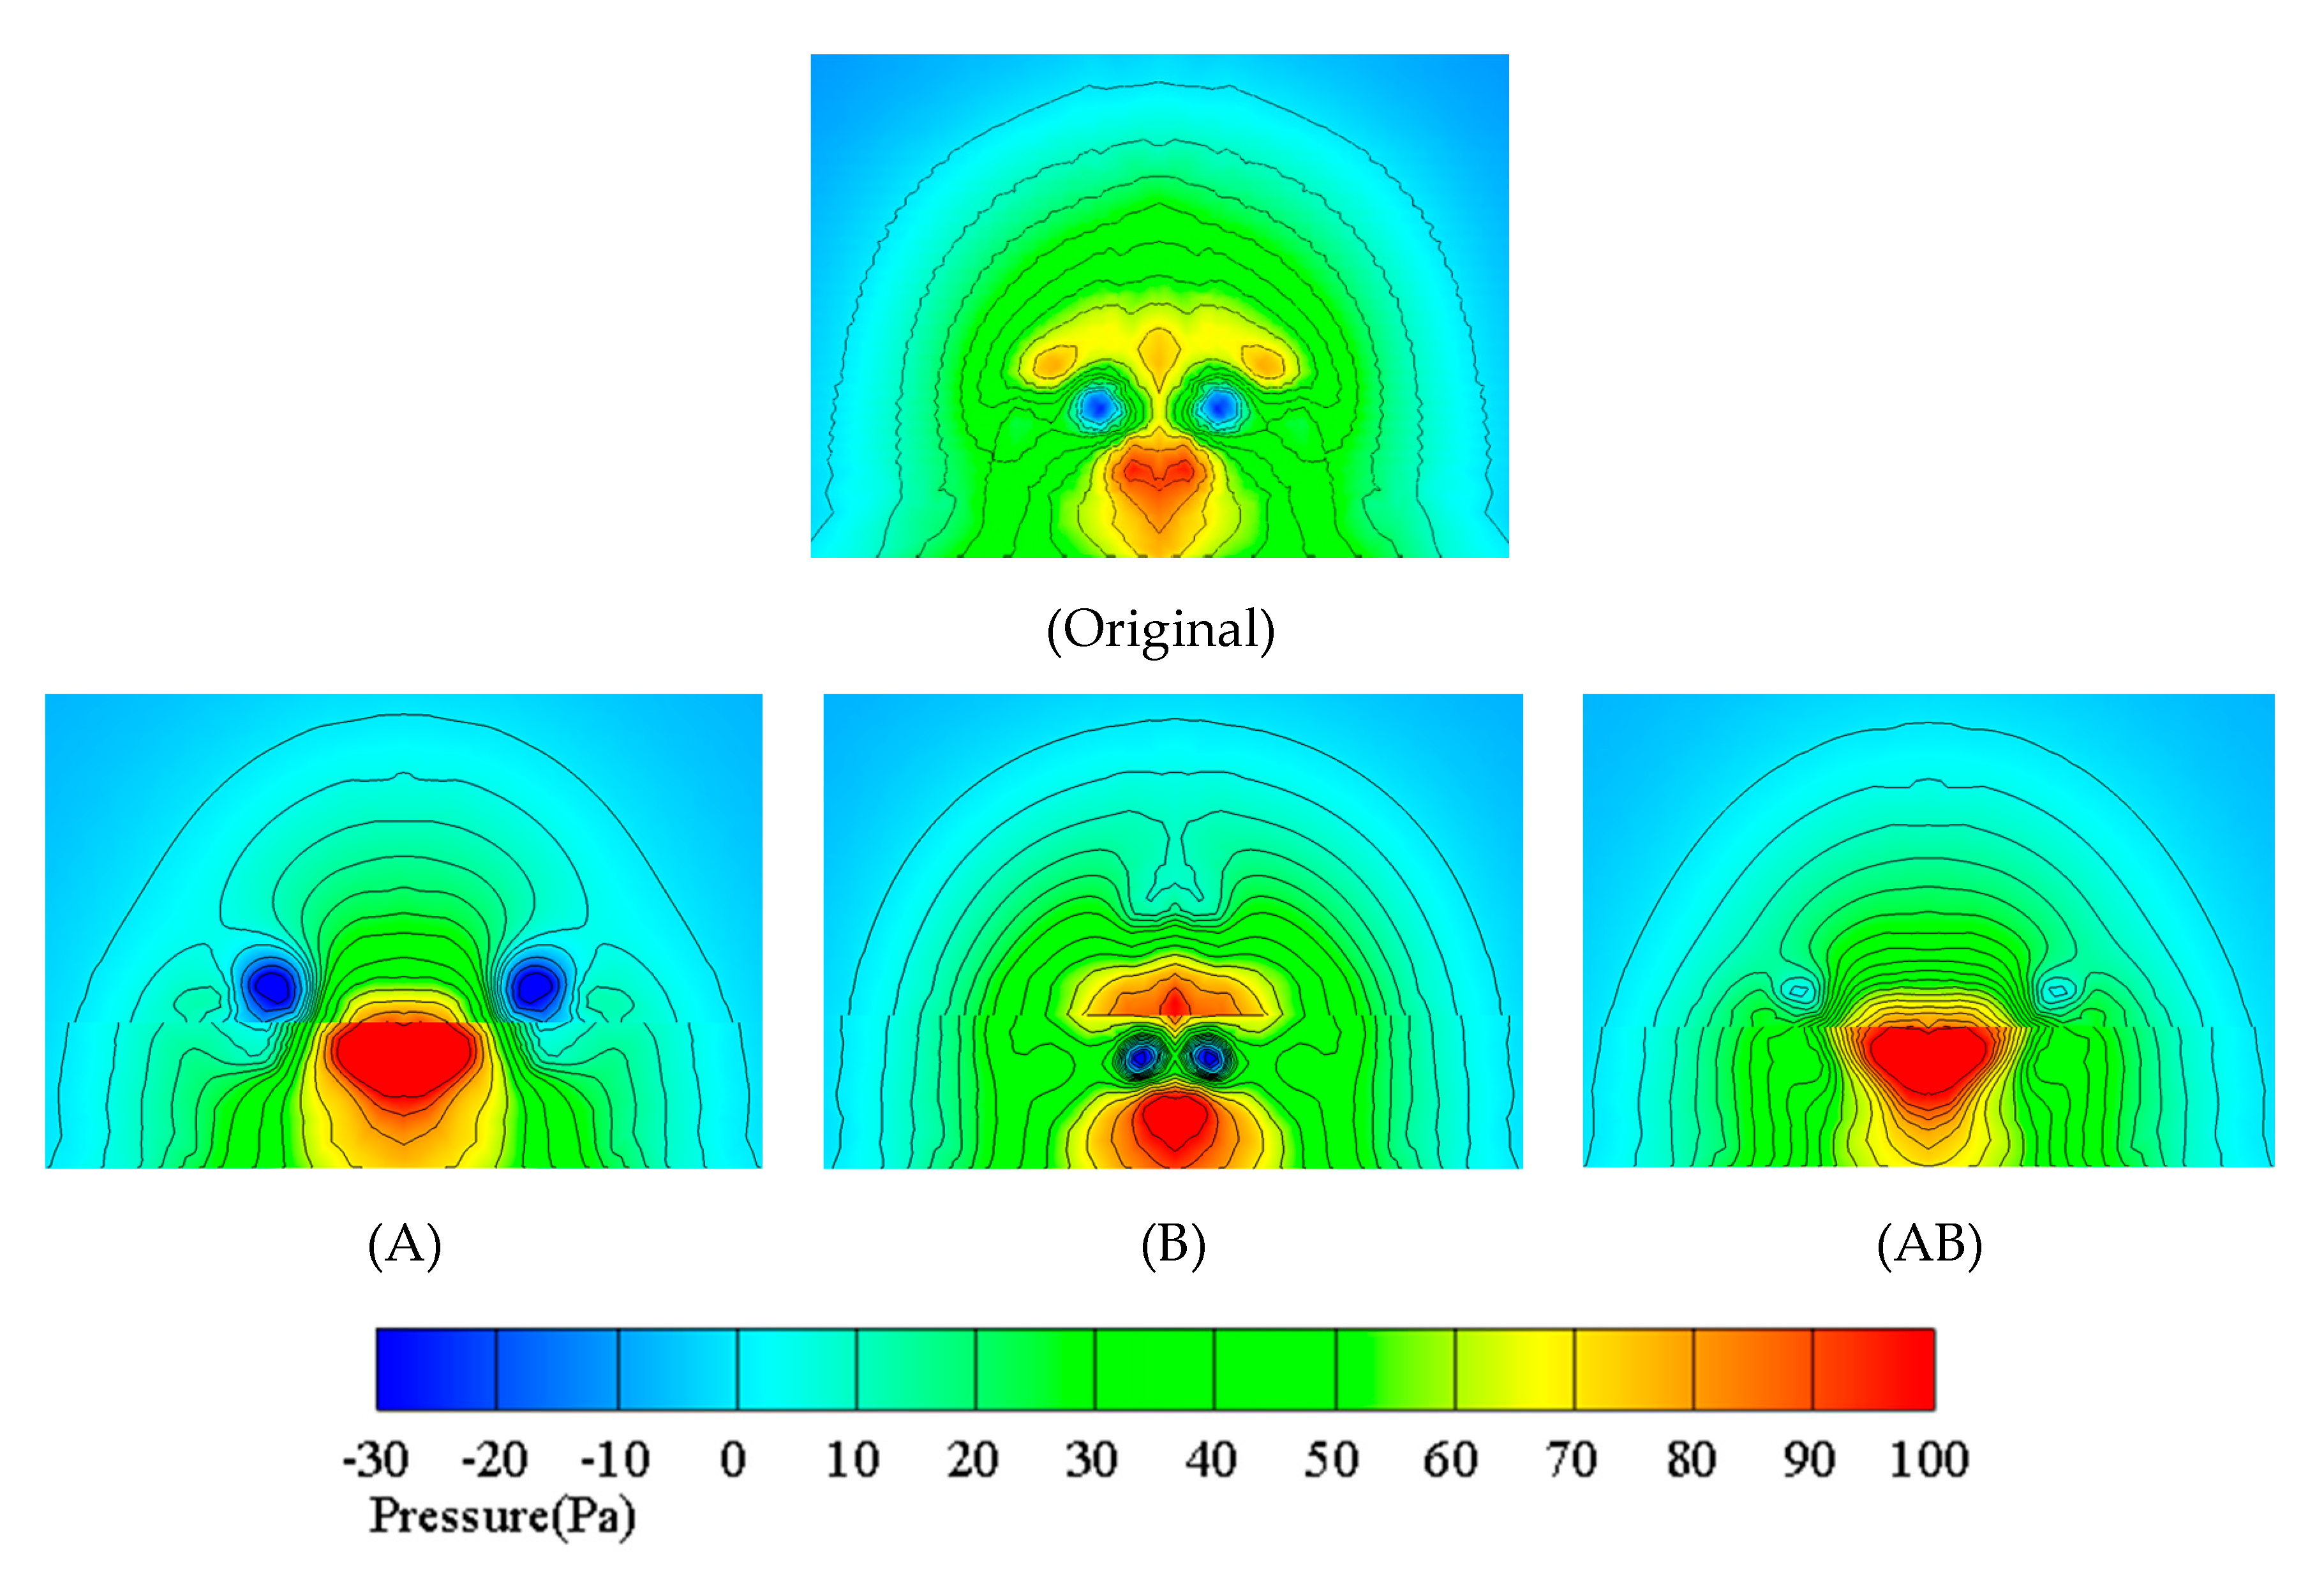
Figure 12 shows the pressure contour of each model on the cross section of x = 0.6m when the applied voltage reaches 15 kV. It is obvious that the application of plasma actuation at each location has a great influence on the structure of the rear flow field of the car. However, it is the flow field that is significantly improved only when the plasma actuation is applied at the D position. The pressure distribution at the tail of model D is more unified and the pressure recovery is better than that of other models, which will help reduce the pressure difference drag of the car. Compared with the original model, although local pressure recovers better, the intensity of the two induced vortexes at the tail of B, C and D increases correspondingly, which will result in raising local energy loss. This is the reason why the drag coefficient increases.
4.3. Multiple Plasma Actuation Results
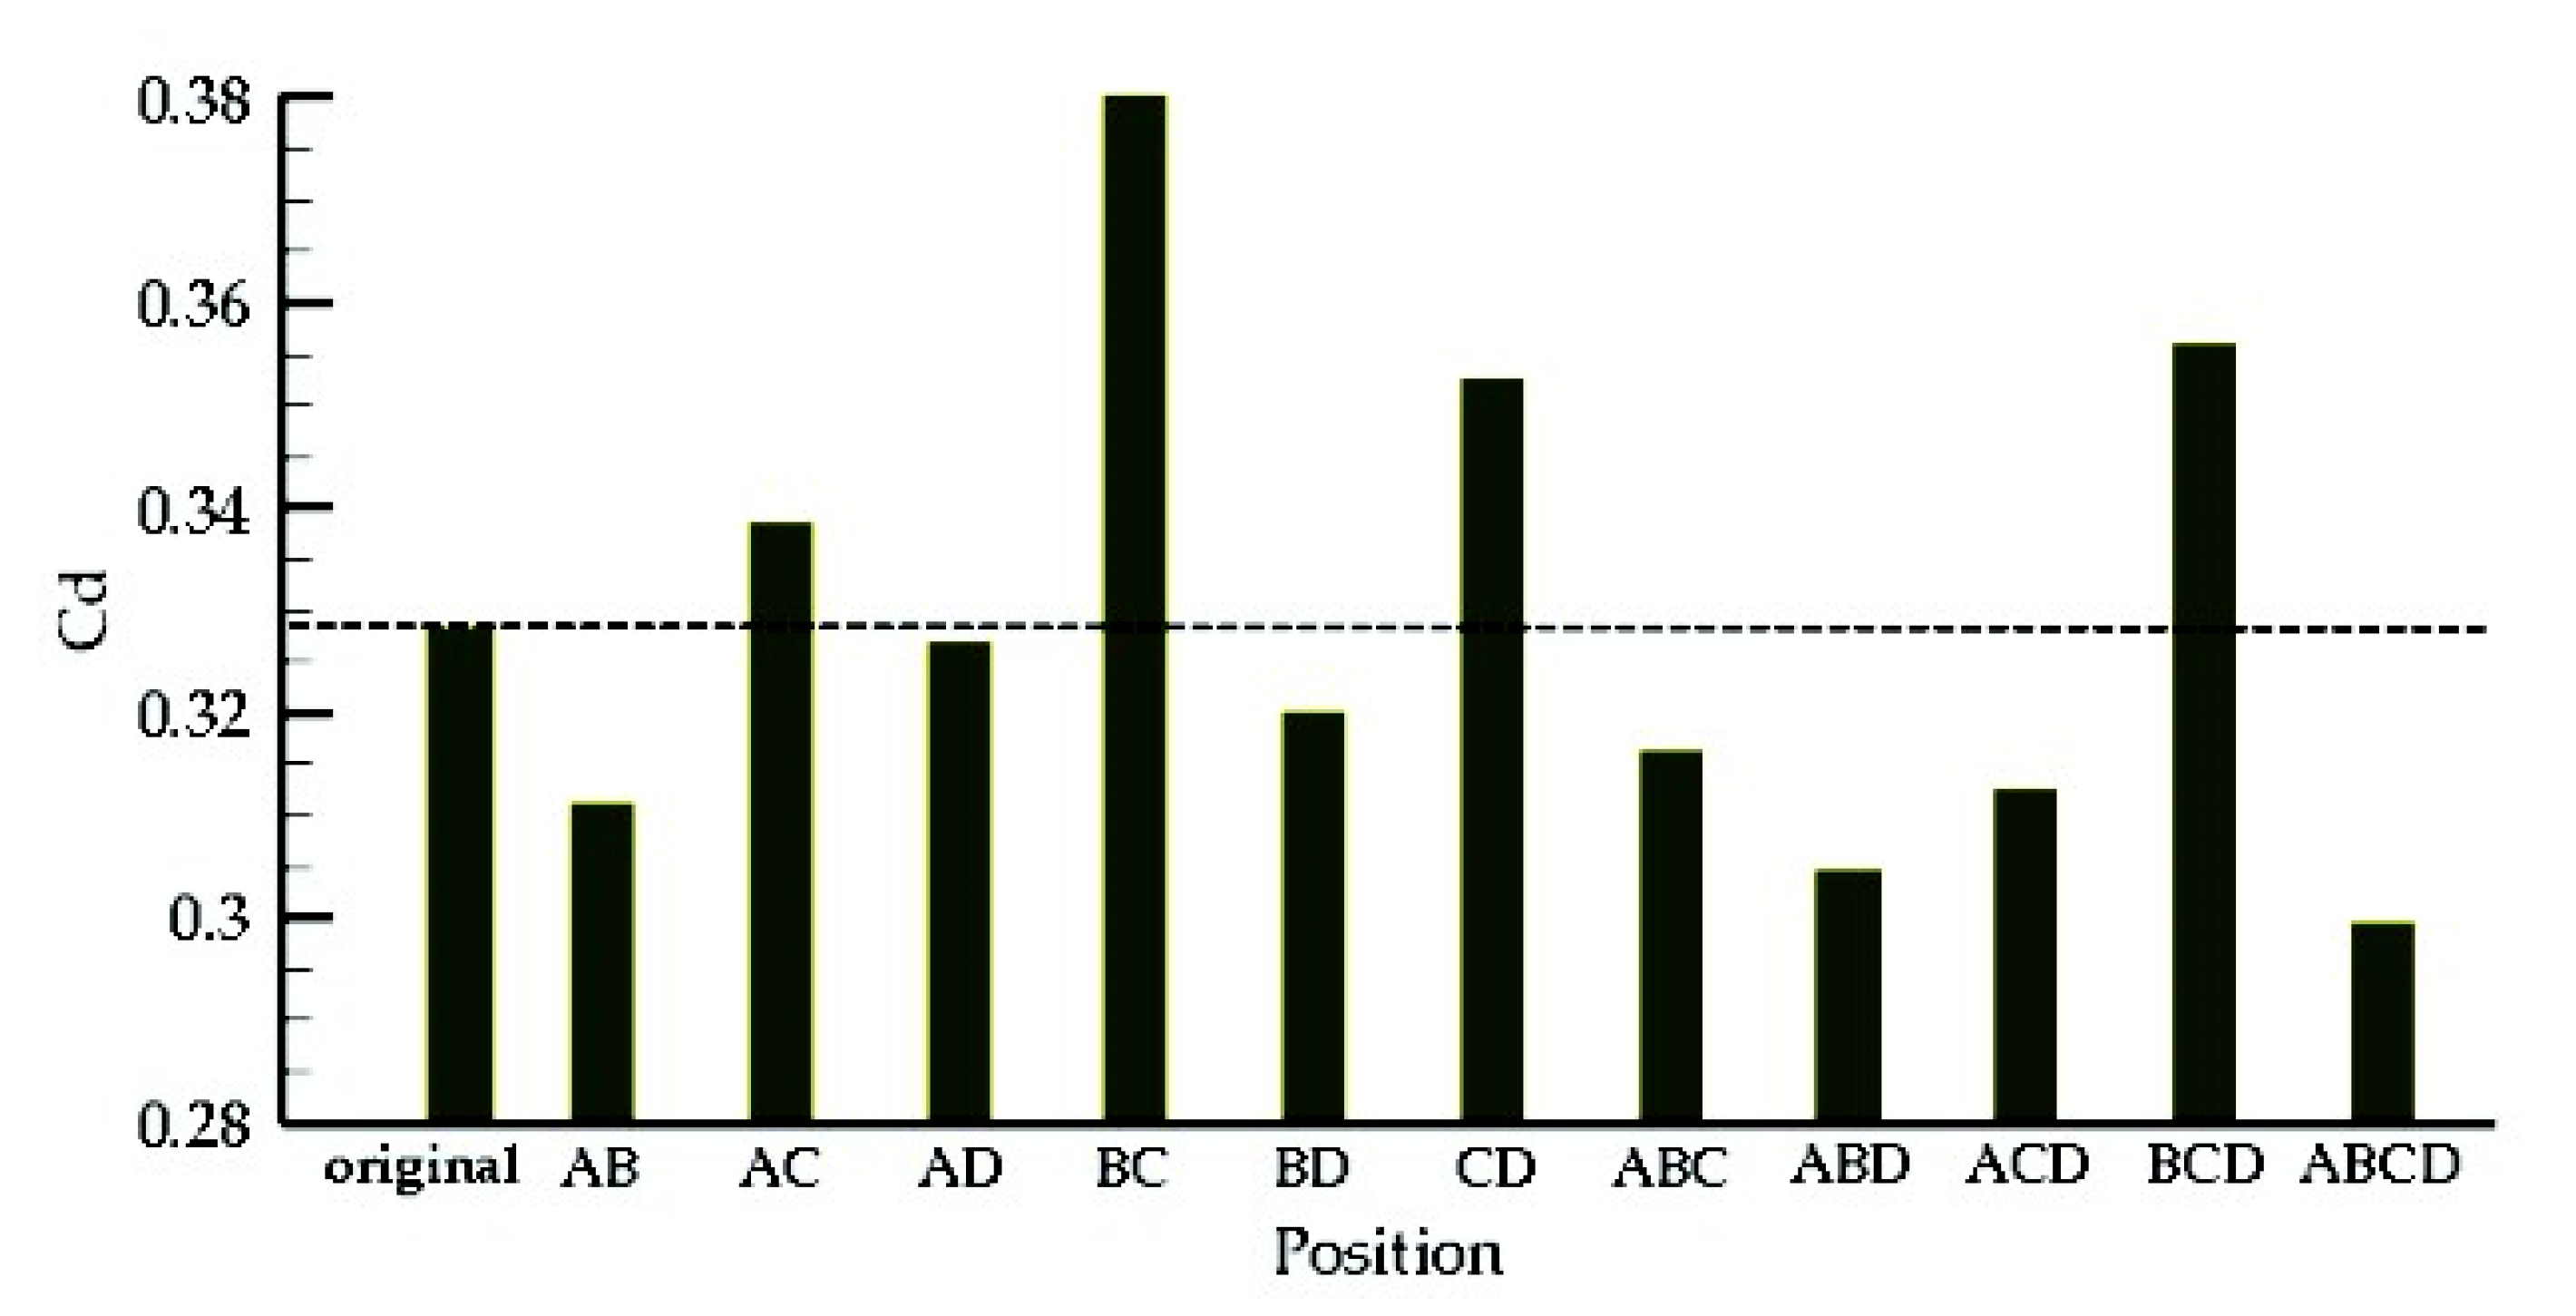
To study the control effect of applying plasma at multiple locations simultaneously, the plasma actuators at various positions are randomly combined, and an actuation voltage of 15 kV is used. Figure 13 shows the results of drag coefficients for simultaneous plasma actuation at each location. It is obvious that the best effect is to apply actuation at four positions simultaneously, as the drag reduction rate reached 8.76%. From the histogram, we can also get the interesting information that the application of actuation at both A and B has a very good effect on drag reduction. On the contrary, applying actuation at only one of them will increase the drag coefficient. From the comparison of the flow field structure (see Figure 14), applying control at A and B simultaneously is beneficial to suppress the strength of a pair of drag vortexes developed from the c-pillar, so the resistance is reduced. Simultaneous application of actuation at B and C increases the drag coefficient by the most, peaking at 18.12%. The following will analyze the flow field of the two extreme cases.
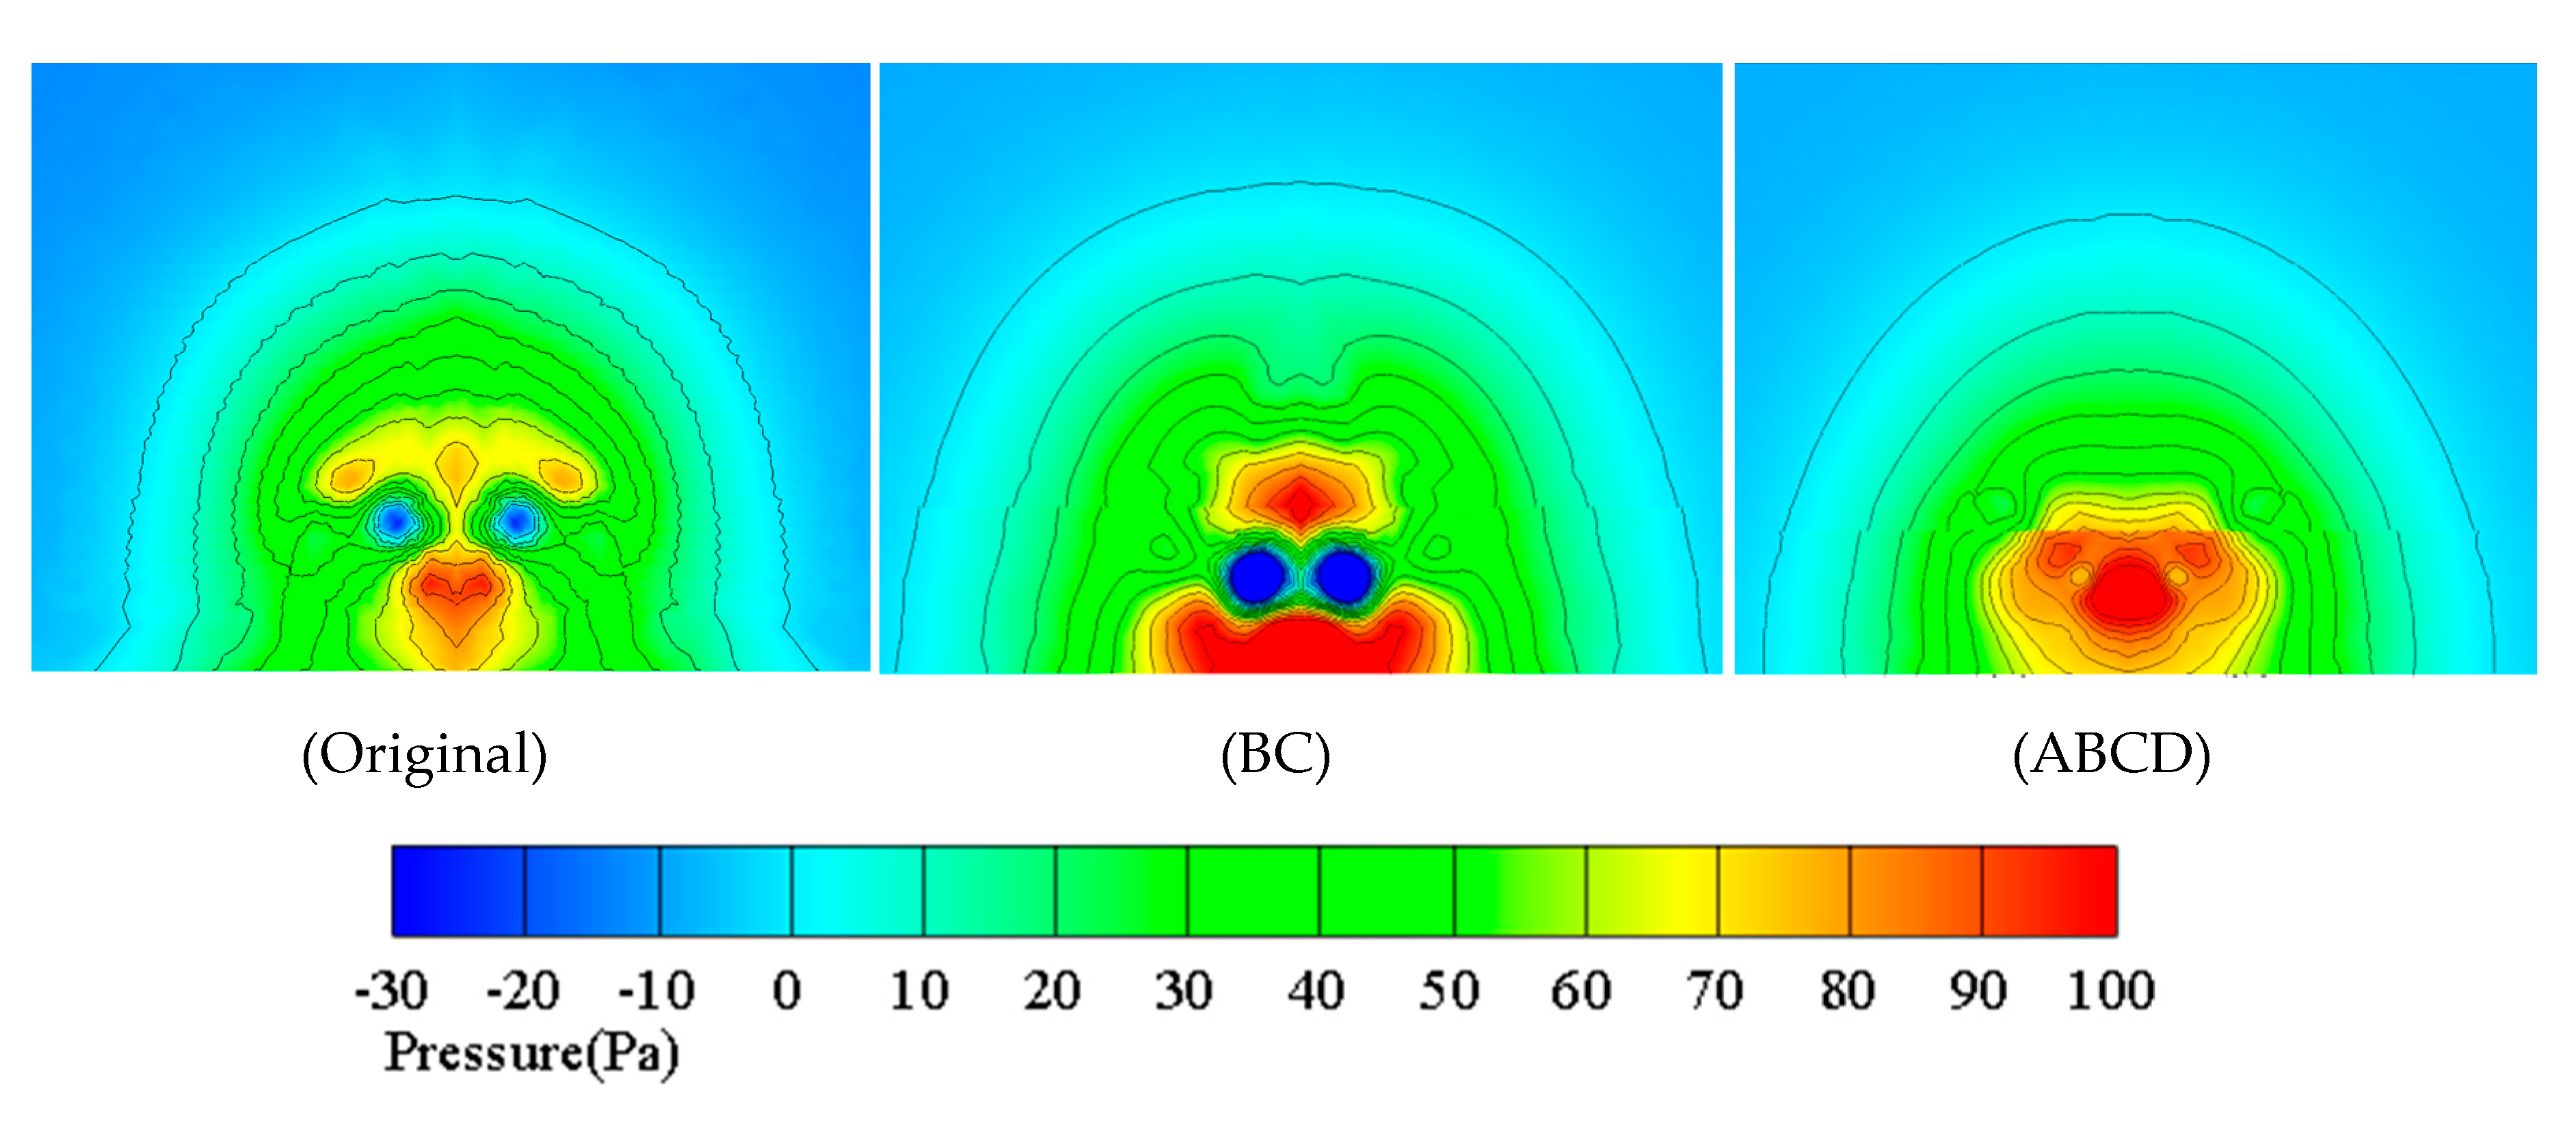
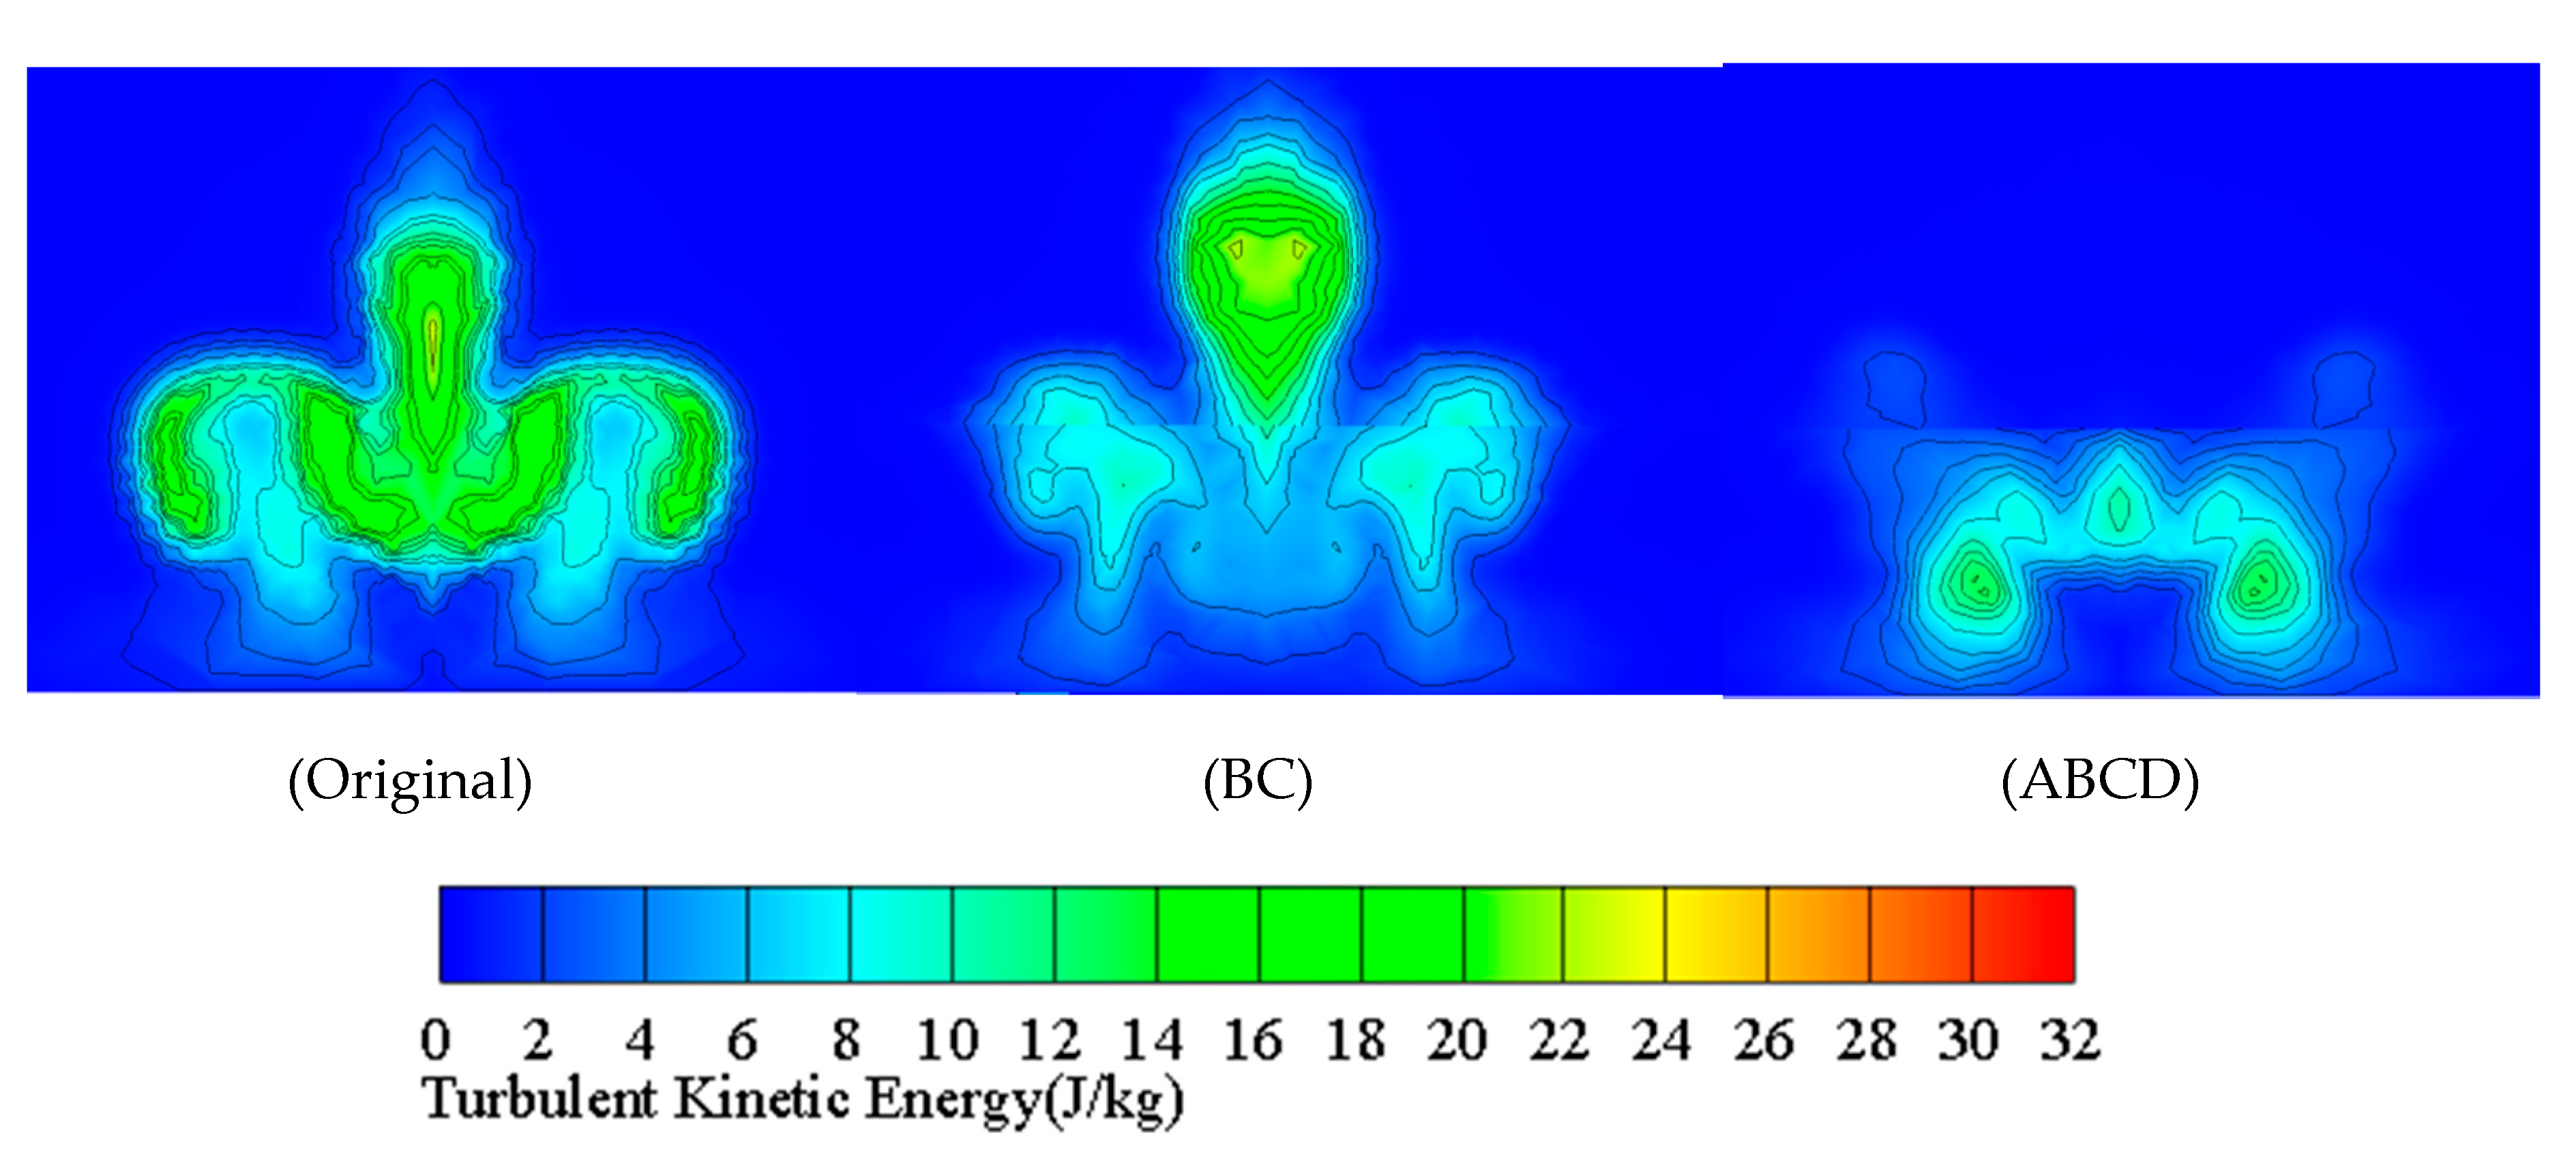
By comparing the BC, ABCD and the original model tail pressure contours (see Figure 15), we can see that simultaneous application of actuation at four positions effectively suppresses the flow separation at the rear of the car, and the pressure recovery is significantly better than the original model and the BC model. The BC model significantly deteriorates the flow field at the rear of the car. Although the local pressure recovers well, the two induced vortexes are significantly enhanced, and move closer to the middle, which is consistent with the increase in the drag coefficient. This also shows that the inhibition of local flow separation cannot improve the overall flow field structure of the vehicle tail but will instead make it worse. It can also be seen from the turbulent kinetic energy contour (see Figure 16) that the simultaneous application of actuation at four positions greatly saves the vortex energy generated by the flow around the rear of the car.
4.4. Optimization Results
To minimize the drag coefficient, the supply voltages at the four positions are optimized by an optimization algorithm. The results are shown in Table 2. Under the optimal actuation condition of plasma that the predicted value obtained from the response surface in this paper is 0.2887, and the Cd of the simulation is 0.2856, the error between the predicted and the simulated value is 1.09%. This shows that the accuracy of the response surface fitted meets the requirements. Compared with the original model, the drag coefficient of the optimal model is reduced by 13.17%, and the drag reduction effect is obvious.
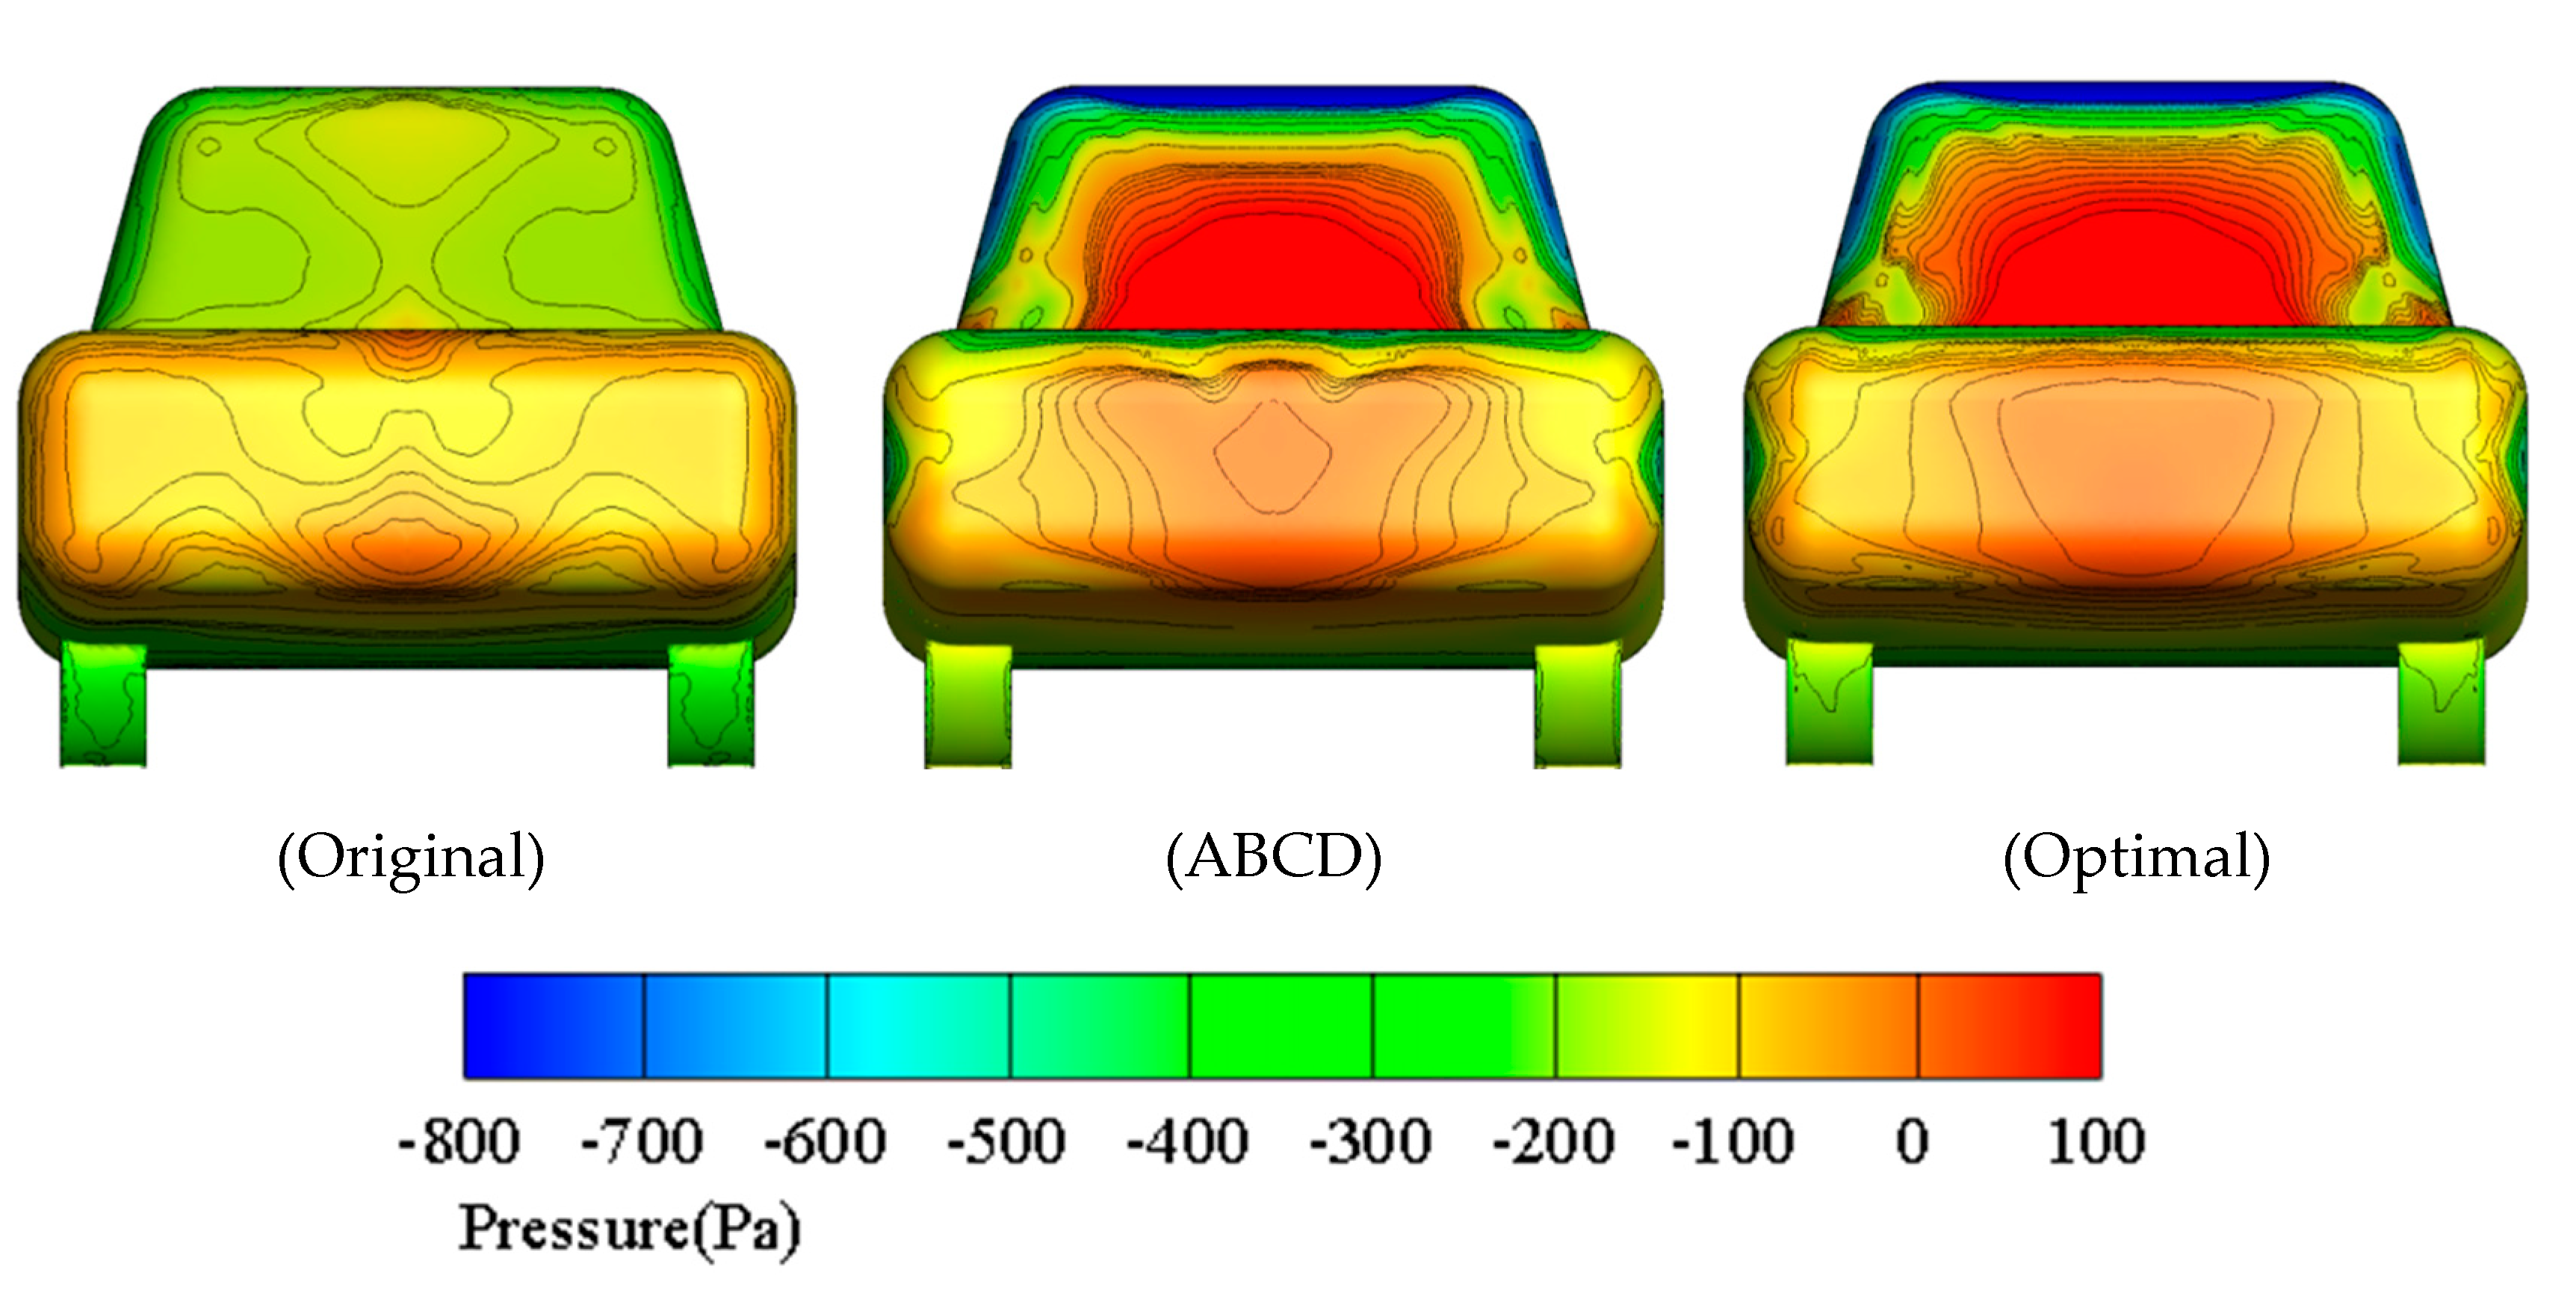
Figure 17 shows the pressure contour of the vehicle surface, where we can clearly observe that, compared with the original model, the surface pressure at the rear of the car body recovers well, and a large positive pressure area appears at the rear windshield and the surface of the trunk lid. This is because the plasma actuation acting on the fluid near the wall surface of the vehicle body, which increases the internal kinetic energy of the boundary layer and enhances its ability to resist back-pressure gradients, effectively inhibits or delays the result of airflow separation. Compared with the ABCD model, the optimal model has a better recovery effect of the body surface pressure. The reason for this phenomenon may be that the flow separation between the various parts of the rear of the car is different. The appropriate control strength should be applied according to the respective flow separation conditions. It is beneficial to improve the flow field at the rear of the vehicle to obtain a better control effect.
4.5. Data Mining
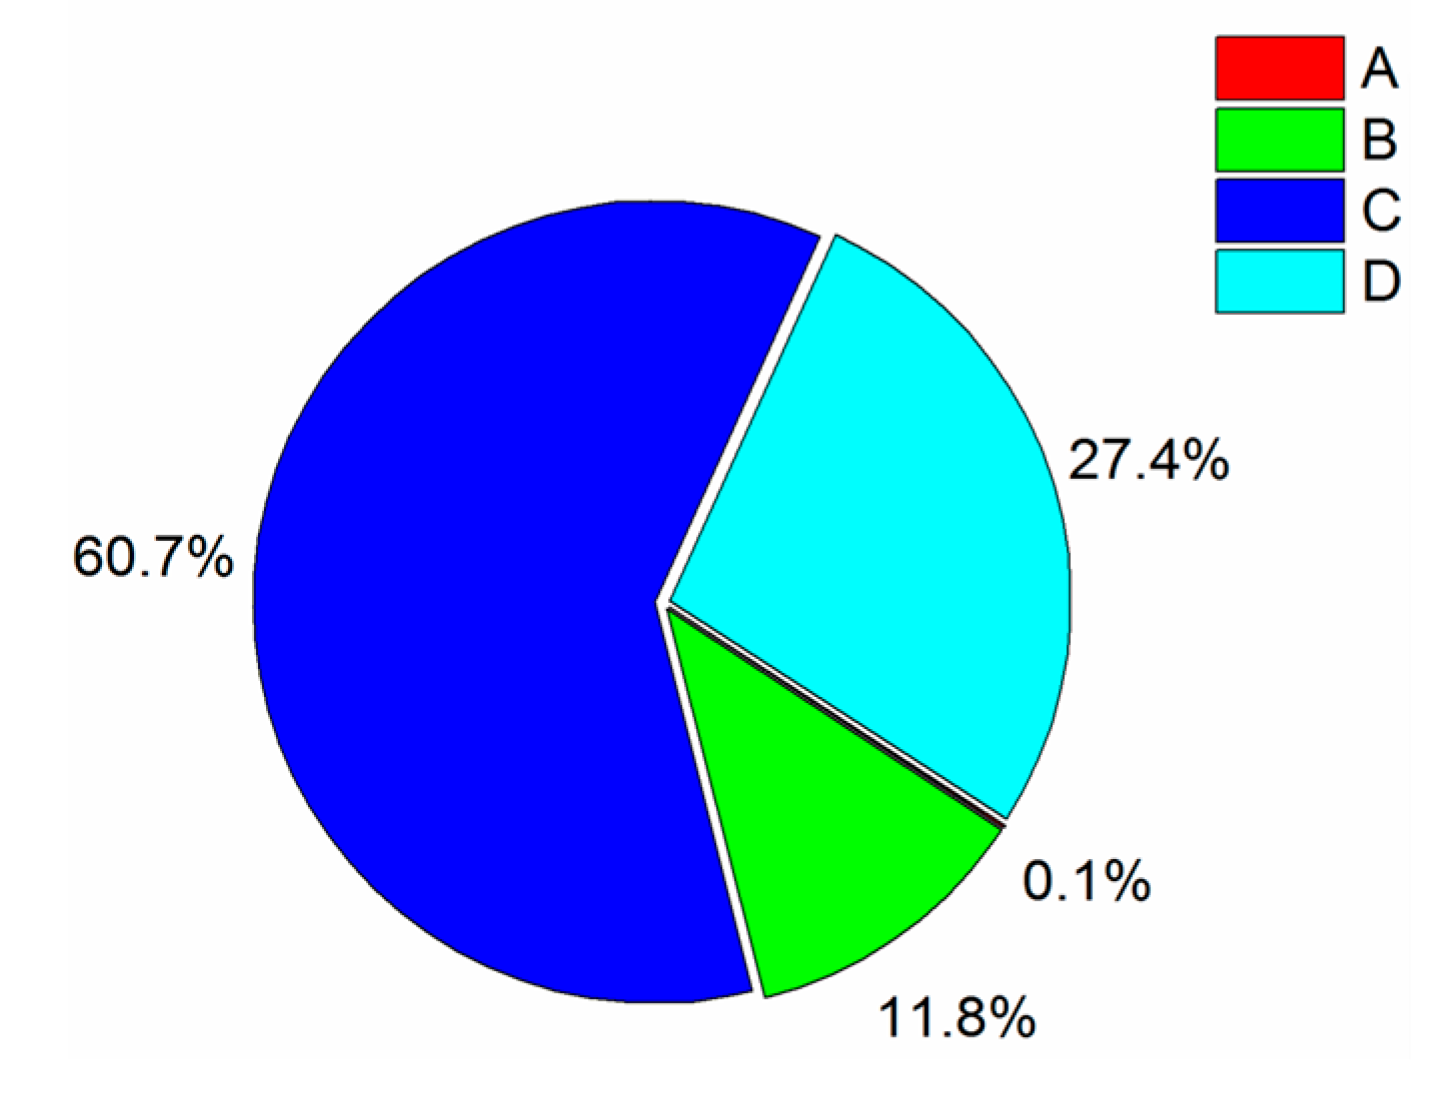
Data mining is a technology of analyzing big amounts of data [43]. Based on the kriging model, total variation analysis is carried out to investigate the interactions between variables and objectives. Total variation analysis (see Figure 18) can investigate the interactions in a quantitative way and reflect the sensitivities of the objectives on each variable. As shown in Figure 18, in the condition of co-actuation, all the variables have an influence on Cd. Acting the plasma at the position of C has the greatest impact on the drag coefficient, which accounted for 60.7%. This shows that the change in flow field structure is more sensitive to the plasma effect at the position of C. Another more sensitive parameter is the applied plasma on the position of D, where its proportion is 27.4%.
5. Conclusions and Future Work
This paper mainly talks about the application of plasma active flow control technology to improve the flow field structure of an automobile tail, so as to reduce drag. The results illustrate that only the actuation at the side of the trunk can reduce the drag, and when the plasma actuation was applied at each position separately, the drag reduction rate reached 5.35%. The flow field structure at the rear of the vehicle can be enhanced in most cases when the actuation is applied simultaneously at two or more positions. Particularly, the drag reduction effect is best performed as high as 8.76% when the actuation is applied simultaneously at all positions. Meanwhile, the actuation voltage is optimized by an efficient global optimization algorithm, and the drag reduction rate reaches 13.17%. This suggests that the plasma jet can obviously inhibit the flow separation in the tail of the vehicle and strengthen the aerodynamic characteristics of the vehicle as long as the appropriate plasma intensity is applied at the appropriate position. The latest research trends demonstrate the influence of the output voltage of the actuator on the control effect to some extent, but other parameters of the plasma actuator have not been considered, such as the influence of actuation frequency, electrode width and thickness and dielectric thickness on the control effect. Future work may involve studying the control effect of the flow field of the automobile via the latest plasma numerical simulation methods, and the numerical simulation results will be verified by a wind tunnel test on the account of the influence of more actuator parameters on the control effect.
Author Contributions
C.L. drafted the paper and provided the overall research ideas. H.F. provided the plasma numerical simulation method and optimization strategy suggestions. Z.L. and L.J. analyzed the data. B.H. revised the paper. These authors are contributed equally to this work. All authors have read and agreed to the published version of the manuscript.
Funding
This work was supported by the National Natural Science Foundation of China (Grant No. 51305477), to whom the authors wish to express their thanks.
Acknowledgments
The authors would like to thank the anonymous reviewers for their valuable comments and suggestions.
Conflicts of Interest
The authors declare no conflict of interest.
Nomenclature
| AC | Alternating current |
| CD | Coefficient drag |
| DC | Direct current |
| EI | Expected improvement |
| EGO | Efficient global optimization |
| LHS | Latin hyper-cube sampling |
| MIRA | Motor industry research association |
| SDBD | Surface dielectric barrier discharge |
| SMODE | Self-adaptive multi-objective differential evolution |
| UD | Uniform design |
| UDF | User define function |
References
- Gu, Z.Q. Automotive Aerodynamics; People’s Communications Press: Beijing, China, 2005. [Google Scholar]
- Nouzawa, T.; Hiasa, K.; Nakamura, T. Analysis of wake pattern for reducing aerodynamic drag of notch-back model. SAE Trans. 1990, 486–494. [Google Scholar]
- Gilhome, B.R.; Saunders, J.W.; Sheridan, J. Time averaged and unsteady near-wake analysis of cars. SAE Trans. 2001, 1179–1196. [Google Scholar]
- Wang, S. Wind Tunnel Test Research on the Aerodynamic Characteristics Model of Mira Model Group; Hunan University: Hunan, China, 2011. [Google Scholar]
- Yang, Y.; Liu, Z.; Gu, Z.Q. Optimization design method of non-smooth surface at the tail of Mira step back model. J. Chongqing Univ. 2015, 38, 10–17. [Google Scholar]
- Zheng, M.; Huang, J.F. Aerodynamic drag reduction method based on non-smooth surface and eddy current interference. J. Mech. Eng. 2016, 27, 982–988. [Google Scholar]
- Boeuf, J.P.; Lagmich, Y.; Unfer, T.; Callegari, T.; Pitchford, L.C. Electrohydrodynamic force in dielectric barrier discharge plasma actuators. J. Appl. Phys. D 2007, 40, 652–662. [Google Scholar] [CrossRef]
- Artana, G.; D’Adamo, J.; Leger, L.; Moreau, E.; Touchard, G. Flow control with electrohydrodynamic actuators AIAA 2001-0351. In Proceedings of the 39th Aerospace Sciences Meeting and Exhibit, Reno, NV, USA, 8 January 2001. [Google Scholar]
- Labergue, A.; Moreau, E.; Zou, N.; Touchard, G. Separation control using plasma actuators: Application to a free turbulent jet. J. Appl. Phys. D 2007, 40, 674–684. [Google Scholar] [CrossRef]
- Roth, J.R.; Sherman, D.M. Electrohydrodynamic flow control with a glow-discharge surface plasma. AIAA J. 2000, 38, 1166–1172. [Google Scholar] [CrossRef]
- Bychkov, V.; Kuzmin, G.; Minaev, I.; Rukhadze, A.; Timofeev, I. Sliding discharge application in aerodynamics AIAA 2003-530. In Proceedings of the 46th Aerospace Sciences Meeting and Exhibit, Reno, NV, USA, 7–10 January 2008. [Google Scholar]
- Roy, S.; Wang, C.C. Bulk flow modification with horseshoe and serpentine plasma actuators. J. Phys. D 2009, 42. [Google Scholar] [CrossRef]
- Wang, J.L.; Li, H.X.; Liu, F.; Luo, S. Forebody asymmetric load manipulated by a horseshoe-shaped plasma actuators AIAA 2009-904. In Proceedings of the 47th Aerospace Sciences Meeting Including the New Horizons Forum and Aerospace Exposition, Orlando, FL, USA, 5–8 January 2009. [Google Scholar]
- Rodrigues, F.; Mushyam, A.; Pascoa, J.; Trancossi, M. A new plasma actuator configuration for improved efficiency: The stair-shaped dielectric barrier discharge actuator. J. Phys. D 2019, 52. [Google Scholar] [CrossRef]
- Rodrigues, F.; Páscoa, J. Implementation of stair-shaped dielectric layers in micro and macro plasma actuators for increased efficiency and lifetime. J. Fluids Eng. 2020. [Google Scholar] [CrossRef]
- Roupassov, D.V.; Zavyalov, I.N.; Starikovskii, A.Y. Boundary layer separation plasma control using low-temperature non-equilibrium plasma of gas discharge AIAA 2006-373. In Proceedings of the 44th Aerospace Sciences Meeting and Exhibit, Reno, NV, USA, 9–12 January 2006. [Google Scholar]
- Correale, G.; Popov, I.B.; Rakitin, A.; Starikovskii, A.; Hulshoff, S.; Veldhuis, L. Flow separation control on airfoil with pulsed nanosecond discharge actuator AIAA 2011-1079. In Proceedings of the 49th Aerospace Sciences Meeting Including the New Horizons Forum and Aerospace Exposition, Orlando, FL, USA, 4–7 January 2011. [Google Scholar]
- Gaitonde, D.V.; McCrink, M.H. A semi-empirical model of a nanosecond pulsed plasma actuator for flow control simulation with LES AIAA 2012-0184. In Proceedings of the 50th Aerospace Sciences Meeting Including the New Horizons Forum and Aerospace Exposition, Nashville, TN, USA, 9–12 January 2012. [Google Scholar]
- Leonov, S.B.; Yarantsev, D.A.; Gromov, V.G.; Kuriachy, A. Mec-hanisms of flow control by near-surface electrical discharge generation AIAA 2005-780. In Proceedings of the 43rd Aerospace Sciences Meeting and Exhibit, Reno, NV, USA, 10–13 January 2005. [Google Scholar]
- Shang, J.S.; Surzhikov, S.T.; Kimmel, R.; Gaitonde, D.; Menart, J.; Hayes, J. Mechnisms of plasma actuators for hyper-sonic flow control. Prog. Aerosp. Sci. 2005, 41, 642–668. [Google Scholar] [CrossRef]
- Enloe, C.L.; McLaughlin, T.E.; VanDyken, R.D.; Kachner, K.D.; Jumper, E.J.; Corke, T.C. Mechanisms and responses of a single dielectric barrier plasma actuator: Plasma morphology. AIAA J. 2004, 42, 589–594. [Google Scholar] [CrossRef]
- Roupassov, D.V.; Nikipelov, A.A.; Nudnova, M.M.; Starikovskii, A.Y. Flow separation control by plasma actuator with nanosecond pulsed-periodic discharge. AIAA J. 2009, 47, 168–185. [Google Scholar] [CrossRef]
- Shyy, W.; Jayaraman, B.; Anderson, A. Modeling of glow discharge-induced fluid dynamics. J. Appl. Phys. 2002, 92, 6434–6443. [Google Scholar] [CrossRef]
- Suzen, Y.B.; Huang, P.G.; Jacob, J.D. Numerical simulations of plasma based flow control applications AIAA 2005-4633. In Proceedings of the 35th Fluid Dynamics Conference and Exhibit, Toronto, ON, Canada, 6–9 June 2005. [Google Scholar]
- Johnson, G.A.; Scott, S.J. Plasma aerodynamic boundary layer interaction studies AIAA 2001-3052. In Proceedings of the 32nd Plasma-dynamics and Lasers Conference and 4th Weakly Ionized Gases Workshop, Anaheim, CA, USA, 11–14 June 2001. [Google Scholar]
- Mao, M.L.; Deng, X.G.; Xiang, D.P. Mechanisms of flow control in boundary layer by glow discharge plasma. J. Aerodyn. 2006, 24, 269–274. [Google Scholar]
- Gaitonde, D.V.; Visbal, M.R.; Roy, S. Control of flow past a wing section with plasma based body forces AIAA 2005-5302. In Proceedings of the Plasma-dynamics and Lasers Conference, Toronto, ON, Canada, 6–9 June 2005. [Google Scholar]
- Moreau, E. Airflow control by non-thermal plasma actuators. J. Phys. D 2007, 40, 605–636. [Google Scholar] [CrossRef]
- List, J.; Byerley, A.R.; McLaughlin, T.E.; Van Dyken, R.D. Using a plasma actuator to control laminar separation on a linear cascade turbine blade AIAA 2003-1026. In Proceedings of the 41st Aerospace Sciences Meeting and Exhibit, Reno, NV, USA, 6–9 January 2003. [Google Scholar]
- Kopiev, V.; Ostrikov, N.; Zaitsev, M.; Kopiev, V.; Belyaev, I.; Bityurin, V.; Klimov, A.; Moralev, I.; Godin, S. Jet noise control by nozzle surface HF DBD actuators AIAA 2011-911. In Proceedings of the 49th Aerospace Sciences Meeting Including the New Horizons Forum and Aerospace Exposition, Orlando, FL, USA, 4–7 January 2011. [Google Scholar]
- Shimizu, K.; Nakashima, T.; Sekimoto, S.; Fujii, K.; Hiraoka, T.; Nakamura, Y.; Nouzawa, T.; Ikeda, J.; Tsubokura, M. Aerodynamic drag reduction of a simplified vehicle model by promoting flow separation using plasma actuator. Mech. Eng. Lett. 2019, 5. [Google Scholar] [CrossRef]
- Michelis, T.; Kotsonis, M. Flow control on a transport truck side mirror using plasma actuators. J. Fluids Eng. 2015, 137. [Google Scholar] [CrossRef]
- Roy, S.; Zhao, P.; DasGupta, A.; Soni, J. Dielectric barrier discharge actuator for vehicle drag reduction at highway speeds. AIP Adv. 2016, 6, 025233. [Google Scholar] [CrossRef] [Green Version]
- Boucinha, V.; Weber, R.; Kourta, A. Drag reduction of a 3D bluff body using plasma actuators. Int. J. Aerodyn. 2011, 1, 262–281. [Google Scholar] [CrossRef]
- Shadmani, S.; Mojtaba, M.; Mousavi Nainiyan, S.; Mirzaei, M.; Ghasemiasl, R.; Pouryoussefi, S.G. Experimental investigation of flow control over an Ahmed body using DBD plasma actuator. J. Appl. Fluid Mech. 2018, 11, 1267–1276. [Google Scholar] [CrossRef]
- Hui, Z.; Hu, X.; Guo, P.; Wang, Z.; Wang, J. Separation flow control of a generic ground vehicle using an SDBD plasma actuator. Energies 2019, 12, 3805. [Google Scholar] [CrossRef] [Green Version]
- Zheng, Y.; Wang, L.; Li, A.; Tao, P. Performance evaluation by computational fluid dynamics modelling of the heavy gas dispersion with a low Froude number in a built environment. Indoor Built Environ. 2020, 29, 656–670. [Google Scholar] [CrossRef]
- Li, G. Research on Plasma Flow Control Mechanism and Its Application; Chinese Academy of Sciences: Beijing, China, 2008. [Google Scholar]
- Jones, D.R. A taxonomy of global optimization methods based on response surfaces. J. Glob. Optim. 2001, 21, 345–383. [Google Scholar] [CrossRef]
- Mckay, M.D.; Beckman, R.J.; Conover, W.J. A comparison of three methods for selecting values of input variables in the analysis of output from a computer code technometrics. Technometrics 1979, 21, 239–245. [Google Scholar]
- Fang, K.T.; Winker, P.; Zhang, Y. Uniform design: Theory and application. Technometrics 2000, 42, 237–248. [Google Scholar] [CrossRef]
- Song, L.; Luo, C.; Li, J.; Feng, Z. Automated multi-objective and multidisciplinary design optimization of a transonic turbine stage. Proc. Inst. Mech. Eng. Part A 2012, 226, 262–276. [Google Scholar] [CrossRef]
- Abuomar, O.; Nouranian, S.; King, R.; Bouvard, J.L.; Toghiani, H.; Lacy, T.E.; Pittman, C.U., Jr. Data mining and knowledge discovery in materials science and engineering: A polymer nanocomposites case study. Adv. Eng. Inf. 2013, 27, 615–624. [Google Scholar] [CrossRef]
Figure 1.
Proposed flow topology over the rear of notch-back vehicles. Adapted from [3].
Figure 1.
Proposed flow topology over the rear of notch-back vehicles. Adapted from [3].

Figure 2.
Surface dielectric barrier discharge (SDBD) plasma actuator structure.

Figure 3.
Research vehicle mode.

Figure 4.
Computational domain.

Figure 5.
Mesh strategy.

Figure 6.
Electric field due to SDBD plasma actuator approximated by linear approximation.

Figure 7.
The velocity distribution along the y direction at 3.8 mm downstream of the upper electrode.
Figure 7.
The velocity distribution along the y direction at 3.8 mm downstream of the upper electrode.

Figure 8.
Schematic of the vehicle with the plasma actuator.

Figure 9.
Flow chart of optimization design.

Figure 10.
Velocity contour of longitudinal and horizontal symmetry plane of vehicle body.

Figure 11.
The influence of different positions and voltages on the drag coefficient.

Figure 12.
Pressure contour on x = 0.6 m section (15 kV).

Figure 13.
The influence of different combination conditions on the drag coefficient (15 kV).

Figure 14.
Pressure contour on x = 0.6 m section (15 kV).

Figure 15.
Pressure contour on x = 0.6 m section (15 kV).

Figure 16.
Turbulent kinetic energy contour on x = 0.6 m section (15 kV).

Figure 17.
Pressure contour of the vehicle surface.

Figure 18.
Total variation analysis map.


Table 1.
Mesh quality verification.
| Experiment [4] | Simulation | Error (%) | |
|---|---|---|---|
| Cd | 0.3242 | 0.3289 | 1.4 |
Table 2.
Optimal design parameters.
| Model | A (V) | B (V) | C (V) | D (V) | Prediction Cd | Simulation Cd | Error (%) |
|---|---|---|---|---|---|---|---|
| Optimal | 12,802 | 20,517 | 11,210 | 12,101 | 0.2887 | 0.2856 | 1.09 |
| Original | 0.3289 |
© 2020 by the authors. Licensee MDPI, Basel, Switzerland. This article is an open access article distributed under the terms and conditions of the Creative Commons Attribution (CC BY) license (http://creativecommons.org/licenses/by/4.0/).
Share and Cite
MDPI and ACS Style
Lai, C.; Fu, H.; Hu, B.; Ling, Z.; Jiang, L. Aerodynamic Drag Reduction and Optimization of MIRA Model Based on Plasma Actuator. Actuators 2020, 9, 64. https://0-doi-org.brum.beds.ac.uk/10.3390/act9030064
AMA Style
Lai C, Fu H, Hu B, Ling Z, Jiang L. Aerodynamic Drag Reduction and Optimization of MIRA Model Based on Plasma Actuator. Actuators. 2020; 9(3):64. https://0-doi-org.brum.beds.ac.uk/10.3390/act9030064
Chicago/Turabian StyleLai, Chenguang, Hang Fu, Bo Hu, Zhiwei Ling, and Li Jiang. 2020. "Aerodynamic Drag Reduction and Optimization of MIRA Model Based on Plasma Actuator" Actuators 9, no. 3: 64. https://0-doi-org.brum.beds.ac.uk/10.3390/act9030064
Note that from the first issue of 2016, this journal uses article numbers instead of page numbers. See further details here.