Efficiency of Coupled Experimental–Numerical Predictive Analyses for Inter-Story Floors Under Non-Isolated Machine-Induced Vibrations


Abstract
:1. Introduction
1.1. Research Topic
1.2. Research Methods
2. State-of-Art on Machine-Induced Floor Vibrations
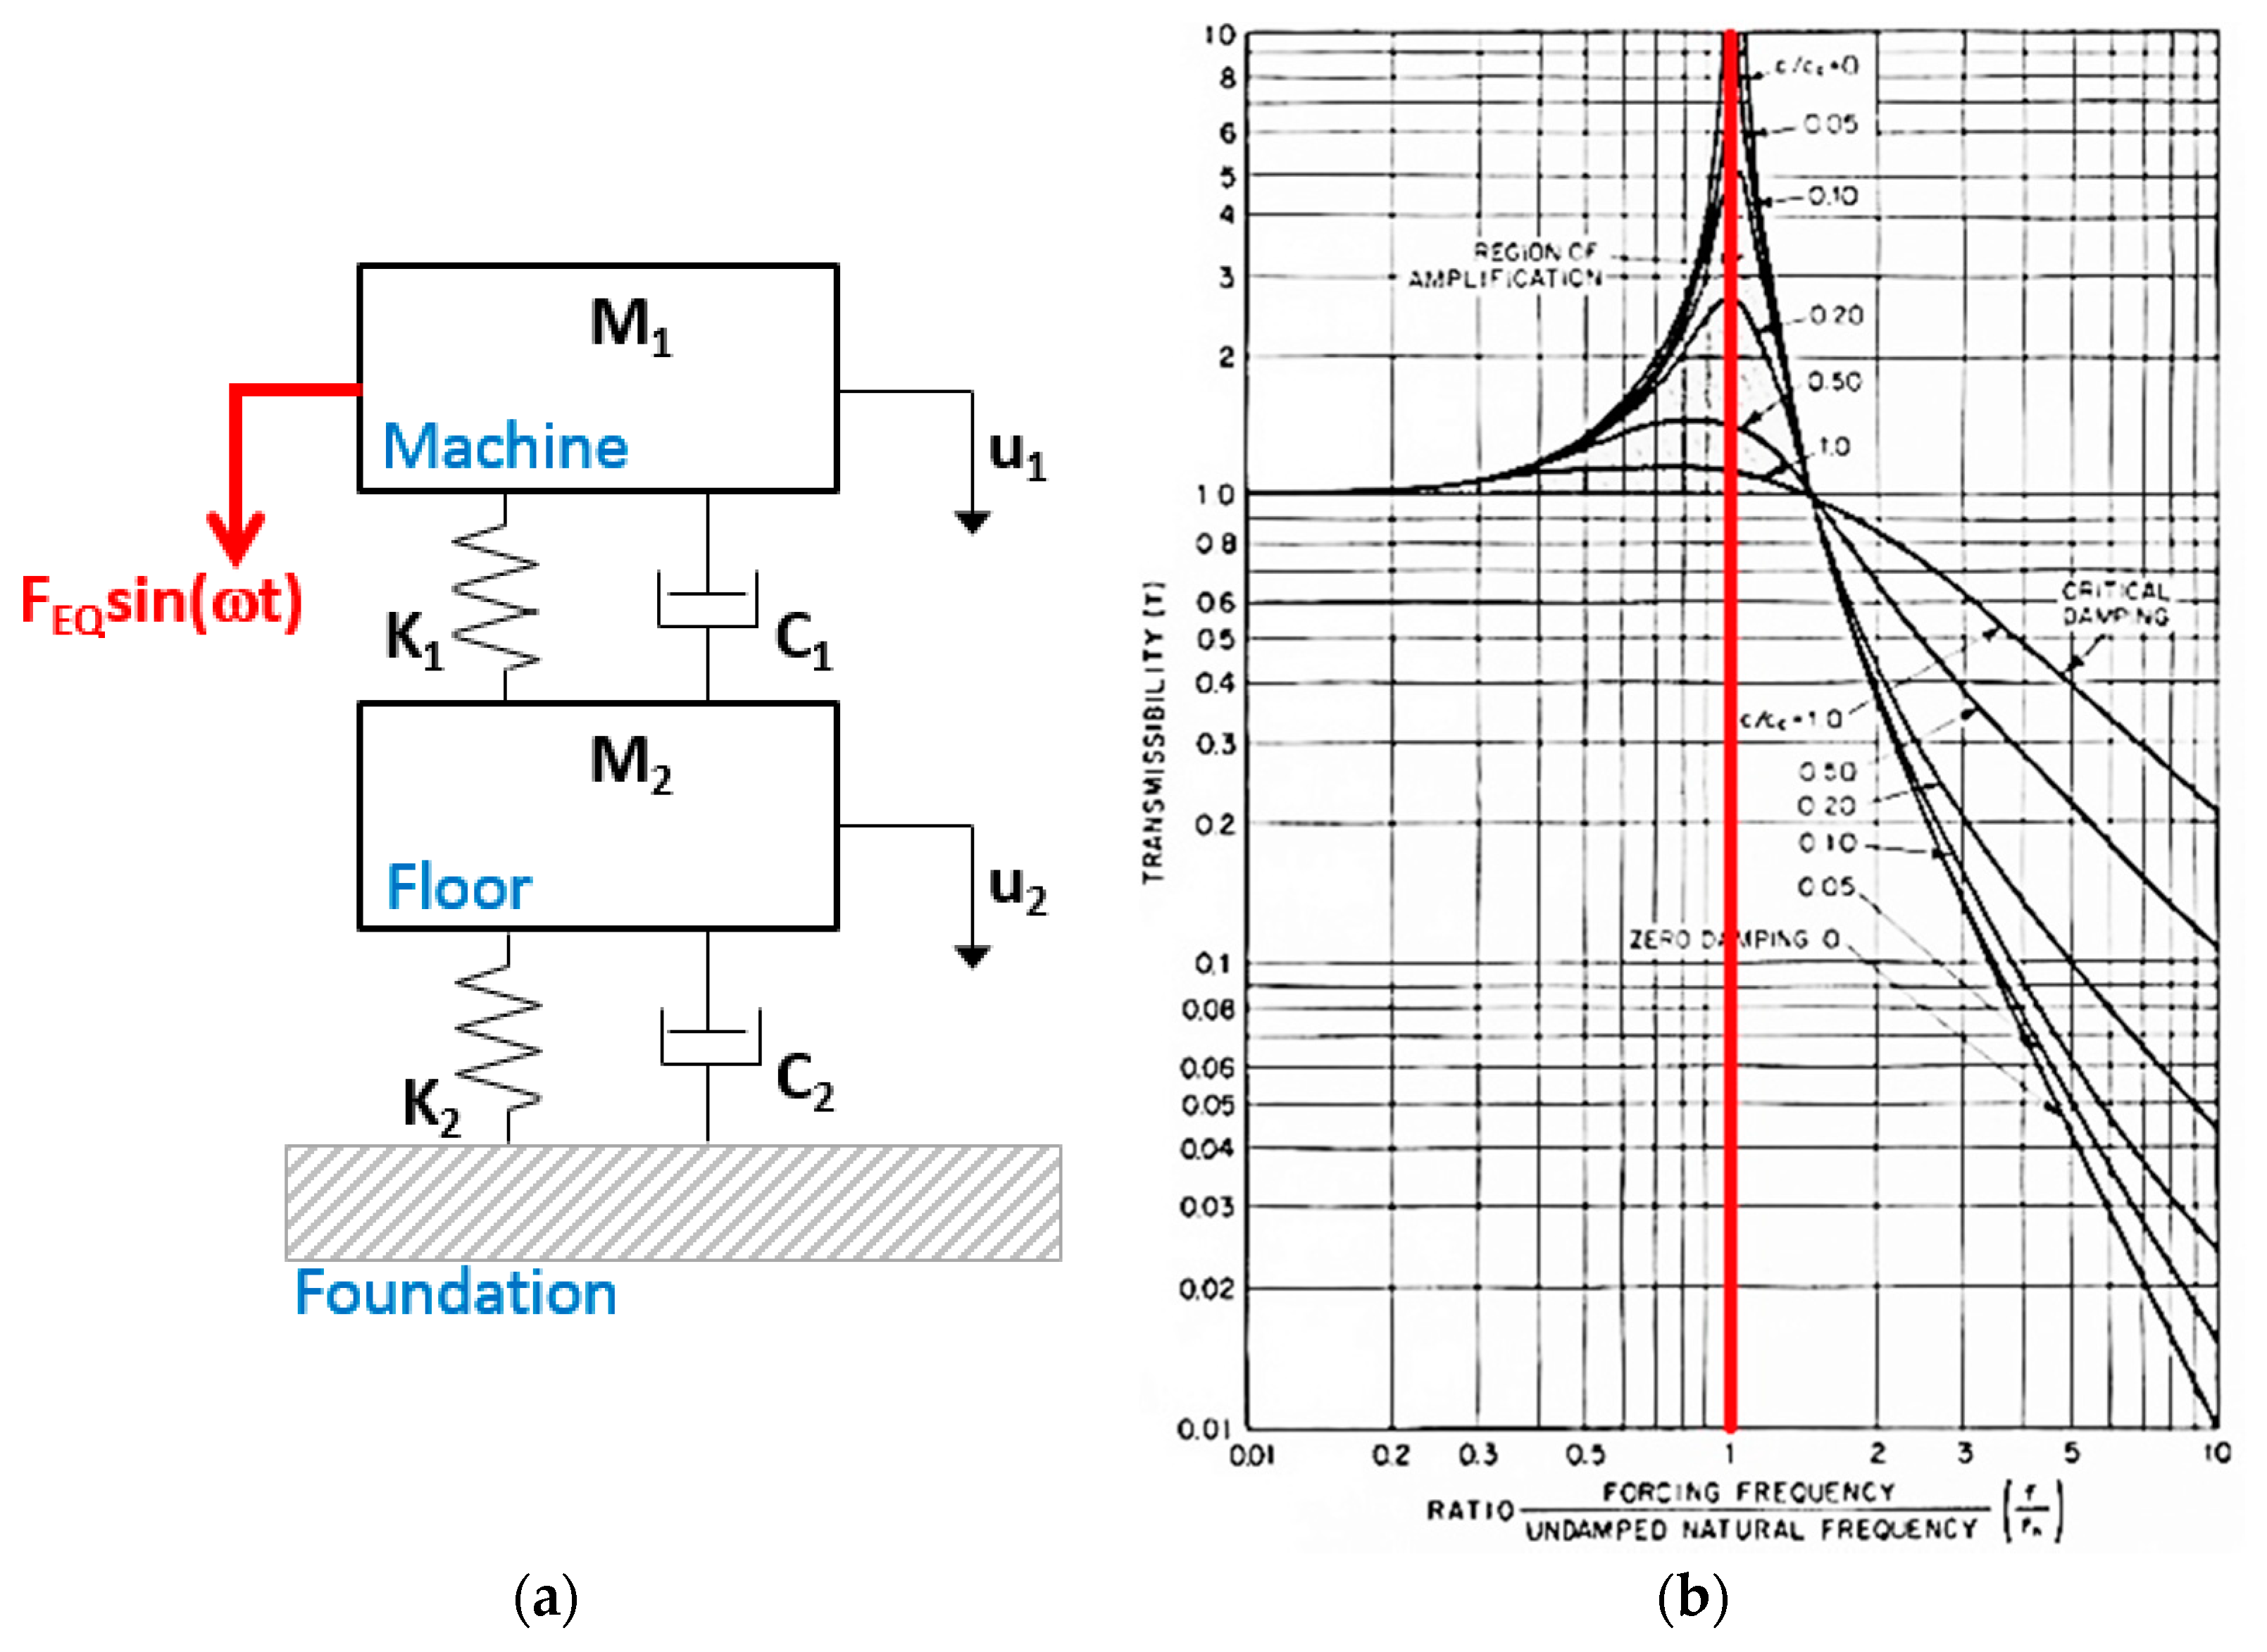
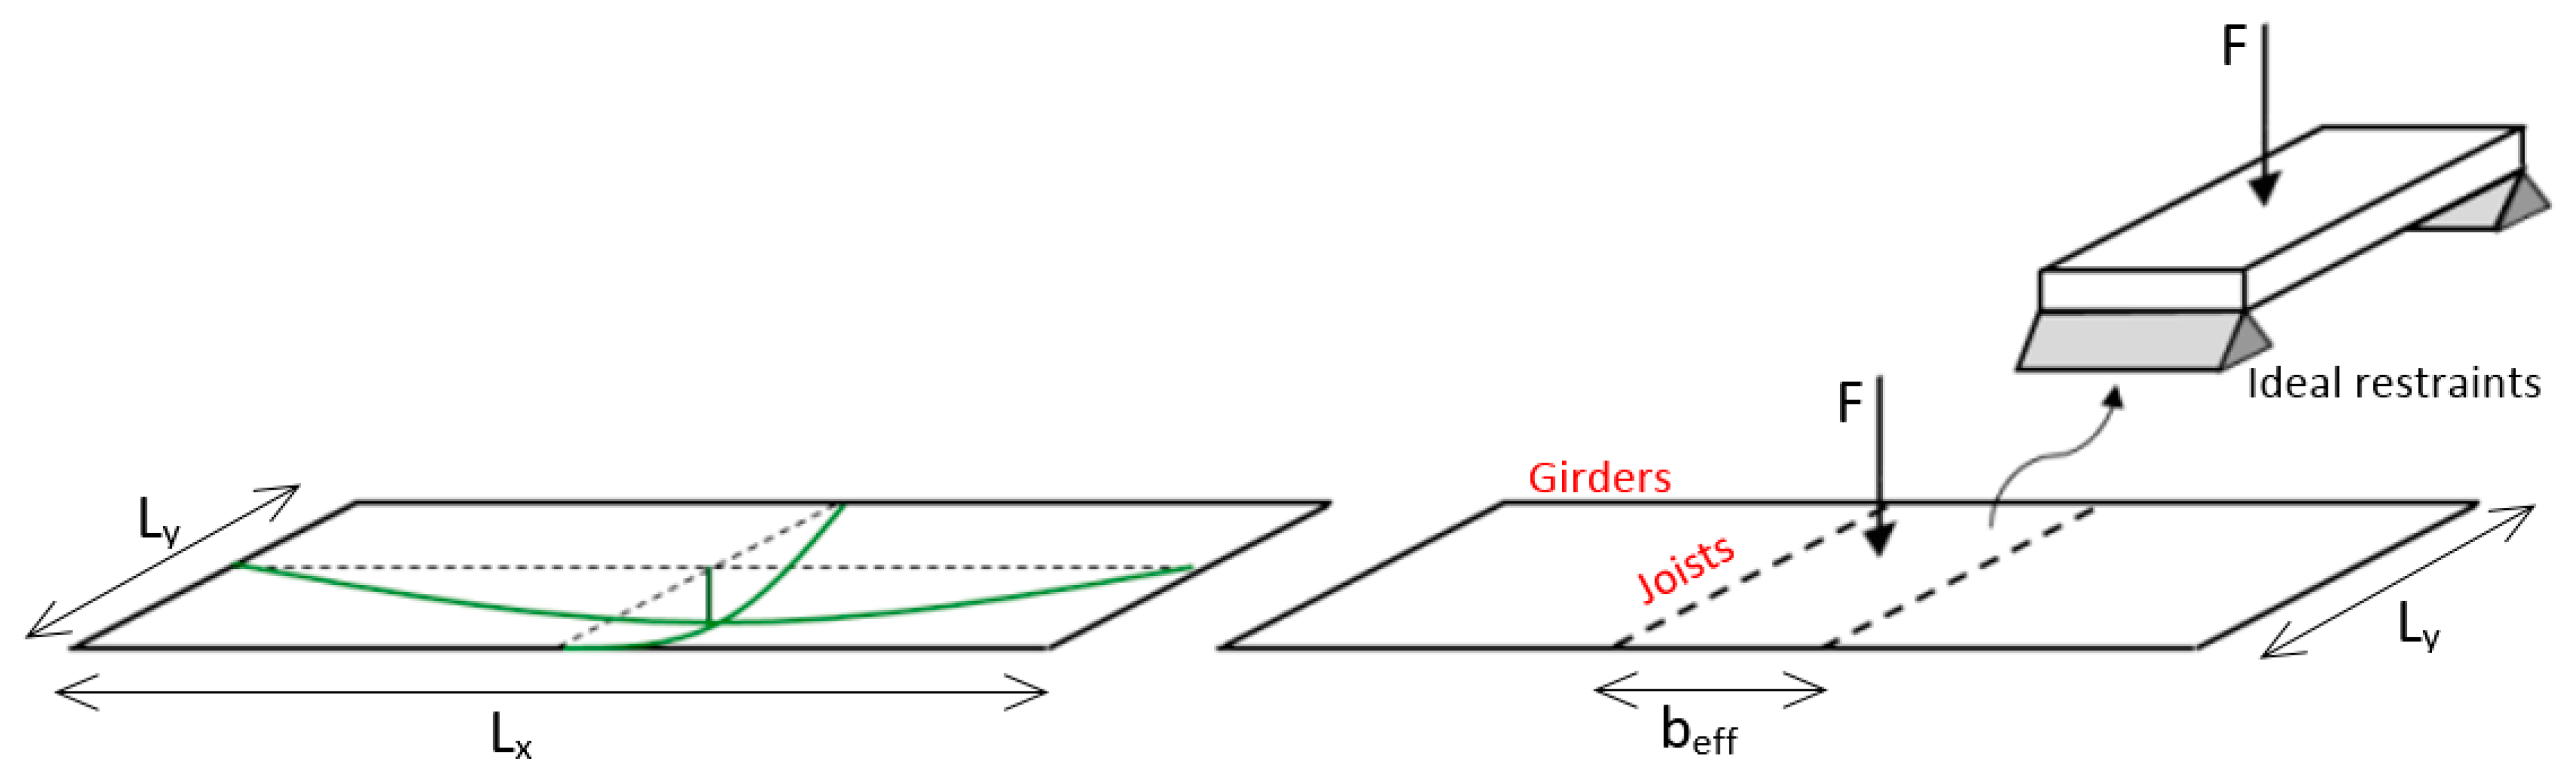
2.1. Mathematical Problem
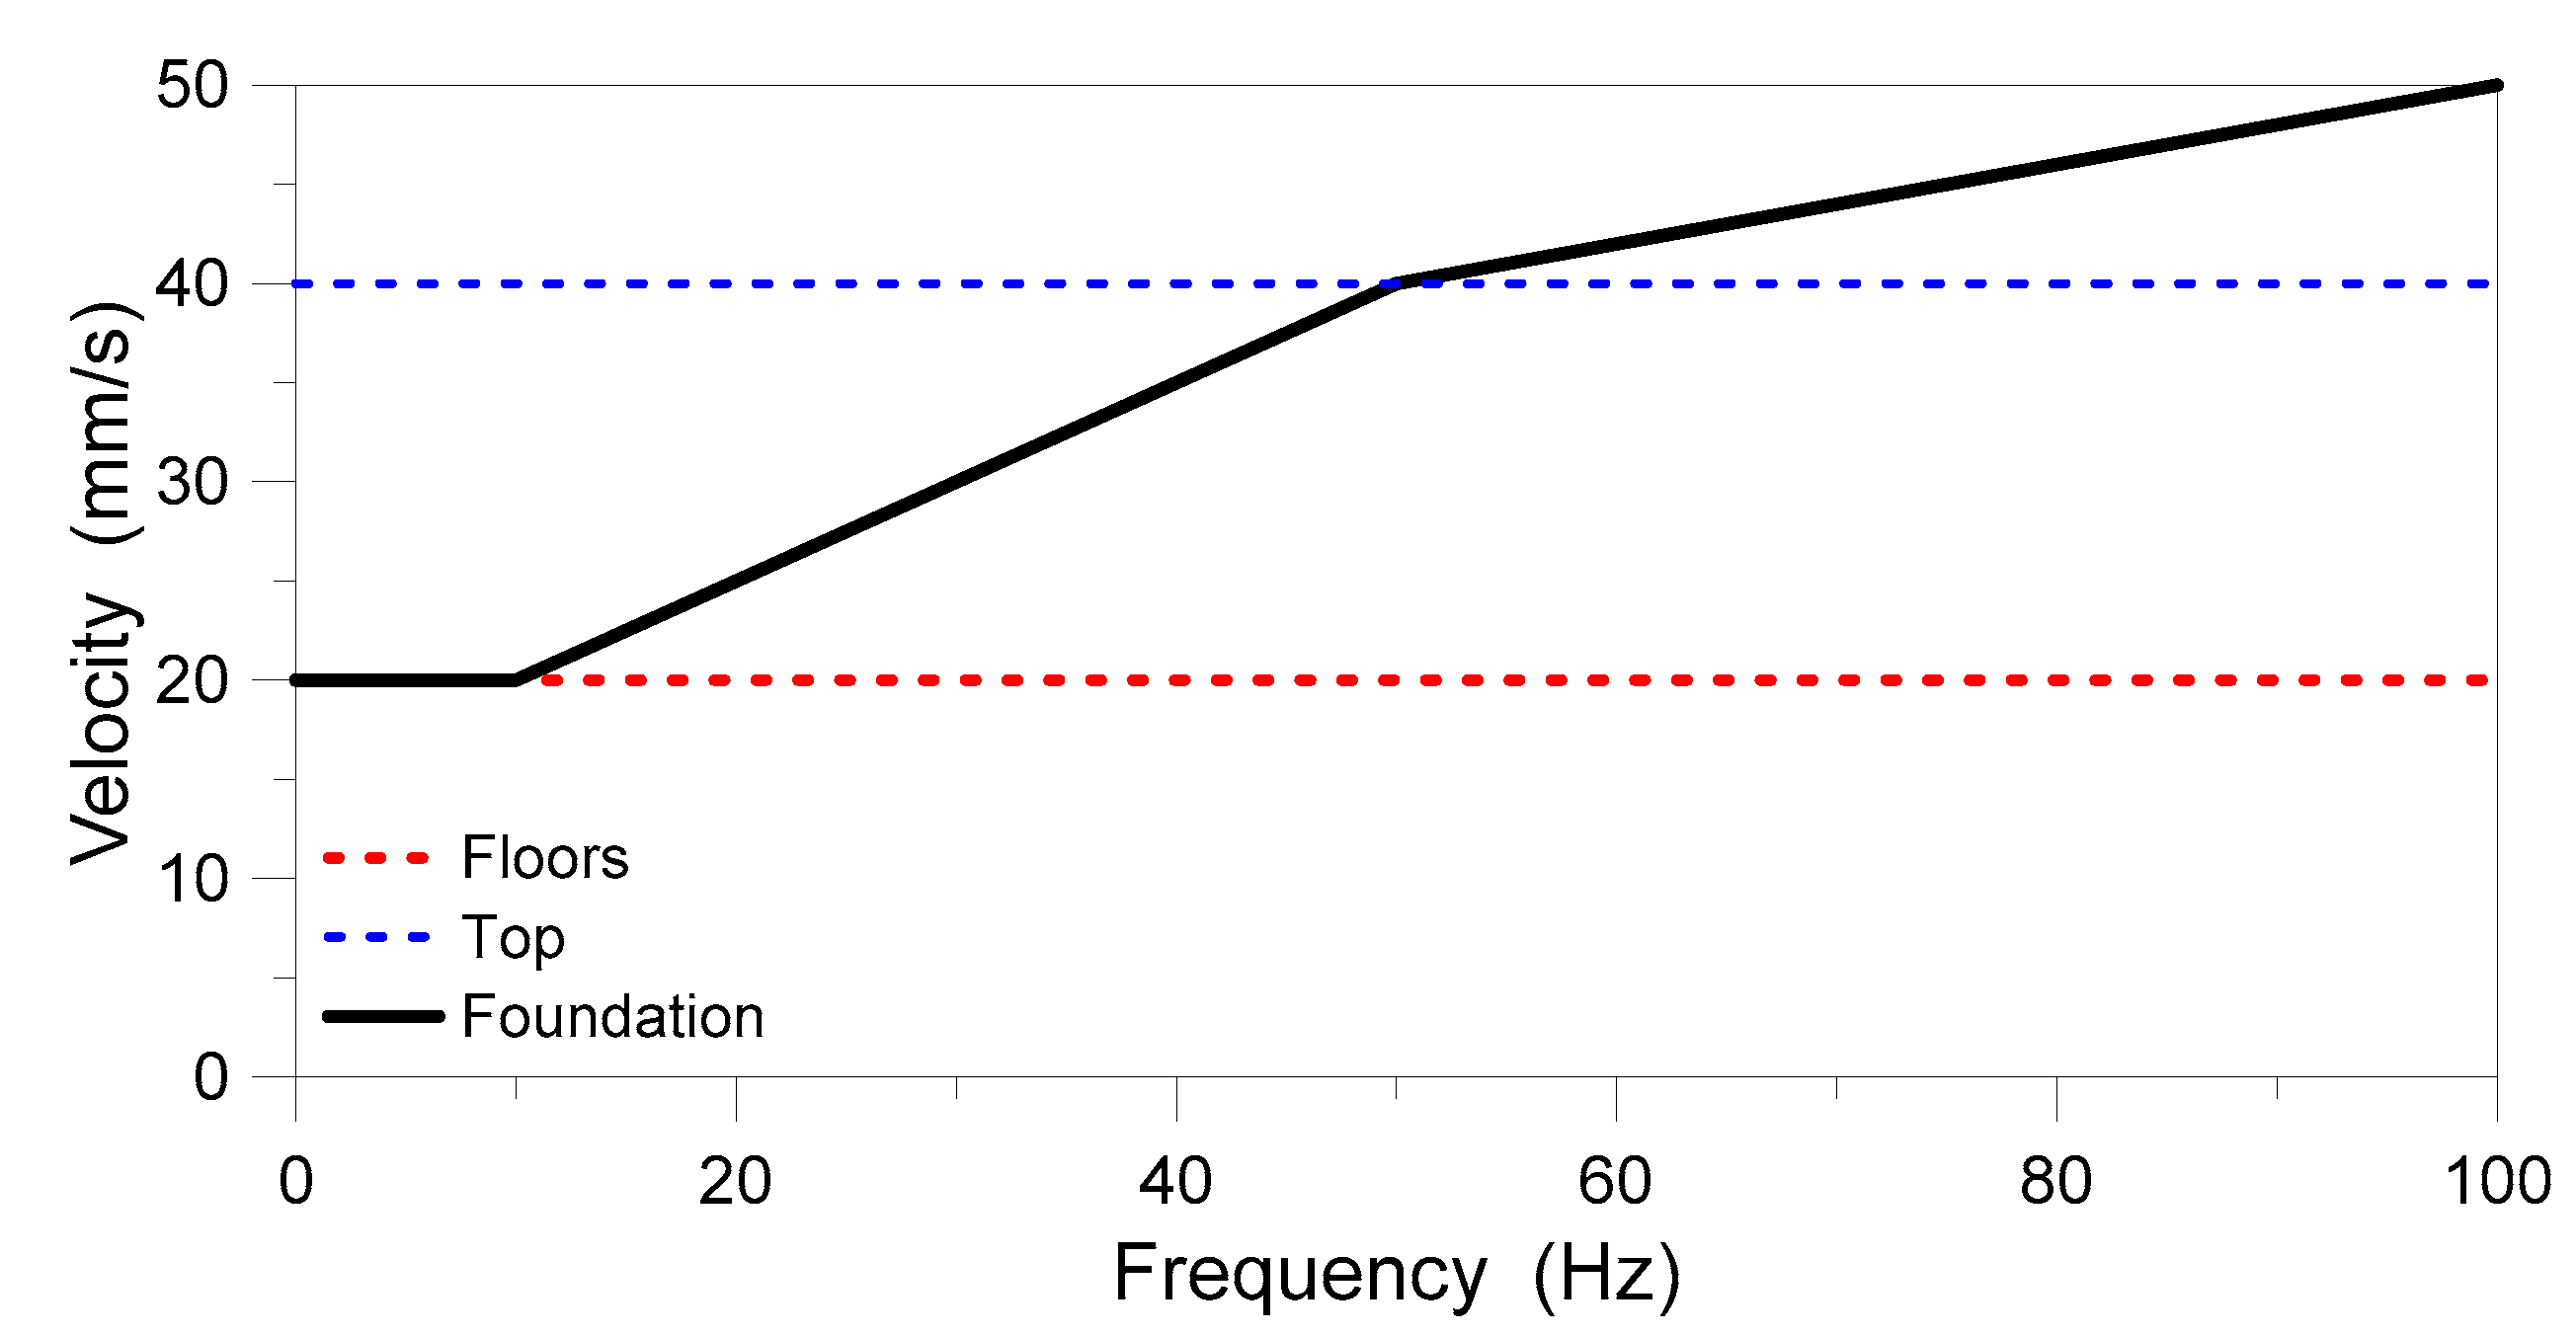
2.2. Reference Design Stantards
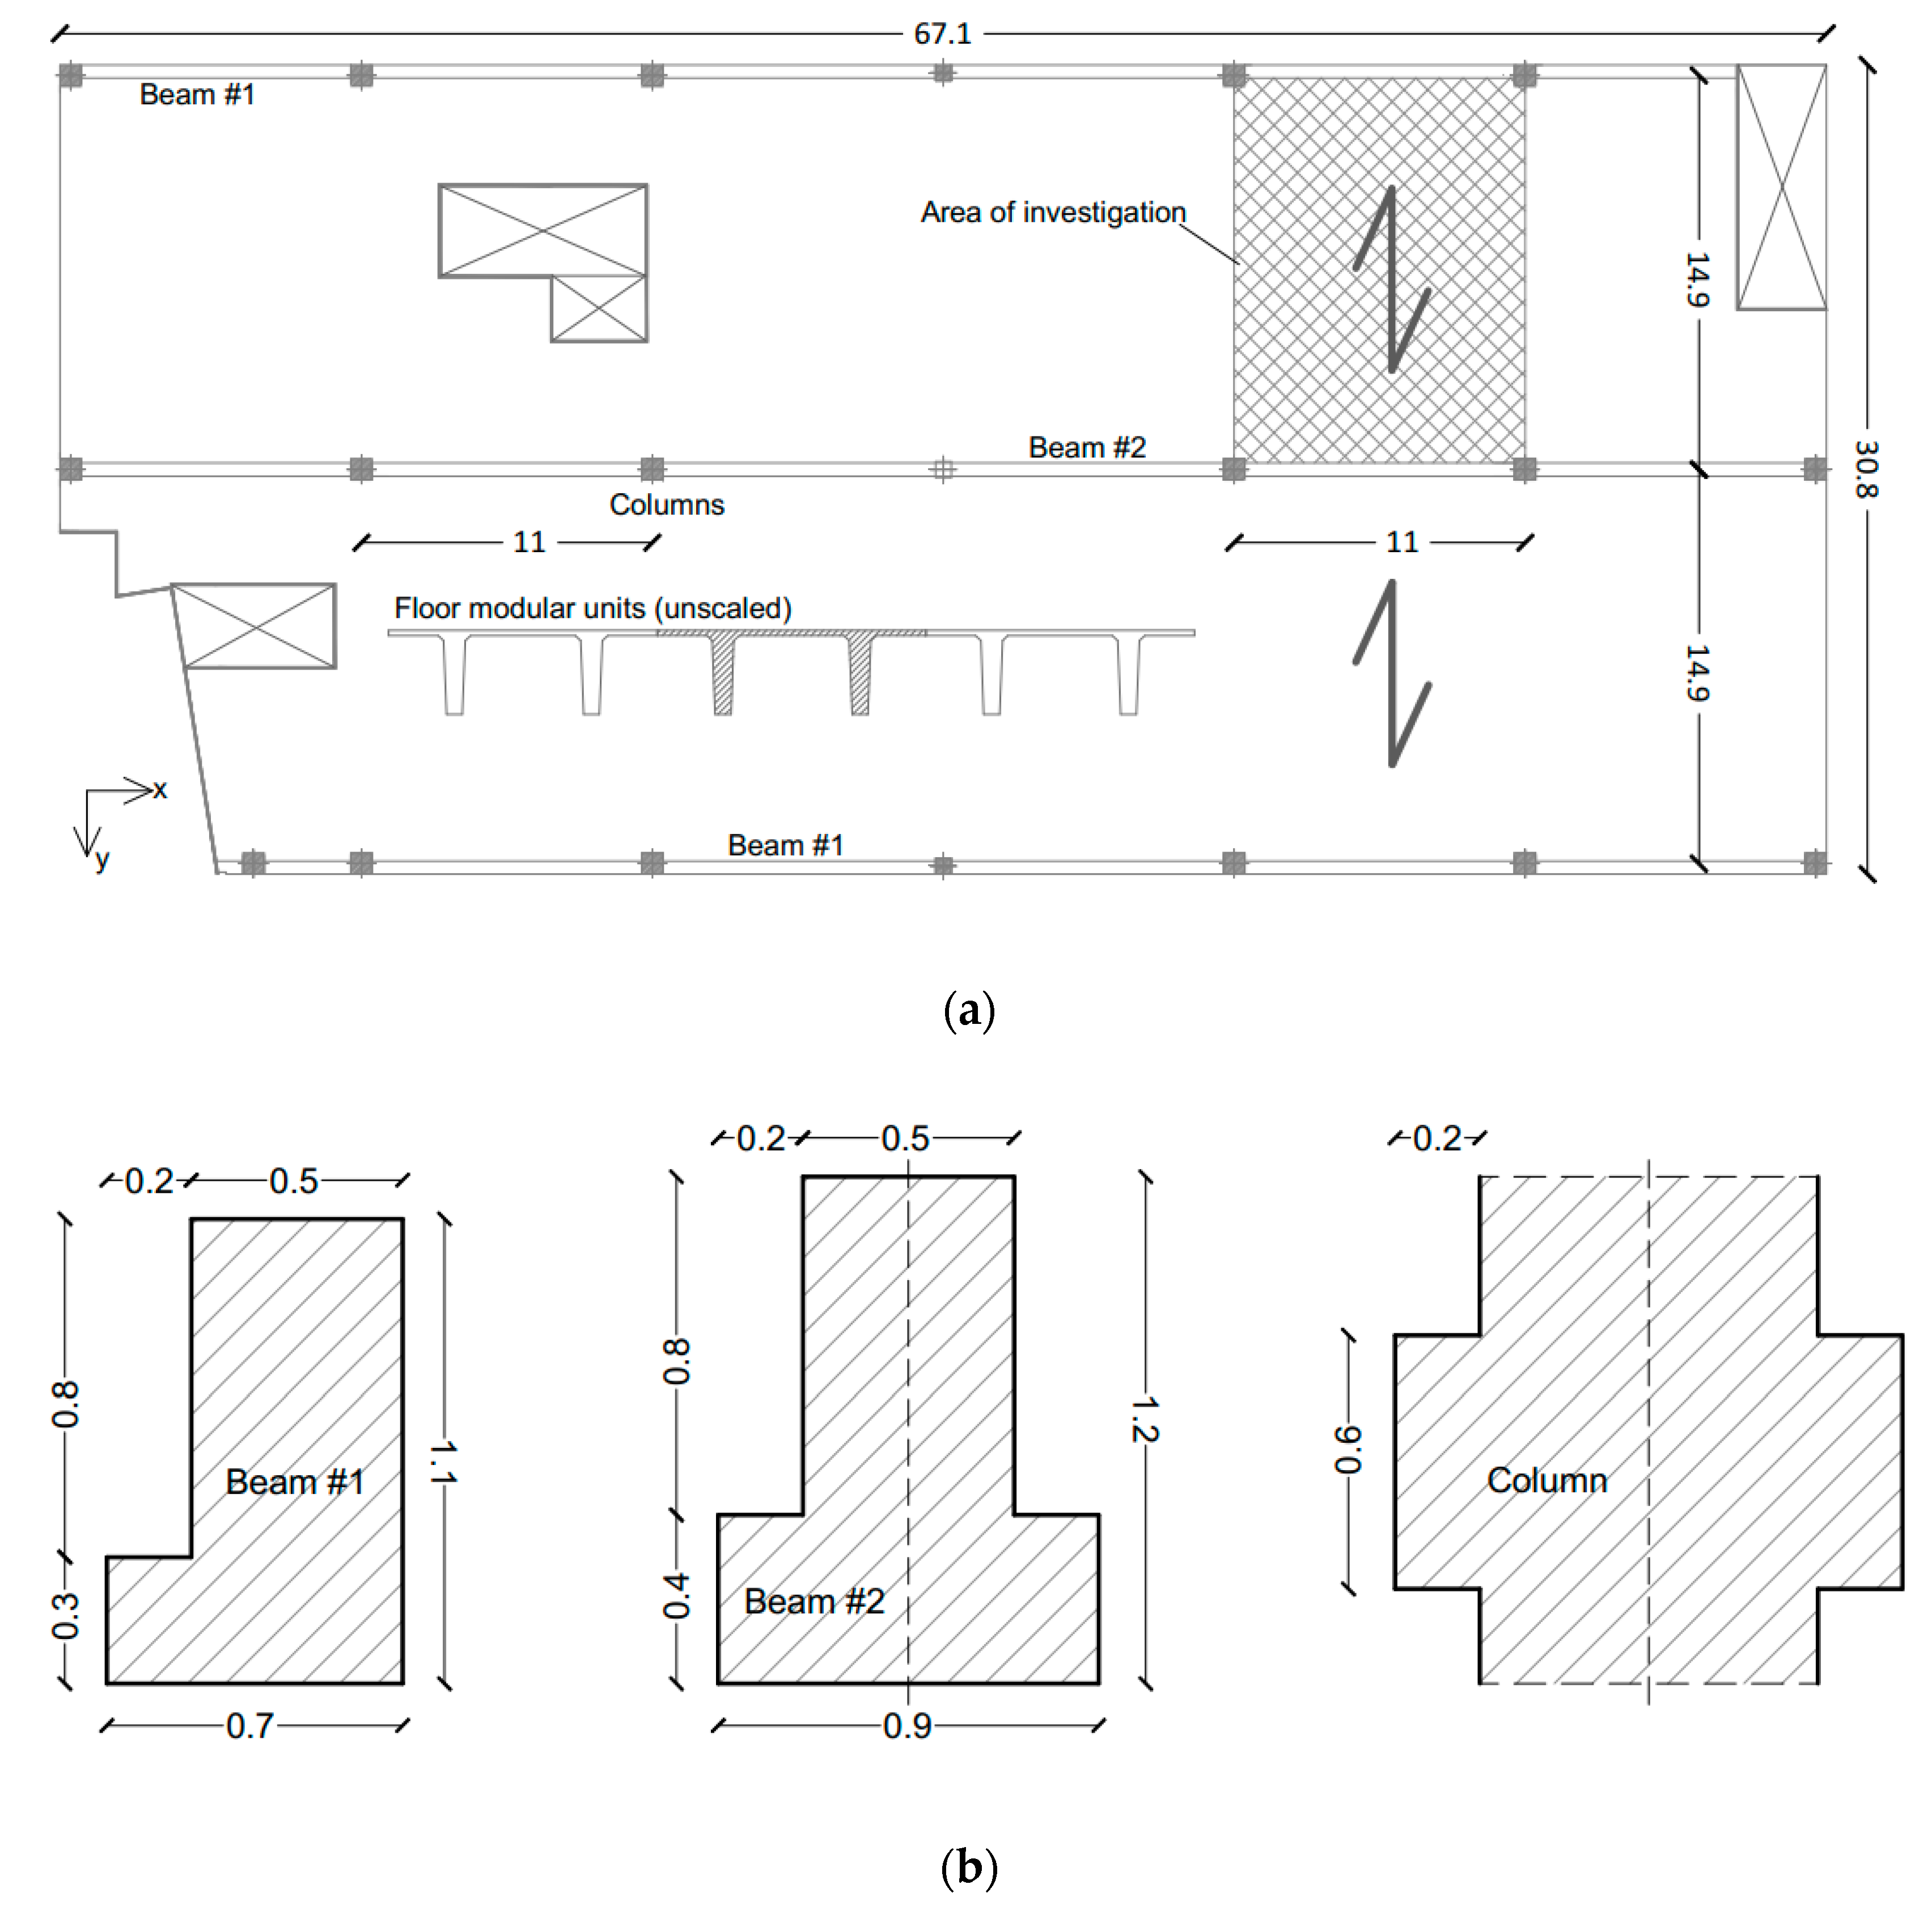
3. Case-Study Building
3.1. Design Concept
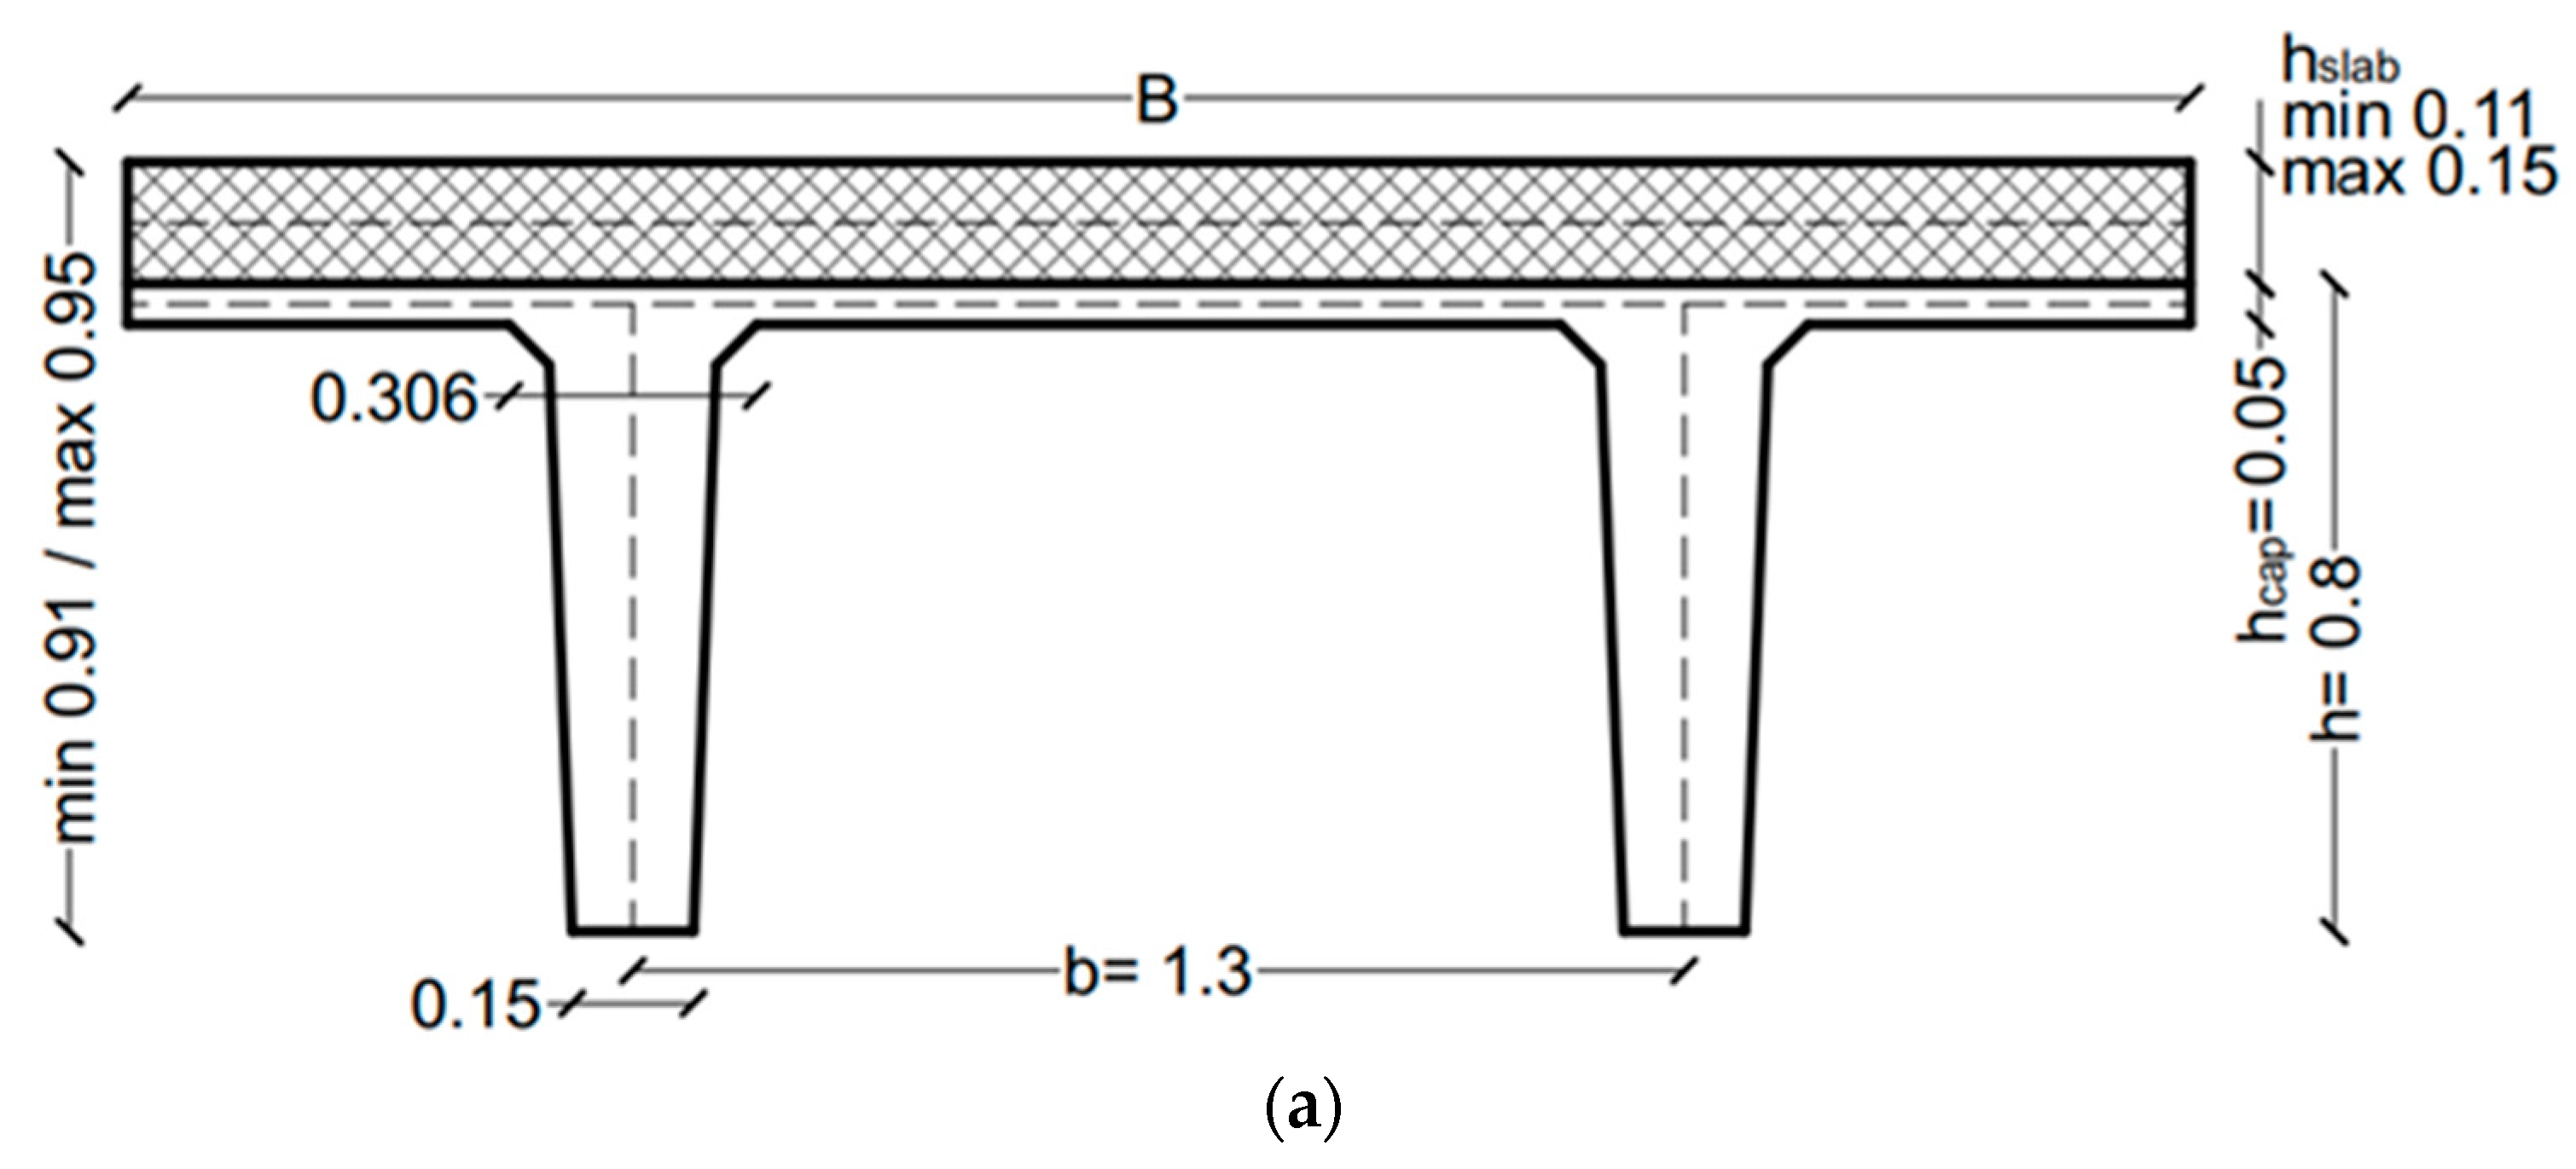
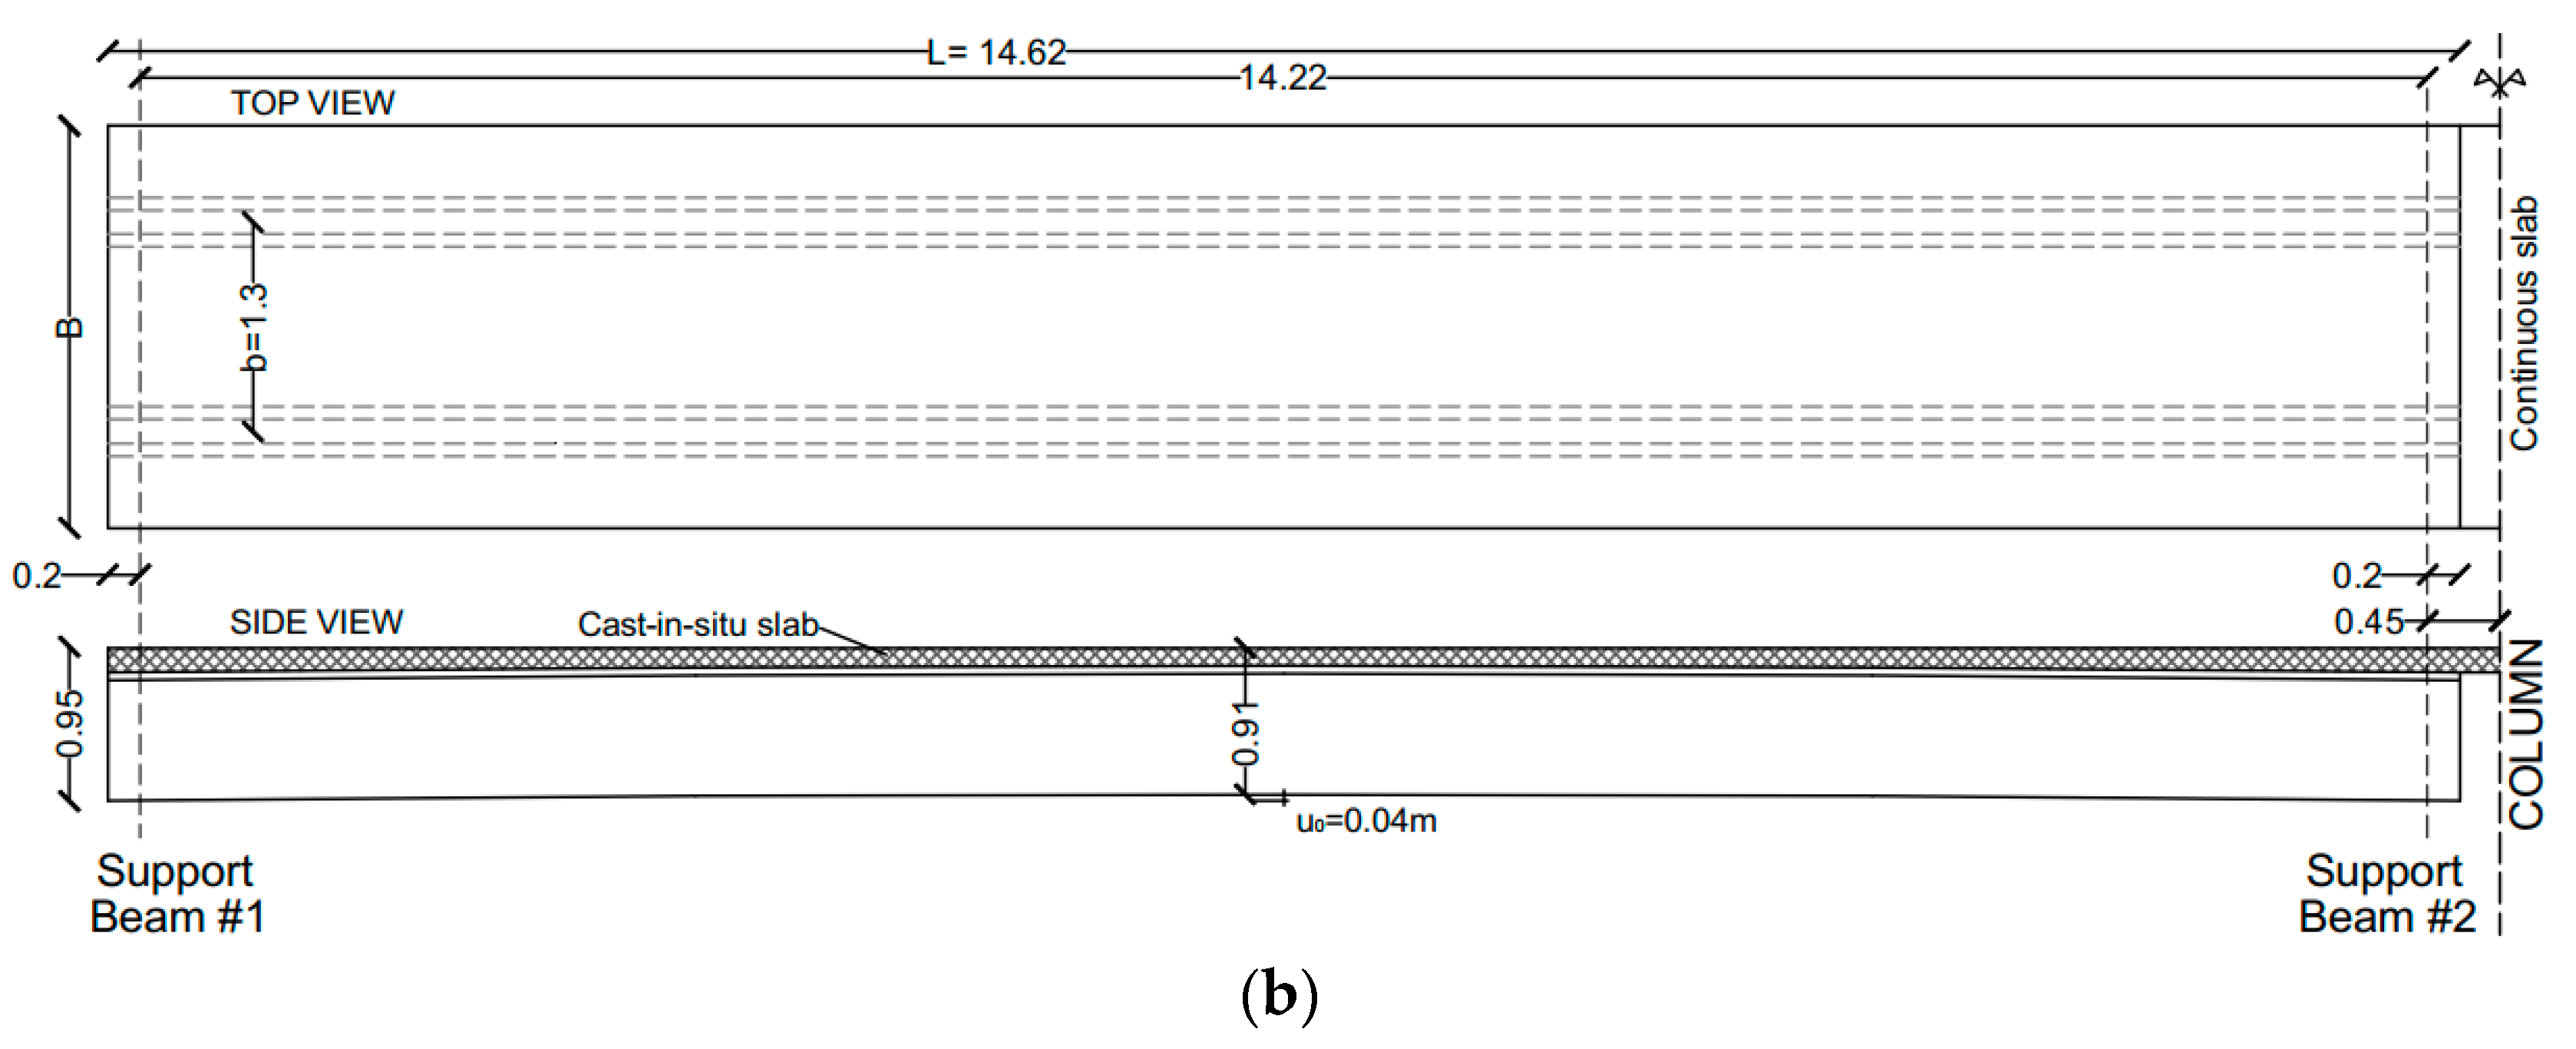
3.2. Inter-Story Floor
3.3. Materials
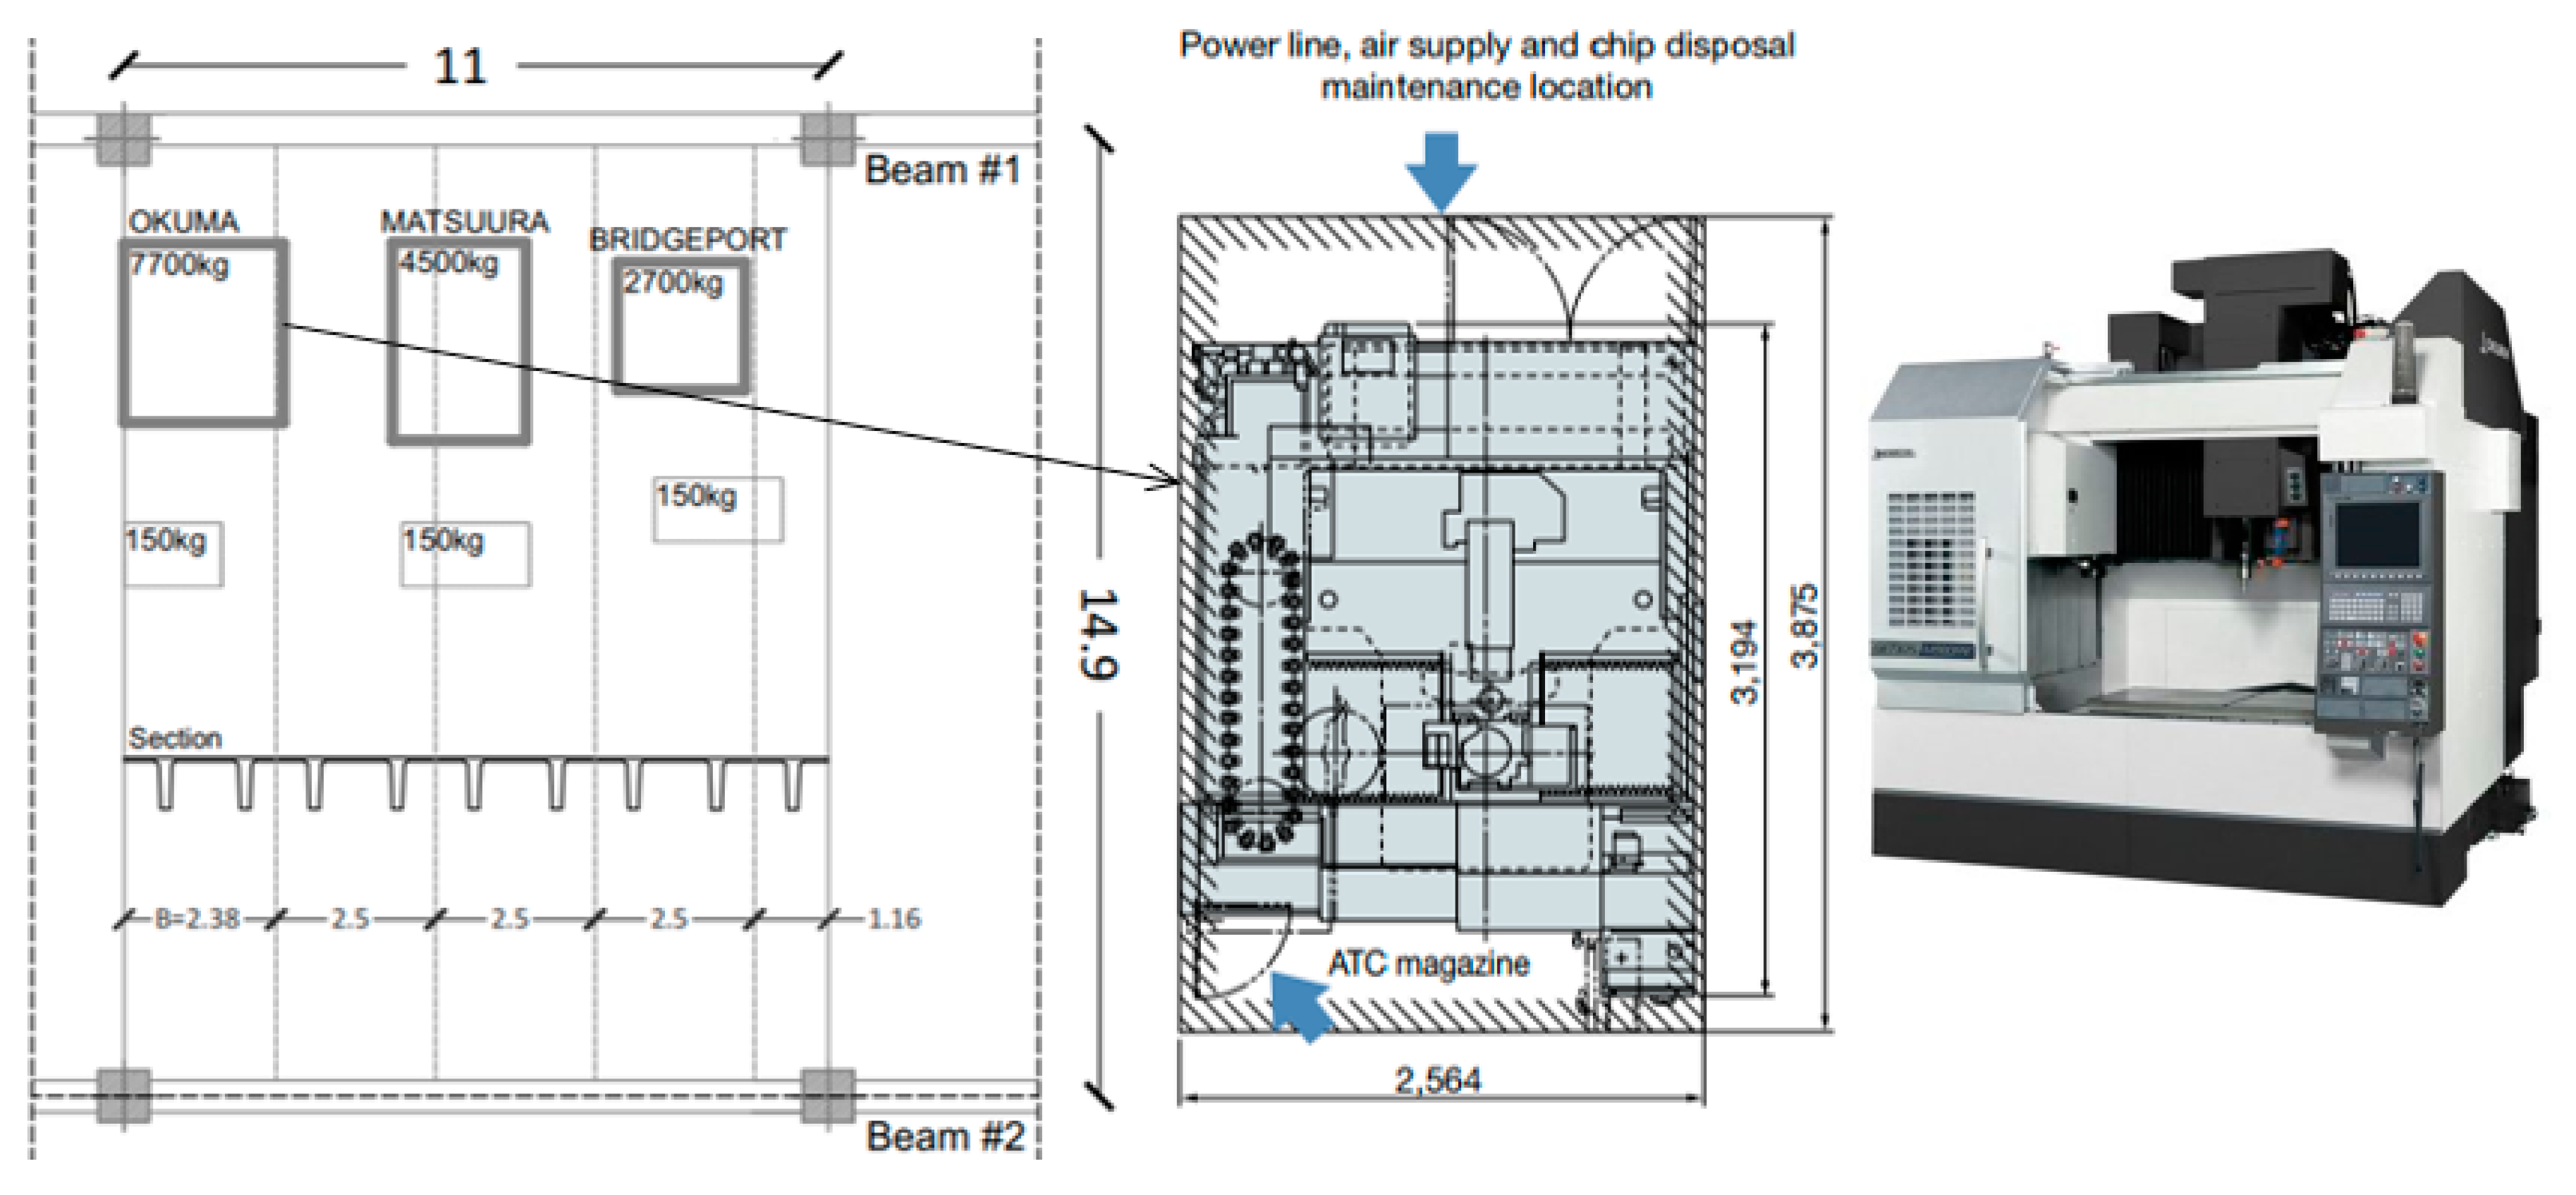
3.4. CNC Machines
4. Experimental Investigation
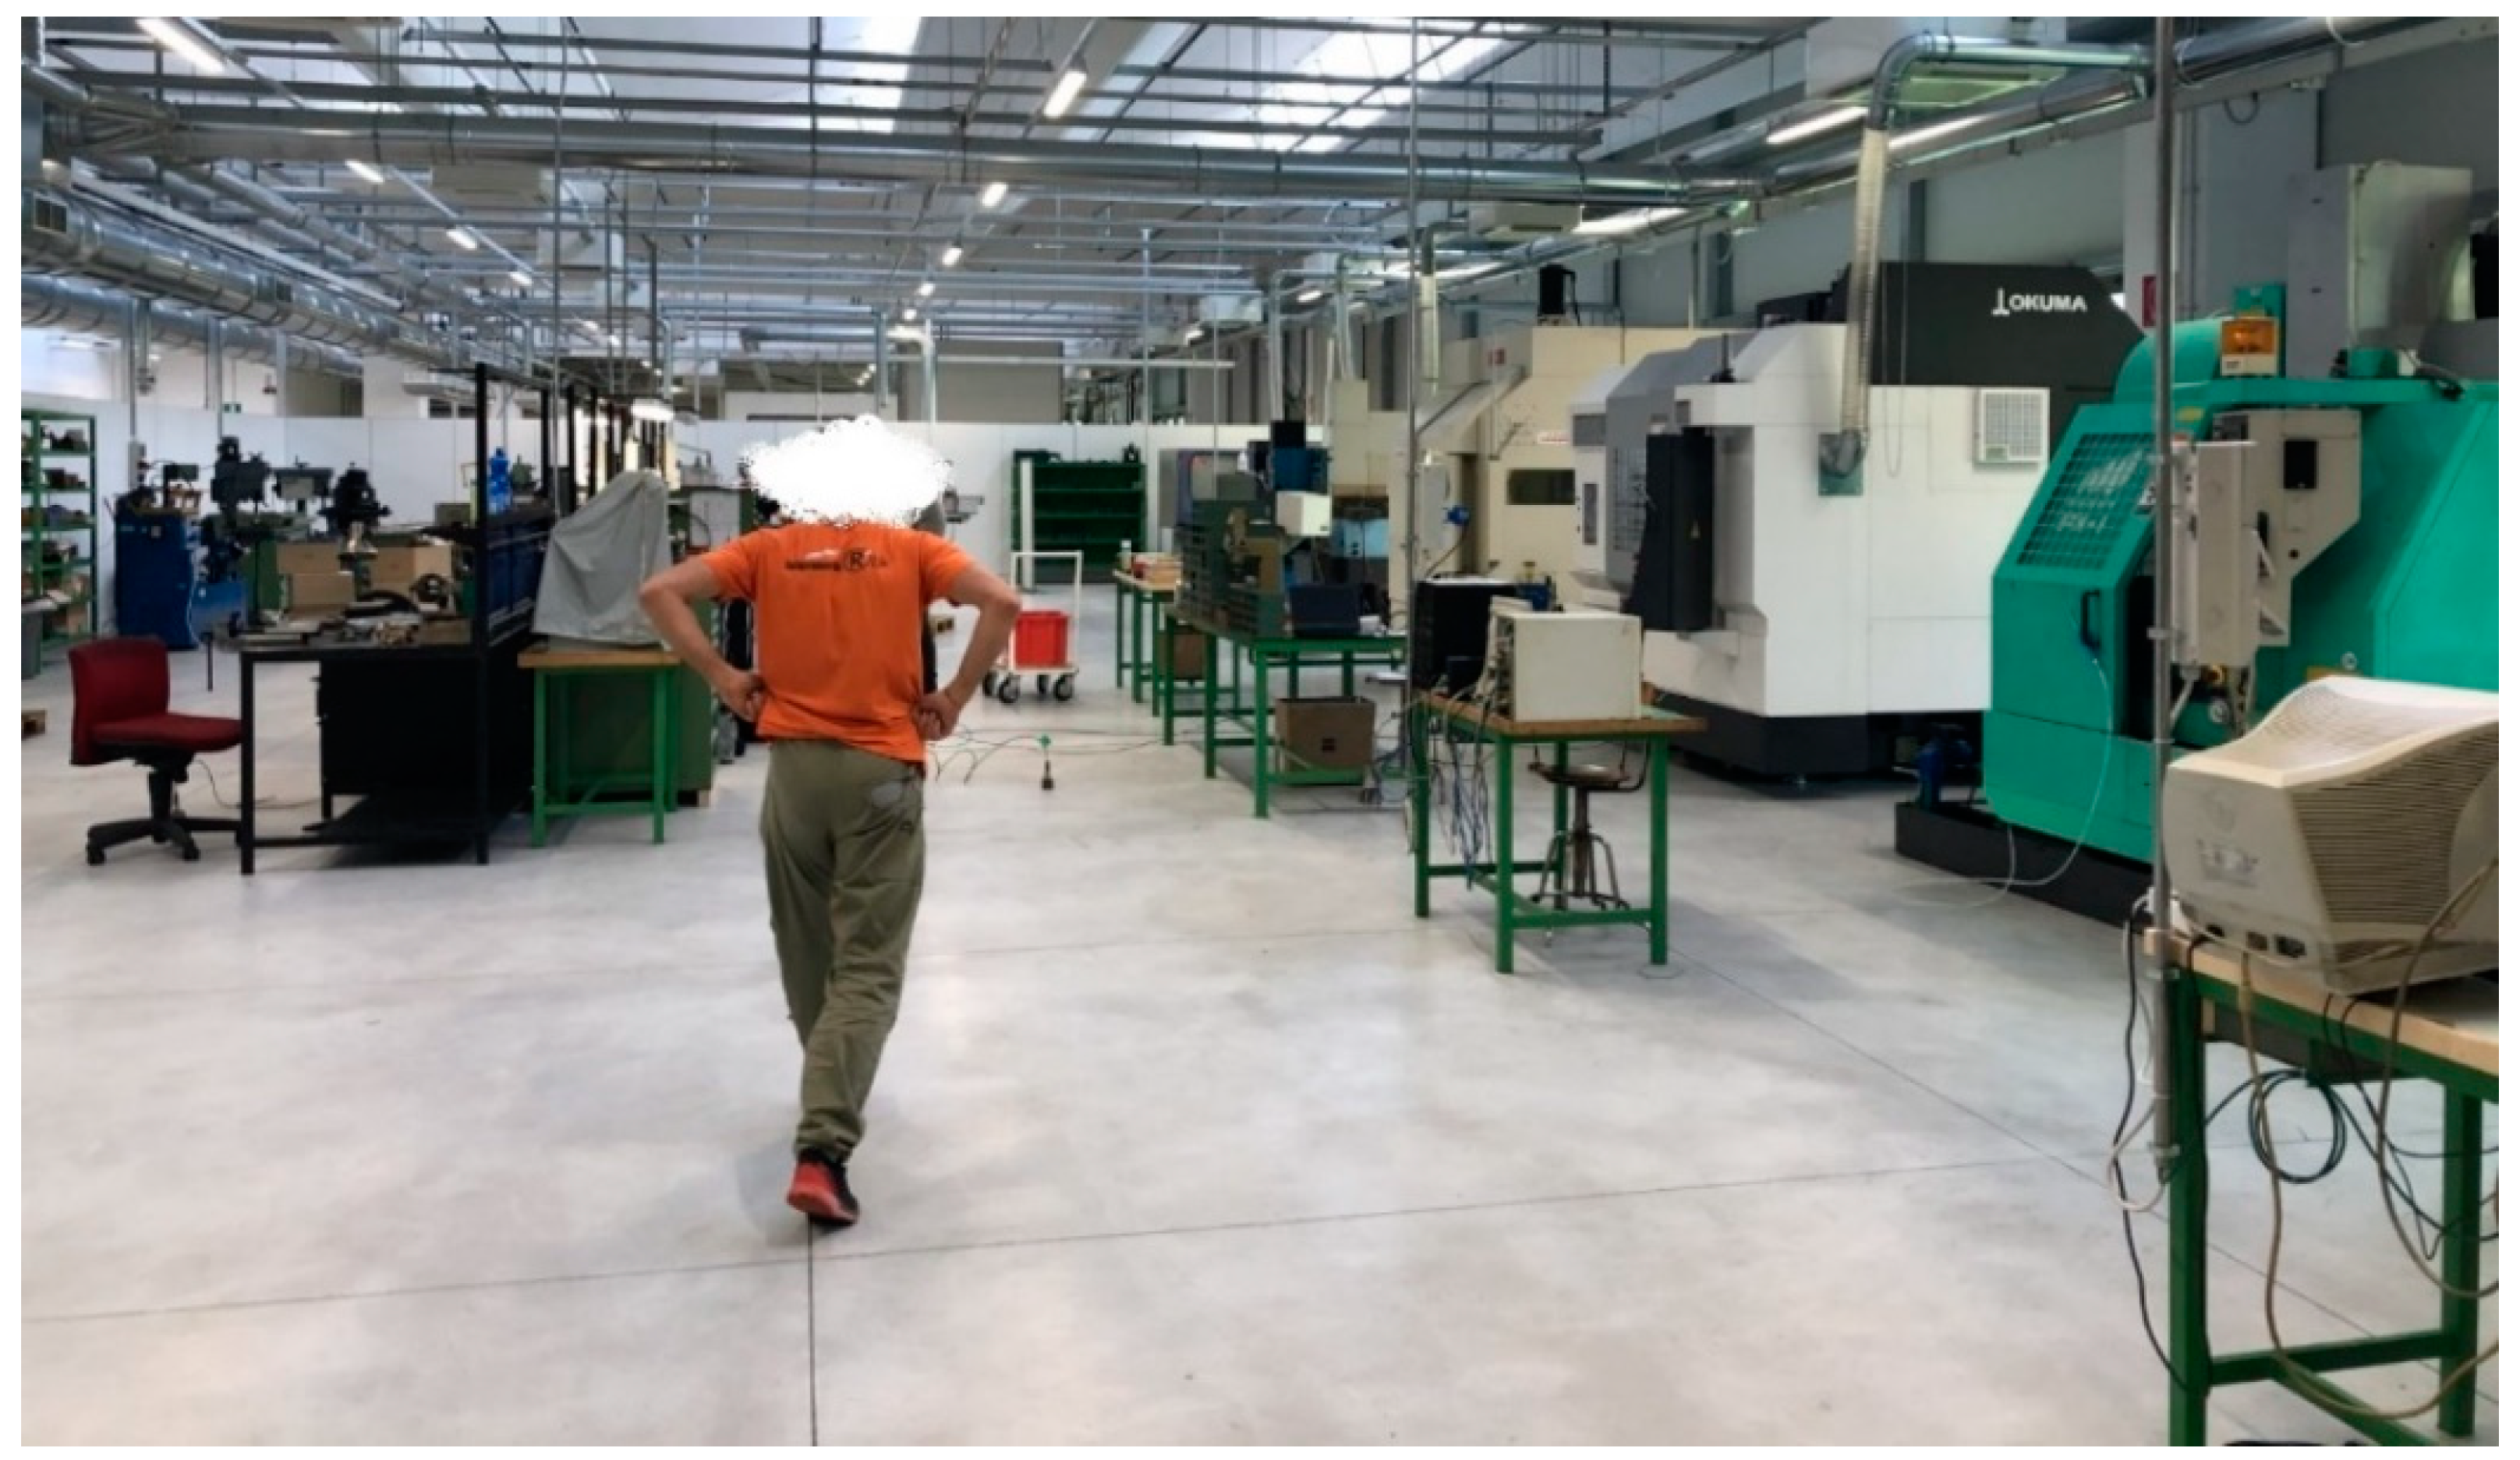
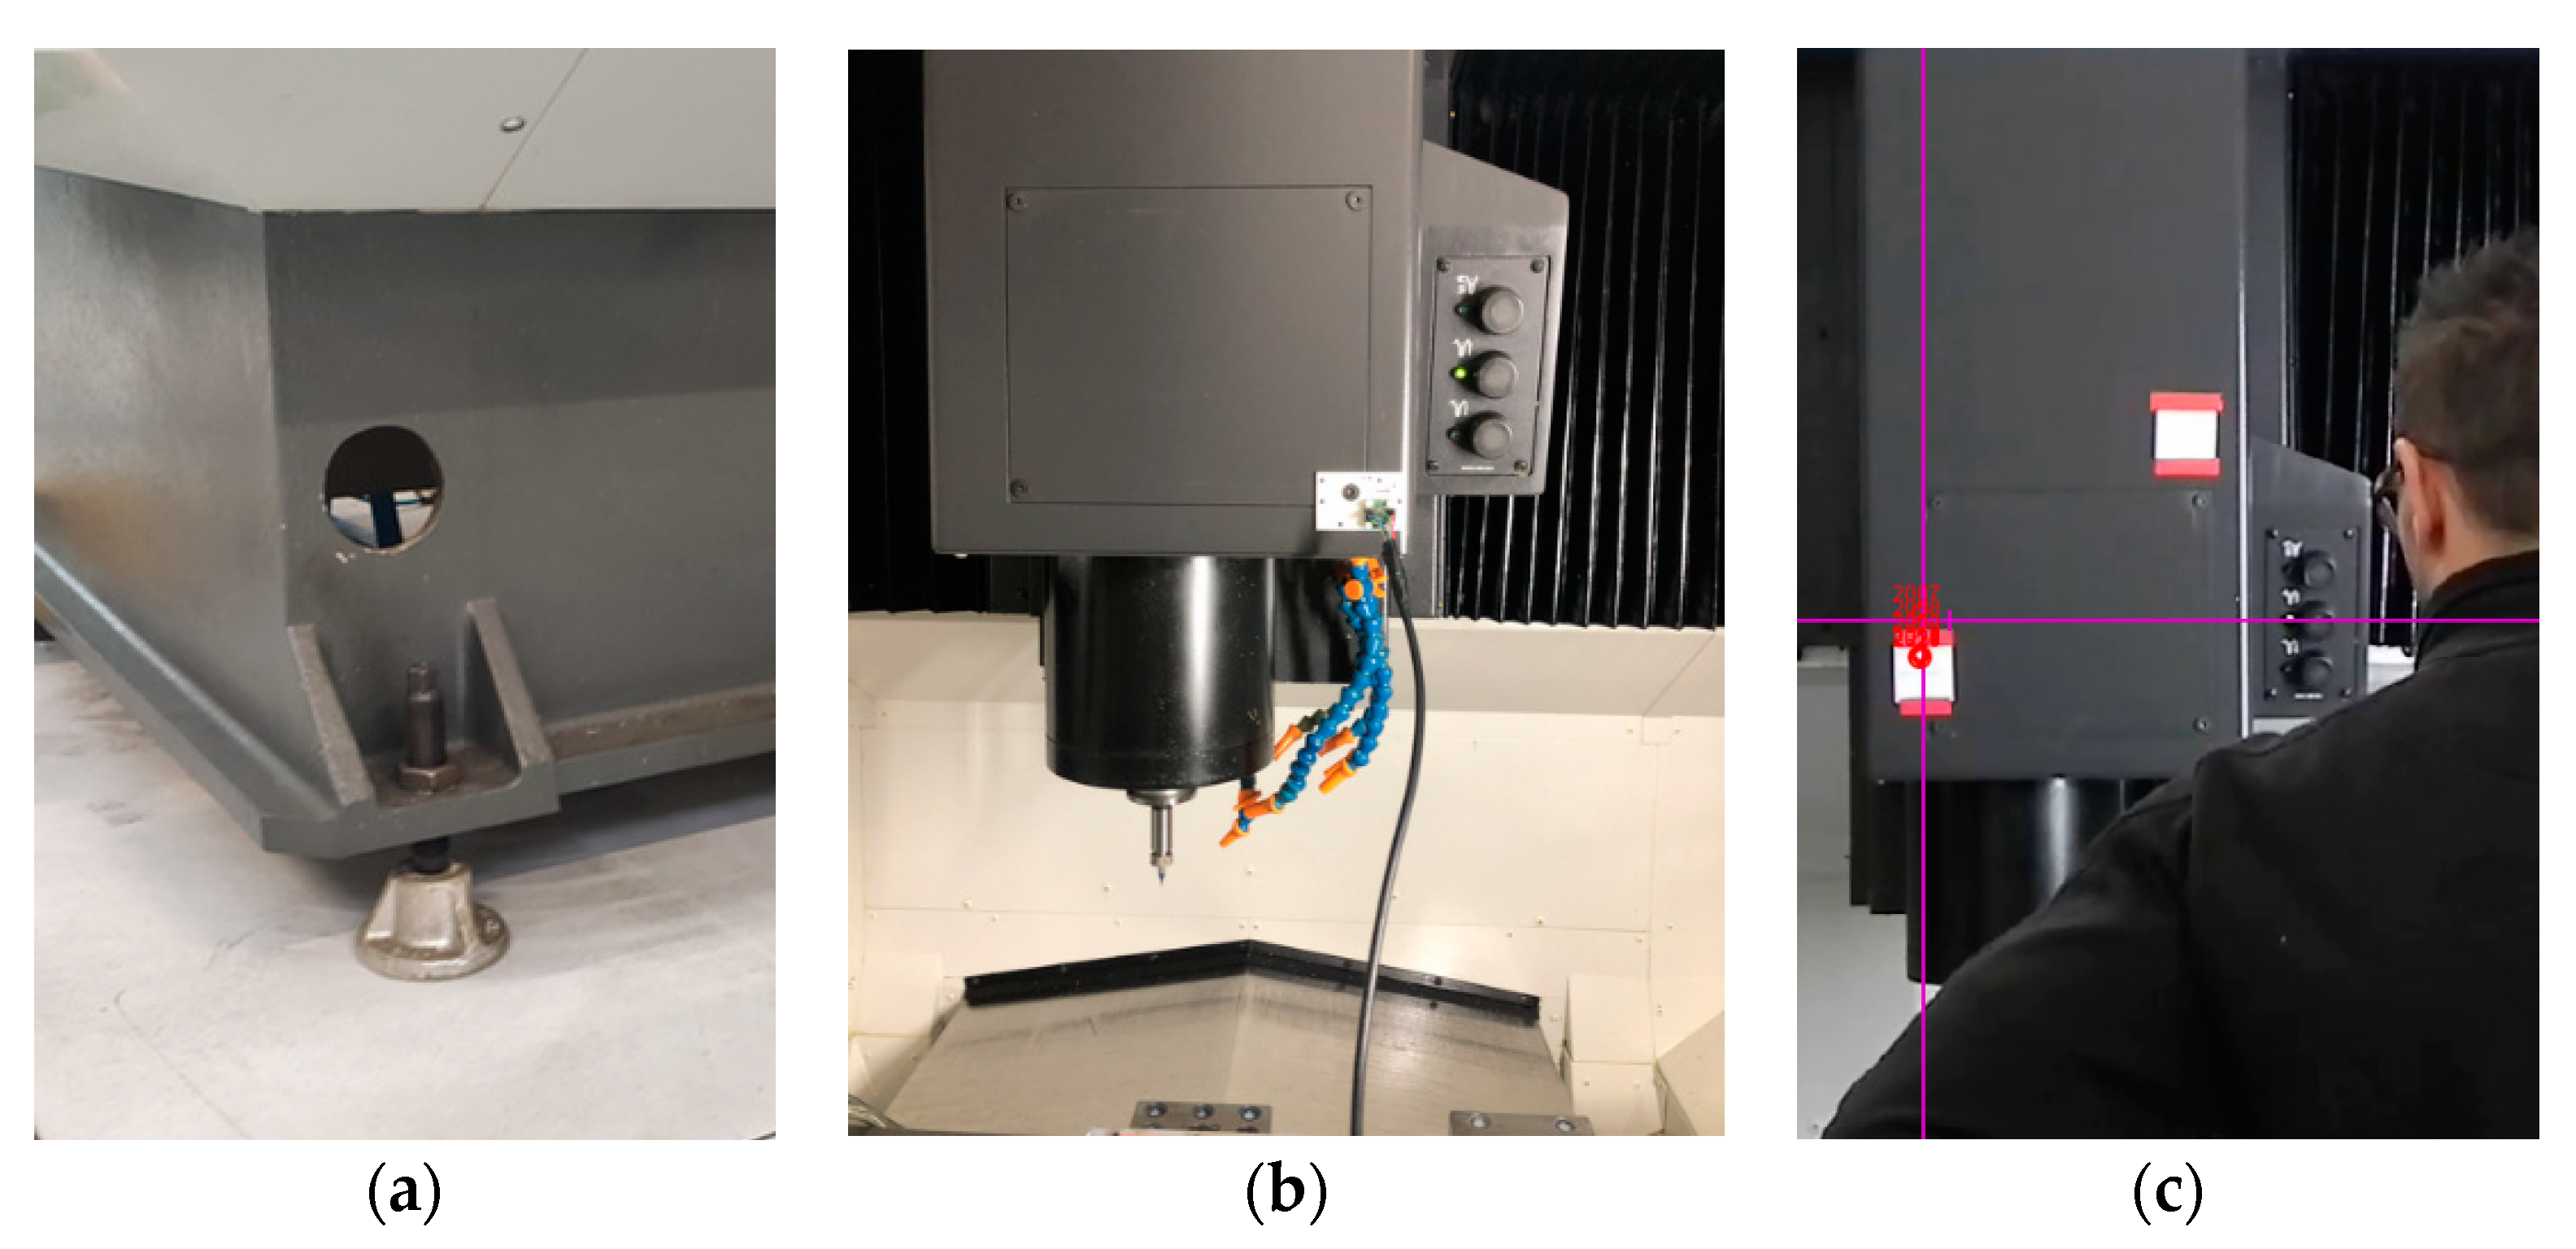
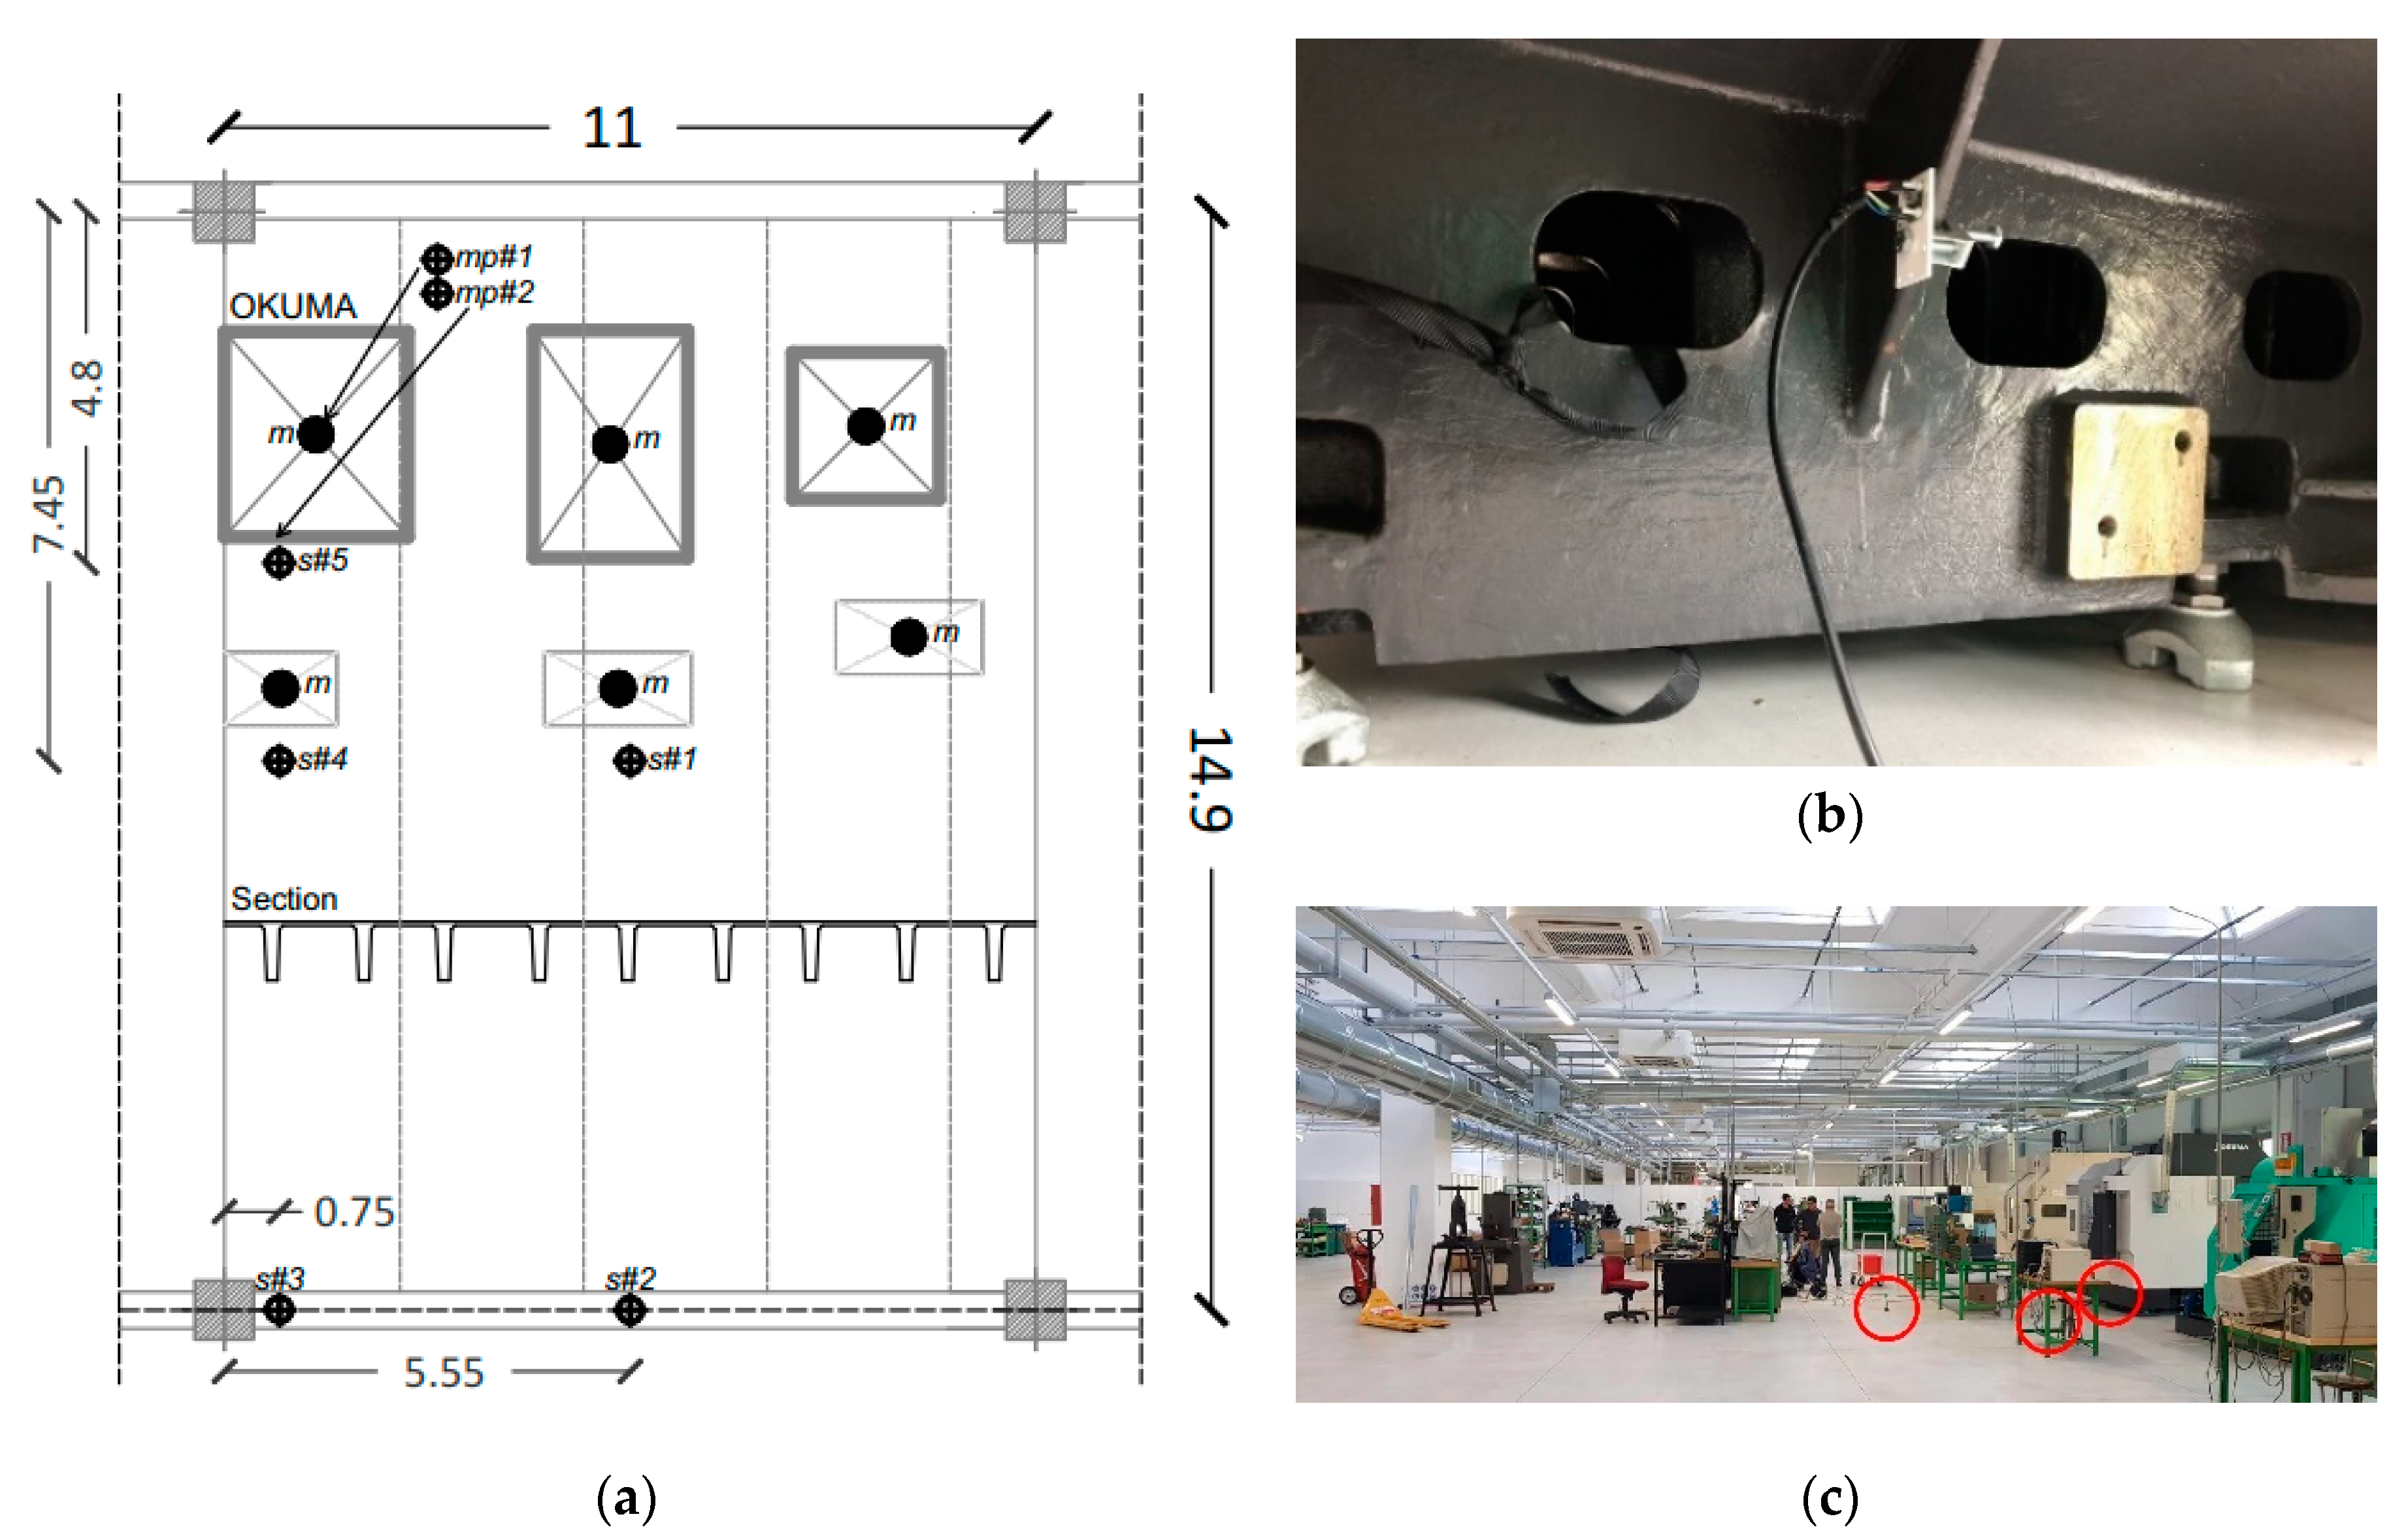
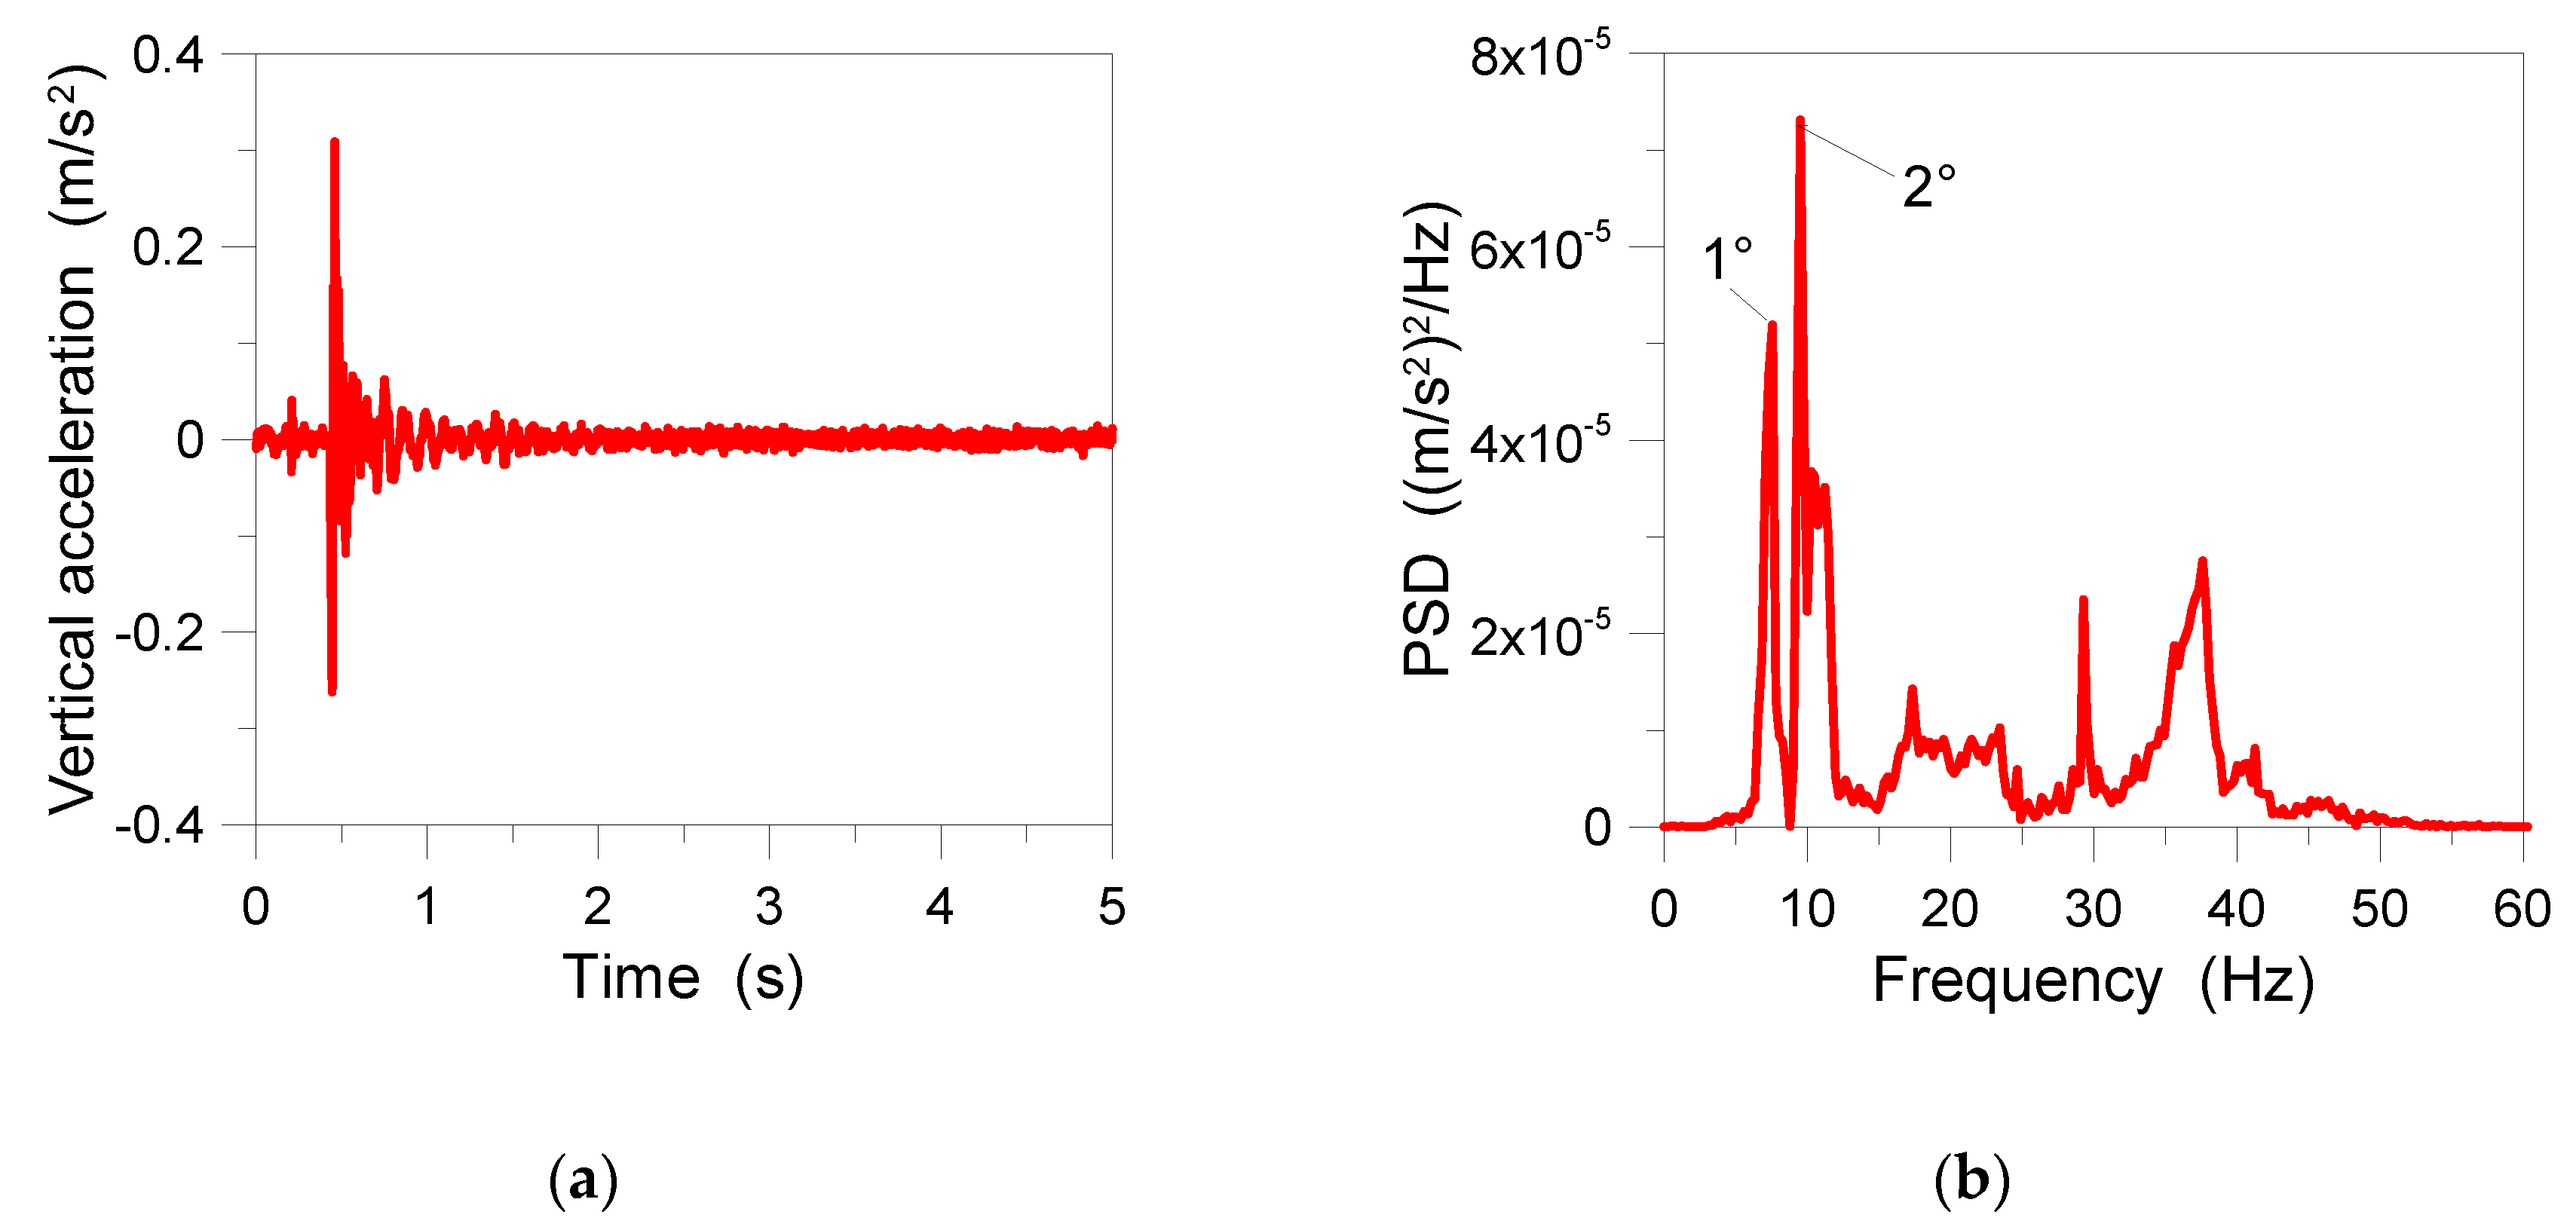
4.1. OKUMA Machinery Center
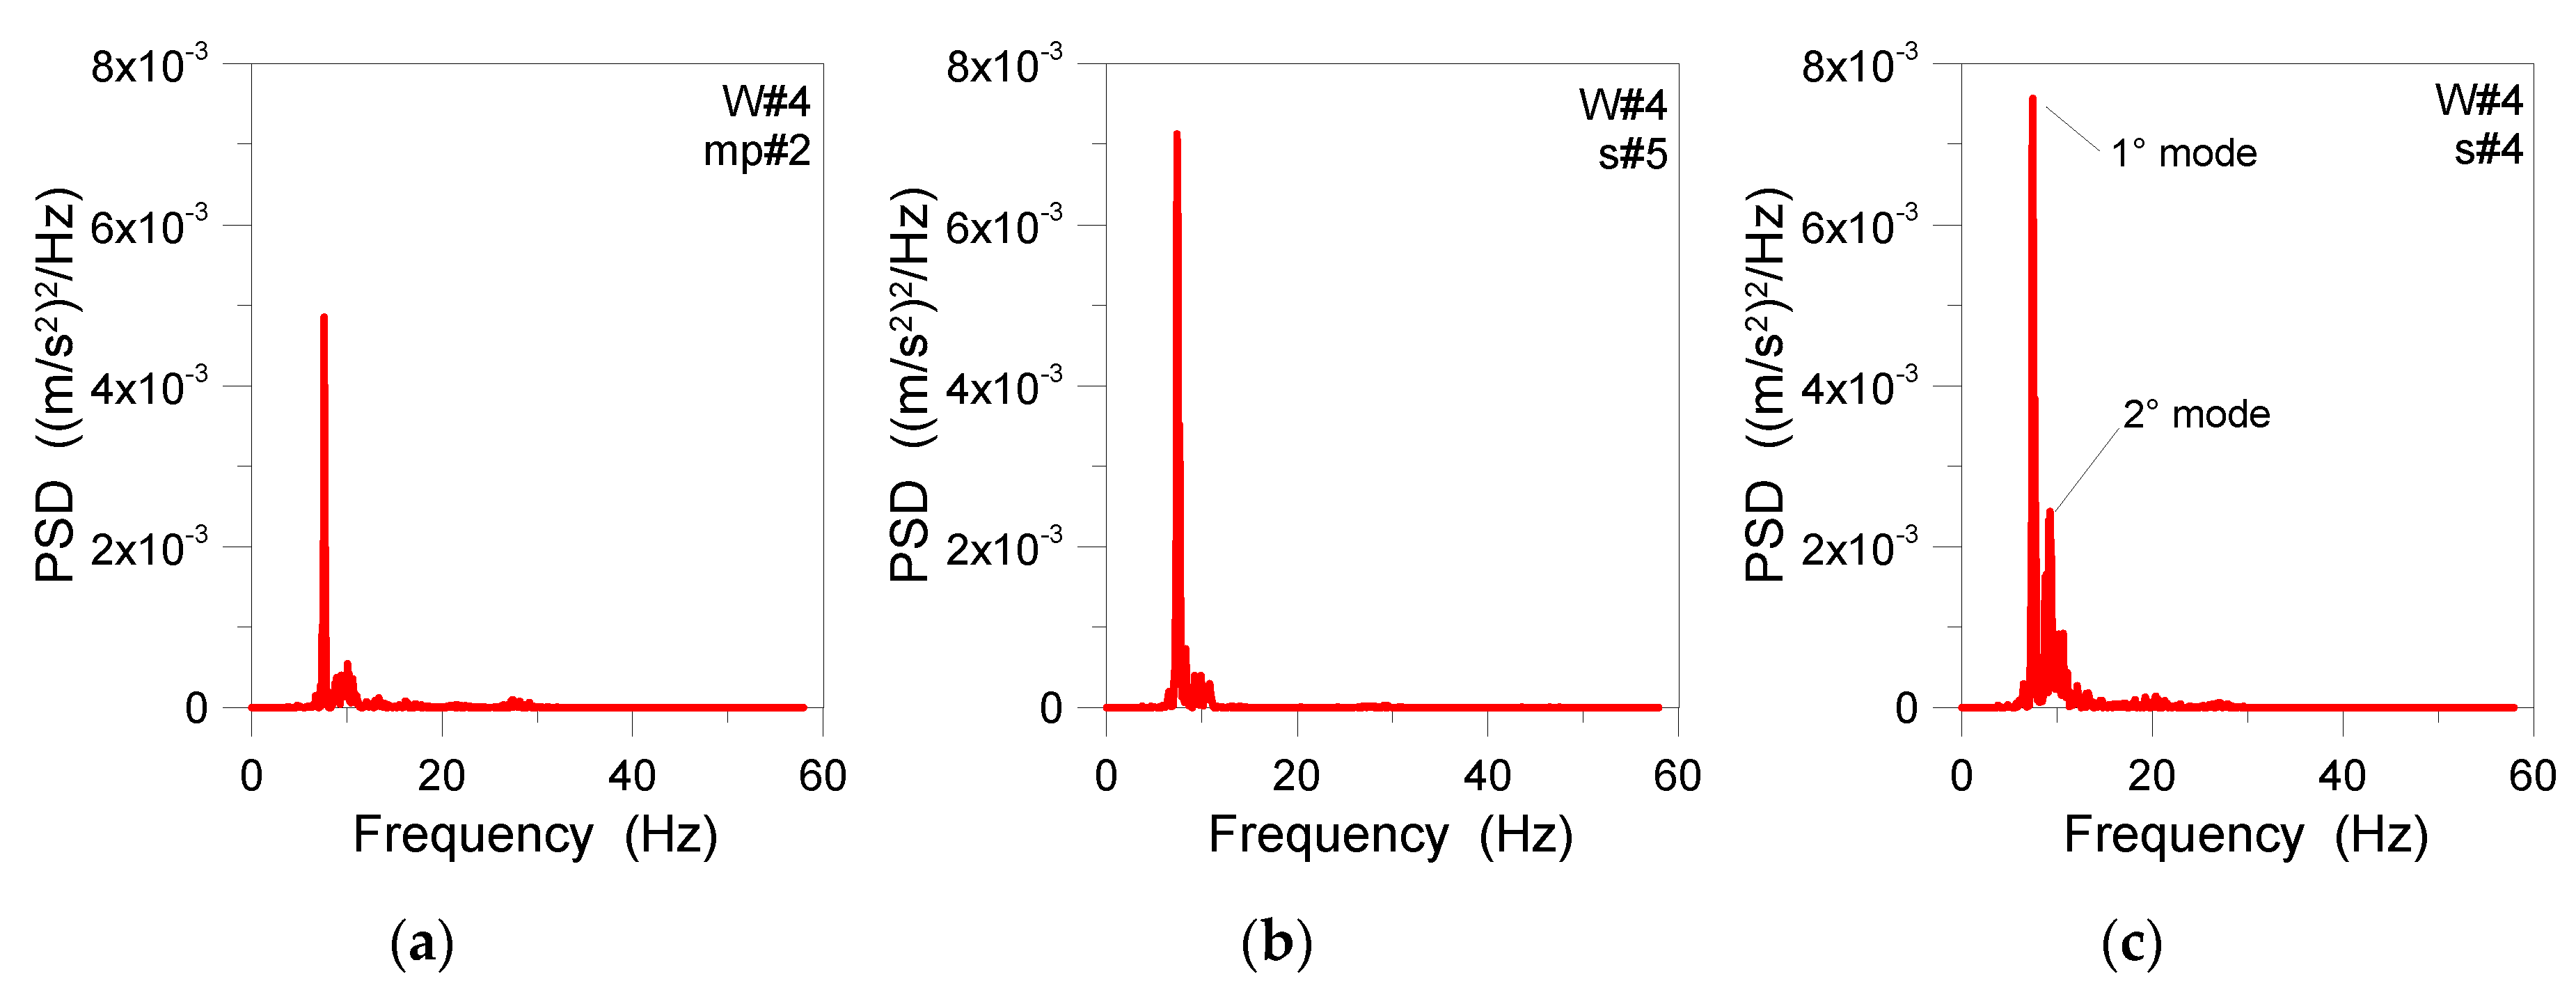
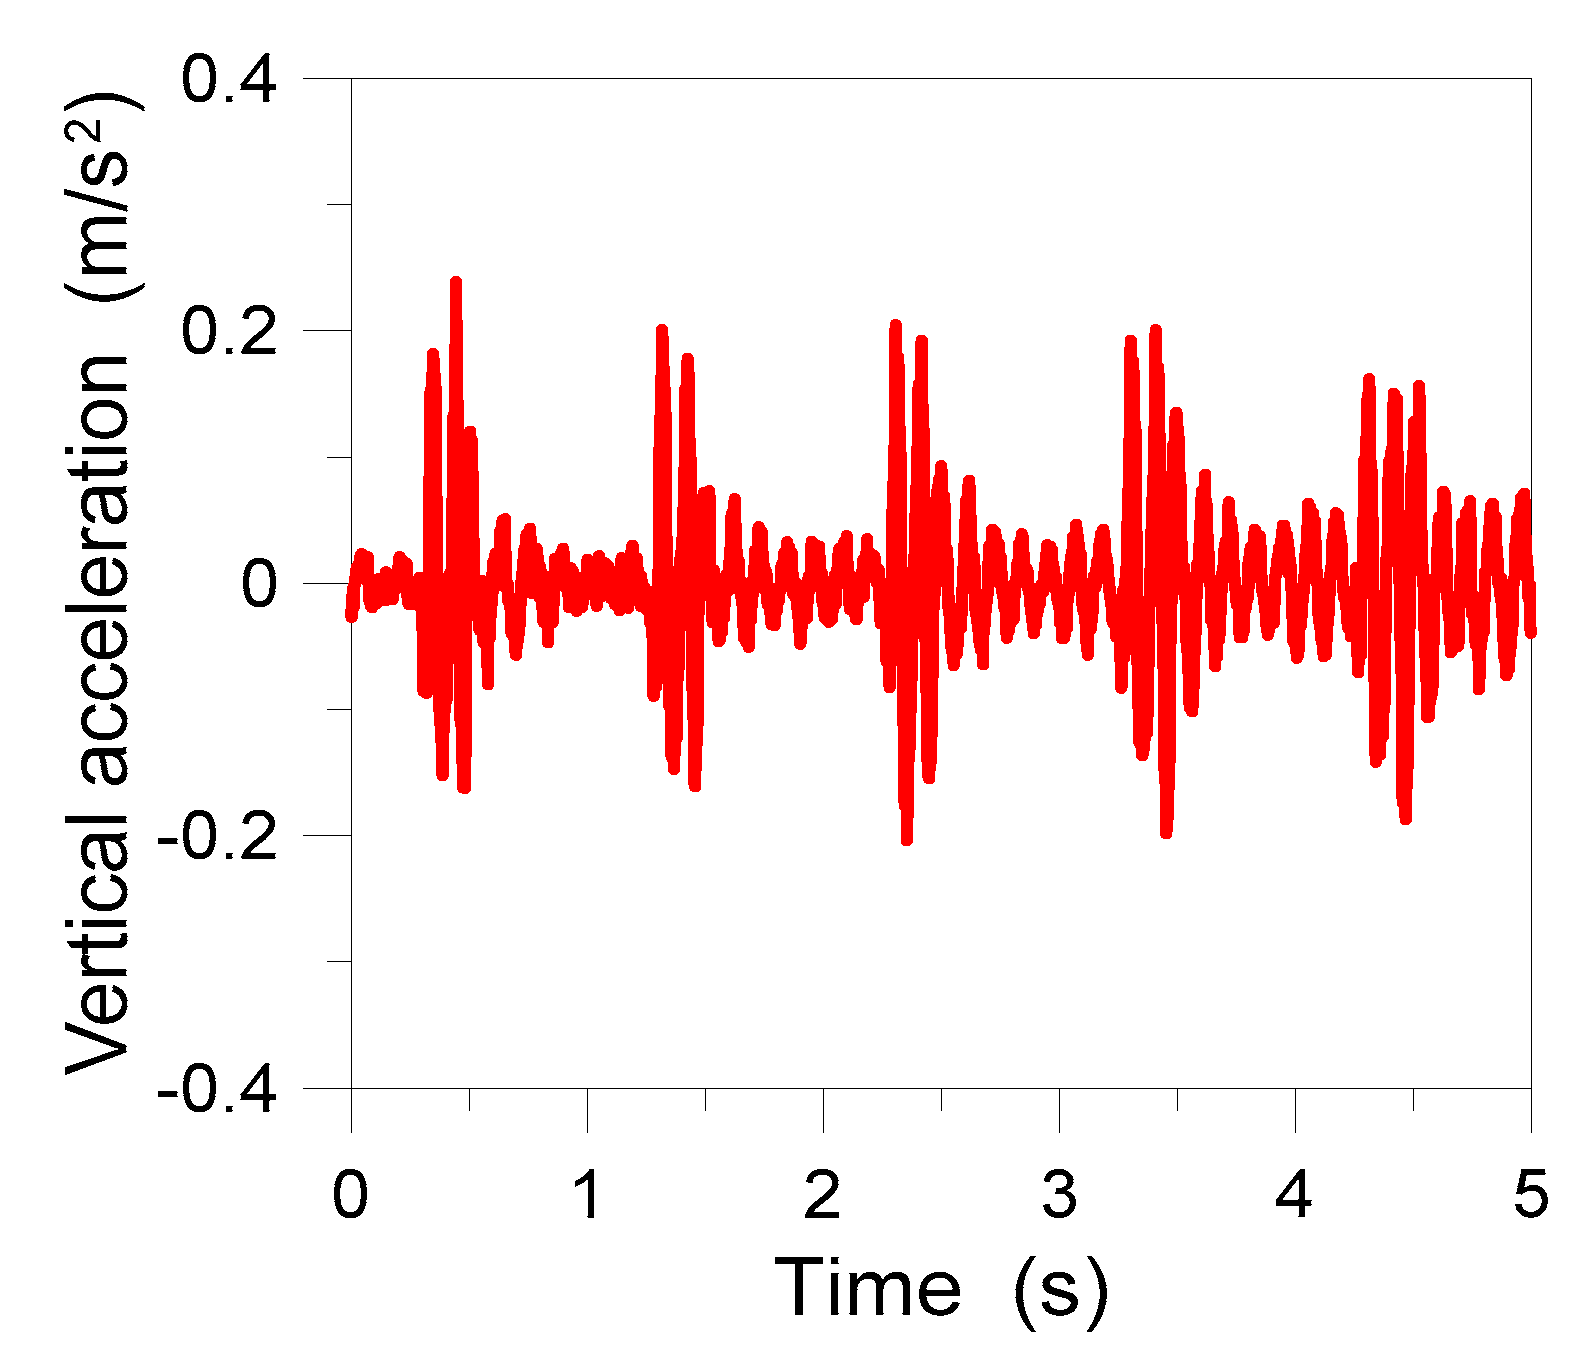
4.2. Analysis of the Inter-Story Floor
4.3. Damping
5. Numerical Analysis
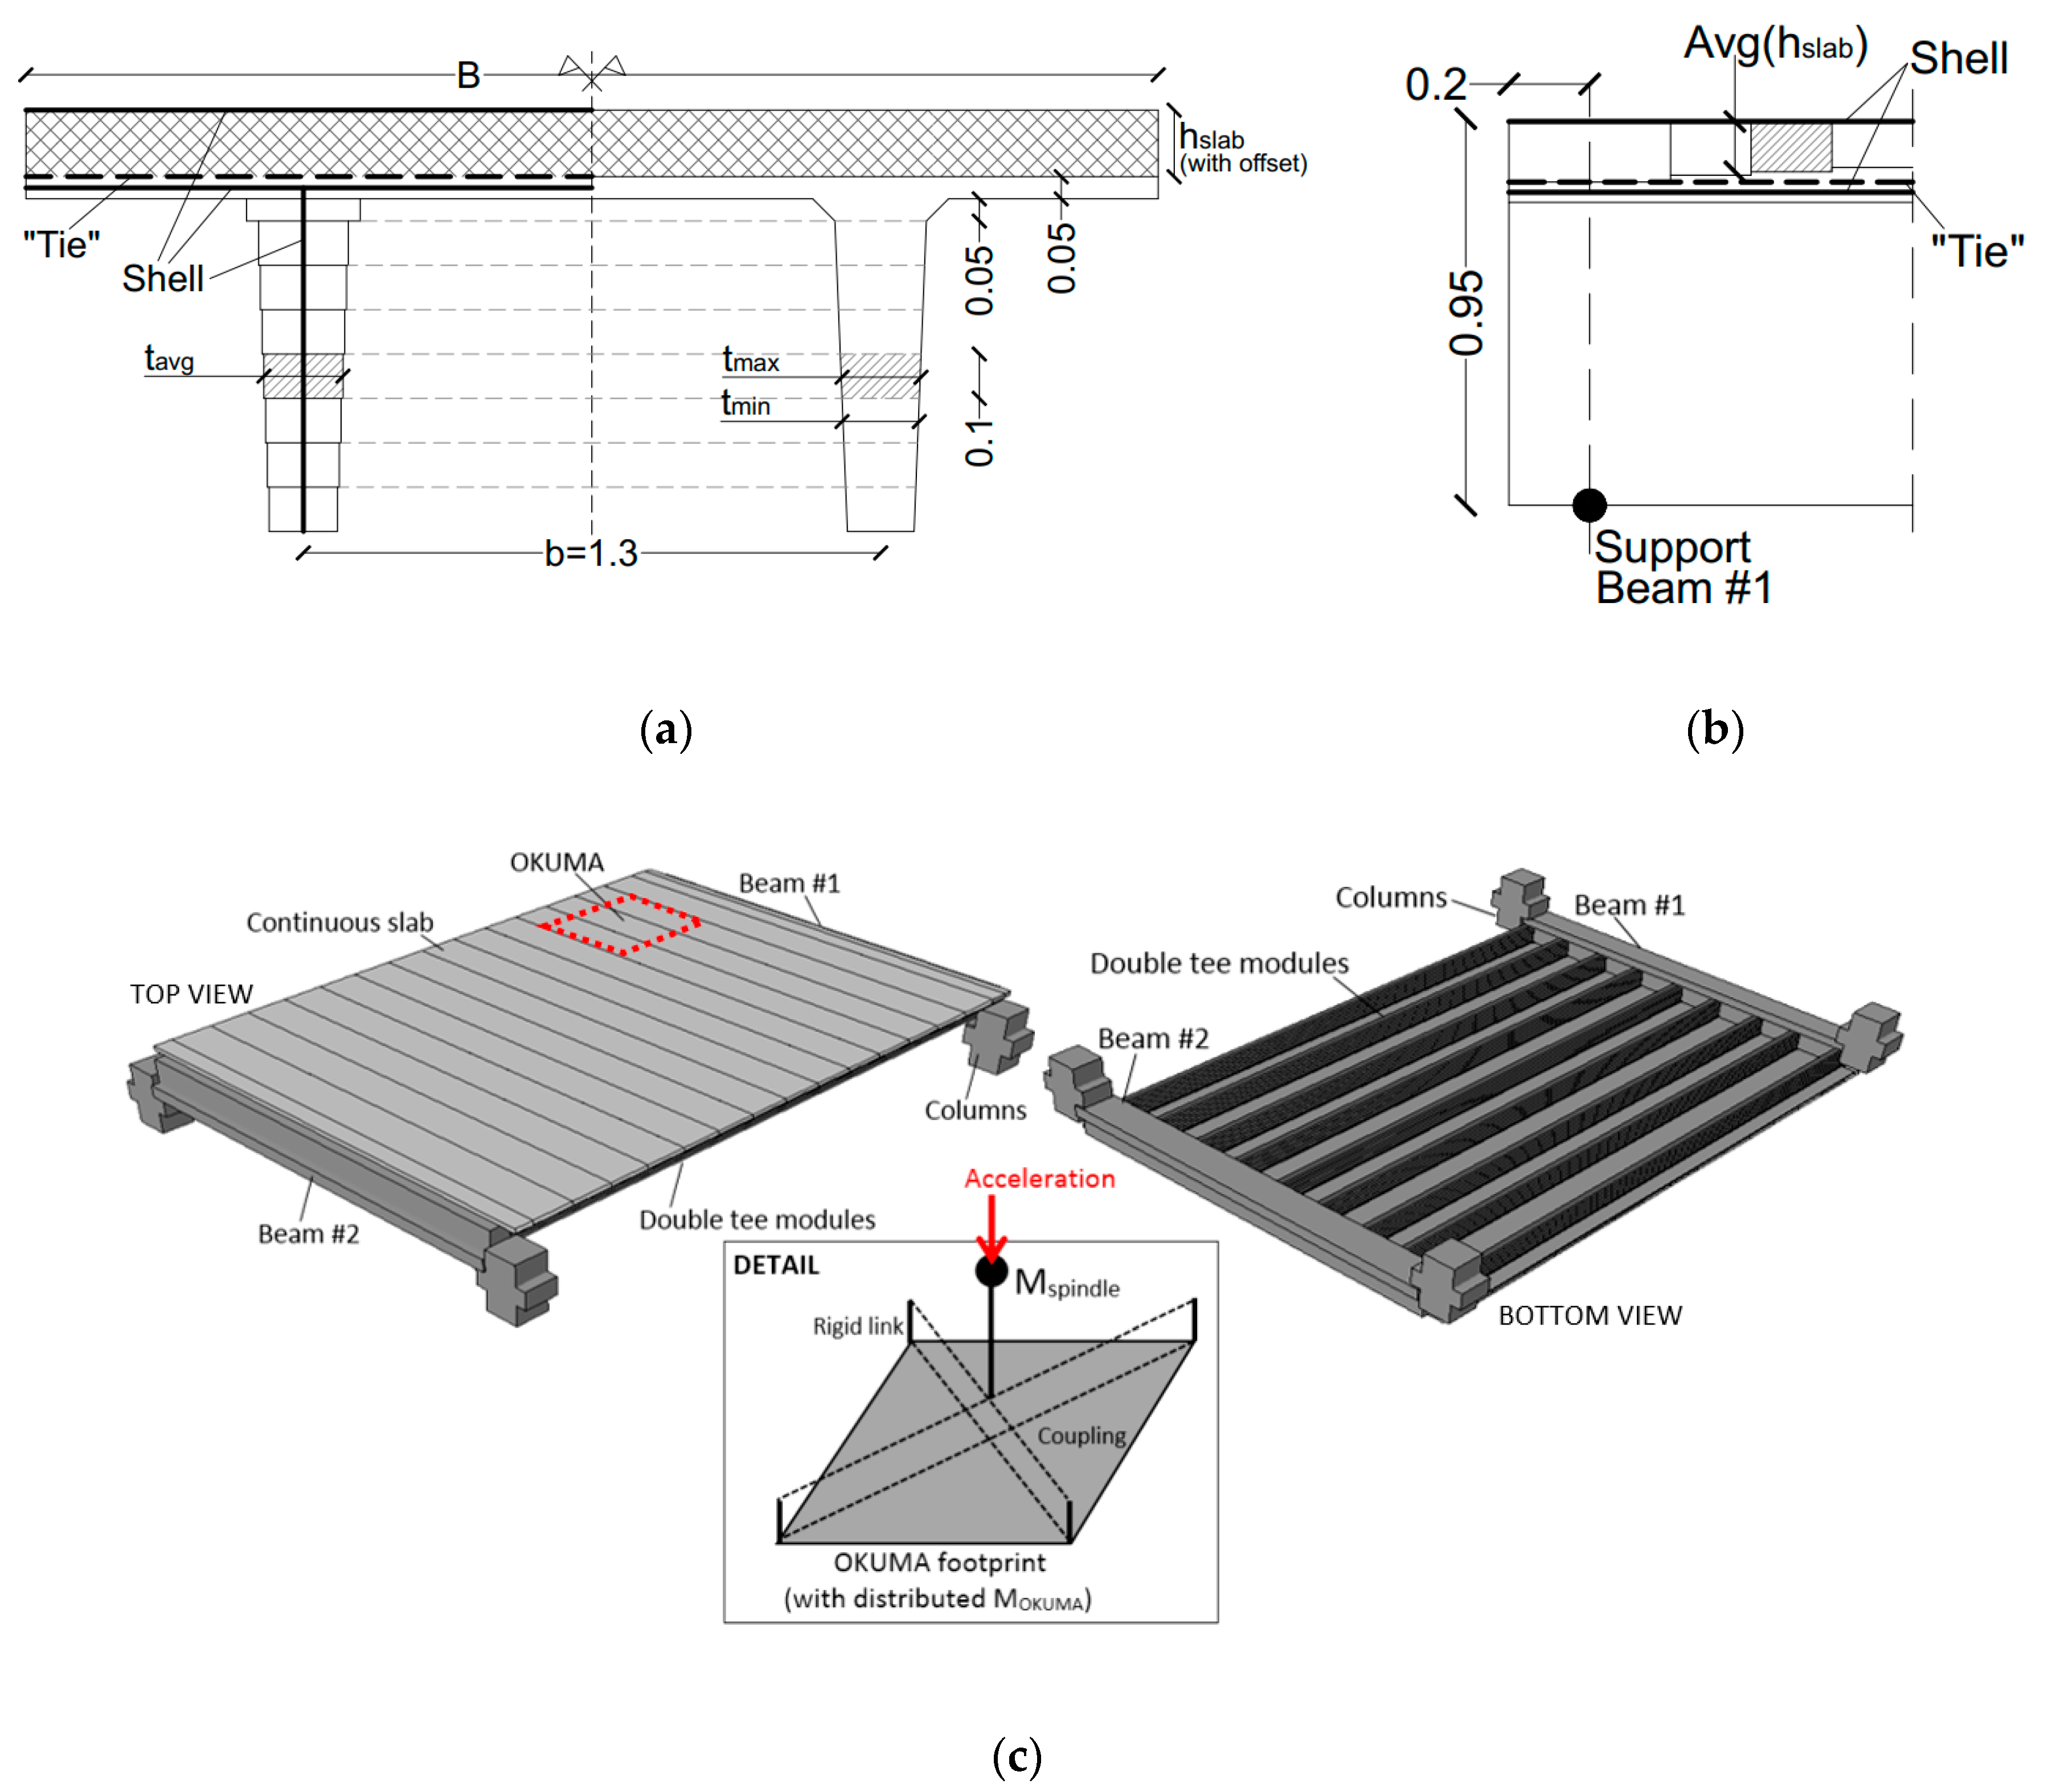
5.1. Description of Floor and Machines
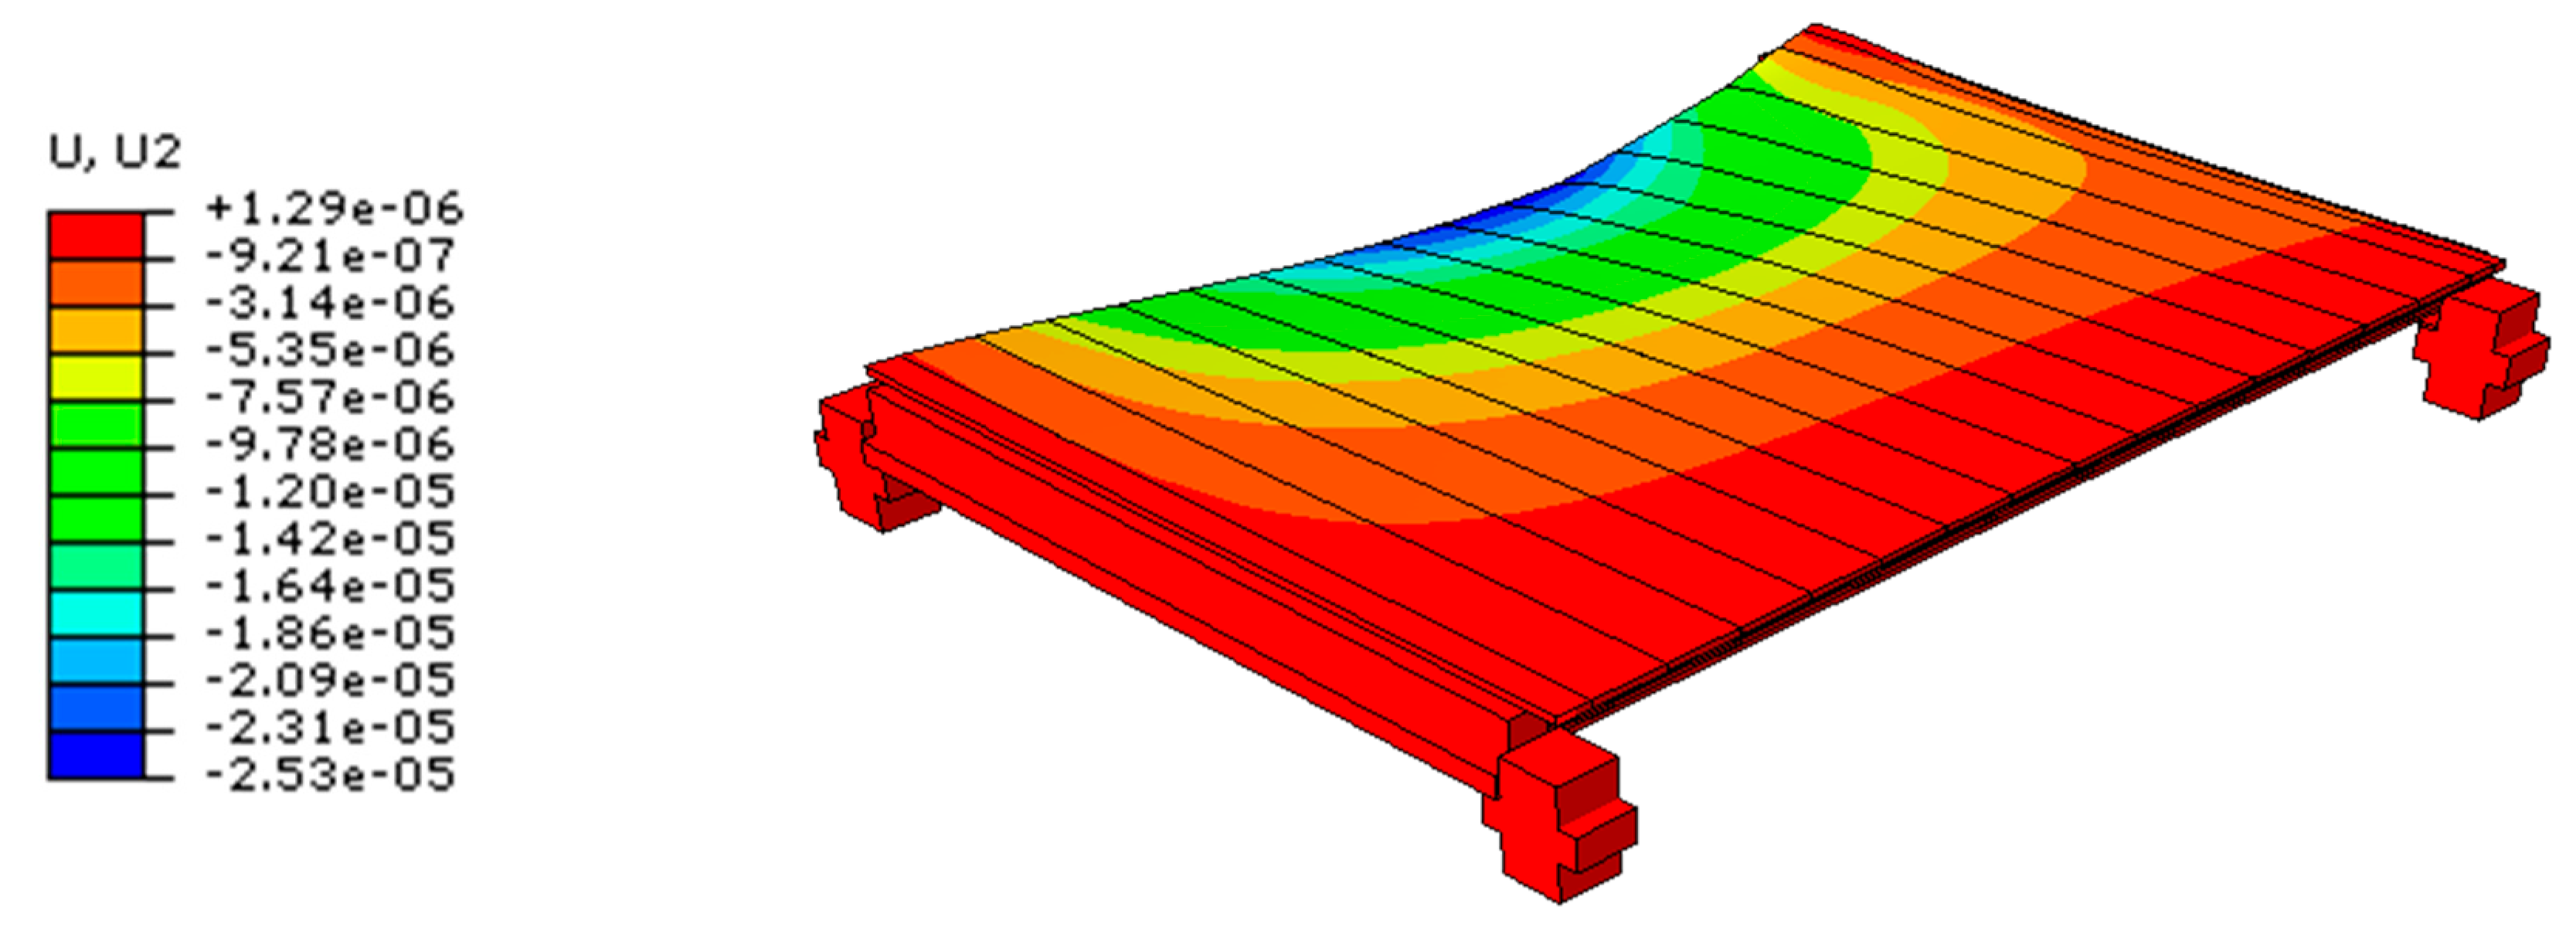
5.2. Static Analysis
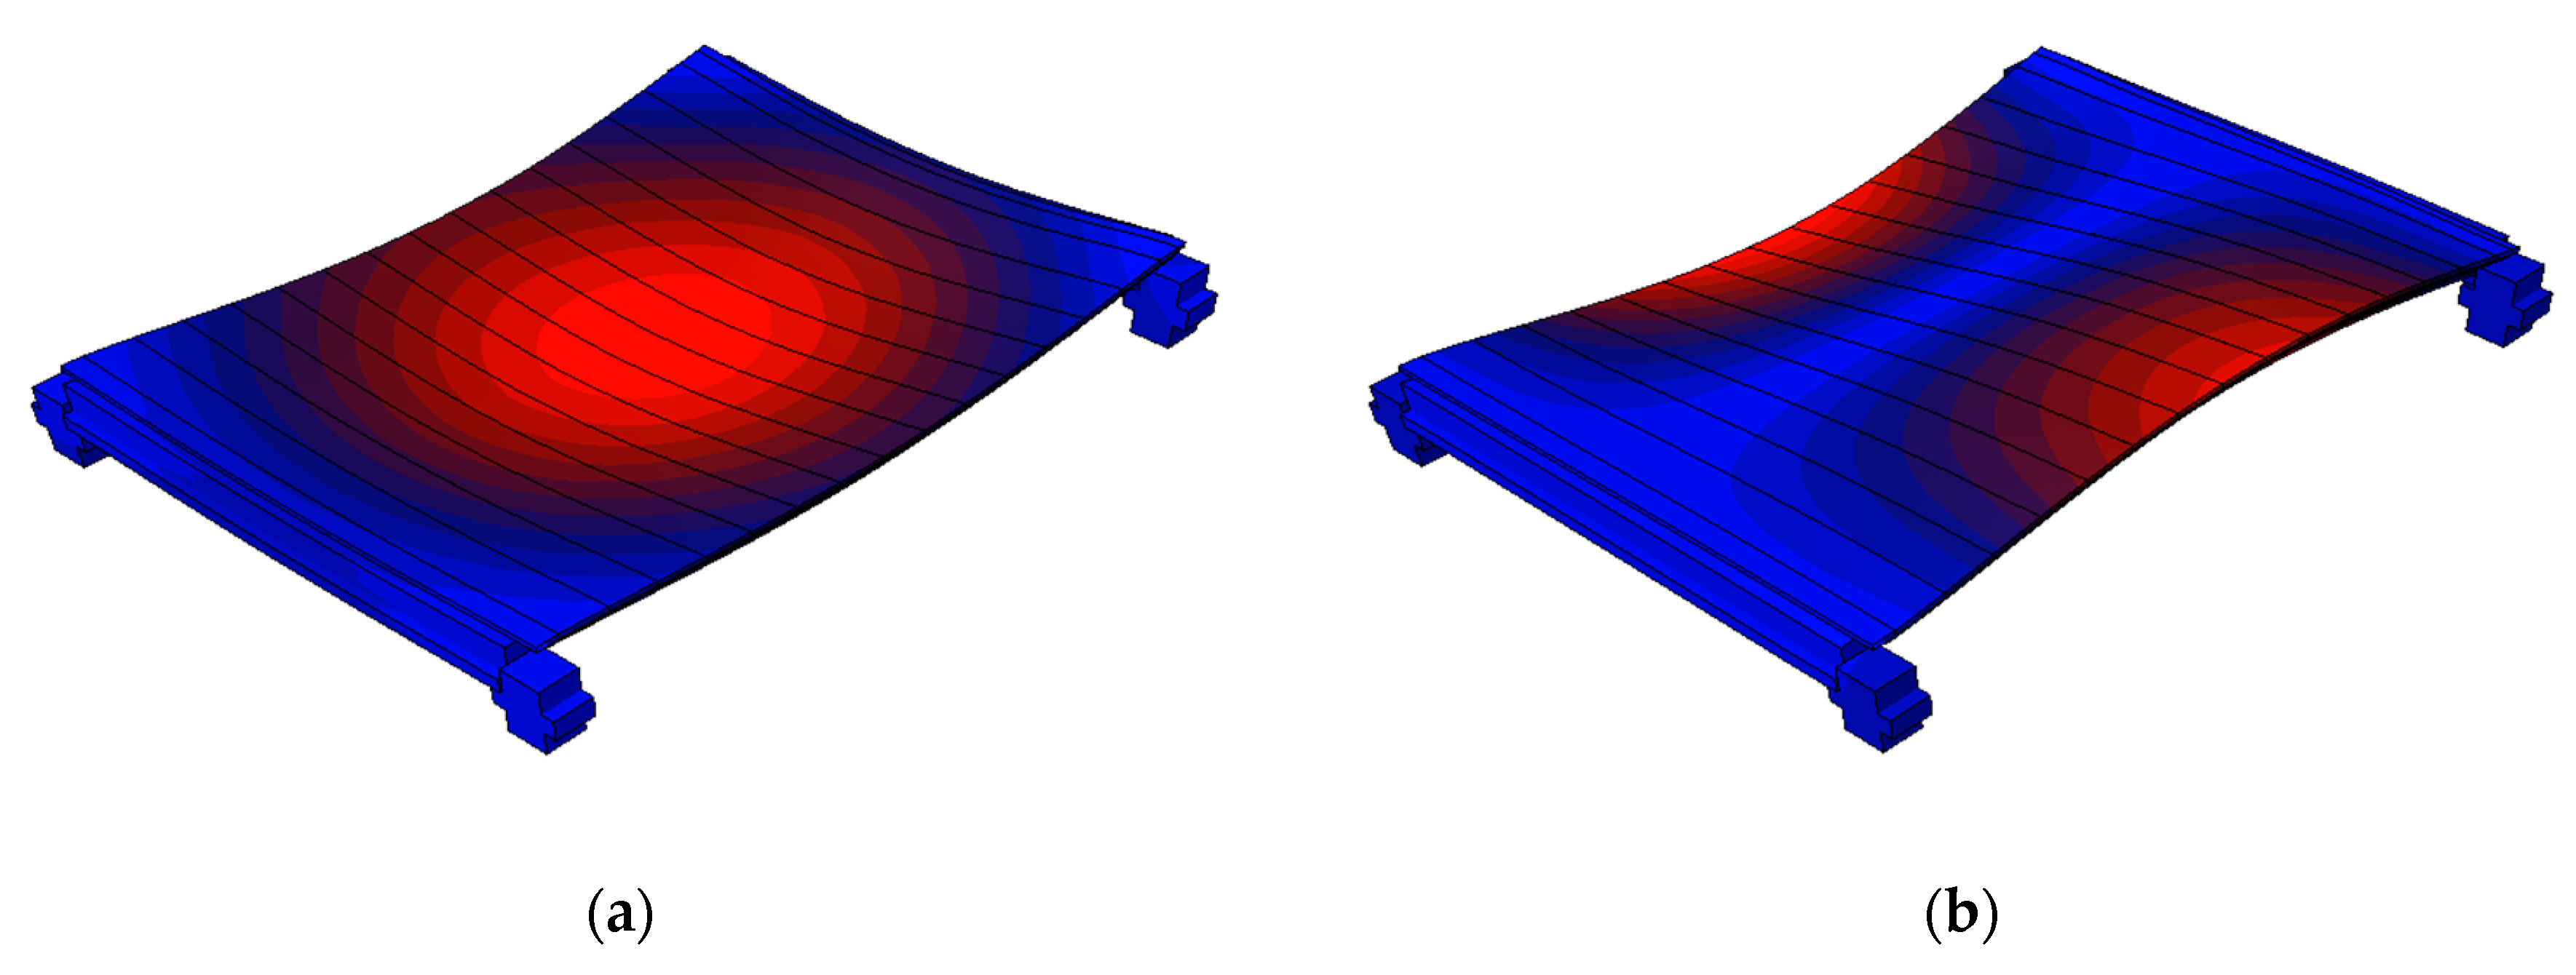
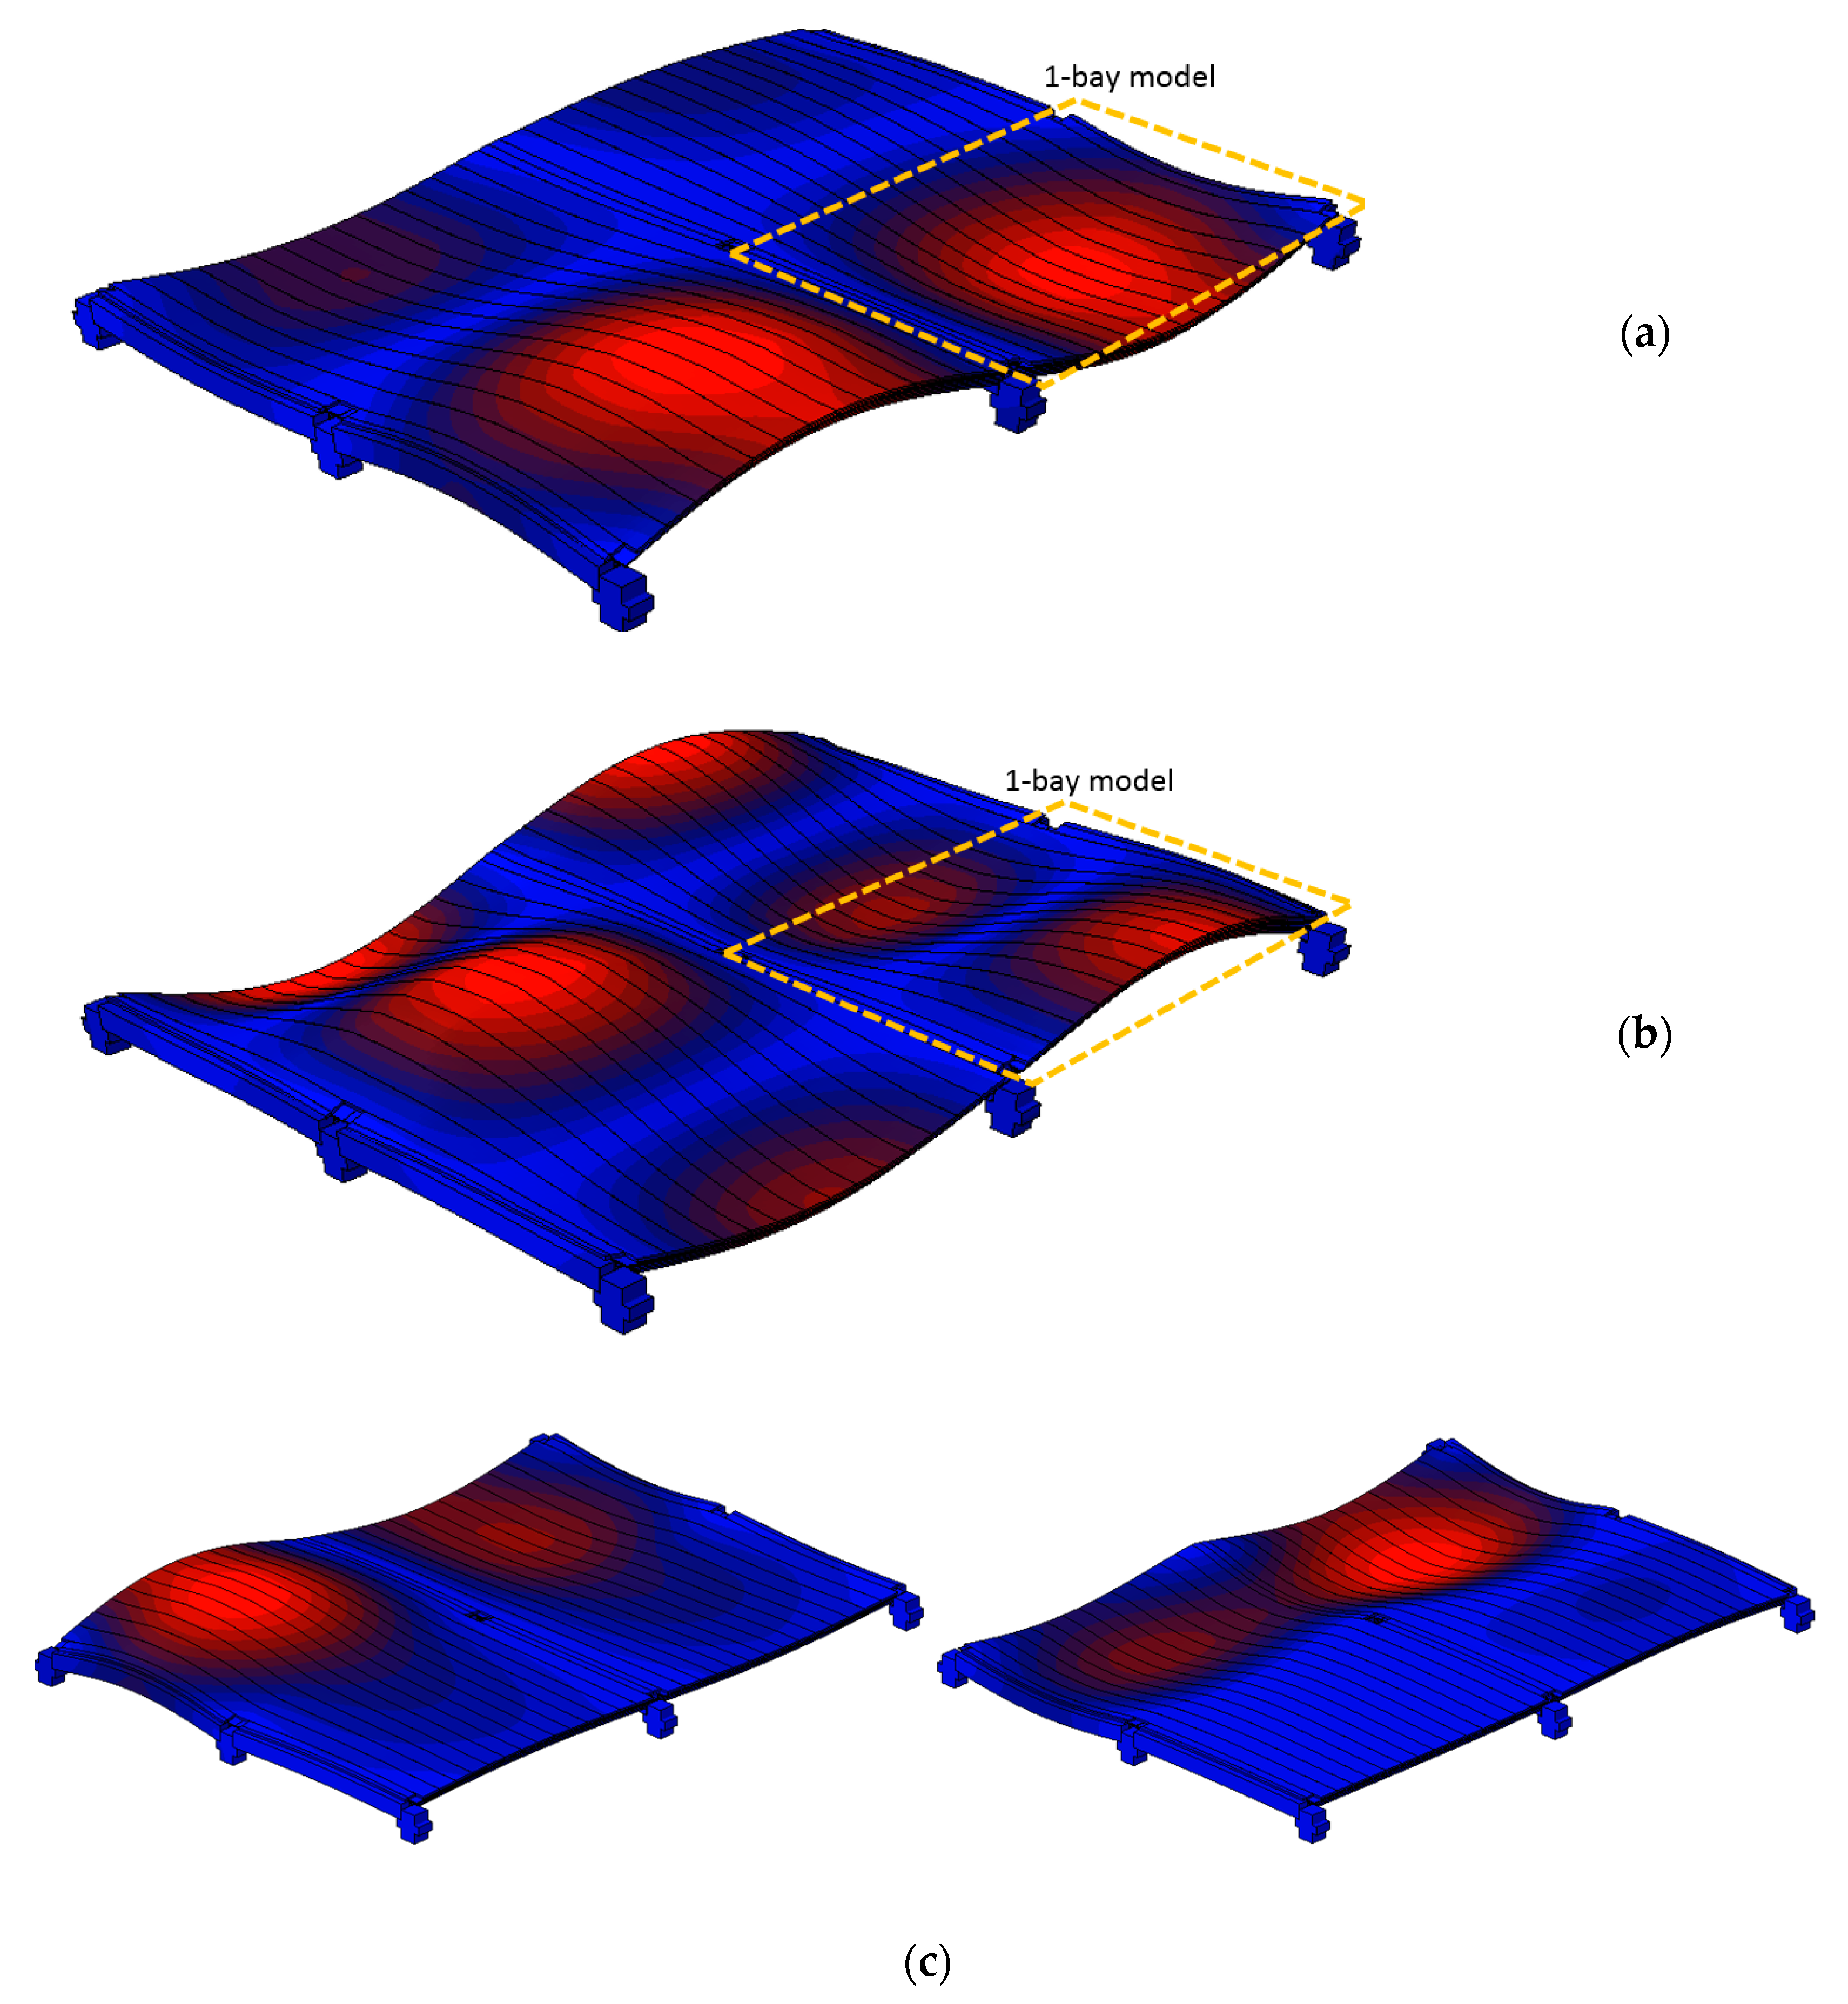
5.3. Natural Frequency Results
6. Coupled Experimental–Numerical Vibration Assessment
6.1. Experimental Configuration
6.2. Design Configuration
7. Conclusions
Author Contributions
Funding
Conflicts of Interest
References
- Bachmann, H.; Ammann, W. Vibrations in Structures Induced by Man and Machines; IABSE—International Association for Bridge and Structural Engineering: Zurich, Switzerland, 1987; ISBN 3-85748-052-X. [Google Scholar]
- Feldmann, M.; Heinemeyer, C.; Butz, C.; Caetano, E.; Cunha, A.; Galanti, F.; Goldack, A.; Hechler, O.; Hicks, S.; Keil, A.; et al. Design of Floor Structures for Human Induced Vibrations; Technical Report EUR 24084 EN.; Publications Office of the European Union: Bruxelles, Belgium, 2009; ISBN 978-92-79-14094-5. [Google Scholar] [CrossRef]
- Da Silva, J.G.S.; Sieira, A.C.C.F.; Da Silva, L.A.P.S.; Rimola, B.D. Dynamic Analysis of Steel Platforms When Subjected to Mechanical Equipment-Induced Vibrations. J. Civ. Eng. Arch. 2016, 10, 1103–1113. [Google Scholar] [CrossRef]
- Brownjohn, J.; Pavic, A. Vibration control of ultra-sensitive facilities. Proc. Inst. Civ. Eng. Struct. Build. 2006, 159, 295–306. [Google Scholar] [CrossRef]
- Chang, M.-L.; Lin, C.-C.; Ueng, J.-M.; Hsieh, K.-H.; Wang, J.-F. Experimental study on adjustable tuned mass damper to reduce floor vibration due to machinery. Struct. Control Health Monit. 2009, 17, 352–548. [Google Scholar] [CrossRef]
- Kazantzi, A.K.; Vamvatsikos, D. Seismic and Vibration Performance Rehabilitation for an Industrial Steel Building. Pr. Period. Struct. Des. Constr. 2020, 25, 05020001. [Google Scholar] [CrossRef]
- Wilson, R.R. Machine Foundations. In Vibrations of Engineering Structures; Lecture Notes in Engineering; Springer: Berlin/Heidelberg, Germany, 1985; Volume 10. [Google Scholar] [CrossRef]
- Tian, Y.; Liu, Z.; Xu, X.; Wang, G.; Li, Q.; Zhou, Y.; Cheng, J. Systematic review of research relating to heavy-duty machine tool foundation systems. Adv. Mech. Eng. 2019, 11. [Google Scholar] [CrossRef] [Green Version]
- Stimac, G.; Braut, S.; Zigulic, R. Structural optimization of turbine generator foundation with frequency constraint. Strojarstvo 2011, 53, 389–398. [Google Scholar]
- Liu, J.B.; Wang, Z.Y.; Zhang, K.F.; Pei, Y.X. 3D Finite element analysis of large dynamic machine foundation considering soil-structure interaction. Eng. Mech. 2002, 19, 34–35. [Google Scholar]
- Tian, Y.; Shu, Q.; Liu, Z.; Ji, Y. Vibration Characteristics of Heavy-Duty CNC Machine Tool-Foundation Systems. Shock. Vib. 2018, 2018, 1–12. [Google Scholar] [CrossRef] [Green Version]
- Werner, U. Derivation of a plane vibration model for electrical machines on soft machine foundations. Forsch. Ing. 2010, 74, 185–205. [Google Scholar] [CrossRef]
- Lipus, J.; Jankovych, R.; Hammer, M.; Lipus, T. Vibration and related diagnostics of motors and generators. MM Sci. J. 2016, 2016, 1639–1642. [Google Scholar] [CrossRef]
- Janak, L.; Stetina, J.; Fiala, Z.; Hadas, Z. Quantities and sensors for machine tool spindle condition monitoring. MM Sci. J. 2016, 2016, 1648–1653. [Google Scholar] [CrossRef]
- Cizikova, A.; Monkova, K.; Monka, P.; Moravec, M. Analysis of frequency characteristics at spindle of CNC machining centre. MM Sci. J. 2016, 2016, 1515–1518. [Google Scholar] [CrossRef]
- Abdulhani, F.; Alswede, J. Study of vibration for CNC machine at different feed. Int. J. Adv. Res. Technol. 2014, 3, 21–29. [Google Scholar]
- Dogrusoz, H.; Wszołek, G.; Czop, P.; Słoniewski, J. Vibration monitoring of CNC machinery using MEMS sensors. J. Vibroengineering 2020, 22, 735–750. [Google Scholar] [CrossRef]
- Ford, D.; Myers, A.; Haase, F.; Lockwood, S.; Longstaff, A. Active vibration control for a CNC milling machine. Proc. Inst. Mech. Eng. Part C J. Mech. Eng. Sci. 2013, 228, 230–245. [Google Scholar] [CrossRef] [Green Version]
- Elfatah, S.A. Practical Design and Construction of Machine Foundations Subjected to Impact Loads. Pr. Period. Struct. Des. Constr. 2020, 25, 04020008. [Google Scholar] [CrossRef]
- Yung, G. Dynamic Analysis of Machine Foundation: When a Static Force cannot give the full picture. In Proceedings of the HKIE-IEM-CIE Tripartite Seminar—Recent Developments in Limit State Design for Geotechnical Works, Hong Kong, China, 28 November 2014. [Google Scholar]
- Okpala, C.C. Shop floor vibration analysis and control. Int. J. Adv. Eng. Technol. 2016, 7, 207–211. [Google Scholar]
- Vlad, I. Machine Foundations and Blast Engineering Vibrations Case Studies. In Proceedings of the International Conferences on Recent Advances in Geotechnical Earthquake Engineering and Soil Dynamics, San Diego, CA, USA, 27 May 2010; Volume 7. [Google Scholar]
- Józwik, J.; Wac-Włodarczyk, A.; Michałowska, J.; Kłoczko, E.M. Monitoring of the Noise Emitted by Machine Tools in Industrial Conditions. J. Ecol. Eng. 2018, 19, 83–93. [Google Scholar] [CrossRef]
- Pinnington, R.; White, R. Power flow through machine isolators to resonant and non-resonant beams. J. Sound Vib. 1981, 75, 179–197. [Google Scholar] [CrossRef]
- Lau, M.; Fok, S.; Seet, G.; Low, E. The Control of Vibration Transmission from an Engine to its Resonant Base Structure. J. Mar. Sci. Res. Dev. 2011, 2. [Google Scholar] [CrossRef] [Green Version]
- Wigaard, J.; Hoen, C.; Fredo, C.R. Designing structural damping to avoid resonance problems in structures, piping and subsea equipment: Risk reduction and fatigue life improvement. In Proceedings of the OMAE2005—24th International Conference on Offshore Mechanics and Arctic Engineering, Halkidiki, Greece, 12–17 June 2005. [Google Scholar]
- Seidlitz, S.; Kuether, R.J.; Allen, M.S. Experimental Approach to Compare Noise Floors of Various Torsional Vibration Sensors. Exp. Tech. 2016, 40, 661–675. [Google Scholar] [CrossRef]
- Goyal, D.; Pabla, B. Development of non-contact structural health monitoring system for machine tools. J. Appl. Res. Technol. 2016, 14, 245–258. [Google Scholar] [CrossRef]
- Dekýš, V.; Sapietová, A.; Stevka, O. Understanding of the Dynamical Properties of Machines Based on the Interpretation of Spectral Measurements and FRF. Appl. Mech. Mater. 2013, 486, 106–112. [Google Scholar] [CrossRef]
- ABAQUS Computer Software; Simulia: Providence, RI, USA, 2020.
- Clough, R.W.; Penzien, J. Dynamics of Structures; McGraw-Hill: New York, NY, USA, 1993; ISBN 0-07-011394-7. [Google Scholar]
- Pap, Z.B.; Kollár, L.P. Dynamic Response of Long Rectangular Floors Subjected to Periodic Force Excitation. Materiral 2019, 12, 1417. [Google Scholar] [CrossRef] [Green Version]
- Nayak, A.N.; Satpathy, L.; Tripathy, P.K. Free vibration characteristics of stiffened plates. Int. J. Adv. Struct. Eng. 2018, 10, 153–167. [Google Scholar] [CrossRef] [Green Version]
- Srivastava, A.K.L. Vibration of stiffened plates with cut-out subjected to partial edge loading. J. Inst. Eng. Ser. A 2012, 93, 129–135. [Google Scholar] [CrossRef]
- Srivastava, A.; Pandey, S.; Kumar, A. Dynamical Analysis of Stiffened Plates under Patch Loading. Int. J. Appl. Mech. Eng. 2013, 18, 537–553. [Google Scholar] [CrossRef] [Green Version]
- Guo, T.; Cao, Z.; Zhang, Z.; Li, A. Frequency domain-based analysis of floor vibrations using the dynamic stiffness matrix method. J. Vib. Control 2018, 25, 763–776. [Google Scholar] [CrossRef]
- Allen, D.E.; Murray, T.M. Design criterion for vibrations due to walking. Eng. J. 1993, 30, 117–129. [Google Scholar]
- Eurocodice 4—Progettazione Delle Strutture Composte Acciaio-Calcestruzzo—Parte 1-1: Regole Generali e Regole per Gli Edifici; UNI EN 1994-1-1:2004; Ente Nazionale Italiano di Unificazione (UNI): Milan, Italy, 2005.
- Ministero delle Infrastrutture e dei Trasporti—DM 17/01/2018. Norme Tecniche per le Costruzioni (NTC2018); Ministero delle Infrastrutture e dei Trasporti: Rome, Italy, 2018.
- Ministero delle Infrastrutture e dei Trasporti—Circolare n.7 del 21/01/2019—Istruzioni per l’applicazione dell’ “Aggiornamento delle Norme Tecniche per le Costruzioni”; Ministero delle Infrastrutture e dei Trasporti: Rome, Italy, 2019.
- Shahabpoor, E.; Pavic, A.; Racic, V. Interaction between Walking Humans and Structures in Vertical Direction: A Literature Review. Shock. Vib. 2016, 2016, 1–22. [Google Scholar] [CrossRef] [Green Version]
- Criteri di Misura e Valutazione Degli Effetti Delle Vibrazioni Sugli Edifici; UNI9916: 2014; Ente Nazionale Italiano di Unificazione (UNI): Milan, Italy, 2014.
- Structural Vibration—Part 1: Prediction of Vibration Parameters, 2001; DIN4150: 2001; Deutsches Institut für Normung E.V. (DIN): Berlin, Germany, 2001.
- OKUMA Europe GmbH. Available online: www.okuma.eu (accessed on 27 July 2020).
- MATSUURA Machinery Corporation. Available online: https://www.matsuura.co.jp/english/ (accessed on 27 July 2020).
- BRIDGEPORT Machines. Available online: https://www.hardinge.com/product-brand/bridgeport/ (accessed on 27 July 2020).
- Bedon, C.; Bergamo, E.; Izzi, M.; Noé, S. Prototyping and Validation of MEMS Accelerometers for Structural Health Monitoring—The Case Study of the Pietratagliata Cable-Stayed Bridge. J. Sens. Actuator Netw. 2018, 7, 30. [Google Scholar] [CrossRef] [Green Version]
- Tracker—Video Analysis and Modeling Tool. 2020. Available online: http://physlets.org/tracker (accessed on 27 July 2020).


| Element | Section Parameter | |||
|---|---|---|---|---|
| A (m2) | Imax (m4) | Imin (m4) | It (m4) | |
| Slab (max, B = 2.5 m) | 0.373 | 0.1953 | 0.0070 | 0.0027 |
| Slab (min, B = 2.5 m) | 0.275 | 0.1432 | 0.0027 | 0.0010 |
| Double tee module (B = 2.5 m) | 0.392 | 0.1578 | 0.0254 | 0.0017 |
| Beam #1 | 0.076 | 0.0645 | 0.0182 | 0.0373 |
| Beam #2 | 0.061 | 0.0943 | 0.0326 | 0.0507 |
| Mix | Element | Nominal | Experimental (avg.) | ||
|---|---|---|---|---|---|
| Grade | Ecm (MPa) | fck (MPa) | Ecm (MPa) | ||
| Cast-in-situ concrete | Continuous slab | C25/30 | 31,476 | 53.3 | 37,893 |
| Precast concrete | Columns, beams, double tee floor modular units | C50/67 | 38,214 | 76.1 | 41,674 |
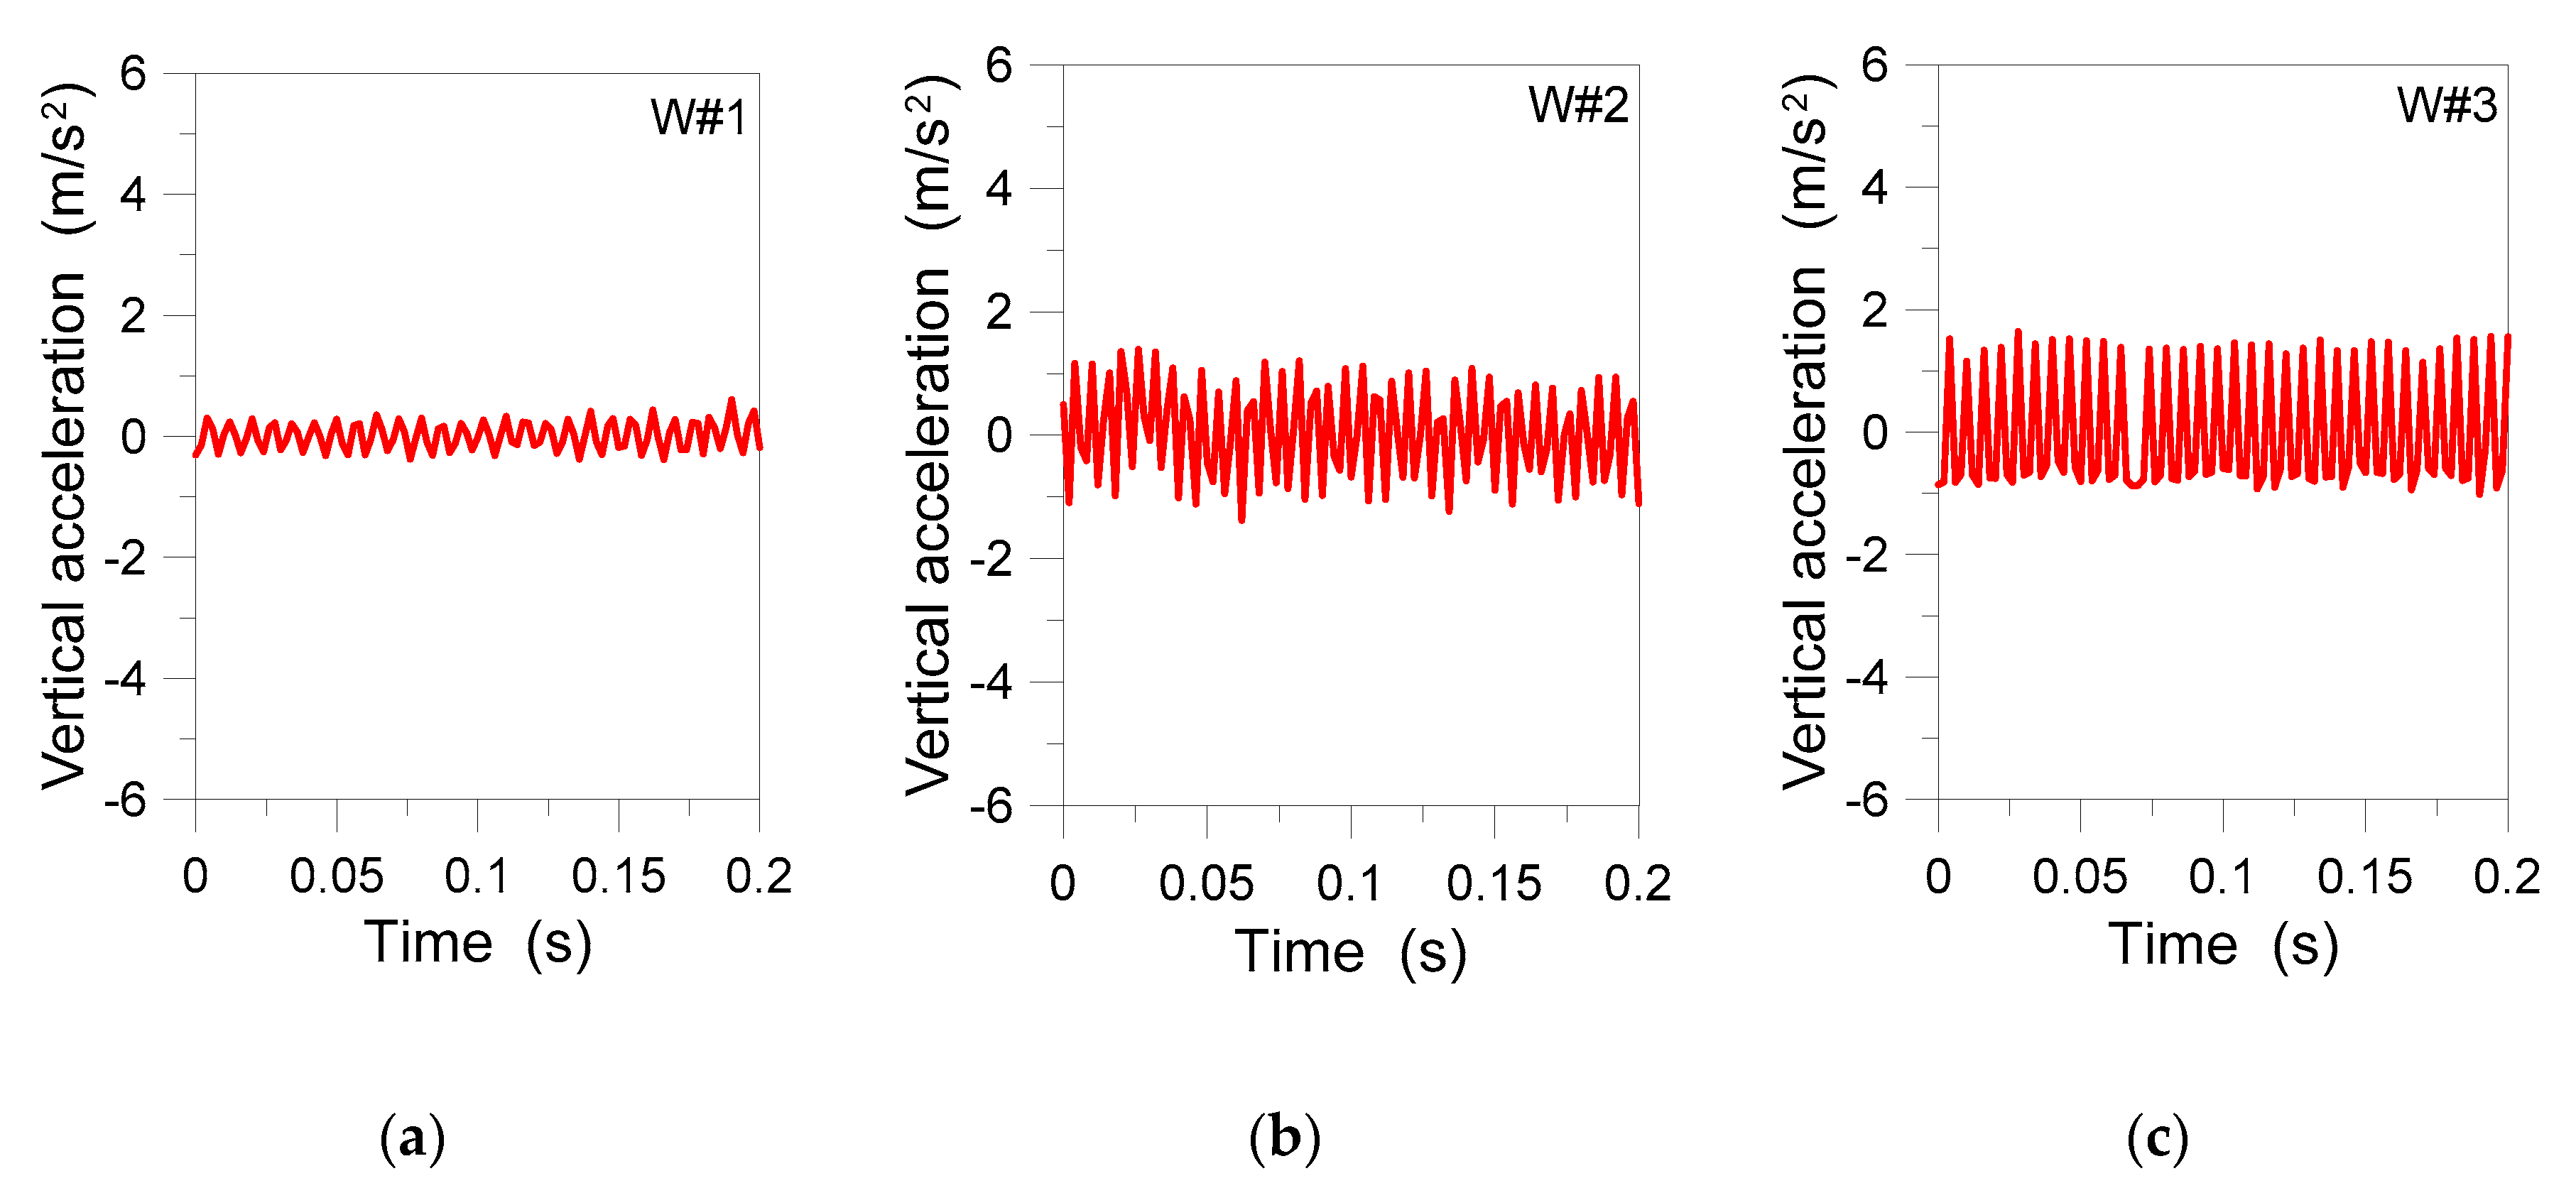
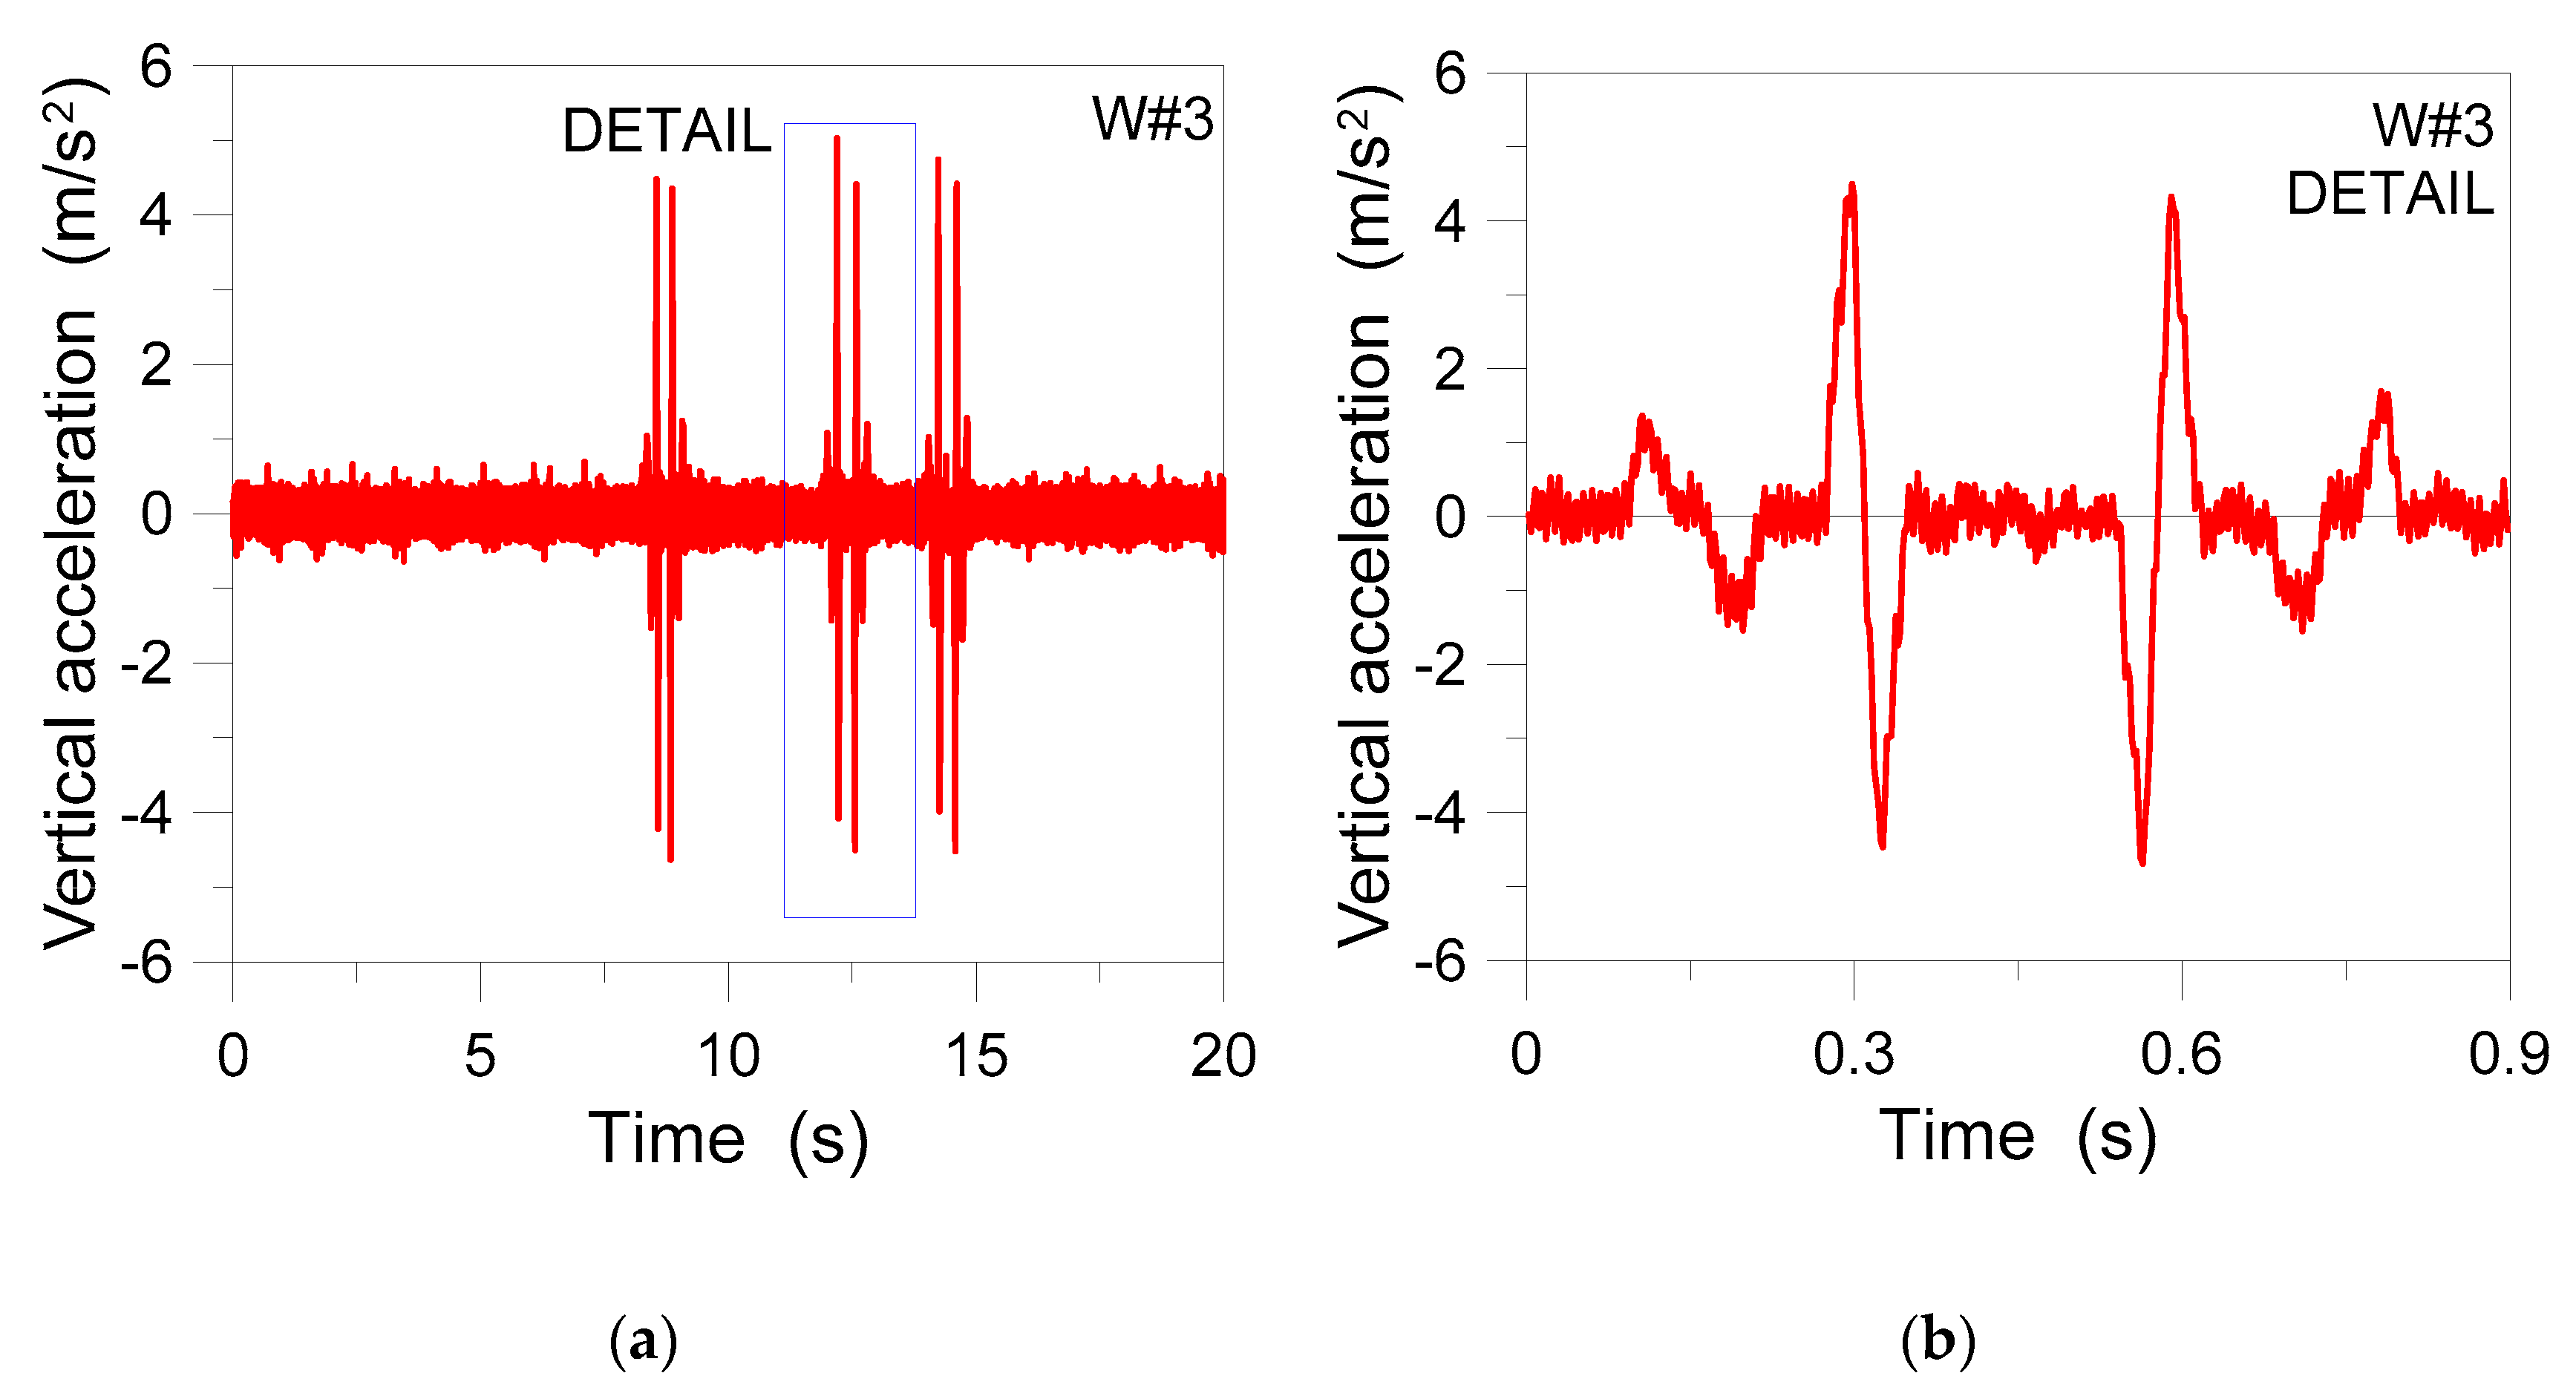
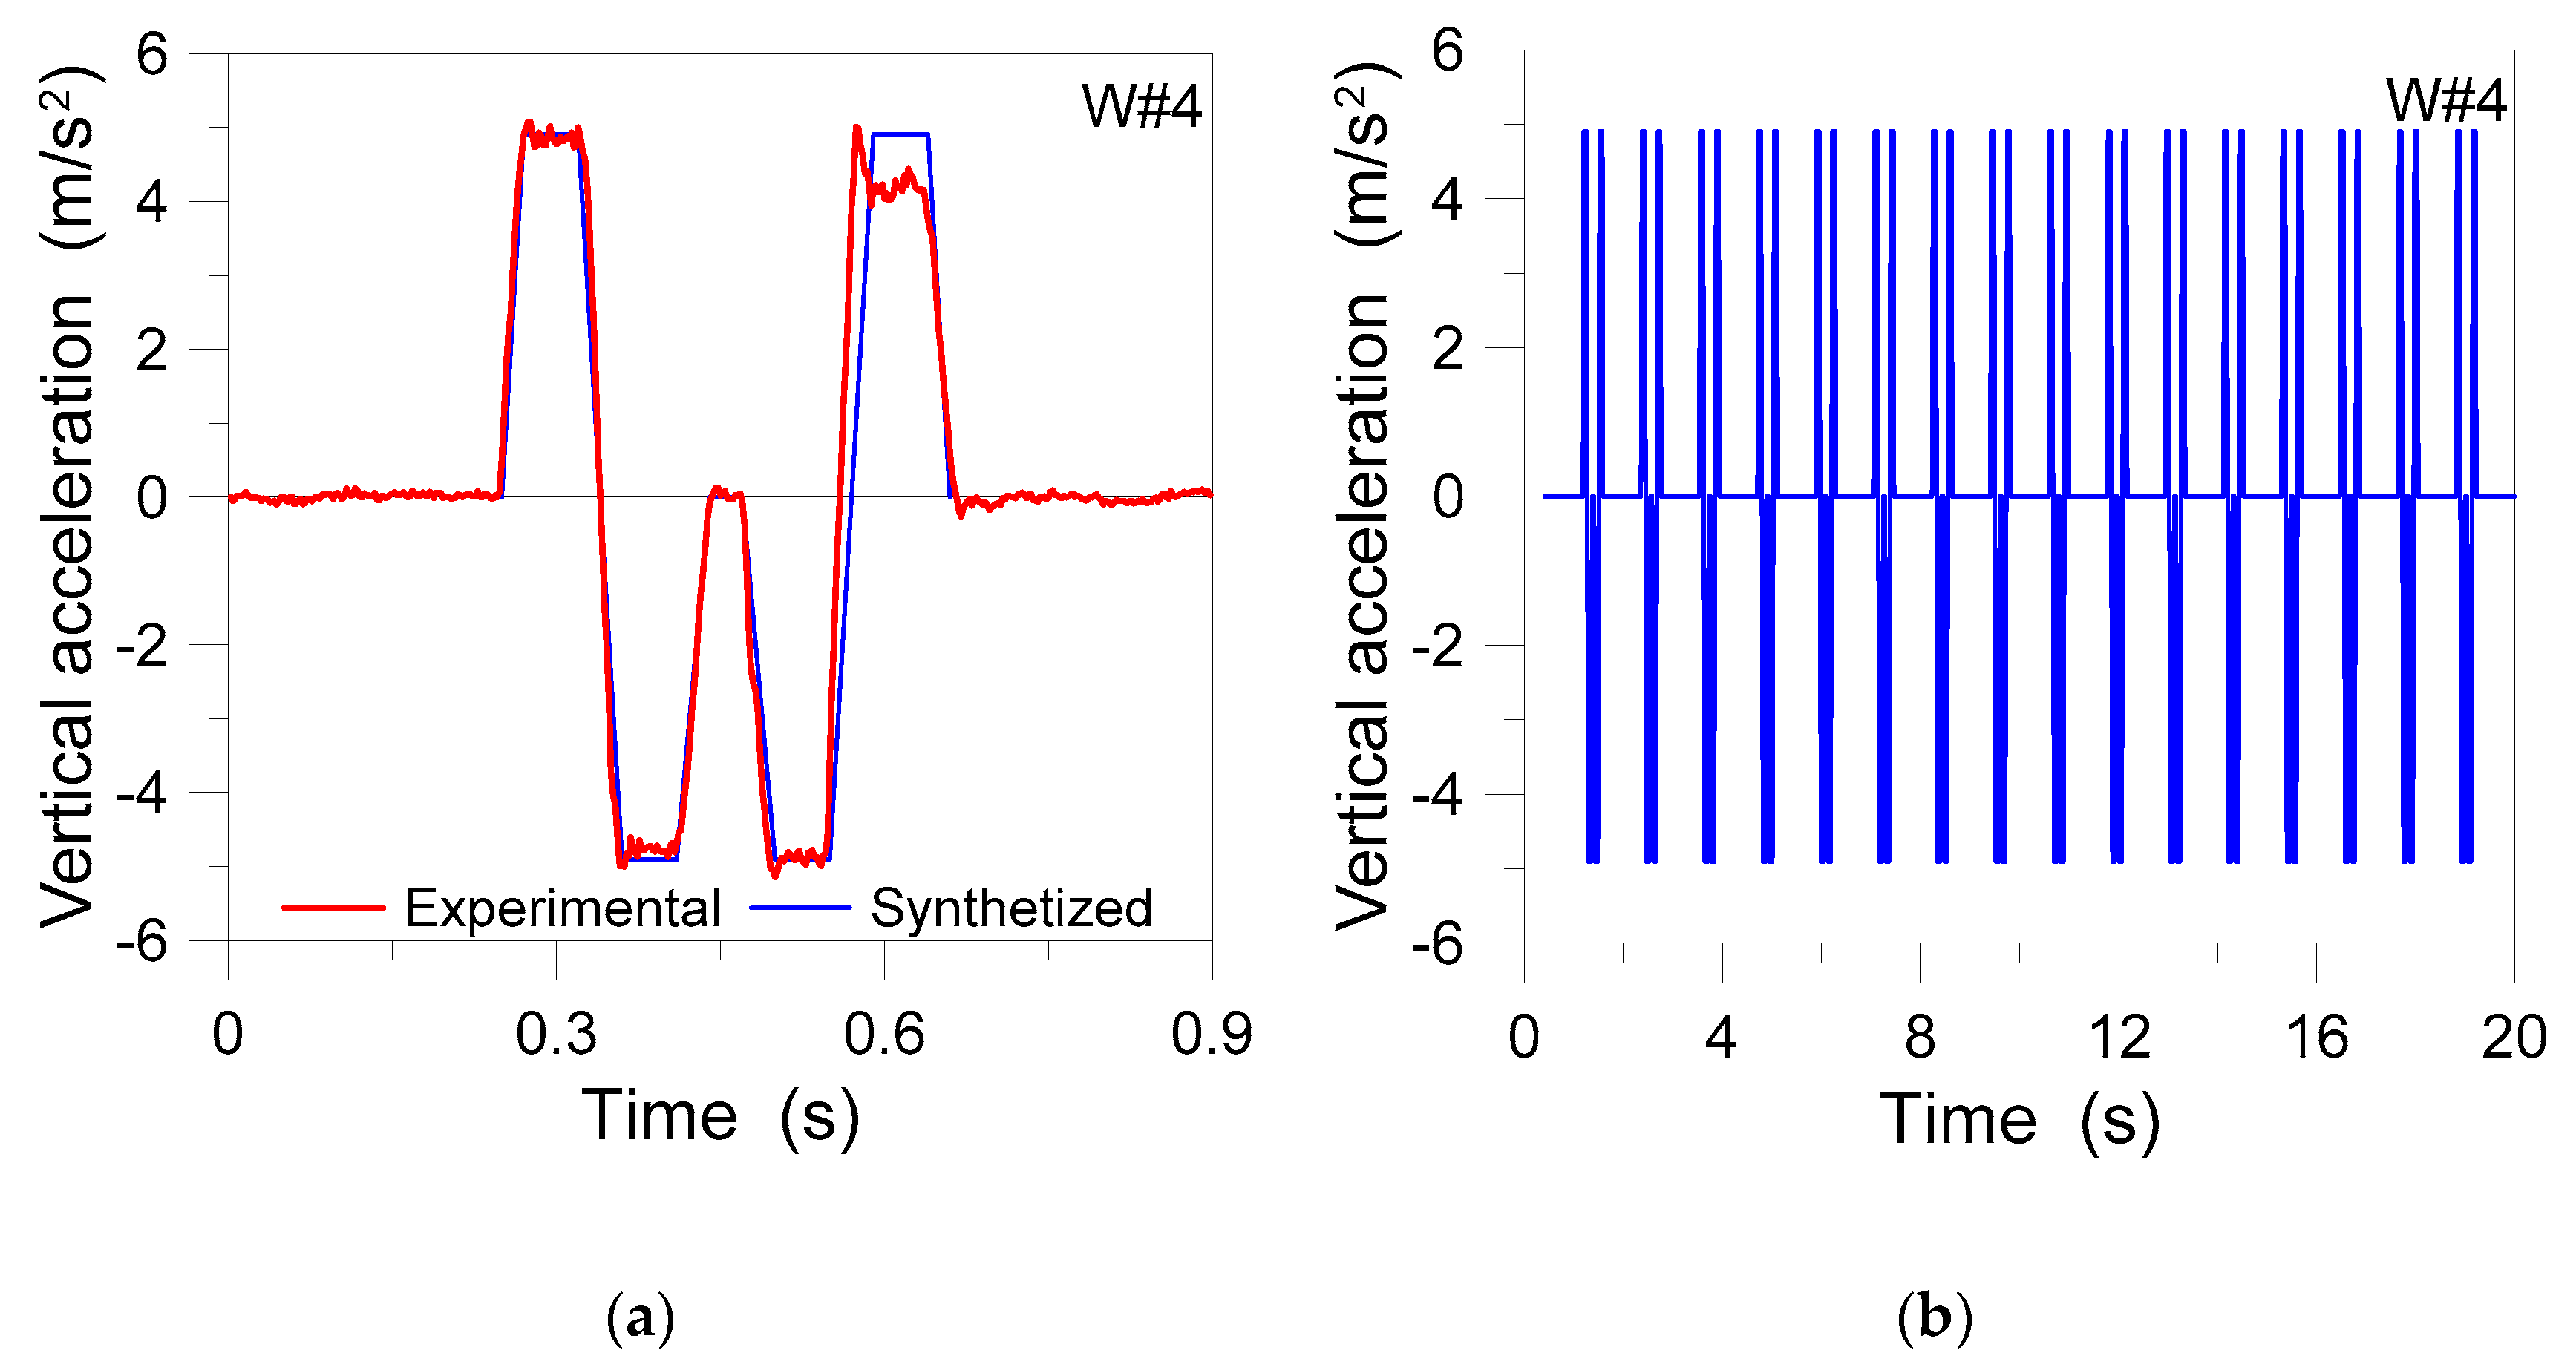
| Spindle Analysis (mp#1 Sensor) | |||
|---|---|---|---|
| W#n | Records | Acceleration Peak (m/s2) | Frequency (Hz) |
| 1 | 3 | 0.6 | 125 |
| 2 | 3 | 1.38 | 250 |
| 3 | 3 | 1.6 | 165 |
| 4 | 9 | 4.95 | 0.9 |
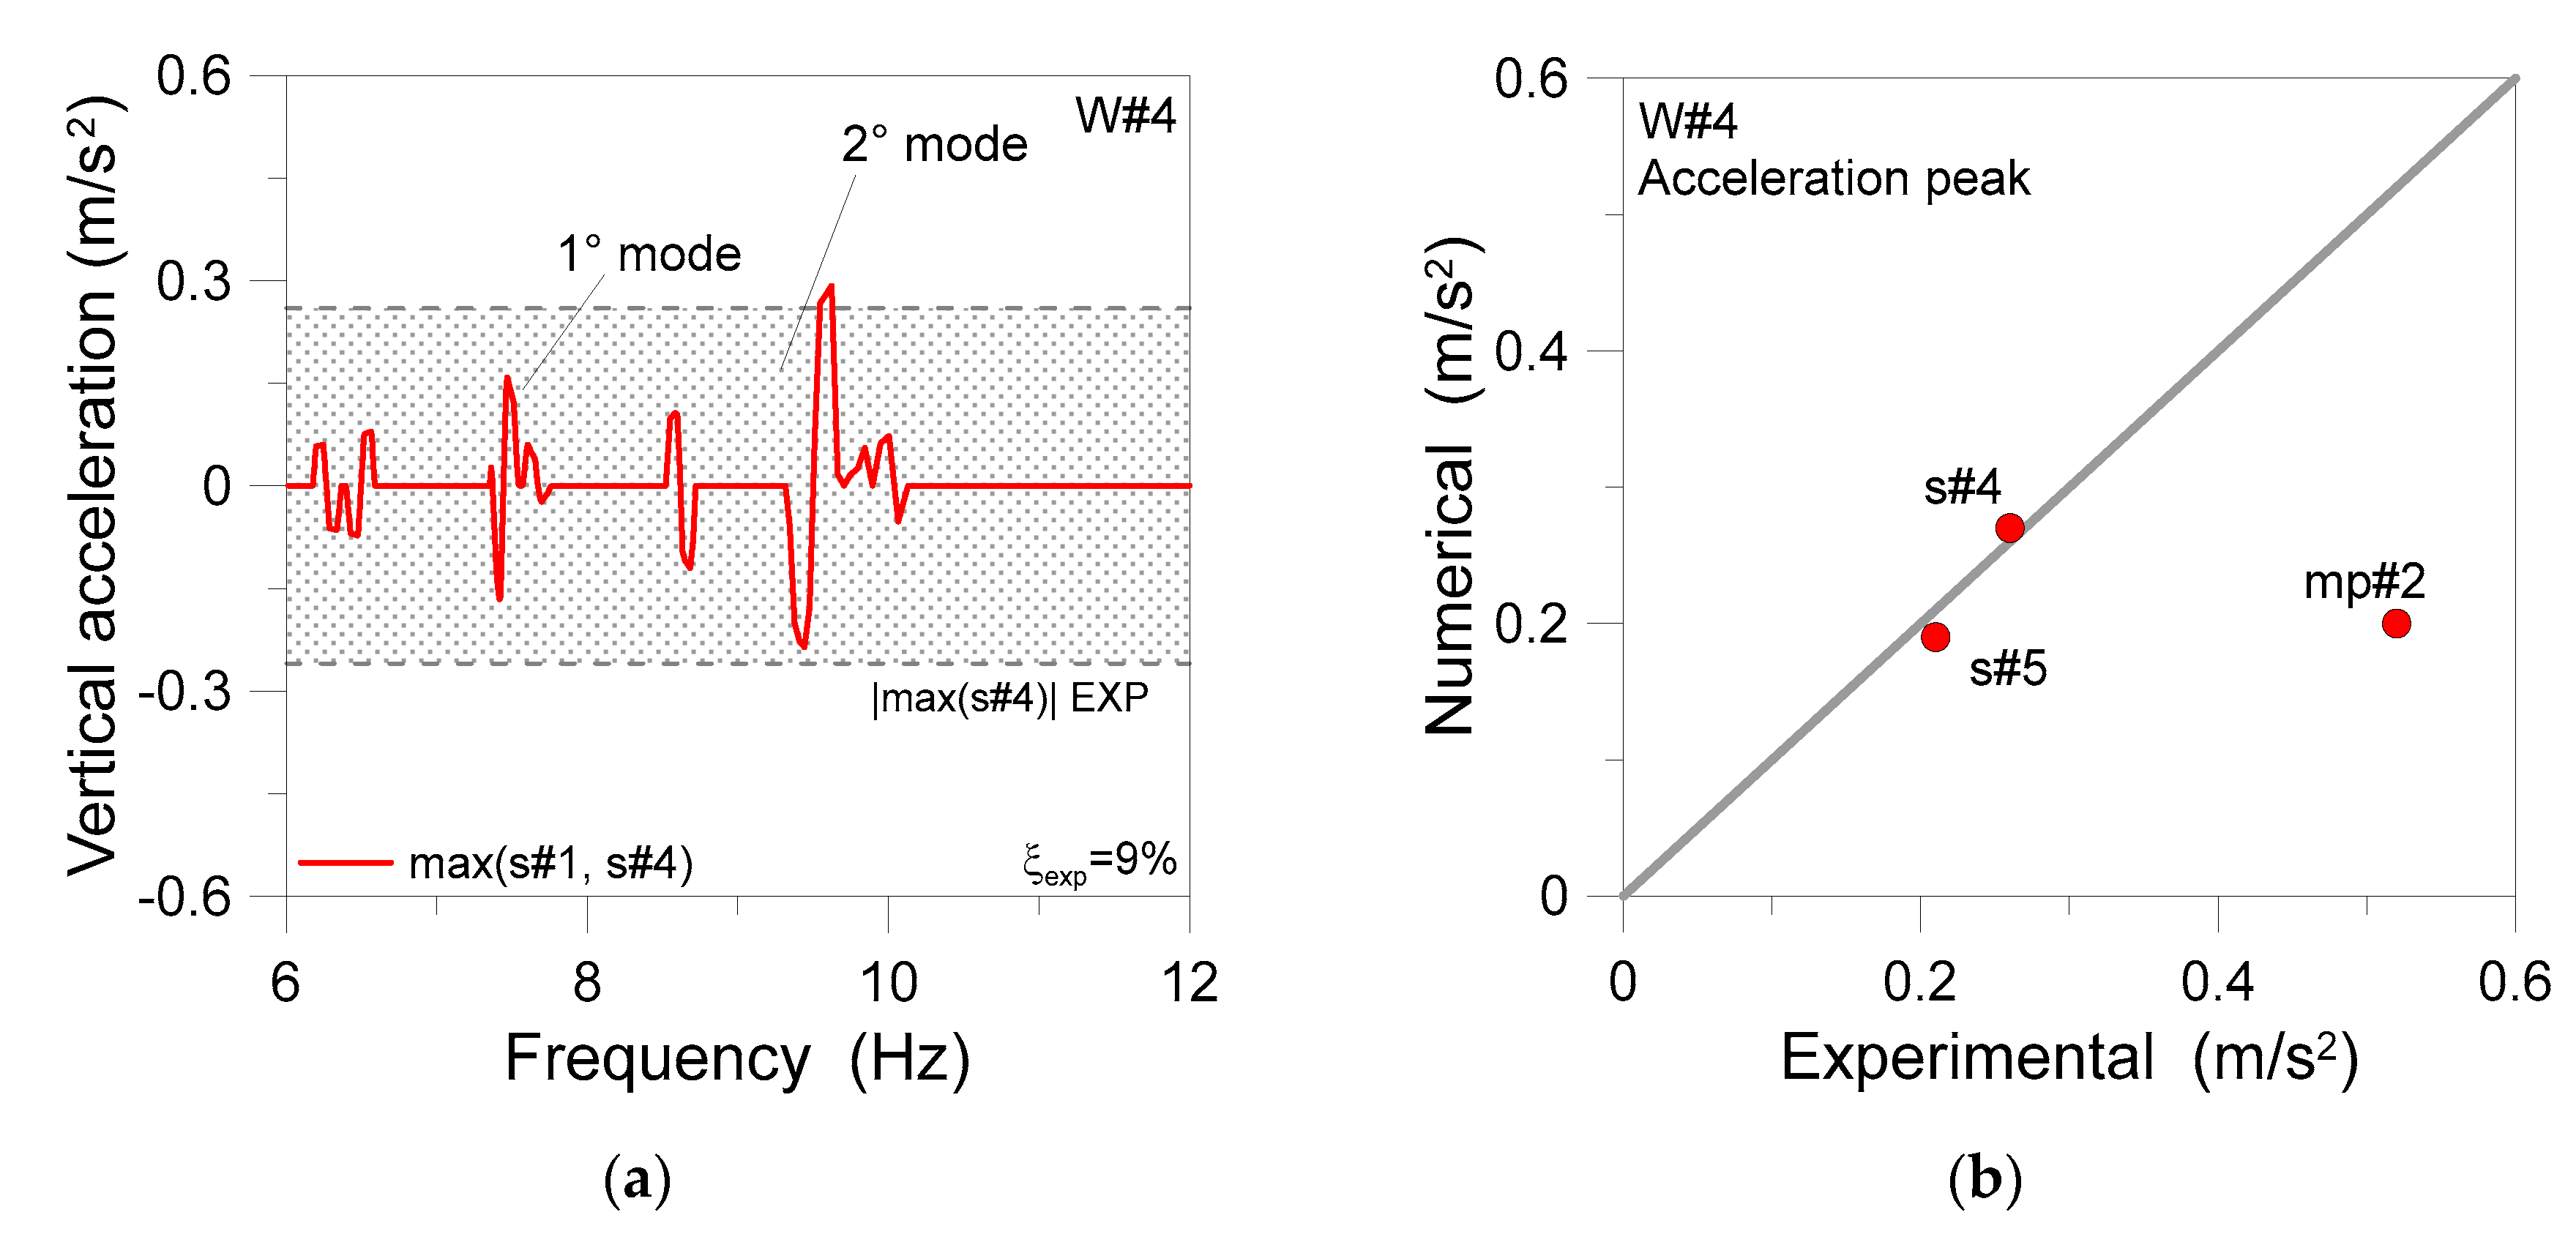
| W#n | Floor Analysis | ||
|---|---|---|---|
| Sensor | Records | Acceleration Peak (m/s2) | |
| 0 * | s#4 | 5 | 0.26 |
| 4 | mp#2 | 3 | 0.52 |
| 4 | s#4 | 3 | 0.28 |
| 4 | s#5 | 3 | 0.21 |
| FE model | |||||
|---|---|---|---|---|---|
| Experimental | Analytical (Equation (10)) | 1-Module | One-Bay | 2 × 2-Bay | |
| n | f (Hz) | f (Hz) | f (Hz) | f (Hz) | f (Hz) |
| 1 | 7.40 | 7.79 | 7.39 | 7.37 | 7.38 |
| - | - | - | - | - | 7.61 |
| - | - | - | - | - | 8.17 |
| 2 | 9.40 | - | - | 9.41 | 9.42 |
© 2020 by the authors. Licensee MDPI, Basel, Switzerland. This article is an open access article distributed under the terms and conditions of the Creative Commons Attribution (CC BY) license (http://creativecommons.org/licenses/by/4.0/).
Share and Cite
Bergamo, E.; Fasan, M.; Bedon, C. Efficiency of Coupled Experimental–Numerical Predictive Analyses for Inter-Story Floors Under Non-Isolated Machine-Induced Vibrations. Actuators 2020, 9, 87. https://0-doi-org.brum.beds.ac.uk/10.3390/act9030087
Bergamo E, Fasan M, Bedon C. Efficiency of Coupled Experimental–Numerical Predictive Analyses for Inter-Story Floors Under Non-Isolated Machine-Induced Vibrations. Actuators. 2020; 9(3):87. https://0-doi-org.brum.beds.ac.uk/10.3390/act9030087
Chicago/Turabian StyleBergamo, Enrico, Marco Fasan, and Chiara Bedon. 2020. "Efficiency of Coupled Experimental–Numerical Predictive Analyses for Inter-Story Floors Under Non-Isolated Machine-Induced Vibrations" Actuators 9, no. 3: 87. https://0-doi-org.brum.beds.ac.uk/10.3390/act9030087