

Nutrient-Limited Operational Strategies for the Microbial Production of Biochemicals

School of Chemical, Materials and Biomedical Engineering, University of Georgia, Athens, GA 30602, USA
*
Author to whom correspondence should be addressed.
Microorganisms 2022, 10(11), 2226; https://0-doi-org.brum.beds.ac.uk/10.3390/microorganisms10112226
Submission received: 18 October 2022
/
Revised: 31 October 2022
/
Accepted: 7 November 2022
/
Published: 10 November 2022
(This article belongs to the Special Issue Microorganisms Possibility for Future Bioproduction)
Abstract
:Limiting an essential nutrient has a profound impact on microbial growth. The notion of growth under limited conditions was first described using simple Monod kinetics proposed in the 1940s. Different operational modes (chemostat, fed-batch processes) were soon developed to address questions related to microbial physiology and cell maintenance and to enhance product formation. With more recent developments of metabolic engineering and systems biology, as well as high-throughput approaches, the focus of current engineers and applied microbiologists has shifted from these fundamental biochemical processes. This review draws attention again to nutrient-limited processes. Indeed, the sophisticated gene editing tools not available to pioneers offer the prospect of metabolic engineering strategies which leverage nutrient limited processes. Thus, nutrient- limited processes continue to be very relevant to generate microbially derived biochemicals.
1. Introduction
Biochemical processes use enzymes or microorganisms as catalysts to convert a substrate to a product, and are analogous to chemical processes in terms of basic design parameters including stoichiometry, energy relationships, kinetics, and equilibria [1]. Design and implementation of microbial bioprocesses additionally require an understanding of metabolic activity and its effect on growth and product formation as well as factors which influence organisms and these cellular reactions.
Operationally, microbial bioprocesses are often classified by the strategies used for substrate addition and product removal (Figure 1). In a batch process, the carbon-substrate/energy source as well as other nutrients are at the onset charged into the reactor, and product is harvested at the conclusion of the process, typically when the carbon source is depleted. Although material can be introduced into the reactor for oxygenation, pH control, foaming, and other minor reasons, a batch process is considered a closed system. Other operations in contrast are implemented as distinctly open systems. A chemostat occurs when the flowrates of a nutrient-containing feed and an effluent of products and residual nutrients are equal [2]. The dilution rate (D) normalizes that feed rate F by the constant volume of the system V (D = F/V). In addition, any of several semi-continuous fed-batch processes involve the feeding of nutrients often without product withdrawal [3,4]. Variations on these basic operational modes include a turbidostat [5,6], wherein the feed rate is controlled to maintain a constant cell density, and an accelerostat [7], wherein the dilution rate is changed progressively and slowly to maintain prolonged pseudo-steady-state conditions over a range of growth rates. A two-reactor cascade in which biomass formation and product formation are spatially distinct is another novel continuous operational mode which increases volumetric productivity of intracellular products [8]. Several of the methods for continuous cultivation have been critically compared for their utility in high-resolution characterization of metabolism [9].
Microbial bioprocesses are further categorized by whether or not the growth of the microorganisms is limited by the availability of nutrients. The term descriptively suggests a process in which cellular growth and metabolism are less than maximal as a result of the limited availability of one or more nutrients during the course of the process. Whereas many authors use limitation in the context of cessation of growth (e.g., [10]), we use the term to refer to the state in which cells are indeed metabolizing nutrients and even steadily growing, albeit at a lower than maximal rate because of the limited availability of one or more nutrients, a condition which can be sustained simply by feeding that limiting nutrient at a controlled rate. A batch process is not a nutrient-limited process (at least until the very end of the process), whereas a chemostat must be a nutrient-limited process. A fed-batch process might or might not be nutrient-limited, depending on the nature of the feeding. Fed-batch operations may also be distinguished by whether or not feedback control is used in establishing the feed [11], a classification which focuses on externally applied control rather than on the resulting physiological behavior of the cells. The type of nutrient limitation has a profound effect on the performance of cells in a bioreactor. This review does not consider control algorithms and strategies, for example, in the context of protein production [12].
In order to establish whether or not cell growth is nutrient-limited, one must consider that a relationship exists between the concentration of any nutrient and the specific growth rate. Among the many models available, the relationship is often satisfactorily described by the hyperbolic Monod Equation [13,14]:
where µmax is the maximum specific growth rate (h−1) which occurs in the absence of inhibitors and when nutrients are plentiful under those culture conditions, KS is the saturation constant (e.g., g/L), and S is the nutrient concentration (g/L). Although a great simplification of true microbial growth dynamics, the Monod Equation does capture the idea that a single nutrient can limit the specific growth rate, and shows that the growth rate approaches the maximum specific growth rate when S >> KS. The saturation “constant” is not actually a constant, but itself depends on culture conditions (e.g., temperature, pH), the nutrients themselves (e.g., glucose versus glycerol; ammonium versus nitrate), and even the degree of adaptation of the cells [15]. The value of KS reflects the overall metabolic affinity for a substrate and can be affected by altering the enzyme kinetics of a single reaction in cellular metabolism [16]. Considering the example of Escherichia coli with glucose as the carbon source, values for KS have been reported as low as 50 μg/L [15,17] to greater than 8 mg/L [18,19,20]. Regardless of the precise numeric value of KS, these results demonstrate that the saturation constant can be three orders of magnitude lower than a typical initial substrate concentration, so that the specific growth rate is essentially independent of S for the duration of a batch process. Since the growth rate is usually less than maximal only at very low nutrient concentrations, using a sensor feedback control strategy directly to maintain the concentration of a carbon/energy source or another nutrient at limiting conditions is generally impractical. Despite the difficulty in determining a value for the saturation constant [21], the Monod Equation is useful. For example, the equation can also be used to estimate the expected concentration of the limiting nutrient (i.e., when the process is operated in that way). Specifically, by rearranging the Monod Equation, the concentration of the growth-limiting nutrient (Slim) needed to sustain a given growth rate (μ < μmax) is:
Due to their simplicity, batch processes are often used to study many microbial phenomena such as growth, carbohydrate utilization, and product formation. However, the flexibility and degrees of control in a batch process are limited. Because the microbes in a batch process invariably encounter nutrients in excess relative to KS, the microbes grow for essentially the entire process at their maximum rate after an initial acclimatization, or lag period, until one or more nutrients suddenly become depleted. Thus, one has no operational ability to influence the nutrient-dependent physiological state of the culture. Nutrient-limited processes are underappreciated, particularly in the context of modern molecular tools, and a goal of this review is to highlight current knowledge on these processes.
2. Chemostat Processes
Originally developed to study bacterial cultures for a long duration [22], the chemostat maintains the cell growth rate lower than the maximum specific growth rate (μmax). The chemostat is an indispensable tool to investigate how growth rate affects cellular processes and how cells or consortia of cells evolve in response to nutrient limitation as a selective pressure [23], though it is particularly difficult to operate for microbes which grow on walls or aggregate such as filamentous fungi [24]. One can dictate which nutrient limits cell growth (e.g., C, N, P, etc.) merely by adjusting the medium composition [25]. Mean residence time in the chemostat is equal to the inverse of the dilution rate 1/D [26]. If the selected dilution rate is lower than the maximum specific growth rate (μmax) at the given environmental conditions, then a steady-state is normally achieved: the growth rate the microbes experience (μ) becomes equal to D, and the limiting nutrient attains a low, constant concentration (e.g., Equation (2)). If the dilution rate approaches or exceeds the maximum specific growth rate, then the cells cannot grow as quickly as the medium is withdrawn, leading to net loss of cells and culture washout. Because chemostat processes maintain a high biomass concentration compared to batch processes, a chemostat achieves a fairly high product and biomass volumetric productivity or space-time yield. Unfortunately, a continuous operation has an increased prospect of contamination or genetic drift during a prolonged biological process because of competition for the limiting nutrients [27,28,29]. Indeed, given the likelihood for mutations, a chemostat does not strictly reach a physiological “steady-state” [30]. In fact, at a long time-scale, the chemostat is an invaluable tool to evolve strains with greater substrate affinity [31,32,33,34], with relieved auxotrophy [35] or with a gain of substrate utilization [36]. Different limiting nutrients (e.g., N-limited versus Fe-limited) change the profile of mutations that occur, and the rate of mutations [37]. Nutrient-limited conditions also encourage phenotypic heterogeneity [38].
Care must be made in medium design for nutrient-limited processes because cells use a portion of the carbon/energy source for maintenance and also often to accumulate storage products. Therefore, the proportion of nutrients needed for a growth limitation itself depends on the growth rate, and dual-nutrient-limited regions are possible [39,40,41,42]. One fixed medium composition can lead to C-limited growth at a low dilution rate, dual C/N-limited growth at an intermediate dilution rate, and N-limited growth at a high dilution rate [40]. Nevertheless, operation of a chemostat is useful to identify optimal conditions for fed-batch operations for biochemical generation (e.g., [43]), and therefore, the chemostat is an indispensable tool for bioprocess development. Chemostat processes have been previously reviewed in the context of recombinant protein production [44], in which case C-limited growth is typically employed to avoid overflow metabolism, a situation in which extra carbon is diverted to an undesirable by-product such as acetate [45]. This review focuses on processes which are limited by another element and are thus carbon-excess, and the effect of these processes on microbial physiology.
3. Fed-Batch Processes
Fed-batch is a semi-continuous process in which one or more nutrients are supplied to the growing microbial culture with or without periodic withdrawal [11]. A fed-batch process can be implemented so that nutrients are intermittently added to the reactor and are always in excess from the perspective of the cells (i.e., relative to KS), resulting in a process physiologically similar to a batch process. Such a culture allows prolonged growth at µmax and can be considered a non-limited-nutrient fed-batch or a repeated fed-batch, although the latter term is often applied to a fill-and-draw process in which a portion of culture is periodically withdrawn and fresh nutrients supplied [46]. This type of fed-batch process is particularly beneficial in cases for which a high concentration of a particular nutrient inhibits microbial growth, since that nutrient can be maintained below its inhibitory concentration while achieving a near maximal growth rate [47,48]. Alternatively, a nutrient-starved fed-batch is a common process which involves growing a culture first with ample nutrients, and then in a subsequent cycle, supplying the culture with a feed in which at least one essential nutrient is absent. In such a nutrient-starved process, often the carbon/energy source is supplied to satisfy the cultures’ maintenance requirement, while the absence of another nutrient (e.g., N) prevents growth [49]. In this case, cells cannot continue growing without the missing essential nutrient(s), but they often remain able to metabolize the supplied carbon source and accumulate storage products or transform that carbon source into a desired product [50,51,52,53].
A fed-batch process can also be implemented as a nutrient-limited fed-batch, which like a chemostat necessitates that a nutrient feed is introduced at a rate lower than the growing culture can maximally metabolize. In contrast to a nutrient-starved process, though, the culture is growing continuously, and the rate of introducing the limiting nutrient controls the metabolic and growth rates [54]. Because no effluent typically exists, cells and products remain in the culture, enabling fed-batch processes to achieve high cell density and product concentration. A quasi-steady state is achieved in nutrient-limited fed-batch cultures [54].
Nutrient-limited fed-batch processes can be operated in several ways. For example, the growth-limiting nutrient can be introduced into the culture at a constant rate or at an exponential rate [11]. When a growth-limiting nutrient is fed at a fixed rate (Fc), the growth rate of the culture decreases with time [11,55]. In an exponential fed-batch process the nutrients are fed at an exponentially increasing rate to match the needs of the growing culture, to maintain a constant growth rate μc less than μmax. The time-varying feed rate of a process limited by the carbon-energy source during an exponential fed-batch process is:
where volumetric feed rate (F) is related to initial cell concentration (Xi), initial volume (Vi), substrate concentration in feed (Sf), biomass yield coefficient (YX/S), cell maintenance coefficient (ms), and the desired constant specific growth rate (µc) [56]. An exponential fed-batch operational mode has been used to obtain high cell density, avoid oxygen limitation, minimize metabolic heat generation, and minimize by-product formation [56,57,58]. Like the saturation constant, the maintenance coefficient should not be considered a constant value, as it includes multiple cellular phenomena that may change over the course of a process [59,60]. This simple parameter is merely an attempt to encapsulate quantitatively the portion of substrate consumption not used for growth or for product formation.
4. Nutrient Limitation Compared to Nutrient Starvation
From the cells’ perspective, nutrient limitation is quite different from nutrient starvation [61], the latter which is often called a “resting cell” process. Nutrient limitation permits continued, possibly steady-state growth, whereas starvation in one or more essential nutrient induces dynamic stress responses and ultimately prevents further growth [62,63,64]. Many researchers examine the effect of nutrient scarcity by restricting an essential nutrient in the medium to cause that nutrient to be depleted first, or by transferring washed and concentrated cells from a complete to a depleted medium (e.g., [65]). Similarly, batch processes are typically composed of a medium from which carbon is depleted first, leading many to refer to such a batch process as “carbon-limited”. The term “starved” would be preferred to describe a batch process: only after a period of maximal growth do the cells transition quickly to non-growth due to first deficiency then absence of that one (or more) nutrient. The distinction is more important when a nutrient other than the carbon source is the first to be depleted, because the remaining excess carbon/energy source often continues to be consumed and converted into an intracellular or extracellular product despite, or often because of, the lack of growth.
Because of these physiological differences, care should be taken when comparing results from nutrient starvation with nutrient limitation, wherein growth is maintained by the slow addition of one or more limiting nutrients. The literature is replete with studies describing “nutrient limitation”, when in fact the initial medium was merely adjusted so that the cells experience a short batch process until a specified nutrient is depleted, that is, the cells transition from a higher growth rate to being starved for that nutrient. Typically, these studies examine the culture for the metabolism of a remaining excess carbon source while the culture transitions from nutrient scarcity to nutrient exhaustion. Nutrient limitation implies a process in which the cells continue to grow.
To understand the physiological response of an organism to nutrient limitation, it is very important to have controlled conditions (pH, temperature, and oxygen) and a well-defined medium since common complex components such as yeast extract and peptone complicate the identification of the limiting nutrient and interpretation of the cellular response [26,66]. For example, enzymes in a pathway to a particular required metabolite (e.g., a vitamin) may require iron, and if the complex medium contains a small quantity of that metabolite, then the effect of iron limitation could differ in that complex medium compared to a medium with a single carbon/energy source. Comparing vastly different media compositions, using complex medium components such as protein hydrolysate, or using microbial consortia can make identification of the limiting nutrient(s) virtually impossible (e.g., [67,68,69]), and make results difficult to interpret.
One important measurement associated with nutrient limitation and cell growth in general is the biomass yield (Y, Table 1), which expresses the quantity of cells on a dry basis generated per quantity of nutrient consumed (e.g., units of g cells/g nutrient). For nutrients not used as an energy source or in a product, the biomass yield is the reciprocal of fractional composition of that nutrient (e.g., g nutrient/g cell). The steady-state biomass yield of a nutrient is greatest when that nutrient is limiting. For example, the E. coli biomass yield on nitrogen (YX/N, dry basis) is 8.8–9.8 g cells/g N during an N-limited chemostat, but 7.8–7.9 g cells/g N during glucose-limited growth, and 7.2–7.5 g cells/g N during Fe-limited growth [70]. In other words, E. coli is composed of 10.1–11.4% N when N is limiting, but 12.5–13.5% N when N is in excess and the cells are limited by something else: a loss of about 20 mg of N in one gram of cells when growth is limited by N. Similarly, E. coli biomass yield on iron (YX/Fe) is about 100,000–150,000 g/g (i.e., 8 μg Fe per g of cells) during an Fe-limited chemostat [71], but is 5000–7000 g/g (200 μg Fe per g of cells) in Fe-excess batch cultivation [72]. These bacterial cells are thus composed of roughly 20–25 times more Fe when excess Fe is in the medium compared to when this element is limiting (largely irrespective of growth rate). These observations demonstrate how the physiological steady-state differs with conditions, and how cells would likely undergo an extraordinary dynamic response in an Fe-starvation process. Cells initially experiencing low but excess Fe would transition through a wide range of states (from 200 μg Fe to 8 μg Fe per g of cells) before becoming truly depleted in Fe and unable to grow further. Such a dynamic response has been noted with high resolution in nitrogen-limited anaerobic processes using Saccharomyces cerevisiae, where a 7% increase in biomass occurs shortly after N-depletion, largely as a consequence of trehalose and glycogen accumulation [73]. Such a growth dynamic cannot be explained exclusively by the Monod equation, and requires the use of at least two independent growth rates, one representing growth in the presence of N, and a second corresponding to carbohydrate-accumulating growth after N-depletion [74]. The unsurprising lesson is that cells have great flexibility to adjust their composition in response to the environment [40], and usually minimize their composition of a limiting nutrient at the expense of energy efficiency, typically by upregulating pathways using less of that nutrient, or otherwise avoiding unnecessary use of the limiting nutrient. As cells optimize their metabolic network, biomass yields also vary with growth rate and temperature [75].
The method of measurement affects the calculation of the yield coefficient. One method is called a “pulse shift technique” [76,83]. This technique involves achieving a steady-state, and then injecting a pulse of a suspected growth-limiting nutrient into the reactor. If the injected nutrient is indeed growth-limiting, then the culture will no longer be limited by that nutrient, and the biomass will increase until the injected nutrient is depleted. Typically, an elemental analysis is not performed on the medium, the technique does not account for potentially multiple, simultaneous nutrient limitations, and it does not consider the cellular flexibility that an injected nutrient might be incorporated into cells without an observed biomass change. Thus, values calculated using this technique are generally low compared to values using other measurements. The dry mass of the cells is measured by drying a selected volume of washed cells at defined conditions of temperature and duration, and thus, this measurement also introduces variability into the yield calculation.
Most biochemical products of interest are composed of carbon, oxygen, and hydrogen. A common approach to maximize microbial formation of such products is by a two-step culture system in which a first phase achieves high cell density potentially without nutrient limitation, followed by a second phase, in which cells are either limited (allowing some growth) or starved (allowing no growth) by the absence of one or more nutrients other than C (e.g., [90,91,92]). After achieving a high biomass concentration, such nutrient starvation/limitation generally maximizes carbon conversion to the product at the expense of additional biomass. For example, intracellular storage products such as poly(hydroxybutyrate) accumulate under N-, P-, S-, or Mg-limitation [93,94,95]. In an analogous fashion, photosynthetic microbes [96,97,98] and plants [99] exude carbon under non-carbon nutrient limitation. The scope of this review is to consider the physiological effects of microbes growing under conditions of limitation or starvation by nutrients other than carbon.
5. Physiological Effects of Non-Carbon Nutrient Limitation
5.1. Nitrogen
Nitrogen occurs throughout cells, in proteins, nucleotides, and many metabolites. Nitrogen as ammonium is assimilated in E. coli and most bacteria and yeast into glutamine and glutamate [100], which are the primary intracellular nitrogen donors. In bacteria, 88% of the cellular nitrogen is derived from glutamate, while 12% is derived from glutamine [101]. Glutamate is the most abundant metabolite in E. coli, accounting for about 40% of the total metabolite concentration [102]. In many bacteria such as E. coli, two ammonium-assimilating pathways are available, a NADPH-dependent glutamate dehydrogenase and a high-affinity glutamate synthase (glutamine oxoglutarate aminotransferase, GOGAT)/glutamine synthase. Glutamate dehydrogenases generally have high values of KM for ammonium, so that during N-limited growth, glutamine synthase expression is elevated to maintain sufficient glutamate [103]. Dynamic N starvation in E. coli and S. cerevisiae growing on glucose depletes glutamine and to a lesser extent glutamate while α-ketoglutarate increases markedly and can even be excreted [65,104]. Accumulation of α-ketoglutarate occurs in cyanobacteria also, a signal which upregulates nitrogen assimilation via the global regulator NtcA and other regulators [105,106]. In yeast, the concentration of tryptophan, which relies on glutamine for its synthesis, decreases, while phenylalanine and tyrosine, which rely on glutamate for nitrogen, do not change, resulting in an accumulation of phenylpyruvate and phenylethanol, a quorum-sensing signal [107]. Accumulated α-ketoglutarate in E. coli noncompetitively and cooperatively inhibits EI of the PTS [108], citrate synthase [109], and PEP synthetase [110]. Furthermore, sudden nitrogen availability in N-starved wild-type E. coli induces a decrease in α-ketoglutarate and rapid increase in glucose uptake rate, while in a PTS-deficient strain with elevated galactose permease, glucose uptake is insensitive to N-availability [108]. In general, S. cerevisiae N-limitation leads to depletion of intracellular amino acids, particularly at low dilution rates [104]. Because intracellular glutamine and arginine concentration correlates strongly with dilution rate, these compounds likely control growth in N-limited S. cerevisiae [104]. Synechocystis also accumulate α-ketoglutarate [111] under N-starvation as well as glycogen, which is associated with the induction of the glgX gene [112,113,114]. E. coli has a high protein turnover under N-limited conditions compared to C-limited or P-limited conditions [115].
Under steady-state conditions, cells tend to have greater uptake of the carbon/energy source when grown under carbon-excess conditions compared to carbon-limited conditions. For example, under N-limited conditions at 0.2 h−1, E. coli shows a 2.3-fold greater specific glucose-consumption compared to under glucose-limited conditions [116], while S. cerevisiae shows 2–3 greater specific glucose consumption compared to glucose-limited conditions at all growth rates [117]. This extra carbon at the same growth rate is diverted to energy consuming reactions, and E. coli also generates substantially more acetate under N-limited conditions compared to C-limited conditions: 0.19 g/g during N-limited growth at 0.10 h−1, but no acetate during C-limited growth [118]. In E. coli, several genes associated with TCA cycle enzymes (isocitrate lyase, fumarase, succinate dehydrogenase) are downregulated under N-limitation compared to glucose-limitation, while genes of the Embden–Meyerhof–Parnas and pentose phosphate pathways are induced [119]. N-limited conditions generally increase the flux through glycolysis relative to the pentose phosphate pathway [116]. Some cells grown under carbon excess conditions induce ATP-dissipating futile cycles. For example, under N-limited conditions, Bacillus subtilis increases flux through the oxaloacetate-PEP-pyruvate cycle (PEP carboxykinase, pyruvate kinase, pyruvate carboxylase) leading to the net loss of one ATP per cycle [77]. N-limited S. cerevisiae cultures showed much lower intracellular concentrations of NAD and NADH compared to C-limited cultures [117]. Increasing dilution rate of S. cerevisiae increased the CO2 generation under N-limited conditions. In general, CO2 emission increases with growth rate irrespective of nutrient limitation [77,119], though CO2 evolution is greater under N-limitation compared to other nutrient limitation.
N-limitation, or more generally C-excess conditions, favor the formation of many biochemical products. For example, citric acid generation by Aspergillus niger is typically carried out under N-limited or dual N-/P-limited conditions [120,121], which are preferred operational modes because of nitrogen catabolite repression [122]. Candida oleophila also generates 0.7 g/g citrate under N-limited conditions at a dilution rate of 0.0185 h−1 [123], while Penicillium simplicissium excreted both malate and citrate under N-limited conditions [124], and Yarrowia lipolytica generated nearly 90 g/L citrate at the lowest dilution rate (<0.01 h−1) though the greatest yield of 0.67 g/g was at a greater dilution rate [125]. Citrate formation by Penicillium ochrochloron under N-limited (and P-limited) conditions is correlated with much lower nucleotide concentrations [126]. Similarly, N-limitation yielded the largest quantity of lipids in an oleaginous Candida [127], Cryptococcus curvatus [128], and Y. lipolytica [129]. In Schizochytrium sp., ammonium starvation resulted in the greatest squalene content (223 mg/g of total lipids) compared to phosphate starvation (30 mg/g) or excess nutrients (143 mg/g) [130]. N-limited chemostats at 0.1 h−1 resulted in 59% of the catabolic flux directed to 1,3-propanediol, whereas under P-limited conditions, 43% of the flux was directed to this product [131]. In N-limited fed-batch cultures, over 60 g/L 1,3-propanediol was obtained with a productivity of 1.7 g/L·h. Nitrogen starvation increased itaconate production ten-fold compared to batch conditions in a Corynebacterium glutamicum strain expressing cis-aconitate decarboxylase from Aspergillus terreus [132]. Very low growth rate of recombinant S. cerevisiae under N-limited conditions generated over 0.61 mol/mol succinate for 500 h [133]. A two-reactor N-limited chemostat system, allowing very low dilution rates, yielded about 200 g/L erythritol using Y. lipolytica with a yield of 0.66 g/g glycerol [134,135].
Storage products such as polyhydroxyalkanoates are well-known to accumulate under N-starvation (the processes are typically referred to as N-limitation). One approach is to grow Alcaligenes eutrophus (Cupriavidus necator) to a high cell density, and then stop providing N while maintaining a high glucose concentration [93,94,136]. Such N-starvation led to about 120 g/L poly(hydroxybutyrate) or poly(3-hydroxybutyrate-co-3-hydroxyvalerate), depending on co-substrates provided. A similar approach using Alcaligenes latus leads to 112 g/L poly(hydroxybutyrate) with a productivity of about 5 g/L·h from sucrose [137]. The cyanobacteria Synechocystis also accumulate poly(hydroxybutyrate) during N-starvation [138,139], an observation attributed to the induction of the phaC gene coding PHA synthase during N-starvation [140].
Compared to C-, S- or P-limited conditions, S. cerevisiae generates the greatest ethanol yield (0.35 g/g) at 0.1 h−1 under N-limited steady-state conditions [141]. N-starvation during the production of actinorhodin by Streptomyces lividans also led to the formation of α-ketoglutarate [142]. N-starvation (referred to as limitation) led to the accumulation of cellobiose lipids in two ustilaginomycetous yeasts [143].
Although Clostridium acetobutylicum under C-limited conditions at neutral pH leads to acetate and butyrate formation [144], N-limited conditions at a pH below 5.2 result in acetone and butanol solvent formation, but at a decreased rate [145]. No solvent formation is observed under N-limited conditions at pH 5.7 [146]. Quite surprisingly, N-limited conditions result in the accumulation of pyruvate and amino acids such as valine in C. thermocellum, a result attributed to a shift in pyruvate-ferredoxin oxidoreductase and an increased malic enzyme flux [147].
5.2. Phosphorus
Phosphorus occurs in cells as phosphorylated organic compounds such as general sugar-phosphates, phospholipids, phosphorylated proteins, RNA, DNA, and ATP. The response to a P-deficiency is typically mediated by a two-component signal transduction system. The sensor kinase component, PhoR, phosphorylates a response regulator that amplifies its own response, increases expression of proteins which scavenge phosphate such as a high-affinity phosphate transporter [150]. Thus, P-limitation has multiple physiological consequences. For example, P-limitation causes a shift in the structure of the cell wall of Gram-positive microbes such as B. subtilis from P-containing teichoic acid to teichuronic acid which lacks phosphorus [151,152]. As a result, P-limited B. subtilis contain less than half as much cellular phosphate as bacteria grown in excess P, and phages which bind to teichoic acid bind less effectively under P-limited conditions [153,154]. In this case, phosphorylated PhoPR represses tagAB operon to restrict teichoic acid synthesis and activates the tua operon to stimulate teichuronic acid synthesis [150]. P-limitation triggers the synthesis of phosphate-mobilizing hydrolases such as alkaline phosphatases and ribonucleases [155]. In S. cerevisiae, genes responsible for uptake of inorganic phosphates and inositol phosphates are upregulated under steady-state P-limitation at 0.1 h−1, and surprisingly, polyphosphates accumulate in this yeast’s vacuoles [141]. Cells appear to use ribosomes for protein synthesis at higher efficiency under phosphate limitation [156], and the RNA content is 6–8-fold greater than expected to be necessary for maintenance of the growth rate, though this RNA is immediately usable when P-limitation is relieved [157].
Isotopic labeling and MFA analysis have been used to compared P-, N-, and C-limited steady-state growth of B. subtilis at 0.1 h−1 and 0.4 h−1 [77], showing that the TCA cycle is severely restricted under P-limitation (only 14% of the flux compared to C-limited conditions, and 12% of flux of N-limited conditions). The rate of glucose uptake is over 30% greater under P-limited conditions compared to C-limited conditions at both growth rates, and the formation of acetate, diacetyl, and acetoin is much greater with those by-products accounting for over one-third of the carbon utilization. A high conversion of malate to pyruvate via malic enzyme and ‘reverse’ flux from oxaloacetate to malate occur at high steady-state growth rate (0.4 h−1). Moreover, compared to C-, or N-limited condition, P-limited conditions lead to the greatest partitioning of flux into the pentose phosphate pathway (59% of glucose-6P entered this pathway at 0.1 h−1 and 44% at 0.4 h−1). High transhydrogenase fluxes are needed to balance the excess reducing equivalents NADPH and NADH [77]. Cells under P-limited conditions also have a greater protein content compared to cells experiencing N-limited or C-limited conditions. Greater CO2 production has been widely observed in cells grown under P-limited conditions compared to C-limited conditions, which is attributed to the realignment of metabolic fluxes between the pentose phosphate pathway and TCA cycle [77,141,148,158,159]. P-limited S. cerevisiae cultures showed much lower intracellular concentrations of CoA than other nutrient-limited conditions [117].
Specific glucose uptake rate is about 2× greater and acetate formation 20× greater in E. coli under P-limited conditions compared to C-limited conditions at 0.2 h−1 [160]. P-limited chemostat cultures of Klebsiella aerogenes using glucose as the sole carbon source (0.17 h−1) secrete polysaccharides, 2-ketogluconate, and gluconate instead of pyruvate [161].
In P-limited B. subtilis cultures growing at comparatively high steady-state growth rates (0.4 h−1), the futile cycle pyruvate–oxaloacetate–malate (pyruvate carboxylase, malate dehydrogenase, malic enzyme) is induced leading to the net loss of one ATP per cycle [77]. In comparison, in glucose-limited E. coli cultures, malic enzyme flux apparently does not occur [116]. Interestingly, malate-to-pyruvate conversion increases with growth rate in Bacillus megaterium. However, this reaction does not take place in glucose- and N-limited B. subtilis chemostat cultures and is replaced with conversion of oxaloacetate to PEP [77].
In general, the concentrations of nitrogenous bases and nucleosides are elevated under P-limitation compared to N-limitation, and the concentration of these metabolites increases with increasing dilution rate [104]. Because ATP concentration correlates with dilution rate during P-limited growth, ATP availability is thought to control the growth rate under P-limitation [104]. The adenylate energy charge of cells is low, and the ADP concentration relatively elevated, under P-limitation [162].
The formation of several biochemical products has been examined under P-limited conditions. P-limited conditions lead to a 3-fold greater vancomycin production by Amycolatopsis orientalis compared to glucose-limited conditions [163], and also increased formation of streptomycin by Streptomyces griseus [164] and oxytetracycline by Streptomyes rimosus [165]. P-starvation (referred to as limitation) causes the greatest actinorhodin formation in Streptomyces lividans [142], and was more effective than N-starvation in generating rhamnolipids by Pseudomonas aeruginosa [166]. P-limited conditions lead to the greatest fatty acid formation in E. coli compared to C- or N-limited conditions in batch or chemostat culture [167], which was increased further by knockouts in genes associated with flagella [168], a significant energy drain. P-limited cultures generate the greatest yield of glucose from xylose in a strain unable to metabolize glucose and blocked carbon entry into the oxidative pentose phosphate pathway (Δzwf), likely because the final step of this conversion includes the dephosphorylation of glucose-6P [169].
P-limited recombinant E. coli cultures showed consistent specific production rate of phenylalanine throughout the fermentation [61]. A hyperproducing E. coli mutant showed 8.7 g/L phenylalanine with a 0.44 g/L·h productivity in a P-limited chemostat (0.05 h−1) [170]. Compared to S-, Mg-, or K-limitation, P-limitation is the most efficient limiting nutrient for phenylalanine generation in recombinant E. coli continuous cultures at 0.1 h−1 [171]. Decreased dilution rate (0.03 h−1) leads to 16.4 g/L phenylalanine with a productivity of 0.49 g/L·h [171]. Compared to C- or N-limitation, P-limitation resulted in the greatest 3-hydroxypropionate production in engineered strain of S. cerevisiae [43]. Because nitrogen is a component of ε-poly-L-lysine, P-limited cultures are used to generate maximal formation using Streptomyces albulus under steady-state conditions, and using glucose and glycerol as dual carbon sources attained over 20 mg/g·h specific productivity compared to less than 8 mg/g·h for either single carbon source alone, a result which correlated with much greater activity in aspartate kinase and several other associated enzymes [172]. P-limited conditions increase carbon flux into the isoprenoid pathway in S. cerevisiae associated with the upregulation of PDC6 [173].
Shikimic acid yield was 2.4× greater in E. coli grown under P-limited steady-state conditions compared to C-limited conditions, with much fewer by-products under P-limited growth [159,174]. Stipitatic acid was produced to a greater extent by Penicillium stipitatum under P-limited conditions compared with N-limited or C-limited conditions, a result which was attributed to the inhibitory effect of phosphate on the polyketide synthesis pathway [82]. Xylitol can be generated from xylose under oxygen-sufficient, P-limited conditions using the yeast Debaryomyces hansenii [175].
In C. necator, phosphate deficiency discourages the decarboxylation of propionyl-CoA to acetyl-CoA, and consequently leads to a higher fraction of hydroxyvalerate-compared to hydroxybutyrate-containing polyhydroxyalkanoates [176]. P-limitation to sustain growth increases productivity [176]. P-starvation has been proposed for high polyhydroxybutyrate formation because of the lower toxicity of C. necator to NH4OH compared to NaOH [177].
Several clostridia have been studied for solvent production under P-limited conditions. Under P-limited conditions at the low growth rate of 0.03 h−1, C. acetobutylicum generates predominantly acetate and butyrate at a pH of 6.0 (more than 90% of products, mole basis), but butanol and acetone at pH 4.3 (87% of total) [178]. This result correlates with changes in observed activities of the enzymes associated pathways, in particular decreased activity in acetate and butyrate-forming enzymes at low pH. Under P-limited conditions at all pH values examined, Clostridium pasteurianum accumulates exclusively acetate and butyrate from glucose but ethanol, butanol, and 1,3-propanediol from glycerol [179]. With Clostridium butyricum, the greatest H2 production is found under P-limited conditions [180]. An extended P-limited process of a C. acetobutylicm engineered for butanol production continuously generated 10 g/L butanol at a stable 14 g/L·h productivity and 0.15 g/g yield [181]. A strain with deletions in the butyrate pathway generated 32-fold greater butanol and the unusual products 2-hydroxy-valerate and 2-keto-valerate under P-limited conditions [182].
E. coli has a P yield coefficient of 36 g/g [78], while an E. coli arginine auxotroph shows a yield coefficient (YX/P) of 34 g/g (Table 1) [79]. The P yield coefficient of Pseudomonas C is 28 g/g [83].
Because many carbohydrate metabolites and ATP are phosphorylated, P-limitation likely causes cells to conserve glycolytic metabolites, phosphate ion, and ATP. P-starvation indeed quickly lowers cell adenylate energy charge [183]. We expect P-limited conditions would be uniquely impactful for biochemicals utilizing ATP or having a dephosphorylation near the final step of the production pathway.
5.3. Sulfur
Sulfur is present in the amino acids methionine and cysteine, and important metabolites such as S-adenosylmethionine, Coenzyme A (CoA), and lipoic acid. In most media, S is supplied as the sulfate ion, and thus, S-limitation is often studied specifically as sulfate-limitation.
Unsurprisingly, S-limited growth leads to increased transcription of proteins encoding for the uptake of sulfur, such as in S. cerevisiae [141], E. coli [184]. Under S-limitation or S-starvation, several organisms preferentially express proteins having a low sulfur content [10,141,185,186]. For example, under S-limitation, S. cerevisiae upregulates by as great as 50-fold the PDC6 transcript expressing a protein with only 6 sulfur-containing amino acids compared to isozymes PDC1 and PDC5 having 17–18 sulfur-containing amino acids [141], while K. aerogenes maintains lower protein content in the cell wall under S-limitation compared to other nutrient-limited conditions, and this remaining protein contains a low sulfur content [187]. The ABC transporter sulfate-binding proteins of Salmonella typhimurium and E. coli responsible for sulfate uptake in a low S environment themselves contain no sulfur [188]. When Pseudomonas putida encounters S-depletion, it replaces proteins having high S content with proteins having lower amounts of cysteine and methionine [86]. K. aerogenes also excretes proteins lacking S when grown under S-limited conditions on glucose [161]. This phenomenon has been observed in many microbes, including cyanobacteria [186]. In transitioning between S-limitation and S-enrichment, cells must synthesize new RNA, whereas under C-limitation, the cells use previously synthesized translation machinery, including inactive ribosomes [156,189].
In E. coli, S-starvation resulted in a 2.8-fold greater glucose uptake rate than N-starvation, and 40% greater glucose uptake rate than P-starvation, but about 70% less than the glucose uptake rate observed during Mg-starvation [190]. In B. subtilis, S-starvation resulted in identical glucose uptake rates as observed during N-, P-starved conditions [190]. S-limitation in E. coli led to secretion of pyruvate (yield of 0.33 g/g), succinate (0.11 g/g), and acetate (0.10 g/g) despite the aerobic conditions [190]. S-limited chemostat cultures of K. aerogenes also secreted more pyruvate than N-, P- or C-limited growth on glucose [161], while S-limited chemostat cultures of K. aerogenes (formerly Aerobacter aerogenes) at high growth rate (0.42 h−1) showed pyruvate and 2-oxoglutarate accumulation [191]. These observations may be explained by comparing a typical protein (~3% S content by mass) to the sulfur-containing cofactors CoA-SH (4.2% S), lipoic acid (31.1% S), and thiamine pyrophosphate (7.5% S). Each one of these cofactors is a component of the subsequent pyruvate/2-oxoglutarate dehydrogenase step, and the limitation of these cofactors would likely limit metabolic conversion of pyruvate under S-limited conditions [191]. Further evidence identifies lipoic acid as the predominant limiting factor [192]. Interestingly, in contrast to growth on glucose which generated pyruvate and acetate, acetate was the only significant product when K. aerogenes was grown on glycerol, mannitol or lactate under S-limited conditions [161].
S-limitation appears to favor plasmid stability compared to C-, N- or P-limitation, particularly at high growth rate [193]. This observation was attributed to the fact that among these four nutrients, only S is not a constituent of nucleic acids. S-starvation resulted in the greatest mevalonate yield from glucose (0.6 mol/mol) compared to Mg-, P- or N-starvation [194,195]. S-starvation (referred to as MgSO4 limitation) increased limonene formation by E. coli [196]. Similarly, lipid formation elevated when the oleaginous yeast Rhodosporidium toruloides became starved for S [197]. The fluxes through the TCA cycle and toward acetate formation were suppressed by S-starvation, and the pentose phosphate pathway appears to be the principal route for NADPH generation [194].
The majority of ribosomal RNA synthesized during S-limitation is believed not to become functional for protein synthesis even after enrichment suggesting that S-limited cultures have limited reserved biosynthetic capability [189]. Hydrogen photoproduction can be prolonged in the green alga Chlamydomonas reinhardtii by sulfate starvation [198,199]. Sulfate starvation inactivates photosystem II, resulting in the cells consuming available O2, experiencing anaerobic conditions, and inducing hydrogenases which generate H2 and sustain the electron transport process [200,201]. Cell viability of microalgae Chlorella is more sensitive to nitrogen and phosphate starvation compared to sulfur for production of starch on a large scale [202]. S-starvation leads to the largest carbohydrate content (46.8%) in microalgae Choleralla sorokiniana compared to control (2.6%) and is preferred over N- or P-limitation for starch production from algae [203].
A sulfur yield YX/S of 243 g/g has been reported for P. putida after 80 min of S-starvation (Table 1, [86]). In studies using chemostats with different limiting nutrients, the S yield coefficient of E. coli cells under sulfur limitation (YX/S) was 278 g/g at a dilution rate of 0.45 h−1 [78], and 163 g/g with an arginine auxotroph at 0.4 h−1 [79].
5.4. Magnesium
Magnesium is an integral component of ribosomes [204], and stabilizes the outer membrane in Gram-negative prokaryotes through the creation of ionic bridges [205]. The element as Mg2+ is also involved in DNA stability and repair [206], and it plays an important role as an enzyme cofactor. Many complex medium formulations supplemented with carbon source (such as “Lysogeny Broth” medium) become starved for Mg, and can lead to protein acetylation at lysine residues [207]. There have been a few reports on cellular Mg composition (Table 1), and the yield coefficient is highly dependent on cell growth rate. For example, under Mg-limited conditions, K. aerogenes showed a yield coefficient of 347–832 g/g (YX/Mg), with the lowest yields occurring at the highest dilution rates [88], while E. coli showed a YX/Mg of 278 g/g at a dilution rate of 0.4 h−1, although cell lysis was reported [79]. Similarly, for B. subtilis under Mg-limited conditions, the yield coefficient was 714 g/g at a dilution rate of 0.1 h−1, and 390 g/g at a dilution rate of 0.6 h−1 [87]. S. cerevisiae also showed a much greater Mg requirement at higher growth rates in chemostat [208].
Mg-starvation causes E. coli cells to restructure the outer membrane and redistribute Mg [209,210]. Although the yield coefficient decreased with increasing dilution rate, Mg-limited K. aerogenes cultures do not synthesize intracellular polysaccharides, which is attributed to an impaired ability to synthesize these materials when Mg is limiting [88]. Mg-limitation results in larger and filamentous E. coli cells [211,212]. Within 400 steady-state Mg-limited generations, mutations arise in genes involved in the cell-membrane in E. coli [209]. Under Mg-limited conditions, both yeast [213] and bacteria [209] reduce the surface hydrophobicity of the lipopolysaccharide (LPS) component of the outer membrane, likely by increasing the proportion of polar sugar residues in the LPS, such that lower amounts of Mg are needed for stabilization of the LPS. Consequently, S. cerevisiae shows reduced ability to flocculate under Mg-limitation [213]. When Gram-negative and Gram-positive bacteria were grown together under Mg-limited conditions, Gram-negative bacteria invariably overtook the culture, suggesting that Gram-negative bacteria have a more efficient Mg uptake process, or in other words, a lower value for the saturation constant, KS [214]. Interestingly, B. subtilis exhibits very low incidence of sporulation under P- or Mg-limited conditions compared to carbon- or N-limited conditions [215]. During hyperosmotic stress in B. subtilis, cells respond by exporting Mg2+ ions to import the K+ ion. However, the decrease in free intracellular Mg2+ influences energy intensive processes including translation that requires magnesium as a cofactor [216].
There is some research on the effect of Mg-starvation on product formation, and this work is usually conducted in batch studies using a medium in which Mg is depleted prior to the depletion of other nutrients (i.e., starvation). No research was found on the effect of Mg-limitation on product formation. In peptide based medium, Mg-starvation leads to accumulation of acetyl-CoA which is converted to acetyl-phosphate to regenerate CoA for the cellular metabolism [207]. Mg-starvation has been shown to improve butanol formation by C. acetobutylicum [217], particularly in the presence of excess zinc. Similarly, a lowered Mg concentration in the second phase of a two-phase fed-batch process increased final butanol titer by 25% using C. acetobutylicum [218], a result attributed to ATP demand. In xanthan-producing Xanthomonas campestris, restriction of Mg in the medium decreases polysaccharide formation [219], a result attributed to low activity of phosphomannose isomerase. Resuspending a centrifuged culture into a medium lacking Mg, compared to other nutrients, led to the greatest glucose uptake rate and production rates of 3-hydroxypropionate and the flavonoid naringenin [220], thought to be due to a high intracellular PEP concentration and lowered flux through Mg-requiring pyruvate kinase. Mg-depletion during growth also elevated tyrosine and mevalonate formation [195], though compared to S-starvation, Mg-starvation showed lower mevalonate, which was attributed to elevated acetate formation and low NADPH formation because of reduced flux through the pentose phosphate pathway [194]. In comparing E. coli cultures from which noncarbon nutrients were depleted before glucose, Mg-starvation showed the greatest glucose consumption rate [190]. This very high glucose consumption rate was accompanied by substantial pyruvate formation (0.74 g/g yield) and an increased PEP pool, effects which were attributed to inactivation of pyruvate dehydrogenase when Mg was depleted [190]. These results could not be explained solely by energy demand, unless the lack of Mg inhibits ATP synthase or increases membrane fluidity. Given that Mg limitation affects membrane structure, it is intriguing to speculate how Mg-limitation impacts not only oxidative phosphorylation, but also the cell’s ability to transport certain products.
Considering the central role that magnesium plays in the cell membrane and in enzymatic conversions involving ATP, the lack of significant research on Mg-limited process for the accumulation of biochemicals is surprising. We envision metabolic circuits involving magnesium which leverage the unique role this ion plays in metabolism.
5.5. Iron
Iron is a common element which exists in two cationic oxidation states, and the element often plays a central role in cellular redox processes, and is also critical in strategies pathogens use to infect their hosts [221,222]. Under aerobic conditions and neutral pH, the ferric ion (Fe3+) is the principal natural form of iron, a species with low aqueous solubility and the potential to promote the formation of reactive oxygen species. Fe-responsive regulation is often mediated by the Fe-dependent transcriptional factor called Fur. Under conditions of Fe-starvation or Fe-limitation and to ameliorate low Fe biological availability, Fur-based repression is typically relieved, resulting in the expression of numerous genes involved in secreting Fe-chelators, siderophores, and high-affinity siderophore outer-membrane receptors [71,223,224,225]. Fur also regulates the small RNAs which repress genes under Fe-limited conditions [226]. Fur regulated aerobic ribonucleotide reductases encoded by nrdE and nrdF are manganese-dependent and become active under Fe-starvation [227,228]. Many bacteria also possess an Fe2+ transport system, Feo, which is induced and important for survival under anaerobic conditions in which Fe2+ is stable [229,230].
Consistent with the theme of cells conserving limited resources, Fe-limitation causes cells to reduce their reliance on pathways which contain significant Fe, such as the tricarboxylic acid cycle (aconitase, fumarate hydratase, succinate dehydrogenase) and the proton-pumping components of the electron transport chain [71,231,232]. This realignment of metabolism has physiological consequences. For example, under Fe-limiting aerobic conditions, E. coli generates acetate at a yield of 0.25 g/g at a dilution rate of 0.4 h−1, but accumulates predominantly lactate (yield of 0.60 g/g) at 0.1 h−1 [71]. Elevated lactate under the most severe steady-state Fe-limitation provides cells a means to oxidize NADH when the Fe-requiring Nuo complex is curtailed, while an increased glucose uptake rate serves to meet ATP demand [71]. Lactate formation is also observed for Staphylococcus aureus exposed to Fe-starvation [233]. The reduction in activity of TCA cycle enzymes and accumulation of NADH encourages the formation of ethyl acetate by Kluyveromyces marxianus [234] and Candida utilis [235]. Because of the restricted capacity of the electron transport chain subject to Fe-limited conditions, cells essentially behave like they are encountering anaerobic conditions. For example, E. coli accumulates acetate and formate under Fe-limited steady-state conditions, attains a 60% greater glycolytic flux, and reduces by a factor of 5 the fraction of glucose entering the TCA cycle [236]. More generally, Fe-limitation impacts oxygenation and redox state because numerous electron-carrying enzymes contain Fe-S clusters, and many Fe-containing enzymes or pathways are constrained under Fe-limitation. For example, the nitrogenase enzyme system contains significant Fe [237], and Fe-limitation thus severely reduces nitrogen fixation by Azotobacter vinelandii [238]. Notably, lactic acid bacteria, which lack cytochrome and show generally high tolerance to peroxide, do not require iron for growth at all [239,240].
Iron strongly affects anaerobes, which have many Fe-containing enzymes. Under Fe-limited conditions, C. acetobutylicum favors from glucose the formation of butanol over acetone at low pH, but the formation of lactate at a pH greater than 5.5 [241], presumably because of the Fe-containing enzymes associated with the conversion of pyruvate to acetyl-CoA (pyruvate:ferredoxin oxidoreductase) and acetoacetate to acetone (acetoacetate decarboxylase). In addition, Fe-limitation leads to a significant reduction in hydrogenase activity [242]. Similarly, for C. pasteurianum, Fe-limited conditions favor lactate generation from glucose but 1,3-propanediol from glycerol [179]. The transition between butanol (Fe-excess) and 1,3-propanediol (Fe-limited) from glycerol is attributed to the coupling of H2-formation to the ferredoxin-dependent butyryl-CoA dehydrogenase [243]. Fe-limitation causes C. pasteurianum to substitute ferredoxin with flavodoxin [244], and flavodoxin is often used as an indicator for the lack of Fe availability [245].
One of the more prevalent transition metals found in many cells (as noted above, YX/Fe of 5000–7000 g/g under Fe-excess conditions [72]), Fe exemplifies a cofactor found in several specific enzymes that impact metabolic fluxes. A yield coefficient of 1690 g/g was reported under Fe-limited conditions [83]. E. coli growing at a dilution rate of 0.45 h−1 under Fe-limited conditions showed a yield coefficient of 7700 g/g [78].
6. Conclusions
Over the last couple decades, research has focused on using metabolic engineering strategies to generate products. These strategies emphasize redirecting fluxes through modification of the metabolic network of reactions, including optimizing native pathways, expressing genes to code for introduced pathways, and statically or dynamically controlling metabolism to redirect carbon to the desired product. Operational strategies have played a secondary role, and are usually limited to repeated batch processes to attain a high titer or introducing microaerobic conditions for biochemically reduced products. However, limiting a specific nutrient can have profound effects on microbial physiology and metabolic pathways. We propose that the growth under nutrient limitation can leverage the native or introduced pathways, which should encourage re-examination of operational strategies. For example, fluxes through competing pathways can be modulated by a nutrient required as a cofactor for one of the designed pathways. Thus, synthetic pathways and circuits can be constructed which by design are regulated by a single nutrient limitation. These include (1) substituting native pathways with enzymes requiring metal ions as cofactors, and which could serve as a control valve to partition flux under the limitation of that metal ion, and (2) designing pathways or metabolic processes which are induced by nutrient limitation.
Funding
This research received no external funding.
Conflicts of Interest
The authors declare no conflict of interest.
References
- Gaden, E.L., Jr. Bioengineering and fermentation. Appl. Microbiol. 1960, 8, 123–131. [Google Scholar] [CrossRef] [PubMed]
- Maxon, W.D. Continuous fermentation: A discussion of its principles and applications. Appl. Microbiol. 1955, 3, 110–120. [Google Scholar] [CrossRef] [PubMed]
- Yoshida, F.; Yamane, T.; Nakamoto, K.-I. Fed-batch hydrocarbon fermentation with colloidal emulsion feed. Biotechnol. Bioeng. 1973, 15, 257–270. [Google Scholar] [CrossRef]
- Pirt, S.J. The theory of fed batch culture with reference to the penicillin fermentation. J. Appl. Chem. Biotechnol. 1974, 24, 415–424. [Google Scholar] [CrossRef]
- Fox, M.S. A device for growing bacterial populations under steady state conditions. J. Gen. Physiol. 1955, 39, 261–266. [Google Scholar] [CrossRef] [PubMed] [Green Version]
- Maxon, W.D. Continuous fermentation. Ind. Eng. Chem. 1960, 52, 64–65. [Google Scholar] [CrossRef]
- Paalme, T.; Kahru, A.; Elken, R.; Vanatalu, K.; Tiisma, K.; Vilu, R. The computer-controlled continuous culture of Escherichia coli with a smooth change in dilution rate (A-stat). J. Microbiol. Meth. 1995, 24, 145–153. [Google Scholar] [CrossRef]
- Schmideder, A.; Weuster-Botz, D. High-performance recombinant protein production with Escherichia coli in continuously operated cascades of stirred-tank reactors. J. Ind. Microbiol. Biotechnol. 2017, 44, 1021–1029. [Google Scholar] [CrossRef]
- Adamberg, K.; Valgepea, K.; Vilu, R. Advanced continuous cultivation methods for systems microbiology. Microbiology 2015, 161, 1707–1719. [Google Scholar] [CrossRef]
- Merchant, S.S.; Helmann, J.D. Elemental economy: Microbial strategies for optimizing growth in the face of nutrient limitation. Adv. Microb. Physiol. 2012, 60, 91–210. [Google Scholar] [CrossRef]
- Yamanè, T.; Shimizu, S. Fed-batch techniques in microbial processes. In Bioprocess Parameter Control Advances in Biochemical Engineering/Biotechnology; Springer: Berlin/Heidelberg, Germany, 1984; Volume 30, pp. 147–194. [Google Scholar] [CrossRef]
- Mahmoodi, M.; Nassireslami, E. Control algorithms and strategies of feeding for fed-batch fermentation of Escherichia coli: A review of 40 years of experience. Prep. Biochem. Biotechnol. 2022, 52, 823–834. [Google Scholar] [CrossRef] [PubMed]
- Monod, J. Recherches sur la Croissance des Cultures Bactériennes; Hermann et Cie: Paris, France, 1942. [Google Scholar]
- Monod, J. The growth of bacterial cultures. Annu. Rev. Microbiol. 1949, 8, 371–374. [Google Scholar] [CrossRef] [Green Version]
- Senn, H.; Lendenmann, U.; Snozzi, M.; Hamer, G.; Egli, T. The growth of Escherichia coli in glucose-limited chemostat cultures: A re-examination of the kinetics. Biochim. Biophys. Acta 1994, 1201, 424–436. [Google Scholar] [CrossRef]
- Rutgers, M.; Teixeira De Mattos, M.J.; Postma, P.W.; Van Dam, K. Establishment of the steady state in glucose-limited chemostat cultures of Klebsiella pneumoniae. J. Gen. Microbiol. 1987, 133, 445–451. [Google Scholar] [CrossRef] [PubMed] [Green Version]
- Shehata, T.E.; Marr, A.G. Effect of nutrient concentration on the growth of Escherichia coli. J. Bacteriol. 1971, 107, 210–216. [Google Scholar] [CrossRef] [PubMed] [Green Version]
- Jannasch, H.W. Competitive elimination of Enterobacteriaceae from seawater. Appl. Microbiol. 1968, 16, 1616–1618. [Google Scholar] [CrossRef]
- Dykhuizen, D. Selection for tryptophan auxotrophs of Escherichia coli in glucose-limited chemostats as a test of the energy conservation hypothesis of evolution. Evolution 1978, 32, 125–150. [Google Scholar] [CrossRef]
- Ishida, Y.; Imai, I.; Miyagaki, T.; Kadota, H. Growth and uptake kinetics of a facultatively oligotrophic bacterium at low nutrient concentrations. Microb. Ecol. 1982, 8, 23–32. [Google Scholar] [CrossRef]
- Owens, J.D.; Legan, J.D. Determination of the Monod substrate saturation constant for microbial growth. FEMS Microbiol Rev. 1987, 46, 419–432. [Google Scholar] [CrossRef]
- Novick, A.; Szilard, L. Experiments with the chemostat on spontaneous mutations on bacteria. Proc. Natl. Acad. Sci. USA 1950, 36, 708–719. [Google Scholar] [CrossRef] [Green Version]
- Ziv, N.; Brandt, N.J.; Gresham, D. The Use of Chemostats in Microbial Systems Biology. J. Vis. Exp. 2013, 80, e50168. [Google Scholar] [CrossRef] [PubMed] [Green Version]
- Lameiras, F.; Heijnen, J.J.; van Gulik, W.M. Development of tools for quantitative intracellular metabolomics of Aspergillus niger chemostat cultures. Metabolomics 2015, 11, 1253–1264. [Google Scholar] [CrossRef] [PubMed] [Green Version]
- Egli, T. Microbial growth and physiology: A call for better craftsmanship. Front. Microbiol. 2015, 6, 287. [Google Scholar] [CrossRef] [PubMed]
- Herbert, D.; Elsworth, R.; Telling, R.C. The continuous culture of bacteria; a theoretical and experimental study. J. Gen. Microbiol. 1956, 14, 601–622. [Google Scholar] [CrossRef] [Green Version]
- Powell, E.O. Criteria for the growth of contaminants and mutants in continuous culture. J. Gen. Microbiol. 1958, 18, 259–268. [Google Scholar] [CrossRef] [Green Version]
- Rosenzweig, R.F.; Sharp, R.R.; Treves, D.S.; Adams, J. Microbial evolution in a simple unstructured environment: Genetic differentiation in Escherichia coli. Genetics 1994, 137, 903–917. [Google Scholar] [CrossRef]
- Weikert, C.; Sauer, U.; Bailey, J.E. Use of a glycerol-limited, long-term chemostat for isolation of Escherichia coli mutants with improved physiological properties. Microbiology 1997, 143, 1567–1574. [Google Scholar] [CrossRef] [Green Version]
- Bull, A.T. The renaissance of continuous culture in the post-genomics age. J. Ind. Microbiol. Biotechnol. 2010, 37, 993–1021. [Google Scholar] [CrossRef]
- Wick, L.M.; Weilenmann, H.; Egli, T. The apparent clock-like evolution of Escherichia coli in glucose-limited chemostats is reproducible at large but not at small population sizes and can be explained with Monod kinetics. Microbiology 2002, 148, 2889–2902. [Google Scholar] [CrossRef]
- Jansen, M.L.A.; Diderich, J.A.; Mashego, M.; Hassane, A.; de Winde, J.H.; Pascale, D.-L.; Pronk, J.T. Prolonged selection in aerobic, glucose-limited chemostat cultures of Saccharomyces cerevisiae causes a partial loss of glycolytic capacity. Microbiology 2005, 151, 1657–1669. [Google Scholar] [CrossRef] [Green Version]
- Gresham, D.; Hong, J. The functional basis of adaptive evolution in chemostats. FEMS Microbiol. Rev. 2015, 39, 2–16. [Google Scholar] [CrossRef] [PubMed] [Green Version]
- Brickwedde, A.; van den Broek, M.; Geertman, J.-M.A.; Magalhães, F.; Kuijpers, N.G.A.; Gibson, B.; Pronk, J.T.; Daran, J.-M.G. Evolutional engineering in chemostat cultures for improved maltotriose fermentation kinetics in Saccharomyces pastorianus lager brewing yeast. Front. Microbiol. 2017, 8, 1690. [Google Scholar] [CrossRef] [PubMed] [Green Version]
- van Maris, A.J.A.; Geertman, J.-M.A.; Vermeulen, A.; Groothuizen, M.K.; Winkler, A.A.; Piper, M.D.W.; van Dijken, J.P.; Pronk, J.T. Directed evolution of pyruvate decarboxylase-negative Saccharomyces cerevisiae, yielding a C2-independent, glucose-tolerant, and pyruvate-hyperproducing yeast. Appl. Environ. Microbiol. 2004, 70, 159–166. [Google Scholar] [CrossRef] [PubMed] [Green Version]
- Arensdorf, J.J.; Loomis, A.K.; DiGarazia, P.M.; Monticello, D.J.; Piendos, P.T. Chemostat approach for the directed evolution of biodesulfurization gain-of-function mutants. Appl. Environ. Microbiol. 2002, 68, 691–698. [Google Scholar] [CrossRef] [PubMed] [Green Version]
- Maharjan, R.P.; Ferenci, T.A. shifting mutational landscape in 6 nutritional states: Stress-induced mutagenesis as a series of distinct stress input-mutation output relationships. PLoS Biol. 2017, 15, e2001477. [Google Scholar] [CrossRef] [PubMed] [Green Version]
- Schreiber, F.; Littmann, S.; Lavik, G.; Escrig, S.; Meibom, A.; Kuypers, M.M.M.; Ackermann, M. Phenotypic heterogeneity driven by nutrient limitation promotes growth in fluctuating environments. Nat. Microbiol. 2016, 1, 16055. [Google Scholar] [CrossRef] [PubMed] [Green Version]
- Cooney, C.L.; Wang, D.I. Transient response of Enterobacter aerogenes under a dual nutrient limitation in a chemostat. Biotechnol. Bioeng. 1978, 18, 189–198. [Google Scholar] [CrossRef]
- Egli, T. On multiple-nutrient-limited growth of microorganisms, with special reference to dual limitation by carbon and nitrogen substrates. Antonie Van Leeuwenhoek 1991, 60, 225–234. [Google Scholar] [CrossRef]
- Egli, T.; Zinn, M. The concept of multiple-nutrient-limited growth of microorganisms and its application in biotechnological processes. Biotechnol. Adv. 2003, 22, 35–43. [Google Scholar] [CrossRef]
- Zinn, M.; Witholt, B.; Egli, T. Dual nutrient limited growth: Models, experimental observations and applications. J. Biotechnol. 2004, 113, 263–279. [Google Scholar] [CrossRef]
- Lis, A.V.; Schneider, K.; Weber, J.; Keasling, J.D.; Jensen, M.K.; Klein, T. Exploring small-scale chemostats to scale up microbial processes: 3-hydroxypropionic acid production in S. cerevisiae. Microb. Cell Factories 2019, 18, 50. [Google Scholar] [CrossRef] [PubMed]
- Peebo, K.; Neubauer, P. Application of continuous culture methods to recombinant protein production in microorganisms. Microorganisms 2018, 6, 56. [Google Scholar] [CrossRef] [PubMed] [Green Version]
- Eiteman, M.A.; Altman, E. Overcoming acetate in Escherichia coli recombinant protein fermentations. Trends Biotechnol. 2006, 24, 530–536. [Google Scholar] [CrossRef] [PubMed]
- Trilli, A.; Michelini, V.; Mantovani, V.; Pirt, S.J. Estimation of productivities in repeated fed-batch cephalosporin fermentation. J. Appl. Chem. Biotechnol. 1977, 27, 219–224. [Google Scholar] [CrossRef]
- Yano, T.; Kurokawa, M.; Nishizawa, Y. Optimum substrate feed rate in fed-batch culture with the DO-stat method. J. Fermentation Bioeng. 1991, 71, 345–349. [Google Scholar] [CrossRef]
- Hu, Z.-C.; Zheng, Y.-G.; Shen, Y.-C. Dissolved-oxygen-stat fed-batch fermentation of 1,3-dihydroxyacetone from glycerol by Gluconobacter oxydans ZJB09112. Biotechnol. Bioprocess Eng. 2010, 15, 651–656. [Google Scholar] [CrossRef]
- Jørgensen, H.; Olsson, L.; Rønnow, B.; Palmqvist, E.A. Fed-batch cultivation of baker’s yeast followed by nitrogen or carbon starvation: Effects on fermentative capacity and content of trehalose and glycogen. Appl. Microbiol. Biotechnol. 2002, 59, 310–317. [Google Scholar] [CrossRef]
- Shang, L.; Jiang, M.; Chang, H.N. Poly(3-hydroxybutyrate) synthesis in fed-batch culture of Ralstonia eutropha with phosphate limitation under different glucose concentrations. Biotechnol. Lett. 2003, 25, 1415–1419. [Google Scholar] [CrossRef]
- Shen, X.-F.; Liu, J.-J.; Chauhan, A.S.; Hu, H.; Ma, L.-L.; Lam, P.K.S.; Zeng, R.J. Combining nitrogen starvation with sufficient phosphorus supply for enhanced biodiesel productivity of Chlorella vulgaris fed on acetate. Algal Res. 2016, 17, 261–267. [Google Scholar] [CrossRef]
- Kim, H.M.; Chae, T.U.; Choi, S.Y.; Kim, W.J.; Lee, S.Y. Engineering of an oleaginous bacterium for the production of fatty acids and fuels. Nat. Chem. Biol. 2019, 15, 721–729. [Google Scholar] [CrossRef]
- Nayak, M.; Suh, W.I.; Chang, Y.K.; Lee, B. Exploration of two-stage cultivation strategies using nitrogen starvation to maximize the lipid productivity in Chlorella sp. HS2. Bioresour. Technol. 2019, 276, 110–118. [Google Scholar] [CrossRef] [PubMed]
- Pirt, S.J. Fed-batch culture of microbes. Ann. N. Y. Acad. Sci. 1979, 326, 119–125. [Google Scholar] [CrossRef]
- Dunn, I.J.; Mor, J.-R. Variable-volume continuous cultivation. Biotechnol. Bioeng. 1975, 17, 1805–1822. [Google Scholar] [CrossRef]
- Korz, D.J.; Rinas, U.; Helmuth, K.; Sanders, E.A.; Deckwer, W.-D. Simple fed-batch technique for high cell density cultivation of Escherichia coli. J. Biotechnol. 1995, 39, 59–65. [Google Scholar] [CrossRef]
- Lee, S.Y.; Chang, H.N. Production of poly(3-hydroxybutyric acid) by recombinant Escherichia coli strains: Genetic and fermentation studies. Can. J. Microbiol. 1995, 41, 207–215. [Google Scholar] [CrossRef] [PubMed]
- Riesenberg, D.; Schulz, V.; Knorre, W.A.; Pohl, H.-D.; Korz, D.; Sanders, E.A.; Roß, A.; Deckwer, W.-D. High cell density cultivation of Escherichia coli at controlled specific growth rate. J. Biotechnol. 1991, 20, 17–28. [Google Scholar] [CrossRef]
- Neijssel, O.M.; Tempest, D.W. The role of energy-spilling reactions in the growth of Klebsiella aerogenes NCTC 418 in aerobic chemostat culture. Arch. Microbiol. 1976, 110, 305–311. [Google Scholar] [CrossRef]
- van Bodegom, P. Microbial Maintenance: A critical review on its quantification. Microb. Ecol. 2007, 53, 513–523. [Google Scholar] [CrossRef] [Green Version]
- Förberg, C.; Häggström, L. Effects of cultural conditions on the production of phenylalanine from a plasmid-harboring E. coli strain. Appl. Microbiol. Biotechnol. 1987, 26, 136–140. [Google Scholar] [CrossRef]
- Werner-Washburne, M.; Braun, E.L.; Crawford, M.E.; Peck, V.M. Stationary phase in Saccharomyces cerevisiae. Mol. Microbiol. 1996, 19, 1159–1166. [Google Scholar] [CrossRef]
- Gasch, A.P.; Werner-Washburne, M. The genomics of yeast responses to environmental stress and starvation. Funct. Integr. Genom. 2002, 2, 181–192. [Google Scholar] [CrossRef] [PubMed]
- Peterson, C.N.; Mandel, M.J.; Silhavy, T.J. Escherichia coli starvation diets: Essential nutrients weigh in distinctly. J. Bacteriol. 2005, 187, 7549–7553. [Google Scholar] [CrossRef] [PubMed] [Green Version]
- Brauner, M.J.; Yuan, J.; Bennett, B.D.; Lu, W.; Kimball, E.; Botstein, D.; Rabinowitz, J.D. Conservation of the metabolomic response to starvation across two divergent microbes. Proc. Natl. Acad. Sci. USA 2006, 103, 19302–19307. [Google Scholar] [CrossRef] [PubMed] [Green Version]
- Minihane, B.J.; Brown, D.E. Fed-batch culture technology. Biotechnol. Adv. 1986, 4, 207–218. [Google Scholar] [CrossRef]
- Vázquez-Lima, F.; Silva, P.; Barreiro, A.; Martínez-Moreno, R.; Morales, P.; Quirós, M.; González, R.; Albiol, J.; Ferrer, P. Use of chemostat cultures mimicking different phases of wine fermentations as a tool for quantitative physiological analysis. Microb. Cell Factories 2014, 13, 85. [Google Scholar] [CrossRef] [PubMed] [Green Version]
- Varrone, C.; Skiadasa, I.V.; Gavala, H.N. Effect of hydraulic retention time on the modelling and optimization of joint 1,3 PDO and BuA production from 2G glycerol in a chemostat process. Chem. Eng. J. 2018, 347, 525–534. [Google Scholar] [CrossRef] [Green Version]
- Zhang, Y.; Xiong, H.; Chen, Z.; Fu, Y.; Xu, Q.; Chen, N. Effect of fed-batch and chemostat cultivation processes of C. glutamicum CP for L-leucine production. Bioengineered 2021, 12, 426–439. [Google Scholar] [CrossRef]
- Folsom, J.P.; Carlson, R.P. Physiological, biomass elemental composition and proteomic analyses of Escherichia coli ammonium-limited chemostat growth, and comparison with iron- and glucose-limited chemostat growth. Microbiology 2015, 161, 1659–1670. [Google Scholar] [CrossRef] [Green Version]
- Folsom, J.P.; Parker, A.E.; Carlson, R.P. Physiological and proteomic analysis of Escherichia coli iron-limited chemostat growth. J. Bacteriol. 2014, 196, 2748–2761. [Google Scholar] [CrossRef]
- Abdul-Tehrani, H.; Hudson, A.J.; Chang, Y.-S.; Timms, A.R.; Hawkins, C.; Harrison, P.M.; Guest, J.R.; Andrews, S.C. Ferritin mutants of Escherichia coli are iron deficient and growth impaired, and fur mutants are iron deficient. J. Bacteriol. 1999, 181, 1415–1428. [Google Scholar] [CrossRef] [Green Version]
- Schulze, U.; Lidén, G.; Villadsen, J. Dynamics of ammonia uptake in nitrogen limited anaerobic cultures of Saccharomyces cerevisiae. J. Biotechnol. 1996, 46, 33–42. [Google Scholar] [CrossRef]
- Henriques, D.; Balsa-Canto, E. The Monod model is insufficient to explain biomass growth in nitrogen-limited yeast fermentation. Appl. Environ. Microbiol. 2021, 87, e01084-21. [Google Scholar] [CrossRef] [PubMed]
- Chrzanowski, T.H.; Grover, J.P. Element content of Pseudomonas fluorescens varies with growth rate and temperature: A replicated chemostat study addressing ecological stoichiometry. Limnol. Oceanogr. 2008, 53, 1242–1251. [Google Scholar] [CrossRef]
- Kuhn, H.; Friederich, U.; Fiechter, A. Defined minimal medium for a thermophilic Bacillus sp. developed by a chemostat pulse and shift technique. Eur. J. Appl. Microbiol. 1979, 6, 341–349. [Google Scholar] [CrossRef]
- Dauner, M.; Storni, T.; Sauer, U. Bacillus subtilis metabolism and energetics in carbon-limited and excess-carbon chemostat culture. J. Bacteriol. 2001, 183, 7308–7317. [Google Scholar] [CrossRef] [Green Version]
- Reiling, H.E.; Laurila, H.; Fiechter, A. Mass culture of Escherichia coli: Medium development for low and high density cultivation of Escherichia coli B/r in minimal and complex media. J. Biotechnol. 1985, 2, 191–206. [Google Scholar] [CrossRef]
- Yee, L.; Blanch, H.W. Defined media optimization for growth of recombinant Escherichia coli X90. Biotechnol. Bioeng. 1993, 41, 221–230. [Google Scholar] [CrossRef]
- Moxley, W.C.; Eiteman, M.A. Pyruvate production by Escherichia coli using pyruvate dehydrogenase variants. Appl. Environ. Microbiol. 2021, 87, e00487-21. [Google Scholar] [CrossRef]
- Bauer, S.; Ziv, E. Dense growth of aerobic bacteria in a bench-scale fermentor. Biotechnol. Bioeng. 1976, 18, 81–94. [Google Scholar] [CrossRef]
- Linton, J.D.; Austin, R.M.; Haugh, D.E. The kinetics and physiology of stipitatic acid and gluconate production by carbon sufficient cultures of Penicillium stipitatum growing in continuous culture. Biotechnol. Bioeng. 1984, 26, 1455–1464. [Google Scholar] [CrossRef]
- Mateles, R.I.; Battat, E. Continuous culture used for media optimization. Appl. Microbiol. 1974, 28, 901–905. [Google Scholar] [CrossRef] [PubMed]
- Sun, Z.; Ramsay, J.A.; Guay, M.; Ramsay, B.A. Automated feeding strategies for high-cell-density fed-batch cultivation of Pseudomonas putida KT2440. Appl. Microbiol. Biotechnol. 2006, 71, 423–431. [Google Scholar] [CrossRef] [PubMed]
- Tempest, D.W.; Dicks, J.W.; Ellwood, D.C. Influence of growth condition on the concentration of potassium in Bacillus subtilis var. niger and its possible relationship to cellular ribonucleic acid, teichoic acid and teichuronic acid. Biochem. J. 1968, 106, 237–243. [Google Scholar] [CrossRef]
- Beil, S.; Kertesz, M.A.; Leisinger, T.; Cook, A.M. The assimilation of sulfur from multiple sources and its correlation with expression of the sulfate-starvation-induced stimulon in Pseudomonas putida S-313. Microbiology 1996, 142, 1989–1995. [Google Scholar] [CrossRef] [Green Version]
- Tempest, D.W.; Dicks, J.W.; Meers, J.L. Magnesium-limited growth of Bacillus subtilis in pure and mixed cultures, in a chemostat. J. Gen. Microbiol. 1967, 49, 139–147. [Google Scholar] [CrossRef] [Green Version]
- Tempest, D.W.; Hunter, J.R.; Sykes, J. Magnesium-limited growth of Aerobacter aerogenes in a chemostat. J. Gen. Microbiol. 1965, 39, 355–366. [Google Scholar] [CrossRef] [Green Version]
- Löser, C.; Urit, T.; Förster, S.; Stujert, A.; Bley, T. Formation of ethyl acetate Kluyveromyces marxianus on whey during aerobic batch and chemostat cultivation at iron limitation. Appl. Microbiol. Biotechnol. 2012, 96, 685–696. [Google Scholar] [CrossRef]
- Jung, K.; Hazenberg, H.; Prieto, M.; Witholt, B. Two-stage continuous process development for the production of medium-chain-length poly(3-hydroxyalkanoates). Biotechnol. Bioeng. 2001, 72, 19–24. [Google Scholar] [CrossRef]
- Dragone, G.; Fernandes, B.D.; Abreu, A.P.; Vicente, A.A.; Teixeira, J.A. Nutrient limitation as a strategy for increasing starch accumulation in microalgae. Appl. Energy 2011, 88, 3331–3335. [Google Scholar] [CrossRef]
- Richter, H.; Martin, M.E.; Angenent, L.T. A two-stage continuous fermentation system for conversion of syngas into ethanol A two-stage continuous fermentation system for conversion of syngas into ethanol. Energies 2013, 6, 3987–4000. [Google Scholar] [CrossRef] [Green Version]
- Kim, B.S.; Lee, S.C.; Lee, S.Y.; Chang, H.N.; Chang, Y.K.; Woo, S.I. Production of poly(3-hydroxybutyric-co-3-hydroxyvaleric acid) by fed-batch culture of Alcaligenes eutrophus with substrate control using on-line glucose analyzer. Enzym. Microb. Technol. 1994, 16, 556–561. [Google Scholar] [CrossRef]
- Kim, B.S.; Lee, S.C.; Lee, S.Y.; Chang, H.N.; Chang, Y.K.; Woo, S.I. Production of poly(3-hydroxybutyric acid) by fed-batch culture of Alcaligenes eutrophus with glucose concentration control. Biotechnol. Bioeng. 1994, 43, 892–898. [Google Scholar] [CrossRef] [PubMed]
- Ahn, W.S.; Park, S.J.; Lee, S.Y. Production of poly(3-hydroxybutyrate) by fed-batch culture of recombinant Escherichia coli with a highly concentrated whey solution. Appl. Environ. Microbiol. 2000, 66, 3624–3627. [Google Scholar] [CrossRef] [Green Version]
- Fogg, G.E. The ecological significance of extracellular products of phytoplankton photosynthesis. Bot. Mar. 1983, 26, 3–14. [Google Scholar] [CrossRef]
- Braakman, R.; Follows, M.; Chisholm, S.W. Metabolic evolution and the self-organization of ecosystems. Proc. Natl. Acad. Sci. USA 2017, 114, e3091–e3100. [Google Scholar] [CrossRef] [PubMed] [Green Version]
- Szul, M.J.; Dearth, S.P. Carbon fate and flux in Prochlorococcus under nitrogen limitation. mSystems 2019, 4, e00254-18. [Google Scholar] [CrossRef] [Green Version]
- Ryan, P.R.; Delhaize, E.; Jones, D.L. Function and mechanism of organic anion exudation from plant roots. Annu. Rev. Plant Physiol. Plant Mol. Biol. 2001, 52, 527–560. [Google Scholar] [CrossRef]
- Reitzer, L. Nitrogen assimilation and global regulation in Escherichia coli. Annu. Rev. Microbiol. 2003, 57, 155–176. [Google Scholar] [CrossRef]
- Hu, P.; Leighton, T.; Ishkhanova, G.; Kustu, S. Sensing of nitrogen limitation by Bacillus subtilis: Comparison to enteric bacteria. J. Bacteriol. 1999, 181, 5042–5050. [Google Scholar] [CrossRef]
- Bennett, B.D.; Kimball, E.H.; Gao, M.; Osterhout, R.; van Dien, S.J.; Rabinowitz, J.D. Absolute metabolite concentrations and implied enzyme active site occupancy in Escherichia coli. Nat. Chem. Biol. 2009, 5, 593–599. [Google Scholar] [CrossRef] [Green Version]
- Reitzer, L.J. Ammonia assimilation and the biosynthesis of glutamine, glutamate, aspartate, asparagine, L-alanine, and D-alanine. In Escherichia coli and Salmonella: Cellular and Molecular Biology; Neidhardt, F.C., Curtiss, R., III, Ingraham, J.L., Lin, E.C.C., Low, K.B., Magasanik, B., Eds.; American Society for Microbiology Press: Washington, DC, USA, 1996; pp. 391–407. [Google Scholar]
- Boer, V.M.; Crutchfield, C.A.; Bradley, P.H.; Botstein, D.; Rabinowitz, J.D. Growth-limiting intracellular metabolites in yeast growing under diverse nutrient limitations. Mol. Biol. Cell. 2010, 21, 198–211. [Google Scholar] [CrossRef] [Green Version]
- Muro-Pastor, M.I.; Reyes, J.C.; Florencio, F.J. Ammonium assimilation in cyanobacteria. Photosynth. Res. 2005, 83, 135–150. [Google Scholar] [CrossRef] [PubMed]
- Espinosa, J.; Rodriguez-Mateos, F.; Salinas, P.; Lanza, V.F.; Dixon, R.; de la Cruz, F.; Contreras, A. PipX, the coactivator of NtcA, is a global regulator in cyanobacteria. Proc. Natl. Acad. Sci. USA 2014, 111, e2423–e2430. [Google Scholar] [CrossRef] [PubMed] [Green Version]
- Chen, H.; Fink, G.R. Feedback control of morphogenesis in fungi by aromatic alcohols. Genes Devel. 2006, 20, 1150–1161. [Google Scholar] [CrossRef] [Green Version]
- Doucette, C.D.; Schwab, D.J.; Wingreen, N.S.; Rabinowitz, J.D. α-ketoglutarate coordinates carbon and nitrogen utilization via enzyme I inhibition. Nat. Chem. Biol. 2011, 7, 894–901. [Google Scholar] [CrossRef] [PubMed] [Green Version]
- Pereira, D.S.; Donald, L.J.; Hosfield, D.J.; Duckworth, H.W. Active site mutants of Escherichia coli citrate synthase. J. Biol. Chem. 1994, 269, 412–417. [Google Scholar] [CrossRef]
- Chulavatnatol, M.; Atkinson, D.E. Phosphoenolpyruvate synthetase from Escherichia coli: Effects of adenylate energy charge and modifier concentrations. J. Biol. Chem. 1973, 248, 2712–2715. [Google Scholar] [CrossRef]
- Muro-Pastor, M.I.; Reyes, J.C.; Florencio, F.J. Cyanobacteria perceive nitrogen status by sensing intracellular 2-oxoglutarate levels. J. Biol. Chem. 2001, 276, 38320–38328. [Google Scholar] [CrossRef]
- De Marsac, N.T.; Castets, A.-M.; Cohen-Bazire, G. Wavelength modulation of phycoerythrin synthesis in Synechocystis sp. 6701. J. Bacteriol. 1980, 142, 310–314. [Google Scholar] [CrossRef] [PubMed]
- Osanai, T.; Imamura, S.; Asayama, M.; Shirai, M.; Suzuki, I.; Murata, N.; Tanaka, K. Nitrogen induction of sugar catabolic gene expression in Synechocystis sp. PCC 6803. DNA Res. 2006, 13, 185–195. [Google Scholar] [CrossRef] [Green Version]
- Yoo, S.-H.; Keppel, C.; Spalding, M.; Jane, J.-L. Effects of growth condition on the structure of glycogen produced in cyanobacterium Synechocystis sp. PCC6803. Intl. J. Biol. Mol. 2007, 40, 498–504. [Google Scholar] [CrossRef] [PubMed]
- Gupta, M.; Johnson, A.; Cruz, E.; Costa, E.; Guest, R.; Li, S.H.-J.; Hart, E.M.; Nguyen, T.; Stadlmeier, M.; Bratton, B.P.; et al. Global protein-turnover quantification in Escherichia coli reveals cytoplasmic recycling under nitrogen-limitation. bioRxiv 2022. [Google Scholar] [CrossRef]
- Sauer, U.; Lasko, D.R.; Fiaux, J.; Hochuli, M.; Glaser, R.; Szyperski, T.; Wüthrich, K.; Bailey, J.E. Metabolic flux ratio analysis of genetic and environmental modulations of Escherichia coli central carbon metabolism. J. Bacteriol. 1999, 181, 6679–6688. [Google Scholar] [CrossRef] [PubMed] [Green Version]
- Kumar, K.; Venkatraman, V.; Bruheim, P. Adaptation of central metabolite pools to variations in growth rate and cultivation conditions in Saccharomyces cerevisiae. Microb. Cell Factories 2021, 20, 64. [Google Scholar] [CrossRef]
- Hua, Q.; Yang, C.; Baba, T.; Mori, H.; Shimizu, K. Responses of the central metabolism in Escherichia coli to phosphoglucose isomerase and glucose-6-phosphate dehydrogenase knockouts. J. Bacteriol. 2003, 185, 7053–7067. [Google Scholar] [CrossRef] [PubMed] [Green Version]
- Hua, Q.; Yang, C.; Oshima, T.; Mori, H.; Shimizu, K. Analysis of gene expression in Escherichia coli in response to changes of growth-liming nutrient in chemostat cultures. Appl. Environ. Microbiol. 2004, 70, 2354–2366. [Google Scholar] [CrossRef] [Green Version]
- Kristiansen, B.; Charley, R. Continuous process for production of citric acid. In Scientific and Engineering Principles, Proceedings of the Sixth International Fermentation Symposium, London, Canada, 20–25 July 1980; Pergamon: Oxford, UK, 1980; pp. 221–227. [Google Scholar]
- Dawson, M.W.; Maddox, I.S.; Goab, I.F.; Brooks, J.D. Application of fed-batch culture to citric acid production by Aspergillus niger: The effects of dilution rate and dissolved oxygen tension. Biotechnol. Bioeng. 1988, 32, 220–226. [Google Scholar] [CrossRef] [PubMed]
- Dawson, M.W.; Maddox, I.S.; Brooks, J.D. Evidence for nitrogen catabolite repression during citric acid production by Aspergillus niger under phosphate-limited growth conditions. Biotechnol. Bioeng. 1989, 33, 1500–1504. [Google Scholar] [CrossRef]
- Anastassiadis, S.; Rehm, H.-J. Citric acid production from glucose by yeast Candida oleophila ATCC 20177 under batch, continuous and repeated batch cultivation. Electron. J. Biotechnol. 2006, 9, 1. [Google Scholar] [CrossRef]
- Gallmetzer, M.; Burgstaller, W. Citrate efflux in glucose-limited and glucose-sufficient chemostat culture of Penicillium simplicissium. Antonie Van Leeuwenhoek 2001, 79, 81–87. [Google Scholar] [CrossRef]
- Rywińska, A.; Juszczyk, P.; Wojtatowicz, M.; Rymowicz, W. Chemostat study of citric acid production from glycerol by Yarrowia lipolytica. J. Biotechnol. 2011, 152, 54–57. [Google Scholar] [CrossRef] [PubMed]
- Vrabl, P.; Schinagl, C.W.; Artmann, D.J.; Krüger, A.; Ganzera, M.; Pötsch, A.; Burgstaller, W. The dynamics of plasma membrane, metabolism and respiration (PM-M-R) in Penicillium ochrochloron CBS 123824 in response to different nutrient limitations—A multi-level approach to study organic acid excretion in filamentous fungi. Front. Microbiol. 2017, 8, 2475. [Google Scholar] [CrossRef] [Green Version]
- Gill, C.O.; Hall, M.J.; Ratledge, C. Lipid accumulation in an oleaginous yeast (Candida 107) growing on glucose in single-stage continuous culture. Appl. Environ. Microbiol. 1977, 33, 231–239. [Google Scholar] [CrossRef] [PubMed] [Green Version]
- Gong, Z.; Shen, H.; Zhou, W.; Wang, Y.; Yang, X.; Zhao, Z.K. Efficient conversion of acetate into lipids by the oleaginous yeast Cryptococcus curvatus. Biotechnol. Biofuels 2015, 8, 189. [Google Scholar] [CrossRef] [PubMed] [Green Version]
- Kerkhoven, E.J.; Pomraning, K.R.; Baker, S.E.; Nielsen, J. Regulation of amino-acid metabolism controls flux to lipid accumulation in Yarrowia lipolytica. NPJ Syst. Biol. Appl. 2016, 2, 16005. [Google Scholar] [CrossRef] [Green Version]
- Sun, L.; Ren, L.; Zhuang, X.; Ji, X.; Yan, J.; Huang, H. Differential effects of nutrient limitations on biochemical constituents and docosahexaenoic acid production of Schizochytrium sp. Bioresour. Technol. 2014, 159, 199–206. [Google Scholar] [CrossRef]
- Zheng, Z.-M.; Xu, Y.-Z.; Wang, T.-P.; Dong, C.-Q.; Yang, Y.-P.; Liu, D.-H. Ammonium and phosphate limitation in 1,3-propanediol production by Klebsiella pneumoniae. Biotechnol. Lett. 2010, 32, 289–294. [Google Scholar] [CrossRef]
- Otten, A.; Brocker, M.; Bott, M. Metabolic engineering of Corynebacterium glutamicum for the production of itaconate. Metabol. Eng. 2015, 30, 156–165. [Google Scholar] [CrossRef] [PubMed]
- Liu, Y.; Esen, O.; Pronk, J.T.; van Gulik, W.M. Uncoupling growth and succinic acid production in an industrial Saccharomyces cerevisiae strain. Biotechnol. Bioeng. 2020, 118, 1557–1567. [Google Scholar] [CrossRef]
- Rakicka, M.; Rukowicz, B.; Rywińska, A.; Lazar, Z.; Rymowicz, W. Technology of efficient continuous erythritol production from glycerol. J. Clean. Prod. 2016, 139, 905–913. [Google Scholar] [CrossRef]
- Rakicka, M.; Rywińska, A.; Lazar, Z.; Rymowicz, W. Two-stage continuous culture—Technology boosting erythritol production. J. Clean. Prod. 2017, 168, 420–427. [Google Scholar] [CrossRef]
- Kim, J.S.; Lee, B.H.; Kim, B.S. Production of poly(3-hydroxybutyrate co-4-hydroxybutyrate) by Ralstonia eutropha. Biochem. Eng. J. 2005, 23, 169–174. [Google Scholar] [CrossRef]
- Wang, F.; Lee, S.Y. Poly(3-hydroxybutyrate) production with high productivity and high polymer content by a fed-batch culture of Alcaligenes latus under nitrogen limitation. Appl. Environ. Microbiol. 1997, 63, 3703–3706. [Google Scholar] [CrossRef] [PubMed] [Green Version]
- Asada, Y.; Miyake, M.; Miyake, J.; Kurane, R.; Tokiwa, Y. Photosynthetic accumulation of poly-(hydroxybutyrate) by cyanobacteria—The metabolism and potential for CO2 recycling. Int. J. Biol. Macromol. 1999, 25, 37–42. [Google Scholar] [CrossRef]
- Singh, A.K.; Mallick, N. Advances in cyanobacterial polyhydroxyalkanoates production. FEMS Microbiol. Lett. 2017, 364, fnx189. [Google Scholar] [CrossRef] [Green Version]
- Von Wobeser, E.A. Genome-Wide Expression Analysis of Environmental Stress in the Cyanobacterium Synechocystis PCC 6803. Ph.D. Thesis, Institute for Biodiversity and Ecosystem Dynamics, University of Amsterdam, Amsterdam, The Netherlands, 2010; p. 68. [Google Scholar]
- Boer, V.M.; de Winde, J.H.; Pronk, J.T.; Piper, M.D. The genome-wide transcriptional responses of Saccharomyces cerevisiae grown on glucose in aerobic chemostat cultures limited for carbon, nitrogen, phosphorous, or sulfur. J. Biol. Chem. 2003, 278, 3265–3274. [Google Scholar] [CrossRef] [Green Version]
- Bruheim, P.; Sletta, H.; Bibb, M.J.; White, J.; Levine, D.W. High-yield actinorhodin production in fed-batch culture by a Streptomyces lividans strain overexpressing the pathway-specific activator gene actII-ORF4. J. Ind. Microbiol. Biotechnol. 2002, 28, 103–111. [Google Scholar] [CrossRef]
- Morita, T.; Fukuoka, T.; Imura, T.; Kitamoto, D. Accumulation of cellobiose lipids under nitrogen-limiting conditions by two ustilaginomycetous yeasts. Pseudozyma aphidis and Pseudozyma hubeiensis. FEMS Yeast Res. 2013, 13, 44–49. [Google Scholar] [CrossRef] [Green Version]
- Bahl, H.; Andersch, W.; Gottschalk, G. Continuous production of acetone and butanol by Clostridium acetobutylicum in a two-stage phosphate limited chemostat. Eur. J. Appl. Microbiol. Biotechnol. 1982, 15, 201–205. [Google Scholar] [CrossRef]
- Andersch, W.; Bahl, H.; Gottschalk, G. Acetone-butanol production by Clostridium acetobutylicum in an ammonium-limited chemostat at low pH values. Biotechnol. Lett. 1982, 4, 29–32. [Google Scholar] [CrossRef]
- Gottschal, J.C.; Morris, J.G. Non-production of acetone and butanol by Clostridium acetobutylicum during glucose- and ammonium-limitation in continuous culture. Biotechnol. Lett. 1981, 3, 525–530. [Google Scholar] [CrossRef]
- Holwerda, E.K.; Zhou, J.; Hon, S.; Stevenson, D.M.; Amador-Noguez, D.; Lynd, L.R.; van Dijken, J.P. Metabolic fluxes of nitrogen and pyrophosphate in chemostat cultures of Clostridium thermocellum and Thermoanaerobacterium saccharolyticum. Appl. Environ. Microbiol. 2020, 86, e01795-20. [Google Scholar] [CrossRef]
- Zhu, Y.; Eiteman, M.A.; Altman, R.; Altman, E. High glycolytic flux improves pyruvate production by a metabolically engineered Escherichia coli strain. Appl. Environ. Microbiol. 2008, 74, 6649–6655. [Google Scholar] [CrossRef] [PubMed] [Green Version]
- Perez-Zabaleta, M.; Guevara-Martínez, M.; Gustavsson, M.; Quillahuamán, J.; Larsson, G.; van Maris, A.J.A. Comparison of engineered Escherichia coli AF1000 and BL21 strains for (R)-3-hydroxybutyrate production in fed-batch cultivation. Appl. Microbiol. Biotechnol. 2019, 103, 5627–5639. [Google Scholar] [CrossRef] [PubMed] [Green Version]
- Devine, K.M. Activation of the PhoPR-mediated response to phosphate limitation is regulated by wall teichoic acid metabolism in Bacillus subtilis. Front. Microbiol. 2018, 9, 2678. [Google Scholar] [CrossRef] [PubMed]
- Ellwood, D.C.; Tempest, D.W. Teichoic acid or teichuronic acid in the walls of Bacillus subtilis var. niger, grown in a chemostat. Biochem. J. 1967, 104, 69. [Google Scholar] [CrossRef]
- Ellwood, D.C.; Tempest, D.W. Control of teichoic acid and teichuronic acid biosynthesis in chemostat cultures of Bacillus subtilis var. niger. Biochem. J. 1969, 111, 1–5. [Google Scholar] [CrossRef]
- Anderson, A.J.; Green, R.S.; Archibald, A.R. Wall composition and phage-binding properties of Bacillus subtilis W23 grown in chemostat culture in media containing varied concentrations of phosphate. FEMS Microbiol. Lett. 1978, 4, 129–132. [Google Scholar] [CrossRef]
- Lang, W.K.; Glassey, K.; Archibald, A.R. Influence of phosphate supply on teichoic acid and teichuronic acid content of Bacillus subtilis cell walls. J. Bacteriol. 1982, 151, 367–375. [Google Scholar] [CrossRef]
- Wouters, J.T.M.; Buysman, P.J. Production of some exocellular enzymes by Bacillus licheniformis 749/C in chemostat cultures. FEMS Microbiol. Lett. 1977, 1, 109–112. [Google Scholar] [CrossRef]
- Li, S.H.-J.; Li, Z.; Park, J.O.; King, C.G.; Rabinowitz, J.D.; Wingreen, N.S.; Gitai, Z. Escherichia coli translation strategies differ across carbon, nitrogen and phosphorous limitation conditions. Nat. Microbiol. 2018, 3, 939–947. [Google Scholar] [CrossRef] [PubMed]
- Alton, T.H.; Koch, A.L. Unused protein synthetic capacity of Escherichia coli grown in phosphate-limited chemostats. J. Mol. Biol. 1974, 86, 1–9. [Google Scholar] [CrossRef]
- Hommes, R.W.J.; Simons, J.A.; Snoep, J.L.; Postma, P.W.; Tempest, D.W.; Neijssel, O.M. Quantitative aspects of glucose metabolism by Escherichia coli B/r, grown in the presence of pyrroloquinoline quinone. Antonie Van Leeuwenhoek 1991, 60, 373–382. [Google Scholar] [CrossRef] [PubMed]
- Johansson, L.; Lidén, G. Transcriptome analysis of a shikimic acid producing strain of Escherichia coli W3110 grown under carbon- and phosphate-limited conditions. J. Biotechnol. 2006, 126, 528–545. [Google Scholar] [CrossRef]
- Marzan, L.W.; Shimizu, K. Metabolic regulation of Escherichia coli and its phoB and phoR genes knockout mutants under phosphate and nitrogen limitations as well as at acidic condition. Microb. Cell Factories 2011, 10, 39. [Google Scholar] [CrossRef] [Green Version]
- Neijssel, O.M.; Tempest, D.W. The regulation of carbohydrate metabolism in Klebsiella aerogenes NCTC 418 organisms, growing in chemostat culture. Arch. Microbiol. 1975, 106, 251–258. [Google Scholar] [CrossRef] [PubMed]
- Chapman, A.G.; Atkinson, D.E. Adenine nucleotide concentrations and turnover rates. Their correlation with biological activity in bacteria and yeast. Adv. Microbiol. Physiol. 1977, 15, 253–306. [Google Scholar] [CrossRef]
- McIntyre, J.J.; Bull, A.T.; Bunch, A.W. Vancomycin production in batch and continuous culture. Biotechnol. Bioeng. 1996, 49, 412–420. [Google Scholar] [CrossRef]
- Fazeli, M.R.; Cove, J.H.; Baumberg, S. Physiological factors affecting streptomycin production by Streptomyces griseum ATCC 12475 in batch and continuous culture. FEMS Microbiol. Lett. 1995, 126, 55–62. [Google Scholar] [CrossRef]
- Rhodes, P.M. The production of oxytetracycline in chemostat culture. Biotechnol. Bioeng. 1984, 26, 382–385. [Google Scholar] [CrossRef]
- Clarke, K.G.; Ballot, F.; Reid, S.J. Enhance rhamnolipid production by Pseudomonas aeruginosa under phosphate limitation. World J. Microbiol. Biotechnol. 2010, 26, 2179–2184. [Google Scholar] [CrossRef]
- Youngquist, J.T.; Rose, J.P.; Pfleger, B.F. Free fatty acid production in Escherichia coli under phosphate limited conditions. Appl. Microbiol. Biotechnol. 2013, 97, 5149–5159. [Google Scholar] [CrossRef] [PubMed]
- Youngquist, J.T.; Korosh, T.C.; Pfleger, B.F. Functional genomics analysis of free fatty acid production under continuous phosphate limiting conditions. J. Ind. Microbiol. Biotechnol. 2017, 44, 759–772. [Google Scholar] [CrossRef] [PubMed] [Green Version]
- Niyas, A.M.M.; Eiteman, M.A. Phosphatases and phosphate affect the formation of glucose from pentoses in Escherichia coli. Eng. Life Sci. 2017, 17, 579–584. [Google Scholar] [CrossRef] [Green Version]
- Choi, Y.J.; Tribe, D.E. Continuous production of phenylalanine using an Escherichia coli regulatory mutant. Biotechnol. Lett. 1982, 4, 223–228. [Google Scholar] [CrossRef]
- Park, N.H.; Rogers, P.L. L-phenylalanine production in continuous culture using a hyperproducing mutant of Escherichia coli K-12. Chem. Eng. Commun. 1986, 45, 185–196. [Google Scholar] [CrossRef]
- Zhang, J.-H.; Zeng, X.; Chen, X.-S.; Mao, Z.-G. Metabolic analyses of the improved ε-poly-L-lysine productivity using a glucose-glycerol mixed carbon source in chemostat cultures. Bioproc. Biosyst. Eng. 2018, 41, 1143–1151. [Google Scholar] [CrossRef]
- Wadhwa, M.; Srinivasan, S.; Bachhawat, A.K.; Venkatesh, K.V. Role of phosphate limitation and pyruvate decarboxylase in rewiring of the metabolic network for increasing flux towards isoprenoid pathway in a TATA binding protein mutant of Saccharomyces cerevisiae. Microb. Cell Factories 2018, 17, 152. [Google Scholar] [CrossRef]
- Johansson, L.; Lindskog, A.; Silfversparre, G.; Cimander, C.; Nielsen, K.F.; Lidén, G. Shikimic acid production by a modified strain of E. coli (W3110.shik1) under phosphate-limited and carbon-limited conditions. Biotechnol. Bioeng. 2005, 92, 541–552. [Google Scholar] [CrossRef]
- Tavares, J.M.; Duarte, L.C.; Amaral-Collaço, M.T.; Gírio, F.M. Phosphate limitation stress induces xylitol overproduction by Debaryomyces hansenii. FEMS Microbiol. Lett. 1999, 171, 115–120. [Google Scholar] [CrossRef]
- Grousseau, E.; Blanchet, E.; Déléris, S.; Albuquerque, M.G.E.; Paul, E.; Uribelarrea, J.-L. Phosphorus limitation strategy to increase propionic acid flux towards 3-hydroxyvaleric acid monomers in Cupriavidus necator. Bioresour. Technol. 2014, 153, 206–215. [Google Scholar] [CrossRef] [PubMed]
- Ryu, H.W.; Hahn, S.K.; Chang, Y.K.; Chang, H.N. Production of poly(3-hydroxybutyrate) by high cell density fed-batch culture of Alcaligenes eutrophus with phosphate limitation. Biotechnol. Bioeng. 1997, 55, 28–32. [Google Scholar] [CrossRef]
- Andersch, W.; Bahl, H.; Gottschalk, G. Level of enzymes involved in acetate, butyrate, acetone and butanol formation by Clostridium acetobutylicum. Eur. J. Appl. Microbiol. Biotechnol. 1983, 18, 327–332. [Google Scholar] [CrossRef]
- Dabrock, B.; Bahl, H.; Gottschalk, G. Parameters affecting solvent production by Clostridium pasteurianum. Appl. Environ. Microbiol. 1992, 58, 1233–1239. [Google Scholar] [CrossRef] [Green Version]
- Heyndrickx, M.; De Vos, P.; De Ley, J. H2 production from chemostat fermentation of glucose by Clostridium butyricum and Clostridium pasteurianum in ammonium- and phosphate limitation. Biotechnol. Lett. 1990, 12, 731–736. [Google Scholar] [CrossRef]
- Nguyen, N.-P.-T.; Raynaud, C.; Meynial-Salles, I.; Soucaille, P. Reviving the Weizmann process for commercial n-butanol production. Nat. Commun. 2018, 9, 3682. [Google Scholar] [CrossRef]
- Yoo, M.; Croux, C.; Meynial-Salles, I.; Soucaille, P. Metabolic flexibility of a butyrate pathway mutant of Clostridium acetobutylicum. Metabol. Eng. 2017, 40, 138–147. [Google Scholar] [CrossRef]
- Schuhmacher, T.; Loffler, M.; Hurler, T.; Takors, R. Phosphate limited fed-batch processes: Impact on carbon usage and energy metabolism in Escherichia coli. J. Biotechnol. 2014, 190, 96–104. [Google Scholar] [CrossRef]
- Gyaneshwar, P.; Paliy, O.; McAuliffe, J.; Popham, D.L.; Jordan, M.I.; Kustu, S. Sulfur and nitrogen limitation in Escherichia coli K-12: Specific homeostatic response. J. Bacteriol. 2005, 187, 1074–1090. [Google Scholar] [CrossRef]
- Cuhel, R.L.; Taylor, C.D.; Jannasch, H.W. Assimilatory sulfur metabolism in marine microorganisms: Sulfur metabolism, growth, and protein synthesis of Pseudomonas halodurans and Alteromonas luteo-violaceus during sulfate limitation. Arch. Microbiol. 1981, 130, 1–7. [Google Scholar] [CrossRef]
- Mazel, D.; Marlière, P. Adaptive eradication of methionine and cysteine from cyanobacterial light-harvesting proteins. Nature 1989, 341, 245–248. [Google Scholar] [CrossRef] [PubMed]
- Robinson, A.; Tempest, D.W. Phenotypic variability of the envelope proteins of Klebsiella aerogenes. J. Gen. Microbiol. 1973, 78, 361–370. [Google Scholar] [CrossRef] [PubMed] [Green Version]
- Pardee, A.B. Purification and properties of a sulfate-binding protein from Salmonella typhimurium. J. Biol. Chem. 1966, 241, 5886–5892. [Google Scholar] [CrossRef]
- Koch, A.L.; Deppe, C.S. In vivo assay of protein synthesizing capacity of Escherichia coli from slowly growing chemostat cultures. J. Mol. Biol. 1971, 55, 549–562. [Google Scholar] [CrossRef]
- Chubukov, V.; Sauer, U. Environmental dependence of stationary-phase metabolism in Bacillus subtilis and Escherichia coli. Appl. Environ. Microbiol. 2014, 80, 2901–2909. [Google Scholar] [CrossRef] [PubMed] [Green Version]
- Stouthamer, A.H.; Bettenhaussen, C.W. Determination of the efficiency of oxidative phosphorylation in continuous cultures of Aerobacter aerogenes. Arch. Microbiol. 1975, 102, 187–192. [Google Scholar] [CrossRef]
- Zinebi, S.; Raval, G.; Petitdemange, H. Effect of oxygenation and sulfate concentrations on pyruvate and lactate formation in Klebsiella oxytoca ZS growing in chemostat culture. Curr. Microbiol. 1994, 29, 79–85. [Google Scholar] [CrossRef]
- Chew, L.C.K.; Tacon, W.C.A.; Cole, J.A. Effect of growth conditions on the rate of loss of the plasmid pAT153 from continuous cultures of Escherichia coli HB101. FEMS Microbiol. 1988, 56, 101–104. [Google Scholar] [CrossRef]
- Masuda, A.; Toya, Y.; Shimizu, H. Metabolic impact of nutrient starvation in mevalonate-producing Escherichia coli. Bioresour. Technol. 2017, 245, 1634–1640. [Google Scholar] [CrossRef]
- Li, S.; Jendresen, C.B.; Nielsen, A.T. Increasing production yield of tyrosine and mevalonate through inhibition of biomass formation. Process Biochem. 2016, 51, 1992–2000. [Google Scholar] [CrossRef]
- Willrodt, C.; Hoschek, A.; Bühler, B.; Schmid, A.; Julsing, M.K. Decoupling production from growth by magnesium sulphate limitation boosts de novo limonene production. Biotechnol. Bioeng. 2016, 113, 1305–1314. [Google Scholar] [CrossRef] [PubMed]
- Wu, S.; Zhao, X.; Shen, H.; Wang, Q.; Zhao, Z.K. Microbial lipid production by Rhodosporidium toruloides under sulfate-limited conditions. Bioresour. Technol. 2011, 102, 1803–1807. [Google Scholar] [CrossRef] [PubMed]
- Melis, A.; Zhang, L.; Forestier, M.; Ghirardi, M.L.; Seibert, M. Sustained photobiological hydrogen gas production upon reversible inactivation of oxygen evolution in the green alga Chlamydomonas reinhardtii. Plant Physiol. 2000, 122, 127–135. [Google Scholar] [CrossRef] [PubMed] [Green Version]
- Kosourov, S.; Patrusheva, E.; Ghirardi, M.L.; Seibert, M.; Tsygankov, A. A comparison of hydrogen photoproduction by sulfur-deprived Chlamydomonas reinhardtii under different growth conditions. J. Biotechnol. 2007, 128, 776–787. [Google Scholar] [CrossRef]
- Zhang, L.; Happe, T.; Melis, A. Biochemical and morphological characterization of sulfur-deprived and H2-producing Chlamydomonas reinhardtii (green alga). Planta 2002, 214, 552–561. [Google Scholar] [CrossRef]
- Volgusheva, A.; Styring, S.; Mamedov, F. Increased photosystem II stability promotes H2 production in sulfur-deprived Chlamydomonas reinhardtii. Proc. Natl. Acad. Sci. USA 2013, 110, 7223–7228. [Google Scholar] [CrossRef] [Green Version]
- Brányiková, I.; Maršálková, B.; Doucha, J.; Brányik, T.; Bišová, K.; Zachleder, V.; Vítová, M. Microalgae—Novel highly efficient starch producers. Biotechnol. Bioeng. 2011, 108, 766–776. [Google Scholar] [CrossRef]
- Wang, Y.; Xu, H.; Yang, J.; Zhou, Y.; Wang, X.; Dou, S.; Li, L.; Liu, G.; Yang, M. Effect of sulfur limitation strategies on glucose-based carbohydrate production from Chlorella sorokiniana. Renew. Energy 2022, 200, 449–456. [Google Scholar] [CrossRef]
- Tissières, A.; Watson, J.D. Ribonucleoprotein particles from Escherichia coli. Nature 1958, 182, 778–780. [Google Scholar] [CrossRef]
- Nikaido, H. Molecular basis of bacterial outer membrane permeability revisited. Microbiol. Mol. Biol. Rev. 2003, 67, 593–656. [Google Scholar] [CrossRef] [Green Version]
- Hartwig, A. Role of magnesium in genomic stability. Mutat. Res 2001, 475, 113–121. [Google Scholar] [CrossRef]
- Christensen, D.G.; Orr, J.G.; Rao, V.G.; Wolfe, A.L. Increasing growth yield and decreasing acetylation in Escherichia coli by optimizing the carbon to magnesium ratio in peptide-based medium. Appl. Environ. Microbiol. 2017, 83, e03034-16. [Google Scholar] [CrossRef] [PubMed] [Green Version]
- Walker, G.M.; Maynard, A.I. Magnesium-limited growth of Saccharomyces cerevisiae. Enzym. Microb. Technol. 1996, 18, 455–459. [Google Scholar] [CrossRef]
- Warsi, O.M.; Andersson, D.I.; Dykhuizen, D.E. Different adaptive strategies in E. coli populations evolving under macronutrient limitation and metal ion limitation. BMC Evol. Biol. 2018, 18, 72. [Google Scholar] [CrossRef]
- Fiil, A.; Branton, D. Changes in the plasma membrane of Escherichia coli during magnesium starvation. J. Bacteriol. 1969, 98, 1320–1327. [Google Scholar] [CrossRef] [Green Version]
- Brock, T.D. Effects of magnesium ion deficiency on Escherichia coli and possible relation to the mode of action of novobiocin. J. Bacteriol. 1962, 84, 679–682. [Google Scholar] [CrossRef] [Green Version]
- Dean, A.C.R.; Rogers, P.L. The cell size and macromolecular composition of Aerobacter aerogenes in various systems of continuous culture. Biochim. Biophys. Acta 1962, 148, 267–279. [Google Scholar] [CrossRef]
- Smit, G.; Straver, M.H.; Lugtenberg, B.J.; Kijne, J.W. Flocculence of Saccharomyces cerevisiae cells is induced by nutrient limitation, with cell surface hydrophobicity as a major determinant. Appl. Environ. Microbiol. 1992, 58, 3709–3714. [Google Scholar] [CrossRef] [Green Version]
- Meers, J.L.; Tempest, D.W. The influence of extracellular products on the behavior of mixed microbial populations in magnesium-limited chemostat cultures. J. Gen. Microbiol. 1968, 52, 309–317. [Google Scholar] [CrossRef]
- Dawes, I.W.; Mandelstam, J. Sporulation of Bacillus subtilis in continuous culture. J. Bacteriol. 1970, 103, 529–535. [Google Scholar] [CrossRef] [Green Version]
- Wendel, B.M.; Pi, H.; Krüger, L.; Herzberg, C.; Stülke, J.; Helmann, J.D. A central role for magnesium homeostasis during adaptation to osmotic stress. mBIO 2022, 13, e00092-22. [Google Scholar] [CrossRef] [PubMed]
- Mukherjee, M.; Sarkar, P.; Goswami, G.; Das, D. Regulation of butanol biosynthesis in Clostridium acetobutylicum ATCC 824 under the influence of zinc supplementation and magnesium starvation. Enzym. Microb. Technol. 2019, 129, 109352. [Google Scholar] [CrossRef] [PubMed]
- Ahlawat, S.; Kaushal, M.; Palabhanvi, B.; Goswami, G.; Das, D. Flux balance analysis of nutritional modulation assisted changes in two-stage fed-batch fermentation by Clostridium acetobutylicum. Bioresour. Technol. Rep. 2019, 7, 100264. [Google Scholar] [CrossRef]
- Roseiro, J.C.; Gírio, F.M.; Kará, A.; Amaral Collaço, M.T. Kinetic and metabolic effects of nitrogen, magnesium and sulphur restriction in Xanthomonas campestris batch cultures. J. Appl. Bacteriol. 1993, 75, 381–386. [Google Scholar] [CrossRef]
- Tokuyama, K.; Toya, Y.; Matsuda, F.; Cress, B.F.; Koffas, M.A.G.; Shimizu, H. Magnesium starvation improves production of malonyl-CoA-derived metabolites in Escherichia coli. Metabol. Eng. 2019, 52, 215–223. [Google Scholar] [CrossRef]
- Almeida, R.S.; Wilson, D.; Hube, B. Candida albicans iron acquisition within the host. FEMS Yeast Res. 2009, 9, 1000–1012. [Google Scholar] [CrossRef] [Green Version]
- Sheldon, J.R.; Heinrichs, D.E. Recent developments in understanding the iron acquisition strategies of gram positive pathogens. FEMS Microbiol. Rev. 2015, 39, 592–630. [Google Scholar] [CrossRef] [Green Version]
- Philpott, C.C.; Protchenko, O. Response to iron deprivation in Saccharomyces cerevisiae. Eukary. Cell 2008, 7, 20–27. [Google Scholar] [CrossRef] [Green Version]
- Andrews, S.C.; Robinson, A.K.; Rodríguez-Quiñones, F. Bacterial iron homeostasis. FEMS Microbiol. Rev. 2003, 27, 215–237. [Google Scholar] [CrossRef] [Green Version]
- Schrettl, M.; Bignell, E.; Kragl, C.; Joechl, C.; Rogers, T.; Arst, H.N., Jr.; Haynes, K.; Haas, H. Siderophore biosynthesis but not reductive iron assimilation is essential for Aspergillus fumigatus virulence. J. Exp. Med. 2004, 200, 1213–1219. [Google Scholar] [CrossRef] [Green Version]
- Massé, E.; Gottesman, S. A small RNA regulates the expression of genes involved in iron metabolism in Escherichia coli. Proc. Natl. Acad. Sci. USA 2002, 99, 4620–4625. [Google Scholar] [CrossRef] [PubMed] [Green Version]
- Martin, J.E.; Imlay, J.A. The alternative aerobic ribonucleotide reductase of Escherichia coli, NrdEF, is a manganese-dependent enzyme that enables cell replication during periods of iron starvation. Mol. Microbiol. 2011, 80, 319–334. [Google Scholar] [CrossRef] [Green Version]
- Chandrangsu, P.; Rensing, C.; Helmann, J.D. Metal homeostasis and resistance in bacteria. Nat. Rev. Microbiol. 2017, 15, 338–350. [Google Scholar] [CrossRef] [Green Version]
- Hantke, K. Ferrous iron transport mutants in Escherichia coli K12. FEMS Microbiol. Lett. 1987, 4, 53–57. [Google Scholar] [CrossRef]
- Stojiljkovic, I.; Cobeljic, M.; Hantke, K. Escherichia coli K-12 ferrous ion uptake mutants are impaired in their ability to colonize the mouse intestine. FEMS Microbiol. Lett. 1993, 108, 111–115. [Google Scholar] [CrossRef] [PubMed]
- Parente, A.F.A.; Bailão, A.M.; Borges, C.L.; Parente, J.A.; Magalhães, A.D.; Ricart, C.A.O.; Soares, C.M.A. Proteomic Analysis Reveals That Iron Availability Alters the Metabolic Status of the Pathogenic Fungus Paracoccidioides brasiliensis. PLoS ONE 2011, 6, e22810. [Google Scholar] [CrossRef]
- McHugh, J.P.; Rodríguez-Quiñones, F.; Abdul-Tehrani, H.; Svistunenko, D.A.; Poole, R.K.; Cooper, C.E.; Andrews, S.C. Global iron-dependent gene regulation in Escherichia coli: A new mechanism for iron homeostasis. J. Biol. Chem. 2003, 278, 29478–29486. [Google Scholar] [CrossRef] [Green Version]
- Friedman, D.B.; Stauff, D.L.; Pishchany, G.; Whitwell, C.W.; Torres, V.J.; Skaar, E.P. Staphylococcus aureus redirects central metabolism to increase iron availability. PloS Path. 2006, 2, 777–789. [Google Scholar] [CrossRef]
- Löser, C.; Urit, T.; Stukert, A.; Bley, T. Formation of ethyl acetate from whey by Kluyveromyces marxianus on a pilot scale. J. Biotechnol. 2013, 163, 17–23. [Google Scholar] [CrossRef]
- Armstrong, D.W.; Yamazaki, H. Effect of iron and EDTA on ethyl acetate accumulation in Candida utilis. Biotechnol. Lett. 1984, 6, 819–824. [Google Scholar] [CrossRef]
- Baez, A.; Sharma, A.K.; Bryukhanov, A.; Anderson, E.D.; Rudack, L.; Olivares-Hernandez, R.; Quan, D.; Shiloach, J. Iron availability enhances the cellular energetics of aerobic Escherichia coli cultures while upregulating anaerobic respiratory chains. New Biotechnol. 2022, 71, 11–20. [Google Scholar] [CrossRef] [PubMed]
- Georgiadis, M.M.; Komiya, H.; Chakrabarti, P.; Woo, D.; Kornuc, J.J.; Rees, D.C. Crystallographic structure of the nitrogenase iron protein from Azotobacter vinelandii. Science 1992, 257, 1653–1659. [Google Scholar] [CrossRef]
- Fekete, F.A.; Spence, J.T.; Emery, T. Siderophores produced by nitrogen-fixing Azotobacter vinelandii OP in iron-limited continuous culture. Appl. Environ. Microbiol. 1983, 46, 1297–1300. [Google Scholar] [CrossRef] [PubMed] [Green Version]
- MacLeod, R.A.; Snell, E.E. Some mineral requirements of the lactic acid bacteria. J. Biol. Chem. 1947, 170, 351–365. [Google Scholar] [CrossRef]
- Archibald, F. Lactobacillus plantarum, an organism not requiring iron. FEMS Microbiol. Lett. 1983, 19, 29–32. [Google Scholar] [CrossRef]
- Bahl, H.; Gottwald, M.; Kuhn, A.; Rale, V.; Andersch, W.; Gottschalk, G. Nutritional factors affecting the ratio of solvents produced by Clostridium acetobutylicum. Appl. Environ. Microbiol. 1986, 52, 169–172. [Google Scholar] [CrossRef] [Green Version]
- Junelles, A.M.; Janati-Idrissi, R.; Petitdemange, H.; Gay, R. Iron effect on acetone–butanol fermentation. Curr. Microbiol. 1988, 17, 299–303. [Google Scholar] [CrossRef]
- Groeger, C.; Wang, W.; Sabra, W.; Utesch, T.; Zeng, A.-P. Metabolic and proteomic analyses of product selectivity and redox regulation in Clostridium pasteurianum grown on glycerol under varied iron availability. Microb. Cell Factories 2017, 16, 64. [Google Scholar] [CrossRef] [PubMed]
- Schönheit, P.; Brandis, A.; Thauer, R.K. Ferredoxin degradation in growing Clostridium pasteurianum during periods of iron deprivation. Arch. Microbiol. 1979, 120, 73–76. [Google Scholar] [CrossRef]
- La Roche, J.; Boyd, P.W.; McKay, R.M.L.; Geider, R.J. Flavodoxin as an in situ marker for iron stress in phytoplankton. Nature 1996, 382, 802–804. [Google Scholar] [CrossRef]
Figure 1.
The three general modes of fermentation operation: batch, continuous, and fed-batch processes.
Figure 1.
The three general modes of fermentation operation: batch, continuous, and fed-batch processes.


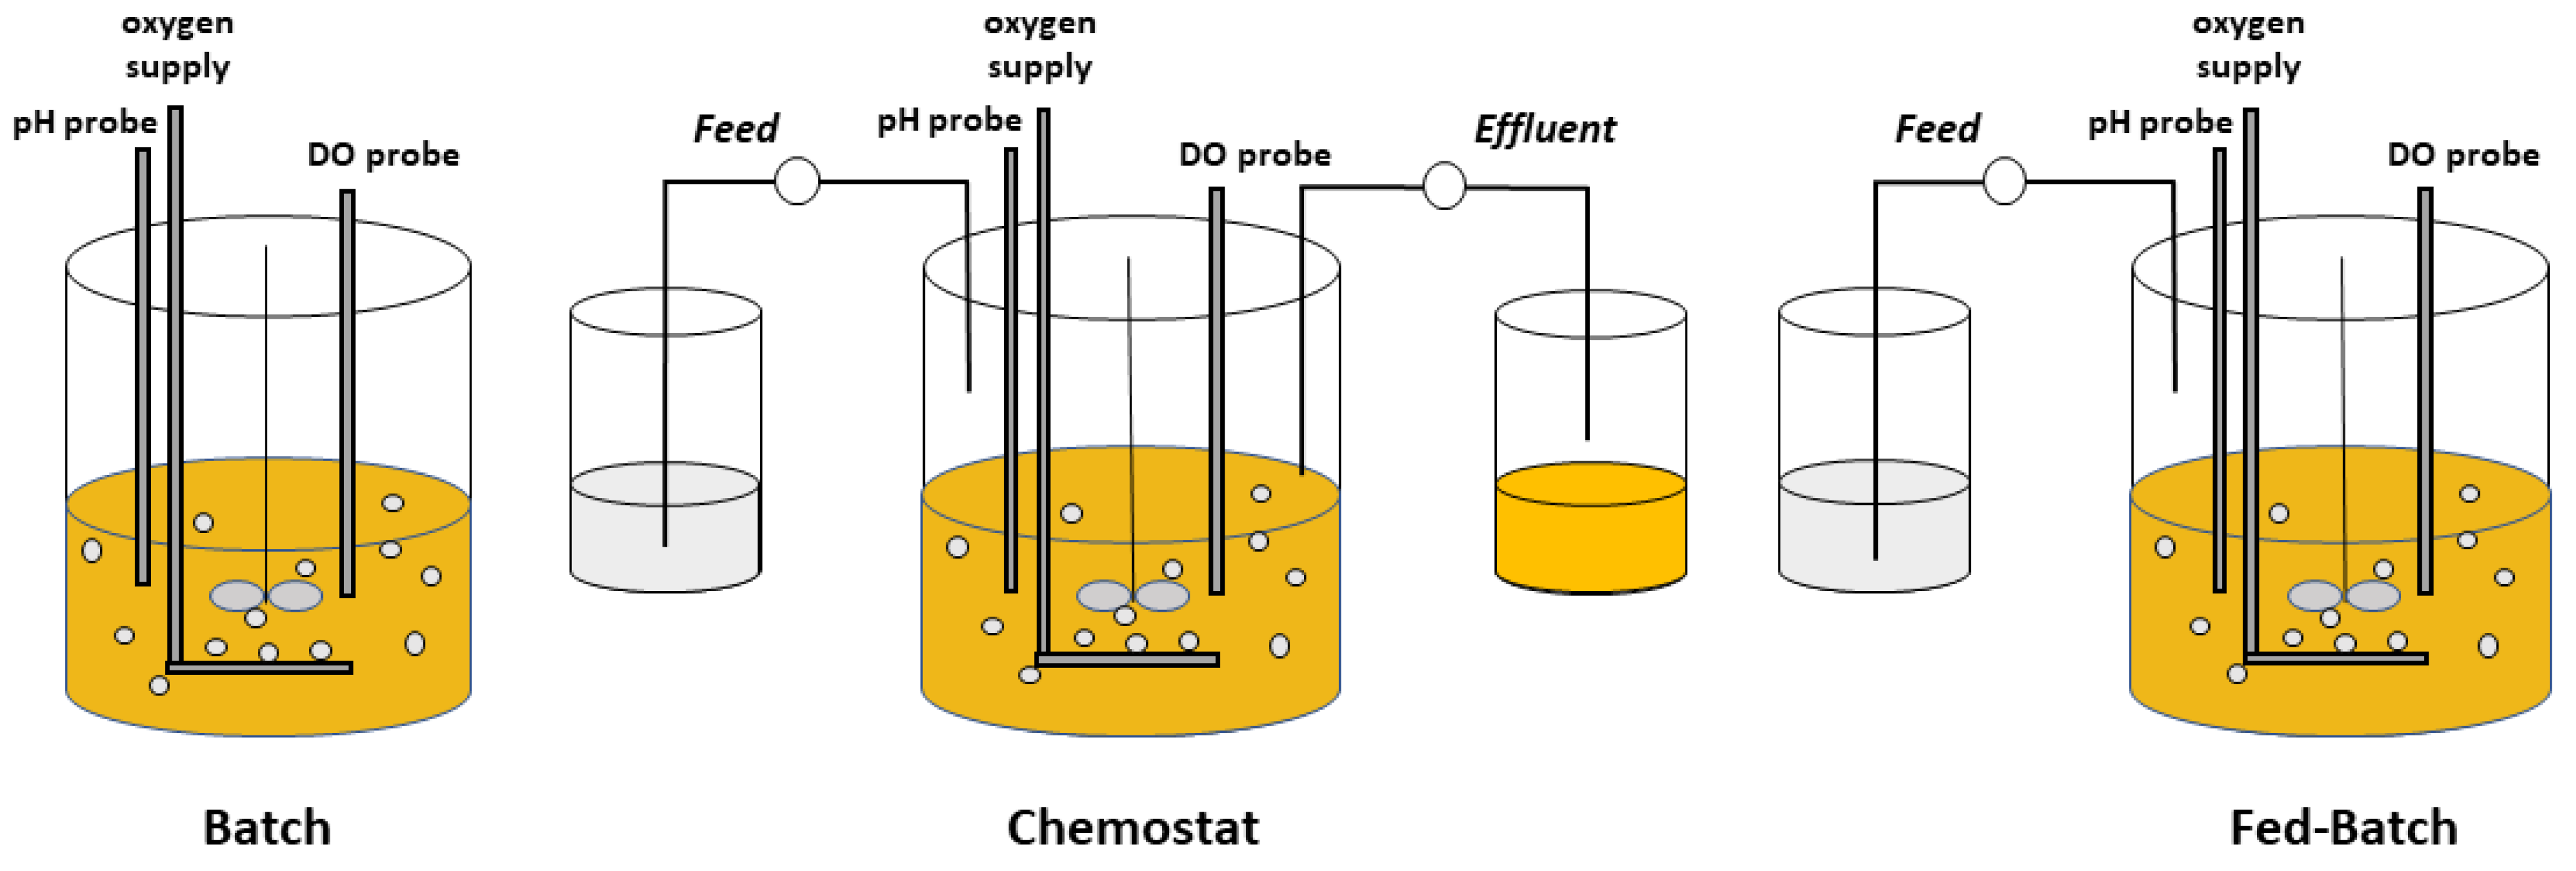
Table 1.
Reported yield coefficients for elements using various microorganisms. Where necessary, reported data have been converted so that the yield coefficient is defined as the mass of cells on a dry basis generated per mass of that element consumed (g cells/g element). Each element is available in the medium as a salt or other metabolizable species.
| Element | YX/element | Microorganism | Growth Conditions | Operational Condition | Reference |
|---|---|---|---|---|---|
| (g/g) | |||||
| Nitrogen (N) | Bacillus caldotenax | Pulse Shift; Glucose, methionine, biotin (65 °C) | Chemostat: | [76] | |
| 6 | D = 1.2 h−1 | ||||
| Bacillus subtilis | P-limited | Chemostat: | [77] | ||
| 7.2 | D = 0.1 h−1 | ||||
| 7.3 | D = 0.4 h−1 | ||||
| Bacillus subtilis | N-limited | Chemostat: | [77] | ||
| 8.1 | D = 0.1 h−1 | ||||
| 7.7 | D = 0.4 h−1 | ||||
5 | Escherichia coli B/r | Pulse Shift | Chemostat: | [78] | |
| D = 0.45 h−1 | |||||
| Escherichia coli | C-limited; | Chemostat: | [70] | ||
| 7.9 ± 0.3 | Cell elemental analysis | D = 0.1 h−1 | |||
| 8.0 ± 0.4 | D = 0.2 h−1 | ||||
| 7.8 ± 0.2 | D = 0.3 h−1 | ||||
| 7.8 ± 0.1 | D = 0.4 h−1 | ||||
| Escherichia coli | Fe-limited; | Chemostat: | [70] | ||
| 7.5 ± 0.1 | Cell elemental analysis | D = 0.1 h−1 | |||
| 7.5 ± 0.1 | D = 0.2 h−1 | ||||
| 7.7 ± 0.0 | D = 0.3 h−1 | ||||
| 7.5 ± 0.0 | D = 0.4 h−1 | ||||
| Escherichia coli | N-limited; | Chemostat: | [70] | ||
| 9.7 ± 0.3 | Cell elemental analysis | D = 0.1 h−1 | |||
| 9.9 ± 0.3 | D = 0.2 h−1 | ||||
| 8.8 ± 0.1 | D = 0.3 h−1 | ||||
| 8.9 ± 0.2 | D = 0.4 h−1 | ||||
| Escherichia coli | N-limited; | Chemostat: | [79] | ||
| 10 | arginine auxotroph containing plasmid | Medium contained arginine and ampicillin | D = 0.4 h−1 | ||
| Escherichia coli C ΔldhA ΔpoxB ΔppsA | N-limited | Chemostat: | [80] | ||
| 8.35 | Medium elemental analysis | D = 0.155 h−1 | |||
| 8.22 | D = 0.208 h−1 | ||||
| 8.26 | D = 0.283 h−1 | ||||
| 7.9 | Escherichia coli W, B, and K-12 | Not growth limited; | Exponential Growth at 20 °C or 30 °C | [81] | |
| Cell elemental analysis | |||||
| Penicillium stipitatum | N-limited; | Chemostat: | [82] | ||
| 11.5 | Medium prepared | D = 0.11 h−1 | |||
| Pseudomonas C | Pulse Shift; Methanol | Chemostat: | [83] | ||
| 9.1 | D = 0.32 h−1 | ||||
| 8 | Pseudomonas fluorescens | Not growth limited; | Exponential Growth at 30 °C | [81] | |
| Cell elemental analysis | |||||
| 7 | Pseudomonas putida | Not growth limited | Fed-batch | [84] | |
| Phosphorus (P) | Bacillus caldotenax | Pulse Shift; Glucose, methionine, biotin (65 °C) | Chemostat: | [76] | |
| 28 | D = 1.2 h−1 | ||||
| Bacillus subtilis | K-limited; | Chemostat: | [85] | ||
| 53 | Cell elemental analysis | D = 0.05 h−1 | |||
| 59 | D = 0.10 h−1 | ||||
| 31 | D = 0.20 h−1 | ||||
| 29 | D = 0.40 h−1 | ||||
| Bacillus subtilis | N-limited | Chemostat: | [77] | ||
| 42 | D = 0.1 h−1 | ||||
| 38 | D = 0.4 h−1 | ||||
| Bacillus subtilis | P-limited; | Chemostat: | [85] | ||
| 77 | Cell elemental analysis | D = 0.10 h−1 | |||
| 59 | D = 0.20 h−1 | ||||
| 43 | D = 0.40 h−1 | ||||
| Bacillus subtilis | P-limited | Chemostat: | [77] | ||
| 96 | D = 0.1 h−1 | ||||
| 65 | D = 0.4 h−1 | ||||
| Escherichia coli B/r | Pulse Shift | Chemostat: | [78] | ||
| 36 | D = 0.45 h−1 | ||||
| Escherichia coli | P-limited; | Chemostat: | [79] | ||
| 34 | arginine auxotroph containing plasmid | Medium contained arginine and ampicillin | D = 0.4 h−1 | ||
| 34.7 49.8 | Escherichia coli W Escherichia coli B | Not growth-limited; Cell elemental analysis | Exponential Growth at 20 °C or 30 °C | [81] | |
| 41.7 | Escherichia coli K-12 | ||||
| Pseudomonas C | Pulse Shift; Methanol | Chemostat: | [83] | ||
| 28 | D = 0.32 h−1 | ||||
| 43 | Pseudomonas fluorescens | Not growth-limited; | Exponential Growth at 30 °C | [81] | |
| Cell elemental analysis | |||||
| 42 | Pseudomonas putida | Not growth-limited | Fed-Batch | [84] | |
| Sulfur (S) | Escherichia coli B/r | Pulse Shift | Chemostat: | [78] | |
| 278 | D = 0.45 h−1 | ||||
163 | Escherichia coli | S-limited; | Chemostat: | [79] | |
| arginine auxotroph containing plasmid | Medium contained arginine and ampicillin | D = 0.4 h−1 | |||
| 244 | Pseudomonas putida | Low S medium allowed to become exhausted | Batch; 80 min after S starvation | [86] | |
| Magnesium (Mg) | Bacillus caldotenax | Pulse Shift; Glucose, methionine, biotin (65 °C) | Chemostat: | [76] | |
| 571 | D = 1.2 h−1 | ||||
| Bacillus subtilis | K-limited; | Chemostat: | [85] | ||
| 770 | Cell elemental analysis | D = 0.05 h−1 | |||
| 670 | D = 0.10 h−1 | ||||
| 530 | D = 0.20 h−1 | ||||
| 450 | D = 0.40 h−1 | ||||
| Bacillus subtilis | Mg-limited; | Chemostat: | [87] | ||
| 714 | Cell elemental analysis | D = 0.10 h−1 | |||
| 567 | D = 0.21 h−1 | ||||
| 444 | D = 0.405 h−1 | ||||
| 397 | D = 0.57 h−1 | ||||
| Bacillus subtilis | P-limited | Chemostat: | [85] | ||
| 830 | D = 0.10 h−1 | ||||
| 670 | D = 0.20 h−1 | ||||
| 500 | D = 0.40 h−1 | ||||
| Escherichia coli B/r | Pulse Shift | Chemostat: | [78] | ||
| 588 | D = 0.45 h−1 | ||||
| Escherichia coli arginine auxotroph containing plasmid | Mg-limited; | Chemostat: | [79] | ||
| 278 | Medium contained arginine and ampicillin | D = 0.4 h−1 | |||
| Klebsiella aerogenes | Mg-limited; | Chemostat: | [88] | ||
| 832 | D = 0.10 h−1 | ||||
| 588 | D = 0.20 h−1 | ||||
| 460 | D = 0.41 h−1 | ||||
| 432 | D = 0.43 h−1 | ||||
| 378 | D = 0.60 h−1 | ||||
| 347 | D = 0.82 h−1 | ||||
| 236 | Pseudomonas putida | Pulse shift | Fed-Batch | [84] | |
128 | Pseudomonas C | Pulse Shift; Methanol | Chemostat: | [83] | |
| D = 0.32 h−1 | |||||
| Iron (Fe) | 7700 | Escherichia coli B/r | Pulse shift | Chemostat | [78] |
| D = 0.45 h−1 | |||||
| 5600 | Escherichia coli | Low iron content; | Batch | [72] | |
| Cell elemental analysis | |||||
| Escherichia coli | Iron-limited; | Chemostat: | [71] | ||
| 130,000 | Cell elemental analysis | D = 0.10 h−1 | |||
| 150,000 | D = 0.20 h−1 | ||||
| 120,000 | D = 0.30 h−1 | ||||
| 100,000 | D = 0.40 h−1 | ||||
43,000 | Kluyveromyces marxianus | Iron-limited | Chemostat: | [89] | |
| D = 0.15 h−1 | |||||
1700 | Pseudomonas C | Pulse Shift; Methanol | Chemostat: | [83] | |
| D = 0.32 h−1 |
Publisher’s Note: MDPI stays neutral with regard to jurisdictional claims in published maps and institutional affiliations. |
© 2022 by the authors. Licensee MDPI, Basel, Switzerland. This article is an open access article distributed under the terms and conditions of the Creative Commons Attribution (CC BY) license (https://creativecommons.org/licenses/by/4.0/).
Share and Cite
MDPI and ACS Style
Rajpurohit, H.; Eiteman, M.A. Nutrient-Limited Operational Strategies for the Microbial Production of Biochemicals. Microorganisms 2022, 10, 2226. https://0-doi-org.brum.beds.ac.uk/10.3390/microorganisms10112226
AMA Style
Rajpurohit H, Eiteman MA. Nutrient-Limited Operational Strategies for the Microbial Production of Biochemicals. Microorganisms. 2022; 10(11):2226. https://0-doi-org.brum.beds.ac.uk/10.3390/microorganisms10112226
Chicago/Turabian StyleRajpurohit, Hemshikha, and Mark A. Eiteman. 2022. "Nutrient-Limited Operational Strategies for the Microbial Production of Biochemicals" Microorganisms 10, no. 11: 2226. https://0-doi-org.brum.beds.ac.uk/10.3390/microorganisms10112226
Note that from the first issue of 2016, this journal uses article numbers instead of page numbers. See further details here.