Article

Distinct Elevational Patterns and Their Linkages of Soil Bacteria and Plant Community in An Alpine Meadow of the Qinghai–Tibetan Plateau

1
College of Marine Science and Biological Engineering, Qingdao University of Science Technology, Qingdao 266042, China
2
Institute of Forest Ecology, Environment and Protection, Chinese Academy of Forestry and the Key Laboratory of Biological Conservation of State Forestry Administration, Beijing 100091, China
*
Author to whom correspondence should be addressed.
Submission received: 30 April 2022 / Revised: 15 May 2022 / Accepted: 17 May 2022 / Published: 19 May 2022
(This article belongs to the Section Environmental Microbiology)

Abstract

:
Soil microbes play important roles in determining plant community composition and terrestrial ecosystem functions, as well as the direction and extent of terrestrial ecosystem feedback to environmental changes. Understanding the distribution patterns of plant and soil microbiota along elevation gradients is necessary to shed light on important ecosystem functions. In this study, soil bacteria along an elevation gradient in an alpine meadow ecosystem of the Qinghai–Tibetan Plateau were investigated using Illumina sequencing and GeoChip technologies. The community structure of the soil bacteria and plants presented a continuous trend along the elevation gradient, and their alpha diversity displayed different distribution patterns; however, there were no linkages between them. Beta diversity of the soil bacteria and plants was significantly influenced by elevational distance changes (p < 0.05). Functional gene categories involved in nitrogen and phosphorus cycling had faster changes than those involved in carbon degradation, and functional genes involved in labile carbon degradation also had faster variations than those involved in recalcitrant carbon degradation with elevational changes. According to Pearson’s correlation, partial Mantel test analysis, and canonical correspondence analysis, soil pH and mean annual precipitation were important environmental variables in influencing soil bacterial diversity. Soil bacterial diversity and plant diversity had different distribution patterns along the elevation gradient.

1. Introduction

Soil microbe–plant linkages play key roles in regulating the direction and extent of terrestrial ecosystem responses to environmental change, as well as the composition of plant communities and terrestrial ecosystem functions [1,2,3,4]. Plant diversity is widely used to predict soil microbial diversity, and a more diverse plant community is associated with a more diversified soil microbial community [2,5]. Evidence is increasingly suggesting that soil microbes can influence plant diversity and community composition, because soil microbes are important in biogeochemical cycles and many ecosystem processes [6,7,8]. Free-living soil microbes might indirectly promote plant diversity by increasing the diversity of the available nutrient pools [9]. Both arbuscular mycorrhizal fungi and N-fixing rhizobia bacteria symbionts complement each other, resulting in increased plant diversity [10]. Therefore, the relationships between soil microbial diversity and plant diversity tend to be mutualistic. However, there is still inconsistency, especially for being somewhat disengaged from alpha to beta diversity [1,2,11,12]. As a result, our lack of knowledge of the underlying links between soil microbial diversity and plant diversity means that we still have much to learn [2].
Climate change is becoming one of the largest anthropogenic disturbances to human well-being and natural ecosystems, and it alters species distributions and inter-organism interactions [7,13]. Many researchers have paid attention to the effect of climate change on soil microbes, plants, and their linkages in terrestrial ecosystems, and their findings from experimental and observational studies have shown variable associations within single sites or across broad spatial scales [2,11,12,14,15,16]. However, the responses and interactions of soil microbes and plant communities to climate change, including warming and changing precipitation, remain unclear [1,17,18,19]. This could be due to the fact that: (i) most previous experiments have primarily focused on plant communities; (ii) there are technological limitations due to the high plasticity and complexity of microbial community in natural environments; (iii) although some controlled warming experiments have lasted over a decade, the majority of them are short term; (iv) numerous warming studies focused only on several temperature points without continuous gradient changes [19,20,21,22].
Elevation gradients can serve as analogs for climate change, characterized by biotic turnover over small geographic distances and dramatic changes in climate. They play a critical role in the progression of biogeographical and ecological studies, as well as the prediction of possible consequences of long-term climate change [2,15,23,24]. Therefore, elevation gradients may be used as powerful “natural experiments” to test theories on how ecosystems adapt to climate change and feedback [7,24,25,26].
The Qinghai–Tibetan Plateau is the largest and highest low-latitude plateau in the world [27], and it is considered as the world’s third “pole” [28]. An alpine meadow is widely distributed from the elevation of 3200–5300 m, covering more than 40% of the Qinghai–Tibetan Plateau area [29,30]. The alpine meadow is a large soil organic carbon (SOC) pool, accounting for 2.5% of global soil carbon pool with an SOC content (0–75 cm) of 23.2 Pg [31]. Therefore, the alpine meadow ecosystem is extremely sensitive to climate change, making it an ideal place for adopting a space-for-time substitution strategy to study the response of natural ecosystems to climate change along elevation, temperature, and precipitation gradients [32,33,34].
In this study, we analyzed soil microbial communities and explored different distribution patterns and their linkages with soil bacterial diversity and plants along an elevation gradient in an alpine meadow ecosystem of the Qinghai–Tibetan Plateau based on high-throughput Illumina sequencing and functional gene microarray (GeoChip). The aims were to determine: (1) how soil bacterial communities and plants are distributed along an elevation gradient in an alpine meadow ecosystem, (2) how plant and soil microbial diversity (alpha and beta diversity) are linked, and (3) how different environmental factors affect plant and soil bacterial diversity under climate change.

2. Materials and Methods

2.1. Study Sites and Sampling

The study sites were located in the Sanjiangyuan National Natural Reserve in Qinghai Province, China (97°40′22″–100°05′27″E, 34°08′16″–35°56′06″N), which lies in the heart of the Qinghai–Tibetan Plateau [35]. The annual mean air temperature and annual mean precipitation are 3.8–5.6 °C and 262.2–772.8 mm, respectively [36]. In July, 2012, six study sites were selected from alpine meadow systems with similar slopes and aspects from 3200 to 4800 m, with an elevation distance of about 200–300 m. The sites were named in accordance with their altitudes (SJY-3220, SJY-3490, SJY-3880, SJY-4140, SJY-4480, and SJY-4790), and their detailed site information is presented in Table 1.
A grid of 200 m × 200 m was set up, and a total of 13 sample plots with 1 m × 1 m were acquired at each site. We sampled with two transect belts along the horizontal and vertical axes, which were located at 5-, 10-, 20-, 50-, 100-, and 200-m distances from the original point. Soil samples were obtained at 0–10 cm soil depth in non-rhizosphere soil of each plot using the diagonal method [37], and ten soil cores (diameter 4 cm) were taken from each plot and mixed to yield about 400 g of soil. Stones and roots were removed from samples before completely mixing the samples from each plot. At each site, 13 soil samples were collected. About 100 g of soil was preserved at −80 °C for soil microbial community research, and the rest of soil was kept at room temperature for soil property measurements. These detailed analyses are described in Section 2.2, Section 2.4, Section 2.5 and Section 2.6. Plant diversity and properties, including plant number, plant species, plant height, and canopy of each grass, were investigated in each plot using stand species identification and survey methods.

2.2. Measurement of Soil Physicochemical Characteristics

The SOC, total nitrogen (TN), available nitrogen (AN), total phosphorus (TP), available phosphorus (AP), soil pH, and soil moisture (Mo) were measured as previous study [38]. SOC and TN were determined by the wet oxidation and modified Kjeldahl procedures, soil pH was measured based on a pH meter with the glass electrode at a water to soil ratio of 2.5:1, and TP was assessed with a wet digestion method with concentrated HF and HClO4 [38]. Plant and soil physicochemical properties are listed in Table S1.

2.3. Climate Data

Climate data were collected by the WorldClim (www.worldclim.org, accessed on 14 February 2019) global climate dataset based on the recorded GPS location information in each sampling plot. Mean annual precipitation (MAP) and mean annual temperature (MAT) over 50 years (1950–2000) were used to represent climate warming at each site.

2.4. Soil Microbial DNA Extraction, Purification, and Quantification

According to the manufacturer’s instructions, soil microbial DNA was extracted by the Fast DNA Spin kit for soil (MP Biomedical, Carlsbad, CA, USA). The quality of purified DNA was analyzed at the ratios of absorbance at 260/230 nm and 260/280 nm with a Nanodrop ND-1000 Spectrophotometer on a 0.8% low-melting-point agarose gel (Nanodrop Technologies, Inc., Wilmington, DE, USA). Finally, microbial DNA was quantified by a FlUOstar Optima (BMG Labtech, Jena, Germany).

2.5. Illumina Sequencing of Bacterial 16S rRNA Gene Amplicons and Data Processing

The purified DNA as a template, as well as 5′- GTGCCAGCMGCCGCGGTAA-3′ (515F) and 5′- GGACTACHVGGGTWTCTAAT-3′ (806R) as the forward and reverse PCR primer sequences, were used to amplify the V4 hypervariable region of bacterial 16S rRNA gene. Reverse primers were coupled with a barcode sequence. The PCR amplification system was in a 25 μL reaction, containing 0.4 μM primers, 5 μL DNA, 2.5 μL AccuPrime PCR buffer II [39], and 0.1 μL Taq Polymerase. The detailed PCR amplification conditions followed those described by Ding et al. A Miseq platform (Illumina, San Diego, CA, USA) was used to perform 2 × 250 bp paired-end sequencing on PCR products [38,40].
The 16S rRNA gene sequencing data were demultiplexed based on their unique barcode sequence. Low-quality (average quality score < 20%) and ambiguous DNA reads (contain N) were trimmed and deleted. FLASH (version 1.0.0) with a phred-offset of 33 was used to integrate the forward and reverse reads into a whole sequence [41]. Chimeric sequences were detected by UCHIME (version 5.2.3) [42]. UCLUST was used to define the operational taxonomic units (OTUs) at a 97% similarity level [42]. Singletons were removed. Taxonomic identification of each phylotype was determined using the ribosomal database project classifier (version 2.12). The number of identified OTUs at different classification levels was counted. Random resampling per soil sample was processed using the lowest sequences number (10,000). Data processing was finished using the Galaxy sequencing pipeline at the Institute for Environmental Genomics, University of Oklahoma, USA (http://zhoulab5.rccc.ou.edu:8080/, accessed on 14 February 2019).

2.6. GeoChip Hybridization and Data Processing

GeoChip 4.0 was used to explore the potential key metabolic functions of soil microbes. GeoChip 4.0 contains about 82,000 oligonucleotide probes containing 141,995 microbial functional genes engaged in 410 gene categories involved in carbon (C), nitrogen (N), and phosphorus (P) cycling, as well as other biogeochemical processes. Detailed probe and function information for GeoChip is displayed on the website (http://ieg.ou.edu, accessed on 14 February 2019). Cy3 fluorescent dye was labeled on microbial DNA by a random priming approach [43]. DNA hybridization was carried out at 42 °C for 16 h in a hybridization station (MAUI, BioMicro Systems, Salt Lake City, UT, USA), and the arrays were scanned at full laser power and 100% photomultiplier tubes with a NimbleGen MS200 Microarray scan (Roche, Madison, WI, USA). Scanned images were processed by NimbleScan software [43].
All the raw GeoChip data were uploaded to the data analysis manager (GeoChip 4.0) (http://ieg.ou.edu/microarray/, accessed on 14 February 2019). GeoChip data were pre-processed as follows: (i) spots with a signal-to-noise ratio of less than 2.0 or signal intensity less than 1000 were deleted, (ii) functional genes that were found in less than 6 out of 13 replicate samples in each study site were removed, and (iii) functional gene signal intensity was normalized by dividing the average signal intensity value of each plot.

2.7. Statistical Analysis

Plant alpha diversity was calculated using Shannon index and Pielou index. Soil bacterial richness, Shannon index, and Simpson index were counted based on 16S rRNA sequencing data. Normalized signal intensity of functional gene category and gene family at the same level was summed. Beta diversity of soil bacteria and plants was calculated based on Bray–Curtis distance, and the linkage between them was analyzed. Principal coordinates analysis (PcoA) was used to assess plant and bacterial community structure. Partial Mantel tests and canonical correspondence analysis (CCA) were used to investigate the relationship between community structure and environmental variables. We used variation inflation factors (VIFs) to determine whether the variance in canonical coefficients was inflated by the presence of correlations with environmental factors while choosing an attribute for the CCA model. The VIFs were used to remove superfluous parameters step by step in the CCA modeling. The R software package (v.3.5.2) was used for all statistical analysis, except for Analysis of variance (ANOVA) and Pearson correlation by IBM SPSS statistic 19.0.

3. Results

3.1. Climate and Soil Physicochemical Characteristics

According to the 1950–2000 climate data from WorldClim, the MAT of the warmest quarter increased as the elevation decreased, from 4.9 °C at SJY-4790 to 11.6 °C at SJY-3220, while the MAP reduced from 417 mm at SJY-4790 to 319 mm at SJY-3220 (Table S1). Therefore, both the MAT and MAP distinctly changed along the elevation gradient. In addition, the contents of SOC, TN, AN, and soil moisture showed similar trends to the MAP (Table S1). Soil pH significantly increased as the elevation decreased, and it was positively correlated with the MAP. Therefore, soil physicochemical characteristics changed dramatically and showed discrepant patterns along the elevation gradient.

3.2. Distribution Pattern of Plant Diversity along Elevation Gradient

A total of 74 plant species were identified at six sites, belonging to 21 families and 51 genera. Cyperaceous plants, such as Kobresia pygmaea, Kobresia schoenoides, and Kobresia humilis, became the dominant species in high-and middle-elevation locations (SJY-4790, SJY-4480, SJY-4140, and SJY-3880), while Poaceae plants, such as Poa annua, Stipa capillata, and Elymus nutans, dominated in the low-elevation locations (SJY-3490 and SJY-3220) (Table 1). Plant Shannon index and Pielou index were calculated by the field survey data, and revealed no distribution pattern along the elevation gradient (Table 2). Of the six research locations, SJY-4480 and SJY-4140 had the highest plant Shannon indices, while SJY-3880 had the lowest Shannon and Pielou indices. PcoA analysis showed plant community structure differed between sites, and a continuous trend was developed across the axis1 from SJY-3220 to SJY-4790 (Figure 1a). Plant beta diversity was significantly affected by elevation distance (r = 0.696, p < 0.001, Figure S1a). These findings revealed that plant alpha diversity had no elevation distribution patterns, while plant community structure and beta diversity were significantly changed along the elevation gradient in the alpine meadow ecosystem (p < 0.001).

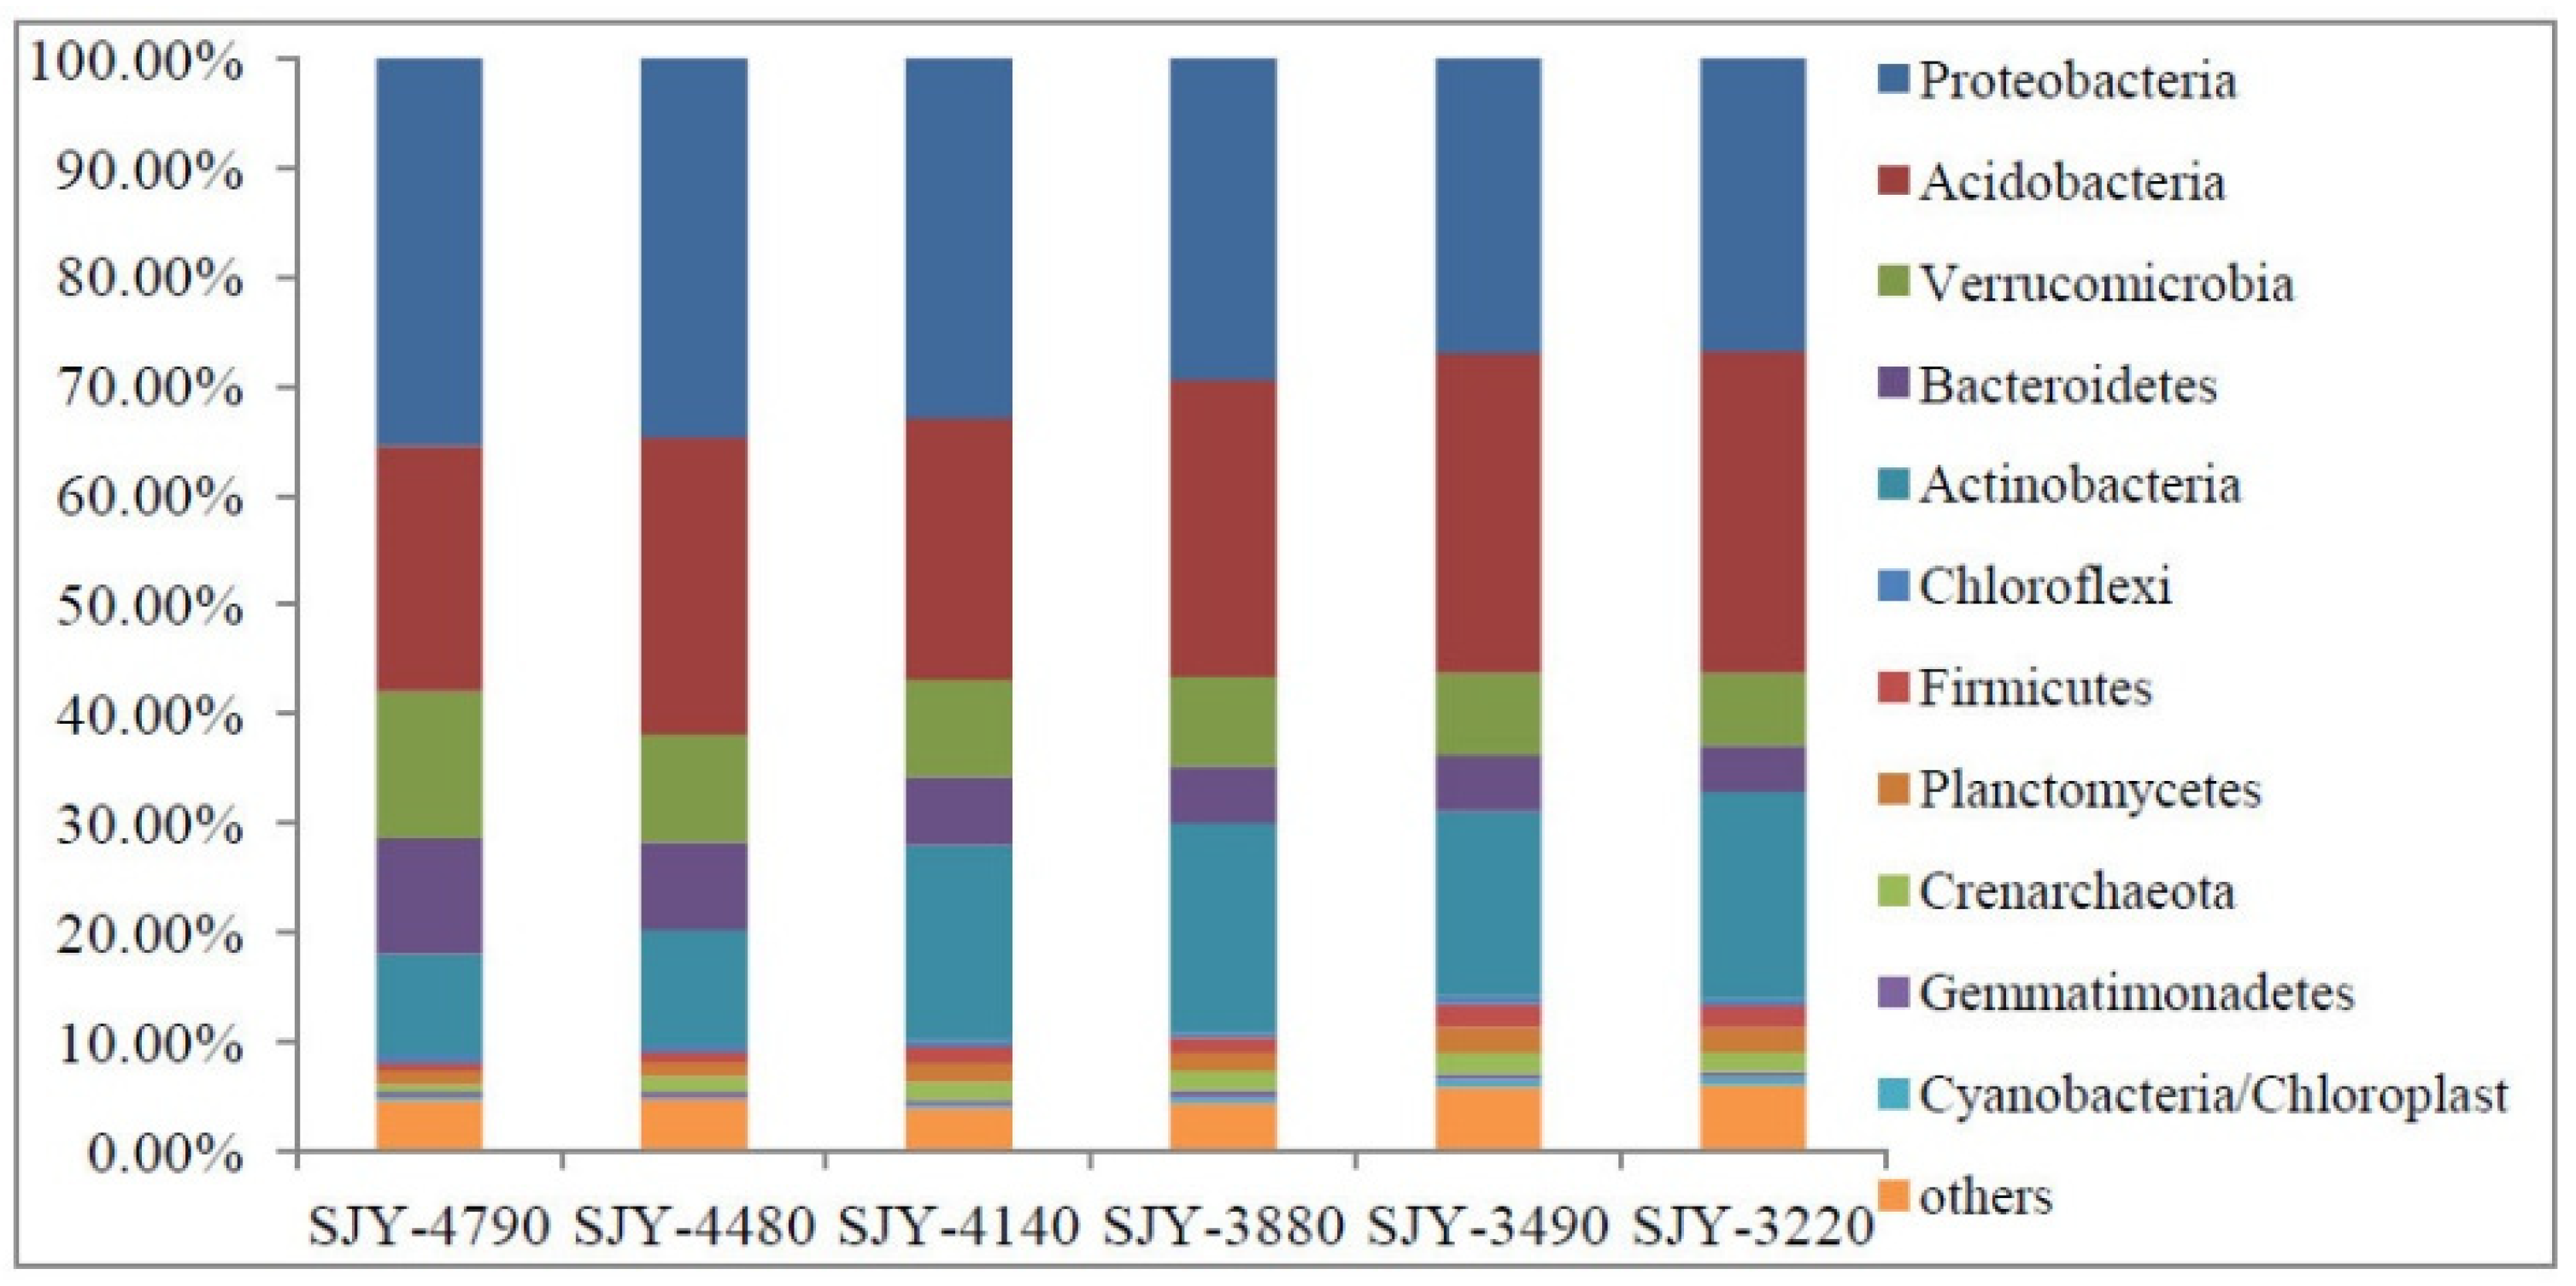
3.3. Distribution Pattern of Soil Community Structure and Bacterial Diversity along Elevation Gradient

A total of 1,726,038 high quality sequences were obtained from grassland soil samples. These sequences were classified into 33,046 OTUs at 97% sequence identity threshold. At least 28 known bacterial phyla were detected by phylogenetic analysis. Soil bacterial community structure changed among different sites. Proteobacteria was the most dominant phylum from SJY-4790 to SJY-4140, accounting for over 29% of the relative abundance, while Acidobacteria was the most dominant phylum in SJY-3220 and SJY-3490, accounting for over 29% of the relative abundance (Figure 2). Along the elevation gradient, three different soil bacterial distribution patterns were observed: (i) the richness and relative abundance of Proteobacteria, Verrucomicrobia, and Bacteroidetes were considerably decreased as elevation decreased; (ii) the richness and relative abundance of Acidobacteria and Actinobacteria were dramatically increased as elevation decreased; (iii) some taxa, such as the Gemmatimonadetes and Chlorobi, were not changed along the elevation gradient (Table S2). The relative abundance of dominant classes of soil bacteria (>0.1%) followed a similar pattern (Table S3). For example, when elevation decreased, Alpha-proteobacteria and Acidobacteria Gp4 were greatly increased, while Gamma-proteobacteria and Acidobacteria Gp22 were decreased (Table S3).
Soil bacterial alpha diversity was calculated by Shannon and Simpson indices, and OTU numbers (richness). Shannon index ranged from 7.26 ± 0.12 to 7.50 ± 0.08, Simpson index ranged from 448 ± 102 to 755 ± 145, and OTU richness ranged from 3144 ± 215 to 3517 ± 153 at these six sites (Table 2 and Table S2). Soil bacterial alpha diversity was significantly higher (p < 0.05) at low-elevation sites (SJY-3220 and SJY-3490) than at high-elevation sites (SJY-4790, SJY-4480, SJY-4140, and SJY-3880). However, there were no differences among these high-elevation sites (SJY-4790, SJY-4480, SJY-4140, and SJY-3880) (Table 2 and Table S2). PcoA showed that soil bacterial community structure presented a continuous trend across the axis1 from SJY-3220 to SJY-4790 (Figure 1b). Bacterial beta diversity was significantly affected by elevation distance changes (r = 0.865, p < 0.001, Figure S1b). These results showed that soil bacterial community structure and diversity significantly altered along the elevation gradient in the alpine meadow ecosystem.

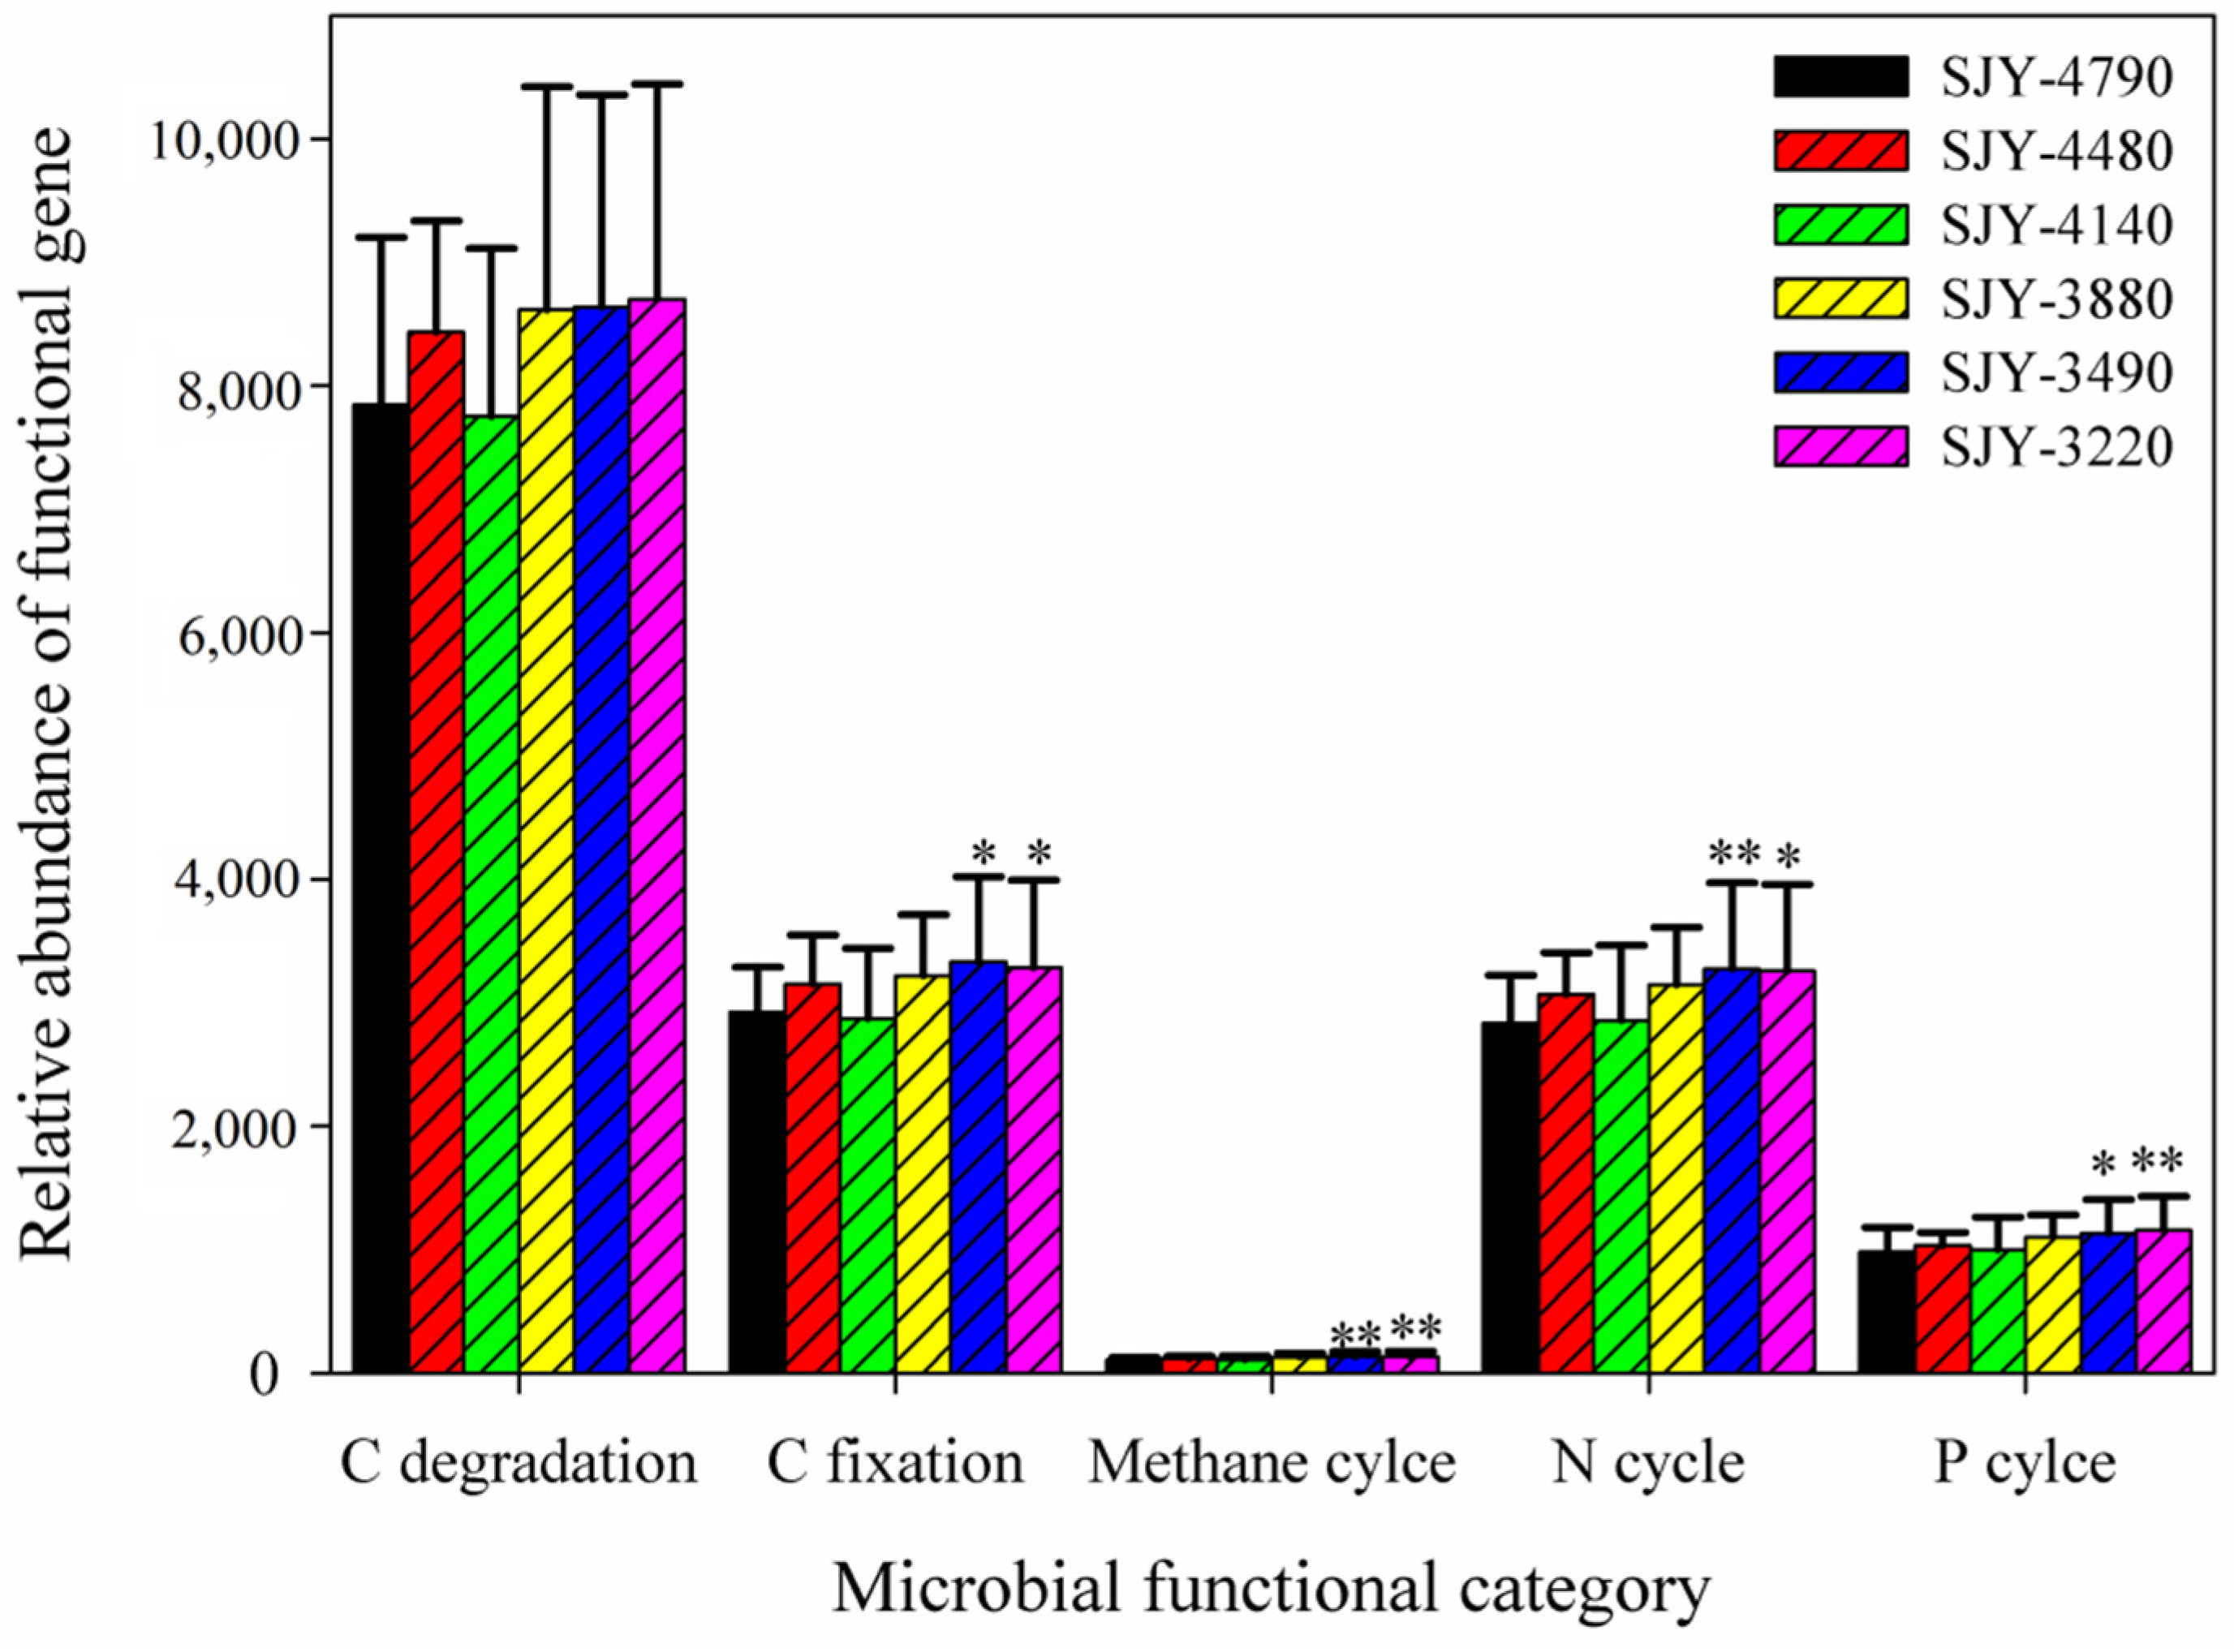
3.4. Soil Microbial Functional Genes Involved in C, N, and P Cycles

Soil microbial functional genes involved in C, N, and P cycling were analyzed by GeoChip 4.0. There were 23,898, 6698, and 2146 genes found in response to C, N, and P cycling, respectively. The relative abundance of functional gene categories varied among different soil sampling sites; however, no elevation trends were observed (Figure 3). Total relative abundance of functional gene categories involved in N cycling, C fixation, methane metabolism, and P cycling at SJY-3220 and SJY-3490 were significantly higher than at SJY-4790 (p < 0.1), while functional gene categories involved in SOC degradation remained changed (Figure 3).
Gene categories produced comparable results at the functional gene level. Most functional genes involved in soil N (nifH, amoA, nosZ, and nirK) and P (ppk and ppx) cycling increased in relative abundance as elevation decreased, and they were significantly higher at SJY-3220 and SJY-3490 than at the high-elevation sites (SJY-4790, p < 0.1, Table S4). Many genes involved in labile C degradation (starch, cellulose, and hemicellulose) at SJY-4790 were significantly higher compared to the low-elevation sites. For example, xylanase gene involved in hemicellulose degradation was significantly higher at SJY-3490 (p = 0.092) and SJY-3220 (p = 0.028) than at SJY-4790 (Table S4). However, there was no difference among these genes involved in soil recalcitrant C degradation (lignin). Thus, functional genes involved in labile C degradation probably respond to elevation changes faster than genes involved in recalcitrant C degradation.

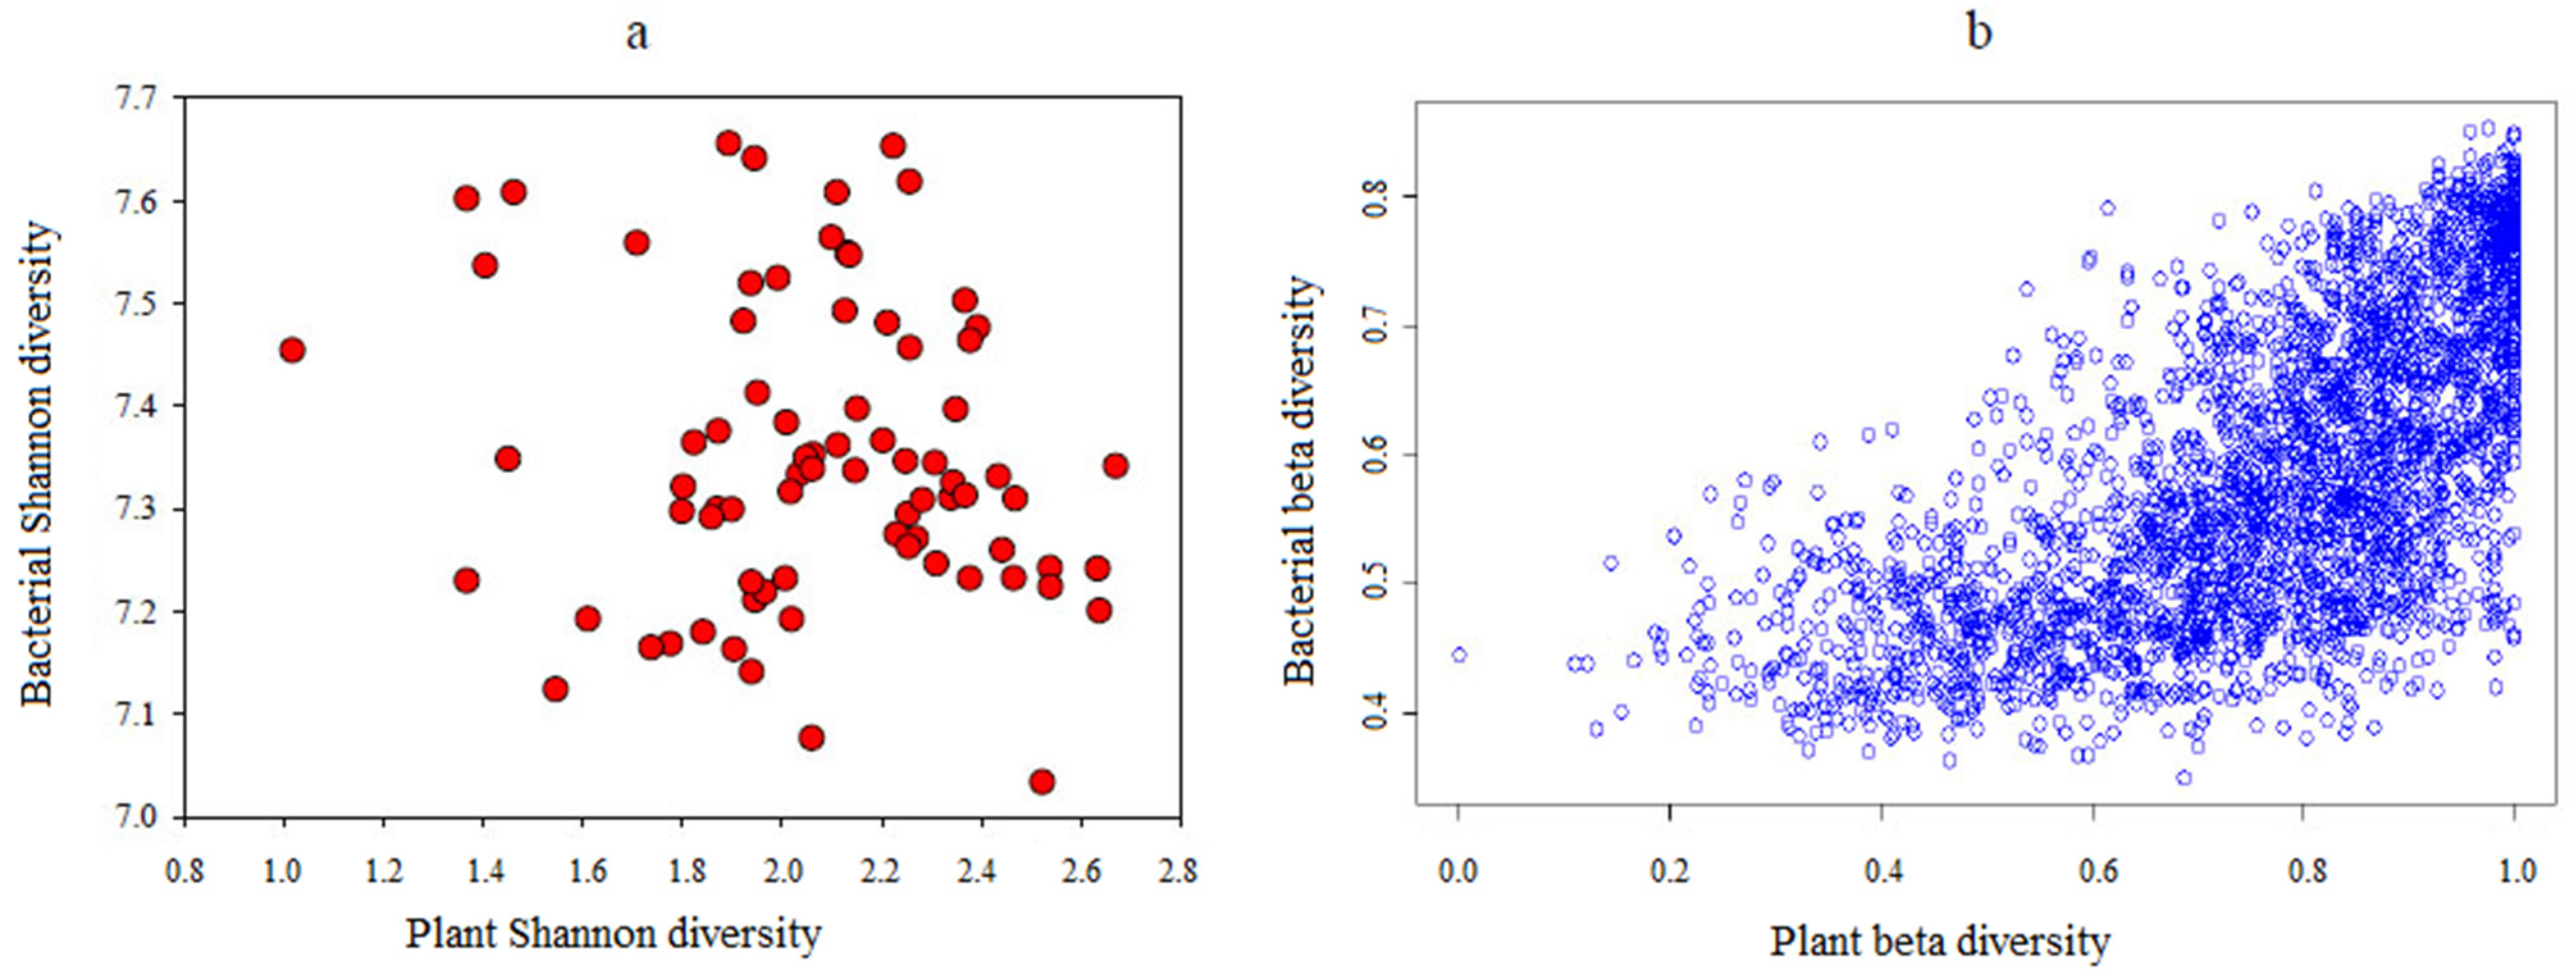
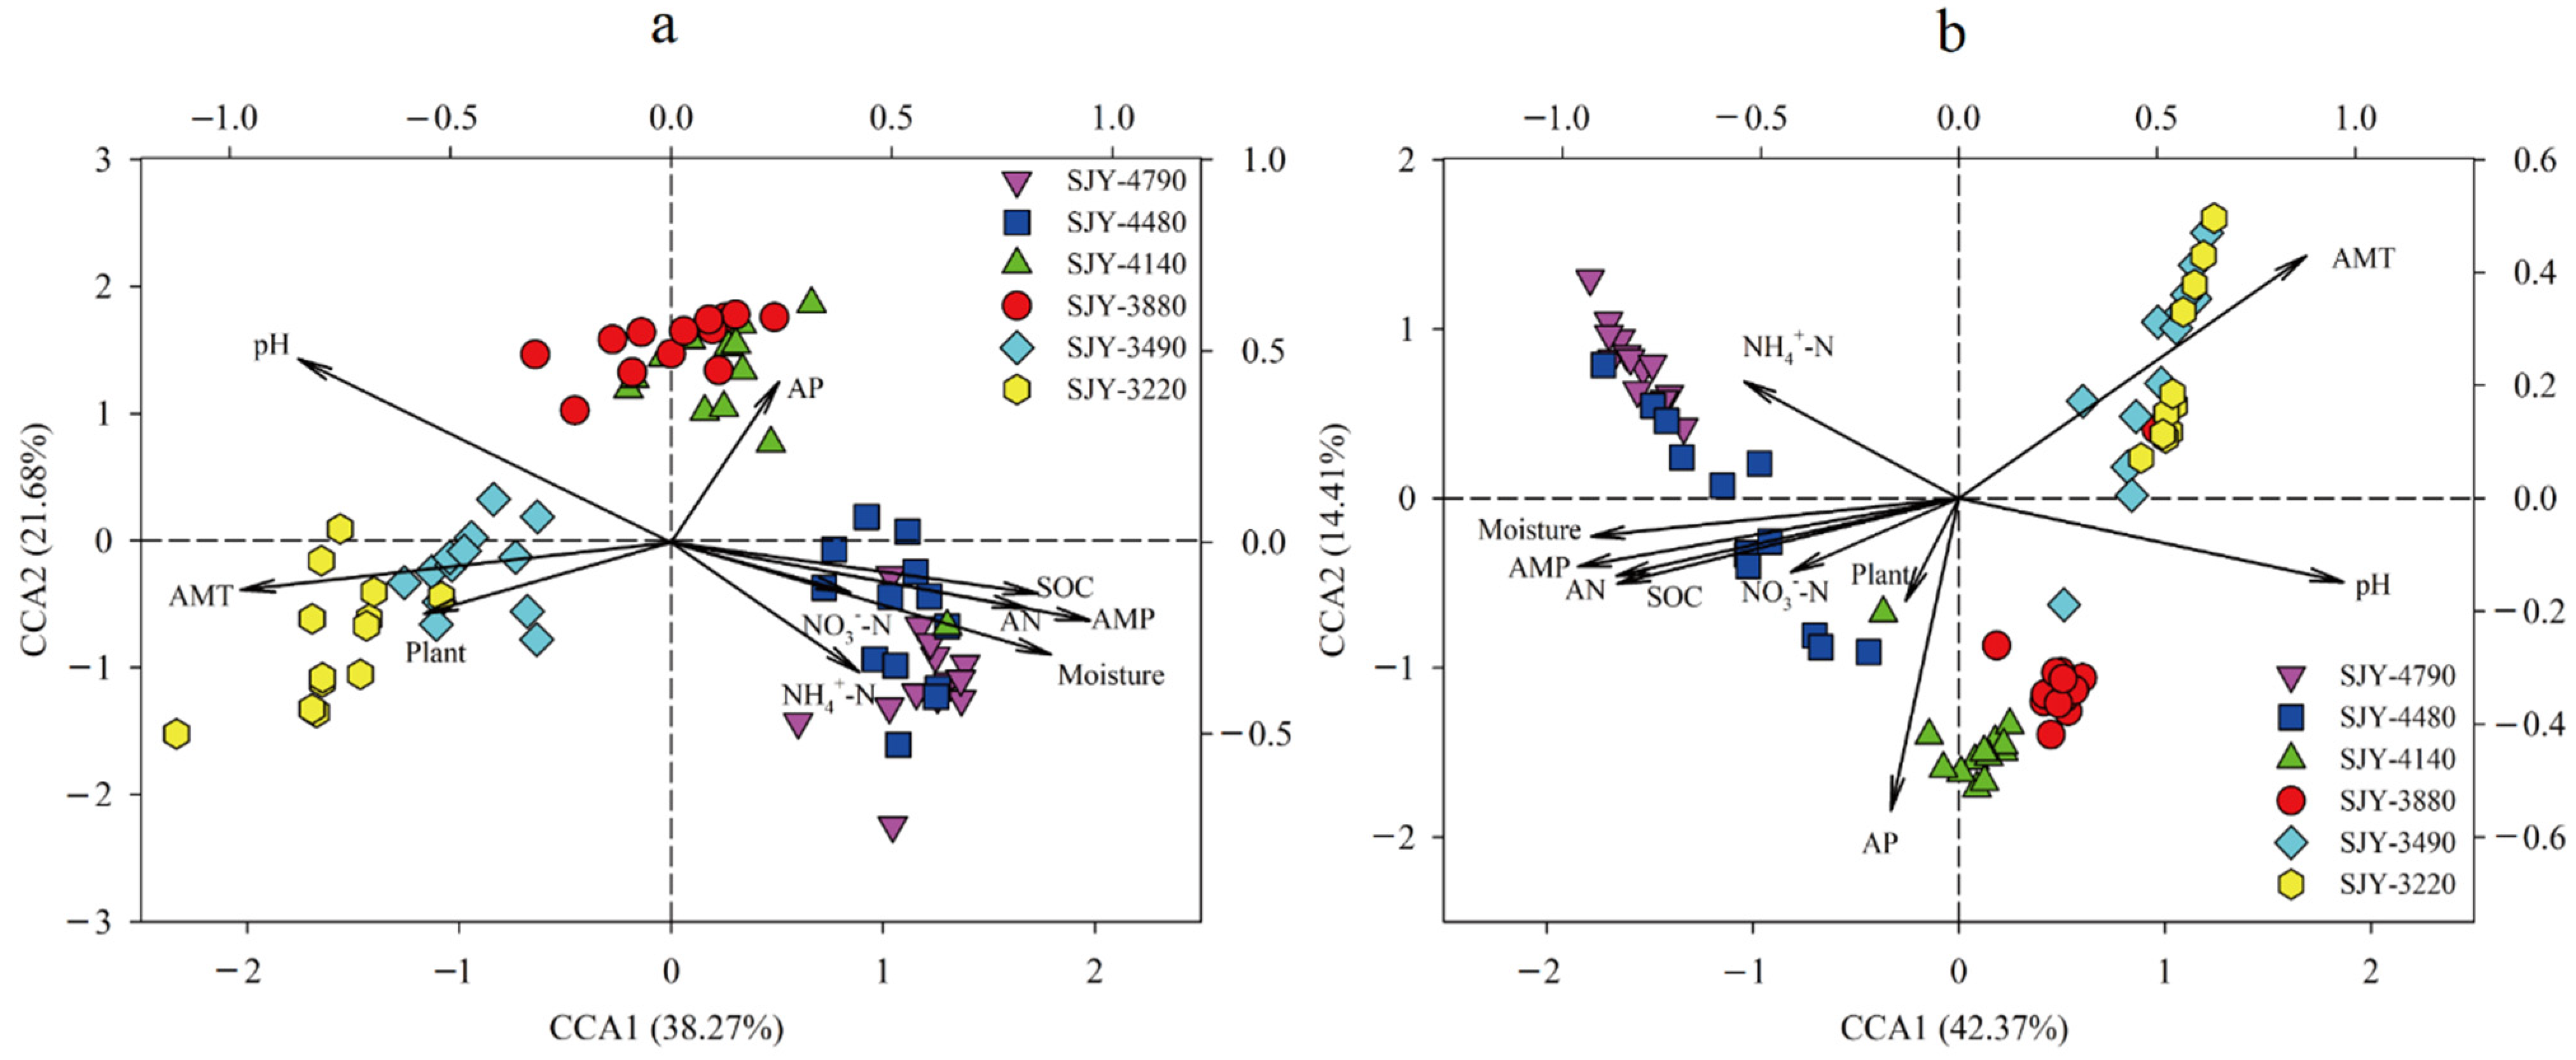
3.5. The Linkages among Plants, Soil Bacterial Diversity, and Environmental Factors

The relationship among plants, soil bacterial diversity, and environmental factors was analyzed by Pearson’s correlation. Plant and soil bacterial Shannon diversity had no direct positive relationship (r = −0.147, p = 0.198) (Figure 4a). Soil bacterial Shannon diversity was significantly negatively (p < 0.01) related with soil site elevation, MAP, soil moisture, SOC, TN, TP, AN, and NH4+-N, and significantly positively correlated with MAT and soil pH (p < 0.01, Table S5). However, none of the climatic or soil nutrient environmental parameters were shown to be substantially associated to plant Shannon diversity (Table S5). Therefore, there was no correlation between plant and soil bacterial alpha diversity, which was probably influenced by diverse environmental conditions.
Partial Mantel tests were performed to determine the relationship between soil bacterial beta diversity and plants, as well as how they were affected by environmental factors. The results showed plant beta diversity was significantly linked with soil bacterial beta diversity (r = 0.493, p < 0.001), MAT (r = 0.453, p < 0.001), and MAP (r = 0.424, p < 0.001), while soil bacterial beta diversity was found to be significantly correlated with MAP (r = 0.679, p < 0.001) and soil pH (r = 0.668, p < 0.001) (Table 3). Regression analysis revealed that plant and soil bacterial beta diversity were significantly associated (r = 0.659, p < 0.001, Figure 4b). CCA results indicated that MAT and MAP were the most important factors determining plant community variations (Figure 5a), whereas MAP and soil pH were the most important variables regulating soil bacterial community variation (Figure 5b). Therefore, MAP and soil pH were the key variables influencing soil bacterial beta diversity. Soil bacterial beta diversity, MAT, and MAP may be the key factors shaping plant beta diversity in the alpine meadow ecosystems.

4. Discussion

The primary concerns of whether soil microbial diversity changes along elevation gradients and whether this pattern resembles that observed in macroorganisms remain unanswered. In the current study, plant and soil bacterial diversity had different elevation diversity patterns. Previous studies yielded different findings on microbial community patterns with increasing elevation: a monotonous decrease [23], or increase [44], or no trend [45], or a humpbacked trend [46]. These different elevation distribution patterns of soil microbes might be caused due to the large variety of different environmental conditions [15].
Elucidating the causes of changes in soil microbial diversity and plant diversity, as well as soil microbe–plant interactions under environmental changes remains a research priority that will shed light on significant ecosystem functions such as plant net primary productivity and soil C storage [7,47,48]. Plants’ diversity patterns have been attributed to spatial factors, climate factors, abiotic factors, or biotic factors in previous studies, and these patterns generally exhibit either monotonically declining or hump-shaped diversity patterns with increased elevation [49,50,51]. Plant alpha diversity had no strong relationship with soil bacterial alpha diversity and other environmental factors in the current study, although it may be affected by human disturbances [52]. Soil bacterial Shannon index was closely related with climate factors (elevation, MAT, and MAP) and soil nutrients (soil moisture, pH, and SOC). Previous experimental and observational investigations found some favorable connections between plant and soil microbial alpha diversity [5,8,53,54]. Zhelezova et al. concluded that soil bacterial alpha diversity in the upper horizon was higher in the growing season (vegetation development) and decreased significantly in non-growing season [55]. Yashiro et al. found soil microbial community and plant alliances tended to be synchronized in community turnover across the grassland mountain landscape in the western Swiss Alps [16]. The contradictory results may be explained by discrepancies in the spatial scale of inquiry into environmental variables, as well as resistance or resilience rates of soil microbes to environmental changes [2,41,56].
Shifts in the soil microbial community are important response mechanisms that can help the adaptation of soil ecosystem functions to environmental changes [7,56,57,58]. In this study, SOC and several other soil nutrients decreased dramatically as elevation decreased, resulting in nutrient-rich or nutrient-limited environments at high-elevation and low-elevation sites (SJY-3490 and SJY-3420, respectively). The most important dominating phylum shifted from Proteobacteria at higher elevation to Acidobacteria at lower elevation (SJY-3490 and SJY-3420), probably in response to their well-known ecological preference for nutrient-rich or nutrient-limited conditions. Acidobacteria was known as a good competitor in oligotrophic environments, which could thrive in nutrient-limited ecosystems, while Proteobacteria was inclined to be in copiotrophic conditions, which dominated in nutrient-rich environments [1,59,60]. Acidobacteria was the most common group at low-elevation, possibly due to their low C turnover, which allows them to adapt to the low-nutrient soil environment as “stress tolerators” [61]. Of course, not all taxa in a phylum will be either copiotrophic or oligotrophic [60], hence other classifier levels should be used to predict soil C loss [62]. In our study, Beta- and Gamma-proteobacteria decreased as elevation decreased; however, Acidobacteria GP4 and GP6 increased. Therefore, these classes exhibit obvious adaptability to varying soil nutrient levels.
A significant positive relationship (p < 0.01) between soil microbes and plants was encouraged by their beta diversity, suggesting that plant diversity predicted beta but not alpha diversity of soil microbes, confirming Prober et al.’s findings [2]. However, the relationship between plant diversity and soil bacterial diversity is influenced by different environmental drivers. Soil bacterial beta diversity was significantly related with elevation, MAP, and soil pH; nevertheless, plant beta diversity was significantly correlated with soil bacterial beta diversity and climate factors (MAT and MAP). The strong driving role of soil pH, significantly affected by MAP, in soil microbial community composition is consistent with previous work [63,64]. Reduced MAP and soil dryness may improve oxygen availability and soil C cycling [65]. Understanding how soil microbe–plant interactions respond to climate change is a research priority, but findings remain inconsistent [58]. Our results showed soil bacterial beta diversity was one of the key factors influencing plant community structure, implying that a soil microbial-mediated nutrient acquisition strategy could alter local plant diversity directly or indirectly under climate change [66]. Because soil microbes regulate soil nutrient transformations, this may have large implications for plant community composition and ecosystem functions [67]. Soil microbes have been increasingly considered as important drivers of plant diversity in recent years [2,7,9,68]. Van der Heijden et al. predicted that soil microbes promoted plant diversity by increasing soil available nutrients [9]. Delgado-Baquerizo et al. reported that soil microbial diversity played a positive role in linking to multifunctionality in terrestrial ecosystems [69]. Teste et al. identified that the soil microbial nutrient acquisition strategy was an important trait explaining how different responses to soil biota improve local plant diversity [3]. Ferreira DA et al. highlighted a potential overall helper effect of soil biodiversity on plant–arbuscular mycorrhizal fungi symbiosis [68].
Soil microbial communities have important effects on maintaining multiple ecosystem services and functions simultaneously [70,71]. They are sensitive to environmental changes, and alterations in microbial abundance or diversity can have an impact on ecosystem processes and functions [9,69,70]. In our study, the relative abundance of microbial functional genes involved in N and P cycling was significantly higher at the low-elevation sites (SJY-3490 and SJY-3220) than at the SJY-4790 site, suggesting that soil microbial functions related to N and P cycles might have a faster change than C degradation functions. Soil N and P contents are essential limiting factors for plant primary production and microbially-mediated biogeochemistry cycles in terrestrial ecosystems, especially in nutrient-limited environments [72,73,74]. More soil N may be lost from the soils when elevation decreasing or climate warming, mediated by potential denitrification processes, and more N mineralization may occur to meet the needs of ecosystem functions [74,75]. The amoA and hao genes related to N nitrification were significantly higher in SJY-3490 and SJY-3220 than in SJY-4790. The nirB, nirA, and NirR genes related to assimilatory N reduction, as well as the nifH gene related to N2 fixation, displayed similar trends along elevation gradient to the amoA genes. Upregulation of these microbial functional genes might produce more NH4+ and NO3 to meet the needs of both microorganisms and plants [57,69,74,75]. P availability not only influenced soil microbial growth, but it was also a key factor driving biogeochemical function and microbial community structure [76,77]. The ppk gene (polyphosphate kinase) for polyphosphate biosynthesis and the ppx gene (exopolyphosphatase) for inorganic polyphosphate degradation were also significantly higher at the SJY-3490 and SJY-3220 sites than at other sites, indicating that more inorganic P might be used by desorption and dissolution from soil minerals to meet ecosystem functions at these sites [69,78].
In summary, we analyzed plant and soil microbial diversity in the alpine meadow ecosystem of the Qinghai–Tibetan Plateau, China, based on Illumina sequencing and GeoChip technologies to better understand the distribution patterns of plant and soil microbial diversity along elevation gradients and their linkages. We realized that plant and soil microbial alpha diversity had different distribution patterns and no links. Functional gene categories involved in N and P cycling may experience quicker elevational gradient shifts than functional genes involved in C degradation. Beta diversity of plants and soil bacteria was significantly increased as elevation distance increased and they were significantly correlated with each other. The elevation, MAP, and soil pH were important environmental variables in shaping soil bacterial beta diversity, while plant beta diversity was significantly correlated with soil bacterial beta diversity and climate factors.

Supplementary Materials

The following supporting information can be downloaded at: https://0-www-mdpi-com.brum.beds.ac.uk/article/10.3390/microorganisms10051049/s1, Table S1. The climate and soil physicochemical characteristics in all six study sites. Table S2. Soil bacterial richness at the phylum level at six study sites. Table S3. Soil bacterial relative abundance of dominant (>0.10%) classes at six study sites. Table S4. The soil microbial functional gene relative abundance at different functional gene categories in all six sites. Table S5. Pearson correlation between plant and bacterial alpha diversity and individual environmental factors. Figure S1. The relationships between plant beta diversity (a) (r = 0.696, p = 0.001) and soil bacterial beta diversity (b) (r = 0.865, p = 0.001) and change elevation distance.

Author Contributions

Conceptualization, Y.Z.; methodology, Y.Z. and J.C.; software, Y.Z. and J.C.; validation, Y.Z. and J.C.; formal analysis, Y.Z. and J.C.; investigation, Y.Z., J.C., H.L. and W.C.; resources, Y.Z., J.C., H.L. and W.C.; data curation, Y.Z., J.C., H.L. and W.C.; writing—original draft preparation, Y.Z. and J.C.; writing—review and editing, Y.Z. and J.C.; visualization, Y.Z. and J.C.; supervision, Y.Z. and J.C.; project administration, Y.Z. and J.C.; funding acquisition, Y.Z. and J.C. All authors have read and agreed to the published version of the manuscript.

Funding

This research was funded by National Nature Science Foundation of China, grant number “31670614”, Fundamental Research Funds of CAF, grant number “CAFYBB2017SY027”, and Key Research and Development Project of Hubei Province, grant number “2020BCA081-03”.

Institutional Review Board Statement

Not applicable.

Informed Consent Statement

Not applicable.

Data Availability Statement

16S rRNA sequences have been deposited to GenBank databases and the accession number is SRP117325.

Acknowledgments

The authors appreciate Yuanyuan Qu and Daliang Ning for their assistance in 16S rRNA sequencing data analysis, and Fang Liu for providing the climate data. The authors are very grateful to Alex Boon for editing the English text of a draft of this manuscript.

Conflicts of Interest

The authors declare no conflict of interest.

References

  1. Singh, B.K.; Bardgett, R.D.; Smith, P.; Reay, D.S. Microorganisms and climate change: Terrestrial feedbacks and mitigation options. Nat. Rev. Microbiol. 2010, 8, 779–790. [Google Scholar] [CrossRef] [PubMed]
  2. Prober, S.M.; Leff, J.W.; Bates, S.T.; Borer, E.T.; Firn, J.; Harpole, W.S.; Lind, E.M.; Seabloom, E.W.; Adler, P.B.; Bakker, J.D.; et al. Plant diversity predicts beta but not alpha diversity of soil microbes across grasslands worldwide. Ecol. Lett. 2015, 18, 85–95. [Google Scholar] [CrossRef] [PubMed]
  3. Teste, F.P.; Kardol, P.; Turner, B.L.; Wardle, D.A.; Zemunik, G.; Renton, M.; Laliberté, E. Plant-soil feedback and the maintenance of diversity in Mediterranean-climate shrublands. Science 2017, 355, 173–176. [Google Scholar] [CrossRef] [PubMed] [Green Version]
  4. Chen, L.; Xu, H.; Wu, S.; Baoyin, T. Plant and soil properties mediate the response of soil microbial communities to moderate grazing in a semiarid grassland of northern China. J. Environ. Manag. 2021, 284, 112005. [Google Scholar] [CrossRef] [PubMed]
  5. Hiiesalu, I.; Pärtel, M.; Davison, J.; Gerhold, P.; Metsis, M.; Moora, M.; Öpik, M.; Vasar, M.; Zobel, M.; Wilson, S.D. Species richness of arbuscular mycorrhizal fungi: Associations with grassland plant richness and biomass. New Phytol. 2014, 203, 233–244. [Google Scholar] [CrossRef]
  6. Falkowski, P.G.; Fenchel, T.; Delong, E.F. The microbial engines that drive Earth’s biogeochemical cycles. Science 2008, 320, 1034–1039. [Google Scholar] [CrossRef] [PubMed] [Green Version]
  7. Classen, A.T.; Sundqvist, M.K.; Henning, J.A.; Newman, G.S.; Moore, J.A.M.; Cregger, M.A.; Moorhead, L.C.; Patterson, C.M. Direct and indirect effects of climate change on soil microbial and soil microbial–plant interactions: What lies ahead? Ecosphere 2016, 6, 1–21. [Google Scholar] [CrossRef]
  8. Xu, M.; Li, X.; Kuyper, T.W.; Xu, M.; Li, X.; Zhang, J. High microbial diversity stabilizes the responses of soil organic carbon decomposition to warming in the subsoil on the Tibetan Plateau. Glob. Change Biol. 2021, 27, 2061–2075. [Google Scholar] [CrossRef]
  9. Van der Heijden, M.G.; Bardgett, R.D.; van Straalen, N.M. The unseen majority: Soil microbes as drivers of plant diversity and productivity in terrestrial ecosystems. Ecol. Lett. 2008, 11, 296–310. [Google Scholar] [CrossRef]
  10. Van der Heijden, M.G.; de Bruin, S.; Luckerhoff, L.; van Logtestijn, R.S.; Schlaeppi, K. A widespread plant-fungal-bacterial symbiosis promotes plant biodiversity, plant nutrition and seedling recruitment. ISME J. 2016, 10, 389–399. [Google Scholar] [CrossRef] [Green Version]
  11. Millard, P.; Singh, B.K. Does grassland vegetation drive soil microbial diversity? Nutr. Cycl. Agroecosyst. 2010, 88, 147–158. [Google Scholar] [CrossRef]
  12. Gao, C.; Shi, N.N.; Liu, Y.X.; Peay, K.G.; Zheng, Y.; Ding, Q.; Mi, X.C.; Ma, K.P.; Wubet, T.; Buscot, F.; et al. Host plant genus-level diversity is the best predictor of ectomycorrhizal fungal diversity in a Chinese subtropical forest. Mol. Ecol. 2013, 22, 3403–3414. [Google Scholar] [CrossRef] [PubMed]
  13. Deutsch, C.A.; Tewksbury, J.J.; Huey, R.B.; Sheldon, K.S.; Ghalambor, C.K.; Haak, D.C.; Martin, P.R. Impacts of climate warming on terrestrial ectotherms across latitude. Proc. Natl. Acad. Sci. USA 2008, 105, 6668–6672. [Google Scholar] [CrossRef] [PubMed] [Green Version]
  14. Yuan, Y.; Si, G.; Wang, J.; Luo, T.; Zhang, G. Bacterial community in alpine grasslands along an altitudinal gradient on the Tibetan Plateau. FEMS Microbiol. Ecol. 2014, 87, 121–132. [Google Scholar] [CrossRef] [Green Version]
  15. Yashiro, E.; Pinto-Figueroa, E.; Buri, A.; Spangenberg, J.E.; Adatte, T.; Niculita-Hirzel, H.; Guisan, A.; van der Meer, J.R. Local Environmental Factors Drive Divergent Grassland Soil Bacterial Communities in the Western Swiss Alps. Appl. Environ. Microbiol. 2016, 82, 6303–6316. [Google Scholar] [CrossRef] [Green Version]
  16. Yashiro, E.; Pinto-Figueroa, E.; Buri, A.; Spangenberg, J.E.; Adatte, T.; Niculita-Hirzel, H.; Guisan, A.; van der Meer, J.R. Meta-scale mountain grassland observatories uncover commonalities as well as specific interactions among plant and non-rhizosphere soil bacterial communities. Sci. Rep. 2018, 8, 5758. [Google Scholar] [CrossRef]
  17. Bardgett, R.D.; Freeman, C.; Ostle, N.J. Microbial contributions to climate change through carbon cycle feedbacks. ISME J. 2008, 2, 805–814. [Google Scholar] [CrossRef] [Green Version]
  18. Dieleman, W.I.; Vicca, S.; Dijkstra, F.A.; Hagedorn, F.; Hovenden, M.J.; Larsen, K.S.; Morgan, J.A.; Volder, A.; Beier, C.; Dukes, J.S.; et al. Simple additive effects are rare: A quantitative review of plant biomass and soil process responses to combined manipulations of CO2 and temperature. Glob. Change Biol. 2012, 18, 2681–2693. [Google Scholar] [CrossRef]
  19. Nie, M.; Pendall, E.; Bell, C.; Gasch, C.K.; Raut, S.; Tamang, S.; Wallenstein, M.D. Positive climate feedbacks of soil microbial communities in a semi-arid grassland. Ecol. Lett. 2013, 16, 234–241. [Google Scholar] [CrossRef]
  20. Melillo, J.M.; Butler, S.; Johnson, J.; Mohan, J.; Steudler, P.; Lux, H.; Burrows, E.; Bowles, F.; Smith, R.; Scott, L.; et al. Soil warming, carbon-nitrogen interactions, and forest carbon budgets. Proc. Natl. Acad. Sci. USA 2011, 108, 9508–9512. [Google Scholar] [CrossRef] [Green Version]
  21. Margesin, R.; Minerbi, S.; Schinner, F. Long-term monitoring of soil microbiological activities in two forest sites in South Tyrol in the Italian alps. Microbes Environ. 2014, 29, 277–285. [Google Scholar] [CrossRef] [PubMed] [Green Version]
  22. Romero-Olivares, A.L.; Allison, S.D.; Treseder, K.K. Soil microbes and their response to experimental warming over time: A meta-analysis of field studies. Soil Biol. Biochem. 2017, 107, 32–40. [Google Scholar] [CrossRef] [Green Version]
  23. Bryant, J.A.; Lamanna, C.; Morlon, H.; Kerkhoff, A.J.; Enquist, B.J.; Green, J.L. Colloquium paper: Microbes on mountainsides: Contrasting elevational patterns of bacterial and plant diversity. Proc. Natl. Acad. Sci. USA 2008, 105 (Suppl. S1), 11505–11511. [Google Scholar] [CrossRef] [Green Version]
  24. Nottingham, A.T.; Whitaker, J.; Turner, B.L.; Salinas, N.; Zimmermann, M.; Malhi, Y.; Meir, P. Climate Warming and Soil Carbon in Tropical Forests: Insights from an Elevation Gradient in the Peruvian Andes. Bioscience 2015, 65, 906–921. [Google Scholar] [CrossRef]
  25. Colwell, R.K.; Brehm, G.; Cardelús, C.L.; Gilman, A.C.; Longino, J.T. Global warming, elevational range shifts, and lowland biotic attrition in the wet tropics. Science 2008, 322, 258–261. [Google Scholar] [CrossRef] [PubMed] [Green Version]
  26. Malhi, Y.; Silman, M.; Salinas, N.; Bush, M.; Meir, P.; Saatchi, S. Introduction: Elevation gradients in the tropics: Laboratories for ecosystem ecology and global change research. Glob. Change Biol. 2010, 16, 3171–3175. [Google Scholar] [CrossRef]
  27. Wang, S.; Duan, J.; Xu, G.; Wang, Y.; Zhang, Z.; Rui, Y.; Luo, C.; Xu, B.; Zhu, X.; Chang, X.; et al. Effects of warming and grazing on soil N availability, species composition, and ANPP in an alpine meadow. Ecology 2012, 93, 2365–2376. [Google Scholar] [CrossRef]
  28. Qiu, J. China: The third pole. Nature 2008, 454, 393–396. [Google Scholar] [CrossRef] [Green Version]
  29. Kang, L.; Han, X.; Zhang, Z.; Sun, O.J. Grassland ecosystems in China: Review of current knowledge and research advancement. Philos. Trans. R. Soc. Lond. Ser. B Biol. Sci. 2007, 362, 997–1008. [Google Scholar] [CrossRef]
  30. Zhou, H.; Zhao, X.; Tang, Y.; Song, G.; Li, Z. Alpine grassland degradation and its control in the source region of the Yangtze and Yellow Rivers, China. Grassl. Sci. 2005, 51, 191–203. [Google Scholar] [CrossRef]
  31. Genxu, W.; Ju, Q.; Guodong, C.; Yuanmin, L. Soil organic carbon pool of grassland soils on the Qinghai-Tibetan Plateau and its global implication. Sci. Total Environ. 2002, 291, 207–217. [Google Scholar] [CrossRef]
  32. Dunne, J.A.; Saleska, S.R.; Fischer, M.L.; Harte, J. Integrating experimental and gradient methods in ecological climate change research. Ecology 2004, 85, 904–916. [Google Scholar] [CrossRef]
  33. Blois, J.L.; Williams, J.W.; Fitzpatrick, M.C.; Jackson, S.T.; Ferrier, S. Space can substitute for time in predicting climate-change effects on biodiversity. Proc. Natl. Acad. Sci. USA 2013, 110, 9374–9379. [Google Scholar] [CrossRef] [Green Version]
  34. Chen, H.; Zhu, Q.; Peng, C.; Wu, N.; Wang, Y.; Fang, X.; Gao, Y.; Zhu, D.; Yang, G.; Tian, J.; et al. The impacts of climate change and human activities on biogeochemical cycles on the Qinghai-Tibetan Plateau. Glob. Change Biol. 2013, 19, 2940–2955. [Google Scholar] [CrossRef]
  35. Zhang, Y.; Lu, Z.; Liu, S.; Yang, Y.; He, Z.; Ren, Z.; Zhou, J.; Li, D. Geochip-based analysis of microbial communities in alpine meadow soils in the Qinghai-Tibetan plateau. BMC Microbiol. 2013, 13, 72. [Google Scholar] [CrossRef] [PubMed] [Green Version]
  36. Hui, L.U.; Cong, J.; Liu, X.; Wang, X.L.; Tang, J.; Di-Qiang, L.I.; Zhang, Y.G. Plant diversity patterns along altitudinal gradients in alpine meadows in the Three River Headwater Region, China. Acta Pratacult. Sin. 2015, 24, 197–204. [Google Scholar]
  37. Semenov, M.V.; Nikitin, D.A.; Stepanov, A.L.; Semenov, V.M. The Structure of Bacterial and Fungal Communities in the Rhizosphere and Root-Free Loci of Gray Forest Soil. Eurasian Soil Sci. 2019, 52, 319–332. [Google Scholar] [CrossRef]
  38. Cong, J.; Yang, Y.; Liu, X.; Lu, H.; Liu, X.; Zhou, J.; Li, D.; Yin, H.; Ding, J.; Zhang, Y. Analyses of soil microbial community compositions and functional genes reveal potential consequences of natural forest succession. Sci. Rep. 2015, 5, 10007. [Google Scholar] [CrossRef] [Green Version]
  39. Caporaso, J.G.; Lauber, C.L.; Walters, W.A.; Berg-Lyons, D.; Lozupone, C.A.; Turnbaugh, P.J.; Fierer, N.; Knight, R. Global patterns of 16S rRNA diversity at a depth of millions of sequences per sample. Proc. Natl. Acad. Sci. USA 2011, 108 (Suppl. S1), 4516–4522. [Google Scholar] [CrossRef] [Green Version]
  40. Ding, J.; Zhang, Y.; Deng, Y.; Cong, J.; Lu, H.; Sun, X.; Yang, C.; Yuan, T.; Van Nostrand, J.D.; Li, D.; et al. Integrated metagenomics and network analysis of soil microbial community of the forest timberline. Sci. Rep. 2015, 5, 7994. [Google Scholar] [CrossRef] [Green Version]
  41. Magoč, T.; Salzberg, S.L. FLASH: Fast length adjustment of short reads to improve genome assemblies. Bioinformatics 2011, 27, 2957–2963. [Google Scholar] [CrossRef] [PubMed]
  42. Edgar, R.C.; Haas, B.J.; Clemente, J.C.; Quince, C.; Knight, R. UCHIME improves sensitivity and speed of chimera detection. Bioinformatics 2011, 27, 2194–2200. [Google Scholar] [CrossRef] [PubMed] [Green Version]
  43. Tu, Q.; Yu, H.; He, Z.; Deng, Y.; Wu, L.; Van Nostrand, J.D.; Zhou, A.; Voordeckers, J.; Lee, Y.J.; Qin, Y.; et al. GeoChip 4: A functional gene-array-based high-throughput environmental technology for microbial community analysis. Mol. Ecol. Resour. 2014, 14, 914–928. [Google Scholar] [CrossRef] [PubMed]
  44. Duan, Y.; Lian, J.; Wang, L.; Wang, X.; Luo, Y.; Wang, W.; Wu, F.; Zhao, J.; Ding, Y.; Ma, J.; et al. Variation in Soil Microbial Communities Along an Elevational Gradient in Alpine Meadows of the Qilian Mountains, China. Front. Microbiol. 2021, 12, 684386. [Google Scholar] [CrossRef]
  45. Shen, C.; Xiong, J.; Zhang, H.; Feng, Y.; Lin, X.; Li, X.; Liang, W.; Chu, H. Soil pH drives the spatial distribution of bacterial communities along elevation on Changbai Mountain. Soil Biol. Biochem. 2013, 57, 204–211. [Google Scholar] [CrossRef]
  46. Guo, Y.; Ren, C.; Yi, J.; Doughty, R.; Zhao, F. Contrasting Responses of Rhizosphere Bacteria, Fungi and Arbuscular Mycorrhizal Fungi Along an Elevational Gradient in a Temperate Montane Forest of China. Front. Microbiol. 2020, 11, 2042. [Google Scholar] [CrossRef] [PubMed]
  47. Putten, V.D.; Wim, H. Climate Change, Aboveground-Belowground Interactions, and Species’ Range Shifts. Annu. Rev. Ecol. Evol. Syst. 2012, 43, 365–383. [Google Scholar] [CrossRef]
  48. Zhang, Y.; Dong, S.; Gao, Q.; Liu, S.; Zhou, H.; Ganjurjav, H.; Wang, X. Climate change and human activities altered the diversity and composition of soil microbial community in alpine grasslands of the Qinghai-Tibetan Plateau. Sci. Total Environ. 2016, 562, 353–363. [Google Scholar] [CrossRef]
  49. Salas-Morales, S.H.; Meave, J.A. Elevational patterns in the vascular flora of a highly diverse region in southern Mexico. Plant Ecol. 2012, 213, 1209–1220. [Google Scholar] [CrossRef]
  50. Nyman, T.; Linder, H.P.; Peña, C.; Malm, T.; Wahlberg, N. Climate-driven diversity dynamics in plants and plant-feeding insects. Ecol. Lett. 2012, 15, 889–898. [Google Scholar] [CrossRef]
  51. Liu, S.; Kruse, S.; Scherler, D.; Ree, R.H.; Zimmermann, H.H.; Stoof-Leichsenring, K.R.; Epp, L.S.; Mischke, S.; Herzschuh, U. Sedimentary ancient DNA reveals a threat of warming-induced alpine habitat loss to Tibetan Plateau plant diversity. Nat. Commun. 2021, 12, 2995. [Google Scholar] [CrossRef] [PubMed]
  52. Li, W.; Liu, C.; Wang, W.; Zhou, H.; Xue, Y.; Xu, J.; Xue, P.; Yan, H. Effects of Different Grazing Disturbances on the Plant Diversity and Ecological Functions of Alpine Grassland Ecosystem on the Qinghai-Tibetan Plateau. Front. Plant Sci. 2021, 12, 765070. [Google Scholar] [CrossRef]
  53. Meadow, J.F.; Zabinski, C.A. Linking symbiont community structures in a model arbuscular mycorrhizal system. New Phytol. 2012, 194, 800–809. [Google Scholar] [CrossRef] [PubMed]
  54. Milcu, A.; Allan, E.; Roscher, C.; Jenkins, T.; Meyer, S.T.; Flynn, D.; Bessler, H.; Buscot, F.; Engels, C.; Gubsch, M.; et al. Functionally and phylogenetically diverse plant communities key to soil biota. Ecology 2013, 94, 1878–1885. [Google Scholar] [CrossRef] [PubMed] [Green Version]
  55. Zhelezova, A.; Chernov, T.; Nikitin, D.; Tkhakakhova, A.; Ksenofontova, N.; Zverev, A.; Kutovaya, O.; Semenov, M. Seasonal Dynamics of Soil Bacterial Community under Long-Term Abandoned Cropland in Boreal Climate. Agronomy 2022, 12, 519. [Google Scholar] [CrossRef]
  56. Hawkes, C.V.; Keitt, T.H. Resilience vs. historical contingency in microbial responses to environmental change. Ecol. Lett. 2015, 18, 612–625. [Google Scholar] [CrossRef]
  57. Zhou, J.Z.; Kai, X.; Xie, J.P.; Ye, D.; Luo, Y.Q. Microbial mediation of carbon-cycle feedbacks to climate warming. Nat. Clim. Change 2011, 2, 106–110. [Google Scholar] [CrossRef]
  58. Cheng, Y.T.; Zhang, L.; He, S.Y. Plant-Microbe Interactions Facing Environmental Challenge. Cell Host Microbe 2019, 26, 183–192. [Google Scholar] [CrossRef]
  59. Berg, M.P.; Kiers, E.T.; Driessen, G.; Van Der Heijden, M.; Kooi, B.W.; Kuenen, F.; Liefting, M.; Verhoef, H.A.; Ellers, J. Adapt or disperse: Understanding species persistence in a changing world. Glob. Change Biol. 2020, 16, 587–598. [Google Scholar] [CrossRef]
  60. Fierer, N.; Bradford, M.A.; Jackson, R.B. Toward an ecological classification of soil bacteria. Ecology 2007, 88, 1354–1364. [Google Scholar] [CrossRef]
  61. Djukic, I.; Zehetner, F.; Watzinger, A.; Horacek, M.; Gerzabek, M.H. In situ carbon turnover dynamics and the role of soil microorganisms therein: A climate warming study in an Alpine ecosystem. FEMS Microbiol. Ecol. 2013, 83, 112–124. [Google Scholar] [CrossRef] [PubMed] [Green Version]
  62. Li, Y.; Lv, W.; Jiang, L.; Zhang, L.; Wang, S.; Wang, Q.; Xue, K.; Li, B.; Liu, P.; Hong, H.; et al. Microbial community responses reduce soil carbon loss in Tibetan alpine grasslands under short-term warming. Glob. Change Biol. 2019, 25, 3438–3449. [Google Scholar] [CrossRef] [PubMed]
  63. Rousk, J.; Smith, A.R.; Jones, D.L. Investigating the long-term legacy of drought and warming on the soil microbial community across five European shrubland ecosystems. Glob. Change Biol. 2013, 19, 3872–3884. [Google Scholar] [CrossRef] [PubMed]
  64. Shen, C.; Shi, Y.; Fan, K.; He, J.S.; Adams, J.M.; Ge, Y.; Chu, H. Soil pH dominates elevational diversity pattern for bacteria in high elevation alkaline soils on the Tibetan Plateau. FEMS Microbiol. Ecol. 2019, 95, fiz003. [Google Scholar] [CrossRef] [PubMed] [Green Version]
  65. Freeman, C.; Nevison, G.B.; Kang, H.; Hughes, S.; Reynolds, B.; Hudson, J.A. Contrasted effects of simulated drought on the production and oxidation of methane in a mid-Wales wetland. Soil Biol. Biochem. 2002, 34, 61–67. [Google Scholar] [CrossRef]
  66. Chen, Q.L.; Ding, J.; Zhu, Y.G.; He, J.Z.; Hu, H.W. Soil bacterial taxonomic diversity is critical to maintaining the plant productivity. Environ. Int. 2020, 140, 105766. [Google Scholar] [CrossRef]
  67. Ke, P.J.; Miki, T.; Ding, T.S. The soil microbial community predicts the importance of plant traits in plant-soil feedback. New Phytol. 2015, 206, 329–341. [Google Scholar] [CrossRef] [Green Version]
  68. Ferreira, D.A.; da Silva, T.F.; Pylro, V.S.; Salles, J.F.; Andreote, F.D.; Dini-Andreote, F. Soil Microbial Diversity Affects the Plant-Root Colonization by Arbuscular Mycorrhizal Fungi. Microb. Ecol. 2021, 82, 100–103. [Google Scholar] [CrossRef]
  69. Delgado-Baquerizo, M.; Maestre, F.T.; Reich, P.B.; Jeffries, T.C.; Gaitan, J.J.; Encinar, D.; Berdugo, M.; Campbell, C.D.; Singh, B.K. Microbial diversity drives multifunctionality in terrestrial ecosystems. Nat. Commun. 2016, 7, 10541. [Google Scholar] [CrossRef] [Green Version]
  70. García-Palacios, P.; Vandegehuchte, M.L.; Shaw, E.A.; Dam, M.; Post, K.H.; Ramirez, K.S.; Sylvain, Z.A.; de Tomasel, C.M.; Wall, D.H. Are there links between responses of soil microbes and ecosystem functioning to elevated CO2, N deposition and warming? A global perspective. Glob. Change Biol. 2015, 21, 1590–1600. [Google Scholar] [CrossRef]
  71. Nikitin, D.A.; Semenov, M.V.; Chernov, T.I.; Ksenofontova, N.A.; Zhelezova, A.D.; Ivanova, E.A.; Khitrov, N.B.; Stepanov, A.L. Microbiological Indicators of Soil Ecological Functions: A Review. Eurasian Soil Sci. 2022, 55, 221–234. [Google Scholar] [CrossRef]
  72. Li, Z.; Zeng, Z.; Song, Z.; Wang, F.; Tian, D.; Mi, W.; Huang, X.; Wang, J.; Song, L.; Yang, Z.; et al. Vital roles of soil microbes in driving terrestrial nitrogen immobilization. Glob. Change Biol. 2021, 27, 1848–1858. [Google Scholar] [CrossRef] [PubMed]
  73. Mehnaz, K.R.; Keitel, C.; Dijkstra, F.A. Phosphorus availability and plants alter soil nitrogen retention and loss. Sci. Total Environ. 2019, 671, 786–794. [Google Scholar] [CrossRef] [PubMed]
  74. Ding, L.; Wang, P. Afforestation suppresses soil nitrogen availability and soil multifunctionality on a subtropical grassland. Sci. Total Environ. 2021, 761, 143663. [Google Scholar] [CrossRef]
  75. Zhang, C.; Dong, W.; Manevski, K.; Hu, W.; Timilsina, A.; Chen, X.; Zhang, X.; Hu, C. Long-term warming and nitrogen fertilization affect C-, N- and P-acquiring hydrolase and oxidase activities in winter wheat monocropping soil. Sci. Rep. 2021, 11, 18542. [Google Scholar] [CrossRef]
  76. DeForest, J.L.; Smemo, K.A.; Burke, D.J.; Elliott, H.L.; Becker, J.C. Soil microbial responses to elevated phosphorus and pH in acidic temperate deciduous forests. Biogeochemistry 2012, 109, 189–202. [Google Scholar] [CrossRef]
  77. Zhang, B.; Xue, K.; Zhou, S.; Che, R.; Du, J.; Tang, L.; Pang, Z.; Wang, F.; Wang, D.; Cui, X.; et al. Phosphorus mediates soil prokaryote distribution pattern along a small-scale elevation gradient in Noijin Kangsang Peak, Tibetan Plateau. FEMS Microbiol. Ecol. 2019, 95, fiz076. [Google Scholar] [CrossRef]
  78. Luo, G.; Xue, C.; Jiang, Q.; Xiao, Y.; Zhang, F.; Guo, S.; Shen, Q.; Ling, N. Soil Carbon, Nitrogen, and Phosphorus Cycling Microbial Populations and Their Resistance to Global Change Depend on Soil C:N:P Stoichiometry. mSystems 2020, 5, e00162-20. [Google Scholar] [CrossRef]
Figure 1. Detrended correspondence analysis of plant (a) and soil bacterial (b) community structure.
Microorganisms 10 01049 g001
Figure 2. Soil bacterial relative abundance at the phylum level along elevation gradient.
Microorganisms 10 01049 g002
Figure 3. The relative abundance of microbial functional genes involved in carbon (C), nitrogen (N), and phosphorus (P) cycles in all six sampling sites. The relative abundance of each gene category was the sum of detected individual gene signal intensity. All data are presented as mean and standard error. Significant differences between different study sites are indicated above the bars. * p <0.1; ** p <0.05.
Microorganisms 10 01049 g003
Figure 4. The relationship between alpha (a) (r = −0.147, p = 0.198) and beta (b) (r = 0.659, p = 0.001) diversity of plants and bacteria.
Microorganisms 10 01049 g004
Figure 5. CCA analysis of plants (a) and bacteria (b) with different environmental factors.
Microorganisms 10 01049 g005
Table 1. Study sites information along elevation gradient in the Qinghai–Tibet Plateau.
Site NameLocationElevationLatitude, LongitudeSlopeAspectDominant Plant SpeciesMAT of the Warmest Quarter (°C)MAP (mm)
SJY-4790Maduo County, Qinghai Province4790 m34°08′16″ N
97°40′22″ E
15°NKobresia tibetica, Kobresia pygmaea4.90417.00
SJY-4480Maduo County, Qinghai Province4480 m34°22′15″ N
97°56′57″ E
18°30°, NWKobresia tibetica6.20386.00
SJY-4140Maduo County, Qinghai Province4140 m35°24′28″ N
99°21′6″ E
20°, NWKobresia pygmaea, Kobresia humilis6.30372.00
SJY-3880Xinghai County, Qinghai Province3880 m35°41′26″ N
99°33′1″ E
15°30°, NWKobresia pygmaea, Stipa capillata7.40354.00
SJY-3490Xinghai County, Qinghai Province3490 m35°40′10″ N
99°55′13″ E
NPoa annua, Stipa capillata10.00344.00
SJY-3220Xinghai County, Qinghai Province3220 m35°56′6″ N
100°5′27″ E
NElymus nutans, Stipa capillata11.60319.00
Mean annual precipitation: MAP, mean annual Temperature: MAT.
Table 2. The plant and soil bacterial alpha diversity in all six study sites.
Site NamePlant Shannon IndexPlant Pielou IndexBacterial Shannon IndexBacterial Simpson Index
SJY-47901.97 ± 0.26 c0.79 ± 0.09 ab7.27 ± 0.10 a448 ± 102 a
SJY-44802.34 ± 0.23 a0.84 ± 0.07 a7.26 ± 0.12 a483 ± 109 a
SJY-41402.27 ± 0.25 ab0.85 ± 0.08 a7.35 ± 0.09 a518 ± 112 a
SJY-38801.72 ± 0.30 d0.74 ± 0.10 b7.27 ± 0.12 a476 ± 87 a
SJY-34902.09 ± 0.14b0.85 ± 0.04a7.50 ± 0.08b755 ± 145b
SJY-32202.05 ± 0.34 bc0.86 ± 0.08 a7.45 ± 0.16 b702 ± 185 b
Data present the mean value and standard error. Significant differences among study sites are indicated by alphabetic letters. p < 0.05.
Table 3. Relationship between plant or soil bacterial beta diversity and climate or soil environmental factors estimated using partial Mantel tests.
Environmental FactorsPlant Beta DiversityBacterial Beta Diversity
rprp
Site elevation0.496<0.0010.670<0.001
Mean annual temperature0.4100.0010.4370.001
Mean annual precipitation0.3730.0010.6240.001
Soil moisture0.1640.0010.4520.001
Soil pH0.2550.0010.6340.001
Soil organic carbon0.0360.1070.1650.001
Available nitrogen−0.0170.7350.0940.008
Available phosphorus0.0890.0100.0300.268
Soil NH4+- N−0.1030.9990.1500.003
Soil NO3−- N−0.0390.864−0.0400.778
Bacteria Shannon index0.1760.004--
Plant Shannon index--0.0600.069
Bacterial beta diversity0.4930.001-
Plant beta diversity--0.4930.001
Publisher’s Note: MDPI stays neutral with regard to jurisdictional claims in published maps and institutional affiliations.

