Article

Prevalence of pvmrp1 Polymorphisms and Its Contribution to Antimalarial Response

1
Department of Pathogenic Biology, School of Medicine, Yangzhou University, Yangzhou 225009, China
2
Key Laboratory of National Health Commission on Parasitic Disease Control and Prevention, Jiangsu Provincial Key Laboratory on Parasite and Vector Control Technology, Jiangsu Institute of Parasitic Diseases, Wuxi 214064, China
3
Department of Medical Research, Ministry of Health and Sports, Yangon 11191, Myanmar
4
Department of Medical Environmental Biology and Tropical Medicine, School of Medicine, Kangwon National University, Chuncheon 24341, Gangwon-do, Korea
5
Affiliated Hospital of Yangzhou University, Yangzhou 225000, China
6
Jiangsu Key Laboratory of Experimental & Translational Non-Coding RNA Research, School of Medicine, Yangzhou University, Yangzhou 225009, China
7
Jiangsu Key Laboratory of Zoonosis, Jiangsu Co-Innovation Center for Prevention and Control of Important Animal Infectious Diseases and Zoonoses, Yangzhou 225009, China
*
Authors to whom correspondence should be addressed.
These authors contributed equally to this study.
Submission received: 29 June 2022 / Accepted: 20 July 2022 / Published: 22 July 2022
(This article belongs to the Special Issue Parasitic Infection and Host Immunity)

Abstract

:
As more sporadic cases of chloroquine resistance occur (CQR) in Plasmodium vivax (P. vivax) malaria, molecular markers have become an important tool to monitor the introduction and spread of drug resistance. P. vivax multidrug resistance-associated protein 1 (PvMRP1), as one of the members of the ATP-binding cassette (ABC) transporters, may modulate this phenotype. In this study, we investigated the gene mutations and copy number variations (CNVs) in the pvmrp1 in 102 P. vivax isolates from China, the Republic of Korea (ROK), Myanmar, Papua New Guinea (PNG), Pakistan, the Democratic People’s Republic of Korea (PRK), and Cambodia. And we also obtained 72 available global pvmrp1 sequences deposited in the PlasmoDB database to investigate the genetic diversity, haplotype diversity, natural selection, and population structure of pvmrp1. In total, 29 single nucleotide polymorphisms reflected in 23 non-synonymous, five synonymous mutations and one gene deletion were identified, and CNVs were found in 2.9% of the isolates. Combined with the antimalarial drug susceptibility observed in the previous in vitro assays, except the prevalence of S354N between the two CQ sensitivity categories revealed a significant difference, no genetic mutations or CNVs associated with drug sensitivity were found. The genetic polymorphism analysis of 166 isolates worldwide found that the overall nucleotide diversity (π) of pvmrp1 was 0.0011, with 46 haplotypes identified (Hd = 0.9290). The ratio of non-synonymous to synonymous mutations (dn/ds = 0.5536) and the neutrality tests statistic Fu and Li’s D* test (Fu and Li’s D* = −3.9871, p < 0.02) suggests that pvmrp1 had evolved under a purifying selection. Due to geographical differences, genetic differentiation levels of pvmrp1 in different regions were different to some extent. Overall, this study provides a new idea for finding CQR molecular monitoring of P. vivax and provides more sequences of pvmrp1 in Asia for subsequent research. However, further validation is still needed through laboratory and epidemiological field studies of P. vivax samples from more regions.

1. Introduction

Plasmodium vivax was responsible for up to 4.5 million cases of malaria in 2020 [1]. Although it is rarely fatal, P. vivax malaria is the leading cause of malaria-related deaths outside of Africa [2]. In most vivax-endemic areas, a combination of chloroquine (CQ) is the first-line treatment for uncomplicated vivax malaria. Despite inexpensive, well tolerated, and widely available chloroquine resistance (CQR), vivax malaria was first reported from Papua New Guinea (PNG) in 1989 [3], and has been documented in more than ten countries [4], especially in multiple regions of Myanmar [5,6,7]. P. vivax resistance to other antimalarial drugs, such as mefloquine (MQ), sulfadoxine-pyrimethamine (SP) and primaquine (PQ), has also been reported widely [8,9]. The rise of these drug-resistant parasites threatens the global efforts to control malaria. However, molecular markers of drug resistance in P. vivax remain elusive [10].
Generally, genetic variation in the expression of transporter proteins could contribute to evading antimalarial action [11]. ATP-binding cassette (ABC) transporters are transmembrane proteins that can carry various substrate types, such as drugs and metabolic products [12]. The overexpression or mutation of many ABC transporters can lead to drug resistance [13]. As one of the members of the ABC subfamily C, the multidrug resistance-associated proteins (MRPs) are associated with antimalarial resistance. The increased expression of pfmrp1 has been associated with the resistance of MQ and CQ, and gene polymorphisms in pfmrp1 with in vivo selection after SP and artemether/lumefantrine treatment [14,15,16]. Furthermore, the deletion of this gene in the CQR P. falciparum strain results in increased sensitivity to CQ, Quinine (QN), artemisinin, piperaquine (PPQ) and PQ [17]. Since P. vivax cannot be cultured continuously in vitro [18], most research on the molecular mechanism of drug resistance in P. vivax has focused on the homologous genes related to the drug resistance of P. falciparum [10,19]. Hence, we chose to study the association between pvmrp1 and the development of P. vivax resistance to antimalarial drugs.
In this study, we genotyped 94 P. vivax isolates from China, the Republic of Korea (ROK), Myanmar, PNG, Pakistan, the Democratic People’s Republic of Korea (PRK), and Cambodia, and combined the 72 available global pvmrp1 sequences deposited in the PlasmoDB database to analyze the characterization of genomic variation and population genomics methods, including genetic differentiation, haplotype network, linkage disequilibrium (LD) and the phylogenetic tree. Meanwhile, the correlation between pvmrp1 and antimalarial drug susceptibility observed in the previous in vitro assays was further analyzed.

2. Materials and Methods

2.1. Study Sites and Participants

Clinical blood samples with P. vivax infections (n = 102) were obtained from seven countries, including China (n = 46), ROK (n = 27), Myanmar (n = 21), PNG (n = 3), Pakistan (n = 3), PRK (n = 1), and Cambodia (n = 1). The Chinese samples were collected from local hospitals or centers for disease control and prevention in central China from 2005 to 2008 [20]; The South Korean samples were from local hospitals in endemic areas, such as the ROK, from 2007 to 2009 [21]; The samples of Myanmar were collected from Wet-Won Station Hospital, Yangon, Myanmar, in 1999 [21]; Other samples of P. vivax isolates were imported malaria cases in China. The protocol was reviewed and approved by the National Institute of Parasitic Diseases, the Chinese Center for Disease Control and Prevention, the Kangwon National University Hospital Human Ethics Committee, and the Myanmar Department of Health. The sequence of pvmrp1 from 72 P. vivax isolates deposited in the PlasmoDB database were downloaded and analyzed, and originated from 10 countries, including South America: Columbia (n = 21), Peru (n = 16), Mexico (n = 13), and Brazil (n = 3); Southeast Asia: Myanmar (n = 4) and Thailand (n = 7); Oceania: PNG (n = 4); East Asia: PRK (n = 1); South Asia: India (n = 2) and Africa: Mauritania (n = 1). All sample information was listed in Spreadsheet S1, and all sequences have been uploaded to Genbank with accession numbers from ON933478 to ON933571.

2.2. Gene Sequence and Protein Structure Prediction

The gene sequence of pvmrp1 (PVX_097025, Sal-I reference genome) was retrieved from PlasmoDB database (http://www.plasmodb.org, accessed on 11 December 2021). The conserved domains of PvMRP1 were searched within the NCBI’s Conserved Domain Database (https://0-www-ncbi-nlm-nih-gov.brum.beds.ac.uk/cdd/, accessed on 20 September 2021) [22]. Protein domains, transmembrane domains (TMDs), and nucleotide-binding domains (NBDs) were predicted by the Simple Modular Architecture Research Tool (http://smart.embl-heidelberg.de/, accessed on 20 September 2021) [23] and TMHMM server 2.0 (https://services.healthtech.dtu.dk/service.php?TMHMM-2.0, accessed on 20 September 2021), respectively [24].

2.3. Single Nucleotide Polymorphisms (SNPs) Identification in pvmrp1 Gene

According to the manufacturer’s instructions, genomic DNAs from the 102 whole blood samples were individually extracted using a QIAamp DNA blood kit (Qiagen, Valencia, CA, USA) and were stored at −20 °C in the previous studies. The pvmrp1 gene was amplified by nested or semi-nested PCR using specific primers (Table 1). All reactions were performed in 20 µL containing 4 µL of 5× Phusion HF Buffer (7.5 mM Mg2+ plus), 0.2 mM of each dNTP, 0.25 µM of each outer primer, 0.4 U Phusion High Fidelity DNA Polymerase (New England Biolabs, Ipswich, MA, USA) and 1 µL of genomic DNA or the amplicon from the first PCR. The PCR was performed with initial denature at 98 °C for 30 s, followed by 35 cycles of 98 °C for 10 s, 56–61 °C for 30 s (Table 1), and 72 °C for 1.5 min, and a final extension period at 72 °C for 10 min. The second round of PCR amplification products was purified and sequenced by GenScript (Nanjing, China). The nucleotide sequences were compared and spliced using Lasergene software (DNASTAR, Madison, WI, USA).

2.4. Determination of pvmrp1 Copy Number (CN)

The copy number variations (CNVs) of pvmrp1 were measured by TaqMan-BHQ1 probe quantitative PCR assays performed on the Roche LC480 thermal cycler. A reference plasmid was constructed with pvmrp1 (nt, 1762–1872) and pvtubulin (nt, 1644–1765) fragments in a ratio of 1:1 similar as described previously [21]. Probes and primers used for amplification of both genes were listed in Table 1. The probe target pvmdr1 was labeled at the 5′ end with the FAM reporter dye, and pvtubulin was the HEX reporter dye, both of which were labeled at the 3′ end with the quencher dye BHQ1. A real-time PCR was conducted in 10 µL volumes containing 5 µL of Lightcycler® 480 Probes Master 2 × (Roche Applied Science, Penzberg, Germany), 400 nM of each forward and reverse primer, 250 nM of each probe, and 1 µL of template DNA. Amplifications were performed in triplicate and the cycling parameters were as follows: 95 °C for 10 min, then 40 cycles of 95 °C for 15 s and 58 °C for 30 s. The single copy of the pvtubulin gene served as an internal control. The relative CN of pvmrp1 was calculated using a relative standard curve method as normal, and the amplifications were repeated according to specifications [20,21].

2.5. Data Analysis

The multiple sequence alignments of worldwide isolates containing the wild reference sequence of pvmrp1 were obtained using the MUSCLE in the MEGA v7.0.18 program to obtain SNPs [25,26]. Moreover, the average nucleotide diversity (π), haplotype diversity (Hd), and the neutrality tests (Tajima’s D test and Fu and Li’s D* test) were further analyzed to identify pvmrp1 gene polymorphism and determined whether it is under the neutral evolution model [26,27], in order to evaluate the evolutionary relationship of the pvmrp1 gene. The estimation of genetic differentiation (FST) of the pvmrp1 was analyzed. Haplotype network was also implemented to identify the genetic association of the pvmrp1 haplotypes by means of the Median-Joining method in the NETWORK v5.0 program [28]. The phylogenetic tree of the aligned sequences was constructed using the Neighbor-Joining method in the MEGA v7.0.18 program [29]. In addition, pairwise LD of pvmrp1 gene at different polymorphic sites was calculated using the DNASP v5.10.01 program [30]. Compared to the previous in vitro drug sensitivity test [20,21], Fisher’s exact test and chi-square analysis were performed to analyze whether it was related to the polymorphism of pvmrp1. As the sample size is too small to carry out statistical analysis, the data would not be displayed. A value of p < 0.05 was considered significant.

3. Results

3.1. Characterization of PvMRP1

As a member of the ABC superfamily, PvMRP1 was encoded by the intron-less gene pvmrp1 (5181 bp), which represented a larger protein (ca. 1726 a.a., Sal-I reference genome). PvMRP1 has 2 TMDs including 11 transmembrane helices (TM) (aa 120–143, 168–191, 308–331, 343–366, 418–441,1065–1088, 1123–1146, 1160–1183, 1195–218, 1221–1237, and 1300–1323), and two NBDs (aa 640–774 and 1442–1717) (Figure 1B). In addition, some specific regions were also identified in the PvMRP1 predicted primary protein structure, such as two Pfam region (aa 646–774, 1076–1318), two conserved domains (aa 291–494 and 1071–1386) and a GPI-anchor (aa 1708–1726) (Figure 1A).

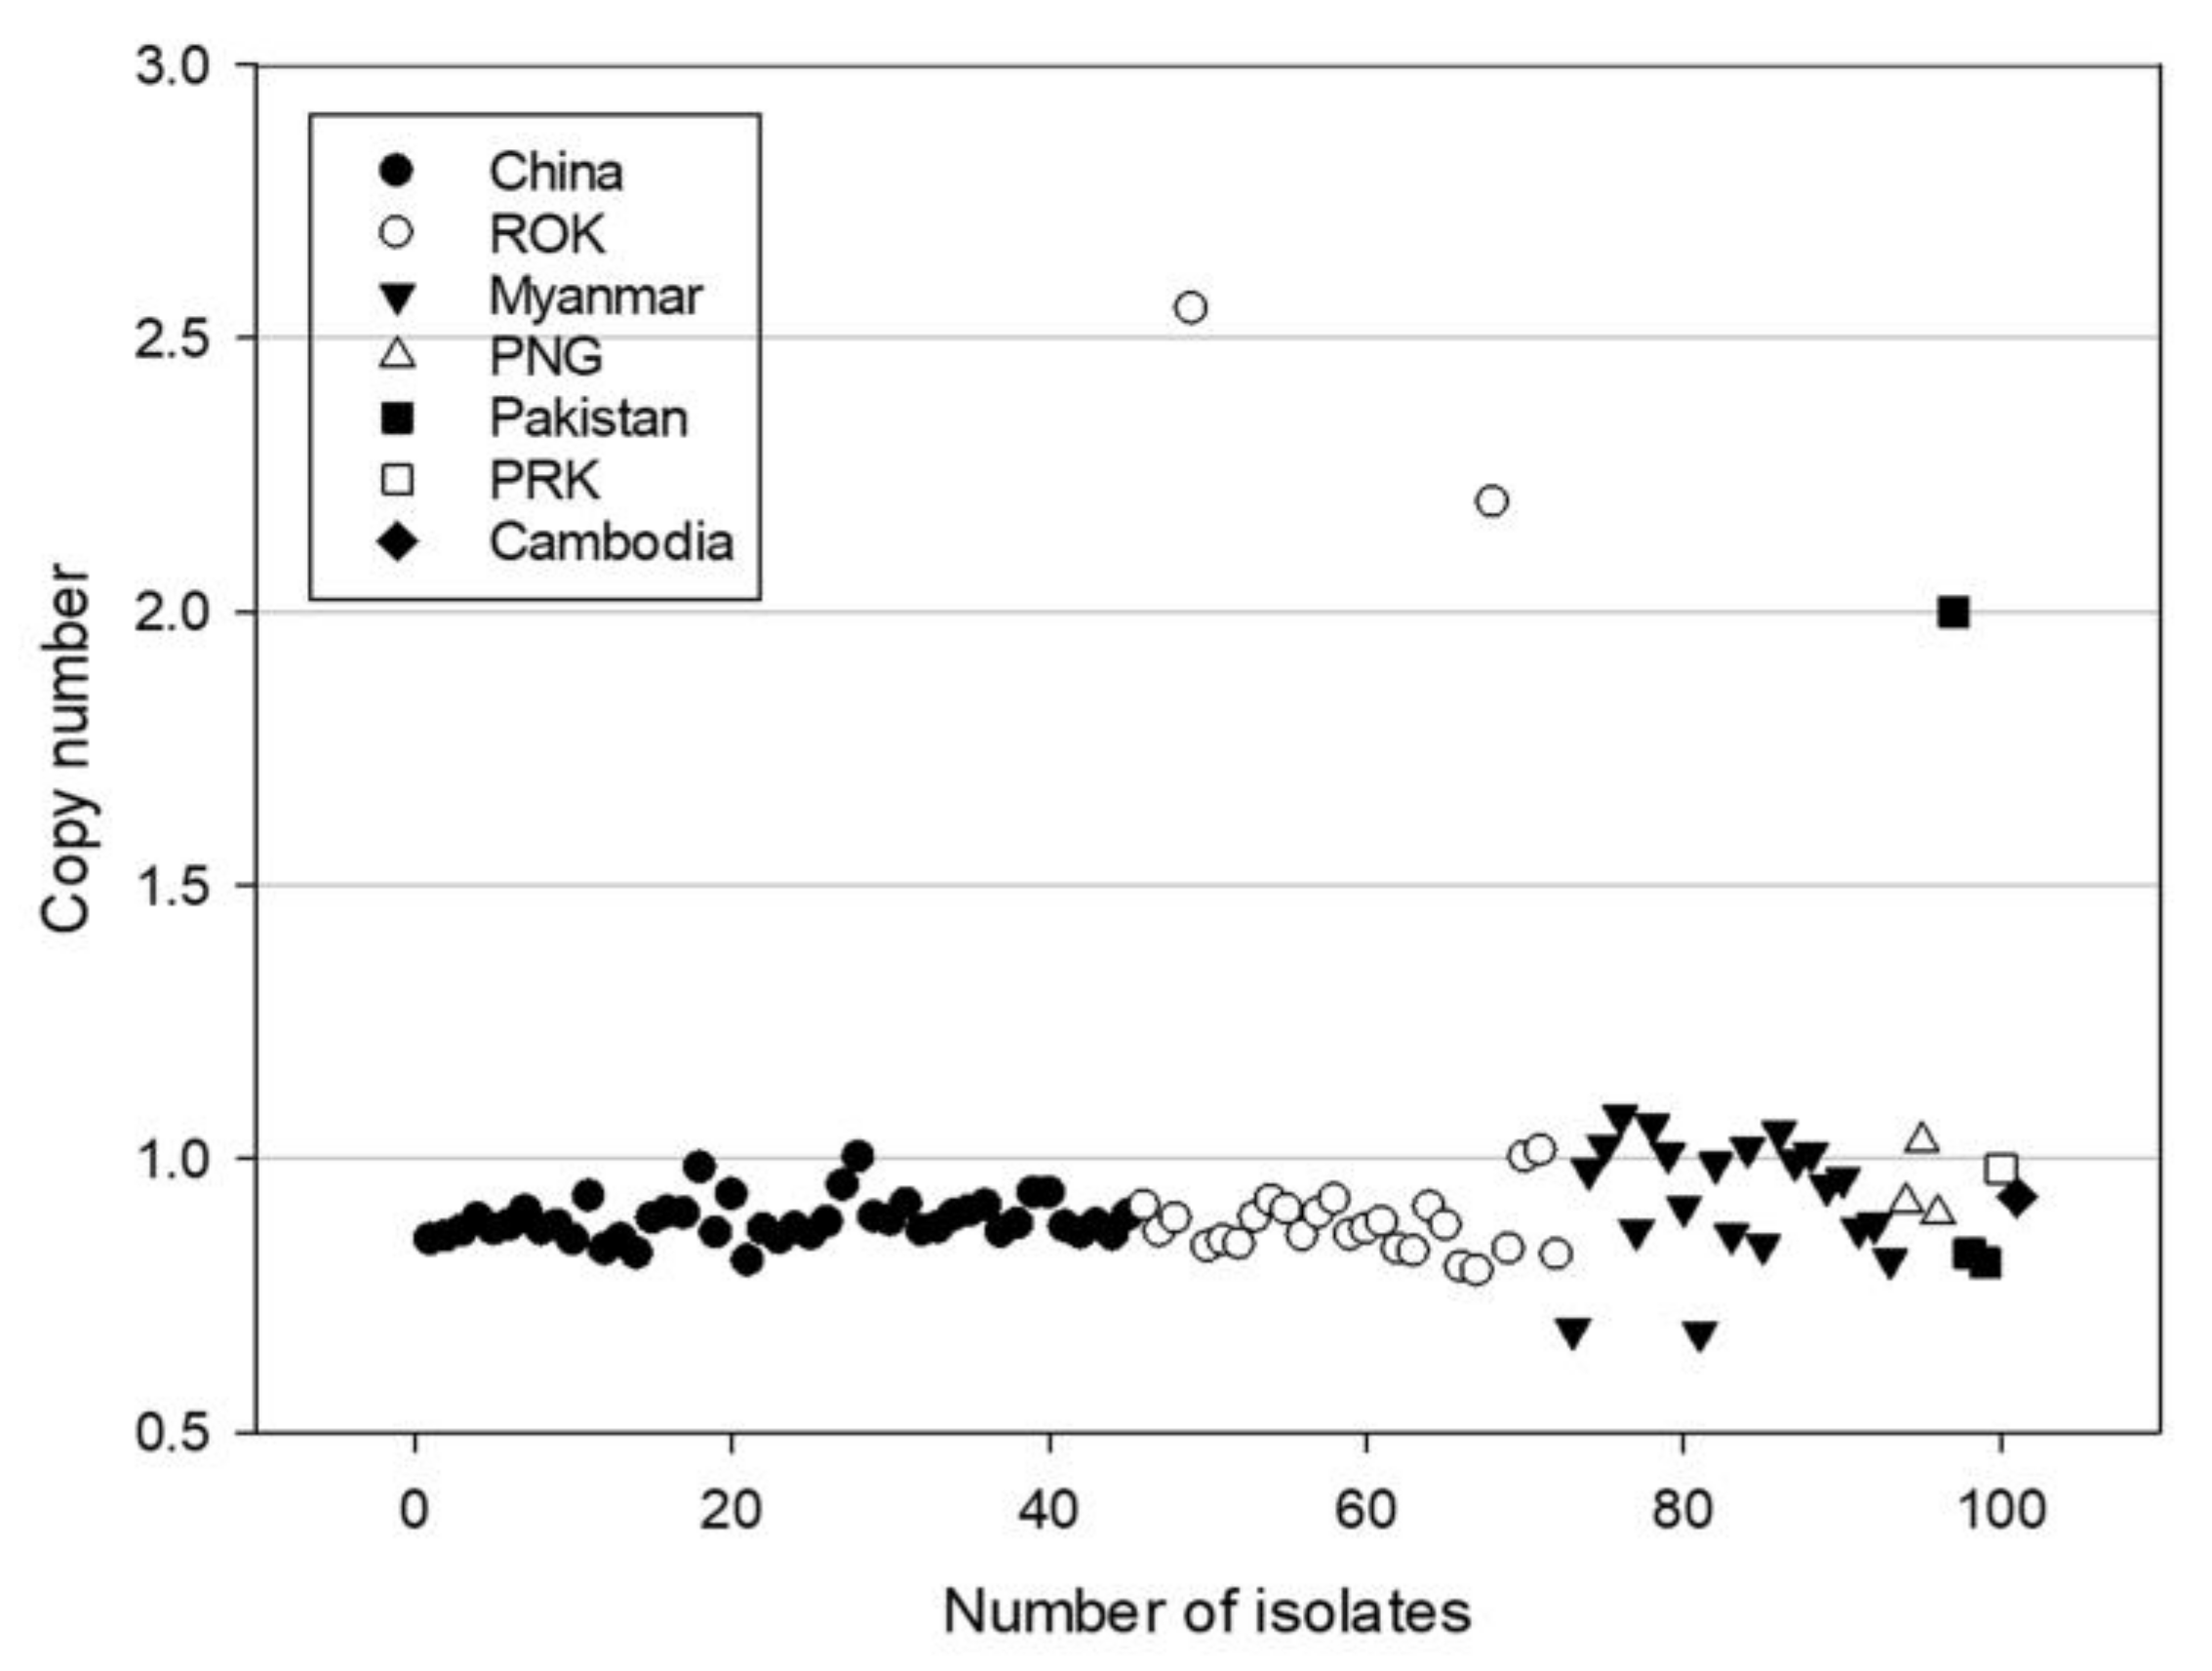
3.2. Identification of Gene Mutations and CN in pvmrp1 among Collected Blood Samples in Asia

Of the 102 P. vivax isolates, 94 samples (92.1%) were sequenced successfully for the pvmrp1 gene, including China (n = 43), ROK (n = 27), Myanmar (n = 18), PNG (n = 2), Pakistan (n = 2), PRK (n = 1) and Cambodia (n = 1). Compared with Sal-I as the wild reference type, 29 polymorphic sites were observed, 23 (79.3%) of which resulted in non-synonymous mutations, one site E533 (GAA) deletion, and five (17.2%) synonymous mutations were identified. Compared with the previously reported SNPs [10], nine non-synonymous mutations were repeatable, and the present analysis revealed 20 different SNPs (Figure 1B). Three non-synonymous substitutions, including T259R (97.87%), Y1393D (97.87%) and V1478I (95.74%), were high prevalence and approached fixation. The wild type T259 was found in two isolates from Oceania, and the other two wild types were found in isolates from South Asia and East Asia (Table 2). Of the 29 mutations found in this study, 20 were shown to be region-specific, such as mutations R281K, S354N, E787D, A853, G949D, and V1360 which were only observed in East Asia (range: 12.7–38.0%), V879 and L1207I were unique to the Southeast Asia at high frequency (89.5%). Three mutations (T234M, Q906E and I1232) were more frequent in isolates from Southeast Asia compared to the other areas. Although only 2 isolates were from South Asia, four mutations (F271Y, T282M, F560I and G1419A) were identified exclusively. Also, two isolates were confirmed, I1620T specifically in Oceania (Table 2).
In this study, the amplification of pvmrp1 was determined by the relative CN, which was calculated by the standard curve method. Except for one isolate from China, the CN of pvmrp1 was assessed successfully from the other 101 isolates. The estimates of pvmrp1 CN for these isolates ranged from 0.68 to 2.55. Most of the isolates carried one copy of the gene, and only three isolates had double CNs, two from the ROK and one from Pakistan (Figure 2).

3.3. Correlation between Polymorphisms and In Vitro Drug Susceptibilities

Of the 102 sequenced isolates mentioned above, partial samples from China and ROK were tested for antimalarial drugs susceptibility in the previous study [20,21]. Combined, a total of 39, 34, 39, and 13 isolates were cultured for more than 24 h and assayed for the susceptibility to CQ, QN, MQ and pyrimethamine (PYR), respectively (Table S1, Figure S1). For CQ, the geometric mean IC50 was 20.92 nM (95% CI: 13–33.67 nM), with 5.12% (2/39) isolates revealing a resistant phenotype with IC50 > 220 nM. Furthermore, the IC50 of MQ was 10.02 nM (95% CI: 5.97–16.83 nM), the QN was 41.94 nM (95% CI: 24.82–70.88 nM), and the PYR was 43.22 nM (range: 19.26–96.98 nM). Within the sample set of isolates, the observed 13 non-synonymous pvmrp1 SNPs (K36Q, T234M, T259R, R281K, S354K, K448I, E787D, Q906E, G949D, K1219N, Y1393D, V1478I, and H1586Y), did not appear to be correlated with the IC50 values of the four antimalarial drugs (Table S2). Using an IC50 value ≤ 220 nM as the sensitivity standard, the chi-square analysis was performed to analyze the correlation between the CQ sensitive/insensitive isolates and the mutation sites, the results showed that only the prevalence of S354N between these two CQ sensitivity categories revealed a significant difference (p < 0.05; Table 3). With regard to the variation of pvmrp1 CN, increased pvmrp1 CN did not appear to significantly alter parasites’ susceptibilities to CQ, MQ and QN (Figure S2).

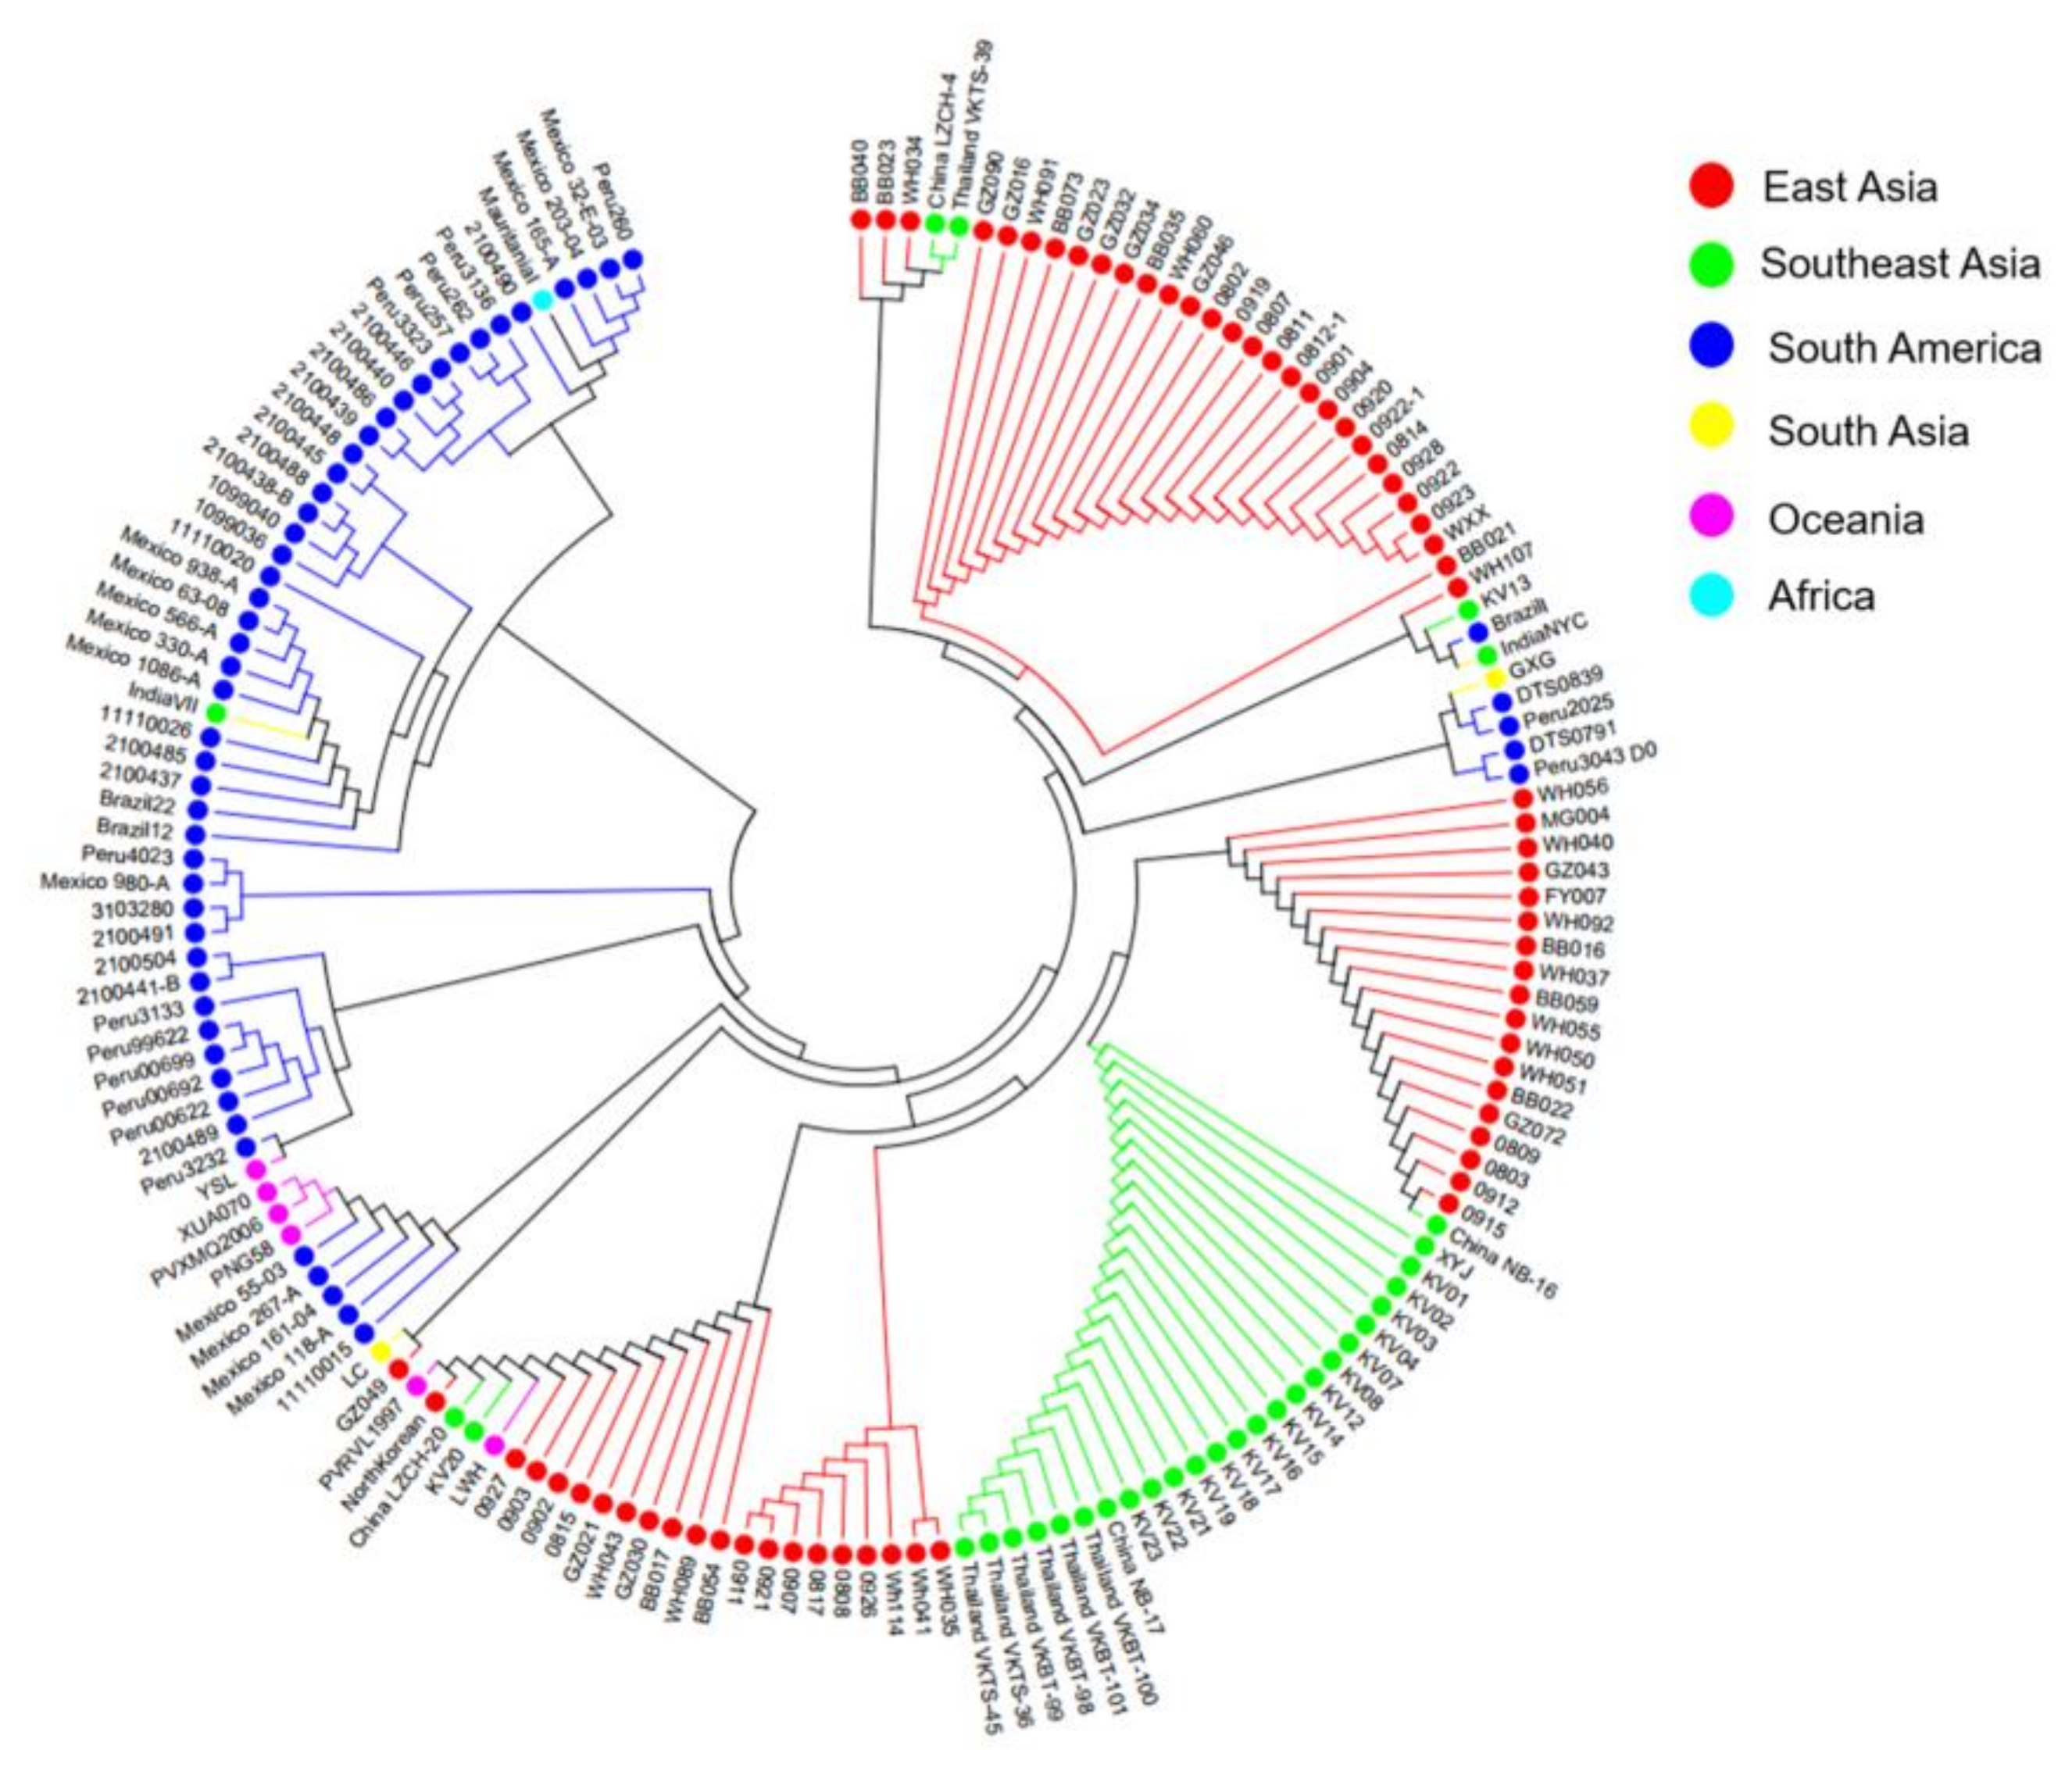
3.4. The Polymorphism of pvmrp1 from Different Regions

To estimate the degree of genetic differentiation of the pvmrp1 in global isolates, the sequences of pvmrp1 obtained from the studied regions were compared with homologous sequences from the PlasmoDB database. An additional 72 pvmrp1 sequences from PlasmoDB were downloaded for further analysis, including Myanmar (n = 4), PNG (n = 4), PRK (n = 1), Columbia (n = 21), Peru (n = 16), Mexico (n = 13), Thailand (n = 7), Brazil (n = 3), India (n = 2) and Mauritania (n = 1). All sequences were aligned and cut to 4095 bp (1087–5181 bp) by MEGA7.0. An analysis of the polymorphism of pvmrp1 within the 166 global isolates revealed low nucleotide diversity (π = 0.0011) and high haplotype diversity (Hd = 0.9290). We also found significant differences in the gene polymorphism of pvmrp1 in different regions. Get rid of Africa, the polymorphism of pvmrp1 gene was the highest in South Asia (π = 0.0015), and the lowest in Southeast Asia (π = 0.0006). These results suggested that pvmrp1 in different regions was subjected to different natural selection pressure and showed different levels of gene polymorphism (Table 4).

3.5. Natural Selection of Polymorphic Region of pvmrp1 from Different P. vivax Isolates

To determine whether natural selection promoted the generation of pvmrp1 gene diversity in global isolates, we calculated the ratio of non-synonymous to synonymous mutations (dn/ds). The dn/ds for pvmrp1 of all the 166 isolates was 0.5536, indicating that the pvmrp1 gene was affected by purifying selection. The overall Tajima’s D test value for pvmrp1 of all the isolates was negative (Tajima’s D = −1.1863, p > 0.1), and the Fu and Li’s D* test of all the isolates was −3.9871 (p < 0.02) (Table 4). It suggested that a neutral model of polymorphism occurrence with values for pvmrp1 was due either to a recent population expansion or genetic hitchhiking. In addition, we found that the significant Fu and Li’s D* test value < 0 (0.01 < p < 0.05) were found in isolates from South America and Southeast Asia.

3.6. Genetic Differentiation, Haplotype Network and LD Analysis of Polymorphic Region of pvmrp1

The level of genetic differentiation of pvmrp1 was estimated by FST values. As there is only one isolate from Africa, it was not considered. A low level of genetic differentiation was found in the isolates from South America and South Asia (the value of FST was 0.0809), while others were in a moderate and high level of genetic differentiation (0.1661–0.5498). This was especially true of the southeast Asian isolates, which showed a great genetic differentiation based on the values of FST (Table 5).
To further verify the differential selection between groups, the 11 non-synonymous SNPs (E787D, Q906E, G949D, C1018Y, L1207I, L1287I, Y1393D, G1419A, V1478I, T1525I, and H1586Y), which occurred twice without deletion, were selected to construct a haplotype network among all 166 samples. The haplotype analysis of pvmrp1 in this study revealed 22 distinct haplotypes (Figure 3). Eight of the haplotypes were singleton haplotypes, of which H_4 and H_5 were found in East Asian isolates exclusively, H_10 and H_11 existed only in South Asian isolates, H_12 was found in Southeast Asia, and H_17, H_18, and H_19 were found in South America specifically. The mutant types H_2: EEGCLLDGITY (18.7%) and H_7: EEGCLLDGITH (18.1%) were the most common. H_2, H_3 (DQDCLLDGITH), and H_13 (EEGCLLDAITH) were the dominant haplotype in East Asia (81.8%, 100.0%, and 69.6%, respectively), H_14 (DQGCLLDGVTH) is mainly distributed in South America (63.6%), and H_7 is distributed worldwide, which mainly includes East Asia (40%), South America (33.3%) and Oceania (16.6%) (Figure 4, Table S3). In particular, 14 haplotypes found in the isolates from South America, which indicated the highest haplotype diversity, and nine haplotypes in East Asia, which was consistent with the results of haplotype diversity in Table 4.
In addition, by pairwise LD of the pvmrp1 gene at 11 non-synonymous SNPs using the DNASP v5.10.01 program, we observed that there was a strong LD between E787D and Q906E, G949D, and H1586Y (p < 0.0001) (Figure 5). Meanwhile, the strong LD was present in pvmrp1 gene between G949D and H1586Y, Q906E (p < 0.0001), and existed in the following pairs also: Q906E/L1207I, V1478I/T1525I (p < 0.0001). We found that most of the genes with LD occurred around the ABC transporter domain, such as E787D and Q906E, G949D.
Furthermore, phylogenetic analysis of the 166 isolates indicated that the genetic evolution of pvmrp1 varies in different regions, which have obvious population genetic structures related to geographical isolates. The genetic differentiation of P. vivax isolates indicated that the geographically distant was high; for example, the genetic differences between pvmrp1 gene from East Asia and South America were the highest (Figure 6).

4. Discussion and Conclusions

Plasmodium vivax is the most geographically widespread cause of human malaria. Due to the lack of an in vitro culture and transgenic system, molecular markers represent a more practical tool to monitor the introduction and spread of drug resistance in P. vivax [31]. In our study, as a member of ABC transporters, PvMRP1, localizes at the parasite plasma membrane, and the predicted primary protein structure includes 11 TM and 2 NBDs, which function primarily as drug transports [32]. Consistent with the potential involvement of PvMRP1, it has been observed as a transporter with a broad range of substrates, including important endogenous substances such as glutathione and a lot of drugs with diverse structures. CQ was identified as a substrate for this ABC transporter, and the mutations of pfmrp1 were found to be associated with reduced susceptibility to CQ and also to QN [13]. In addition, pvmrp1 transcription level is decreased in the trophozoite stage, which is consistent with the phenotype that P. vivax trophozoites insensitive to CQ [33]. All of these suggest that pvmrp1 may be a potential molecular marker of drug resistance.
In this study, we amplified and sequenced the pvmrp1 gene of 102 whole blood samples originating from Asia, and 29 genetic mutations were found out of the 94 successfully sequenced isolates. Among them, most mutations have not been hitherto reported, and most of these mutations are found only in East Asia, which is likely due to the low number of east Asian isolates used in previous studies. The mutations T259R (97.87%), Y1393D (97.87%) and V1478I (95.74%) were approaching fixation in the sequenced samples, and the mutations V879 (89.5%) and L1207I (89.5%) were highly prevalent and present in Southeast Asia exclusively. A small number of imported isolates, such as South Asia (n = 2) and Oceania (n = 2) were not considered. We found significant differences in the types of mutations prevalent in East and Southeast Asia except for the mutations approaching fixation. A sequence similarity analysis of pvmrp1 and pfmrp1 indicated that the Y1393D and G1419A mutations of pvmrp1 overlap with pfmrp1 locations residing between the ABC transmembrane and the second ABC transporter domains which were associated with drug resistance [10]. Furthermore, a recent study has provided evidence that G1419A and V1478I had a significant association with the IC50 to CQ and artesunate, and G1419A was also associated with the decreased susceptibilities to PPQ, MQ, and QN [34]. However, in combination with our previous in vitro drug susceptibility studies [20,21], we could not find a correlation between the polymorphisms of pvmrp1 and antimalarial drug susceptibilities (p > 0.05). The isolates used in our previous drug susceptibility studies, Y1393D and V1478I, were fixed, and no G1419A was observed in the pvmrp1 gene, which may limit the correlation analysis. Moreover, we found that the prevalence of S354N between the two CQ sensitivity categories revealed a significant difference by chi-square analysis, although more clinical samples are needed to confirm this conclusion. Numerous studies have shown that gene CN polymorphism is related to genetic and phenotypic variation, which is as important as SNPs [35,36]. Three CNVs were also determined from two ROK isolates and one Pakistan isolate in this study, which indicates the variation in pvmrp1 gene amplification in Asian isolates. However, we did not find a statistically significant correlation between CNVs and drug sensitivity.
The 94 sequenced samples combined with the 72 known sequences from the PlasmoDB database formed pvmrp1 sequences worldwide. The result displayed a low genetic diversity at the pvmrp1 with an average π of 0.0011. Haplotype analysis of pvmrp1 showed that haplotype diversity varies in different regions, and haplotype polymorphism was higher in South America and Oceania than in the other areas. These results suggested that pvmrp1 of P. vivax from different areas was subjected to various natural selection pressures and showed different levels of gene polymorphism and haplotype polymorphism. In this study, the rates of non-synonymous mutation to synonymous mutation of pvmrp1 were < 1, and the neutral evolutionary test statistic Tajima’s D test was negative (Tajima’s D = −1.1863, p > 0.1), indicating that the pvmrp1 gene was affected by purifying selection [27]. Fu and Li’s D* test further confirmed that the pvmrp1 gene was under purifying selection (Fu and Li’s D* = −3.9871, p < 0.02), which suggested that the mutations and accumulate at silent sites, there were likely to be lots of segregating sites, but not much heterozygosity. This could explain that nucleotide diversity (π) was small and the average number of nucleotide differences (K) was high in Table 4.
Furthermore, genetic differentiation, the haplotype network, and phylogenetic analysis of the 166 isolates indicated that the genetic evolution of pvmrp1 varies in different regions, which has obvious population genetic structures related to geographical isolates. The genetic differentiation between P. vivax isolates that were geographically distant was high, for example, the genetic differences between the pvmrp1 gene from Southeast Asia and South America were the highest. Perhaps parasite movement could be controlled by different factors, including geographical barriers, distance, poor road infrastructure, cultural and language barriers, and the effectiveness of malaria control interventions.
Overall, PvMRP1 localizes on the P. vivax plasma membrane with 11 TM, the gene nucleotide polymorphism, and CNVs were analyzed with the field P. vivax isolates in our study. We found some unreported point mutations of pvmrp1 in the collected samples, and S354N substitution may lead to CQR in P. vivax. In combination with the worldwide isolates, the analysis showed that the pvmrp1 gene had a high haplotype diversity, low nucleotide diversity and was under purifying selection. This study showed the polymorphisms of the pvmrp1 gene from worldwide isolates, and pointed to the potential contribution of the pvmrp1 gene in the CQR of P. vivax. However, the lack of correlation between the pvmrp1 polymorphisms and the IC50 values of the four antimalarial drugs (CQ, MQ, QN and PYR), highlights the need for more informative tools to function the role of pvmrp1 gene.

Supplementary Materials

The following supporting information can be downloaded at: https://0-www-mdpi-com.brum.beds.ac.uk/article/10.3390/microorganisms10081482/s1, Table S1: IC50 values to four antimalarial drugs of P. vivax isolates; Figure S1: Dot plots of in vitro susceptibilities of P. vivax isolates to four antimalarial drugs; Table S2: Association of SNPs in pvmrp1 with in vitro susceptibilities to CQ, MQ, QN and PYR; Figure S2: Comparison of IC50 values for three antimalarials between parasites with single copy and multicopies of pvmrp1 gene; Table S3: Distribution of the number of 22 pvmrp1 haplotypes in worldwide isolates; Spreadsheet S1: Sample information.

Author Contributions

Conceptualization, F.L. and E.-t.H.; data curation, F.T., X.H. and M.H.N.; formal analysis, Y.Y. and G.C.; funding acquisition, F.L., E.-t.H. and Y.Y.; investigation, J.C., G.Z. and M.H.N.; methodology, F.L., E.-t.H., Y.Y., G.C., M.Z. and Y.L.; project administration, F.L. and E.-t.H.; resources, F.L. and M.H.N.; software, Y.Y., G.C., M.Z. and Y.L.; supervision, F.T. and X.H.; validation, Y.Y., Y.L. and J.C.; visualization, G.Z. and M.Z.; writing—original draft preparation, Y.Y. and G.C.; writing—review and editing, Y.Y., G.C., F.L. and E.-t.H. All authors have read and agreed to the published version of the manuscript.

Funding

This work was supported by the National Natural Science Foundation of China (No. 82072297), the Natural Science Foundation of Jiangsu Province (BK20130114), the Six Talent Peaks Project in Jiangsu Province (2019-YY-065), the Postgraduate Research & Practice Innovation Program of Jiangsu Province (KYCX21-3284), the high level talent support project of Yangzhou University, a National Research Foundation of Korea (NRF) grant funded by the Korean government (MSIP) (NRF-2021R1A2C2008235) and by the Basic Science Research Program through the National Research Foundation of Korea (NRF), funded by the Ministry of Science, ICT and Future Planning (NRF-R1A4A1031574).

Institutional Review Board Statement

The study was conducted in accordance with the Declaration of Helsinki, and reviewed and approved by the Ethics Committee of Jiangsu Institute of Parasitic Diseases (200402, 9 June 2004), the Kangwon National University Committee (08-28, 21 July 2008), and the Ministry of Health, Myanmar (52, 30 April 2012).

Informed Consent Statement

Informed consent was obtained from all subjects involved in the study.

Data Availability Statement

Data is contained within the article.

Conflicts of Interest

The authors declare that they have no conflict of interest.

Sample Availability

Samples of the compounds are available from the authors.

References

  1. WHO. World Malaria Report 2021. Available online: https://www.who.int/publications/i/item/9789240040496 (accessed on 6 December 2021).
  2. Battle, K.E.; Lucas, T.C.D.; Nguyen, M.; Howes, R.E.; Nandi, A.K.; Twohig, K.A.; Pfeffer, D.A.; Cameron, E.; Rao, P.C.; Casey, D.; et al. Mapping the global endemicity and clinical burden of Plasmodium vivax, 2000–2017: A spatial and temporal modelling study. Lancet 2019, 394, 332–343. [Google Scholar] [CrossRef] [Green Version]
  3. Rieckmann, K.H.; Davis, D.R.; Hutton, D.C. Plasmodium vivax resistance to chloroquine? Lancet 1989, 2, 1183–1184. [Google Scholar] [CrossRef]
  4. Cotter, C.; Sturrock, H.J.; Hsiang, M.S.; Liu, J.; Phillips, A.A.; Hwang, J.; Gueye, C.S.; Fullman, N.; Gosling, R.D.; Feachem, R.G. The changing epidemiology of malaria elimination: New strategies for new challenges. Lancet 2013, 382, 900–911. [Google Scholar] [CrossRef]
  5. Xu, S.; Zeng, W.; Ngassa Mbenda, H.G.; Liu, H.; Chen, X.; Xiang, Z.; Li, C.; Zhang, Y.; Baird, J.K.; Yang, Z.; et al. Efficacy of directly-observed chloroquine-primaquine treatment for uncomplicated acute Plasmodium vivax malaria in northeast Myanmar: A prospective open-label efficacy trial. Travel Med. Infect. Dis. 2020, 36, 101499. [Google Scholar] [CrossRef] [PubMed]
  6. Htun, M.W.; Mon, N.C.N.; Aye, K.M.; Hlaing, C.M.; Kyaw, M.P.; Handayuni, I.; Trimarsanto, H.; Bustos, D.; Ringwald, P.; Price, R.N.; et al. Chloroquine efficacy for Plasmodium vivax in Myanmar in populations with high genetic diversity and moderate parasite gene flow. Malar. J. 2017, 16, 281. [Google Scholar] [CrossRef] [PubMed]
  7. Yuan, L.; Wang, Y.; Parker, D.M.; Gupta, B.; Yang, Z.; Liu, H.; Fan, Q.; Cao, Y.; Xiao, Y.; Lee, M.C.; et al. Therapeutic responses of Plasmodium vivax malaria to chloroquine and primaquine treatment in northeastern Myanmar. Antimicrob. Agents Chemother. 2015, 59, 1230–1235. [Google Scholar] [CrossRef] [Green Version]
  8. Ngassa Mbenda, H.G.; Wang, M.; Guo, J.; Siddiqui, F.A.; Hu, Y.; Yang, Z.; Kittichai, V.; Sattabongkot, J.; Cao, Y.; Jiang, L.; et al. Evolution of the Plasmodium vivax multidrug resistance 1 gene in the Greater Mekong Subregion during malaria elimination. Parasites Vectors 2020, 13, 67. [Google Scholar] [CrossRef]
  9. Diez Benavente, E.; Ward, Z.; Chan, W.; Mohareb, F.R.; Sutherland, C.J.; Roper, C.; Campino, S.; Clark, T.G. Genomic variation in Plasmodium vivax malaria reveals regions under selective pressure. PLoS ONE 2017, 12, e0177134. [Google Scholar] [CrossRef] [Green Version]
  10. Benavente, E.D.; Manko, E.; Phelan, J.; Campos, M.; Nolder, D.; Fernandez, D.; Velez-Tobon, G.; Castaño, A.T.; Dombrowski, J.G.; Marinho, C.R.F.; et al. Distinctive genetic structure and selection patterns in Plasmodium vivax from South Asia and East Africa. Nat. Commun. 2021, 12, 3160. [Google Scholar] [CrossRef]
  11. Valderramos, S.G.; Fidock, D.A. Transporters involved in resistance to antimalarial drugs. Trends Pharmacol. Sci. 2006, 27, 594–601. [Google Scholar] [CrossRef] [Green Version]
  12. Srikant, S.; Gaudet, R.; Murray, A.W. Selecting for Altered Substrate Specificity Reveals the Evolutionary Flexibility of ATP-Binding Cassette Transporters. Curr. Biol. 2020, 30, 1689–1702.e1686. [Google Scholar] [CrossRef] [Green Version]
  13. Gil, J.P.; Fançony, C. Plasmodium falciparum Multidrug Resistance Proteins (pfMRPs). Front. Pharmacol. 2021, 12, 759422. [Google Scholar] [CrossRef]
  14. Dahlström, S.; Veiga, M.I.; Mårtensson, A.; Björkman, A.; Gil, J.P. Polymorphism in PfMRP1 (Plasmodium falciparum multidrug resistance protein 1) amino acid 1466 associated with resistance to sulfadoxine-pyrimethamine treatment. Antimicrob. Agents Chemother. 2009, 53, 2553–2556. [Google Scholar] [CrossRef] [Green Version]
  15. Gendrot, M.; Wague Gueye, M.; Tsombeng Foguim, F.; Madamet, M.; Wade, K.A.; Bou Kounta, M.; Fall, M.; Diawara, S.; Benoit, N.; Lo, G.; et al. Modulation of in vitro antimalarial responses by polymorphisms in Plasmodium falciparum ABC transporters (pfmdr1 and pfmdr5). Acta Trop. 2019, 196, 126–134. [Google Scholar] [CrossRef]
  16. Kavishe, R.A.; Paulo, P.; Kaaya, R.D.; Kalinga, A.; van Zwetselaar, M.; Chilongola, J.; Roper, C.; Alifrangis, M. Surveillance of artemether-lumefantrine associated Plasmodium falciparum multidrug resistance protein-1 gene polymorphisms in Tanzania. Malar. J. 2014, 13, 264. [Google Scholar] [CrossRef] [Green Version]
  17. Rijpma, S.R.; van der Velden, M.; Bilos, A.; Jansen, R.S.; Mahakena, S.; Russel, F.G.; Sauerwein, R.W.; van de Wetering, K.; Koenderink, J.B. MRP1 mediates folate transport and antifolate sensitivity in Plasmodium falciparum. FEBS Lett. 2016, 590, 482–492. [Google Scholar] [CrossRef] [Green Version]
  18. Noulin, F.; Borlon, C.; Van Den Abbeele, J.; D’Alessandro, U.; Erhart, A. 1912-2012: A century of research on Plasmodium vivax in vitro culture. Trends Parasitol. 2013, 29, 286–294. [Google Scholar] [CrossRef]
  19. Suwanarusk, R.; Russell, B.; Chavchich, M.; Chalfein, F.; Kenangalem, E.; Kosaisavee, V.; Prasetyorini, B.; Piera, K.A.; Barends, M.; Brockman, A.; et al. Chloroquine resistant Plasmodium vivax: In vitro characterisation and association with molecular polymorphisms. PLoS ONE 2007, 2, e1089. [Google Scholar] [CrossRef]
  20. Lu, F.; Gao, Q.; Chotivanich, K.; Xia, H.; Cao, J.; Udomsangpetch, R.; Cui, L.; Sattabongkot, J. In vitro anti-malarial drug susceptibility of temperate Plasmodium vivax from central China. Am. J. Trop. Med. Hyg. 2011, 85, 197–201. [Google Scholar] [CrossRef] [Green Version]
  21. Lu, F.; Lim, C.S.; Nam, D.H.; Kim, K.; Lin, K.; Kim, T.S.; Lee, H.W.; Chen, J.H.; Wang, Y.; Sattabongkot, J.; et al. Genetic polymorphism in pvmdr1 and pvcrt-o genes in relation to in vitro drug susceptibility of Plasmodium vivax isolates from malaria-endemic countries. Acta Trop. 2011, 117, 69–75. [Google Scholar] [CrossRef]
  22. Yang, M.; Derbyshire, M.K.; Yamashita, R.A.; Marchler-Bauer, A. NCBI’s Conserved Domain Database and Tools for Protein Domain Analysis. Curr. Protoc. Bioinform. 2020, 69, e90. [Google Scholar] [CrossRef] [PubMed] [Green Version]
  23. Letunic, I.; Khedkar, S.; Bork, P. SMART: Recent updates, new developments and status in 2020. Nucleic Acids Res. 2021, 49, D458–D460. [Google Scholar] [CrossRef] [PubMed]
  24. Krogh, A.; Larsson, B.; von Heijne, G.; Sonnhammer, E.L. Predicting transmembrane protein topology with a hidden Markov model: Application to complete genomes. J. Mol. Biol. 2001, 305, 567–580. [Google Scholar] [CrossRef] [PubMed] [Green Version]
  25. Kumar, S.; Stecher, G.; Li, M.; Knyaz, C.; Tamura, K. MEGA X: Molecular Evolutionary Genetics Analysis across Computing Platforms. Mol. Biol. Evol. 2018, 35, 1547–1549. [Google Scholar] [CrossRef]
  26. Kumar, S.; Stecher, G.; Tamura, K. MEGA7: Molecular Evolutionary Genetics Analysis Version 7.0 for Bigger Datasets. Mol. Biol. Evol. 2016, 33, 1870–1874. [Google Scholar] [CrossRef] [Green Version]
  27. Tajima, F. Simple methods for testing the molecular evolutionary clock hypothesis. Genetics 1993, 135, 599–607. [Google Scholar] [CrossRef]
  28. Hall, B.G. Building phylogenetic trees from molecular data with MEGA. Mol. Biol. Evol. 2013, 30, 1229–1235. [Google Scholar] [CrossRef] [Green Version]
  29. Bandelt, H.J.; Forster, P.; Röhl, A. Median-joining networks for inferring intraspecific phylogenies. Mol. Biol. Evol. 1999, 16, 37–48. [Google Scholar] [CrossRef]
  30. Rozas, J.; Ferrer-Mata, A.; Sánchez-DelBarrio, J.C.; Guirao-Rico, S.; Librado, P.; Ramos-Onsins, S.E.; Sánchez-Gracia, A. DnaSP 6: DNA Sequence Polymorphism Analysis of Large Data Sets. Mol. Biol. Evol. 2017, 34, 3299–3302. [Google Scholar] [CrossRef]
  31. Lu, F.; Wang, B.; Cao, J.; Sattabongkot, J.; Zhou, H.; Zhu, G.; Kim, K.; Gao, Q.; Han, E.T. Prevalence of drug resistance-associated gene mutations in Plasmodium vivax in Central China. Korean J. Parasitol. 2012, 50, 379–384. [Google Scholar] [CrossRef]
  32. Carlton, J.M.; Fidock, D.A.; Djimdé, A.; Plowe, C.V.; Wellems, T.E. Conservation of a novel vacuolar transporter in Plasmodium species and its central role in chloroquine resistance of P. falciparum. Curr. Opin. Microbiol. 2001, 4, 415–420. [Google Scholar] [CrossRef]
  33. Sharrock, W.W.; Suwanarusk, R.; Lek-Uthai, U.; Edstein, M.D.; Kosaisavee, V.; Travers, T.; Jaidee, A.; Sriprawat, K.; Price, R.N.; Nosten, F.; et al. Plasmodium vivax trophozoites insensitive to chloroquine. Malar. J. 2008, 7, 94. [Google Scholar] [CrossRef] [Green Version]
  34. Zeng, W.; Zhao, H.; Zhao, W.; Yang, Q.; Li, X.; Li, X.; Duan, M.; Wang, X.; Li, C.; Xiang, Z.; et al. Molecular Surveillance and Ex Vivo Drug Susceptibilities of Plasmodium vivax Isolates From the China-Myanmar Border. Front. Cell. Infect. Microbiol. 2021, 11, 738075. [Google Scholar] [CrossRef]
  35. Anderson, T.J.; Patel, J.; Ferdig, M.T. Gene copy number and malaria biology. Trends Parasitol. 2009, 25, 336–343. [Google Scholar] [CrossRef] [Green Version]
  36. Hiroi, N.; Takahashi, T.; Hishimoto, A.; Izumi, T.; Boku, S.; Hiramoto, T. Copy number variation at 22q11.2: From rare variants to common mechanisms of developmental neuropsychiatric disorders. Mol. Psychiatry 2013, 18, 1153–1165. [Google Scholar] [CrossRef] [Green Version]
Figure 1. Predicted PvMRP1 primary protein structure and gene mutation. (A) Diagram of PvMRP1 primary protein structure, orange, yellow and green colors indicate conserved domain, Pfam domains, and GPI-anchor, respectively. (B) PvMRP1 shows the 11 predicted transmembrane helices. The positions of all the different mutations identified from the analysis of 94 geographically diverse isolates are indicated by filled circles, solid lines represent non-synonymous mutations, dotted lines represent synonymous mutations. The red font indicates that the mutation was reported previously [10].
Microorganisms 10 01482 g001
Figure 2. A scatter-gram depicting pvmrp1 copy number estimates for P. vivax isolates from seven countries. ROK, the Republic of Korea; PNG, Papua New Guinea; PRK, the Democratic People’s Republic of Korea.
Microorganisms 10 01482 g002
Figure 3. Amino acid alignment of the 22 pvmrp1 haplotypes in 166 isolates. Polymorphic amino acids are listed for each haplotype. Amino acid residues are identical to the reference sequence Sal-I marked in pink. The dimorphic amino acid changes are marked in blue. The total number of sequences for each haplotype is listed in the right panel.
Microorganisms 10 01482 g003
Figure 4. The haplotype network was created using 166 pvmrp1 nucleotide sequences by the median-joining method in the NETWORK v5.0 program. The size of the circles indicates the haplotype frequency, and the color shows the geographical origin of the sequences. The lines between haplotypes display mutational steps.
Microorganisms 10 01482 g004
Figure 5. Linkage disequilibrium (LD) plot showing non-random association between nucleotide variants among 166 P. vivax isolates at 11 non-synonymous SNPs. R for each pair of genetic polymorphisms of pvmrp1.
Microorganisms 10 01482 g005
Figure 6. Phylogenetic relationship of pvmrp1 full-length genes in 166 isolates based on the neighbor-joining method. The evolutionary history was inferred using the neighbor-joining method. The optimal tree with the sum of branch length = 51.8479 is shown. The evolutionary distances were computed using the number of differences method and are in the units of the number of base differences per sequence. The analysis involved 166 nucleotide sequences. All positions containing gaps and missing data were eliminated. There were a total of 3373 positions in the final dataset. The color shows the geographical origin of the sequences.
Microorganisms 10 01482 g006
Table 1. Sequences and features of primers used in nest/seminest PCR and Real-Time PCR.
PurposePrimer NameRole in PCRSequence (5′-3′)PositionPCR Product (bp)Annealing Temperature
Sequencing
Fragment 1Frag1-F1First, second and Seq PCRAAA AAA TAA GCC AAA TTA ACC TTA CAC−48–−74First round 2500 bp56 °C
Frag1-R1First PCRGGC AAA ATG CAC TTA TTT TGT CT2430–2452
Frag1-R2Second PCRTTT ATG TTC TTC AAA ATG TAC TTC TCA1926–1952second round 2000 bp56 °C
Frag1-SF1Seq PCRGGA TTT TTT TTA ACA CTG TTA CAG CTT726–752
Frag1-SR2Seq PCRGAT TTA ACG AAT CAT TCT GTG TAT AGA AA652–680
Frag1-SR3Seq PCRCAT AGT TGA AGT GTT GTT ATT TTT TTT GT1302–1330
Fragment 2Frag2-F1First PCRTGA TGT AGA GAA AGT GTG TTT CCA G1752–1776First round 2401 bp61 °C
Frag2-R1First PCRCTC CTC TAG CCT CTG CAC ACA4132–4152
Frag2-F2Second and Seq PCRTTA GAA AAT GCT TTT TTT GGC AC1882–1904second round 1971 bp56 °C
Frag2-R2Second PCRTAT ACC TAA ATG GTA CCA ATT CTT TTC3826–3852
Frag2-SF1Seq PCRAAT AAG AGC TTC AAA GAC TAT TGC AGT2602–2628
Frag2-SF2Seq PCRTAT ATC TAT CTT TAC AGA TGA AAT AAA ATT3252–3281
Fragment 3Frag3-F1First PCRCAG TGA AGG TGC ACA CAG ATG3452–3472First round 1792 bp59 °C
Frag3-R1First, second and Seq PCRTAC CAC ACG TCG AAC GTG G+44–+62
Frag3-F2Second and Seq PCRTTA TGC AAC ATA TAT AGC AAC ACC AT3772–3797second round 1472 bp56 °C
Frag3-SF1Seq PCRTTA TTT TGT CCA TCT TAG GGC TC4502–4524
CN detection
Reference genePvtubulin–FPReal-Time PCRCAA GAA CTC CTC CTA CTT CGT CG1644–1666122 bp58 °C *
Pvtubulin–RPReal-Time PCRGTT GCG TGG AAA GCC ATC TC1746–1765
Pvtubulin–PProbeHEX-TGCCCAACAGGGAGGAAGCGATT-BHQ11699–1721
Target genePvMRP-FPReal-Time PCRAAA GTG TGT TTC CAG ACA AGA GTT1762–1785111 bp58 °C
PvMRP-RPReal-Time PCRCAA ATT GCT TCG CTC CTC TG1853–1872
PvMRP-PProbeFAM-TGCTCCAATGGCGGCAGTAGTAGTAG-BHQ11789–1814
* Reference [21].
Table 2. The prevalence of pvmrp1 gene substitution in 94 parasite isolates.
NO.AA ChangeEffectNumber (%)Frequency (%)
East Asia
(n = 71)
Southeast Asia (n = 19)South Asia
(n = 2)
Oceania
(n = 2)
1N67Snon-synonymous mutation1 (1.06)1.4
2K36Qnon-synonymous mutation1 (1.06)1.4
3T234Mnon-synonymous mutation18 (19.15)1.489.5
4T259Rnon-synonymous mutation92 (97.87)100100100
5F271Ynon-synonymous mutation1 (1.06) 50
6R281Knon-synonymous mutation11 (11.70)15.5
7T282Mnon-synonymous mutation1 (1.06) 50
8S354Nnon-synonymous mutation9 (9.57)12.7
9F406Lnon-synonymous mutation1 (1.06)1.4
10K448Inon-synonymous mutation1 (1.06)1.4
11E533gene deletion3 (3.19)4.2
12F560Inon-synonymous mutation1 (1.06) 50
13N568synonymous mutation2 (2.13) 5050
14E787Dnon-synonymous mutation30 (31.9)42.3
15C817synonymous mutation1 (1.06)
16A853synonymous mutation20 (21.28)28.2
17V879synonymous mutation17 (18.09) 89.5
18Q906Enon-synonymous mutation59 (62.77)56.394.7 50
19G949Dnon-synonymous mutation27 (28.72)38.0
20E967Gnon-synonymous mutation1 (1.06) 5.3
21L1207Inon-synonymous mutation17 (18.09) 89.5
22K1219Nnon-synonymous mutation2 (2.13)2.8
23I1232synonymous mutation38 (40.43)28.289.550
24Y1393Dnon-synonymous mutation92 (97.87)98.610050100
25V1360non-synonymous mutation9 (9.57)12.7
26G1419Anon-synonymous mutation1 (1.06) 50
27V1478Inon-synonymous mutation90 (95.74)95.810050100
28H1586Ynon-synonymous mutation29 (30.85)38.05.3 50
Allele frequency bolded if >50%.
Table 3. Comparison of pvmrp1 substitutions between CQ sensitive and CQ resistant isolates.
MutationsCQ Sensitive (n) aCQ Resistant (n) ap-Value *
E787DD1610.2491
E220
G949DD1510.2245
G230
Q906EE2010.3483
Q180
H1586YY1410.2
H240
S354NN610.0303 *
S320
a Using 220 nM as the cutoff IC50 for CQ resistance. >220 nM was considered as CQ resistant isolates, and ≤220 nM were considered as CQ sensitive isolates. * indicates a significant correlation.
Table 4. Estimates of the number of isolates and SNPs, nucleotide diversity, haplotype diversity and neutrality indices of pvmrp1.
RegionnSηHHdπkdn/dsTajima’s Dp-ValueFu and Li’s D*p-Value
South America532425280.95440.00093.49330.7748−1.1743p > 0.1−2.04140.05 < p < 0.1
East Asia721111150.85810.00083.20210.56301.1341p > 0.10.8084p > 0.1
Southeast Asia30151580.41800.00062.01720.6154−1.5484p > 0.1−2.03900.05 < p< 0.1
South Asia4101041.00000.00125.00000.40090.2982p > 0.10.2982p > 0.1
Oceania6101061.00000.00093.33330.6762−0.9837p > 0.1−1.1374p > 0.1
Africa16611.00000.00156.0000-----
Total1663435460.92900.00113.65710.5536−1.1863p > 0.1−3.9871p < 0.02
n: number of sequences; S: number of polymorphic sites; η: total number of mutations; H: number of Haploytypes; Hd: Haplotype diversity; π: nucleotide diversity; K: average number of nucleotide differences; dn: the rates of non-synonymous substitutions; ds: the rates of synonymous substitutions.
Table 5. Estimation of genetic differentiation (FST *) of the pvmrp1 among geographical populations.
PopulationEast AsiaSouth AmericaSoutheast AsiaSouth AsiaOceania
East Asia (n = 72)0.0000
South America (n = 53)0.37880.0000
Southeast Asia (n = 30)0.48320.54980.0000
South Asia (n = 4)0.19570.08090.36820.0000
Oceania (n = 6)0.23500.15890.53510.16610.0000
* the value of FST (0.05–0.15) is poor differentiation, FST (0.15–0.25) is moderate differentiation, and FST > 0.25 is great differentiation.
Publisher’s Note: MDPI stays neutral with regard to jurisdictional claims in published maps and institutional affiliations.

